Communication

Energy Storage Performance of (Na0.5Bi0.5)TiO3 Relaxor Ferroelectric Film

1
College of Physics Science and Technology, Hebei University, Baoding 071002, China
2
Beijing Institute of Metrology, Beijing 100029, China
*
Authors to whom correspondence should be addressed.
Coatings 2024, 14(7), 801; https://doi.org/10.3390/coatings14070801
Submission received: 5 June 2024 / Revised: 23 June 2024 / Accepted: 26 June 2024 / Published: 27 June 2024
(This article belongs to the Special Issue High-Performance Dielectric Ceramic for Energy Storage Capacitors)

Abstract

:
The (Na0.5Bi0.5)TiO3 relaxor ferroelectric materials have great potential in high energy storage capacitors due to their small hysteresis, low remanent polarization and high breakdown electric field. In this work, (Na0.5Bi0.5)TiO3 thin films with ~400 nm were prepared on (001) SrTiO3 substrate by pulsed laser deposition technology. The (Na0.5Bi0.5)TiO3 films have good crystallization quality with a dense microstructure and relaxor ferroelectric properties, as confirmed by the elongated hysteresis loops and the relation of <A>∝Eα. A high Eb of up to 1400 kV/cm is obtained, which contributes to a good Wrec of 24.6 J/cm3 and η of 72% in (Na0.5Bi0.5)TiO3 film. In addition, the variations of Wrec and η are less than 4% and 10% in the temperature range of 20–120°C. In the frequency range of 103 Hz–2 × 10⁴ Hz, the variations of Wrec and η are less than 10%. All those reveal the great potential of NBT film for energy storage.

1. Introduction

As electronic equipment becomes smaller and more incorporated, dielectric capacitors are gaining considerable attention for their high-power density and extremely fast charge–discharge rates [1,2,3]. Dielectric materials for energy storage can be classified into four categories: linear dielectric materials, ferroelectric (FE) materials, relaxor ferroelectric (RFE) materials, and antiferroelectric (AFE) materials [4]. The recoverable energy storage density (Wrec) and energy efficiency (η) of these materials can be derived from polarization–electric field (P-E) curves [5]. The formulas for calculating Wrec and η are as follows [6]:
W r e c = P r P m a x E d p
η = W r e c W r e c + W l o s s
where E represents the applied electric field, Pmax denotes the maximum polarization, Pr denotes the remnant polarization, and Wloss relates to the energy loss. It is evident from the above formula that a high Pmax, low Pr, and high breakdown strength Eb are necessary to achieve a high Wrec [5]. Linear dielectric materials have a limited Wrec due to their lower Pmax. FE materials are also inadequate because of their low η caused by the large polarization hysteresis. On the contrary, RFE and AFE materials typically exhibit a significant ∆P (PmaxPr) caused by the electric field-induced polarization and high breakdown strength (Eb), making them ideal for achieving exceptional Wrec. However, AFE materials experience a phase transition between FE and AFE states during charging and discharging, leading to considerable lattice distortion and reduction in their thermal stability. Consequently, Pb-free RFE materials have garnered significant attention in recent years for their superior energy storage density and environmentally friendly characteristics. Consequently, lead-free RFE materials have garnered substantial attention owing to their excellent energy storage density and environmental protection characteristics.
Sodium bismuth titanate ((Na0.5Bi0.5)TiO3, or NBT) is a typical RFE material, which is promising for energy storage since it has a high dielectric constant, large Pmax, small Pr and small polarization hysteresis. For instance, Qiao et al. attained a Wrec of 3.52 J/cm3 in NBT-based ceramics at 260 kV/cm by introducing Sr0.7Sm0.2TiO3 [7]. Zhou et al. achieved a Wrec of 4.21 J/cm3 at 380 kV/cm in domain-engineered NBT-NaTaO3 relaxor ferroelectrics [8]. The lower Eb always determines a lower Wrec in bulk ceramics. Compared with ceramics, films with small thickness and low defect concentration have higher Eb and better Wrec. For example, the NBT thick film with 1500 nm prepared by the sol-gel method (SGM) had a Wrec of 12.4 J/cm3 at 1200 kV/cm [9]. The NBT film prepared by SGM had a Wrec of 23.3 J/cm3 at 1200 kV/cm [10].
In the present work, (001) NBT films were prepared by pulsed laser deposition technology, which shows dense microstructure with uniform grains. The crystal structure, dielectric properties and ferroelectric properties were investigated. The prepared NBT films have typical RFE properties, and the Wrec reaches 24.6 J/cm3 at 1400 kV/cm. Moreover, the Wrec exhibits excellent thermal stability and frequency stability.

2. Experimental

NBT epitaxial films were prepared on (001) SrTiO3 (STO) substrate by pulsed laser deposition (PLD) technology. Firstly, a ~40 nm LaNiO3 (LNO) layer was grown on the STO substrate at 700 °C by RF magnetron sputtering, serving as the bottom electrode, with an argon-to-oxygen volume ratio of 3:1. Secondly, ~400 nm NBT films were deposited by PLD at 725 °C, and the samples were annealed in an oxygen atmosphere of approximately 600 Torr. Finally, symmetrical LNO and Pt upper electrodes were prepared by magnetron sputtering at room temperature.
The crystal structure of the NBT thin film was characterized using Cu Kα radiation (λ = 0.15406 nm) with X-ray diffraction (XRD) analysis conducted on a D8 Advance instrument (Saarbruken, Germany). The surface morphology of the NBT films was analyzed using scanning electron microscopy (SEM, Nova NanoSEM450, FEI, Brno, Czech Republic). The dielectric behaviors of the NBT thin film were measured using an LCR meter (Radiant Technologies, Albuquerque, NM, USA). The leakage current density of the NBT thin film was measured using an I-V system (Keithley Ivy App 1.1.0, Tektronix, Beaverton, OR, USA). The energy storage performance of the NBT thin film was analyzed using a ferroelectric testing apparatus (Precision LC II, Radiant Technologies, Albuquerque, NM, USA).

3. Results and Discussion

Figure 1a illustrates the XRD patterns of LNO and NBT films deposited on (001) STO substrates. The (001) and (002) diffraction peaks (LNO (001) and LNO (002)) of the LNO film can be observed, while only the (002) diffraction peak (NBT (002)) is observed for the NBT film. The absence of other orientations and secondary phases reveals that the LNO and NBT films have a good epitaxial structure. Figure 1b displays the XRD pattern from 43–50°.The NBT (002) diffraction peak is lower than the STO (002) diffraction peak and higher than the LNT (002) diffraction peak in intensity. In addition, the NBT (002) diffraction peak locates at the right side of STO (002) diffraction peak and at the left side of the LNO (002) diffraction peak, indicating that the out-of-plane lattice parameter c of NBT film is larger than that of LNO film [6,11]. Phi-scan is performed on the (101) plane of NBT film, as depicted in Figure 1c. Four diffraction peaks with equal 90° space are observed, further confirming the epitaxial growth of NBT films [12]. The surface topography of the NBT film is characterized by SEM, as depicted in Figure 1d. The film exhibits a dense microstructure with uniform distribution of grains and well-defined boundaries. Additionally, the grains of the NBT film are rectangular with a length of 0.1–0.2 nm and a width of 0.04–0.1 nm, which is quite different from those of the reported NBT thin films prepared by SGM [9,10]. The grains of the NBT thin films prepared by SGM are always irregular [9,10]. The thickness of NBT film is about 400 nm, as confirmed by the cross-section image.
The dielectric behaviors including the dielectric constant (εr) and dielectric loss (tanδ) of NBT films were measured at room temperature and 103 Hz–2 × 10⁶ Hz, as depicted in Figure 2a. As the frequency increases from 103 Hz to 2 × 10⁶ Hz, εr declines from 614 to 367. This decline stems from the limited time available for polarizations to respond adequately to the applied electric field at higher frequencies [13]. Additionally, there is a slight increase in tanδ which remains below 0.12 as the frequency is less than 105 Hz. The tanδ is greatly affected by the space charge polarization effect at the low-frequency region [14]. At frequency greater than 105 Hz, the defect dipole inertia becomes dominating [15], which results in increased tanδ with a maximum value of 0.35 at 2 × 10⁶ Hz.
Figure 2b illustrates the leakage current density of NBT films in the range of −700–700 kV/cm. The leakage current density is about 1.37 × 10⁻³ A/cm2 at 700 kV/cm. The conduction mechanisms are further explored by fitting the log(J)–log(E) curves, as depicted in Figure 2c. In the range of 14–140 kV/cm, log(J) and log(E) have a linear relationship with a slope of 0.7 (close to 1.0), indicating an ohmic-like conduction mechanism [16,17]. The low J observed at 14–140 kV/cm is attributed to a small quantity of carriers generated by thermal excitation in the NBT film [18]. In the range of 140–700 kV/cm, the slope increases to 3.8, indicating the presence of a nonlinear-space-charge-current-limiting mechanism. This mechanism is primarily responsible for the high leakage current density observed in the 140–700 kV/cm range. The difference in Fermi energy between LNO and Pt results in a substantial Schottky barrier at the interfaces. Under an applied electric field, a significant number of electrons accumulate in the electrodes. When the applied electric field exceeds the potential barrier, these electrons become activated and enter the NBT film, resulting in a sharp increase in J [18].
The dielectric constant–electric field (εrE) curve is a simple and effective way to understand the dielectric properties of materials, as depicted in Figure 3a. At 300–900 kV/cm, the εrE curve shows an obscure double-hump shape with small hysteresis. The FE materials always show an obvious butterfly shape with large hysteresis. Thus, it can be inferred that the NBT film may be RFE. The dielectric response initially increases and then decreases, resulting in a double-hump shape as the electric field increases. It has been observed that εr rises at very low electric fields but rapidly declines as the DC electric field increases. Narayanan et al. proposed an enhanced Johnson model. In accordance with this model, below the EC, the initial rise in εr is attributed to enhanced domain reorientation, whereas above EC, a rapid decrease in εr occurs due to domain reorientation suppression [19,20].
The dielectric tunability in the εrE curve is characterized by Δεr/εr0, where Δεr is the alteration in εr relative to the intersection point εr0. At 300–900 kV/cm, the dielectric tunability increases from 3.3% to 24.4%, as depicted in Figure 3b. A small change in dielectric tunability is beneficial to high Eb.
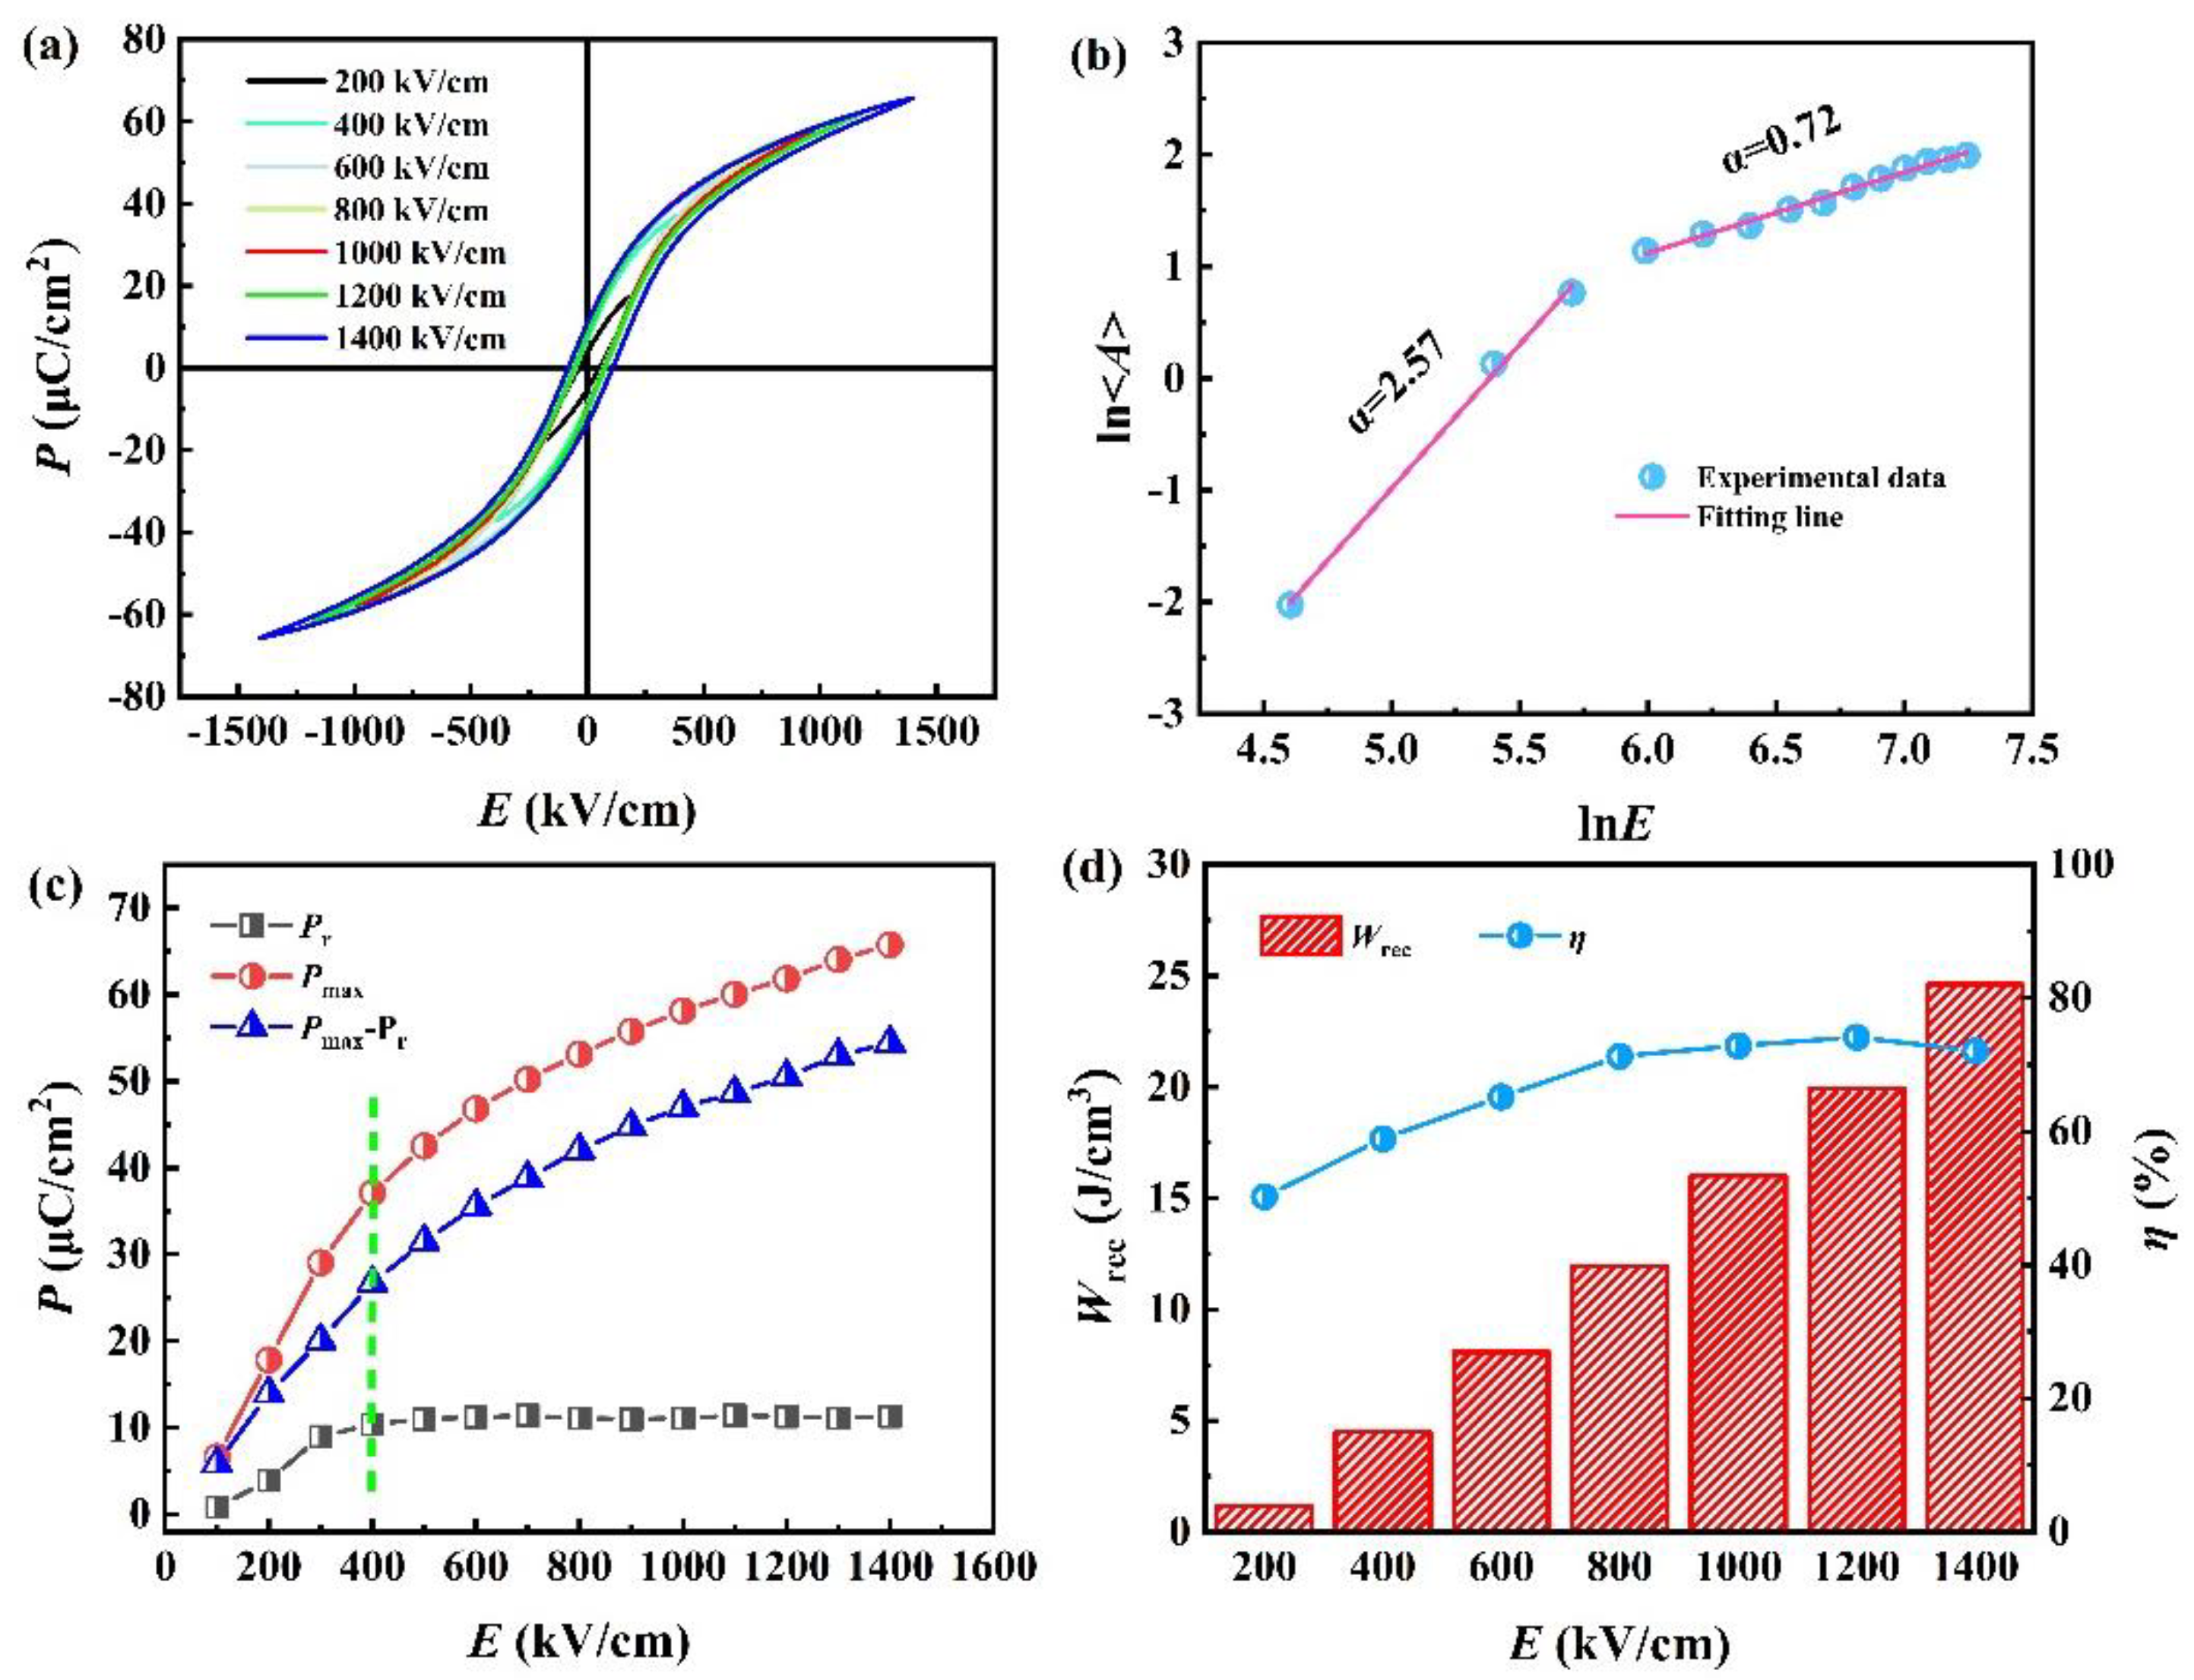
Figure 4a illustrates the hysteresis loops of the NBT film at 104 Hz and 200–1400 kV/cm. NBT film shows elongated hysteresis loops in the range of 200–1400 kV/cm. A power–law proportional relation (<A>∝Eα) is employed to generate a curve depicting the changes in the hysteresis area A with the E of the NBT film [21], illustrated in Figure 4b. <A> represents the energy dissipation during one cycle of polarization reversal. The exponent α is primarily influenced by the domain state and the polarization switching mechanism [22,23]. For FEs, ln<A> can be segmented into three stages concerning lnE, namely two linear phases correlating with domain wall motion and polarization orientation, and one nonlinear phase corresponding to domain switching [24]. There are two linear stages with α values of 2.57 and 0.72 for NBT film, as depicted in Figure 4b, indicating the NBT film is in RFE states. In the first linear stage, the polarization increases rapidly with an α value of 2.57 as increasing the electric field from 100 to 300 kV/cm, while in the second linear stage, the polarization increases slowly with an α value of 0.72 at 400–1400 kV/cm. The rapid increase in polarization can be attributed to the electric field-induced phase transition from the RFE state to the long-range FE state, accompanied by different polarization responses, including domain growth and switching [22,23]. This results in significant polarization hysteresis and a high α value. In contrast, the second linear phase is dominated by induced polarization, where polarization approaches saturation with lower hysteresis and a correspondingly lower α value [21]. The specific changes of Pr, Pmax and ∆P with the electric field are depicted in Figure 4c. Pr increases from 0.8 μC/cm2 to 10.4 μC/cm2 when the electric field increases from 100 kV/cm to 400 kV/cm, and remains almost unchanged as the electric field increases from 400 kV/cm to 1400 kV/cm. Pmax and ∆P increase rapidly at electric fields below 400 kV/cm. As the electric field is greater than 400 kV/cm, Pmax and ∆P show a gradually increasing trend. The NBT film has a maximum Pmax of 65.8 μC/cm2 at 1400 kV/cm. The Wrec and η values which are estimated according to the P-E loops are depicted in Figure 4d. The Wrec increases almost linearly with applied electric field. At 1400 kV/cm, Wrec reaches 24.6 J/cm3 and η reaches 72%. For energy storage materials, both the Wrec and η are important. It is reported that the Wrec and η of NBT thin films prepared by SGM are 12.4–23.3 J/cm3 and 43%–61.6% at 1200 kV/cm [9,10]. In our work, a better Wrec and a higher η are simultaneously obtained in the NBT thin film.
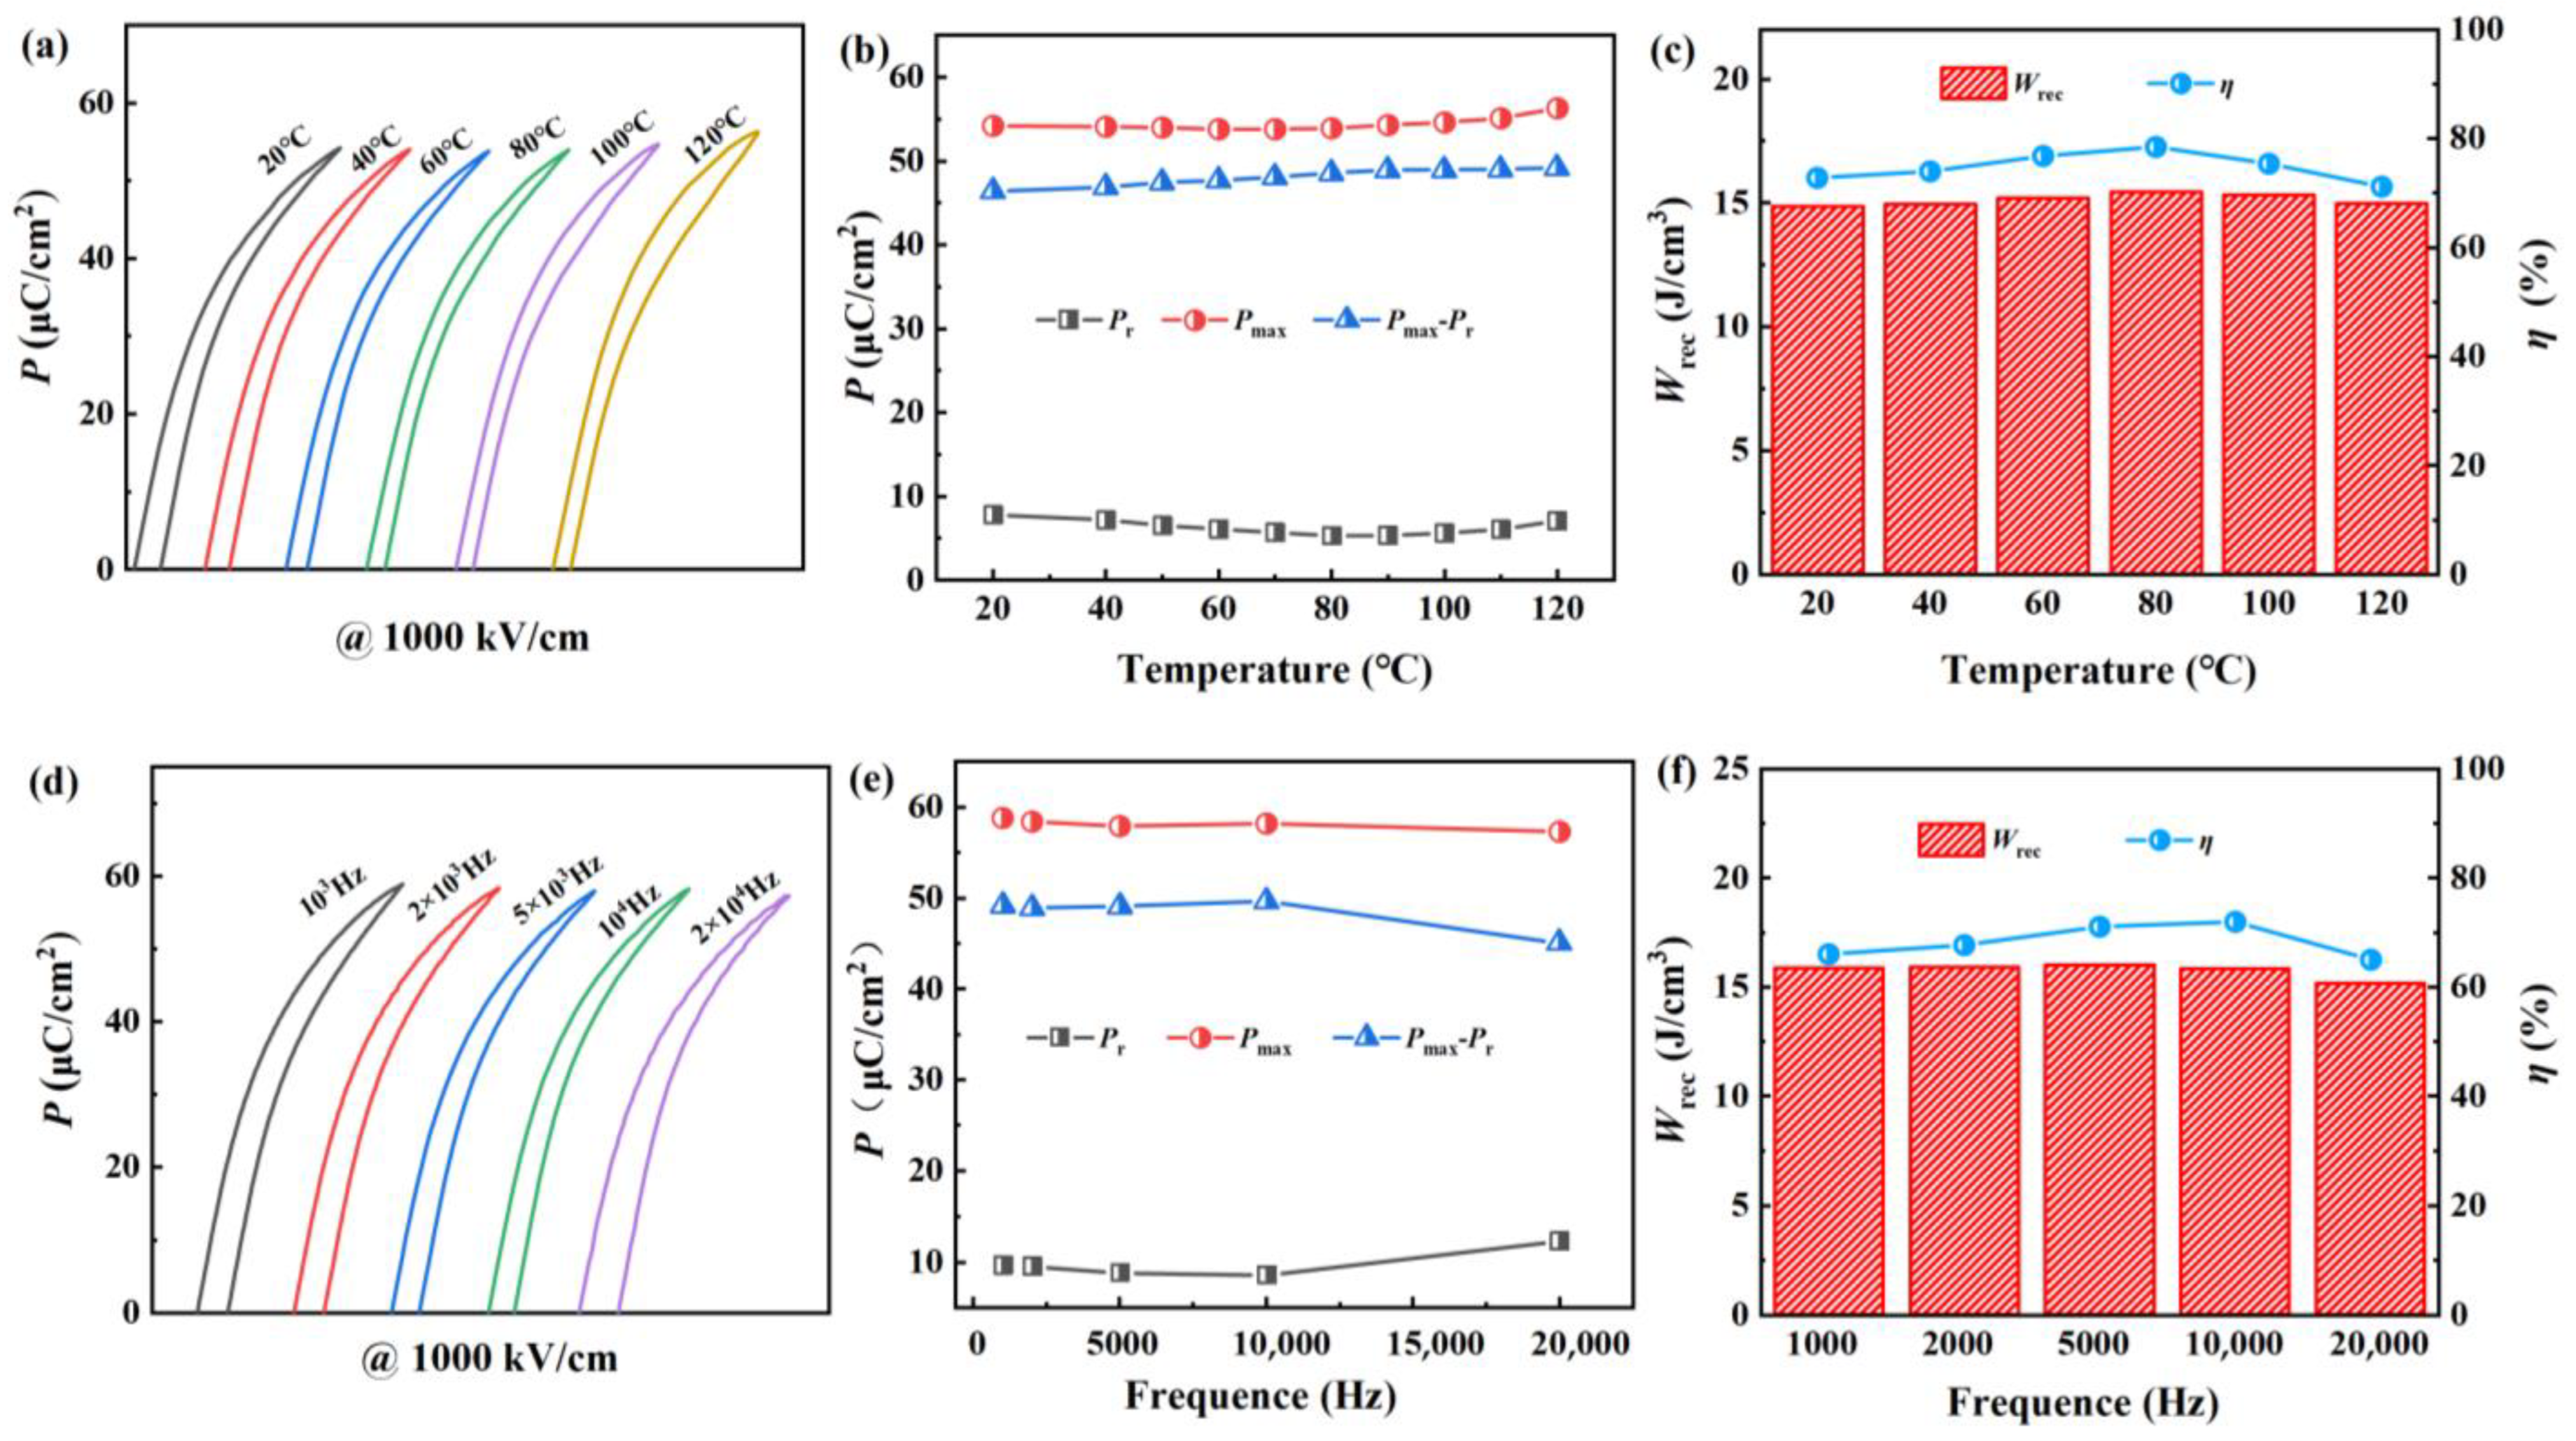
The temperature stability and frequency stability of the film is also very important for practical applications. Figure 5a depicts the P-E loops of the NBT film at a temperature range of 20–120 °C. The elongated P-E loop changes to a pinched one as the temperature increases from 20 °C to 120 °C, which may be caused by phase transition. It has been reported that the RFE phase would translate to the AFE phase as the temperature reaches 180 °C in NBT bulk ceramics. The AFE phase would result in double P-E loops in NBT bulk ceramics [25,26]. The NBT film shows an AFE-like double P-E loop at about 100 °C, which is much lower than that of NBT bulk ceramics, indicating that it is easier for the NBT film to realize the RFE-AFE phase transition. Figure 5b illustrates the variations of Pmax, Pr, and ∆P with temperature. There is a slight decrease in Pr and Pmax as the temperature rises from 20 °C to 80 °C, which may be due to the RFE-AFE phase transition. Pr and Pmax increase as the temperature rises from 90 °C to 120 °C. It can be inferred that the phase transition temperature of RFE-AFE may be 80–90 °C. At high temperature, the domain wall movement becomes easier, and the leakage current will increase with the increase in temperature; both of them will lead to an increase in both Pr and Pmax at a high temperature [12]. The fluctuations of Wrec and η with temperature are depicted in Figure 5c, where the fluctuation in Wrec is less than 4% over the range of 20–120 °C. η increases gradually at 20–80 °C and reaches a maximum value of 78.5% at 80°C. This can be attributed to the fact that the film is in an RFE state in this temperature range. η gradually decreases at 90–120 °C, which can be attributed to the increase in the hysteresis caused by the RFE-AFE phase transition. The fluctuation of η is less than 10% at 20–120 °C, indicating that NBT film has good temperature stability. In addition, the fluctuations are less than 10% at 103 Hz–2 × 10⁴ Hz for both Wrec and η, as depicted in Figure 5f.

4. Conclusions

NBT thin films were prepared by pulsed laser deposition. NBT films show elongated hysteresis loops in the range of 200–1400 kV/cm. All these findings align with the characteristics of RFE, as evidenced by the relationship <A>∝Eα. The dielectric tunability increases from 3.3% to 24.4% when the electric field is increased from 300 kV/cm to 900 kV/cm in the NBT films. Owing to the small thickness, dense microstructure and small dielectric tenability, the NBT films display an Eb of reaching 1400 kV/cm, which results in a favorable Wrec of 24.6 J/cm3 and η of 72%. In addition, the fluctuations of Wrec and η are less than 4% and 10% in the temperature range of 20–120 °C, indicating good thermal stability. In the frequency range of 103 Hz–2 × 10⁴ Hz, the fluctuations of Wrec and η are less than 10%, implying better frequency stability.

Author Contributions

Formal analysis, X.W.; Investigation, L.Z.; Data curation, L.Z.; Writing—original draft, X.L., Y.Y. and X.W.; Writing—review & editing, X.L., L.Z. and X.S.; Supervision, L.Z.; Project administration, L.Z. and X.S.; Funding acquisition, L.Z. All authors have read and agreed to the published version of the manuscript.

Funding

This work was supported by the Natural Science Foundation of Hebei Province, China (No. E2021201044).

Institutional Review Board Statement

Not applicable.

Informed Consent Statement

Not applicable.

Data Availability Statement

Data is contained within the article.

Conflicts of Interest

The authors declare that they have no known competing financial interests or personal relationships that could have appeared to influence the work reported in this paper.

References

  1. Pan, H.; Lan, S.; Xu, S.Q.; Zhang, Q.H.; Yao, H.B.; Liu, Y.Q.; Meng, F.Q.; Guo, E.J.; Gu, L.; Yi, D.; et al. Ultrahigh energy storage in superparaelectric relaxor ferroelectrics. Science 2021, 374, 100–104. [Google Scholar] [CrossRef] [PubMed]
  2. Kim, J.; Saremi, S.; Acharya, M.; Velarde, G.; Parsonnet, E.; Donahue, P.; Qualls, A.; Garcia, D.; Martin, L.W. Ultrahigh capacitive energy density in ion-bombarded relaxor ferroelectric films. Science 2020, 369, 81–84. [Google Scholar] [CrossRef] [PubMed]
  3. Zhao, M.Y.; Wang, J.; Yuan, H.; Zheng, Z.H.; Zhao, L. Energy storage performance and phase transition under high electric field in Na/Ta co-doped AgNbO3 ceramics. J. Mater. 2023, 9, 19–26. [Google Scholar] [CrossRef]
  4. Jain, A.; Wang, Y.G.; Shi, L.N. Recent developments in BaTiO3 based lead-free materials for energy storage applications. J. Alloys Compd. 2022, 928, 167066. [Google Scholar] [CrossRef]
  5. Ge, P.Z.; Liu, Z.G.; Huang, X.X.; Tang, X.G.; Tang, Z.H.; Li, S.F.; Liu, Q.X.; Jiang, Y.P.; Guo, X.B. Excellent energy storage properties realized in novel BaTiO3-based lead-free ceramics by regulating relaxation behavior. J. Mater. 2023, 9, 910–919. [Google Scholar] [CrossRef]
  6. Zhang, Y.L.; Li, X.B.; Song, J.M.; Zhang, S.W.; Wang, J.; Dai, X.H.; Liu, B.T.; Dong, G.Y.; Zhao, L. AgNbO3 antiferroelectric film with high energy storage performance. J. Mater. 2021, 7, 1294–1300. [Google Scholar] [CrossRef]
  7. Qiao, X.S.; Sheng, A.H.; Wu, D.; Zhang, F.D.; Chen, B.; Niang, P.F.; Wang, J.J.; Chao, X.L.; Yang, Z.P. A novel multifunctional ceramic with photoluminescence and outstanding energy storage properties. Chem. Eng. J. 2021, 408, 127368. [Google Scholar] [CrossRef]
  8. Zhou, X.F.; Qi, H.; Yan, Z.N.; Xue, G.L.; Luo, H.; Zhang, D. Superior thermal stability of high energy density and power density in domain-engineered Bi0.5Na0.5TiO3–NaTaO3 relaxor ferroelectrics. ACS Appl. Mater. Interfaces 2019, 11, 43107–43115. [Google Scholar] [CrossRef]
  9. Zhao, Y.; Hao, X.H.; Li, M.L. Dielectric properties and energy-storage performance of (Na0.5Bi0.5)TiO3 thick films. J. Alloys Compd. 2014, 601, 112–115. [Google Scholar] [CrossRef]
  10. Wang, F.; Zhu, C.; Zhao, S.F. Good energy storage properties of Na0.5Bi0.5TiO3 thin films. J. Alloys Compd. 2021, 869, 159366. [Google Scholar] [CrossRef]
  11. Han, H.J.; Zhang, Q.H.; Li, W.; Liu, Y.Q.; Guo, J.S.; Wang, Y.; Li, Q.; Gu, L.; Nan, C.W.; Ma, J. Interfacial oxygen octahedral coupling-driven robust ferroelectricity in epitaxial Na0.5Bi0.5TiO3 thin films. Research 2023, 6, 0191. [Google Scholar] [CrossRef] [PubMed]
  12. An, Z.X.; Yao, Y.; Wang, J.; Zhu, L.F.; Zhao, L. Energy storage performance and piezoelectric response of silver niobate antiferroelectric thin film. Ceram. Int. 2024, 50, 12427–12433. [Google Scholar] [CrossRef]
  13. Sui, H.T.; Yang, C.H.; Wang, G.; Feng, C. Dielectric tunability of highly (l00)-oriented Fe-doped Na0.5Bi0.5TiO3 thin film. Ceram. Int. 2014, 40, 12989–12992. [Google Scholar] [CrossRef]
  14. Saxena, A.; Sharma, P.; Saxena, A.; Verma, V.; Saxena, R.S. Effect of La doping on dielectric properties of BiFe0.95Mn0.05O3 multiferroics. Ceram. Int. 2014, 40, 15065–15072. [Google Scholar] [CrossRef]
  15. Cheng, M.; Tan, G.Q.; Xue, X.; Xia, A.; Ren, H.J. Preparation of Nd-doped BiFeO3 films and their electrical properties. Phys. Rev. B Condens. 2012, 407, 3360–3363. [Google Scholar] [CrossRef]
  16. Wang, S.Y.; Cheng, B.L.; Wang, C.; Dai, S.Y.; Lu, H.B.; Zhou, Y.L.; Chen, Z.H.; Yang, G.Z. Reduction of leakage current by Co doping in Pt/Ba0.5Sr0.5TiO3/Nb–SrTiO3 capacitor. Appl. Phys. Lett. 2004, 84, 4116–4118. [Google Scholar] [CrossRef]
  17. YQi, J.; Lu, C.J.; Zhang, Q.F.; Wang, L.H.; Chen, F.; Cheng, C.S.; Liu, B.T. Improved ferroelectric and leakage properties in sol–gel derived BiFeO3/Bi3.15Nd0.85Ti3O12 bi-layers deposited on Pt/Ti/SiO2/Si. J. Phys. D Appl. Phys. 2008, 41, 065407. [Google Scholar] [CrossRef]
  18. Song, J.M.; Gao, J.; Zhang, S.W.; Luo, L.H.; Dai, X.H.; Zhao, L.; Liu, B.T. Structure and electrical properties of Na0.5Bi0.5TiO3 epitaxial films with (110) orientation. Crystals 2019, 9, 558. [Google Scholar] [CrossRef]
  19. Tian, Y.; Geng, J.; She, L.N.; Lu, T.; Yang, Y.X.; Wu, Z.G.; Xue, X.; Li, C.C.; Wei, X.Y.; Xu, Z.; et al. High hysteresis-free dielectric tunability in silver niobate-based ceramics. Ceram. Int. 2024, 50, 14773–14781. [Google Scholar] [CrossRef]
  20. Narayanan, M.; Tong, S.; Ma, B.; Liu, S.S.; Balachandran, U. Modified Johnson model for ferroelectric lead lanthanum zirconate titanate at very high fields and below Curie temperature. Appl. Phys. Lett. 2012, 100, 022907. [Google Scholar] [CrossRef]
  21. Xie, A.; Fu, J.; Zuo, R.Z.; Li, X.W.J.T.Y.; Fu, Z.Q.; Yin, Y.W.; Li, X.G.; Zhang, S.J. Supercritical relaxor nanograined ferroelectrics for ultrahigh-energy-storage capacitors. Adv. Mater. 2024, 34, 2204356. [Google Scholar] [CrossRef] [PubMed]
  22. Yu, G.; Dong, X.L.; Wang, G.S.; Cao, F.; Chen, X.F.; Nie, H.C. Three-stage evolution of dynamic hysteresis scaling behavior in 63PbTiO3−37BiScO3 bulk ceramics. J. Appl. Phys. 2017, 107, 106102. [Google Scholar] [CrossRef]
  23. Yimnirun, R.; Wongmaneerung, R.; Wongsaenmai, S.; Ngamjarurojana, A.; Ananta, S.; Laosiritaworn, Y. Dynamic hysteresis and scaling behavior of hard lead zirconate titanate bulk ceramics. Appl. Phys. Lett. 2007, 90, 112908. [Google Scholar] [CrossRef]
  24. Shi, J.P.; Chen, X.L.; Li, X.; Sun, J.; Sun, C.C.; Pang, F.H.; Zhou, H.F. Realizing ultrahigh recoverable energy density and superior charge–discharge performance in NaNbO3-based lead-free ceramics via a local random field strategy. J. Mater. Chem. C 2020, 8, 3784–3794. [Google Scholar] [CrossRef]
  25. Venkidu, L.; Ruth, D.E.J.; Babu, M.V.G.; Rubavathi, P.E.; Dhayanithi, D.; Giridharan, N.V.; Sundarakannan, B. Suppression of intermediate antiferroelectric phase in sub-micron grain size Na0.5Bi0.5TiO3 ceramics. J. Mater. Sci.-Mater. Electron. 2022, 33, 25006–25024. [Google Scholar] [CrossRef]
  26. Jain, A.; Wang, Y.G.; Guo, H.; Wang, N. Grain size engineered Ba0.9Sr0.1Ti0.9Hf0.1O3-Na0.5Bi0.5TiO3 relaxor ceramics with improved energy storage performance. J. Am. Ceram. Soc. 2020, 103, 6308–6318. [Google Scholar] [CrossRef]
Figure 1. (a) XRD patterns, (b) enlarged parts around 47°, (c) Phi scan of (101) plane, surface morphology, (d) and cross-section morphology, (the inset of (d)) the NBT films grown on LNO/STO substrates. The red lines in (a,b) is the XRD patterns of LNO film and STO substrate, and the blue lines in (a,b) is the XRD patterns of NBT film, LNO film and STO substrate.
Coatings 14 00801 g001
Figure 2. (a) Frequency dependences of dielectric constant and dielectric loss, (b) leakage current density and (c) log(J)–log(E) of NBT film.
Coatings 14 00801 g002
Figure 3. (a) εrE curves, and (b) dielectric tunability of the NBT thin film.
Coatings 14 00801 g003
Figure 4. (a) P-E loops, (b) relation between ln<A> and lnE, (c) Pmax, Pr and ∆P, and (d) Wrec and η of NBT film.
Coatings 14 00801 g004
Figure 5. (a,d) P-E loops, (b,e) Pr, Pmax and ΔP, and (c,f) Wrec and η of the NBT thin film at 20–120 °C and 103 Hz–2 × 10⁴ Hz.
Coatings 14 00801 g005
Disclaimer/Publisher’s Note: The statements, opinions and data contained in all publications are solely those of the individual author(s) and contributor(s) and not of MDPI and/or the editor(s). MDPI and/or the editor(s) disclaim responsibility for any injury to people or property resulting from any ideas, methods, instructions or products referred to in the content.