
Study on the Cutting Performance and Remaining Life Prediction of Micro-Texture Ball End Milling Cutters for Titanium Alloys

Abstract
:1. Introduction
2. Materials and Methods
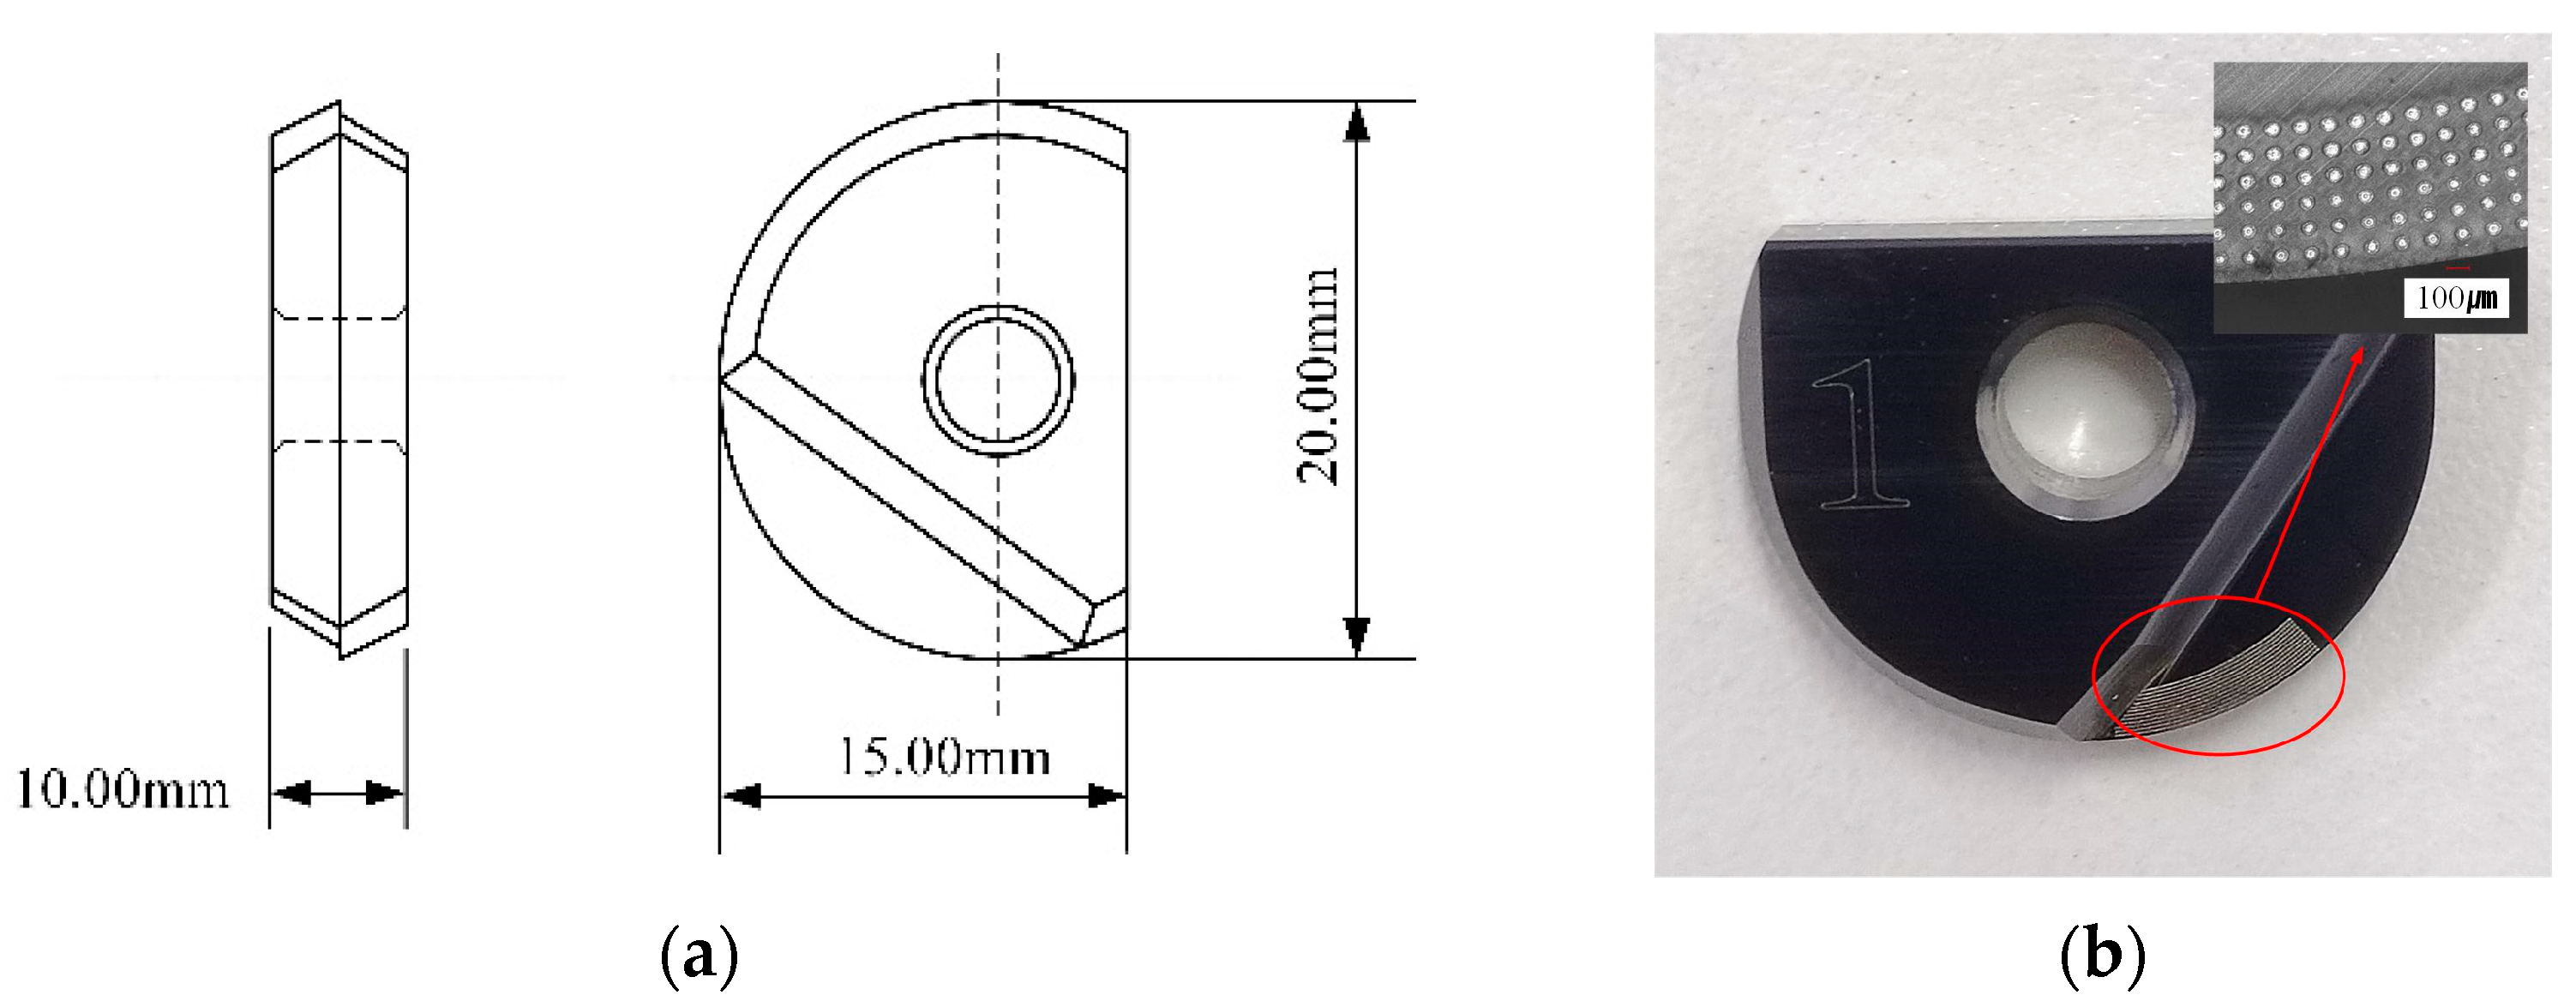
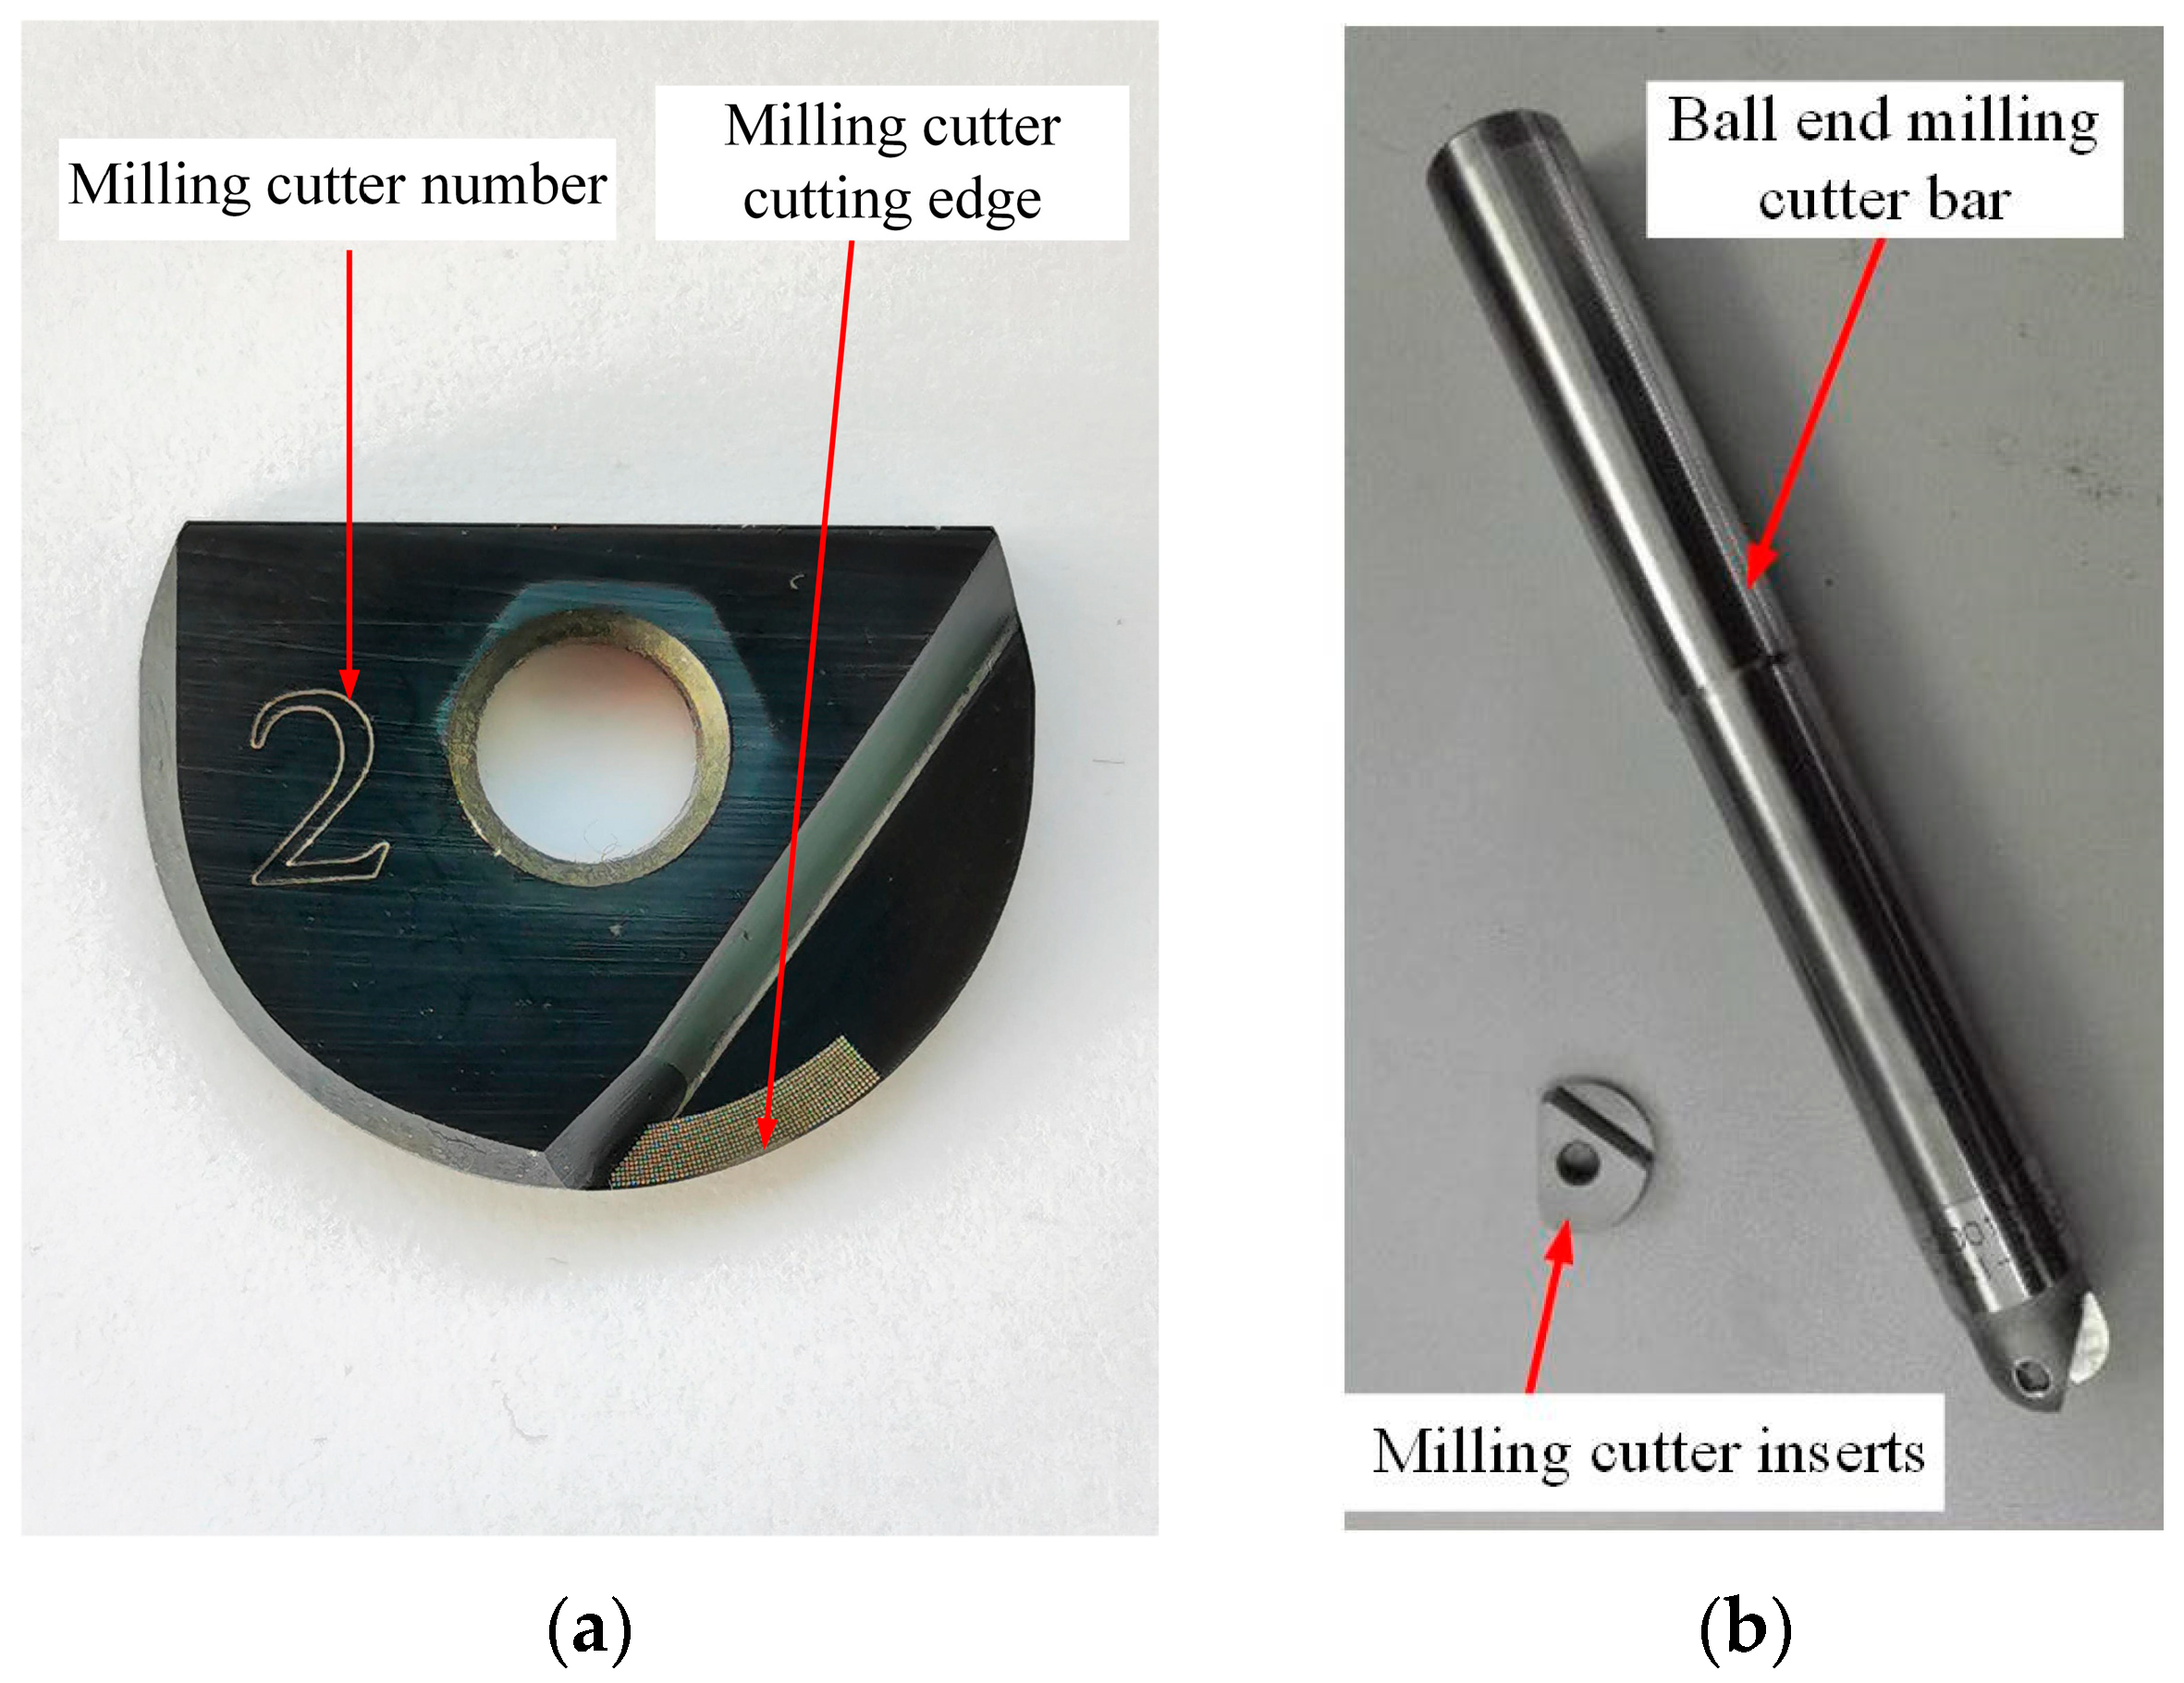
2.1. Preparation of Experimental Materials
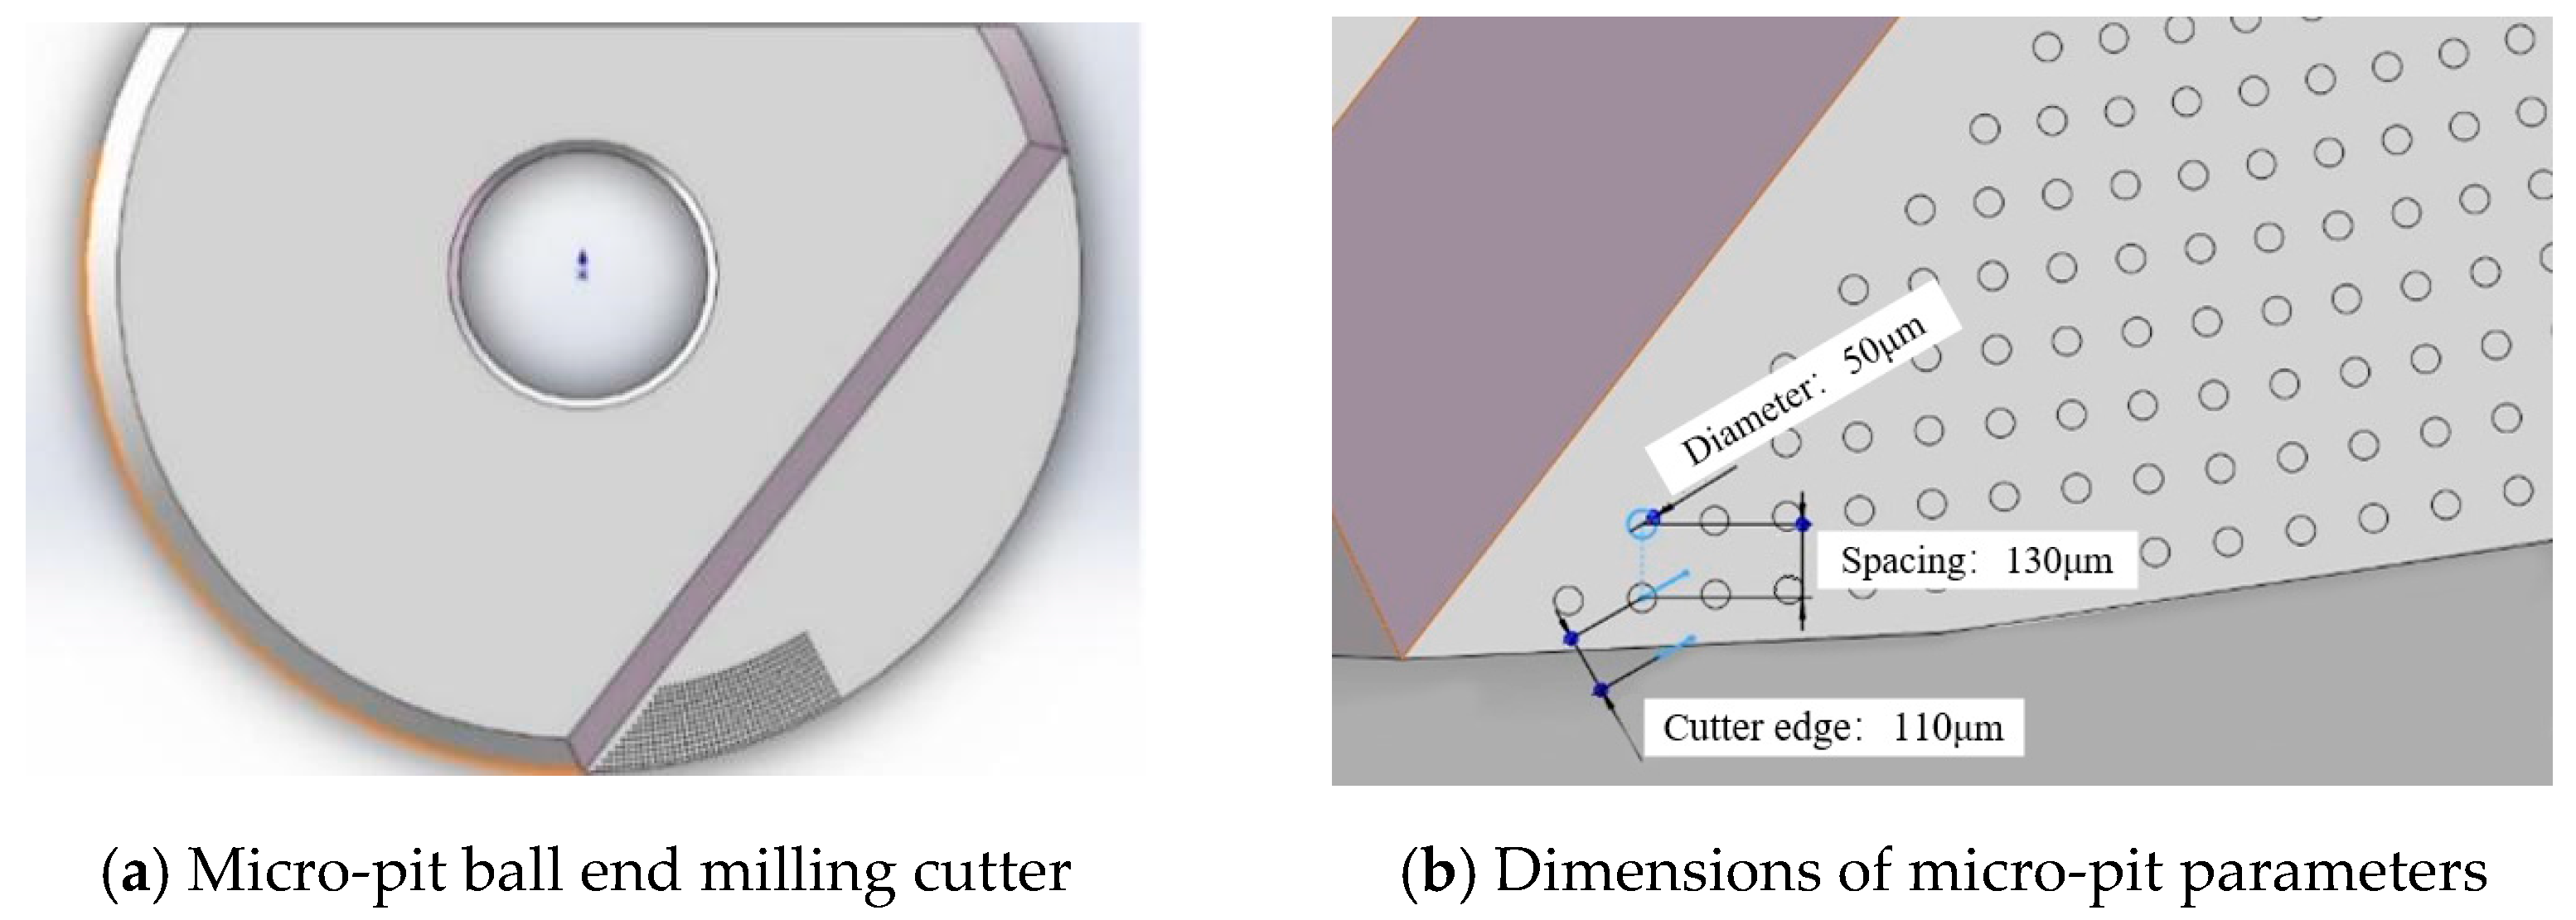
2.2. Design of Tool Surface Texture
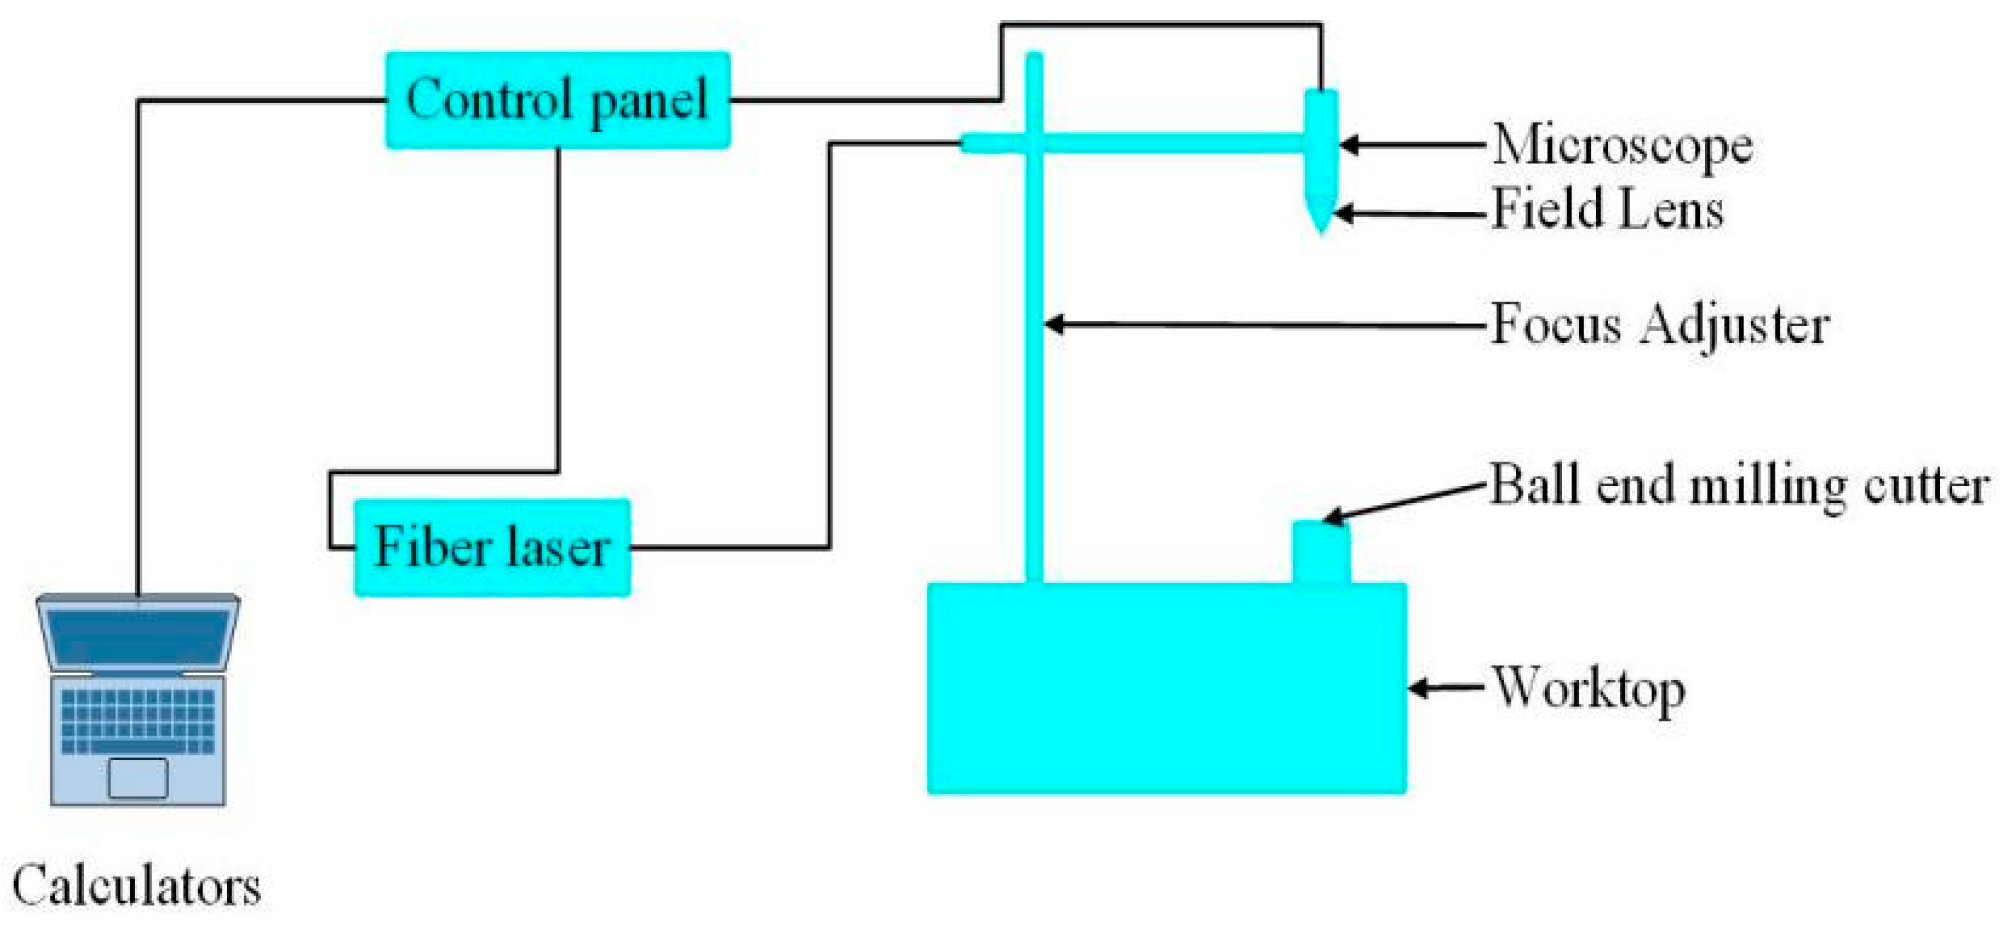
2.3. Laser Processing Equipment
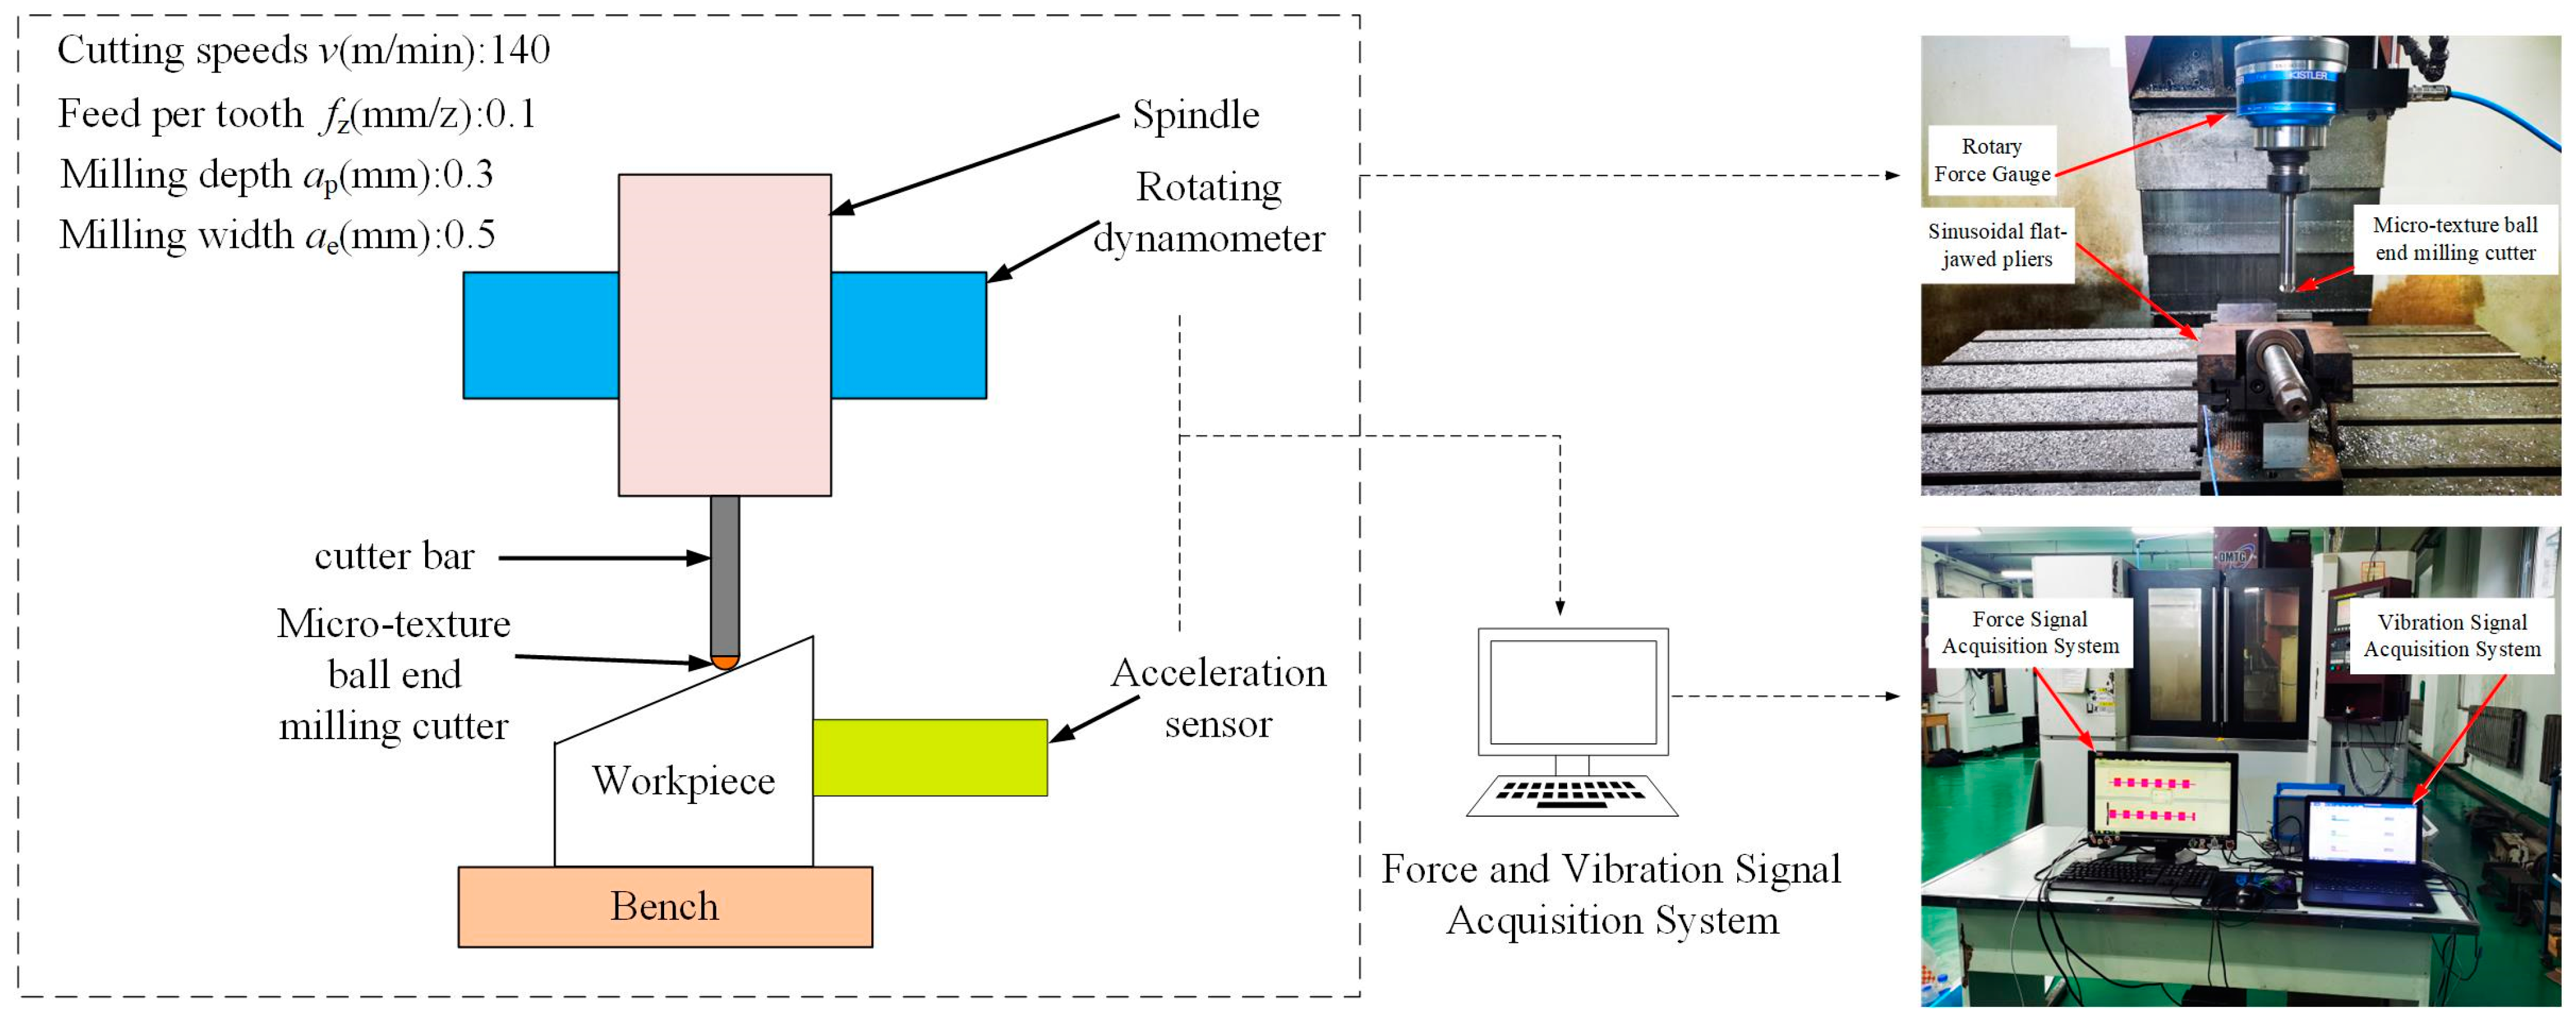
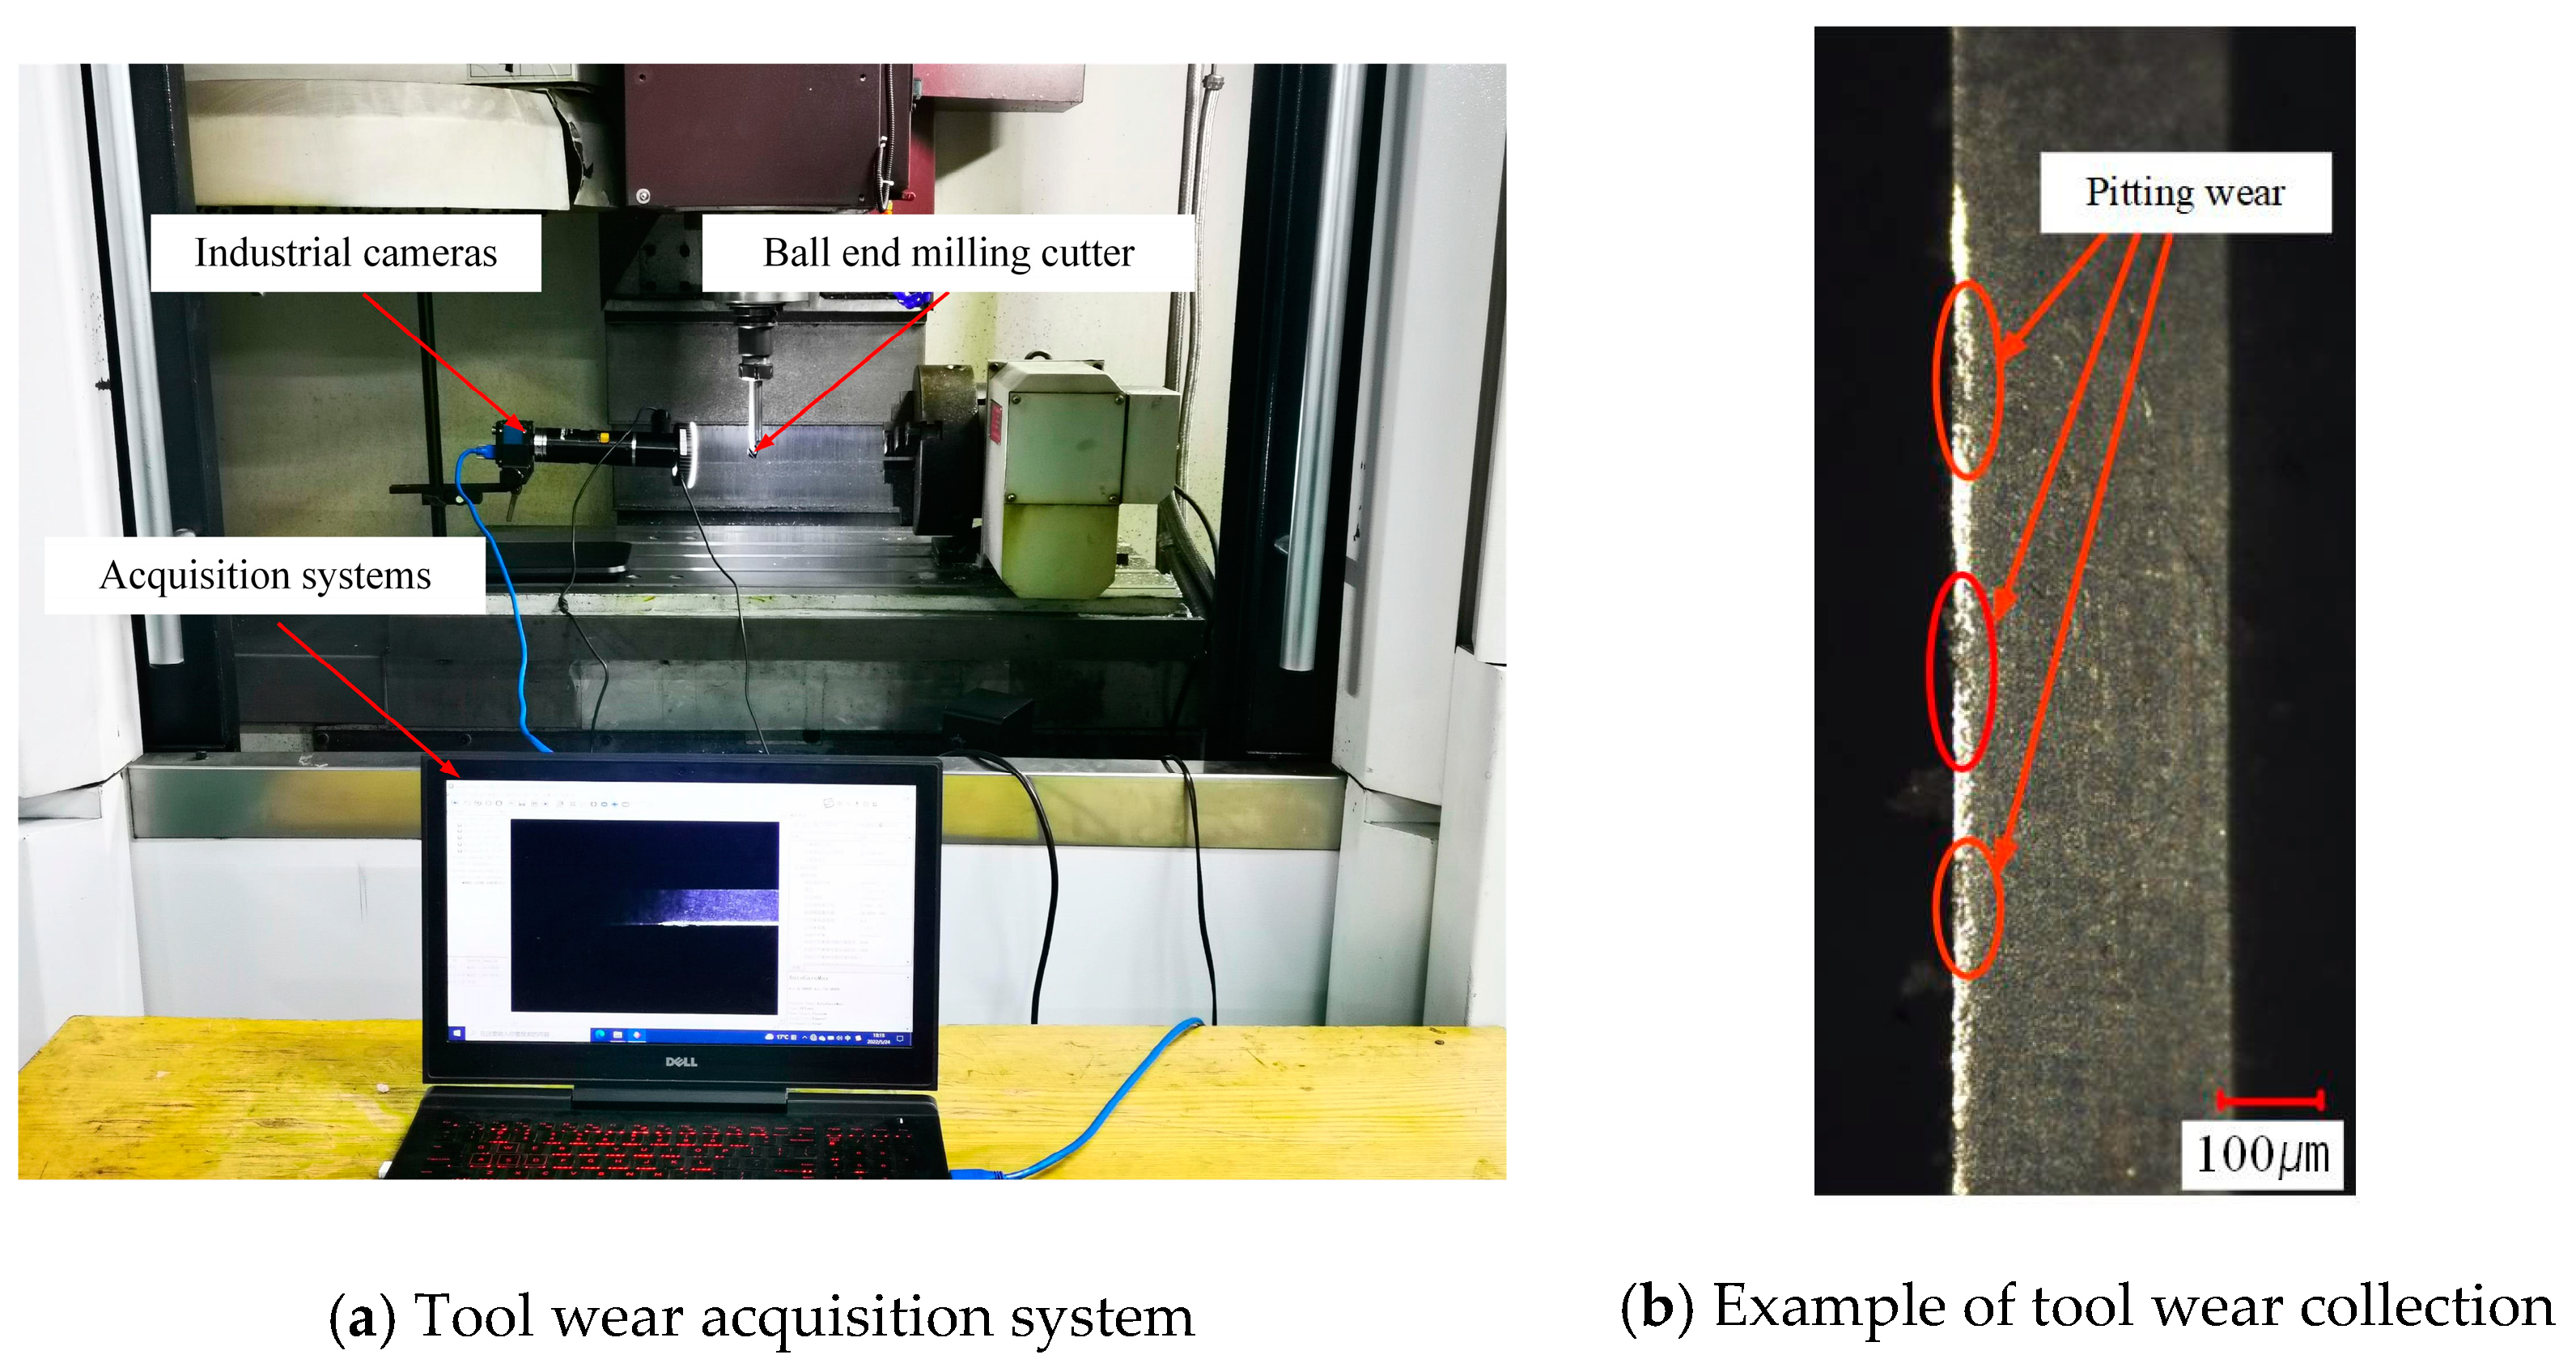
2.4. Construction of the Experimental Platform
3. Analysis of Results
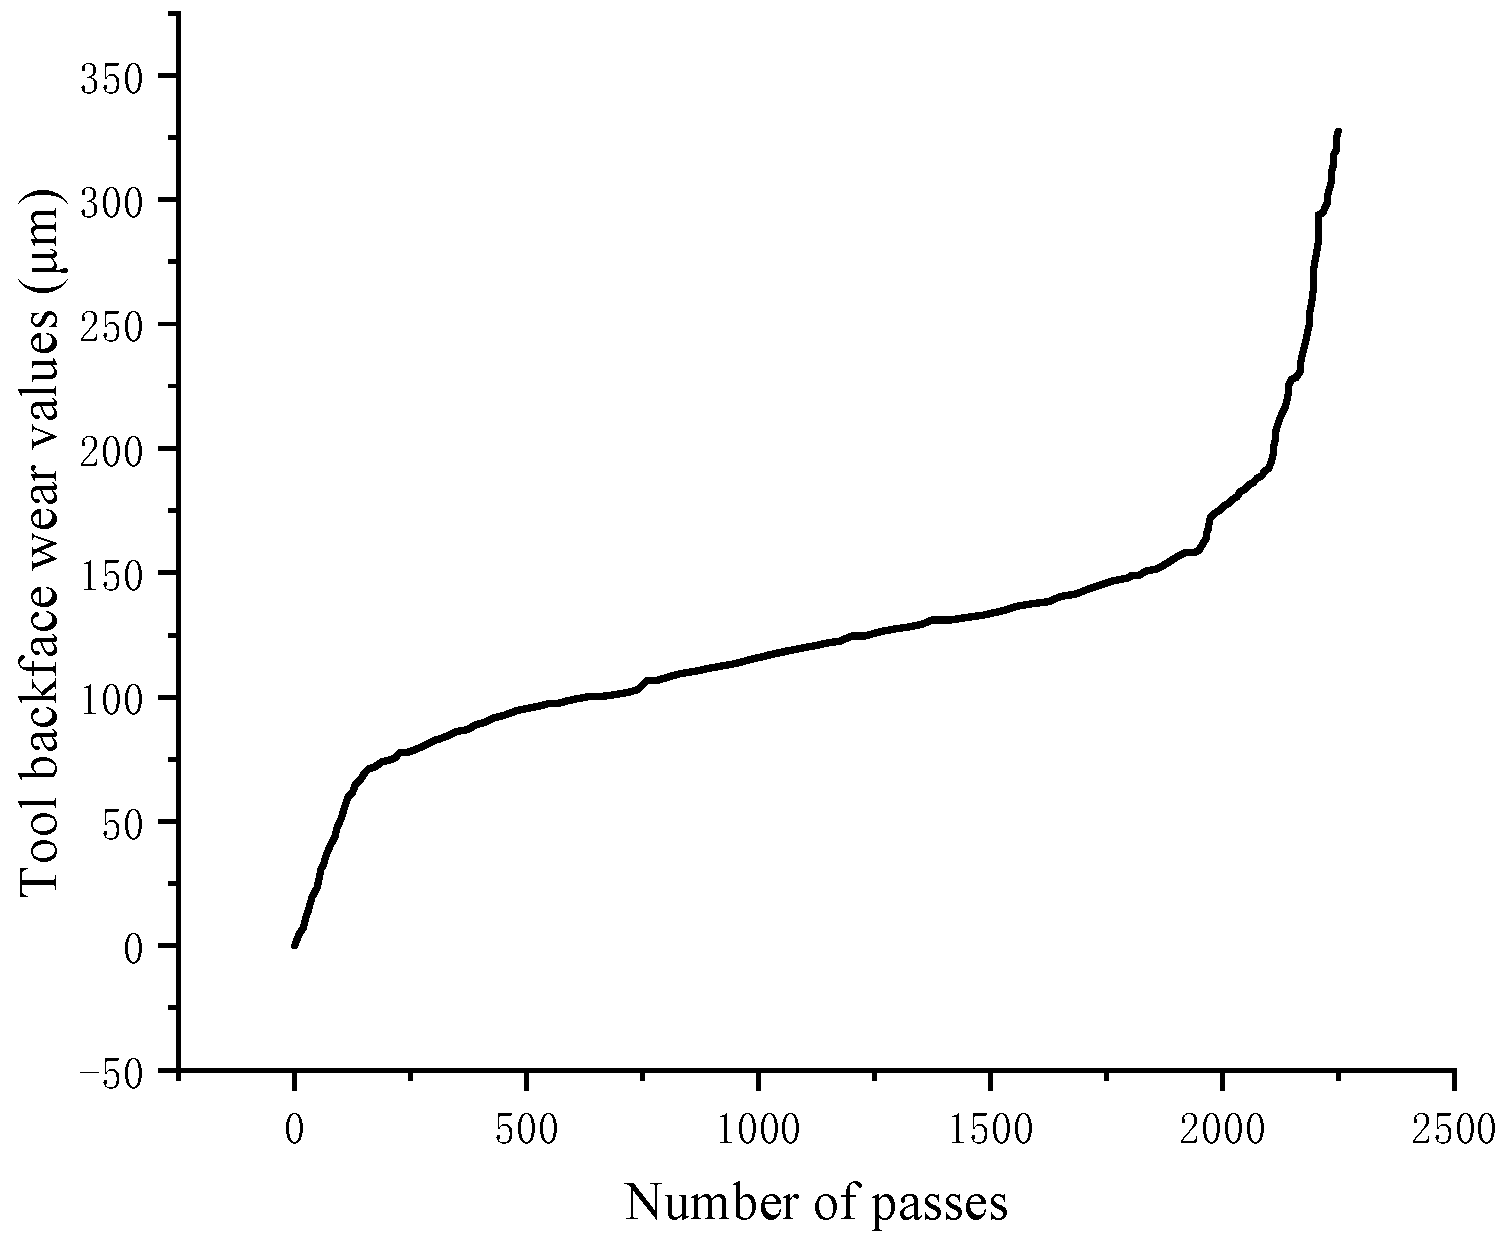
3.1. Tool Wear Result Analysis
- (1)
- Initial wear stage
- (2)
- Intermediate wear stage
- (3)
- Later wear stage
3.2. Analysis of Workpiece Surface Quality
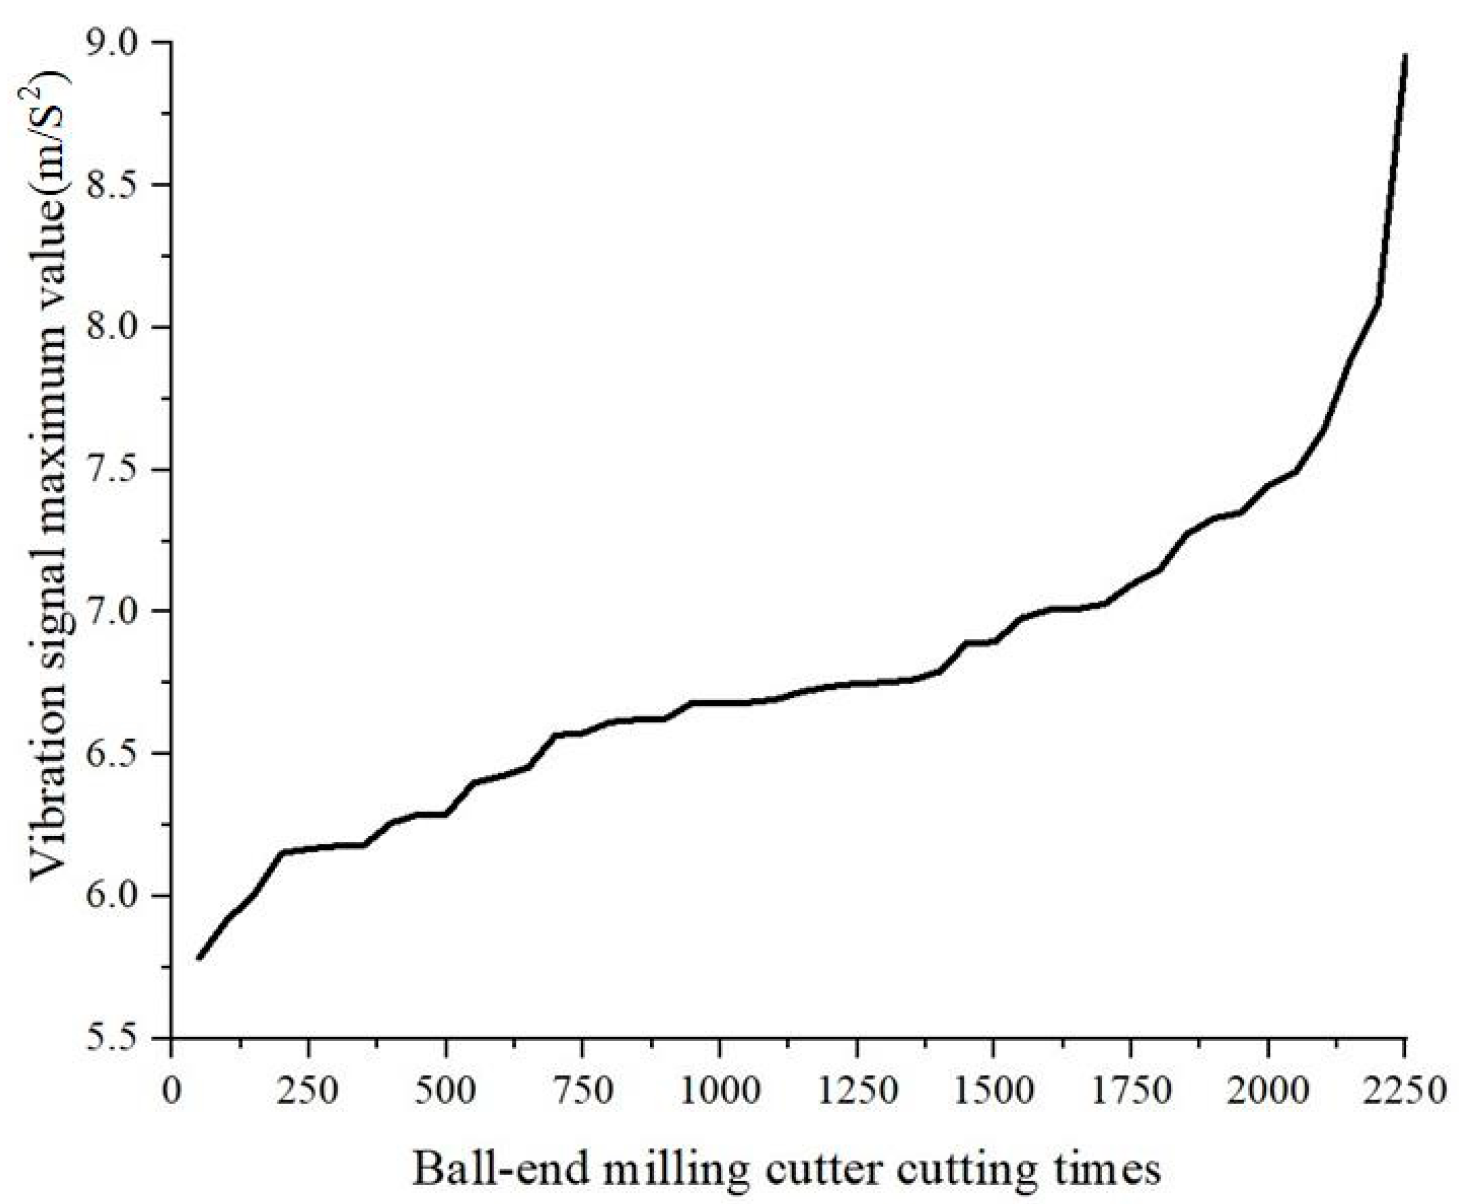
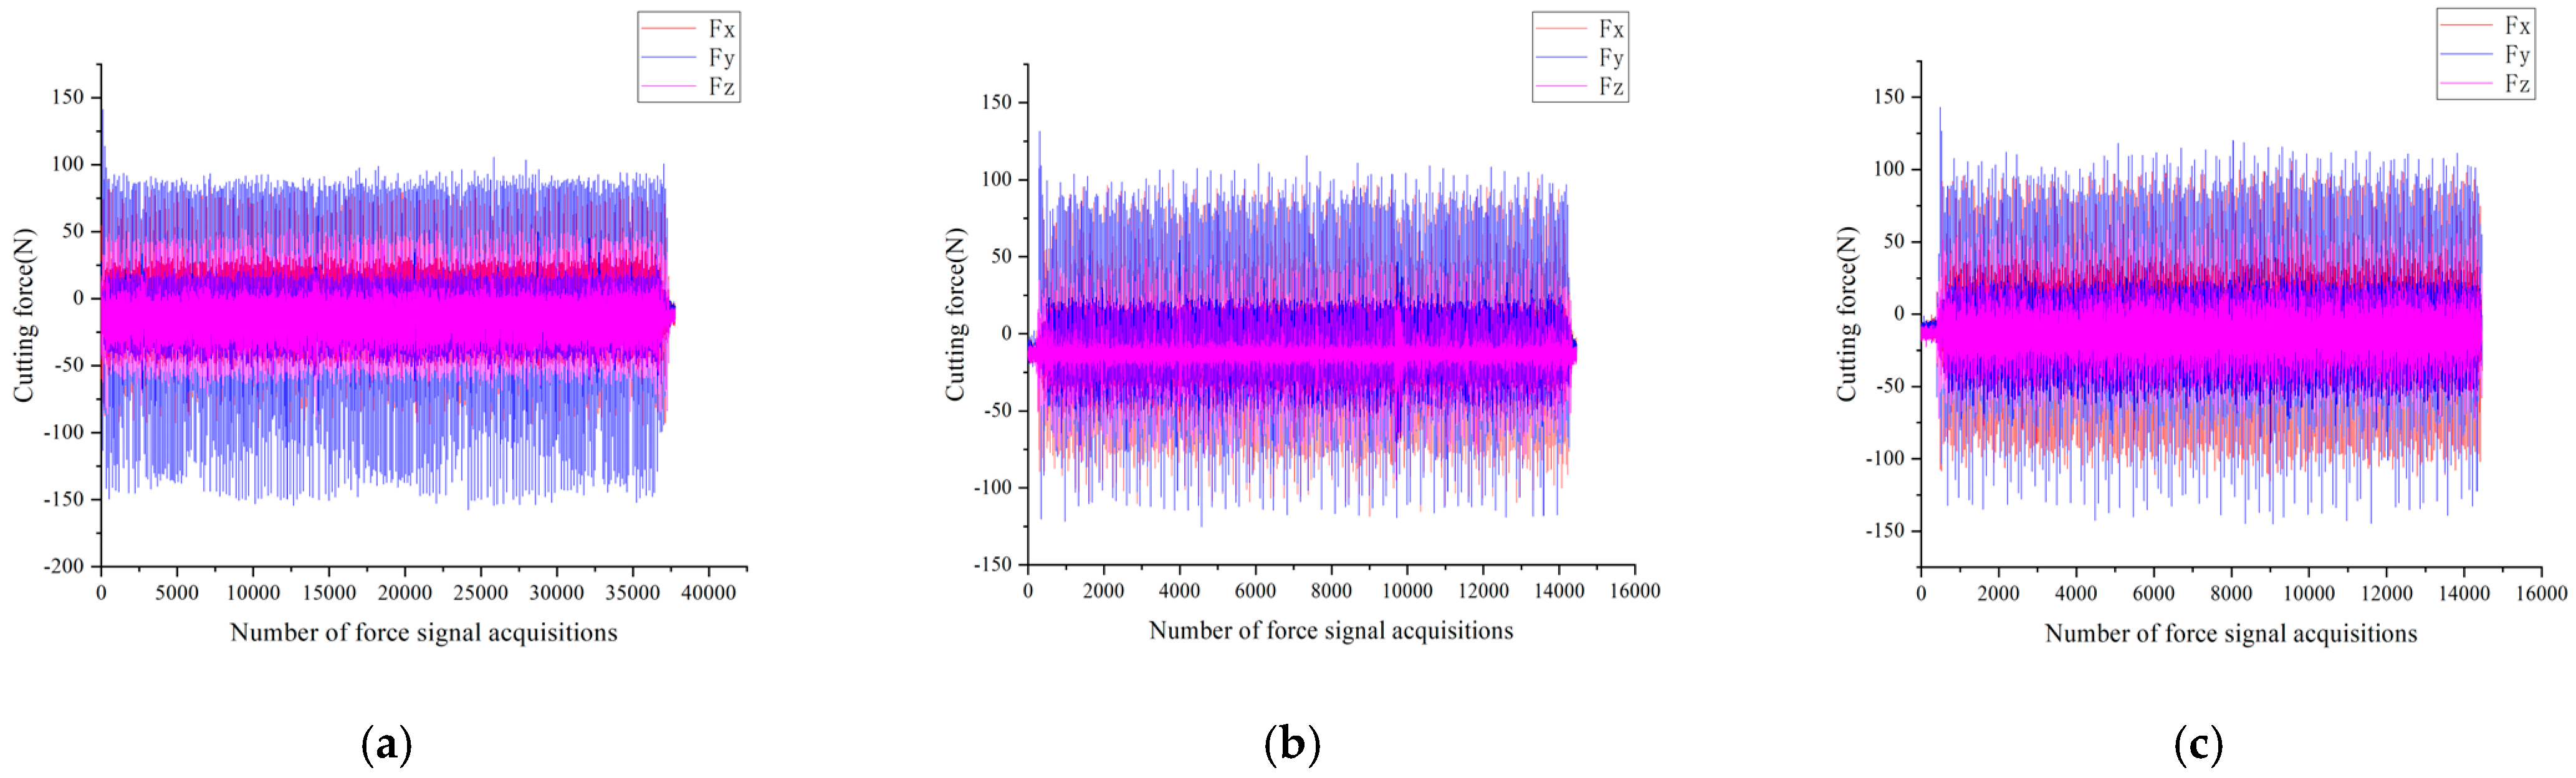
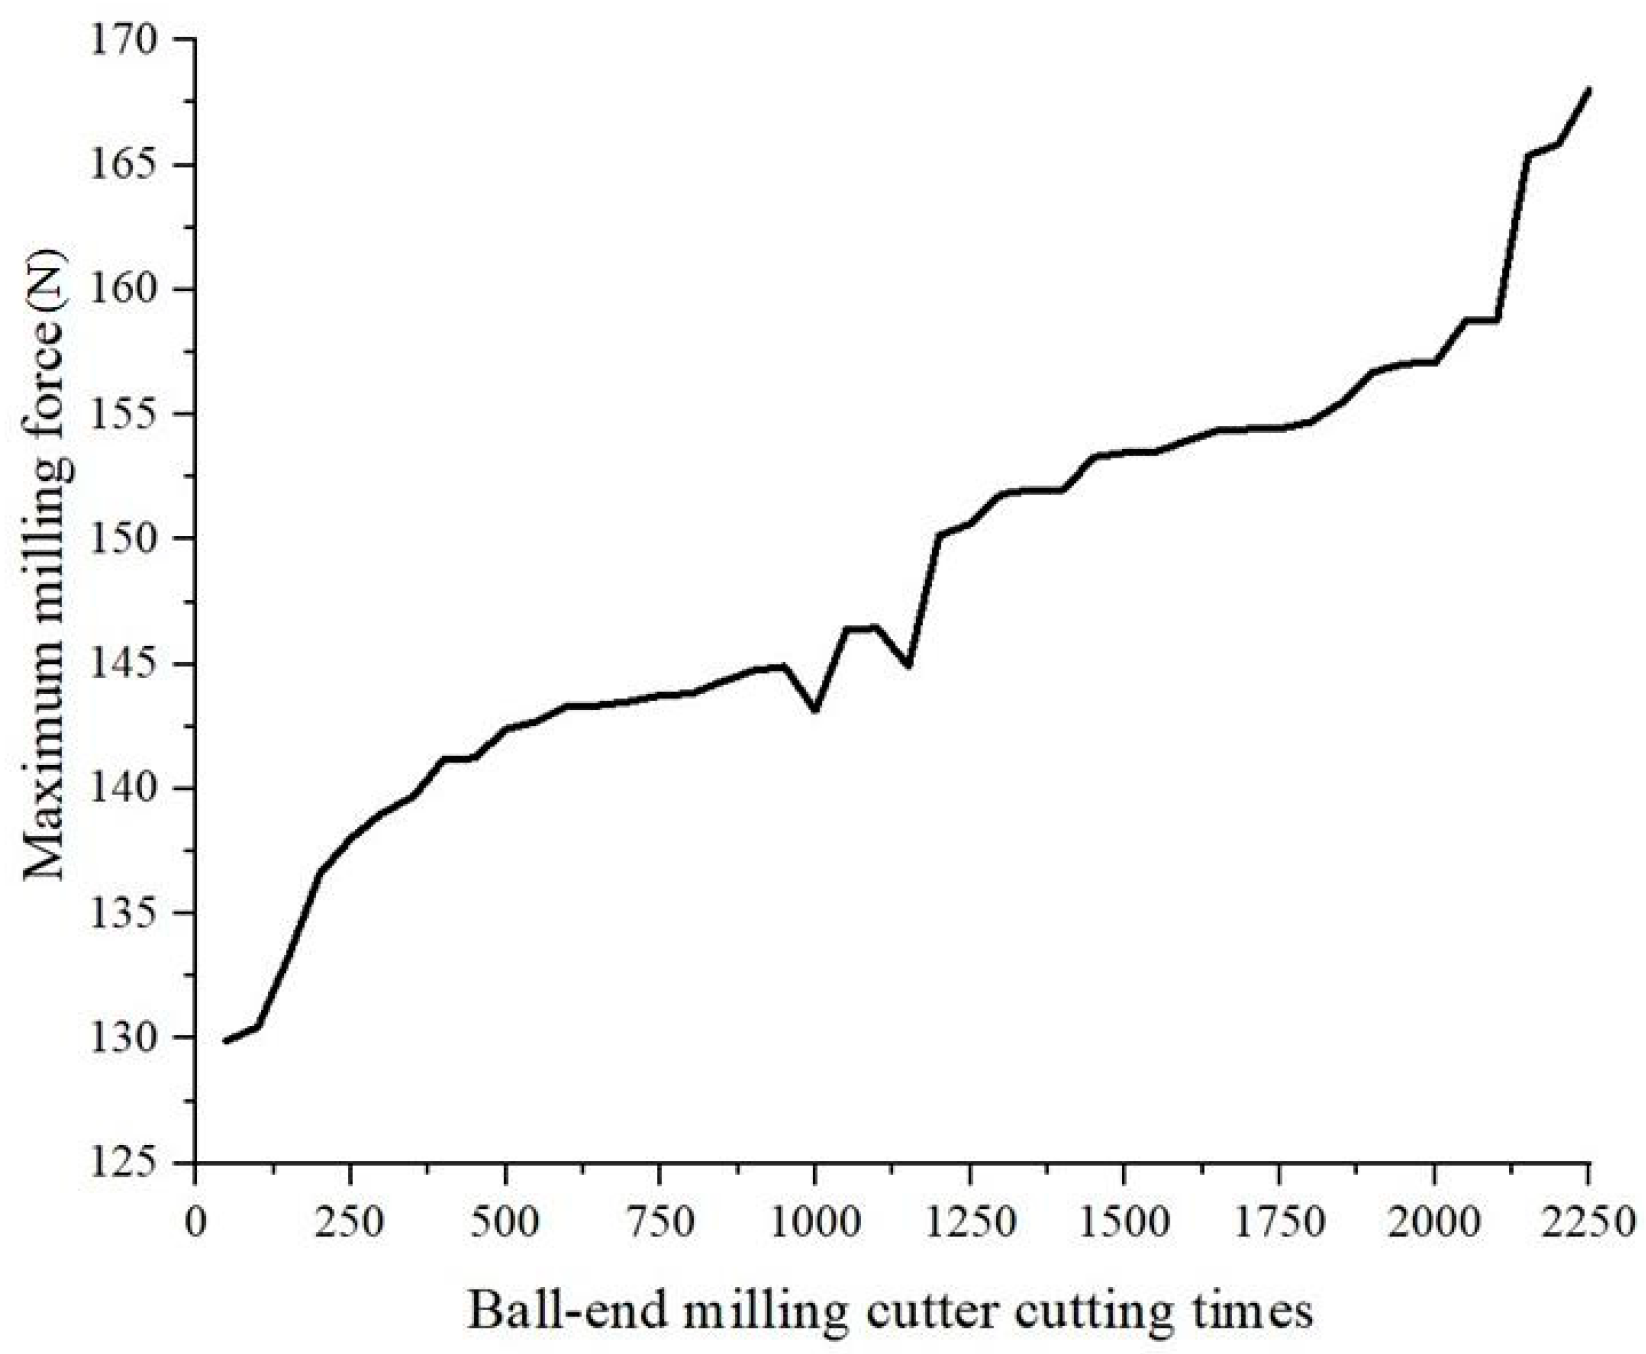
3.3. Preliminary Analysis of Cutting Forces and Vibration Signals
3.4. Preprocessing of Cutting Forces and Vibration Signals
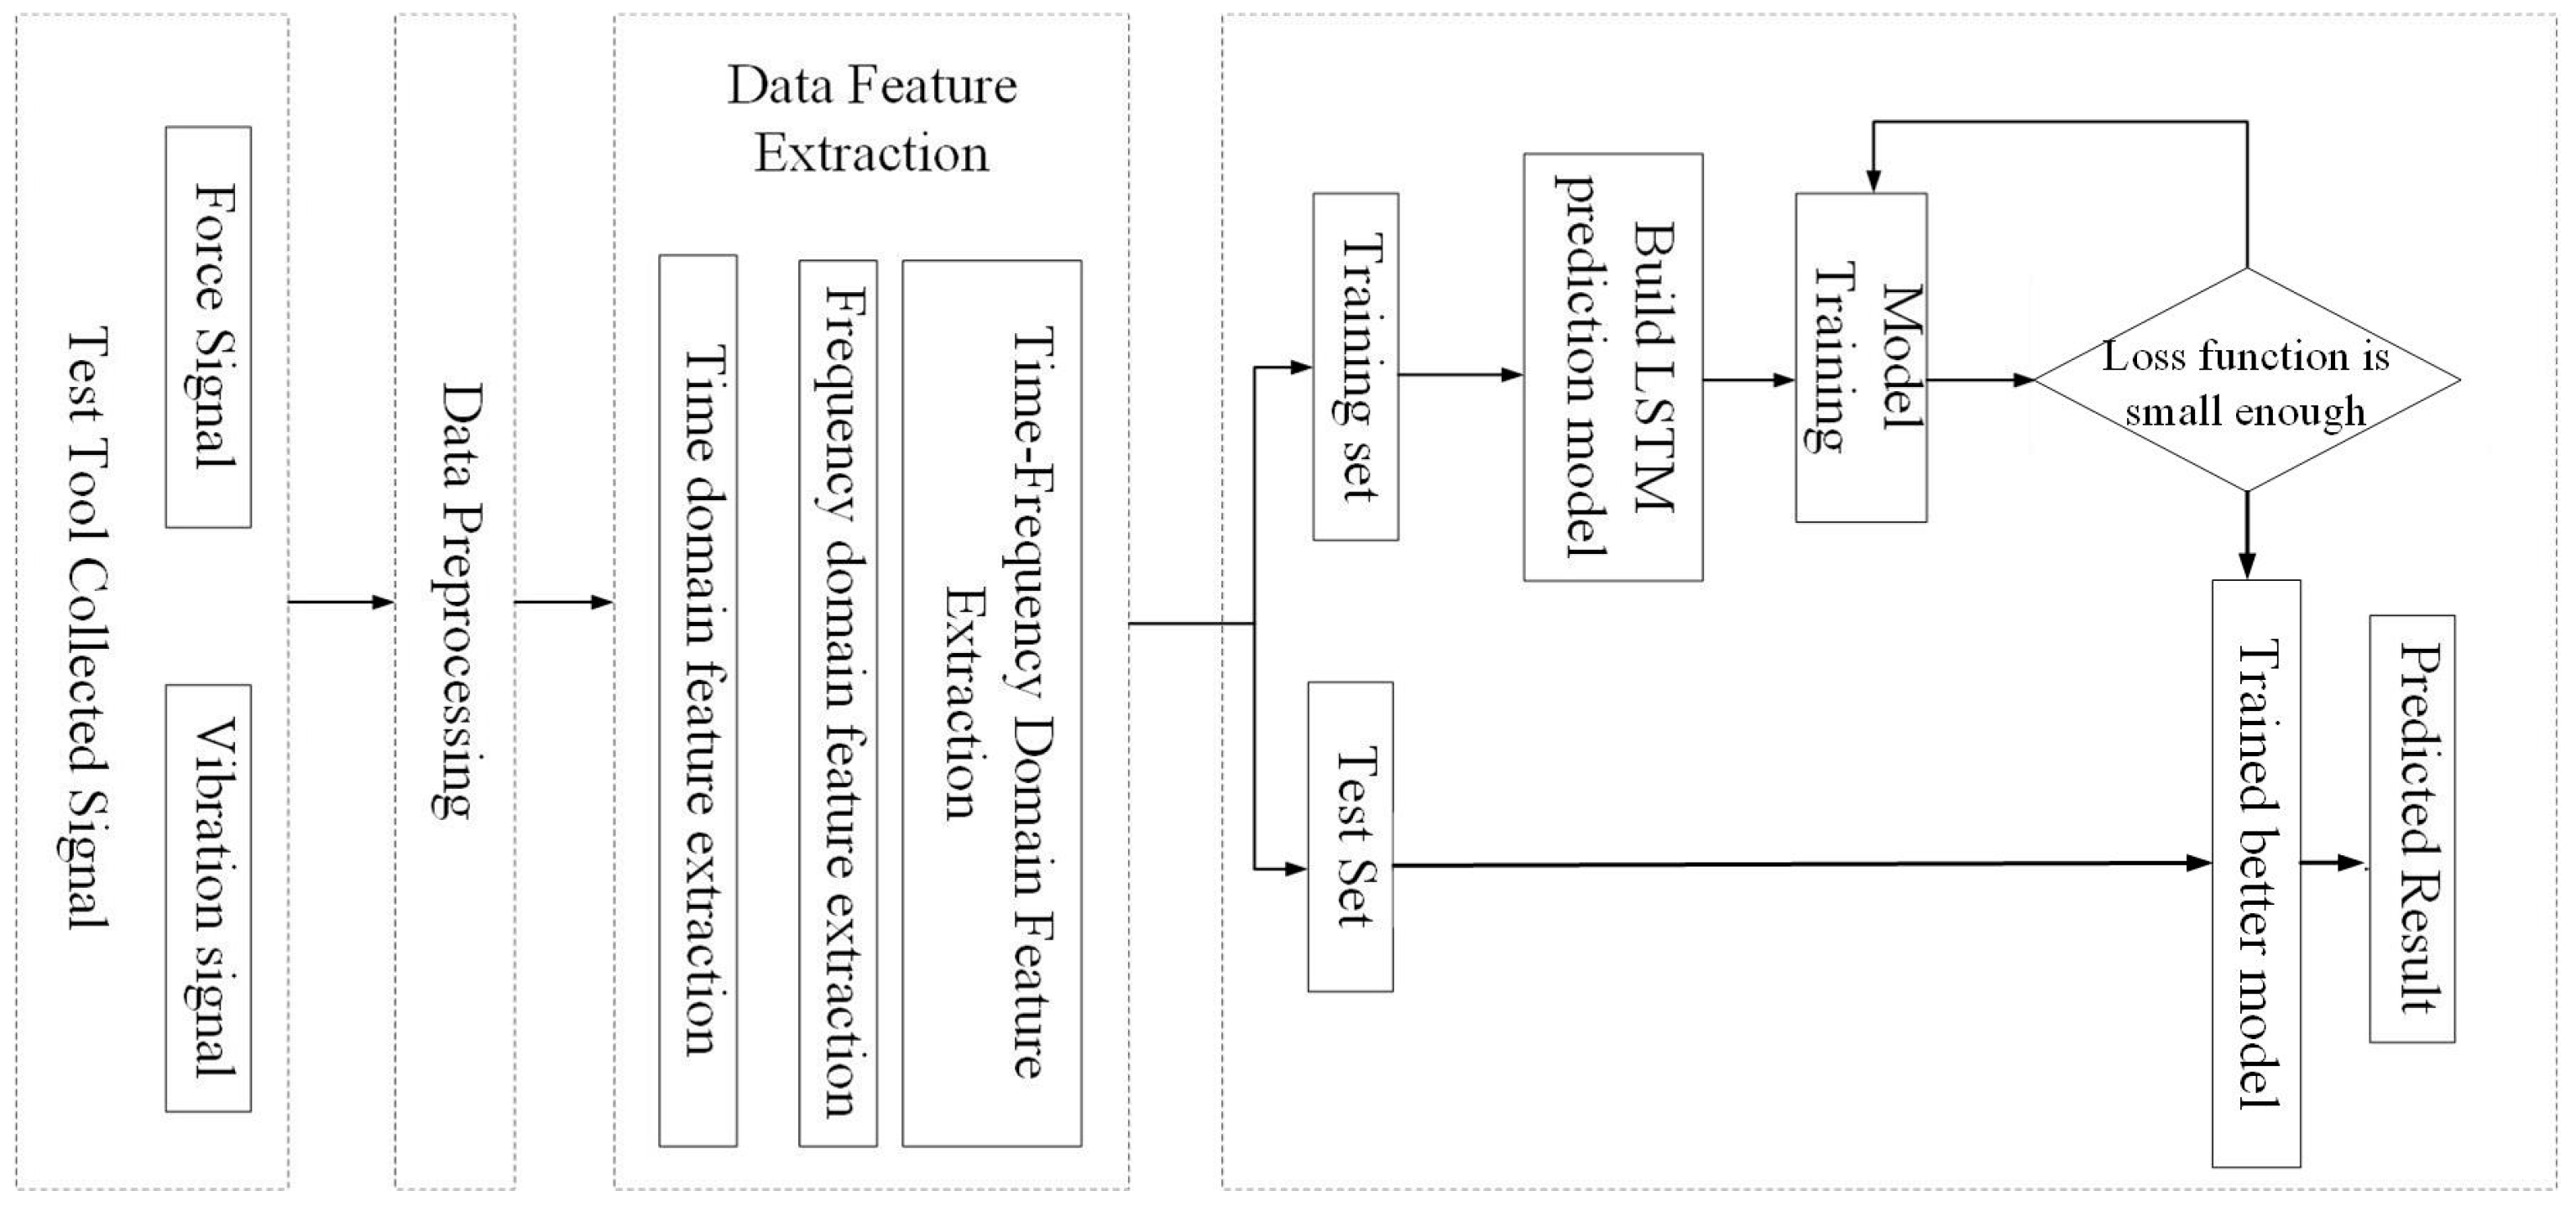
3.5. Tool Residual Life Modeling
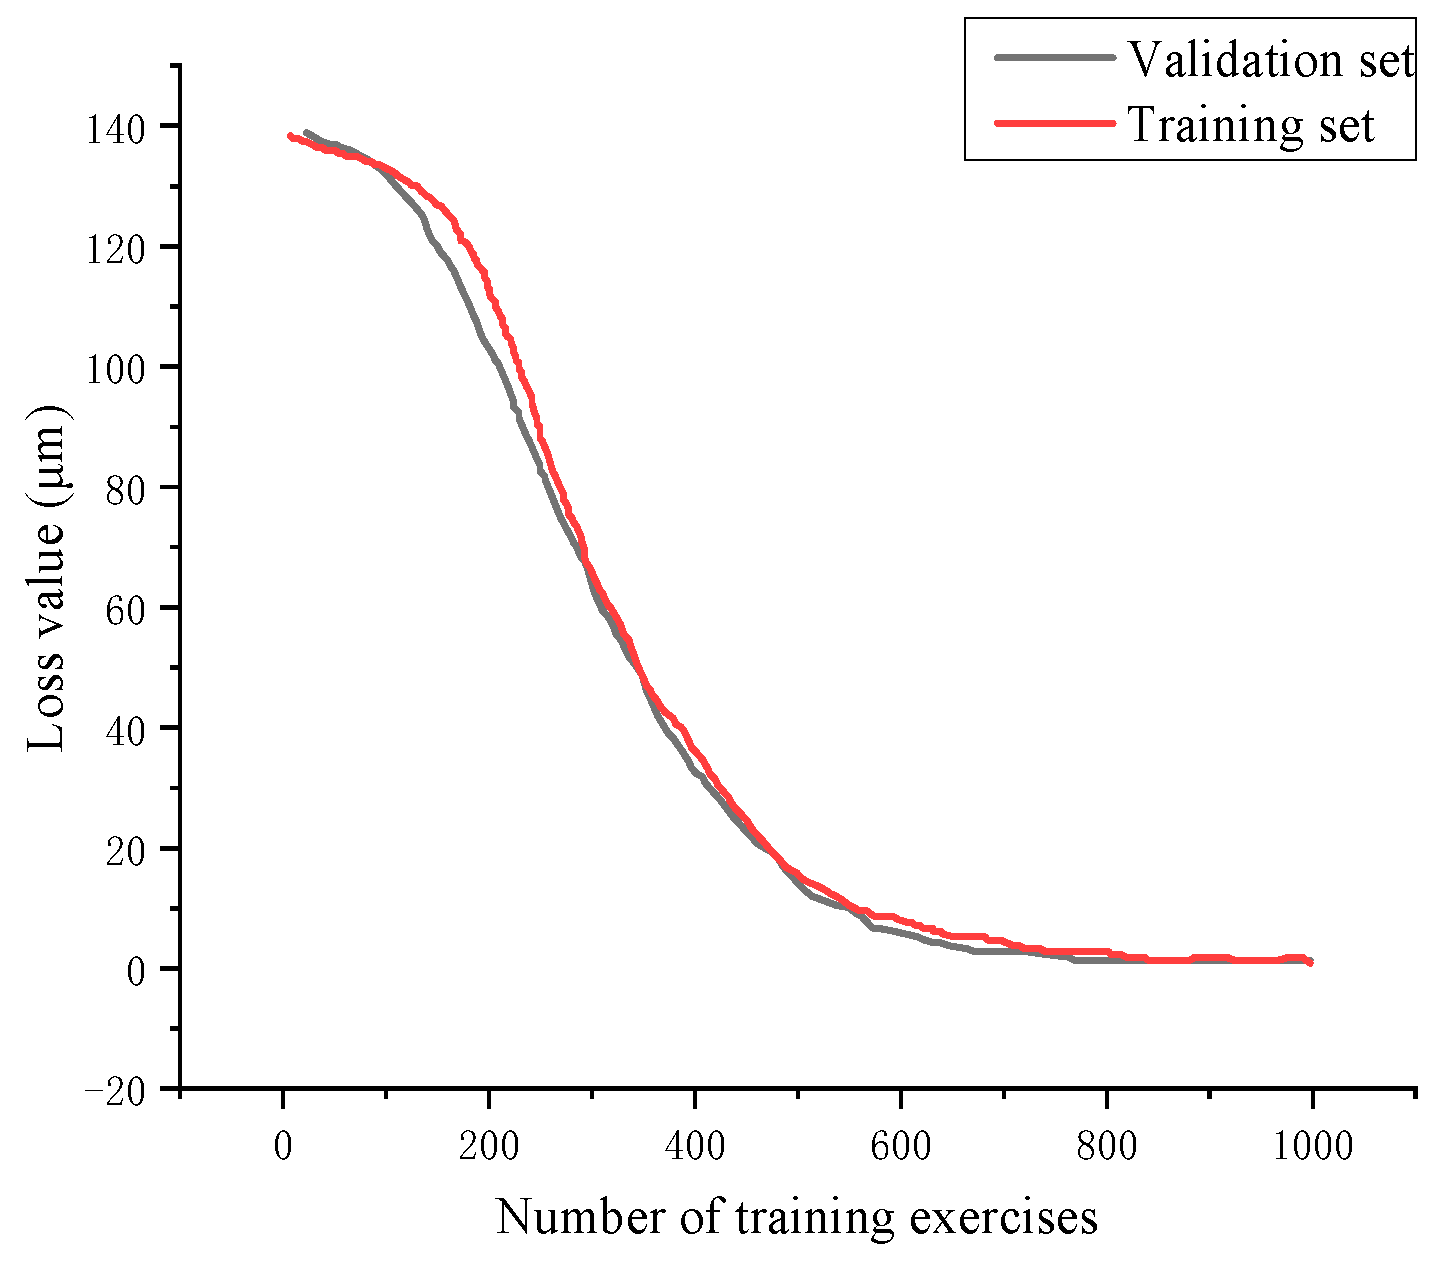
3.5.1. Tool-Remaining-Life Prediction Model Training
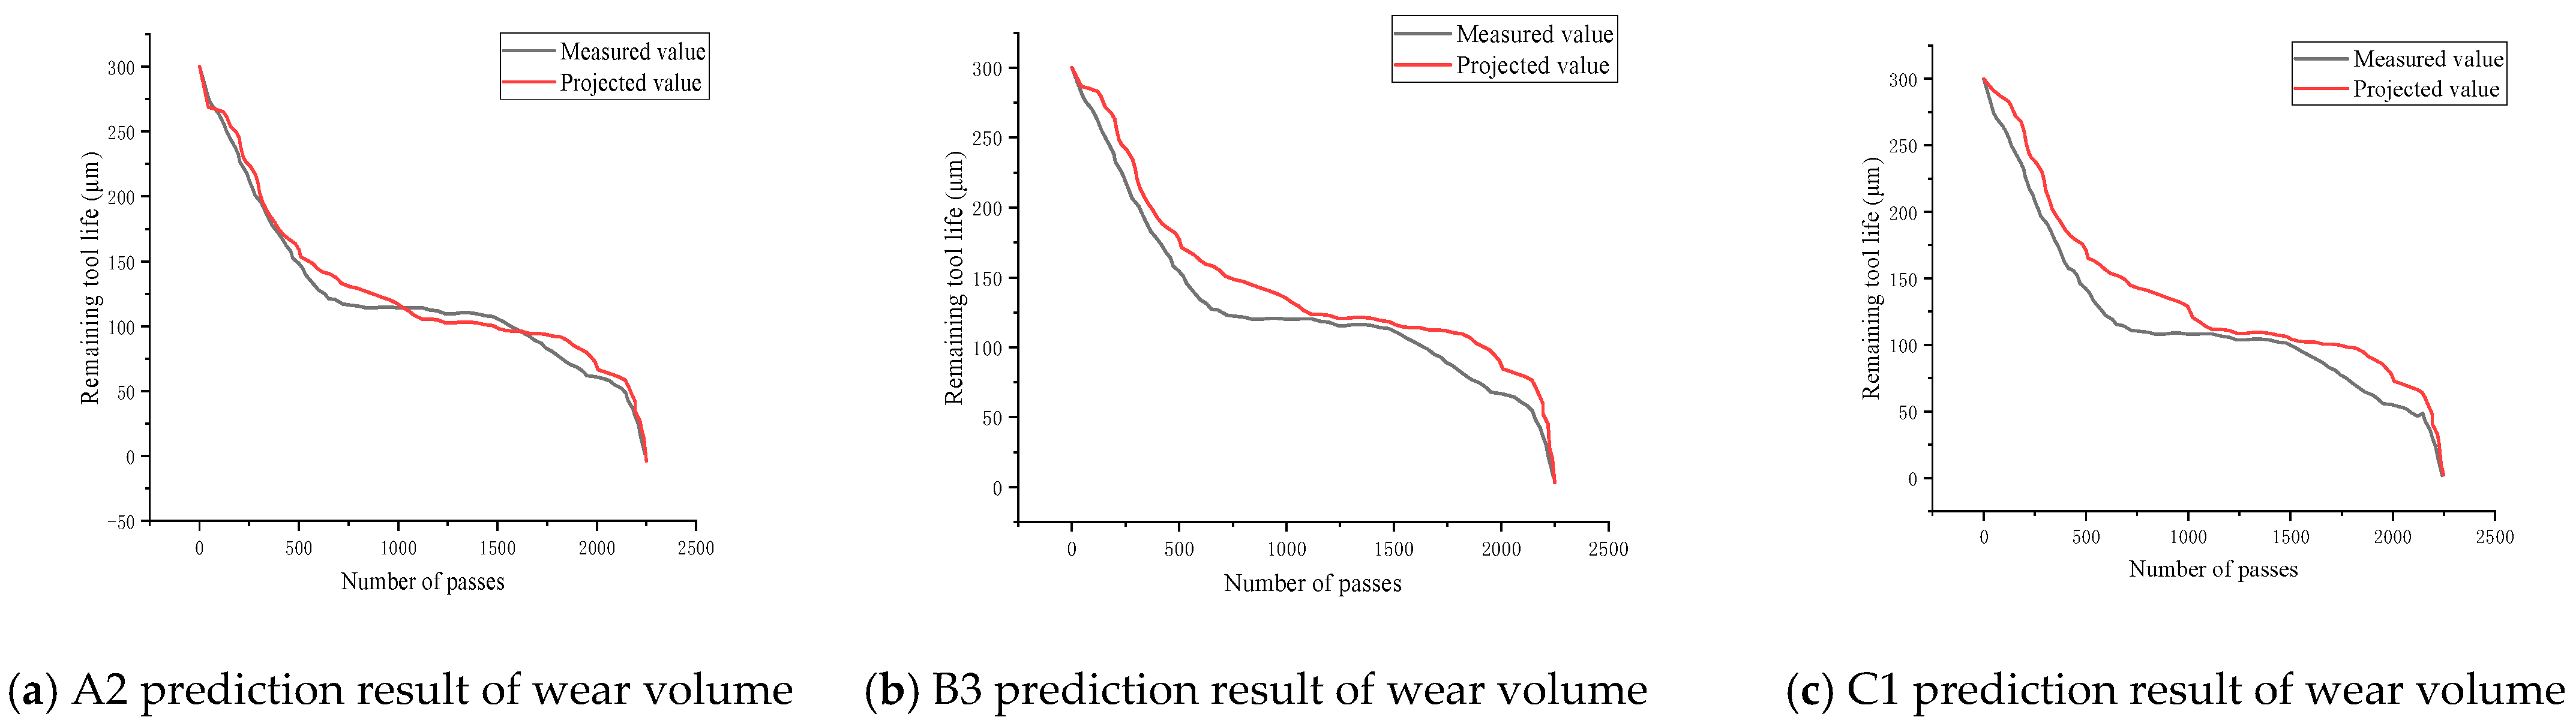
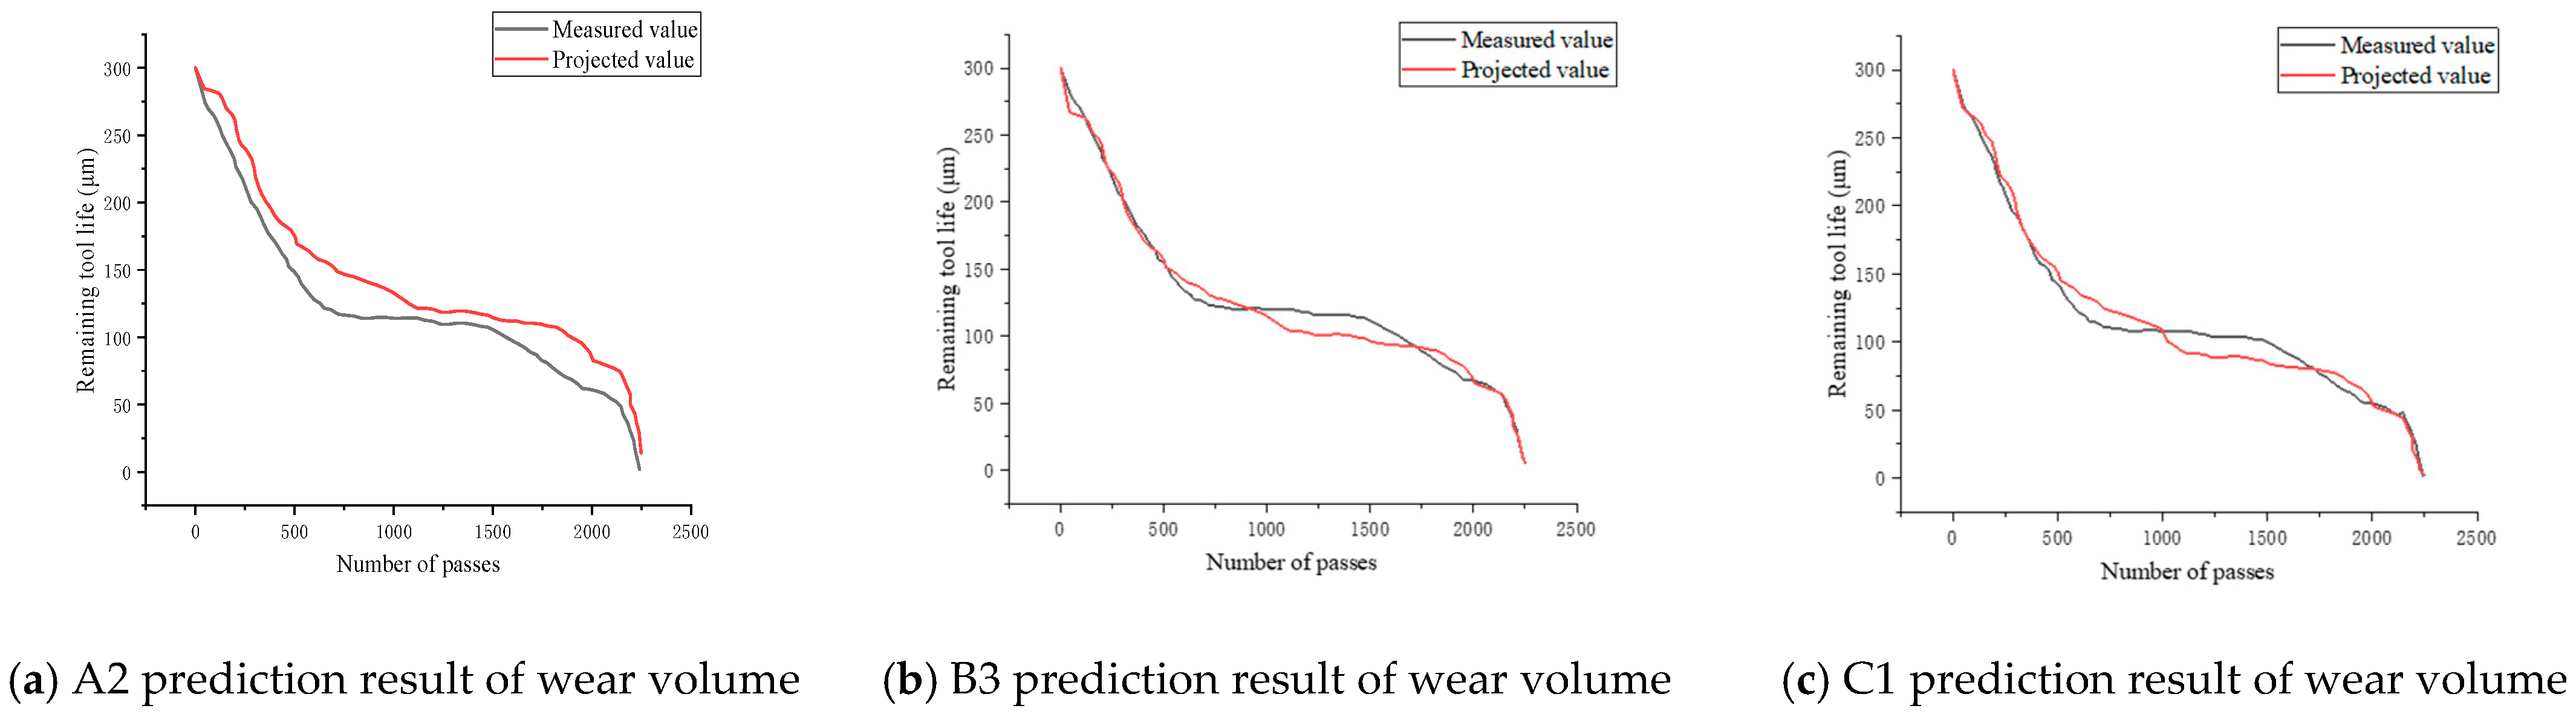
3.5.2. Tool-Remaining-Life Prediction Analysis
3.5.3. Predictive Model Comparison Test
4. Conclusions
- (1)
- Based on the experimental study of milling titanium alloy with a micro-texture ball end milling cutter, it was found that the amplitude of the milling force and vibration signals increases with tool wear as the milling distance increases.
- (2)
- The wear evolution of the micro-texture ball end milling cutter is divided into three stages: the initial wear stage, the mid-wear stage, and the late wear stage. In the initial wear stage, due to the presence of the tool’s remelted layer, micro-pit wear occurs, resulting in significant tool wear. In the intermediate wear stage, the remelted layer smooths out, increasing the contact area and reducing the surface pressure, leading to a lower tool wear rate, mainly due to crescent pits. In the late wear stage, the surface quality of the ball end milling cutter declines sharply, producing thick edge burrs, which cause a significant increase in wear. During this stage, boundary breakage, flake peeling, and micro-chipping occur, leading to the tool’s failure.
- (3)
- By building a BiLSTM–Attention tool-remaining-life prediction model and inputting feature data for training and validation, the model achieved an average absolute percentage error of 11.64%. In a comparative analysis with the Hidden Markov Model (HMM) and Convolutional Neural Network (CNN) prediction models suggested by other researchers, the BiLSTM–Attention tool was revealed to have a significantly higher accuracy (24.82%) for predicting the remaining life of micro-textured ball end milling cutters compared to both the HMM (24.82%) and CNN (18.74%) models. This finding attests to the efficacy and reliability of the proposed BiLSTM–Attention tool in this domain.
5. Research Outlook
Author Contributions
Funding
Institutional Review Board Statement
Informed Consent Statement
Data Availability Statement
Conflicts of Interest
References
- Yang, S.; Zhou, Y.C.; Zhang, Y.H.; Tong, X.; Liu, W.W. Prediction of surface roughness of titanium alloy milled by Micro-pit configuration ball-end milling cutter. J. Harbin Inst. Technol. 2017, 3, 141–146. [Google Scholar] [CrossRef]
- Hexi, J.; Kexiang, W.; Jianming, L.; Jianyu, Z.; Wenjing, P. Research progress of titanium alloy for aviation. Chin. J. Nonferrous Met. 2015, 2, 280–292. [Google Scholar] [CrossRef]
- Du, Y. Research on Tool Failure Mechanism of Titanium Alloy Milling Process. Master’s Thesis, Harbin Institute of Technology, Harbin, China, 2023. [Google Scholar]
- Lianyao, T.; Tang, L.; Li, P.; Qiu, X. A new species of the genus Lepidoptera (Lepidoptera, Lepidoptera, Lepidoptera). Research progress on cutting titanium alloys by micro-texture tools. Aerosp. Mater. Process. 2020, 4, 8–12. [Google Scholar]
- Xinmin, F.; Xin, L.; Zuo, W. Research status of micro-texture tool wear. Mech. Des. Manuf. 2023, 298–304. [Google Scholar] [CrossRef]
- Sahu, T.S.; George, A.; Kuriachen, B.; Mathew, J.; Dhanish, P.B. Experimental investigations on the wear behaviour of micro-EDM-fabricated textured tools during dry turning of Ti6Al4V. Ind. Lubr. Tribol. 2022, 74, 26–33. [Google Scholar] [CrossRef]
- Wang, X.; Popov, V.L.; Yu, Z.; Li, Y.; Xu, J.; Li, Q.; Yu, H. Evaluation of the cutting performance of mi-cro-groove-textured PCD tool on SiCp/Al composites. Ceram. Int. 2022, 48, 32389–32398. [Google Scholar] [CrossRef]
- Wang, X.; Popov, V.L.; Yu, Z.; Li, Y.; Xu, J.; Yu, H. Study on cutting performance of SiCp/Al composite using textured YG8 carbide tool. Int. J. Adv. Manuf. Technol. 2021, 119, 2213–2222. [Google Scholar] [CrossRef]
- Liang, X. Research on the influence law of tool wear state on the surface integrity of machining titanium alloy Ti-6Al-4V. Ph.D. Dissertation, Shandong University, Jinan, China, 2021. [Google Scholar]
- Colpani, A.; Fiorentino, A.; Ceretti, E.; Attanasio, A. Tool wear analysis in micromilling of titanium alloy. Precis. Eng. 2019, 57, 83–94. [Google Scholar] [CrossRef]
- Liu, Q.; Xu, J.; Yu, H. Experimental study on the influence of tool wear on the cutting process of Ti6Al4V. J. Physics Conf. Ser. 2021, 1838, 012026. [Google Scholar] [CrossRef]
- Jiang, W. Experimental Research on Machining Titanium Alloy by Circular Milling Cutter under Ultrasonic Vibration-Assisted Conditions. Master’s Thesis, Harbin Institute of Technology, Harbin, China, 2021. [Google Scholar]
- Xu, X.; Li, X.; Ming, W.; Chen, M. A novel multi-scale CNN and attention mechanism method with multi-sensor signal for remaining useful life prediction. Comput. Ind. Eng. 2022, 169, 108204. [Google Scholar] [CrossRef]
- Nie, L.; Zhang, L.; Xu, S.; Cai, W.; Yang, H. Remaining Useful Life Prediction of Milling Cutters Based on CNN-BiLSTM and Attention Mechanism. Symmetry 2022, 14, 2243. [Google Scholar] [CrossRef]
- Yang, C.; Zhou, J.; Li, E.; Zhang, H.; Wang, M.; Li, Z. Milling cutter wear prediction method under variable working conditions based on LRCN. Int. J. Adv. Manuf. Technol. 2022, 121, 2647–2661. [Google Scholar] [CrossRef]
- Lingfeng, Z.; Longxian, C.; Fujun, Z.; Anhui, K.; Dazun, L. A new genus and species of the genus Lepidoptera (Hymenoptera, Braconidae). Research on tool life prediction based on big data analysis technology. Mech. Manuf. Autom. 2022, 4, 148–151. [Google Scholar]
- Huang, Q.; Qian, C.; Li, C.; Han, Y.; Zhang, Y.; Xie, H. Tool Remaining Useful Life Prediction Method Based on Multi-Sensor Fusion under Variable Working Conditions. Machines 2022, 10, 884. [Google Scholar] [CrossRef]
- Cui, X. Research on Surface Quality of Titanium Alloy Milling by Micro-Pit Configuration Ball End Milling Cutter. Master’s Thesis, Harbin Institute of Technology, Harbin, China, 2017. [Google Scholar]
- Ko, T.; Kim, H.; Lee, S. Selection of the Machining Inclination Angle in High-Speed Ball End Milling. Int. J. Adv. Manuf. Technol. 2001, 17, 163–170. [Google Scholar] [CrossRef]


| Nominal Chemical Composition | WC | Co | TiC | TaC |
|---|---|---|---|---|
| Content (mass fraction %) | 92 | 8 | - | - |
| Nominal Chemical Composition | Ti | Al | V | Fe | C | O | N | H |
|---|---|---|---|---|---|---|---|---|
| Content (mass fraction %) | Bal. | 6.1 | 4.1 | 0.12 | 0.01 | 0.14 | 0.01 | 0.001 |
| Structure Number | Micro-Pit Diameter | Micro-Pit Depth | Micro-Pit Spacing | Distance to Cutter Edge |
|---|---|---|---|---|
| A | 50 | 25 | 130 | 110 |
| B | 50 | 20 | 120 | 110 |
| C | 50 | 30 | 110 | 110 |
| Laser Repetition Frequency | 20 KHz~100 KHz | Marking speed | Maximum 7000 mm/s |
| Laser wavelength | 1064 nm | Positioning accuracy | 0.002 mm |
| Repeatability | 0.002 mm | Rated power | 50 W |
| Traveling distance (mm) | 10,500 | 31,500 | 52,500 | 73,500 | 84,000 |
| Cutting Edge Wear Chart | 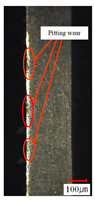 | 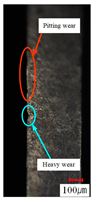 | 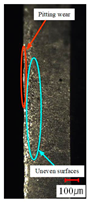 | 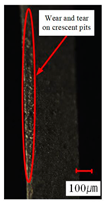 | 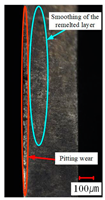 |
| VB value (μm) | 70.8 | 93.7 | 106.7 | 118.4 | 124.3 |
| Traveling distance (mm) | 105,000 | 115,500 | 136,500 | 147,000 | 157,500 |
| Cutting Edge Wear Chart | 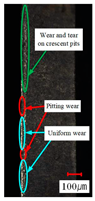 |  | 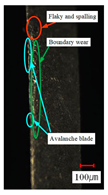 |  | 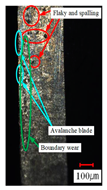 |
| VB value (μm) | 134.3 | 140.1 | 160.1 | 193.3 | 330.1 |
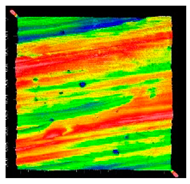 | 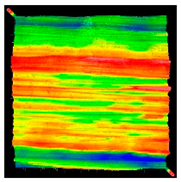 | 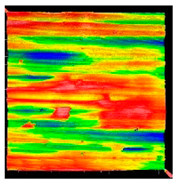 |
| (a) Initial wear stage Ra = 0.204 | (b) Intermediate wear stage Ra = 0.164 | (c) Later wear stage Ra = 0.364 |
| Evaluation Indicators | Meaning | Action |
|---|---|---|
| MSE | Mean square error | Model prediction error |
| MAPE | Mean absolute percent error | Model prediction accuracy |
| Evaluation Criteria | HMM | CNN | BiLSTM–Attention |
|---|---|---|---|
| MSE | 463.72 | 302.58 | 67.27 |
| MAPE | 24.82% | 18.74% | 11.64% |
Disclaimer/Publisher’s Note: The statements, opinions and data contained in all publications are solely those of the individual author(s) and contributor(s) and not of MDPI and/or the editor(s). MDPI and/or the editor(s) disclaim responsibility for any injury to people or property resulting from any ideas, methods, instructions or products referred to in the content. |
© 2024 by the authors. Licensee MDPI, Basel, Switzerland. This article is an open access article distributed under the terms and conditions of the Creative Commons Attribution (CC BY) license (https://creativecommons.org/licenses/by/4.0/).
Share and Cite
Zhang, Y.; Fu, Y.; Li, Q.; Zhang, K.; Liu, K. Study on the Cutting Performance and Remaining Life Prediction of Micro-Texture Ball End Milling Cutters for Titanium Alloys. Coatings 2024, 14, 814. https://doi.org/10.3390/coatings14070814
Zhang Y, Fu Y, Li Q, Zhang K, Liu K. Study on the Cutting Performance and Remaining Life Prediction of Micro-Texture Ball End Milling Cutters for Titanium Alloys. Coatings. 2024; 14(7):814. https://doi.org/10.3390/coatings14070814
Chicago/Turabian StyleZhang, Yuhua, Yongqi Fu, Quanxi Li, Keyi Zhang, and Kuo Liu. 2024. "Study on the Cutting Performance and Remaining Life Prediction of Micro-Texture Ball End Milling Cutters for Titanium Alloys" Coatings 14, no. 7: 814. https://doi.org/10.3390/coatings14070814