Article

Effect of Temperature on the Structure and Tribological Properties of Ti, TiN and Ti/TiN Coatings Deposited by Cathodic Arc PVD

by
Carolina Ortega-Portilla
1,
Andrea Giraldo
2,
Jorge Andrés Cardona
2,
Alexander Ruden
2,
Guillermo César Mondragón
1,
Juan Pablo Trujillo
2,
Arturo Gómez Ortega
1,
Juan Manuel González-Carmona
1,* and
Edgar Adrián Franco Urquiza
1
1
CONAHCYT—Centro de Ingeniería y Desarrollo Industrial, CIDESI, Avenida Pie de la Cuesta 702, Querétaro 76125, Mexico
2
Grupo de Investigación: Ingeniería Biomédica y Ciencias Forenses, Universidad Tecnológica de Pereira, La Julita, Pereira 660003, Colombia
*
Author to whom correspondence should be addressed.
Coatings 2024, 14(7), 823; https://doi.org/10.3390/coatings14070823
Submission received: 30 May 2024 / Revised: 27 June 2024 / Accepted: 29 June 2024 / Published: 2 July 2024
(This article belongs to the Special Issue Surface Engineering, Coatings and Tribology)

Abstract

:
Monolayers of Ti and TiN coatings, as well as a Ti/TiN bilayer coating, were deposited on AISI M2 steel substrates using the PVD cathodic arc technique. The coatings had a thickness close to 5 μm and an average roughness between 98.6 and 110.1 μm due to the presence of microdroplets on the surface. The crystalline structure of the materials was analyzed using Grazing Incidence X-ray Diffraction (GIXRD) with an increase in temperature to study the dynamics of oxide formation. A phase composition study was conducted using the Rietveld refinement method. At the temperatures where critical growth of titanium oxides, both anatase and rutile, was observed, pin-on-disk tests were performed to study the tribological properties of the materials at high temperatures. It was determined that the oxidation temperature of Ti is around 450 °C, promoting the formation of a combination of anatase and rutile. However, the formation of rutile inhibits the formation of anatase, which is stable above 600 °C. In contrast, TiN showed an oxidation temperature of 550 °C, with an exclusive growth of the rutile phase. The Ti/TiN bilayer exhibited mixed behavior, with the initial growth of anatase promoted by Ti, followed by the formation of rutile. Oxidation and tribo-oxidation dominated the wear behavior of the surfaces, showing a transition from mechanisms related to abrasion at low and medium temperatures to a combination of abrasion and adhesion mechanisms at high temperatures (800 °C).

1. Introduction

M2 steel is highly relevant in industrial applications involving high contact loads, such as drill bits, taps, milling cutters, reamers, and thread rolling dies, among others [1]. Its exceptional toughness makes it a valuable material for manufacturing cutting tools. However, the use of bare M2 steel in tools poses the risk of damage when in contact with surfaces at high speed, leading to increased temperatures and accelerated oxidation kinetics. These processes result in a higher corrosion rate and the formation of oxides [2].
To improve the durability and performance of M2 steel, the application of hard coatings as protective layers has been applied. These coatings alter the surface properties of the underlying material, creating chemical inertness on the surface, which increases hardness and reduces wear rates [3]. Among the techniques used to achieve this objective, Plasma-Assisted Physical Vapor Deposition (PAPVD) stands out. This method is notable for the surface uniformity it produces and the superior mechanical, thermal, and chemical properties it imparts on the material, serving as a protective barrier against corrosion [4]. The industry has employed various transition metal ceramic thin films to coat industrial tools and components, such as TiN, ZrN, and CrN monolayers, as well as TiN/ZrN bilayers [5,6,7,8]. These coatings are known for their high resistance to oxidation and corrosion, high hardness, and strong wear resistance, making them essential in the surface treatment of cutting tools, injection and extrusion molds, and metal forming tools [9].
At high temperatures, the most critical characteristics of these coatings are oxidation resistance, friction reduction, and thermal shock resistance. These properties depend on the crystalline structure and morphology of the material [10,11,12]. Through diffraction, phenomena such as “peak drift” can be observed, which occurs in a specific crystalline plane and is manifested in the diffraction pattern, which is useful for microcrack analysis [13,14]. Therefore, it is essential to further understand the mechanisms that govern oxidation processes, the evolution of the crystalline structure as a function of temperature, and the dynamic wear resistance concerning temperature to predict the lifetime of these hard coating materials when they are in sliding contact at high contact pressures.
This investigation focuses on the synthesis of titanium (Ti), titanium nitride (TiN) thin monolayers, and a Ti/TiN bilayer as surface treatments applied to M2 tool steel, deposited using the cathodic arc PVD technique. A detailed analysis of the evolution of the crystalline structure as a function of temperature was performed, and the tribological behavior under simulated extreme contact conditions was studied at temperatures where changes associated with the material’s chemical composition were observed.

2. Materials and Methods

Titanium (Ti), titanium nitride (TiN) coatings, and the Ti/TiN bilayer were deposited on M2 steel (Φ: 2 cm, t: 5 mm) and Si substrates using the cathodic arc PVD technique. In Table 1, the chemical composition of M2 steel is observed, under the ASTM A600-92a [15] standard. Si substrates were used exclusively to determine the crystalline structure at RT and high temperature. The homogeneous oxidation of silicon is well understood, and it does not introduce noise into the analysis.
Prior to deposition, the substrates were prepared by grinding with SiC paper and then polished to a specular finish using a 0.1 μm alumina solution. The substrates were subsequently cleaned ultrasonically in isopropyl alcohol for 15 min. The cleaned samples were mounted on a substrate holder with 3-axis rotation in an Oerlikon Domino Mini PVD system (Oerlikon, Pfäffikon-Switzerland), and a vacuum of 4 × 10⁻⁵ mbar was achieved. Plasma cleaning was conducted for 20 min using the Arc Enhanced Glow Discharge (AEGD) technique with a current of 80 A in the shielded Ti target (99.995%), an anode current of 85 A, a pulsed bias voltage of −250 V (80% active time, 20 Hz), in an Ar (278 sccm) atmosphere at a pressure of 1 × 10⁻² mbar and a temperature of 350 °C.
For the deposition of Ti and TiN coatings, as well as the Ti/TiN bilayer, Ti targets (99.999%) with a diameter of 100 mm were used. The deposition was carried out in an atmosphere of Ar (278 sccm) and N2 (500 sccm) at a pressure of 1 × 10⁻² mbar and a temperature of 350 °C. The cathode current was maintained at 135 A, and a bias voltage of −150 V was applied. Grazing incidence X-ray diffraction (GIXRD) patterns were obtained using a SmartLab Rigaku system (Rigaku, Tokyo-Japan) with a CuKα source (λ = 1.5406 Å). Measurements were taken in a 2θ range of 20° to 80° at a speed of 3°/min and a step size of 0.02°. These analyses were performed at room temperature (~25 °C) and at intervals of 100 °C up to 400 °C, then at 50 °C intervals up to 900 °C, using a heating rate of 10 °C/min and holding for 15 min at each temperature. Phase percentages, microdeformations, and crystallite sizes were calculated using the Rietveld refinement method with PDXL 2.7 software from Rigaku [16]. The microdeformations and crystallite size are obtained from the FWHM of the peaks of the diffraction pattern, using the Debye–Scherrer equation and the conventional Williamson–Hall method. In this way, microdeformations are interpreted as the deviation from the ideal geometry of the crystal lattice and the crystallite size as the coherent diffraction area or the average size of the crystallographic domain [16].
Coating thickness was measured using scanning electron microscopy (SEM) on a JEOL JSM-6460 device (JEOL, Akishima, Tokio-Japan) equipped with an Oxford INCA—Energy EDS System energy-dispersive spectroscopy (EDS). Cross-section profiles were prepared in the cylindrical specimen and five thickness measurements were taken. Roughness measurements were performed using a contact profilometer (Dektak Bruker) (Billerica, MA-USA), obtaining five profiles of 4 mm in different zones of the coatings.
Friction and wear tests were conducted using an Anton Paar THT-1000 pin-on-disc tribometer (Anton Paar, Graz-Austria) (see Figure 1), following the ASTM G99 standard [17], at room temperature (RT, ~25 °C), 400 °C, 600 °C, and 800 °C. These temperatures were chosen according to the X-ray diffraction tests and to the oxidation states of the materials, RT as a point of comparison, 400 °C before oxidation, 600 °C onset of oxidation, and 800 °C generalized oxidation of the surface. A heating rate of 10 °C/min and a holding time of 15 min were applied. An Al2O3 counterpart (Φ: 6 mm) was used to ensure non-reactive surface interactions. Tests were conducted over a distance of 100 m, at a speed of 200 rpm, and with a normal load of 2 N. This distance, speed, and load were used to obtain steady-state friction coefficients, simulating cutting events with Hertzian contact stresses above 1 GPa, Finally, elemental chemical mapping of the wear tracks was performed using EDS at the different test temperatures. The wear coefficient was obtained from the Archard model:
k = V/Ld,
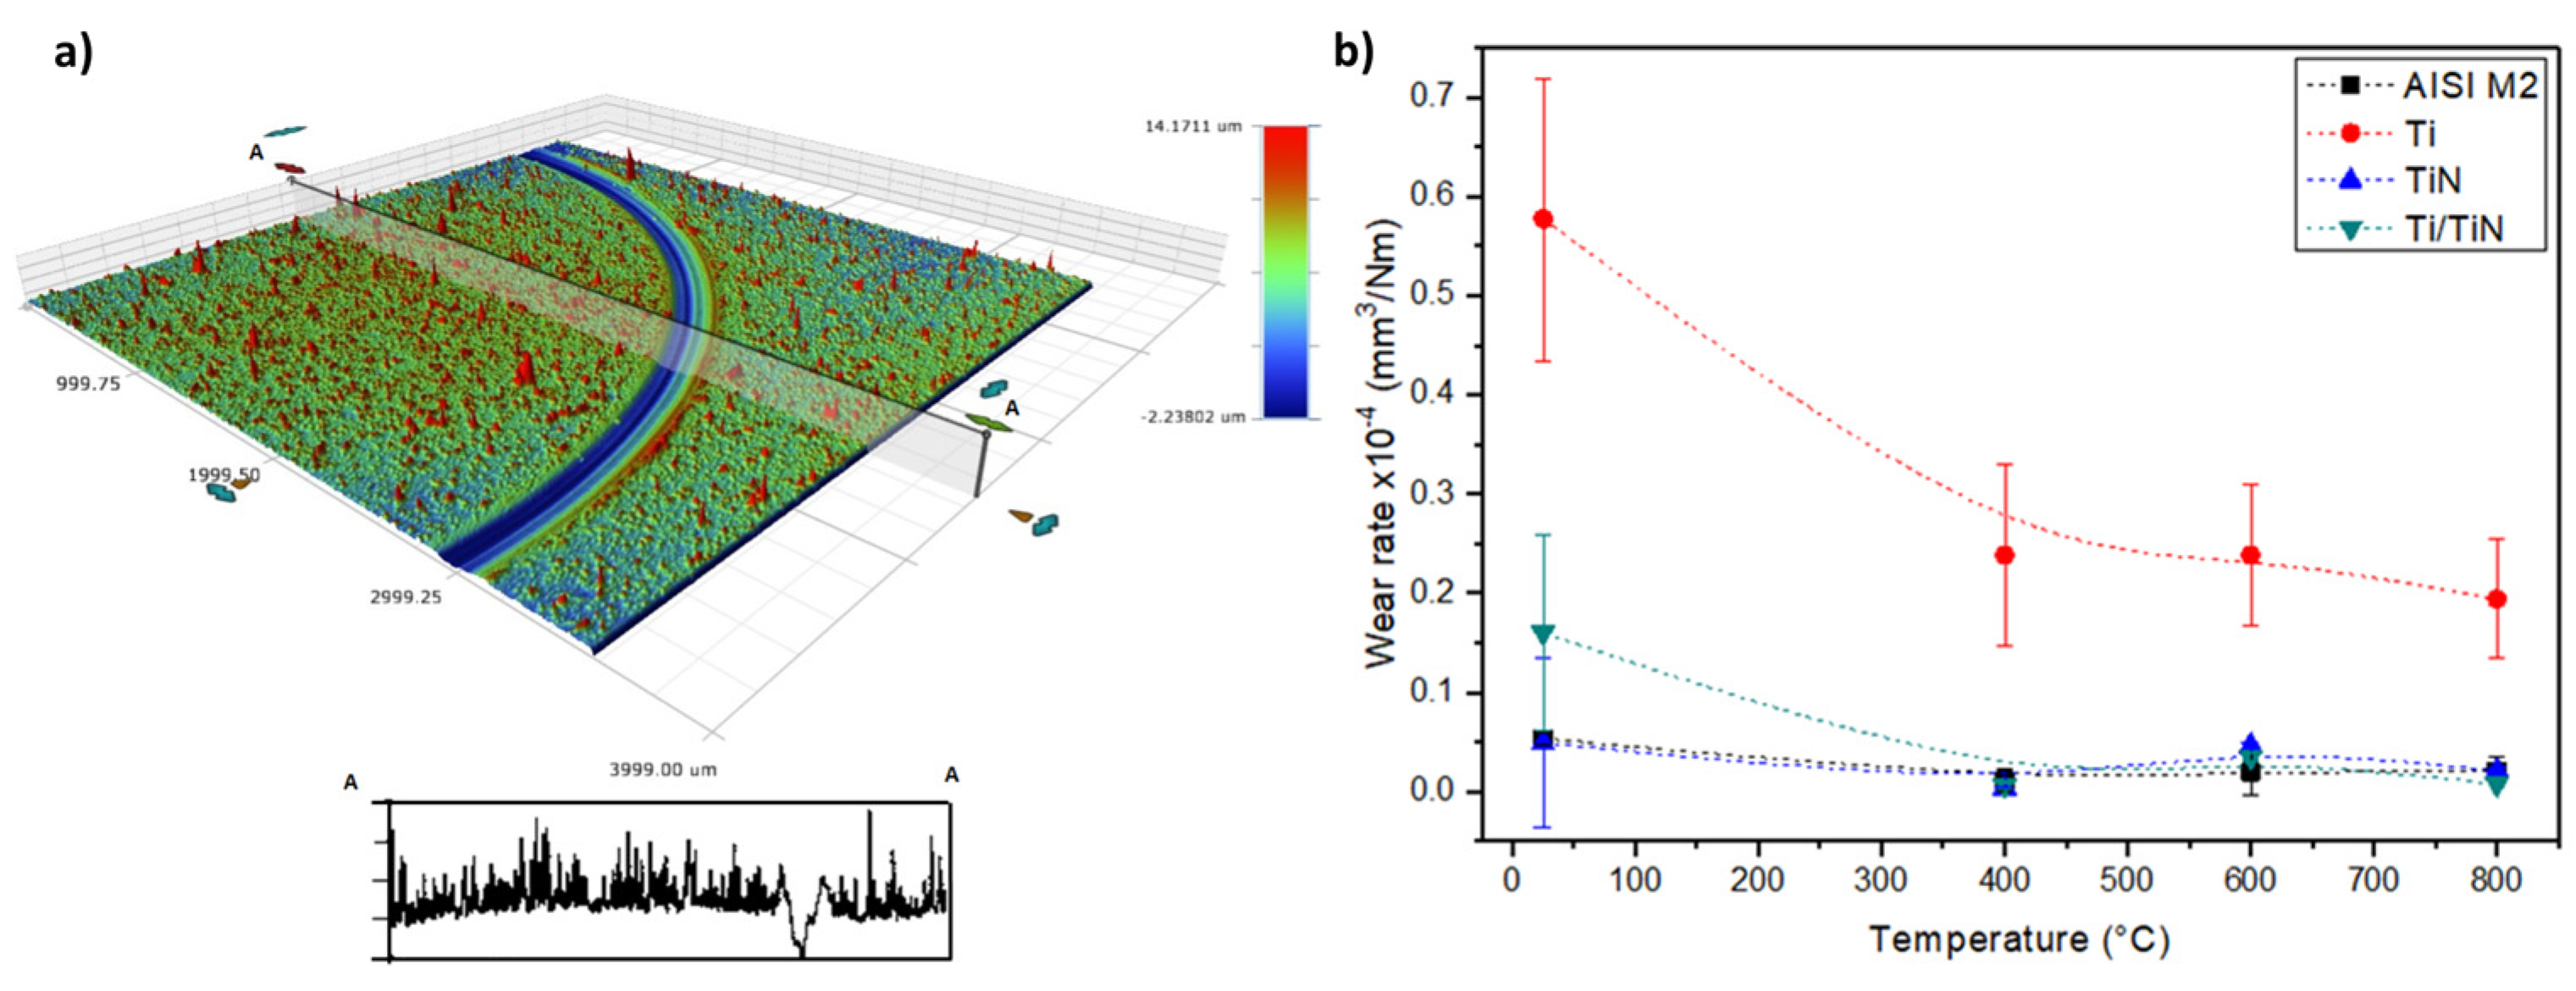
where k is the wear coefficient in [mm3/Nm], V is the wear volume, L is the load, and d is the wear distance. The wear volume is calculated from wear track profiles taken by contact profilometry. With these profiles, first, the worn area is calculated and then multiplied by 2πR, where R is the radius of the pin-on-disk test (3.5 mm).

3. Results and Discussion

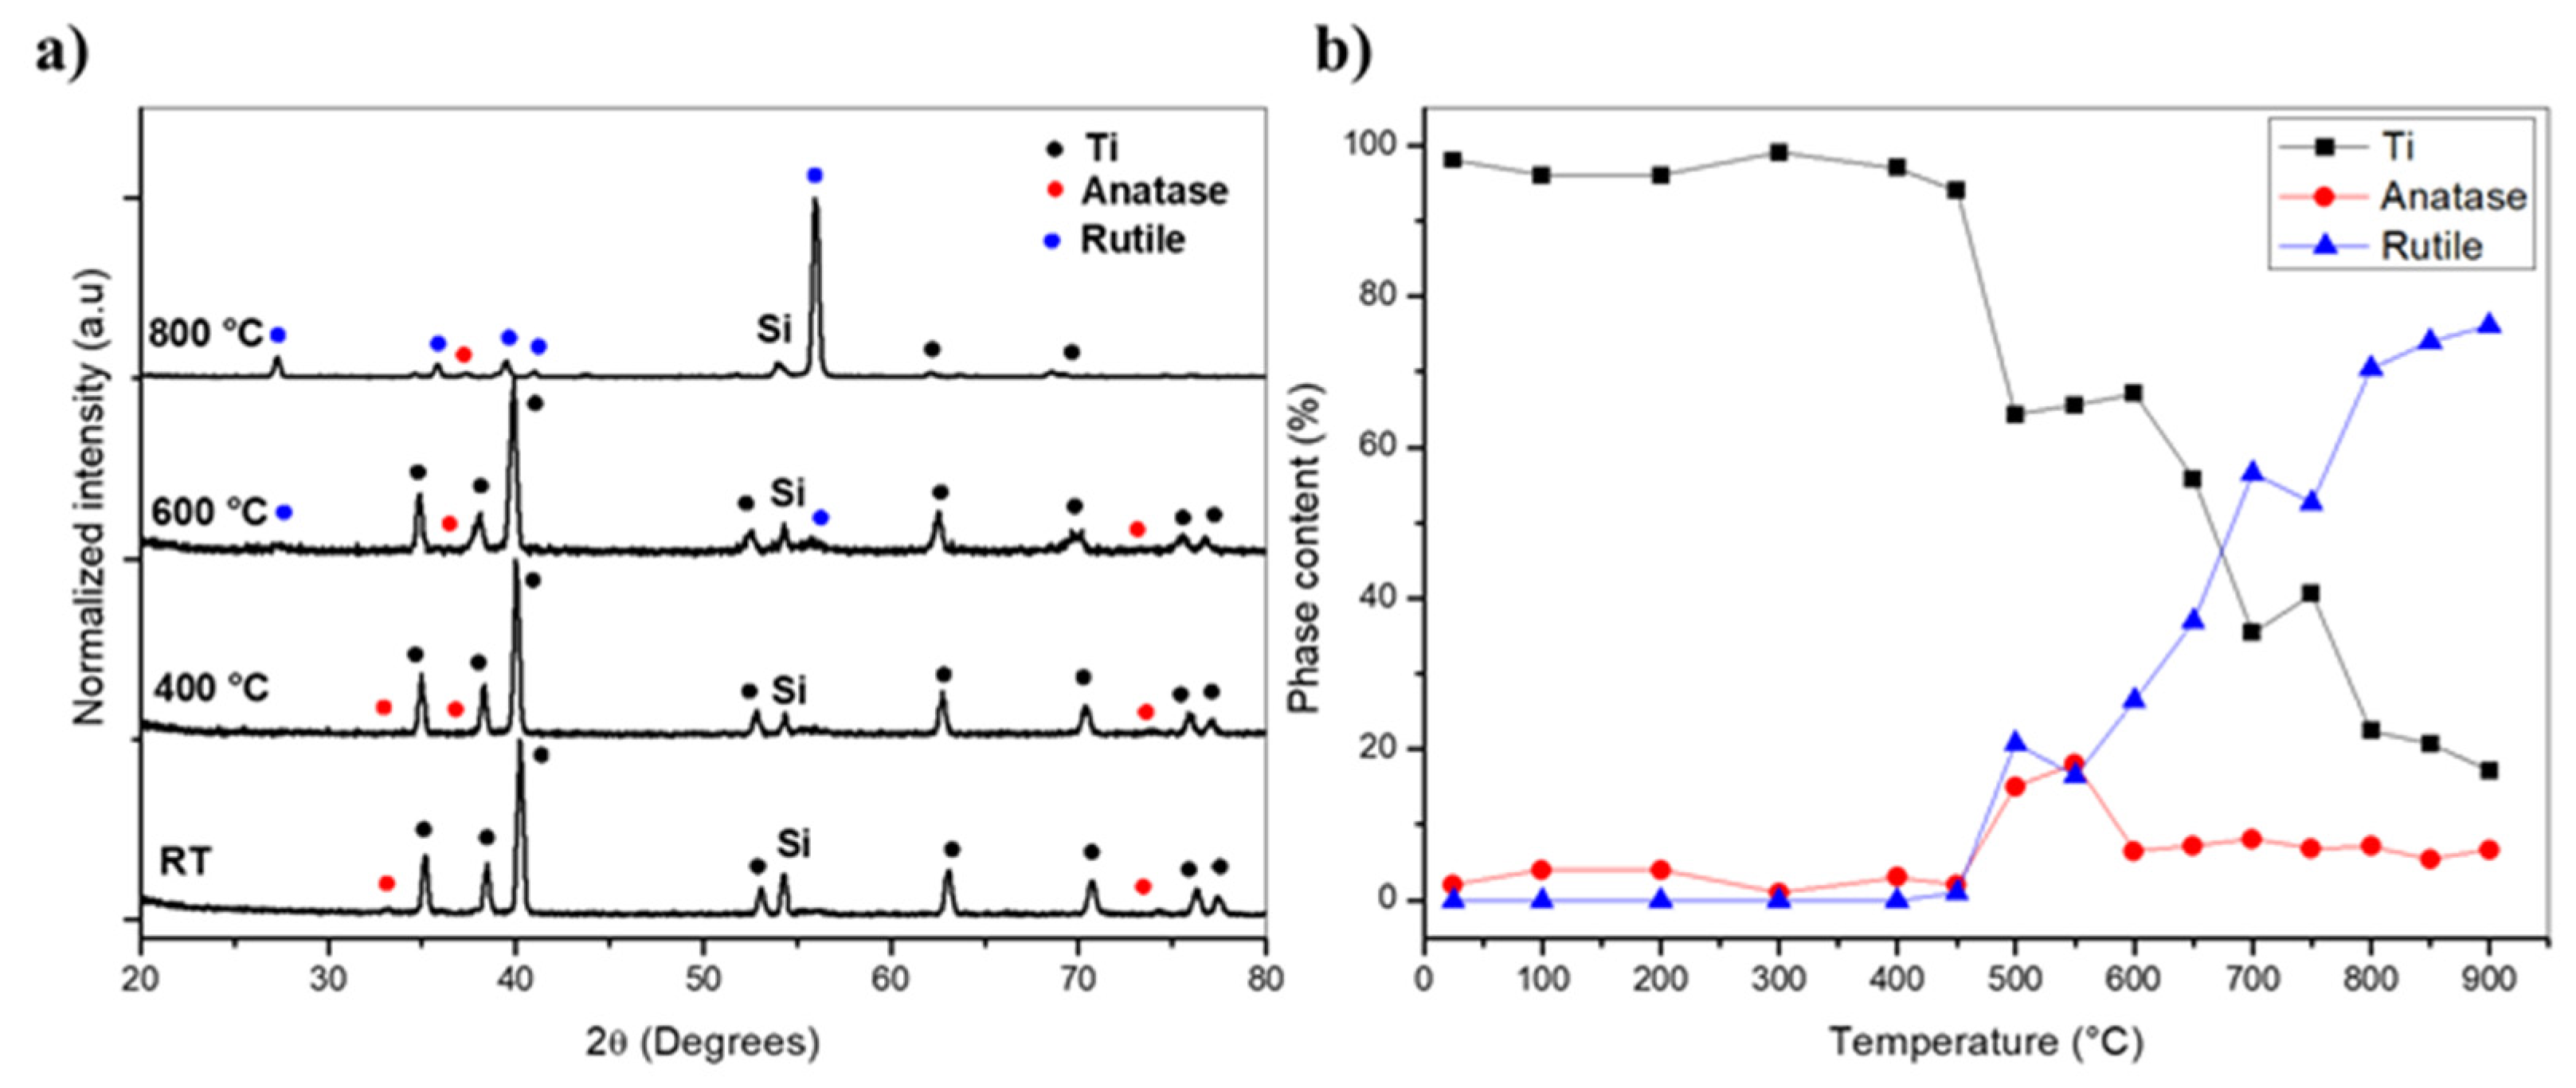
Figure 2a presents the in situ diffraction patterns of the Ti coatings. Characteristic peaks are observed at 2θ angles of 35°, 38°, 54°, 64°, 71°, 76°, and 77°, corresponding to the hexagonal close-packed (HCP) crystal structure of titanium [16,18] and to the Si peak at 55°, corresponding to the substrate. As temperature increases, there is a noticeable decrease in peak intensity, indicating oxidation. This oxidation leads to the formation of two titanium oxide phases: rutile and anatase, each with a tetragonal crystal structure, differing in their atomic packing (2 and 4 atoms per unit cell, respectively) [19,20]. Titanium’s high reactivity, stemming from its incomplete outer electron shell, allows for the formation of multiple compounds via substitution reactions [21,22]. At 800 °C, titanium is nearly completely transformed into oxide, with Ti’s presence becoming imperceptible.
Figure 2b illustrates the evolution of crystalline phase content from the HCP structure of titanium-to-titanium oxides (rutile and anatase) with increasing temperature. According to Rietveld analysis, titanium remains stable up to approximately 450 °C, with negligible oxide percentages at this temperature, consistent with previous reports [23]. Oxidation begins in the tetragonal phase of titanium oxides as temperatures exceed 450 °C, with rutile predominating due to its greater thermodynamic stability compared to metastable anatase. Anatase can undergo irreversible phase transitions depending on thermodynamic variables such as temperature and pressure, due to non-equilibrium transformations in intermediate states [24]. Between 450 °C and 800 °C, rutile becomes the predominant phase on the surface, favored by its considerably negative free energy of formation compared to anatase. Transformation of anatase to rutile occurs around 450 °C [25], and rutile growth at the expense of the titanium layer is observed, with the amount of anatase remaining relatively constant above 600 °C.
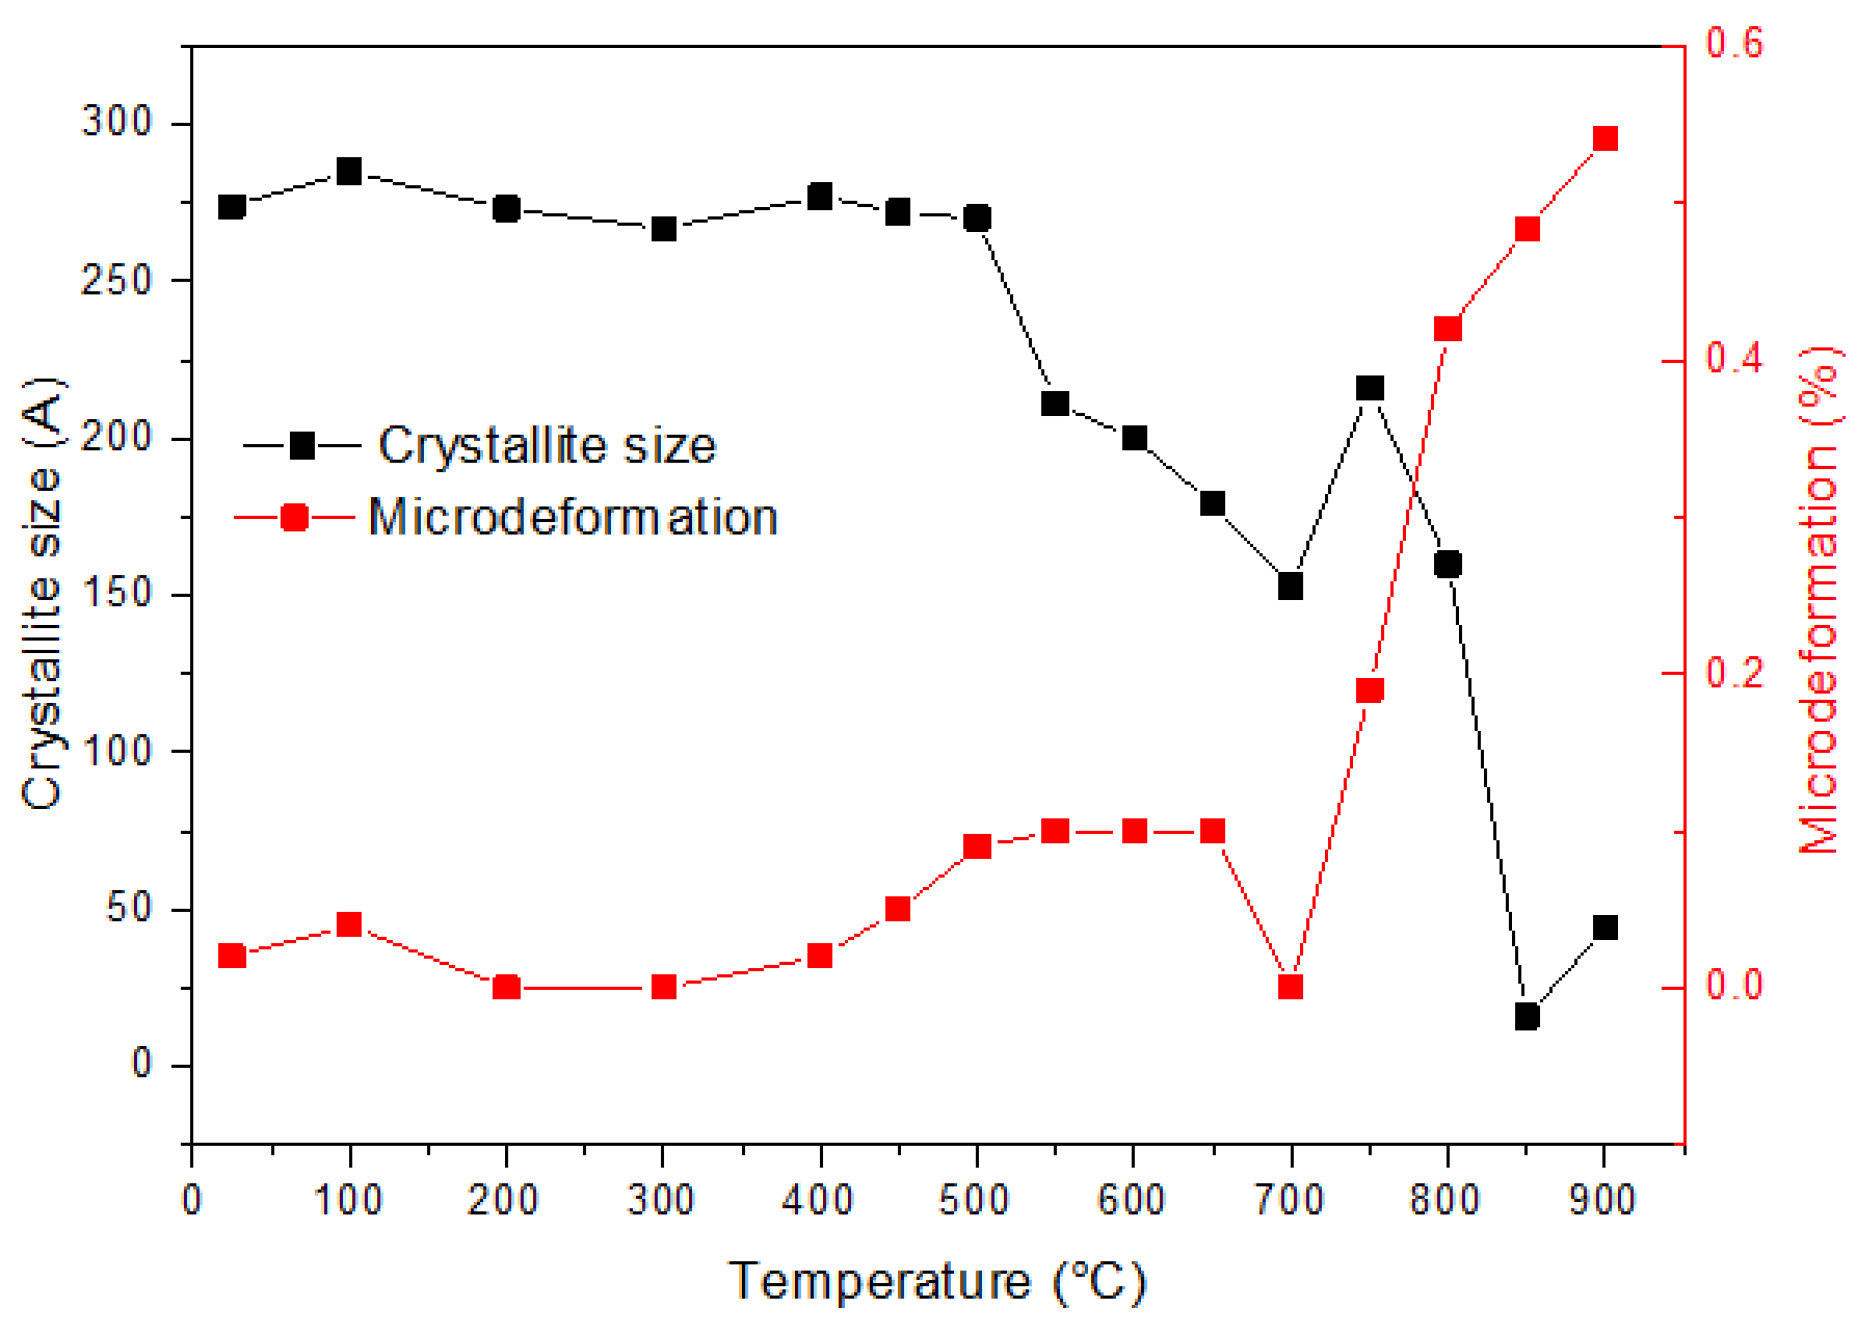
The crystallite size and microdeformations in the Ti coatings are analyzed in Figure 3. Both parameters show no significant effects in the temperature range from RT to 400 °C, with values remaining approximately 270 nm and 40%, respectively. Above 400 °C, notable changes occur in both parameters, attributed to modifications in the Full Width Half Maximum (FWHM) of the Ti diffraction peaks with increasing temperature. Oxygen diffusion processes and increased atom mobility drive these changes, consistent with the phase percentages previously analyzed between titanium and rutile. In this context, titanium undergoes a transformation toward the anatase and rutile phases, where substitutional oxygen deforms the titanium structure, resulting in increased microdeformation [26]. Additionally, the crystallite size increases with temperature, indicating the coalescence of rutile aggregates on the surface [24].
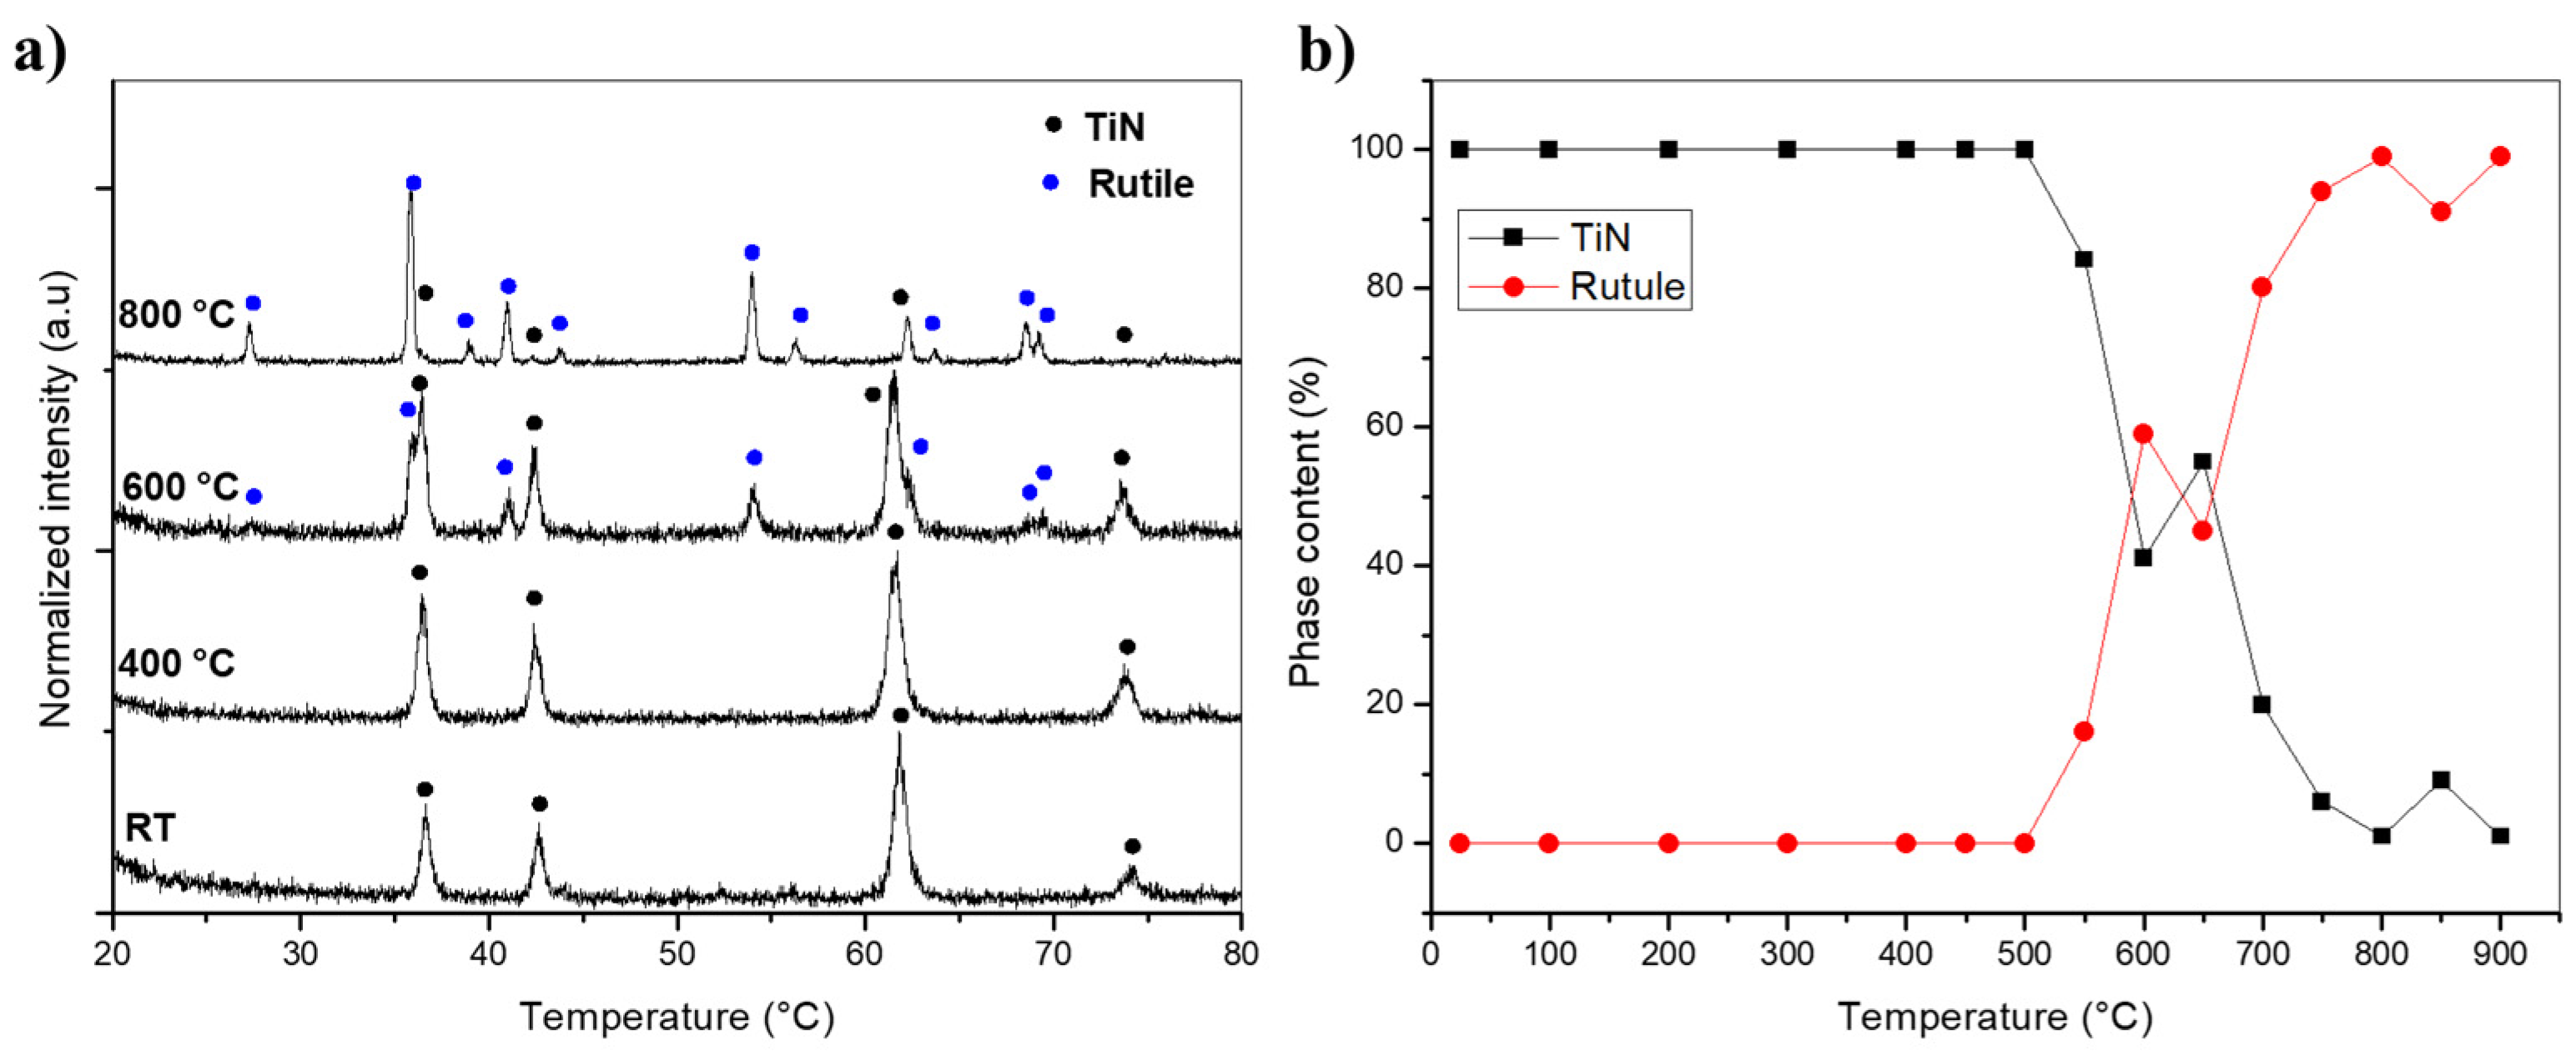
Figure 4a presents the diffraction patterns of TiN at varying temperatures. At room temperature, characteristic peaks of the TiN ceramic coating are observed at 2θ angles of 36°, 44°, 62°, and 74°, typical for coatings deposited via physical vapor deposition (PVD) techniques [27]. The material exhibits a face-centered cubic structure (FCC), belonging to the space group fm-3m, which imparts exceptional tribological and mechanical properties [28,29]. The crystalline structure remains stable until 600 °C, with rutile peaks appearing at higher temperatures. Unlike titanium, where oxide phases compete during oxidation, the metastable anatase phase does not appear, transforming directly into rutile as the material reaches equilibrium [30,31]. This behavior is consistent with findings from previous studies that describe the formation of oxides and oxynitrides depending on oxygen potential [30,32,33]. High oxygen potentials and sufficient holding times can prevent the formation of anatase during oxidation.
Figure 4b shows the Rietveld refinement analysis. TiN remains stable up to approximately 550 °C, after which titanium oxide begins to form due to reaction with oxygen. The amount of rutile phase increases linearly with temperature at the expense of TiN. As observed from the GIXRD, the TiN coating remains stable until reaching approximately 550 °C. However, at higher temperatures, titanium oxide begins to form due to the reaction of titanium with oxygen in the environment. It is notable that the amount of rutile phase increases semi-linearly with temperature at the expense of the TiN.
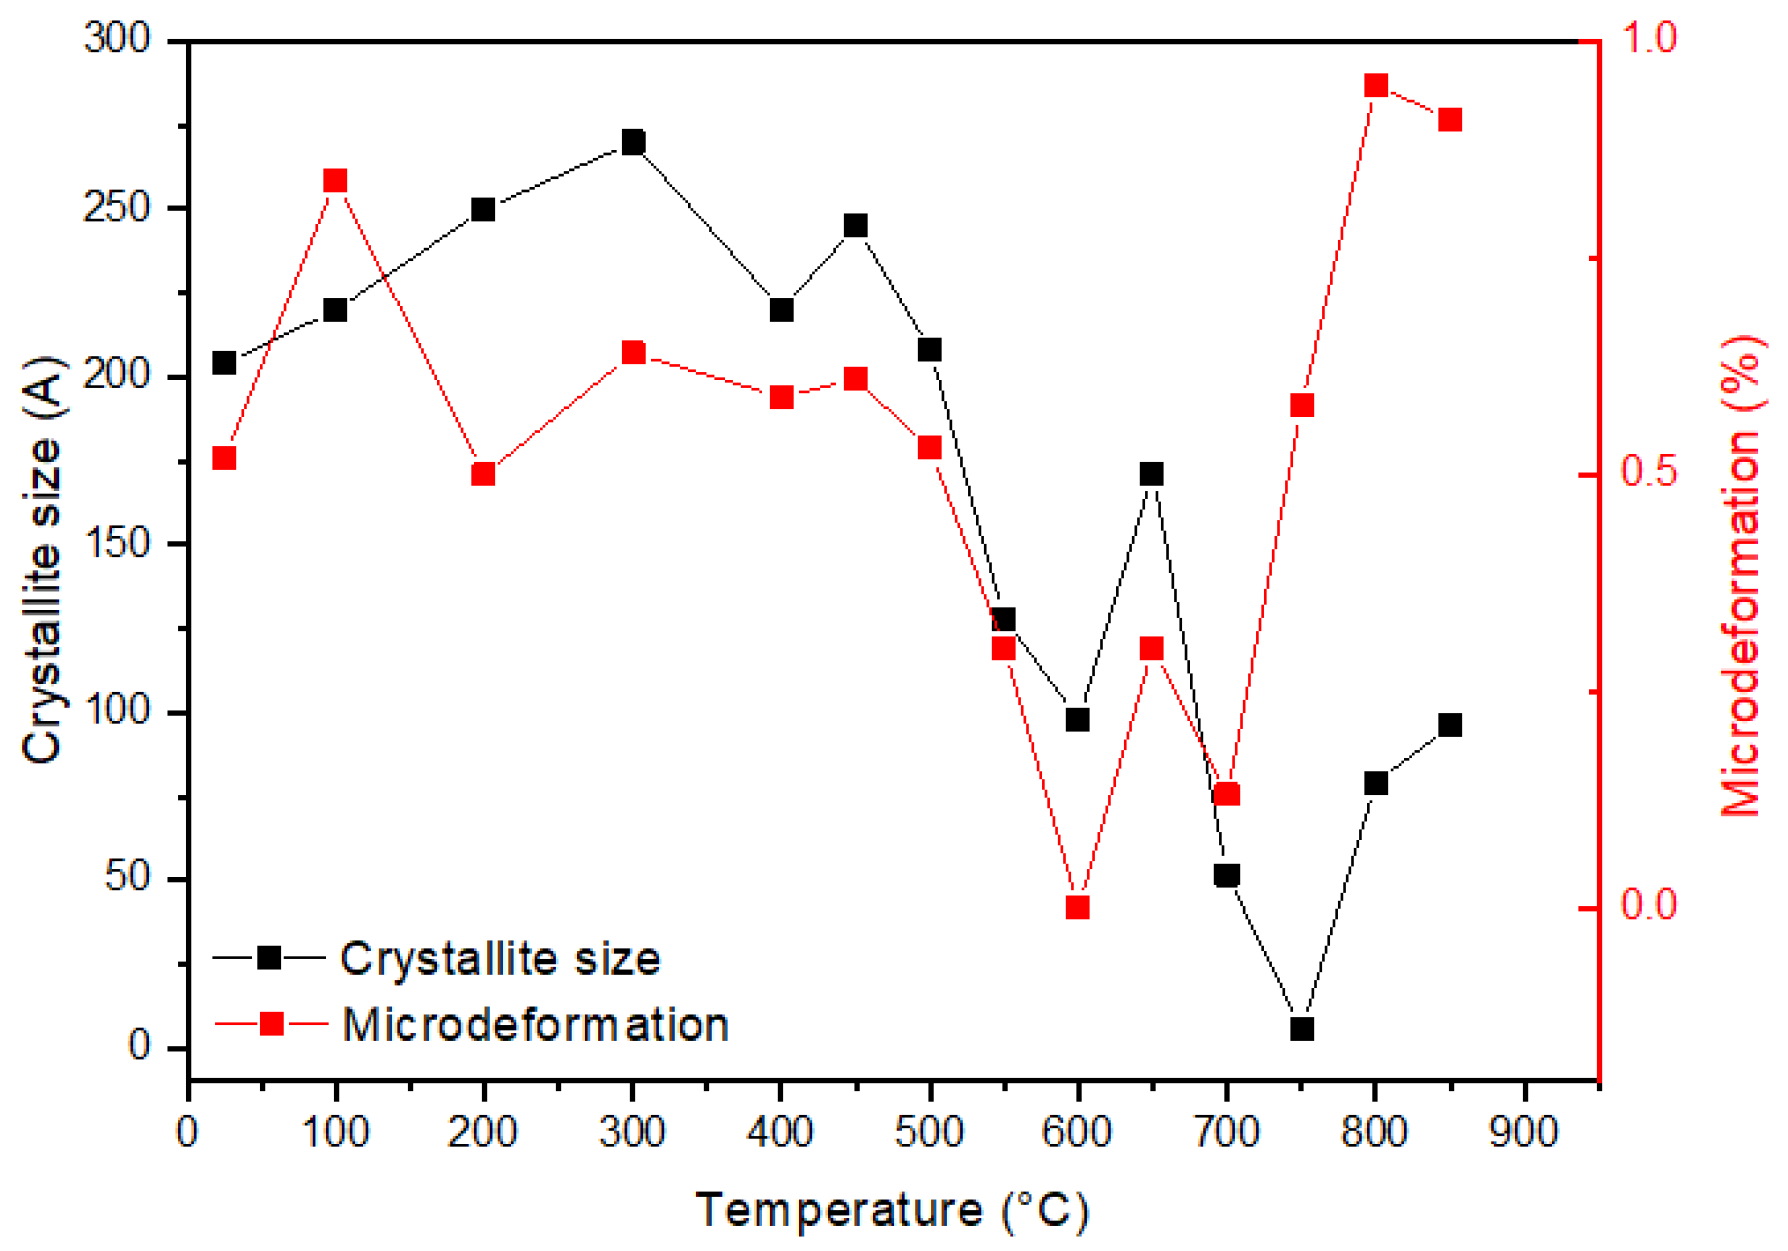
Figure 5 shows the calculations performed for the crystallite size and the microdeformations present in the TiN coating. At low temperatures (<300 °C), the crystallite size tends to grow. This indicates the coalescence of TiN islands with increasing temperature. However, at higher temperatures, a reduction in crystallite size was observed. This decrease becomes critical when the growth of the oxide phase begins (between 550 and 600 °C). On the other hand, the microdeformations remain relatively constant until the appearance of the oxide, where a reduction attributed to the increase in the FWHM is observed and a subsequent increase where the presence of titanium oxide seems to stabilize.
Researchers have observed a consistent trend toward reduction in crystallite size in TiN when synthesized using plasma-assisted techniques. This phenomenon is attributed to the shading or self-shading effect, where the growth of crystallites is hindered. As a result, spaces are formed between the islands of the coating, where the incident ions or atoms responsible for the formation of the TiN layer cannot fully reach. These spaces become small cavities in the coating [34]. However, as observed in other materials such as NiTi thin films [35] and barium titanate nanoparticles [35], increasing temperature generally leads to a decrease in crystallite size. This trend is further supported by the formation of smaller grains at higher crystallization temperatures [35]. Nonetheless, the specific relationship between temperature and crystallite size in titanium nitride warrants further exploration.
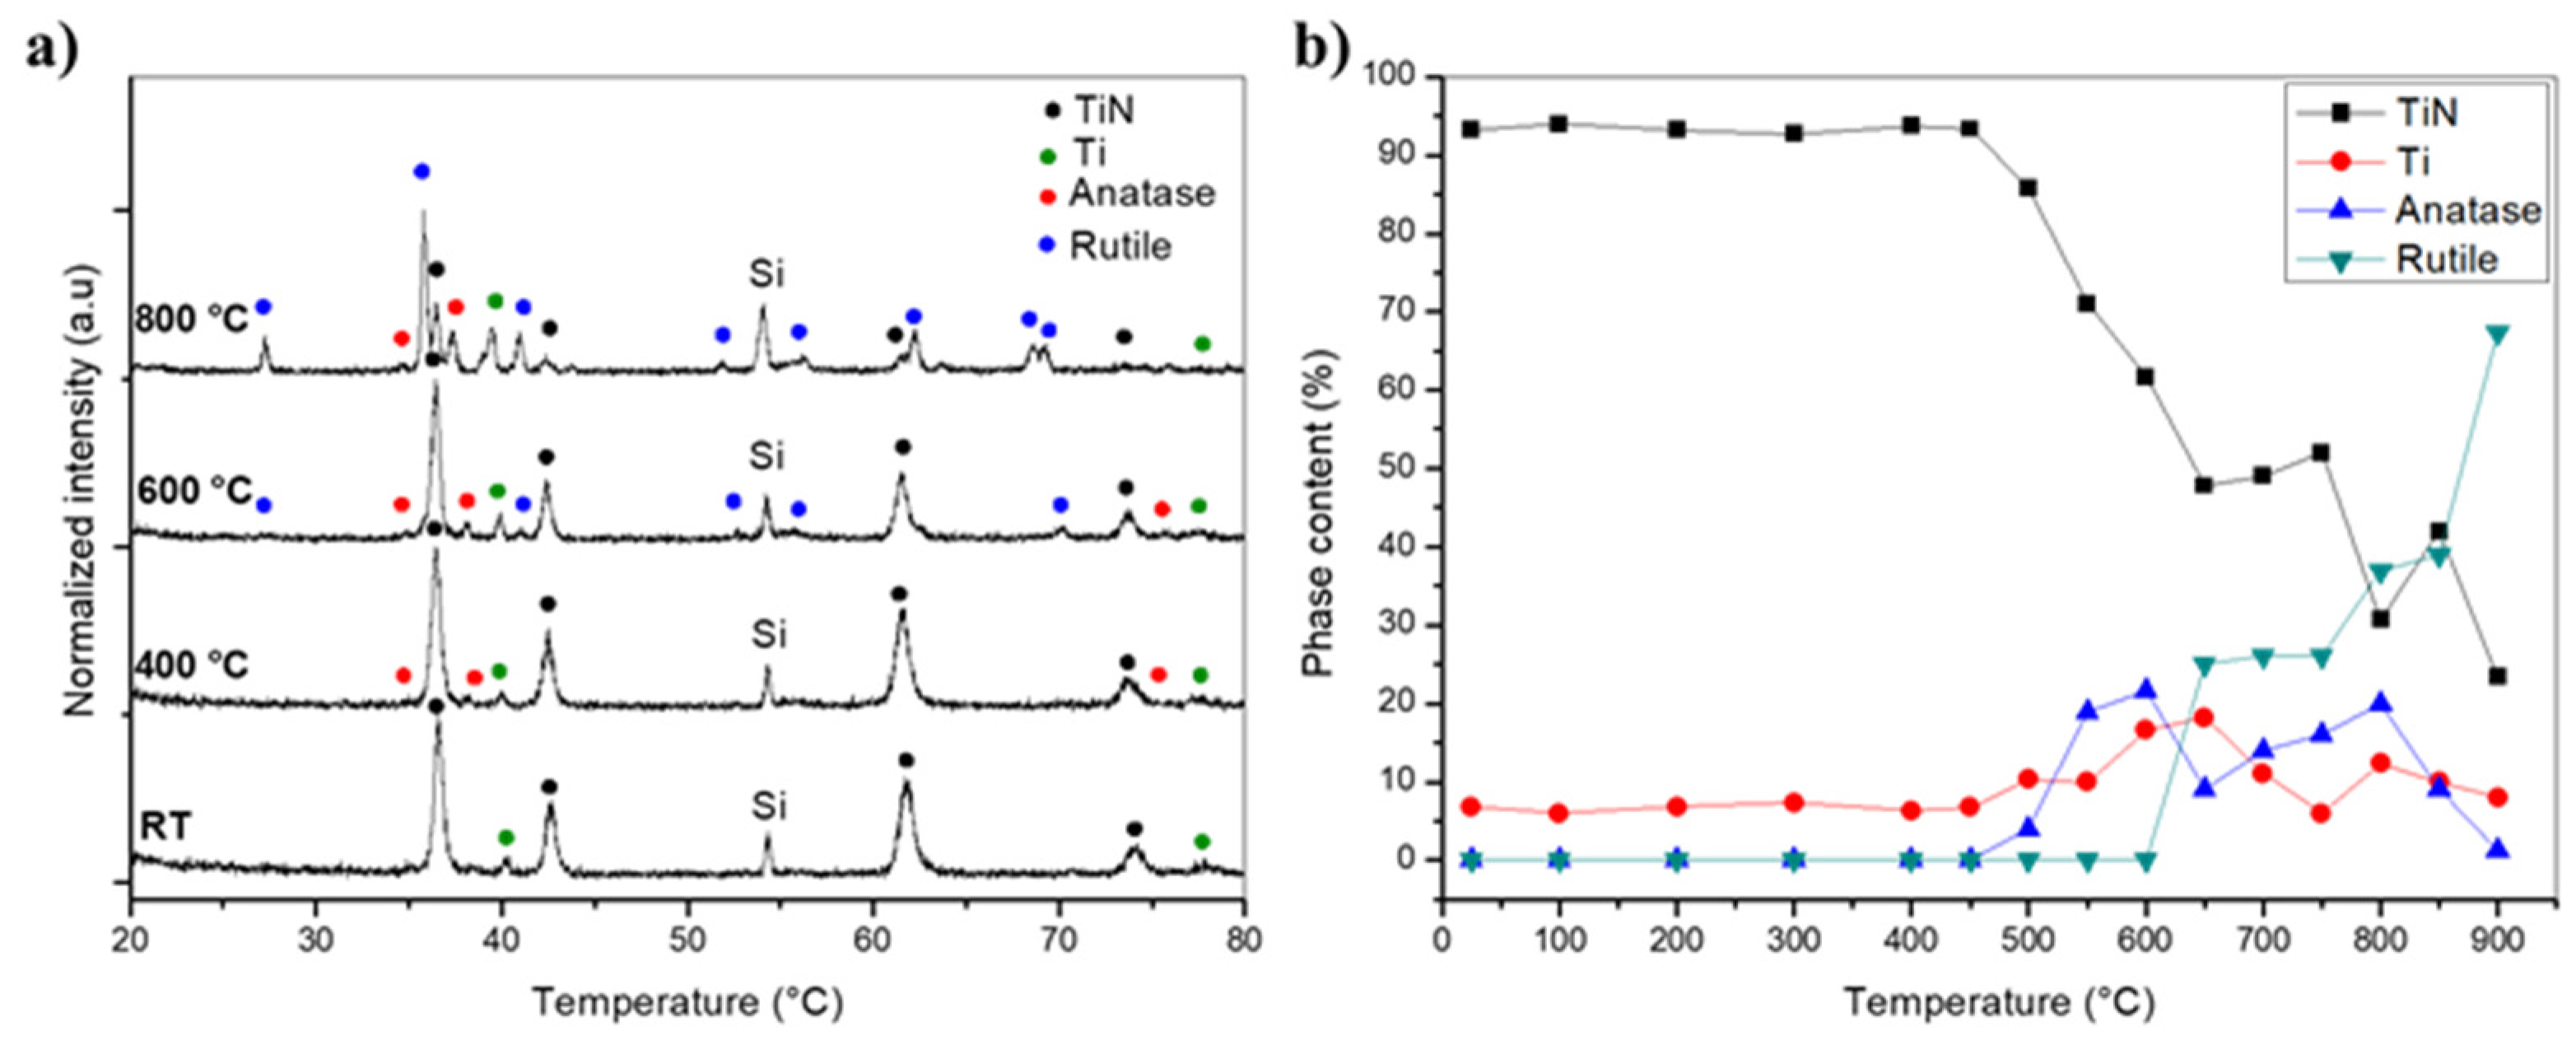
Figure 6a shows the diffraction patterns corresponding to the Ti/TiN bilayer. These patterns reveal the coexistence of various crystalline structures, including the metallic structure of titanium and the ceramic structures of FCC-TiN and oxide phases at different temperatures. At room temperature, peaks related to the Ti/TiN bilayer are distinguished, with no indication of titanium oxidation. Upon exceeding 400 °C, anatase is observed. At temperatures above 800 °C, rutile becomes the predominant phase in the coating.
Figure 6b (Rietveld refinement analysis) shows a mixed behavior between Ti (Figure 2b) and TiN (Figure 4b). Initially, the formation of anatase is attributed to the oxidation of the titanium coating since it is formed around 450 °C, where TiN does not show a reduction in phase concentration. While increasing the temperature above 500 °C, TiN begins the oxidation process, which causes the anatase phase, which was already stabilized, to grow. However, as observed for the TiN monolayer, when oxidation increases critically, the formation of the rutile phase increases, which grows in a quasi-linear manner.
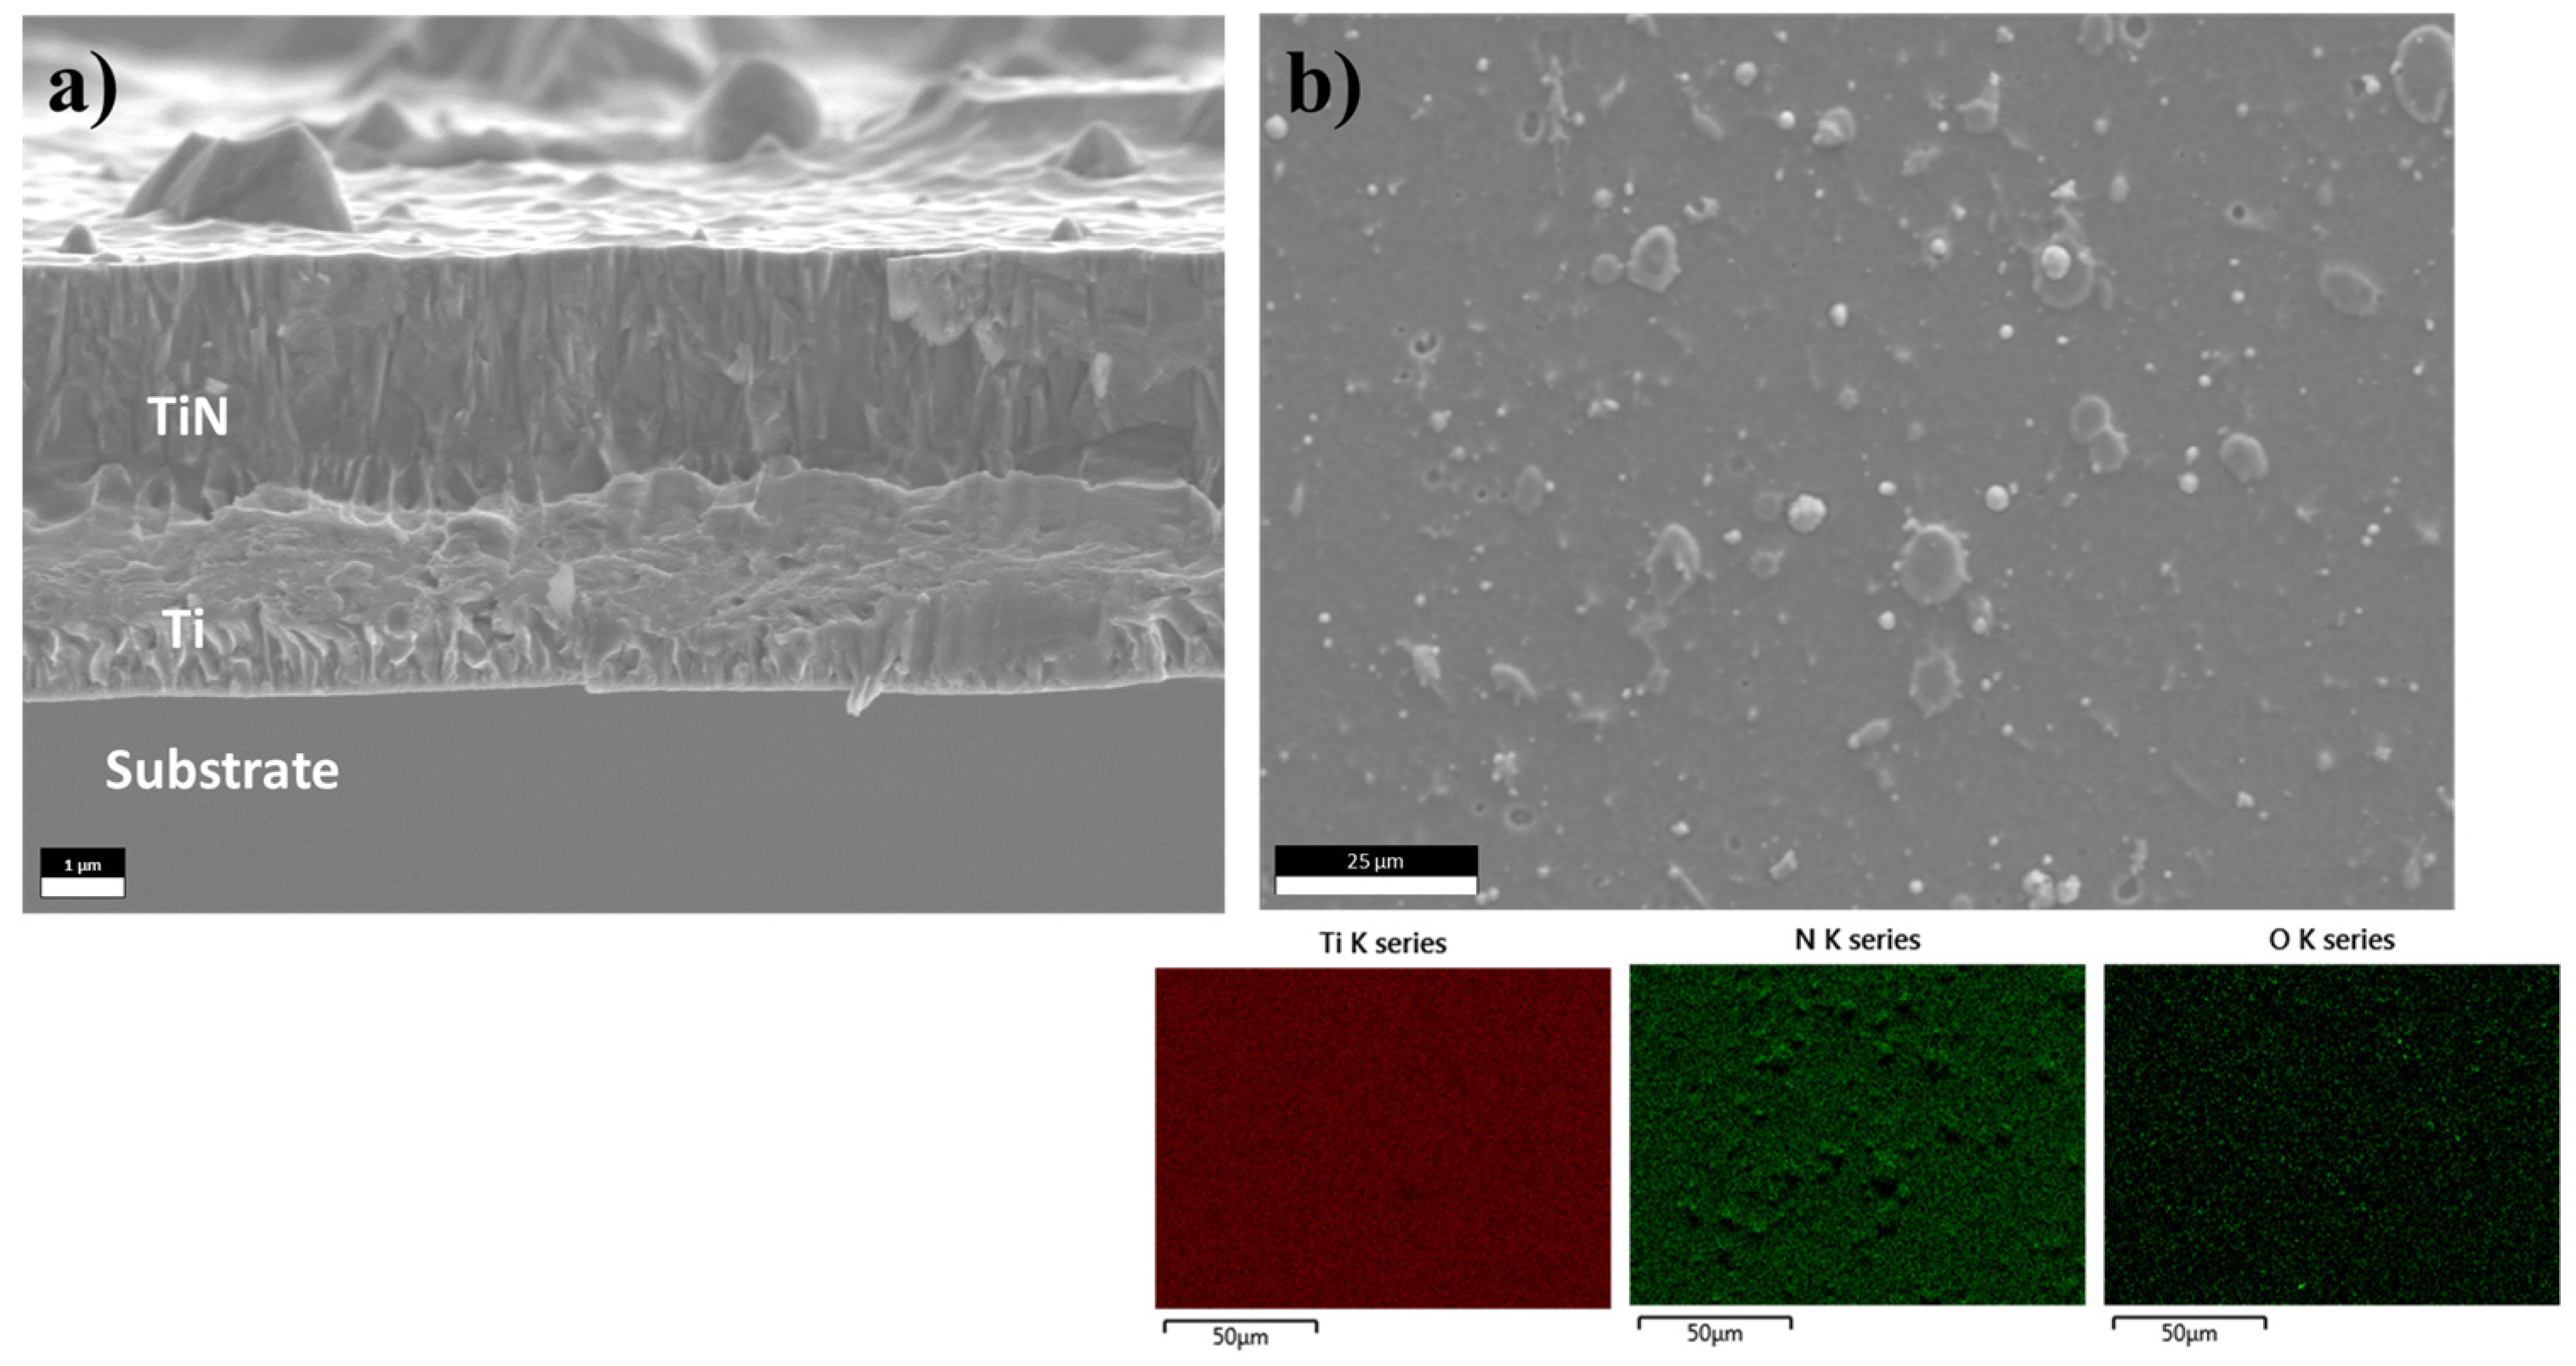
Figure 7a,b display the SEM images of the cross section and surface of the Ti/TiN bilayer (including an EDS map for Ti, N, and O), respectively, while Table 2 presents the thickness and roughness values obtained by contact profilometry. The Ti and TiN monolayers achieved average thicknesses of 4.11 µm and 5.3 µm, respectively. For the bilayer, the average total thickness of 5.2 µm was obtained, with approximately 2.6 µm of Ti and 2.6 µm of TiN (see Figure 7a). Thus, the total thickness remains within the desired range of around 5 µm. The coatings’ surfaces exhibit microdroplets typical of those produced by the cathodic arc technique (Figure 7b), formed due to temperature variations at the cathodic spot. Consequently, the coatings have a higher average roughness (Ra) than the M2 steel substrate. The EDS maps of the coating show that the surface is homogeneous, with a Ti percentage of 48.7 ± 2.48 at%, N of 49.5 ± 2.97 at%, and Oxygen around 1.8 at%.
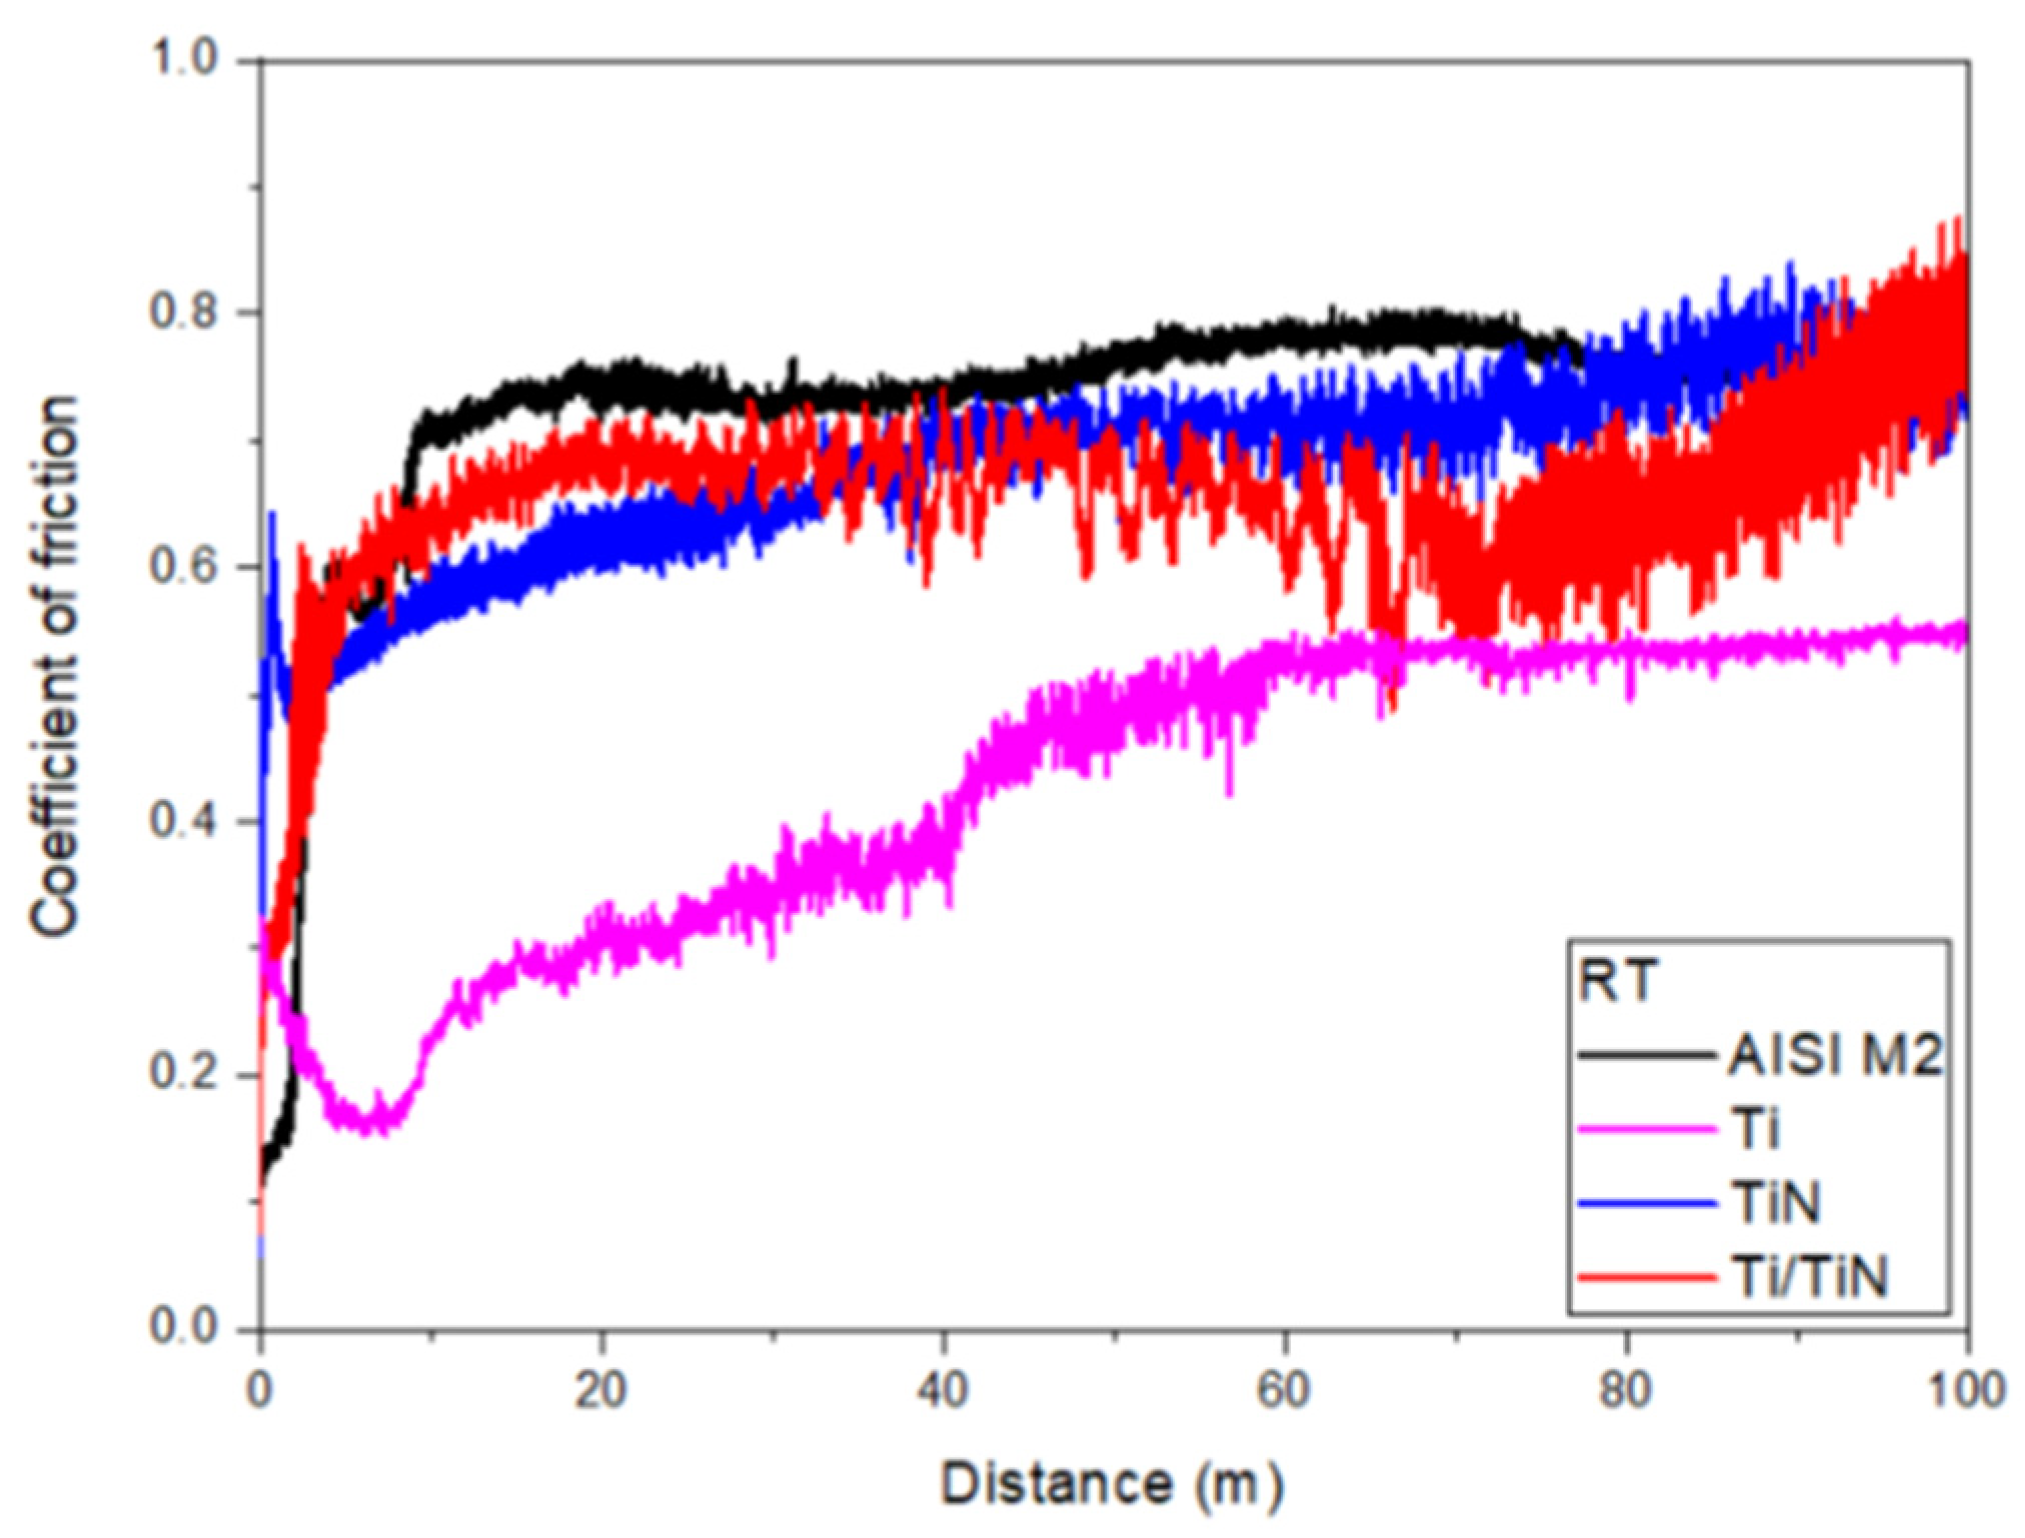
Figure 8 shows the coefficients of friction (COF) for the substrate and the coatings obtained at RT (~25 °C). The lowest COF corresponds to Ti, which remains stable at around 0.4 in the steady state. Ti, considered a solid lubricant metal, exhibits a high plastic deformation capacity, conforming to the pin’s geometry, increasing the contact area, and reducing shear stress. However, its status as a solid lubricant can only be maintained in oxygen-free atmospheres because the interaction of the metal with the atmosphere promotes the formation of oxides and tribo-corrosion products, which are prone to abrasion [36]. Similarly, the COFs of the TiN coating and the Ti/TiN bilayer are comparable to those obtained for the M2. However, an increase in the COF for the bilayer was observed at distances greater than 85 m. This increase is mainly due to the creation of particles, which can adhere to the surface and modify the roughness of the wear track. However, when worn out, the COF will likely return to its stable state, observed at distances between approximately 20 to 85 m.
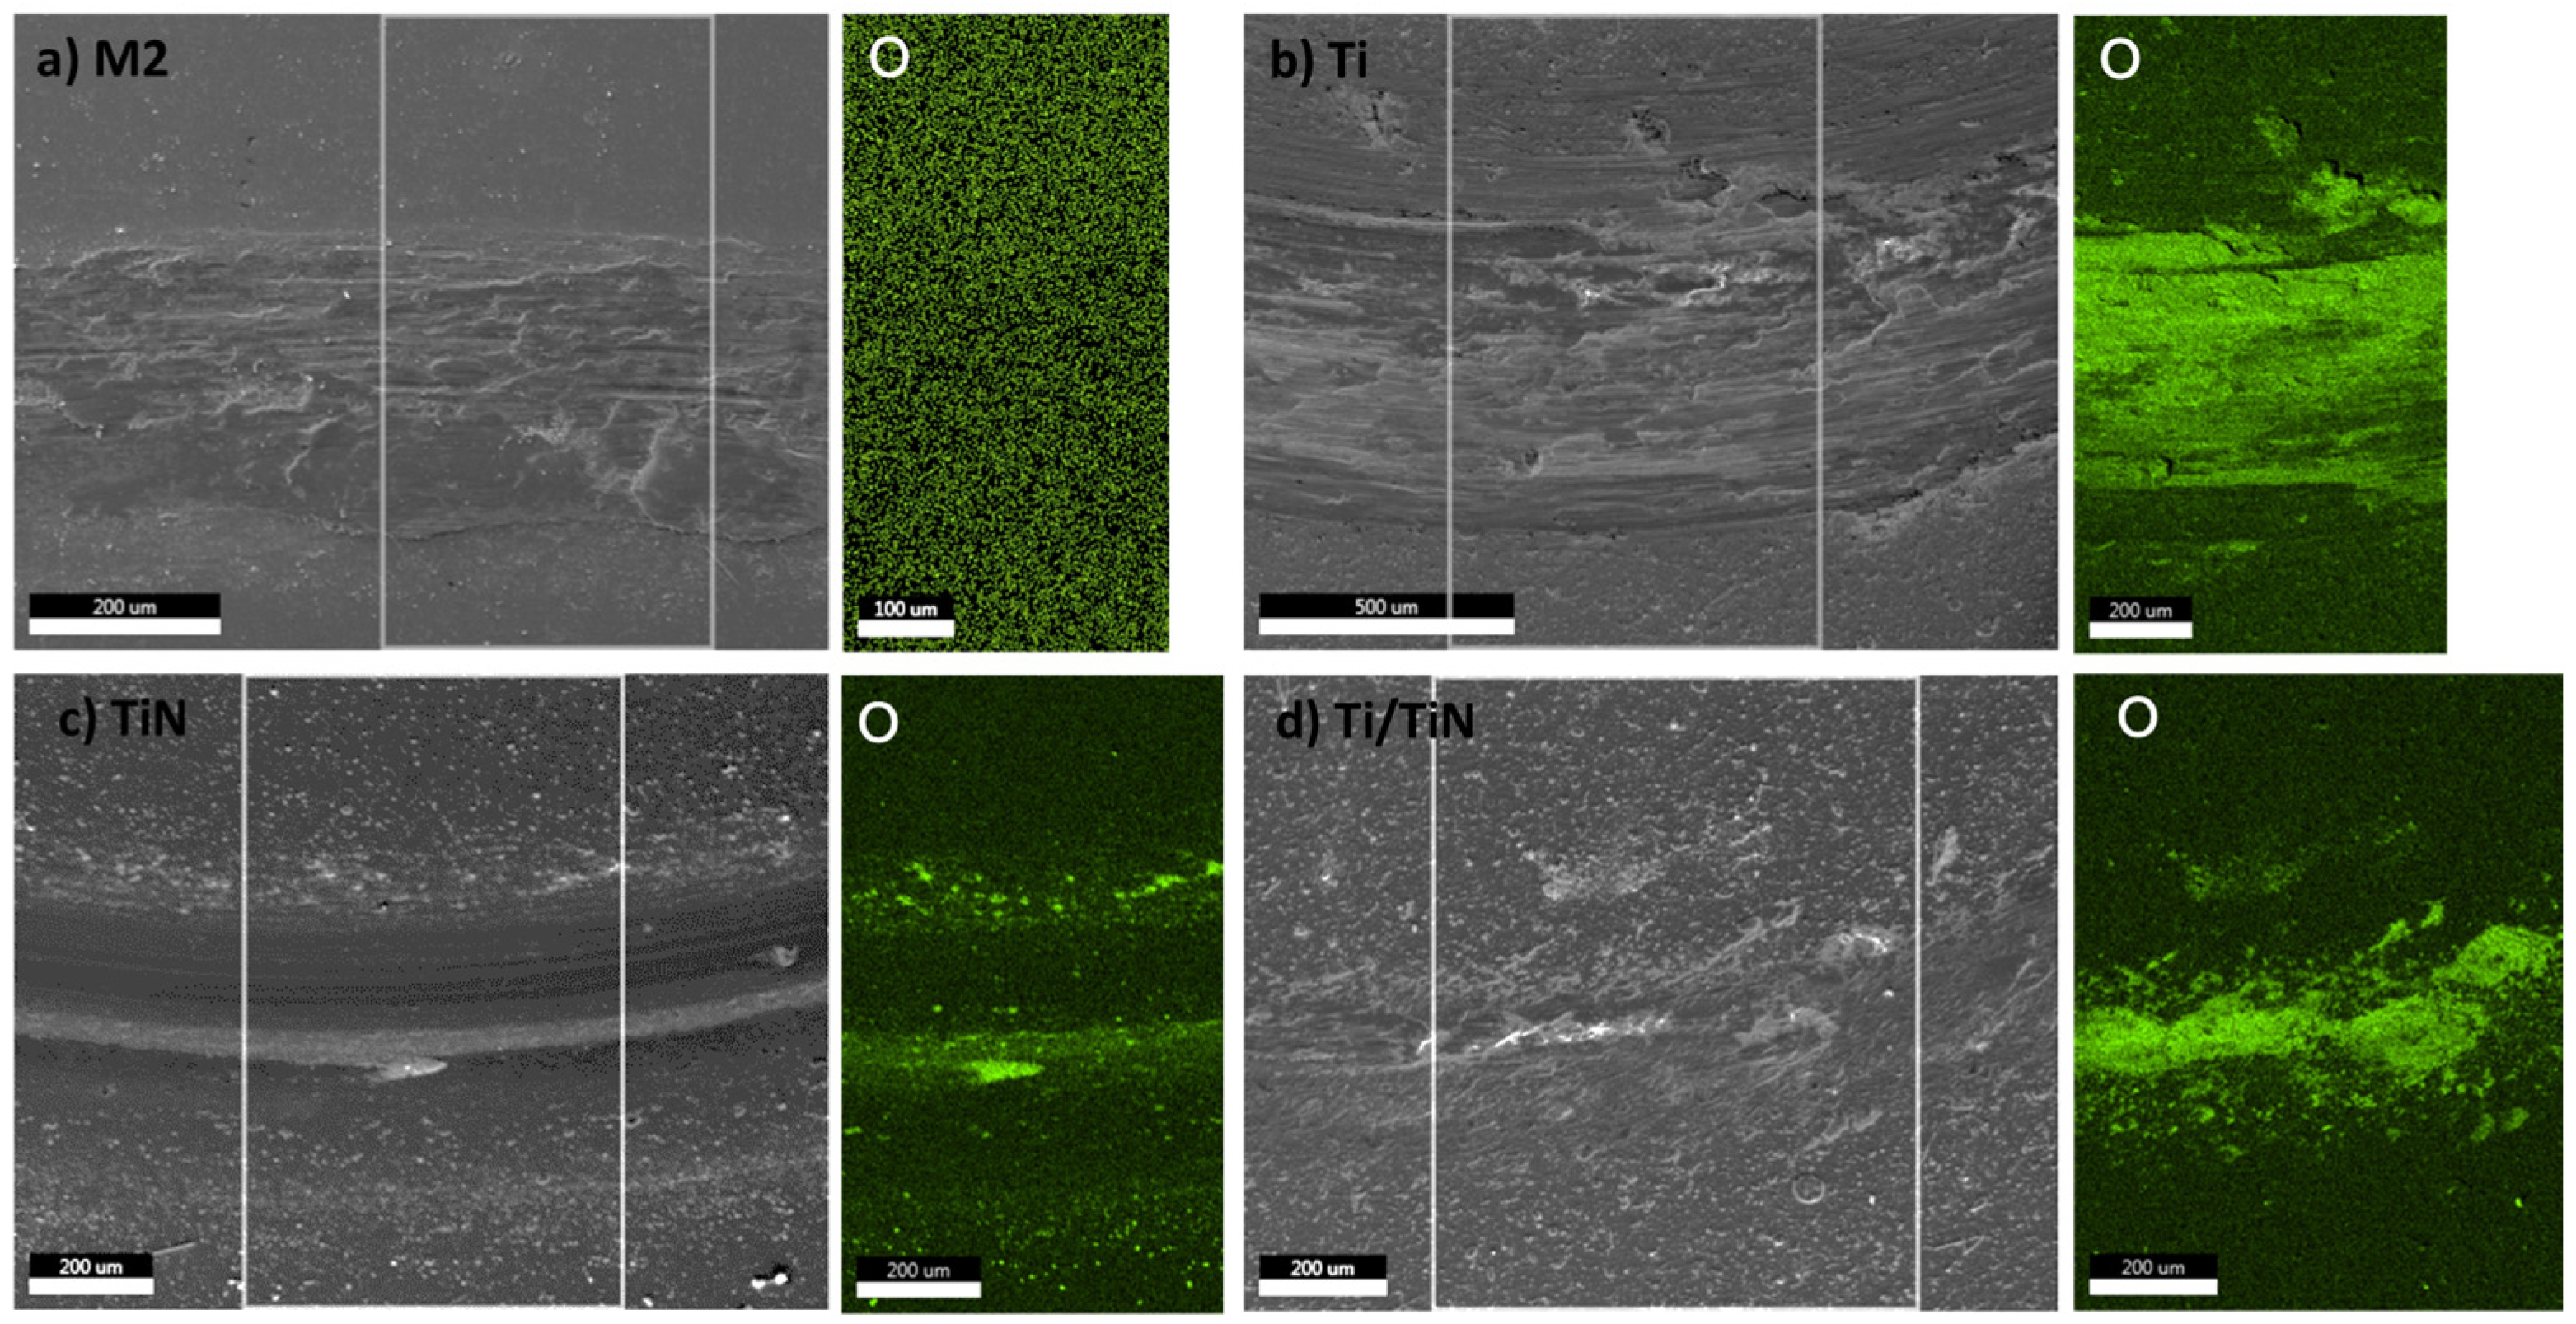
Figure 9 presents SEM images of the wear tracks, with an insert showing the chemical mapping of oxygen on part of the surface. The substrate and Ti present generalized oxidation in the center of the track, while TiN shows particle accumulation in the track’s corners with high oxygen content. These particles are responsible for the COF instabilities observed in Figure 8. Conversely, the bilayer shows behavior similar to that of the Ti coating, indicating significant wear of the coating and exposure of the substrate. Despite this, a large amount of adhered material is observed, especially in the center of the track. For metallic coatings of titanium and its alloys, such as TiAlV, abrasive wear mechanisms have been observed in friction tests conducted at room temperature under similar conditions [37].
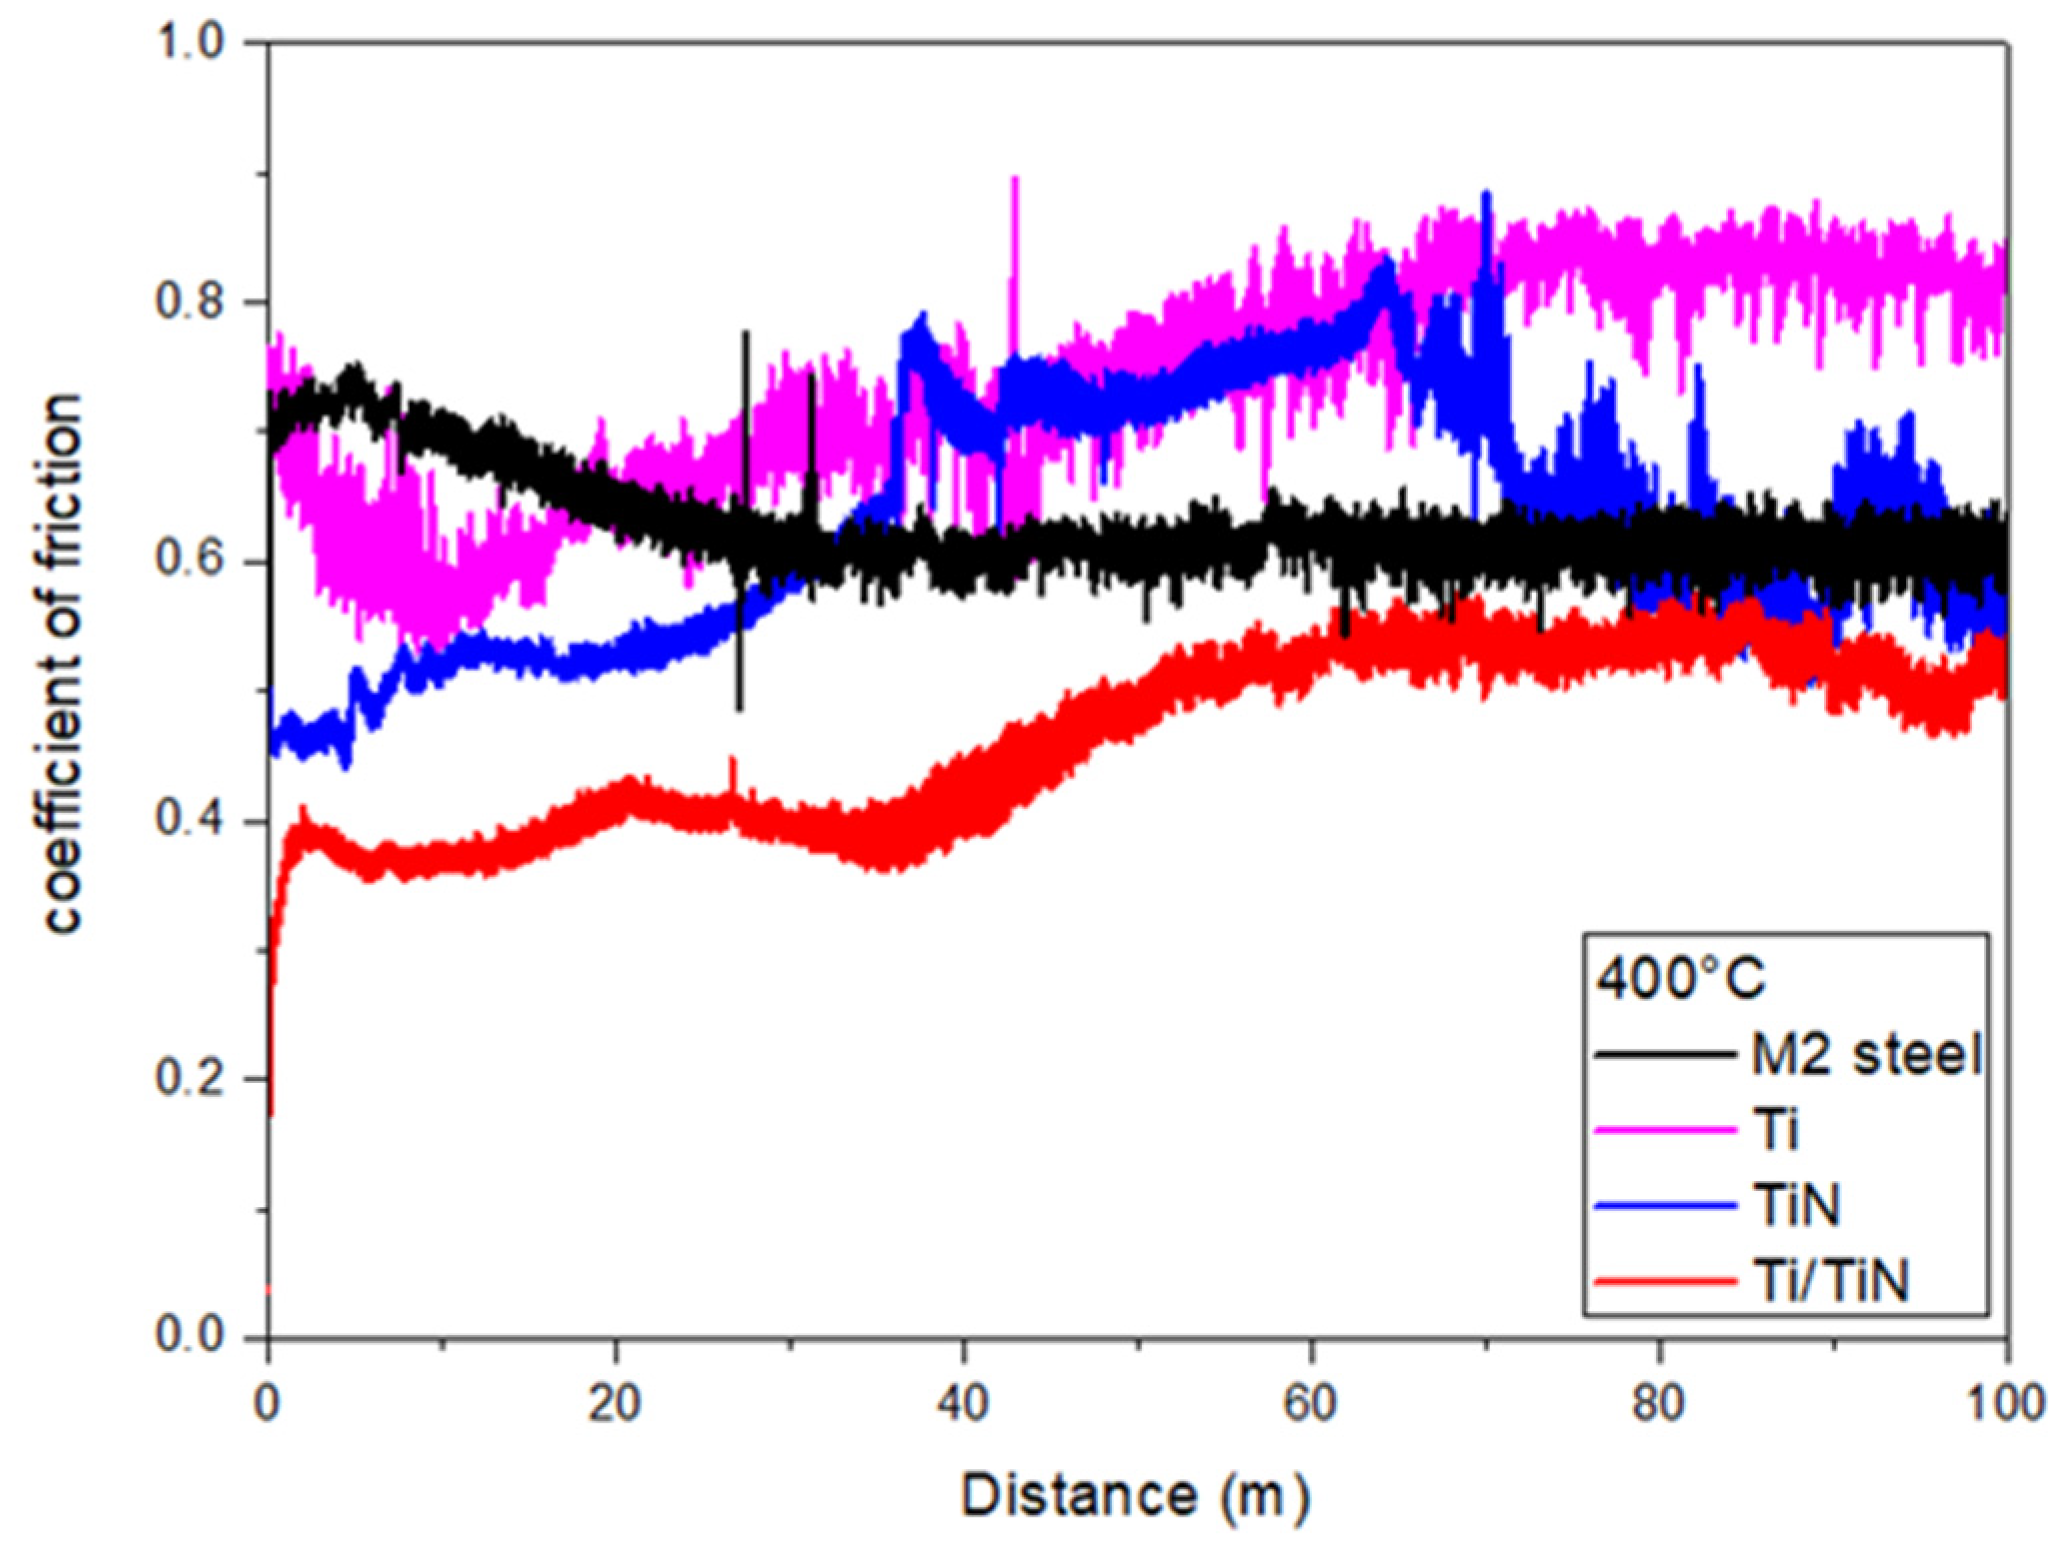
Figure 10 shows the COFs for the substrate and the coatings obtained at 400 °C. An increase in Ti’s COF is observed due to oxide formation on the surface, as observed in the GIXRD analysis (Figure 1). However, the coatings and the substrate exhibit similar COFs. In contrast, the TiN COF displays instabilities during the test, possibly due to the generation of abrasive particles, causing sudden COF increases. At this temperature, the bilayer exhibits the lowest coefficient of friction. The formation of titanium oxides, which have lower wear resistance compared to Ti or TiN, induces the formation of wear particles, which are cyclically plastically deformed, hardened by plastic deformation, and fractured with the pin run in [38,39].
Figure 11 presents the images of the worn surfaces at 400 °C with an inset of the chemical oxygen mapping. It is observed that the TiN coatings and the bilayer exhibit partial oxidation, in specific areas of the wear track, whereas oxidation is generalized for the Ti coating and the substrate. At these temperatures, the predominant wear mechanisms combine adhesion and abrasion; however, the bilayer and TiN coatings showed high adhesion in the center of the track with abrasion in the corners, while the Ti and the substrate primarily exhibit abrasive mechanisms. Abrasive wear mechanisms come from the formation of oxidized wear particles [37,38,39].
Figure 12 displays the COFs obtained at a temperature of 600 °C. At this temperature, surface oxidation is generalized, as observed from the GIXRD analysis, resulting in similar COFs across the entire set. However, the formation of wear particles is more pronounced in the substrate, leading to greater COF instabilities.
This is corroborated by the observation of the worn surfaces (Figure 13), where the substrate and Ti show primarily abrasive mechanisms, while the TiN coating and the bilayer show signs of adhesion, which comes from highly deformed wear particles that adhere to the surface and show signs of fatigue and cracking, due to the constant deformation produced by the pin [40,41,42].
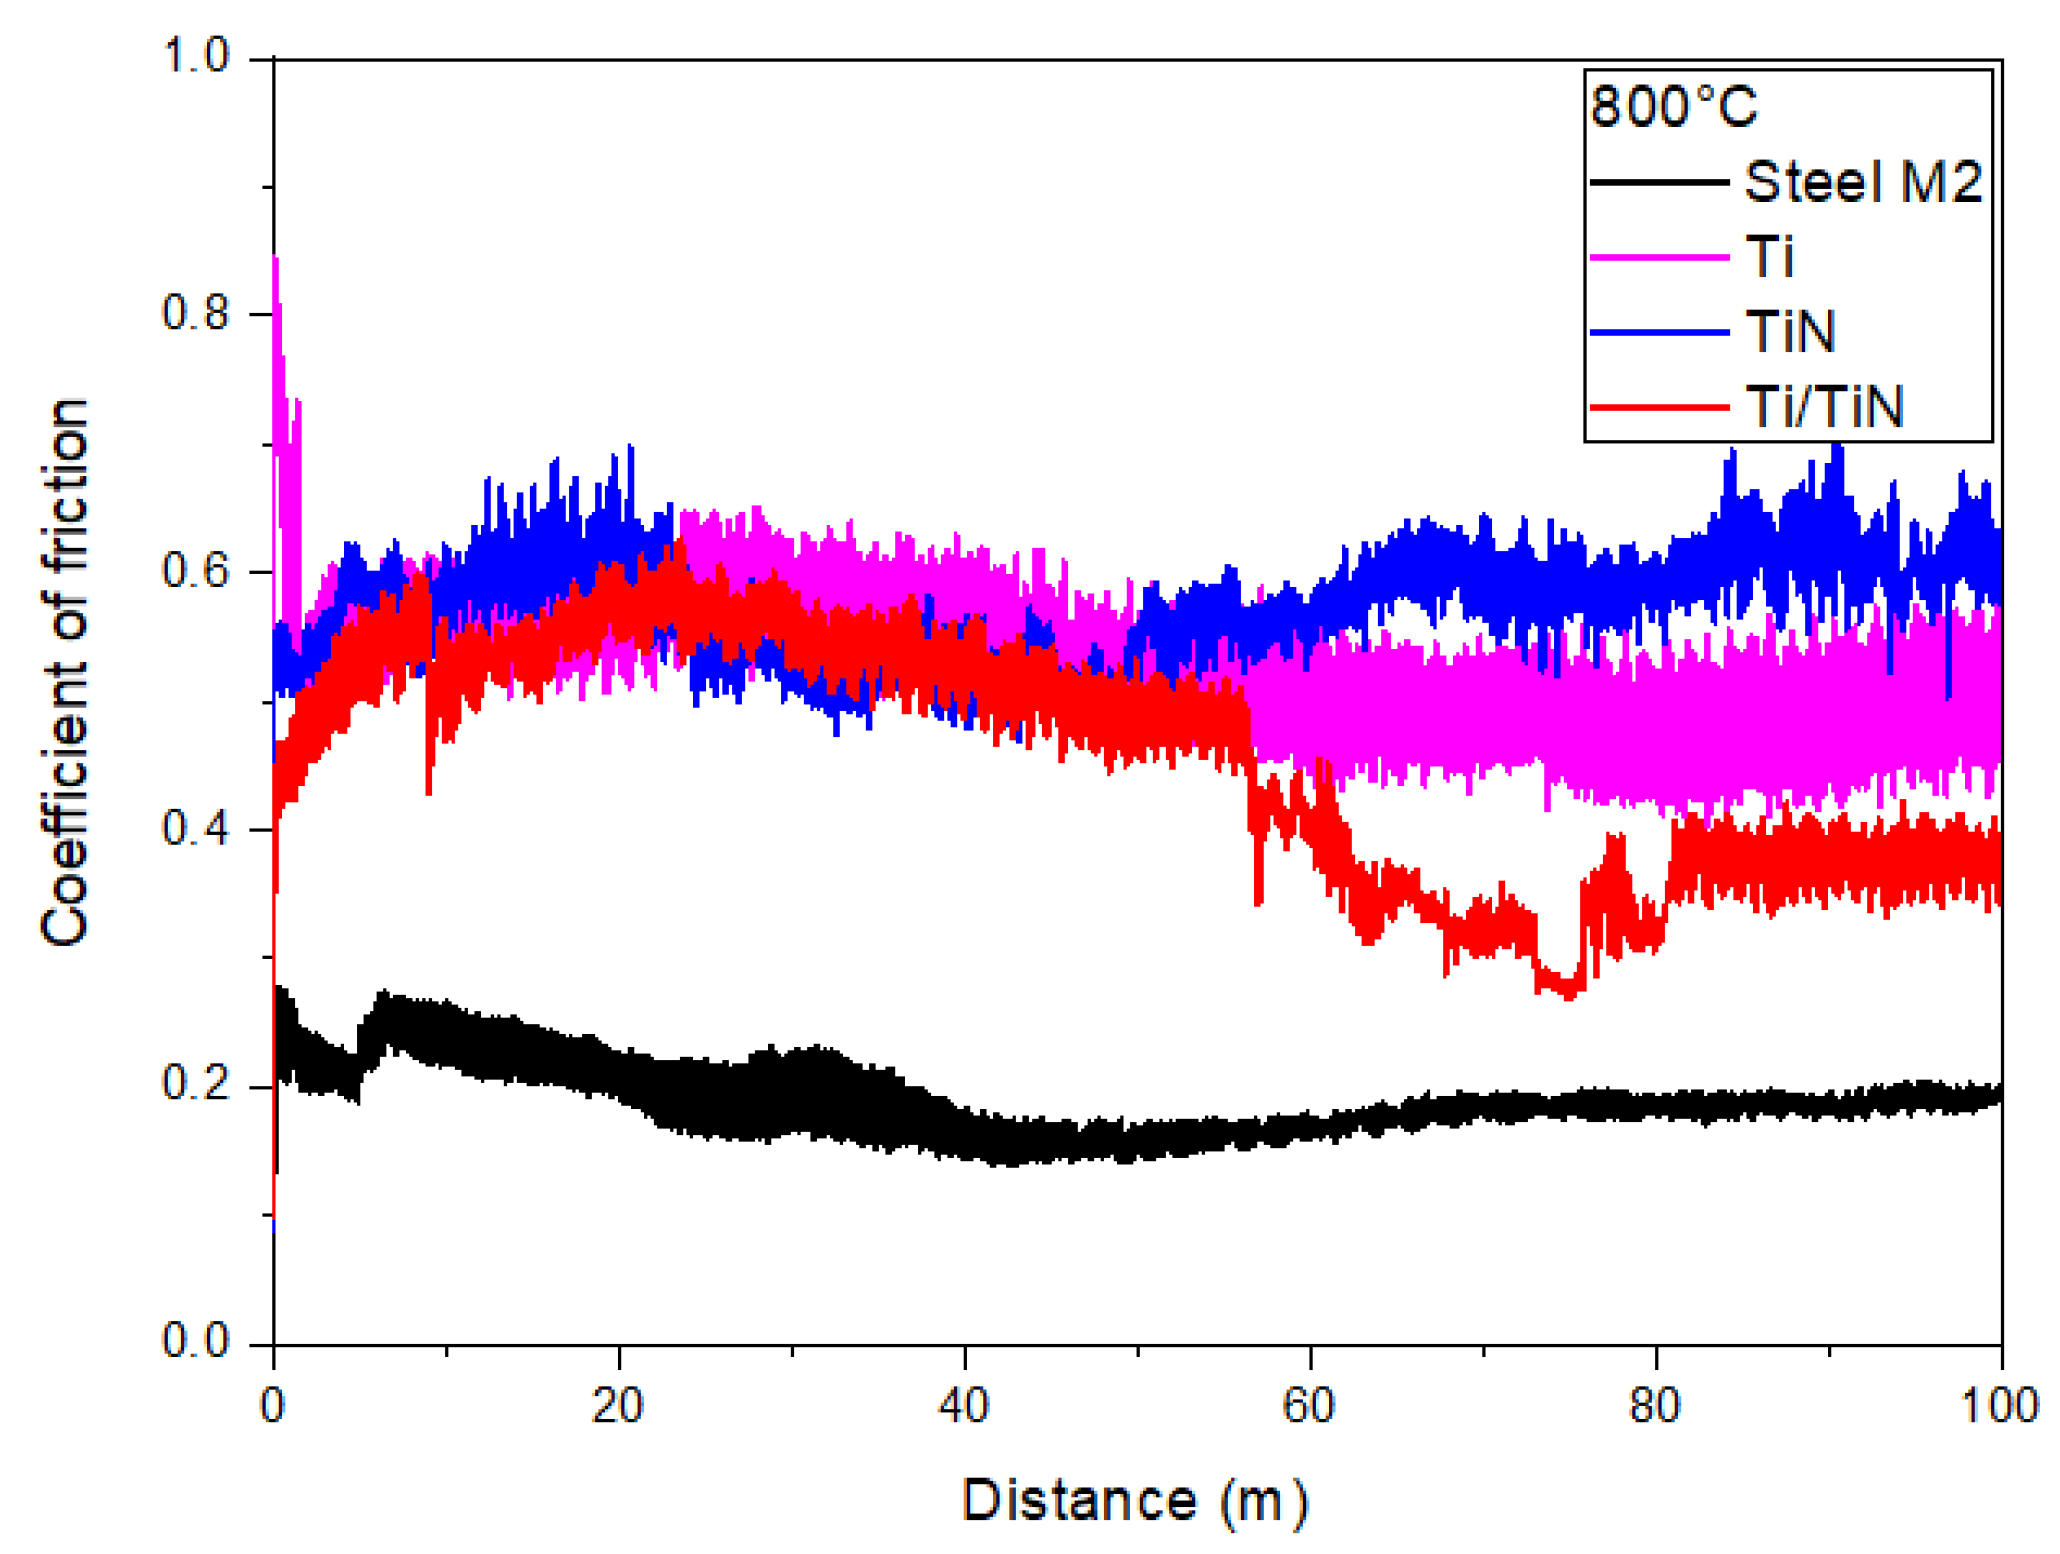
Figure 14 shows the COF obtained at a temperature of 800 °C. The lowest COF was observed for M2 steel, which suffers from generalized oxidation and softening at this temperature, which increases the contact area and reduces the shear stress at the interface between the material and the counterpart. At this temperature, mechanisms related to oxidation and tribo-oxidation dominate the tribological behavior, However, as far as we can determine, the behavior of these types of surfaces at temperatures above 600 °C has not been reported [38,39,40,41]. Compared to the other coatings, which have a higher coefficient of friction (COF) and are approximately 0.6 more stable, the Ti/TiN coating shows a decrease in COF between 60 and 80 m. This is because the particles on the Ti/TiN surface are harder than the counterpart and are gradually removed, creating a smooth surface. In this case, the frictional force decreases due to the reduction in particle deformation, as such wear particles cannot anchor as easily to a polished surface.
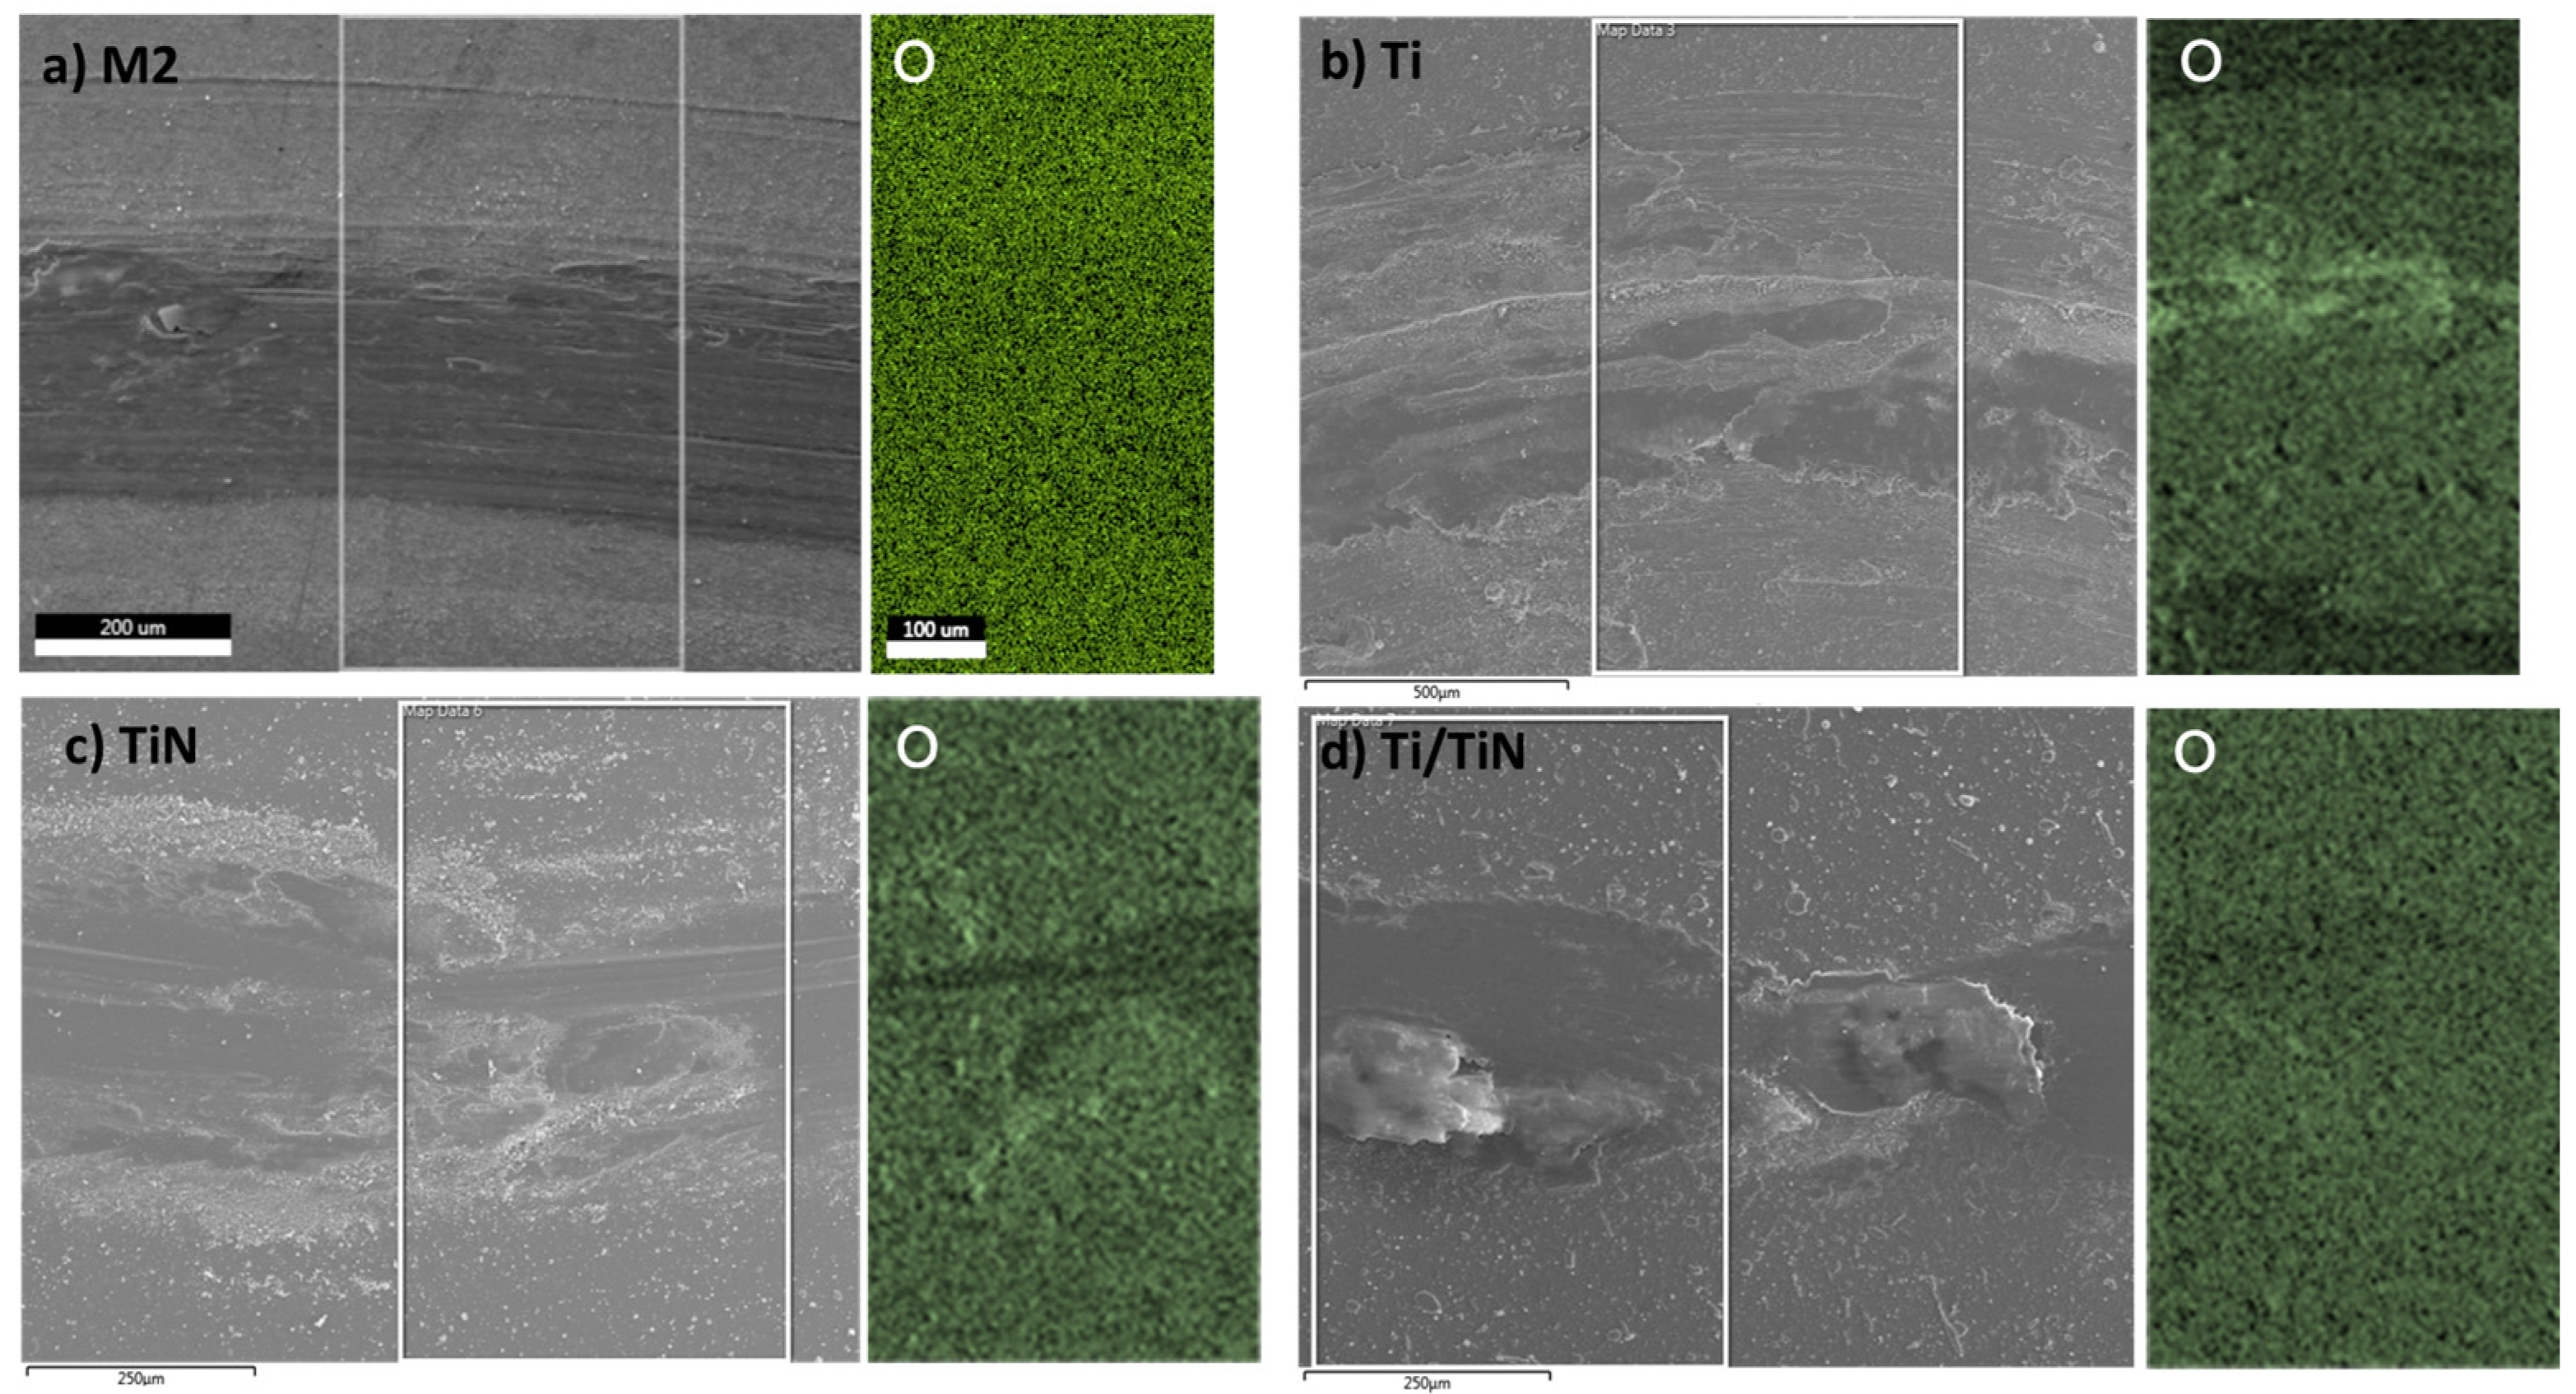
As shown in Figure 15, surface oxidation is generalized and wear mechanisms are primarily related to adhesion, except for the TiN coating, where signs of plowing and abrasion are observed in the corners of the track, due to the formation of wear particles [41].
Figure 16 shows the wear coefficient obtained from the Archard model (Equation (1)). The higher wear was observed for the Ti coating, which at low temperatures exhibited wear mechanisms related to abrasion. However, the statistical distribution of results indicates a high variability in the values obtained, suggesting non-homogeneous wear and an adhesion component. With increasing temperature, a reduction in wear was observed due to the formation of lubricating oxides on the surface [41,42]. Nevertheless, the Ti coating continued to show the highest wear values of the set. The combination of adhesion and abrasion mechanisms observed in the Ti/TiN bilayer results in a higher wear coefficient at low temperatures compared to the substrate and the TiN monolayer. However, as the temperature increases, the observed wear becomes similar. TiN and the substrate showed similar wear coefficients, which remained relatively constant with increasing temperature, but their wear mechanisms differed. The steel substrate, exhibiting high oxidation, showed increased plastic deformation with signs of plowing and scratching in some areas of the track. In contrast, for TiN, particle formation dominated the wear behavior, generating abrasion at low temperatures and a combination of adhesion and abrasion at temperatures above 400 °C.

4. Conclusions

X-ray diffraction revealed that the titanium film has a polycrystalline structure, with an ideal crystallite size observed at temperatures below 500 °C. However, above this temperature, the crystallite size decreases and microdeformations increase, possibly due to vacancies or atom dislocations. The TiN monolayer exhibited a face-centered cubic crystalline structure, which showed variations at temperatures above 600 °C, along with increased microdeformations indicating diffusion phenomena altering its structural properties. The wear of this material was minimal at 600 °C, as indicated by its constant low coefficient of friction. The Ti/TiN bilayer exhibited the expected rutile and anatase phases characteristic of such materials, which become prominent at elevated temperatures, generating hard abrasive particles that increase stripping and plowing. Significant changes in the crystallographic parameters of these crystalline phases were observed starting at 800 °C, accompanied by decreased microdeformations, suggesting improved atom coalescence under these conditions, enhancing properties essential for metalworking applications. Moreover, the bilayer showed favorable wear behavior at 600 °C, maintaining a low and constant friction coefficient indicative of its wear resistance.

Author Contributions

Conceptualization, A.G.O., A.R. and J.M.G.-C.; methodology, G.C.M. and J.M.G.-C.; formal analysis, A.G.O., C.O.-P., G.C.M., J.P.T., A.R. and J.M.G.-C.; investigation, C.O.-P., A.G. and J.A.C.; data curation, A.G.O., J.P.T., A.R. and J.M.G.-C.; writing—original draft preparation C.O.-P. and J.M.G.-C.; writing—review and editing, G.C.M., A.R. and E.A.F.U.; funding acquisition, E.A.F.U. All authors have read and agreed to the published version of the manuscript.

Funding

This research was funded by CONAHCYT through the FORDECYT projects 297265 and 296384 and Frontiers of Science project 2015-02-1077. Additionally internal CIDESI project number QID0027.

Institutional Review Board Statement

Not applicable.

Informed Consent Statement

Not applicable.

Data Availability Statement

The raw data supporting the conclusions of this article will be made available by the authors on request.

Acknowledgments

The authors thank the support provided by CONAHCYT through the FORDECYT program, support from the national laboratory CENAPROT-CIDESI, and the Investigadores por México (previously Cátedras program) managed by CONAHCYT.

Conflicts of Interest

The authors declare no conflicts of interest.

References

  1. Li, Y.; Wang, Y.; Niu, J.; Liu, S.; Lin, Y.; Liu, N.; Ma, J.; Zhang, Z.; Wang, J. Microstructure and mechanical properties of M2 high speed steel produced by electron beam melting. Mater. Sci. Eng. A 2023, 862, 144327. [Google Scholar] [CrossRef]
  2. Yuan, J.; Geng, H.; Alfano, M. Multi-response optimization of M2 steel coatings deposited by co-axial laser cladding on A2 steel tool surfaces. J. Mater. Res. Technol. 2024, 29, 1102–1117. [Google Scholar] [CrossRef]
  3. Dang, M.N.; Singh, S.; King, H.J.; Navarro-Devia, J.H.; Le, H.; Pattison, T.G.; Hocking, R.K.; Wade, S.A.; Stephens, G.; Papageorgiou, A.; et al. Surface Enhancement of Titanium-Based Coatings on Commercial Hard Steel Cutting Tools. Crystals 2024, 14, 470. [Google Scholar] [CrossRef]
  4. Masuda, K.; Ishihara, S.; Shibata, H.; Sakamoto, Y.; Oguma, N.; Iwasaki, M. Effect of surface coating on fatigue life and fatigue crack growth behavior of AISI D2 tool steel. Int. J. Fatigue 2024, 183, 108230. [Google Scholar] [CrossRef]
  5. Wang, Y.H.; Yang, Z.B.; Hu, S.Y.; Zhao, Y.H.; Ren, H.; Gong, F.; Xie, Z.W. Tailoring growth structure. wear and corrosion properties of TiN coatings via gradient bias and arc enhanced glow discharge. Surf. Coat. Technol. 2022, 450, 129015. [Google Scholar] [CrossRef]
  6. Siriprom, W.; Chananonnawathorn, C.; Kongsriprapan, S.; Teanchai, K.; Horprathum, M. Preparation and characterization of CrN thin film by DC reactive magnetron Sputtering. Mater. Today Proc. 2018, 5, 15224–15227. [Google Scholar] [CrossRef]
  7. Zambrano, D.; Hernández-Bravo, R.; Ruden, A.; Espinosa-Arbelaez, D.; González-Carmona, J.; Mujica, V. Mechanical, tribological and electrochemical behavior of Zr-based ceramic thin films for dental implants. Ceram. Int. 2023, 49, 2102–2114. [Google Scholar] [CrossRef]
  8. Gonzalez-Carmona, J.M.; Triviño, J.D.; Gómez-Ovalle, Á.; Ortega, C.; Alvarado-Orozco, J.M.; Sánchez-Sthepa, H.; Avila, A. Wear mechanisms identification using Kelvin probe force microscopy in TiN, ZrN and TiN/ZrN hard ceramic multilayers coatings. Ceram. Int. 2020, 46, 24592–24604. [Google Scholar] [CrossRef]
  9. Locks, E.; He, Q.; DePaiva, J.M.; Guimaraes, M.; Arif, A.F.; Veldhuis, S.C.; Kish, J.R. Investigating the Impact of Physical Vapour Deposition (PVD)-Coated Cutting Tools on Stress Corrosion Cracking Susceptibility in Turning Super Duplex Stainless Steel. Coatings 2024, 14, 290. [Google Scholar] [CrossRef]
  10. Aditharajan, A.; Radhika, N.; Saleh, B. Recent advances and challenges associated with thin film coatings of cutting tools: A critical review. Trans. IMF 2023, 101, 205–221. [Google Scholar] [CrossRef]
  11. Ariharan, N.; Sriram, C.G.; Radhika, N.; Aswin, S.; Haridas, S. A comprehensive review of vapour deposited coatings for cutting tools: Properties and recent advances. Trans. IMF 2022, 100, 262–275. [Google Scholar] [CrossRef]
  12. Martan, J.; Beneš, P. Thermal properties of cutting tool coatings at high temperatures. Thermochim. Acta 2012, 539, 51–55. [Google Scholar] [CrossRef]
  13. Zhang, Y.; Wang, Q.; Li, C.; Piao, Y.; Hou, N.; Hu, K. Characterization of surface and subsurface defects induced by abrasive machining of optical crystals using grazing incidence X-ray diffraction and molecular dynamics. J. Adv. Res. 2022, 36, 51–61. [Google Scholar] [CrossRef]
  14. Gómez-Ortega, A.; Pinilla-Bedoya, J.A.; Ortega-Portilla, C.; Félix-Martínez, C.; Mondragón-Rodríguez, G.C.; Espinosa-Arbeláez, D.G.; Pérez-Barrera, J.; González-Carmona, J.M.; Franco Urquiza, E.A. The Scratch Resistance of a Plasma-Assisted DUPLEX-Treated 17-4 Precipitation-Hardened Stainless Steel Additively Manufactured by Laser Powder Bed Fusion. Coatings 2024, 14, 605. [Google Scholar] [CrossRef]
  15. ASTM A600-92a; Standard Specification for Tool Steel High Speed. ASTM International: West Conshohocken, PA, USA, 2016. [CrossRef]
  16. Mondragón-Rodríguez, G.; Hernández-Mendoza, J.; Gómez-Ovalle, A.; González-Carmona, J.; Ortega-Portilla, C.; Camacho, N.; Hurtado-Macías, A.; Espinosa-Arbeláez, D.; Alvarado-Orozco, J. High-temperature tribology of Hf doped c-Al0.64Ti0.36N cathodic arc PVD coatings deposited on M2 tool steel. Surf. Coat. Technol. 2021, 422, 127516. [Google Scholar] [CrossRef]
  17. ASTM G99-17; Standard Test Method for Wear Testing with a Pin-on-Disk Apparatus. ASTM: West Conshohocken, PA, USA, 2023. [CrossRef]
  18. Djerdj, I. Rietveld Refinement in the Characterization of Crystalline Materials; MDPI: Basel, Switzerland, 2019. [Google Scholar] [CrossRef]
  19. Mittireddi, R.T.; Makani, N.H.; Prajapati, D.G.; Gautam, A.R.S.; Banerjee, R.; Panda, E. Microstructure-induced functionality in titanium dioxide thin films. Mater. Charact. 2023, 199, 112818. [Google Scholar] [CrossRef]
  20. Inamdar, A.K.; Hulsure, N.R.; Kadam, A.S.; Rajenimbalkar, R.S.; Karpoormath, R.; Shelke, S.B.; Inamdar, S.N. Flame synthesized tetragonal TiO2 nanoparticles for Methylene Blue and Congo Red dye removal applications. Results Chem. 2023, 5, 100854. [Google Scholar] [CrossRef]
  21. Eroğlu, O.; Kizil, H. The effect of the iron doping on anatase TiO2 anode for electrochemical performance of sodium-ion batteries. Solid State Ionics 2023, 393, 116168. [Google Scholar] [CrossRef]
  22. Lévy, F.; Hones, P.; Schmid, P.; Sanjinés, R.; Diserens, M.; Wiemer, C. Electronic states and mechanical properties in transition metal nitrides. Surf. Coat. Technol. 1999, 120–121, 284–290. [Google Scholar] [CrossRef]
  23. Restrepo-Parra, E.; Amaya-Roncancio, S.; Bedoya-Hincapie, C.; Riaño-Rojas, J. Simulation of band structure for CrN lattices by using a 3D array of range-limited circularly symmetric attractive potential. Superlattices Microstruct. 2008, 43, 559–563. [Google Scholar] [CrossRef]
  24. Hanaor, D.A.H.; Sorrell, C.C. Review of the anatase to rutile phase transformation. J. Mater. Sci. 2011, 46, 855–874. [Google Scholar] [CrossRef]
  25. Chen, X.; Hosseini, S.N.; van Huis, M.A. Heating-Induced Transformation of Anatase TiO2 Nanorods into Rock-Salt TiO Nanoparticles: Implications for Photocatalytic and Gas-Sensing Applications. ACS Appl. Nano Mater. 2022, 5, 1600–1606. [Google Scholar] [CrossRef]
  26. Dubey, R.; Krishnamurthy, K.V.; Singh, S. Experimental studies of TiO2 nanoparticles synthesized by sol-gel and solvothermal routes for DSSCs application. Results Phys. 2019, 14, 102390. [Google Scholar] [CrossRef]
  27. Cavalheiro, A.A.; De Oliveira, L.C.; Santos, S.A.D. Structural Aspects of Anatase to Rutile Phase Transition in Titanium Dioxide Powders Elucidated by the Rietveld Method. Alberto Adriano Cavalheiro, Lincoln Carlos Silva de Oliveira and Silvanice Aparecida Lopes dos Santos. In Titanium Dioxide; IntechOpen: London, UK, 2017. [Google Scholar] [CrossRef]
  28. Klimenko, I.O.; Belous, V.A.; Podhurska, V.Y.; Ostash, O.P.; Ovcharenko, V.D.; Tolmachova, G.N.; Kolodiy, I.V.; Ishchenko, M.G.; Babayev, I.M.; Kuprin, O.S. Tribological Properties at 20 and 500 °C of TiN and CrN Cathodic ARC Coatings Deposited on Ti-6Al-4V Alloy. East Eur. J. Phys. 2024, 1, 380–385. [Google Scholar] [CrossRef]
  29. Han, C.-S.; Park, S.-S.; Chun, M.-G. Investigation of the characteristics of TiN-coating film deposited by arc ion plating method and the feasibility of measuring residual stress according to heat treatment. J. Korean Phys. Soc. 2024, 84, 779–792. [Google Scholar] [CrossRef]
  30. Devia, D.M.; Restrepo, J.; Ruden, A.; González, J.M.; Sequeda, F.; Arango, P.J. The Tribological Characteristics of TiN. TiC. TiC/TiN Films Prepared by Reactive Pulsed Arc Evaporation Technique. In Proceedings of the 52nd Annual Technical Conference Proceedings, Santa Clara, CA, USA, 9–14 May 2009; pp. 32–36. [Google Scholar]
  31. Glaser, A.; Surnev, S.; Netzer, F.; Fateh, N.; Fontalvo, G.; Mitterer, C. Oxidation of vanadium nitride and titanium nitride coatings. Surf. Sci. 2007, 601, 1153–1159. [Google Scholar] [CrossRef]
  32. Hou, X.; Chou, K.; Zhang, M. The Model for Oxidation Kinetics of Titanium Nitride Coatings. Int. J. Appl. Ceram. Technol. 2010, 7, 248–255. [Google Scholar] [CrossRef]
  33. Joshi, A.; Hu, H. Oxidation behavior of titanium-aluminium nitrides. Surf. Coat. Technol. 1995, 76–77, 499–507. [Google Scholar] [CrossRef]
  34. Ren, J.; Xu, L.; Luo, J.; Li, Z.; Li, B.; Shi, X.; Xu, L.; Bang, L.T.; Fu, Q. Hydrothermal oxidation of titanium nitride coating for enhanced corrosion resistance in fluoride-containing acidic solution. Mater. Lett. 2023, 335, 133790. [Google Scholar] [CrossRef]
  35. Ovchinnikov, S.V.; Korotaev, A.D.; Pinzhin, Y.P. Modification of the microstructure of TiN-based columnar coatings in indentation zones. Russ. Metall. 2015, 2015, 278–284. [Google Scholar] [CrossRef]
  36. Budinski, K.G. Tribological properties of titanium alloys. Wear 1991, 151, 203–217. [Google Scholar] [CrossRef]
  37. Lee, H.-J.; Huang, X.; Mohanchandra, K.; Carman, G.; Ramirez, A. Effects of crystallization temperature on the stress of NiTi thin films. Scr. Mater. 2009, 60, 1133–1136. [Google Scholar] [CrossRef]
  38. Kobayashi, Y.; Nishikata, A.; Tanase, T.; Konno, M. Size Effect on Crystal Structures of Barium Titanate Nanoparticles Prepared by a Sol-Gel Method. J. Sol-Gel Sci. Technol. 2004, 29, 49–55. [Google Scholar] [CrossRef]
  39. Dong, H.; Bell, T. Enhanced wear resistance of titanium surfaces by a new thermal oxidation treatment. Wear 2000, 238, 131–137. [Google Scholar] [CrossRef]
  40. Saier, A.; Esen, I.; Ahlatci, H.; Keskin, E. Effect of Oxidation Process on Mechanical and Tribological Behaviour of Titanium Grade 5 Alloy. Materials 2024, 17, 776. [Google Scholar] [CrossRef]
  41. Kuo, C.-C.; Lin, Y.-T.; Chan, A.; Chang, J.-T. High Temperature Wear Behavior of Titanium Nitride Coating Deposited Using High Power Impulse Magnetron Sputtering. Coatings 2019, 9, 555. [Google Scholar] [CrossRef]
  42. Liu, A.H.; Zhou, S.X. Tribological Properties of TiN Coating at Elevated Temperature up to 600 °C. Appl. Mech. Mater. 2014, 644–650, 4784–4787. [Google Scholar] [CrossRef]
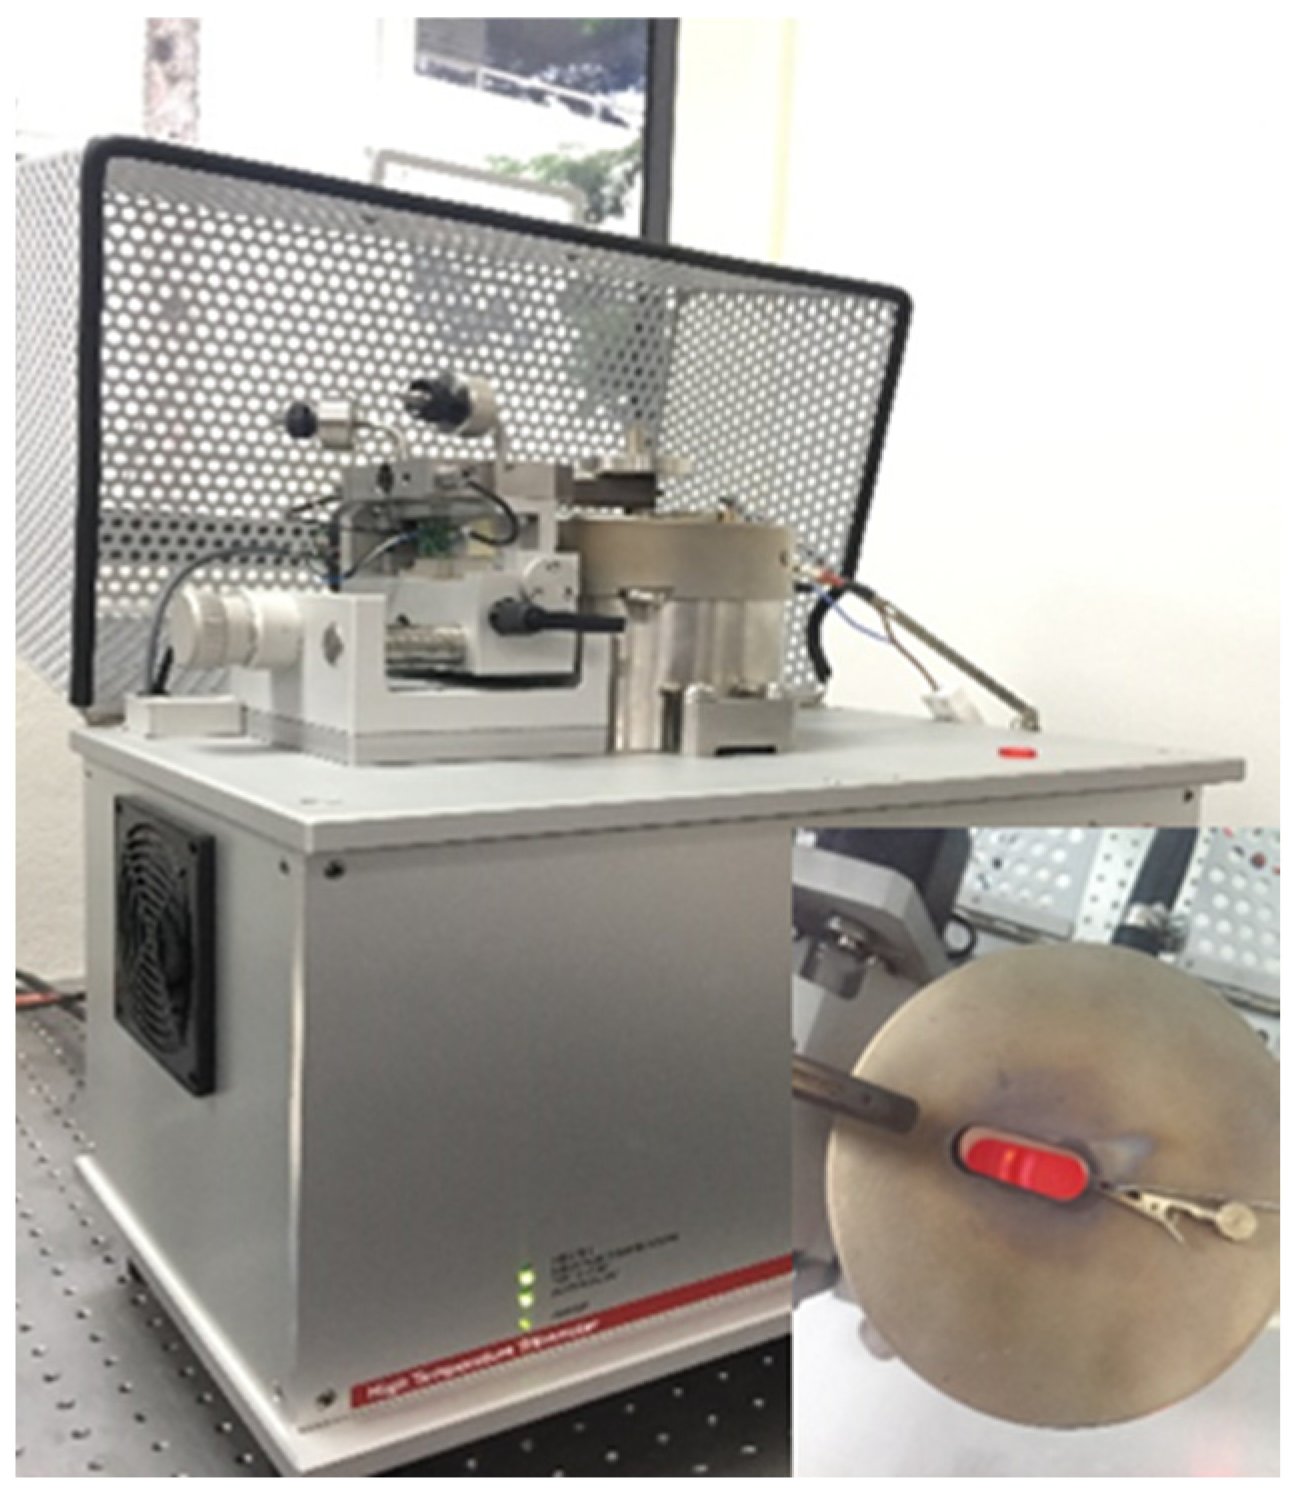
Figure 1. Anton Paar THT-1000 pin-on-disc tribometer.
Coatings 14 00823 g001
Figure 2. (a) Diffraction patterns for the Ti coating at different temperatures and (b) phase calculation obtained by Rietveld refinement as a function of temperature.
Coatings 14 00823 g002
Figure 3. Crystallite size and microdeformations calculated for the Ti coating at different temperatures.
Coatings 14 00823 g003
Figure 4. (a) Diffraction patterns for the TiN coating at different temperatures and (b) phase calculation obtained by Rietveld refinement as a function of temperature.
Coatings 14 00823 g004
Figure 5. Crystallite size and microdeformations calculated for the TiN coating at different temperatures.
Coatings 14 00823 g005
Figure 6. (a) Diffraction patterns for the Ti/TiN bilayer at different temperatures and (b) phase calculation obtained by Rietveld refinement as a function of temperature.
Coatings 14 00823 g006
Figure 7. (a) SEM images from the cross section and (b) the surface of the Ti/TiN bilayer.
Coatings 14 00823 g007
Figure 8. Friction coefficients at RT (~25 °C) for the M2 steel substrate and the Ti, TiN, coatings, and Ti/TiN bilayer.
Coatings 14 00823 g008
Figure 9. SEM images with EDS chemical mapping for oxygen of the wear track at RT for (a) the M2 steel substrate, (b) the Ti coating, (c) the TiN coating, and (d) the Ti/TiN bilayer.
Coatings 14 00823 g009
Figure 10. Friction coefficients at 400 °C for the M2 steel substrate and the Ti, TiN, coatings, and Ti/TiN bilayer.
Coatings 14 00823 g010
Figure 11. SEM images with EDS chemical mapping for oxygen of the wear track at 400 °C for (a) the M2 steel substrate, (b) the Ti coating, (c) the TiN coating, and d) the Ti/TiN bilayer.
Coatings 14 00823 g011
Figure 12. Friction coefficients at 600 °C for the M2 steel substrate and the Ti, TiN, coatings, and Ti/TiN bilayer.
Coatings 14 00823 g012
Figure 13. SEM images with EDS chemical mapping for oxygen of the wear track at 600 °C for (a) the M2 steel substrate, (b) the Ti coating, (c) the TiN coating, and (d) the Ti/TiN bilayer.
Coatings 14 00823 g013
Figure 14. Friction coefficients at 800 °C for the M2 steel substrate and the Ti, TiN, coatings, and Ti/TiN bilayer.
Coatings 14 00823 g014
Figure 15. SEM images with EDS chemical mapping for oxygen of the wear track at 800 °C for (a) the M2 steel substrate, (b) the Ti coating, (c) the TiN coating, and (d) the Ti/TiN bilayer.
Coatings 14 00823 g015
Figure 16. (a) Superficial profile map of the wear track for the Ti/TiN bilayer, showing the AA profile of the wear area and (b) Wear coefficient for the M2 steel substrate and the Ti, TiN, and Ti/TiN coatings.
Coatings 14 00823 g016
Table 1. Chemical composition of commercial AISI M2 steel.
ElementCMoVCrWCoSiMnFe
wt. %0.9 ± 0.23.83 ± 0.51.43 ± 0.13.97 ± 0.44.17 ± 0.30.445 ± 0.040.39 ± 0.060.286 ± 0.01Balance
Table 2. Thickness and roughness of the Ti, TiN coatings, the Ti/TiN bilayer, and the M2 steel substrate.
Thickness (μm)Roughness Ra (μm)
AISI M2--65.3 ± 11.70
Ti4.11 ± 0.73102.4 ± 18.43
TiN5.3 ± 0.5498.6 ± 17.74
Ti/TiN5.2 ± 0.96110.1 ± 19.81
Disclaimer/Publisher’s Note: The statements, opinions and data contained in all publications are solely those of the individual author(s) and contributor(s) and not of MDPI and/or the editor(s). MDPI and/or the editor(s) disclaim responsibility for any injury to people or property resulting from any ideas, methods, instructions or products referred to in the content.