Article

The Influence of Aging Temperatures on the Microstructure and Stress Relaxation Resistance of Cu-Cr-Ag-Si Alloy

1
School of Materials Science and Engineering, Henan University of Science and Technology, Luoyang 471023, China
2
Institute of Materials, Henan Academy of Sciences, Zhengzhou 450046, China
3
School of Chemical Engineering, Zhengzhou University, Zhengzhou 450001, China
*
Author to whom correspondence should be addressed.
Coatings 2024, 14(7), 909; https://doi.org/10.3390/coatings14070909 (registering DOI)
Submission received: 23 June 2024 / Revised: 17 July 2024 / Accepted: 19 July 2024 / Published: 20 July 2024

Abstract

:
Copper alloys used in connectors rely significantly on stress relaxation resistance as a key property. In this study, a heavily deformed Cu-Cr-Ag-Si alloy underwent aging at varying temperatures, with a subsequent analysis of its mechanical properties and microstructure, with a particular emphasis on understanding the mechanism of improving stress relaxation resistance. As the aging temperature rose, the Cr precipitated into a Cr-Si composite element precipitated phase. Both work hardening and precipitation strengthening played vital roles in enhancing the stress relaxation resistance of the Cu-Cr-Ag-Si alloy, with the latter exerting a more pronounced impact. The notable performance enhancement observed after aging at 450 °C can be attributed to the synergistic effects of work hardening and precipitation strengthening. Following aging at 450 °C, the alloy demonstrated optimal performance, boasting a tensile strength of 495.25 MPa, an electrical conductivity of 84.2% IACS, and a level of 91.12%. These exceptional properties position the alloy as a highly suitable material for connector contacts.

1. Introduction

Connectors are bridges connecting systems, subsystems or components, mainly transmitting signals or energy, and are indispensable products in electrical and electronic aspects [1]. Copper alloy is the key conductor material to ensure the stable and reliable transmission of connectors [2]. During the repeated operation of the connector, its stress is easy to relax. Therefore, copper for connectors not only requires high strength and high conductivity but also more attention to its stress relaxation resistance. The service life of copper contacts is determined by the stress relaxation resistance. For example, for high-voltage connectors of new energy vehicles, under the coupling effect of long-term contact pressure and thermal stress, the copper-based materials used in the connectors undergo stress relaxation [3]. With a decrease in contact pressure, an increase in resistance and an increase in heat generation, an excessive temperature rise occurs in the contact part of the connector. The increase in temperature will further aggravate the stress relaxation of copper-based materials, form a vicious circle, accelerate connector failure, and cause major safety accidents in vehicles such as new energy vehicles. Therefore, copper alloys for high-voltage connectors are required to have high electrical conductivity and high stress relaxation resistance.
The copper alloy is a typical age-strengthened copper alloy, which is widely used in electronic connectors due to its high strength, excellent electrical conductivity and good stress relaxation resistance [4,5]. However, with the increasing requirements of connectors for the stress relaxation resistance of copper alloy contacts, the strength and stress relaxation resistance of Cu-Cr alloys need to be further improved.
A large number of scholars have made many efforts to improve the strength and stress relaxation resistance of copper alloys. Du et al. [6] studied the influence of Zr on the microstructure and yield strength of Cu-Cr alloys. They found that the precipitation sequence of Zr-containing precipitates in Cu-Cr-Zr alloys is a supersaturated solid solution → Zr-rich atomic clusters → the Cu5Zr phase. The strengthening mechanism of Zr-rich clusters is coherent strengthening, while the strengthening mechanism of the Cu5Zr phase is the Orowan bypass mechanism. Sun et al. [7] studied the effect of Mg on the stress relaxation resistance of a Cu-Cr alloy and found that the stress relaxation rate of the Cu-Cr alloy was as high as 36% after 100 h at a temperature of 200 °C, and the addition of 0.1 wt.% Mg element reduced the stress relaxation rate of the Cu-Cr alloy to 14.6%. The higher stress relaxation resistance of Cu-Cr-Mg was attributed to fine grains, precipitates and the interaction between Mg atoms and dislocations. Watanabe et al. [8] developed a Cu-Cr Ag alloy with high strength and excellent stress relaxation resistance. They found that the increase in strength and stress relaxation resistance is attributed to the reduction in Cr precipitation phase spacing and the inhibition of recovery during aging, as well as the drag effect of Ag atoms on dislocation movement. In addition, recent studies have shown that the addition of trace Si significantly refines Cr-rich precipitates, thus effectively improving the strength and stress relaxation resistance of Cu-Cr alloys [9]. As for the heat treatment process parameters, in the previous study of our team, it was found that aging temperature significantly affected the stress relaxation resistance of copper alloys [10]. However, the effect of Si element on the microstructure and stress relaxation resistance of Cu-Cr-Ag alloys under different aging parameters is not clear and warrants further exploration.
In this work, Cu-Cr-Ag alloys containing trace amounts of Si were aged at different temperatures, and the relationship between the microstructure and strength, conductivity and stress relaxation resistance of the materials was explored. The evolution of the precipitate phase and the change law of stress relaxation resistance at different aging temperatures are mainly explored. The results of this experiment can provide theoretical guidance for the heat treatment process design and the determination of the properties and microstructure control of Cu-Cr alloys containing trace Si.

2. Materials and Methods

The Cu-Cr-Ag-Si alloy ingots were obtained by a vacuum induction melting furnace. The raw materials included 6N electrolytic copper, pure chromium (99.99%), pure silver (99.99%), pure iron (99.99%), pure titanium (99.995%), and pure silicon (99.9999%). The surface oxide layer of the ingot was removed by turning on a lathe, and the turned ingot was then subjected to a solution treatment at 980 °C for 2.5 h. After the solution treatment was completed, the material was subjected to hot extrusion and hot rolling. The hot-rolled material was immediately water-quenched to form a supersaturated solid solution. The composition of the hot-rolled plate was tested, and the test results are shown in Table 1. The hot-rolled copper plate was subjected to cold rolling, which was divided into four passes, and the final thickness was 0.9 mm, with a total reduction of approximately 83%. The samples for tensile testing were cut from the cold-rolled strip using wire-electrode cutting. The samples had a gauge length of 50 mm and a width of 12.5 mm. The next step is to conduct aging treatment on the tensile samples in a vacuum tube furnace while filling the furnace with Ar protective atmosphere. The aging temperatures were room temperature (natural aging, approximately 25 °C), 300 °C, 450 °C, and 600 °C, and the aging time was uniformly set to 1 h.
The samples in different aging states were subjected to conductivity, hardness, strength, and stress relaxation testing experiments. The eddy current testing method was used for conductivity testing, and the result was measured five times to obtain the average value. The microhardness testing method was used for hardness testing, with a load of 100 gf and a holding time of 10 s. Measurements were performed seven times, and the final result was obtained by taking the average value after excluding the maximum and minimum values. The tensile test was conducted at a temperature of 25 °C and a tensile rate of 0.75 mm/s. The yield strength Rp0.2 of the alloy was calculated from the force—displacement curve. The stress relaxation test was conducted using a tensile-type relaxation testing method with the same sample size as that of the tensile sample. The initial stress of the stress relaxation test was set to 50% of the yield strength. The relaxation test was conducted in an environment of 195 °C for 24 h, and the temperature was raised to the specified temperature and held for 30 min to ensure sample stability and thermal equilibrium.
The orientation information of the samples was collected using EBSD (OXFORD NordlysMax3, OXFORD INSTRUMENTS Companies, Oxford, UK). The EBSD samples were prepared by electrolytic polishing using an electrolyte solution with a ratio of alcohol, phosphoric acid, and deionized water of 1:1:1. The experimental conditions were 15 V, 10 s, and 25 °C. The microstructure of the experimental samples was observed and analyzed using TEM (FEI Talos F200X, FEI Company, Hillsboro, OR, USA). The TEM sample preparation was performed using an electrolytic double-jet polisher (MPT-1A) and using a corrosion solution with a ratio of alcohol, phosphoric acid, and deionized water of 1:1:1. The voltage was set to 20 V, and the temperature was −5 °C.

3. Results and Discussion

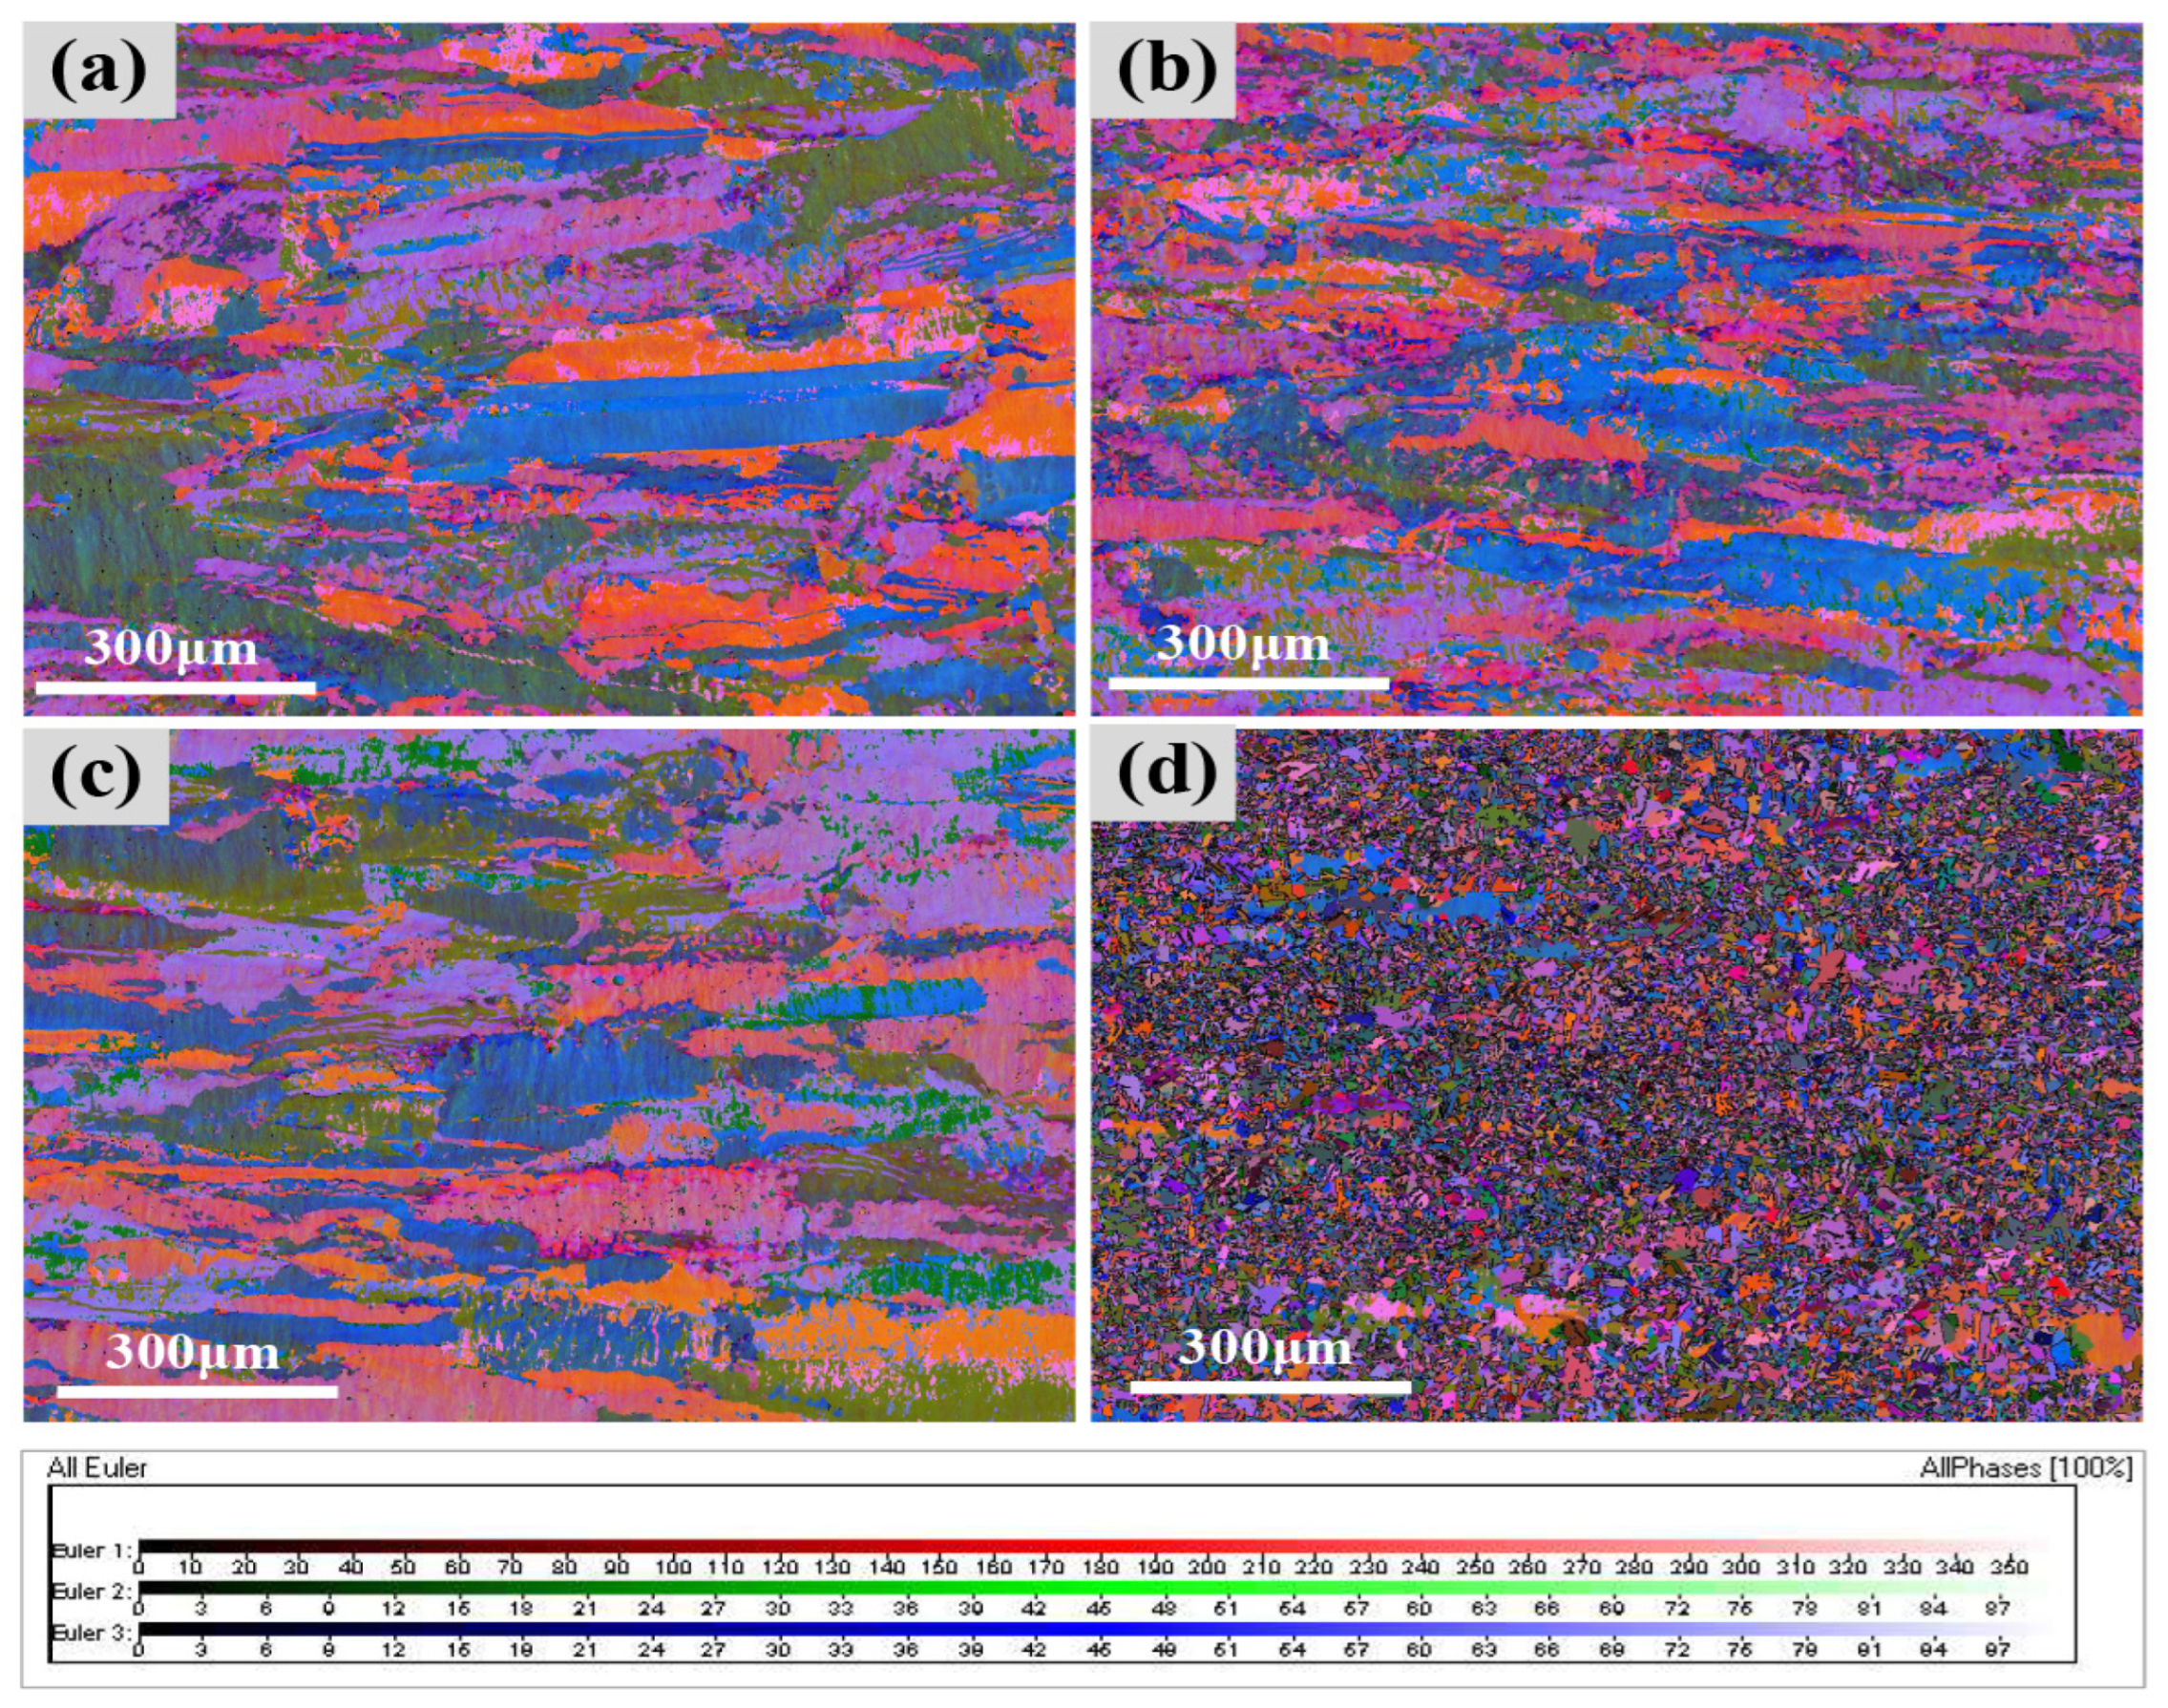
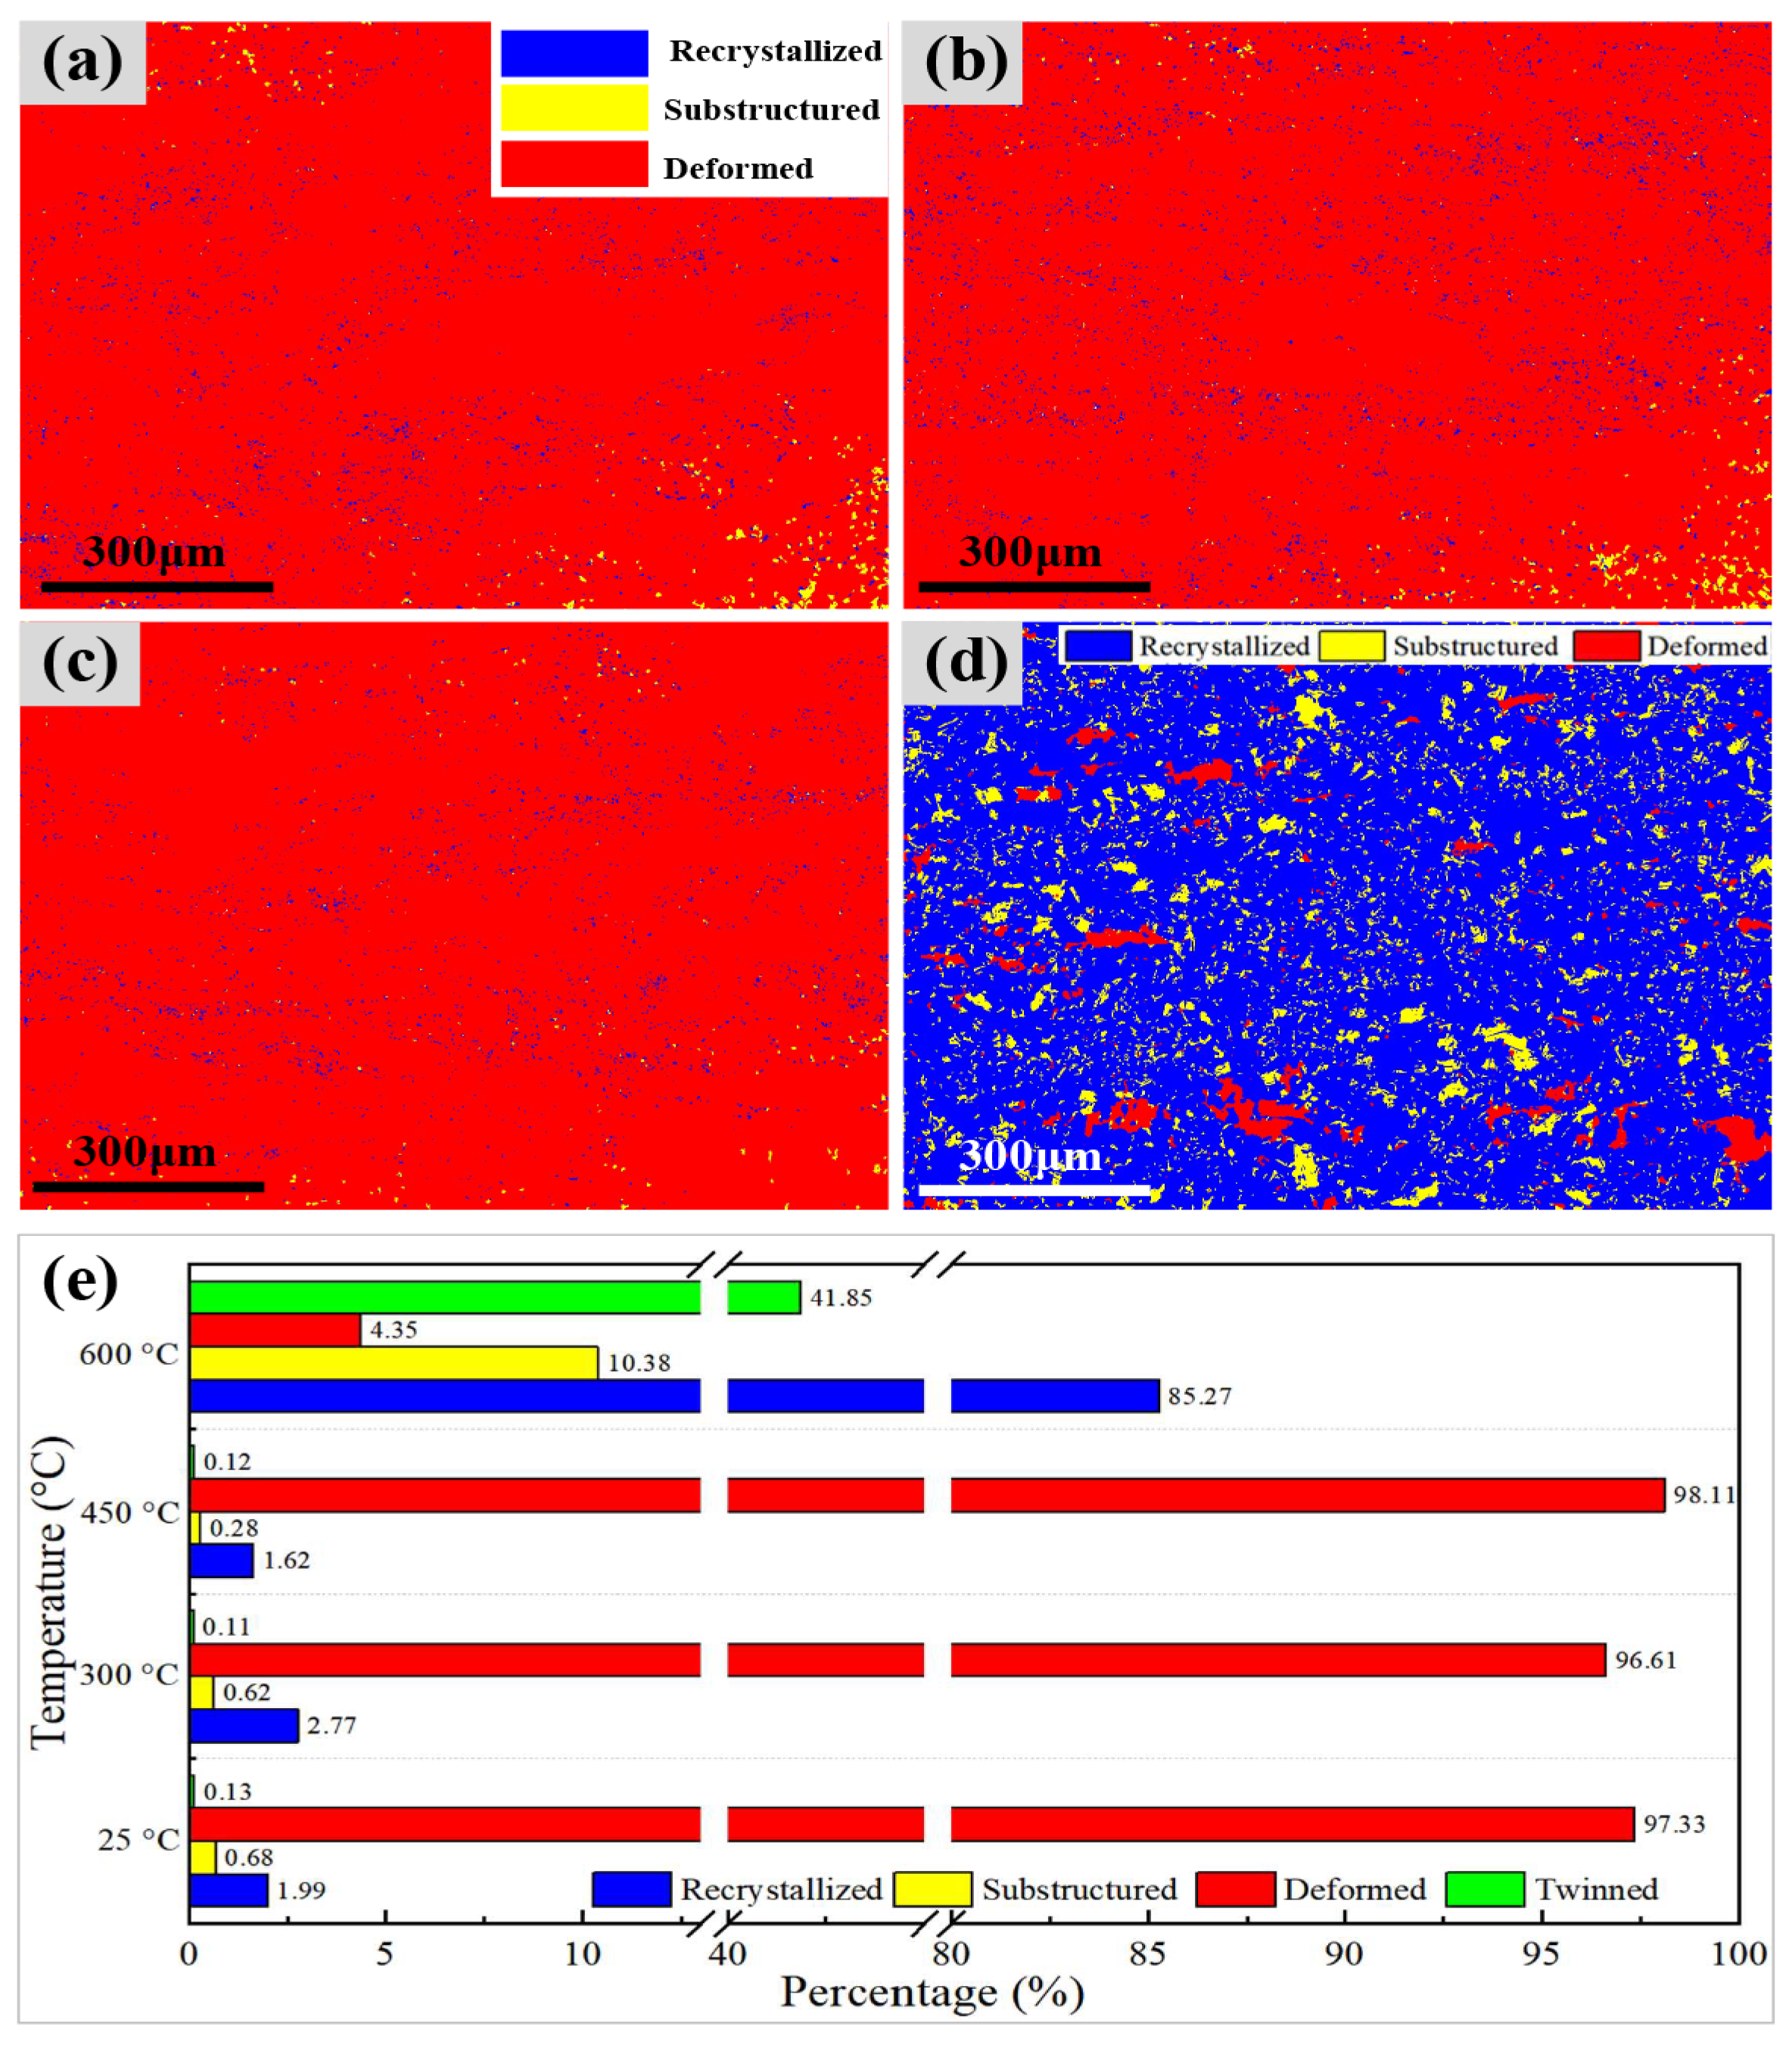
3.1. The Influence of Aging Temperature on Grain Characteristics

Figure 1a–d show the Euler angle renderings of the Cu-Cr-Ag-Si alloy at different aging temperatures, including room temperature (approximately 25 °C), 300 °C, 450 °C, and 600 °C, respectively. The grain characteristics in Figure 1a–c are elongated grains with a length of about 200 μm and a width of about 40 μm. The grain features in Figure 1d are equiaxed recrystallized grains, with a smaller equiaxed grain size and a diameter of about 20 μm, where the number of grain boundaries increases significantly.
Figure 2a–e show the distribution and proportion statistics of recrystallized, substructured, and deformed microstructures of the Cu-Cr-Ag-Si alloy at different aging temperatures. The aging temperatures are room temperature, 300 °C, 450 °C, and 600 °C, respectively. The proportion of twinned crystals in the Cu-Cr-Ag-Si alloy is additionally calculated in Figure 2e. In Figure 2a–d, the red region represents the deformed microstructure, the yellow region represents the substructured microstructure, and the blue region represents the recrystallized microstructure. The values of the red, yellow, and blue bars in the bar chart of Figure 2e represent the proportions of deformed, substructured, and recrystallized microstructures, respectively, while the value of the green bar represents the proportion of twinned grains. After natural aging, the proportion of deformed, substructured, and recrystallized microstructures is 97.33%, 0.68%, and 1.99%, respectively. The proportion of deformed microstructure exceeds 95%, and the proportion of recrystallized and substructured microstructures is very low. After aging at 300 °C, the proportion of recrystallized, substructured, and deformed microstructures is 2.77%, 0.62%, and 96.61%, respectively. After aging at 450 °C, the proportion of recrystallized, substructured, and deformed microstructures is 1.62%, 0.28%, and 98.10%, respectively. The proportion changes in the three microstructures are small compared with those of the samples after natural aging. However, after aging at 600 °C, the proportion changes in the three microstructures in the sample are significant. The proportion of the recrystallized microstructure is as high as 85.27%, and the proportion of the deformed microstructure is only 4.35%, while the proportion of the substructured microstructure is 10.38%. In addition, it is found that a large number of annealing twins appear in the sample after aging at 600 °C based on the twinned crystal data statistics in Figure 2e, while there are almost no twins in the samples aged at other temperatures.

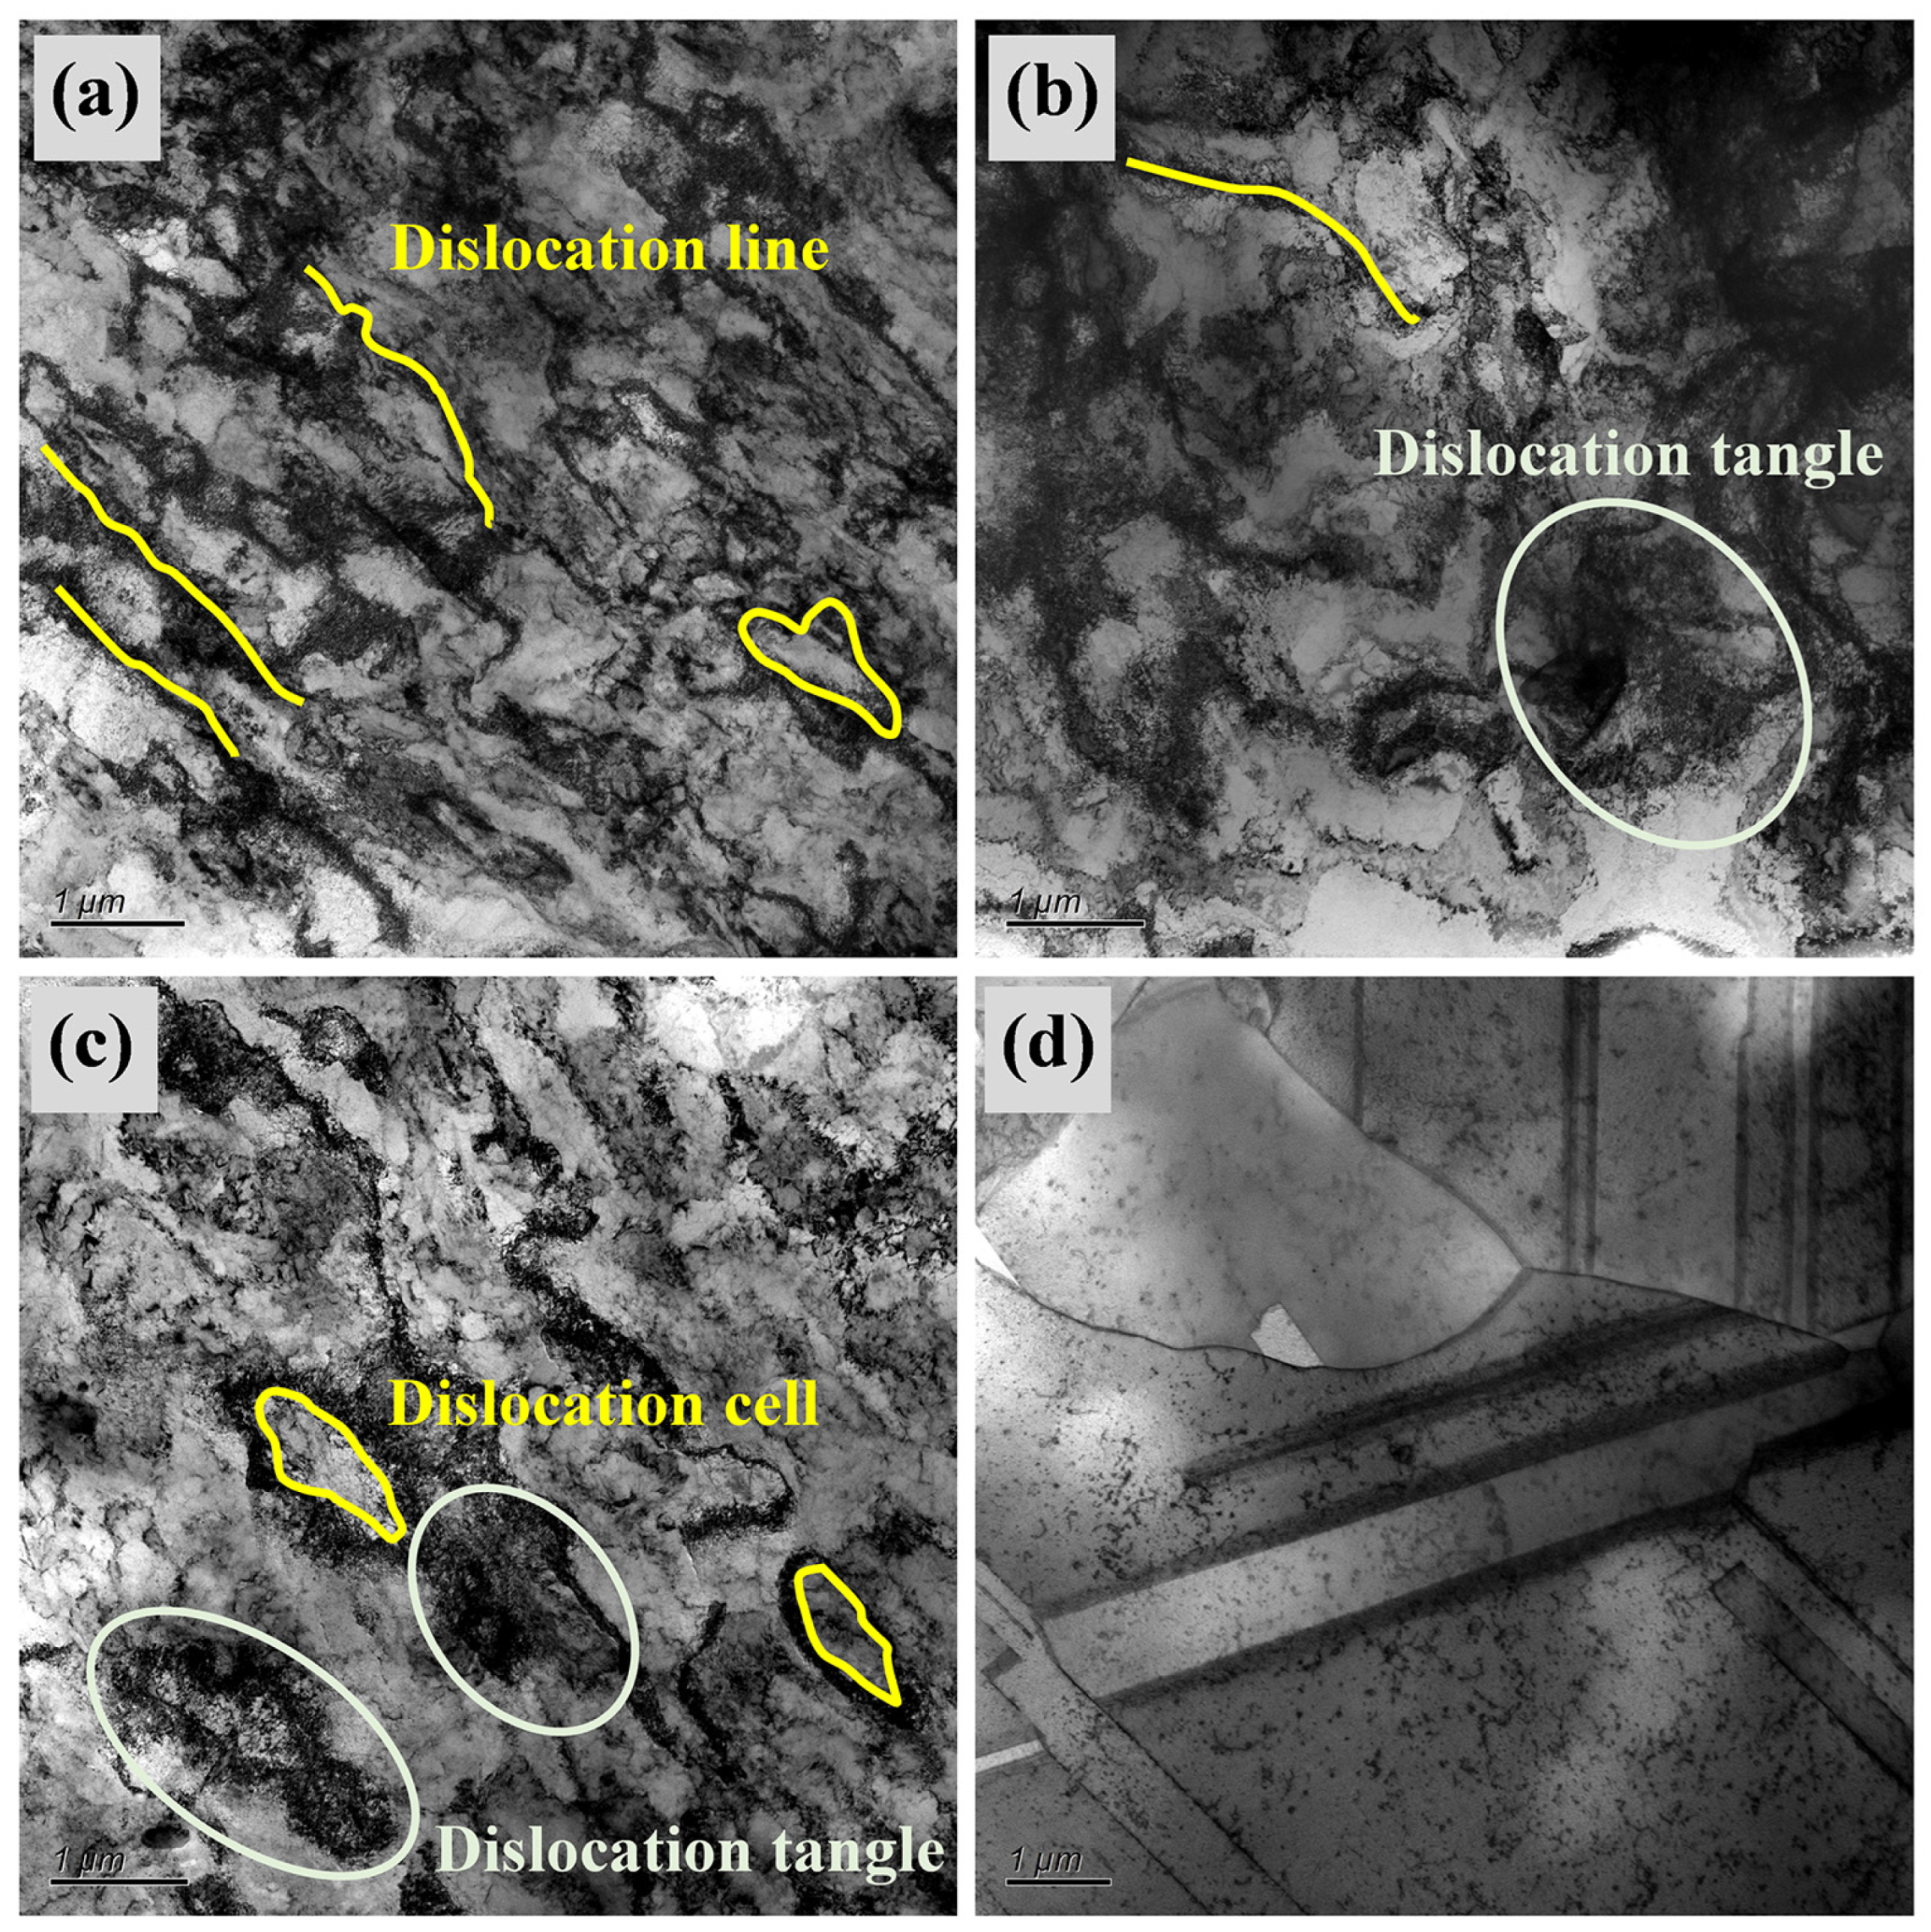
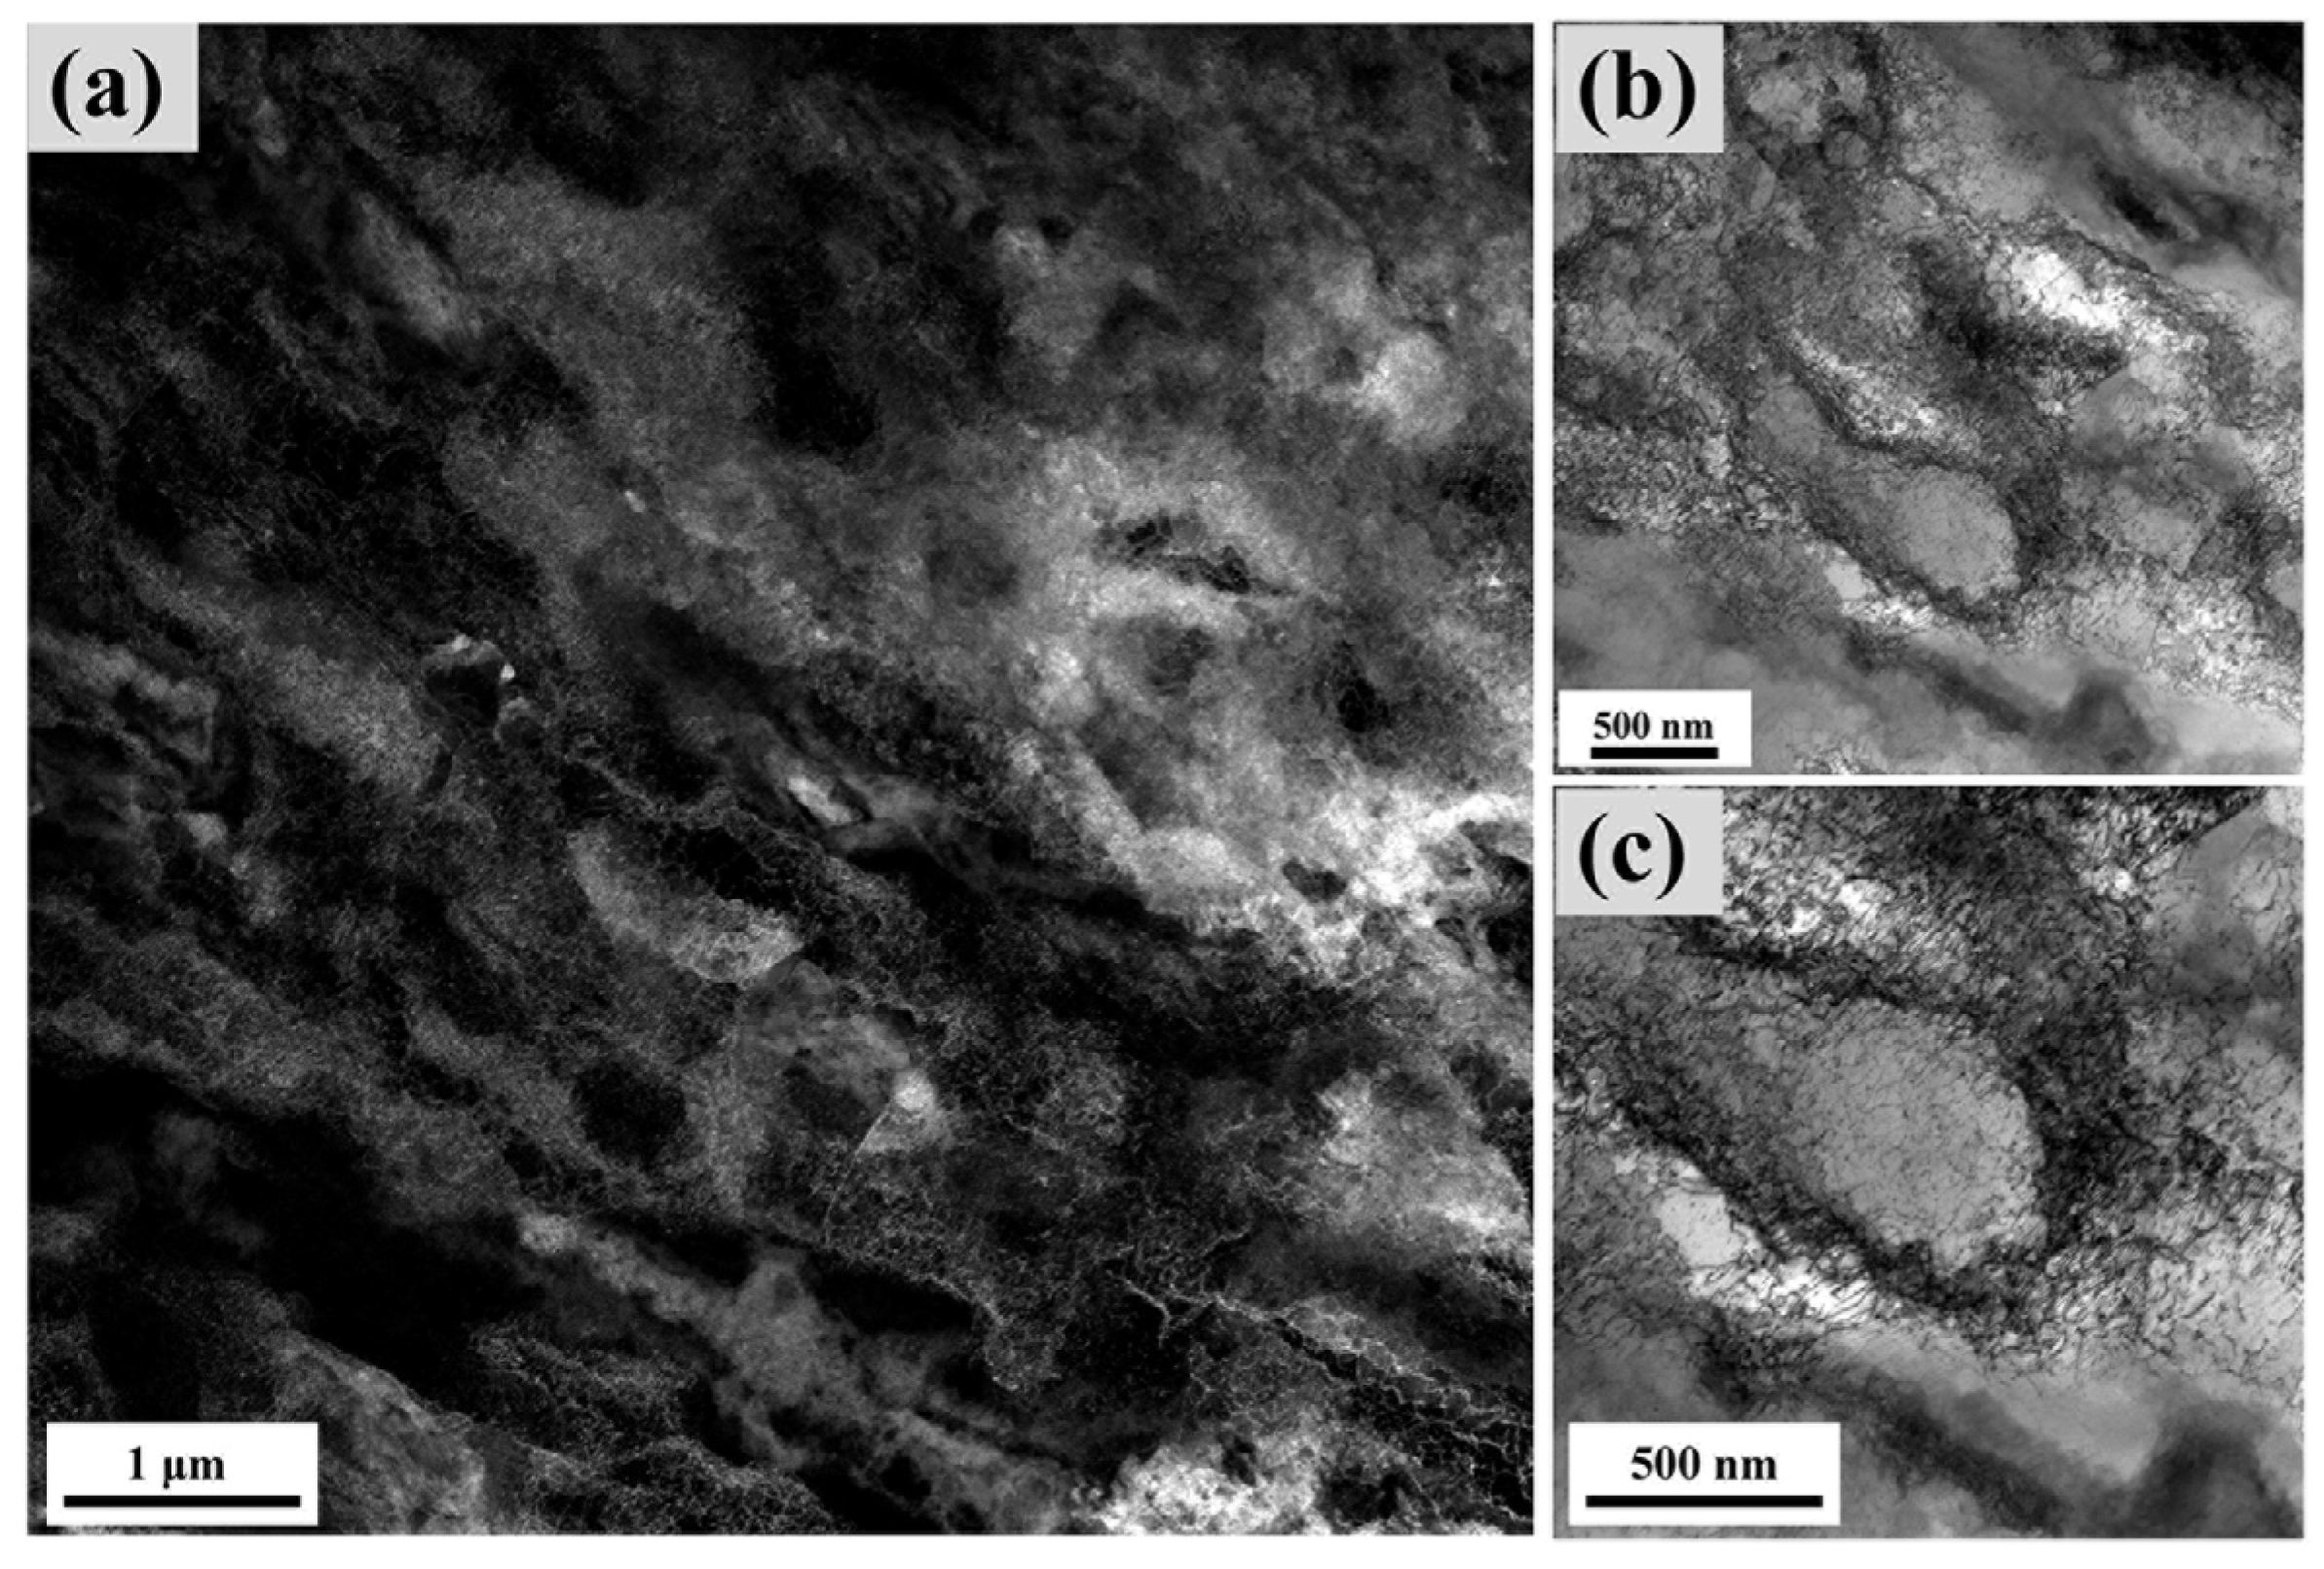
3.2. The Influence of Aging Temperature on Dislocations and Schmid Factor

The local misorientation distribution diagrams of the alloy at different aging temperatures are shown in Figure 3a–d. The local misorientation can qualitatively reflect the uniformity of plastic deformation, and the larger its value, the higher the defect density [11]. From Figure 3a–c, it can be found that the alloys aged at 25 °C, 300 °C, and 450 °C all have higher average local misorientation values. This indicates that all three samples have high dislocation density and a strong dislocation enhancement effect. However, when the alloy is aged at 600 °C, the average local misorientation of the sample is 0.25, indicating that the dislocation density in the material is very low and the dislocation strengthening effect is weak [12,13].
Figure 4a–d show the microstructures of dislocations in the Cu-Cr-Ag-Si alloy at different aging temperatures observed under transmission electron microscopy (TEM), including room temperature, 300 °C, 450 °C, and 600 °C. After undergoing severe plastic deformation through cold rolling, the alloy produces a large number of dislocation structures such as dislocation walls, dislocation cells, and dislocation tangles, which can generate a work hardening effect, increase the flow stress of the alloy, and enhance its mechanical properties [14]. As shown in Figure 4a–c, a large number of dislocation tangles, dislocation walls, and dislocation cells were found after aging. However, as shown in Figure 4d, no dislocation interaction structure was found in the sample aged at 600 °C; only scattered dislocations were present. Combining the results of Figure 3 and Figure 4, it can be seen that the dislocation interaction structures generated by plastic deformation can be preserved after aging at room temperature, 300 °C, and 450 °C, thereby preserving the dislocation strengthening effect. However, after aging at 600 °C, dislocations undergo annihilation, resulting in a sharp decrease in dislocation density and the disappearance of the dislocation strengthening effect.
Figure 5 shows the distribution of Schmid factors on the {111} [1,2,3,4,5,6,7,8,9,10] slip system in the Cu-Cr-Ag-Si alloy after different aging temperatures. The essence of plastic deformation in alloys is the slip and climb of dislocations, and the higher the Schmid factor, the greater the probability of slip system activation [15]. Analyzing the changes in Schmid factor values under different aging temperatures can predict the material’s plastic deformation ability to some extent. According to Figure 5, an increase in aging temperature can cause an increase in the high-value Schmid factor frequency. The higher the high-value Schmid factor frequency, the softer the material, and the easier it is for dislocations to move under stress. After aging at 300 °C, the frequency of the Schmid factor values within the range of 0.40–0.48 noticeably increases, while after aging at 600 °C, the frequency of the Schmid factor values within the range of 0.45–0.50 noticeably increases. However, the distribution of the Schmid factor values after aging at 450 °C shows little change compared to that after natural aging. From the relationship between the Schmid factor and plastic deformation, it can be seen that after aging at 300 °C and 600 °C, dislocations in the material are more likely to move, making the material more prone to plastic deformation.
Based on the changes in local misorientation, precipitation behavior, and Schmid factor at different aging temperatures, it can be concluded that the precipitation strengthening effect is insufficient when the Cu-Cr-Ag-Si alloy is aged at 300 °C. The hindering effect on dislocations during the aging process is relatively small, and dislocation annihilation occurs in the material. So, the average value of local misorientation decreases, while the Schmid factor increases. After aging at 450 °C, the precipitated phases effectively prevent dislocation annihilation during the aging process. The average local misorientation remains the same as the value after natural aging, effectively preserving a strong work hardening effect. After aging at 600 °C, the dislocation density decreases rapidly, resulting in the disappearance of work hardening in the material. The Schmid factor shows a sharp increase.

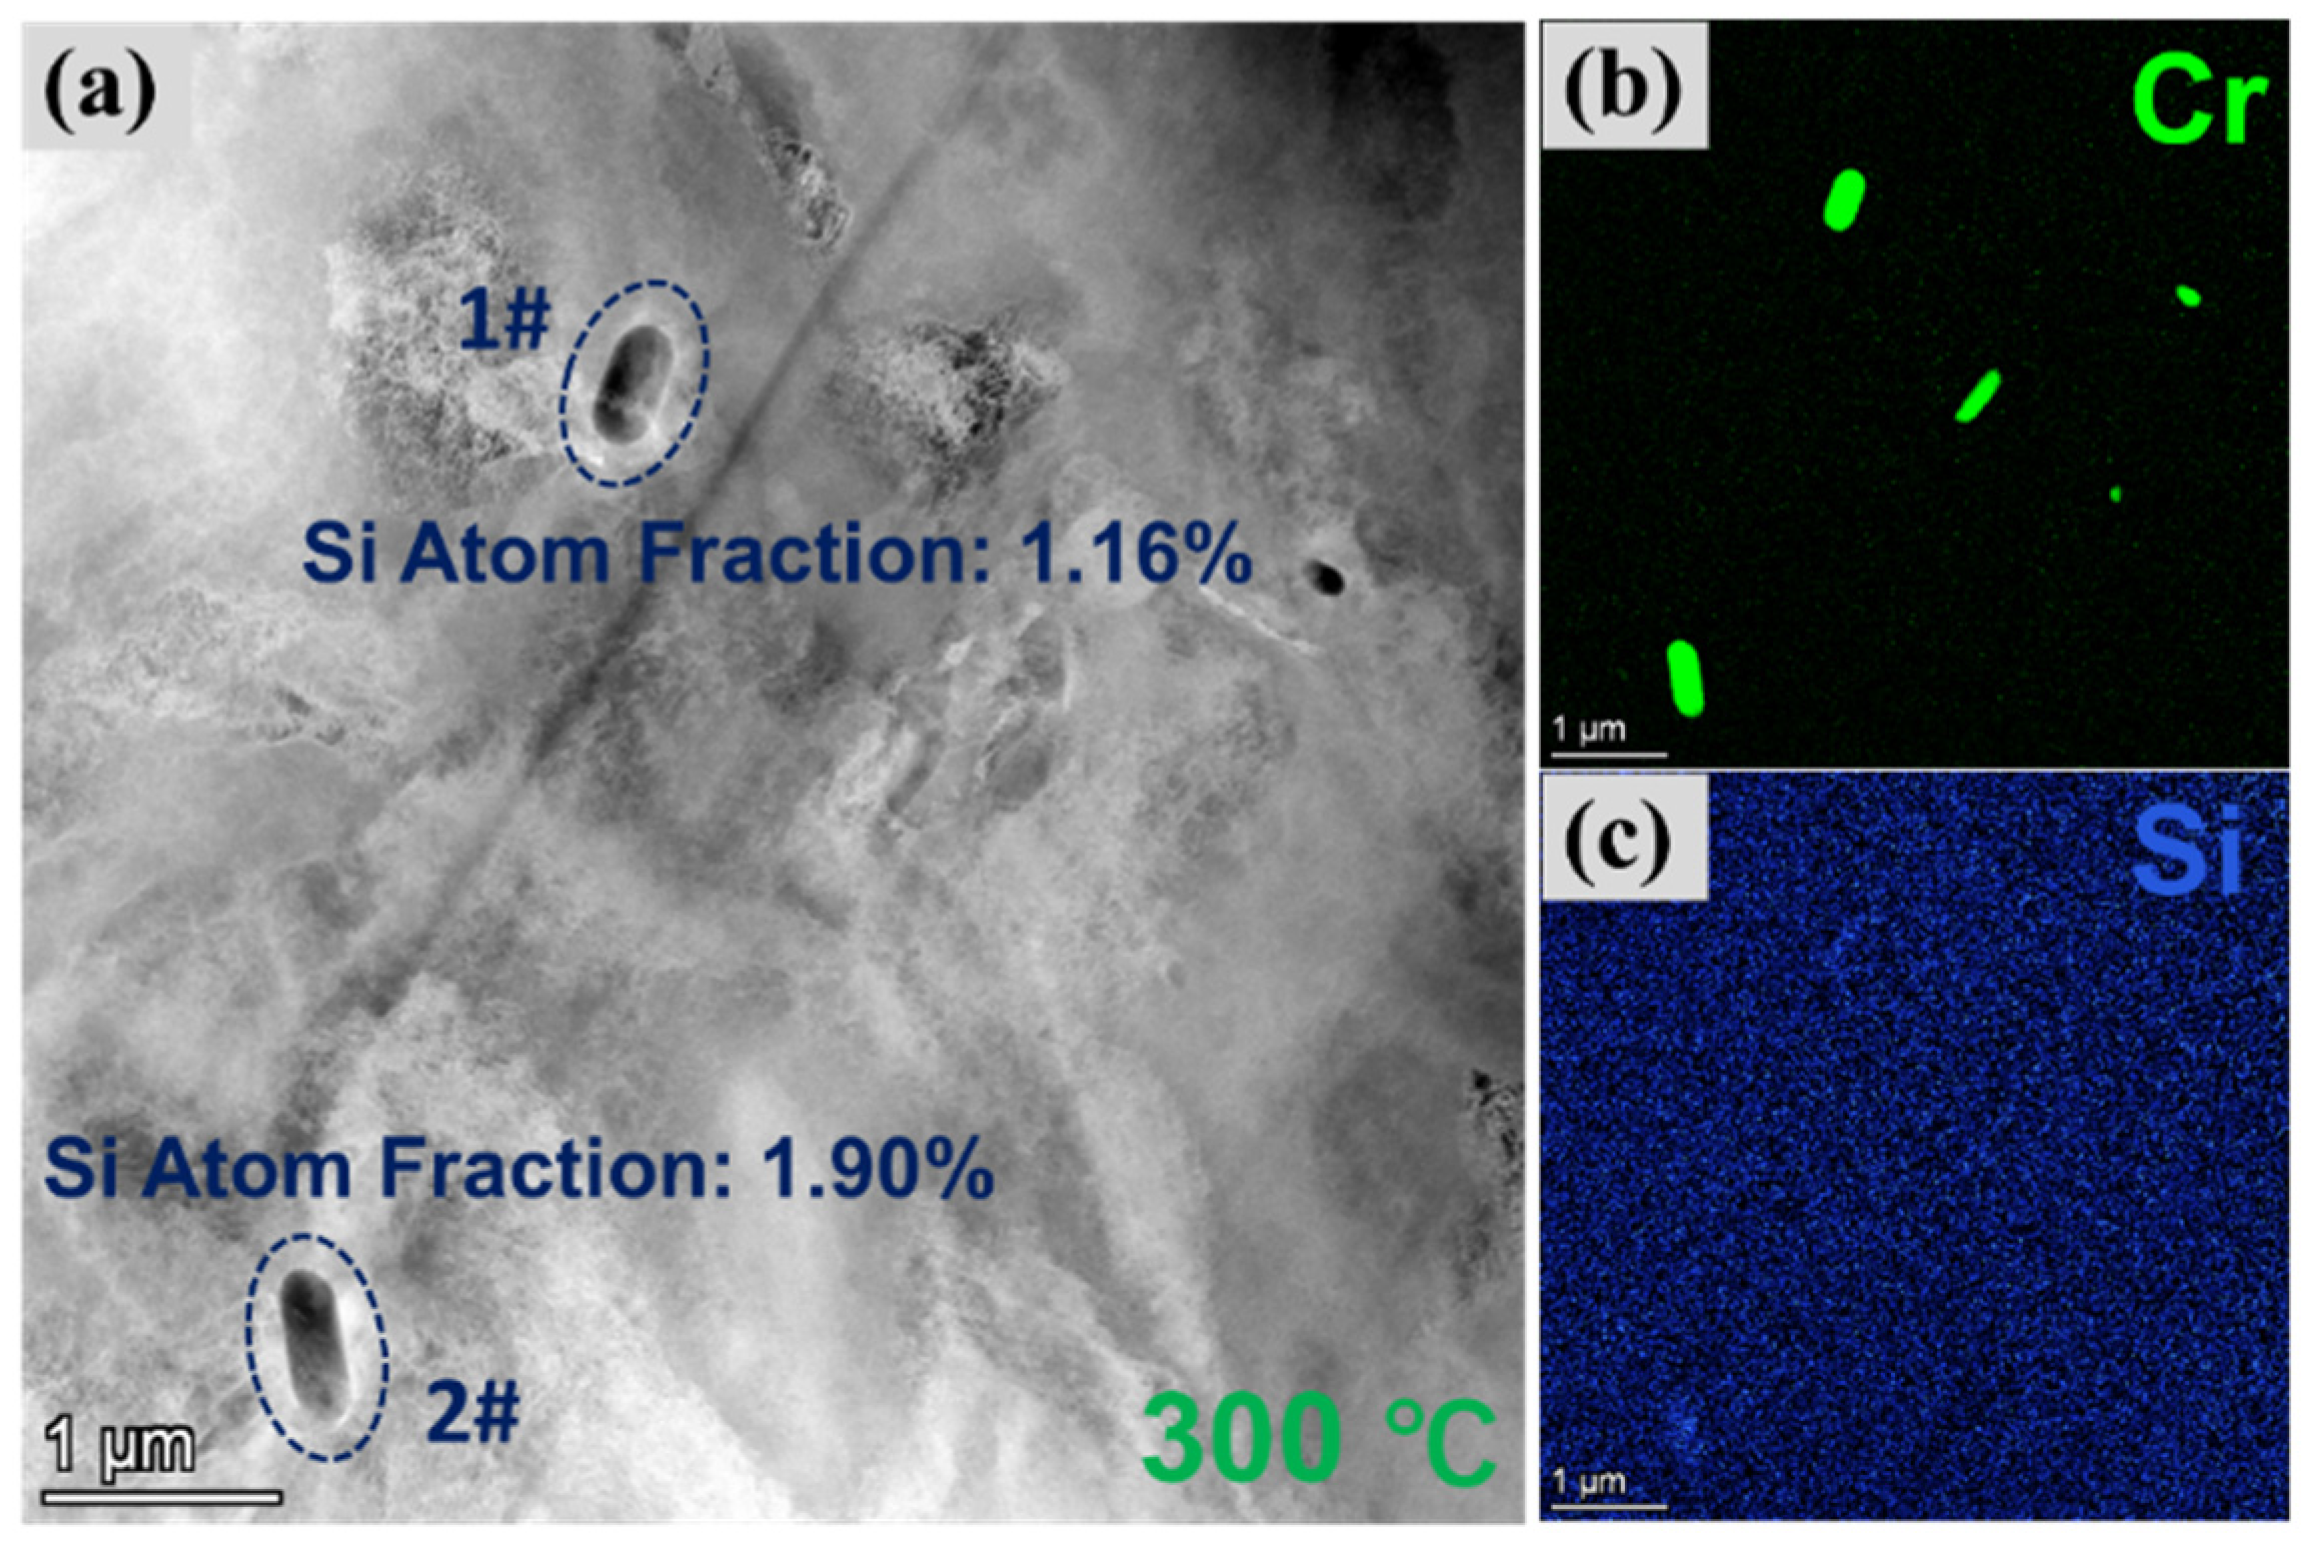
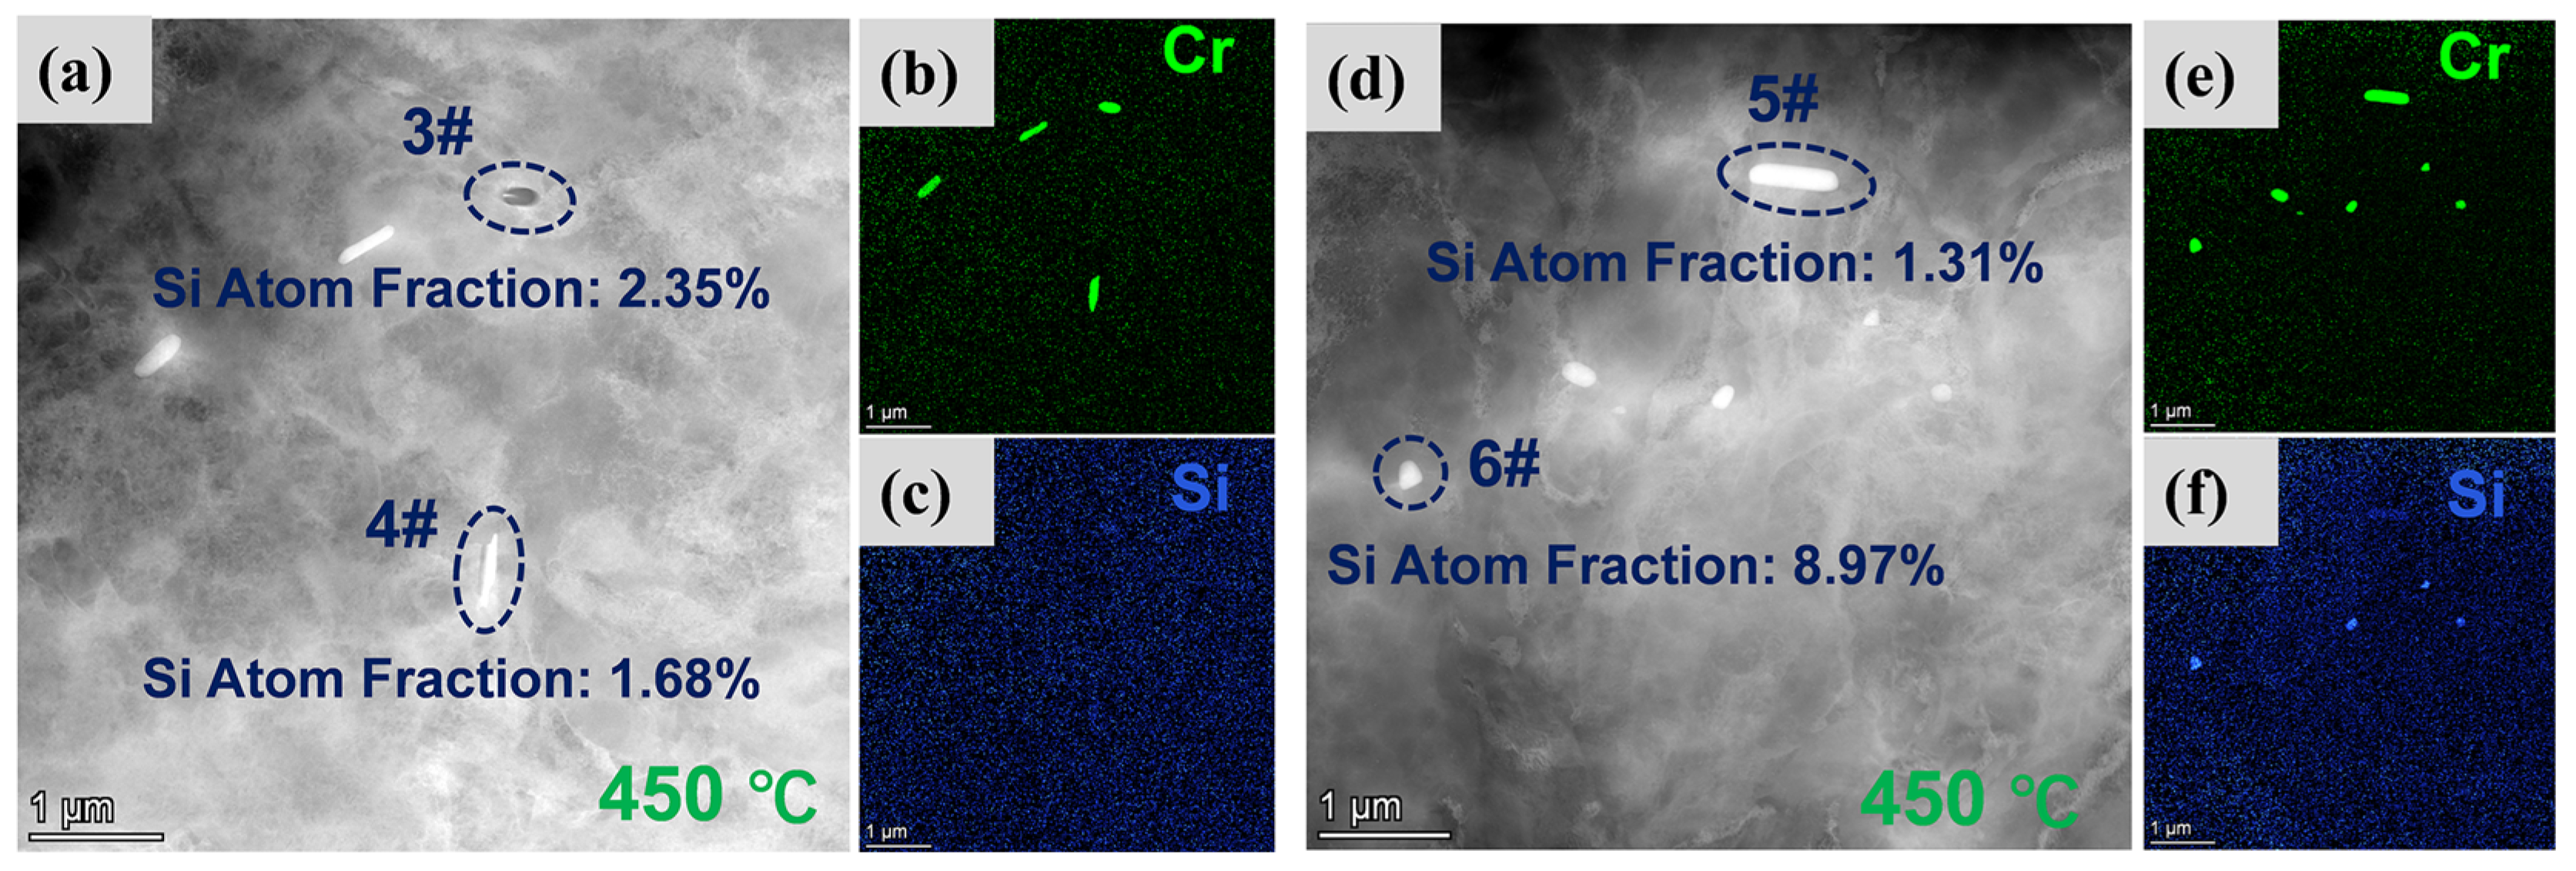
3.3. The Influence of Aging Temperature on Precipitated Phases

Figure 6 illustrates the TEM microstructures of the Cu-Cr-Ag-Si alloy at different scales, with the aging temperature at room temperature. In Figure 6a–c, the scales are 1 μm, 500 nm, and 200 nm, respectively. Based on the TEM micrographs, no apparent precipitated phases were observed in the microstructure with a scale of 1 μm. Further magnification was employed to search for precipitated phases, but no significant presence of precipitated phases was detected at scales of 500 nm and 200 nm. Characterization results revealed the presence of high dislocation density and abundant dislocation interaction structures, such as dislocation walls, dislocation cells, and dislocation tangles. The material was subjected to a solution treatment (water quenching) to form a supersaturated solid solution. Due to the low temperature of natural aging, the supersaturated solid solution is unable to decompose and form precipitated phases. Therefore, the presence of precipitated phases in the material is rarely observed.
Figure 7 presents the TEM microstructure and elemental distribution maps of the Cu-Cr-Ag-Si alloy after aging at 300 °C. The presence of precipitated phases is observed after aging, with the main constituent being Cr. Randomly selected precipitated phases were analyzed, and a semi-quantitative atomic fraction analysis of Si in the precipitated phases was performed. The results, indicated in Figure 7a, show a Si atomic fraction of 1.16% and 1.90%, respectively. This indicates that the Si content in the Cr precipitated phase is relatively low after aging at 300 °C.
Figure 8 depicts the TEM microstructure and elemental distribution maps of the Cu-Cr-Ag-Si alloy after aging at 450 °C. Based on Figure 8, it is evident that a significant number of precipitate phases appear in the alloy after aging. The precipitated phases primarily consist of Cr, but in some of the precipitated phases, an enrichment of Si is observed, forming the Cr-Si composite precipitated phase. Randomly selected precipitated phases in Figure 8a,d were analyzed for a semi-quantitative atomic fraction percentage of Si. The results indicate Si atomic fraction percentages of 2.35%, 1.67%, and 1.31% in Cr precipitated phases with low Si content and a Si atomic fraction percentage of 8.97% in Cr-Si precipitated phases with high Si content. This suggests a noticeable increase in Si content in some Cr precipitated phases after aging at 450 °C. The material exhibits two types of coexisting precipitate phases: one with lower Si content, identified as Cr precipitates, and the other with higher Si content, identified as Cr-Si precipitates.
Figure 9 displays the TEM microstructure and elemental distribution maps of the Cu-Cr-Ag-Si alloy after aging at 600 °C. After aging, the alloy exhibits both Cr precipitated phases and Cr-Si precipitated phases. There is a significant presence of Cr-Si precipitated phases in the material, with Si atomic fraction percentages of 9.43% and 9.71%, respectively. Additionally, the copper matrix shows a noticeable enrichment of Fe and Ti elements. This indicates a pronounced enrichment of Cr, Fe, Si, and Ti elements after aging at 600 °C and the occurrence of numerous Cr-Si composite precipitate phases with high Si content.

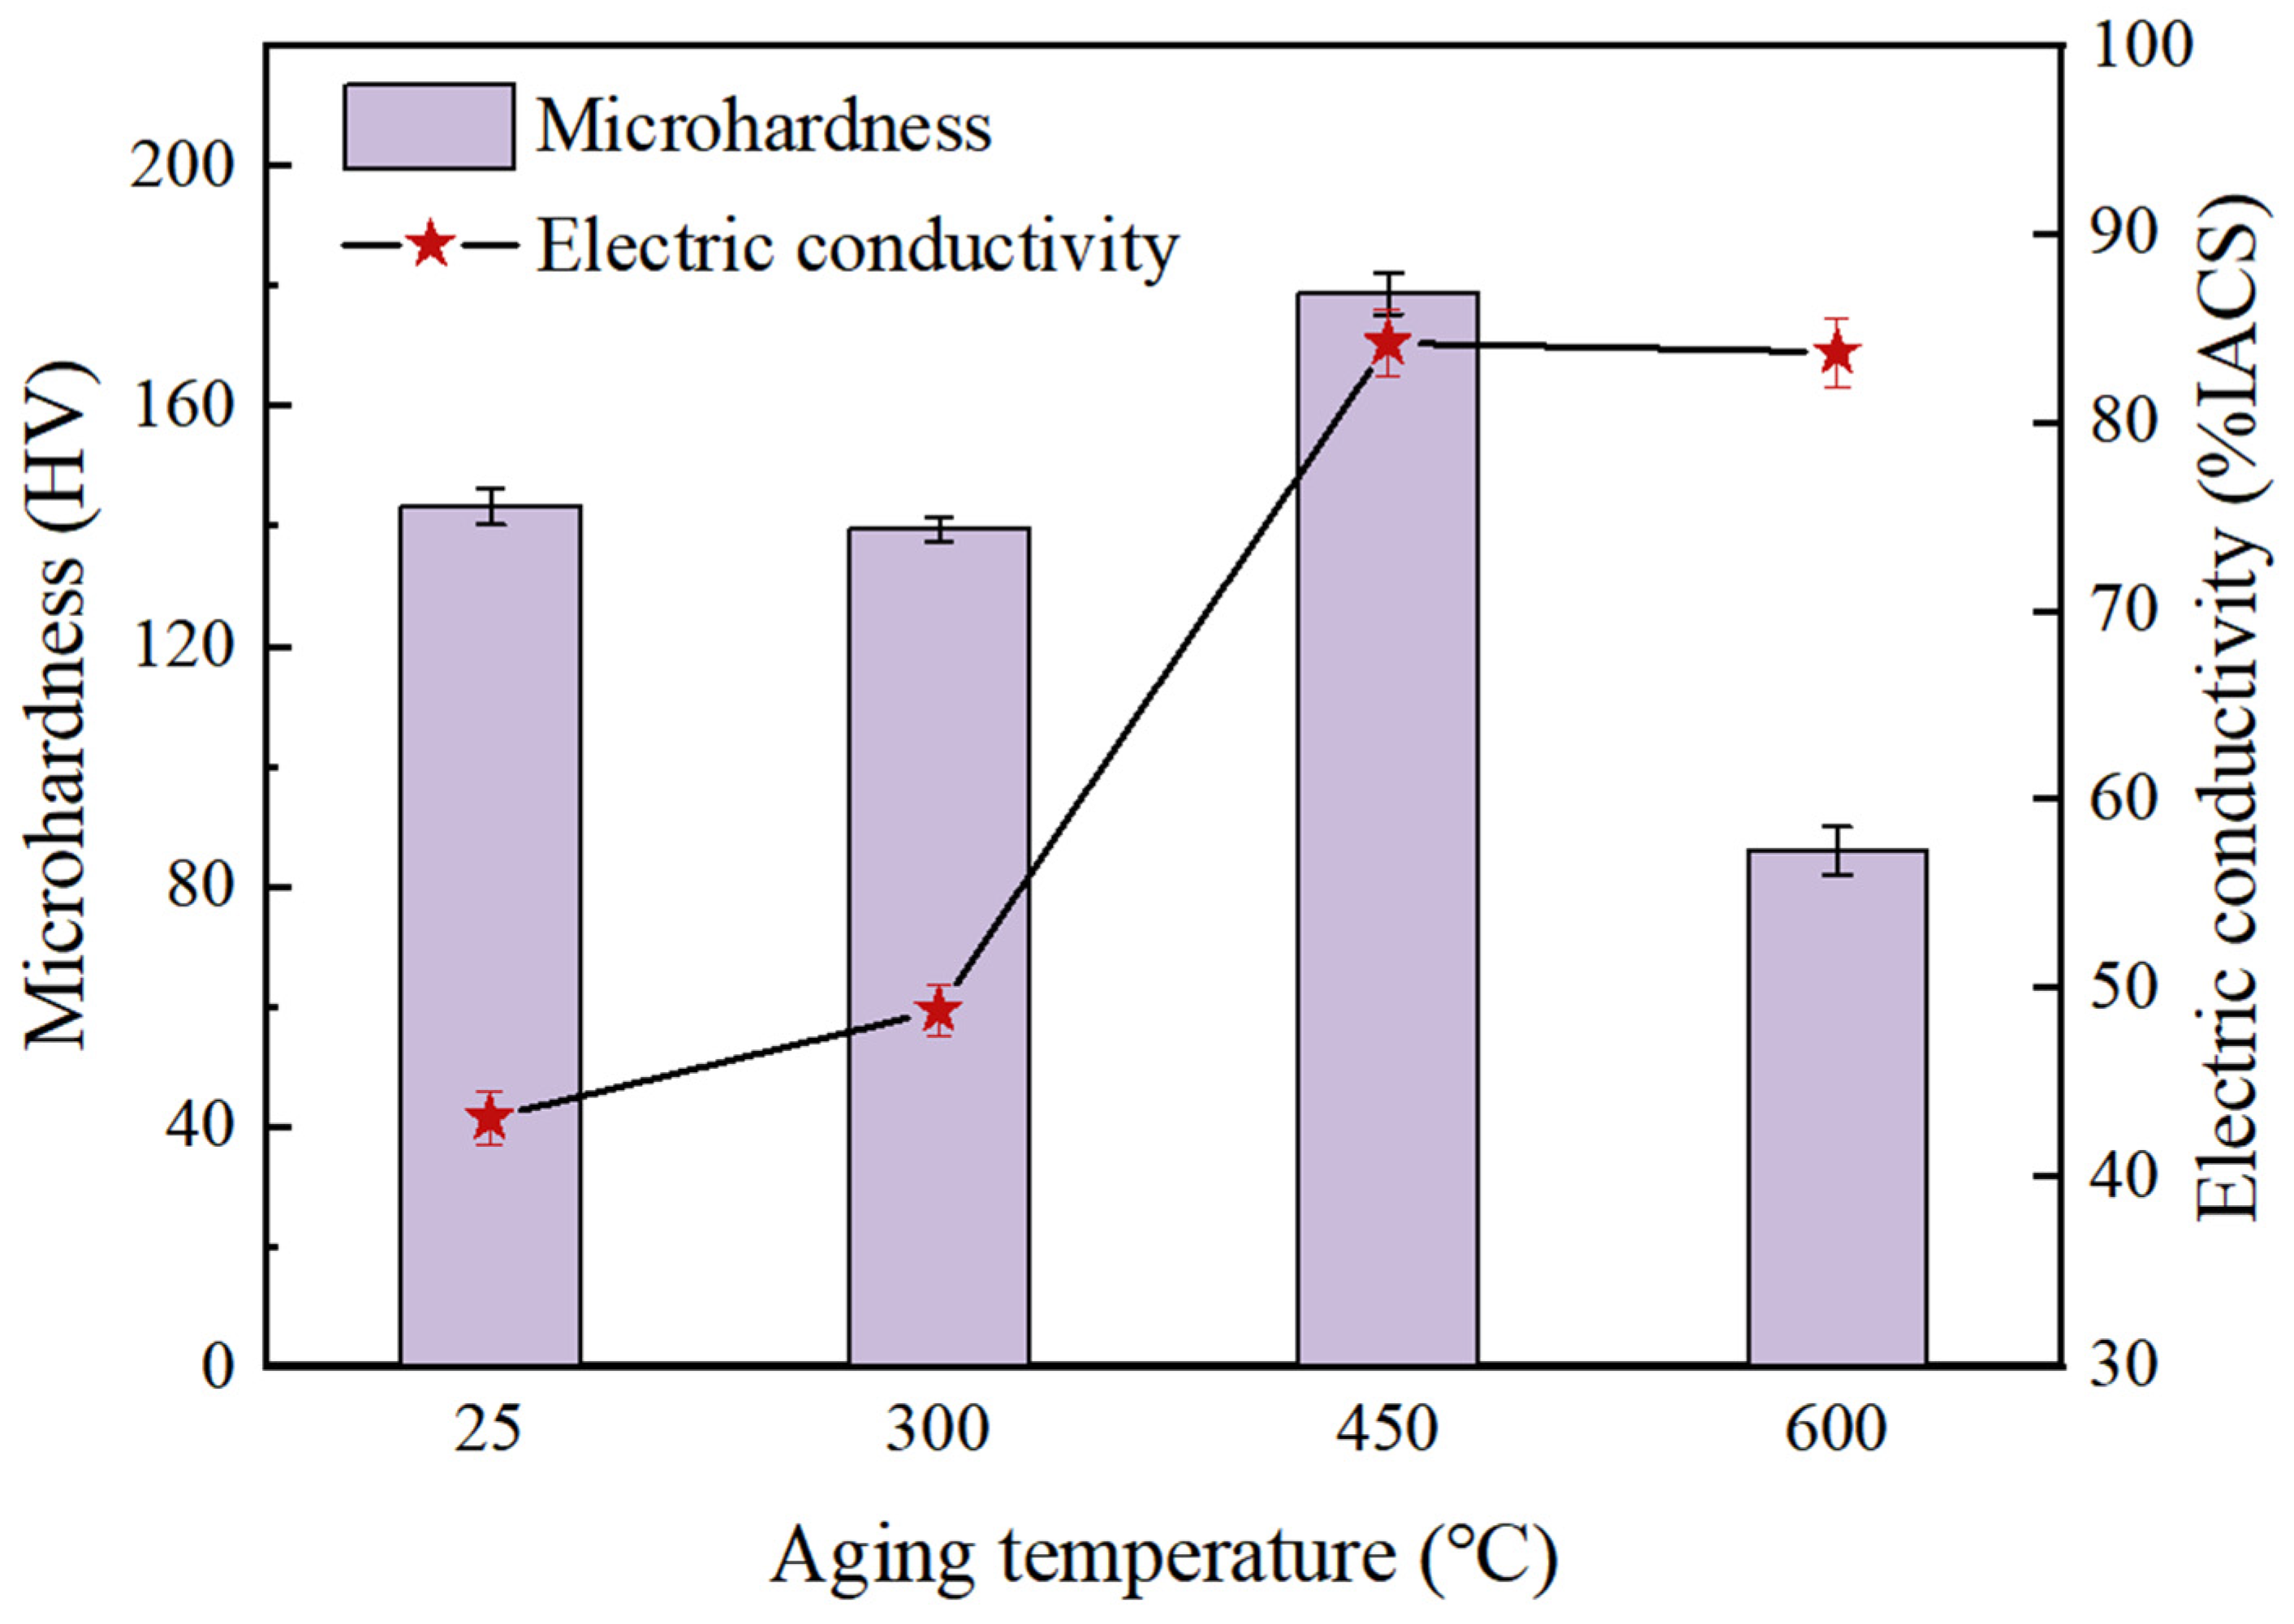
3.4. Relationship between Microstructure and Properties at Different Aging Temperatures

Figure 10 represents the variation in the microhardness and electrical conductivity of the Cu-Cr-Ag-Si alloy at different aging temperatures. From the column chart in Figure 10, it can be observed that the microhardness of the Cu-Cr-Ag-Si alloy initially increases and then decreases with the increase in aging temperature. The highest microhardness value of 178.72 HV is achieved after aging at 450 °C. There is no significant increase in microhardness after aging at 300 °C, which is related to the variation in the dislocation strengthening effect. After aging at 600 °C, the microhardness significantly decreases to only 85.96 HV, which is associated with recrystallization. Combining the changes in the microstructure discussed in Section 3.1, Section 3.2 and Section 3.3, it can be concluded that at 300 °C, the aging temperature is relatively low, resulting in weak age-hardening effects. Moreover, dislocation annihilation occurs, partially weakening the work hardening effect. These combined factors contribute to the lack of significant improvement in microhardness after aging at 300 °C. At 600 °C, the high aging temperature leads to recrystallization, resulting in the loss of dislocation strengthening effect, leading to a sharp decrease in microhardness [16,17].
According to the linear graph in Figure 10, the electrical conductivity of the Cu-Cr-Ag-Si alloy shows an increasing trend with higher aging temperatures. After aging at 450 °C, the electrical conductivity of the Cu-Cr-Ag-Si alloy reaches a high value of 84.2% IACS. The rise in electrical conductivity can be primarily attributed to the precipitation of solute atoms in the matrix after aging as the formation of precipitated phases reduces the scattering of electrons by solute atoms. On the other hand, it is also related to the number of grain boundaries in the material. Previous studies [18] have investigated the influence of grain boundaries on the electrical conductivity of copper wires, indicating a significant impact of the number of grain boundaries on resistivity, exhibiting an exponential relationship. The resistivity increases with an increase in the number of grain boundaries. Additionally, the resistivity is influenced by the type of grain boundary structure, with the highest resistivity observed in low-angle grain boundaries, which is twice as high as that of high-angle tilt boundaries. After aging at 600 °C, the average electrical conductivity is 83.7% IACS, which is lower than that after aging at 450 °C. This is because recrystallization occurs in the material after aging, resulting in an increased number of grain boundaries and an increased scattering of electrons [19,20].
Figure 11 illustrates the variations in the tensile strength, yield strength, and remaining stress of Cu-Cr-Ag-Si alloy at different aging temperatures. The stress relaxation experiment was conducted with an initial stress of 0.5%Rp0.2 at a temperature of 194.7 °C for a loading time of 24 h. It is observed that the tensile strength and yield strength of the Cu-Cr-Ag-Si alloy exhibit an increasing trend followed by a decreasing trend with increasing aging temperature. After aging at 450 °C, the tensile strength and yield strength reach their maximum values of 495.25 MPa and 473.54 MPa, respectively, indicating a significant age-hardening effect. After aging at 300 °C, there is no significant improvement in tensile strength and yield strength. This cause of phenomenon is consistent with the previously mentioned microhardness changes and may be attributed to the simultaneous occurrence of under-aging precipitation and dislocation annihilation at relatively low temperatures, resulting from the interaction of these two phenomena.
After aging at 600 °C, the tensile strength and yield strength decrease significantly to 282.97 MPa and 147.94 MPa, respectively, compared to the samples aged at 450 °C. This decline in mechanical properties is due to recrystallization that occurs at the high aging temperature of 600 °C, resulting in the disappearance of the strengthening effect of dislocations and weakening of the age-hardening effect. Furthermore, the yield ratio is approximately 95% for samples aged at 25 °C, 300 °C, and 450 °C, while it decreases to only about 52% for samples aged at 600 °C. This indicates that the material retains the effect of work hardening effectively after aging at relatively low temperatures ranging from 25 °C to 450 °C. However, the effect of work hardening disappears after aging at 600 °C, leading to a drastic decrease in the mechanical properties of the experimental material.
From the linear graph in Figure 11, it can be observed that the remaining stress of the Cu-Cr-Ag-Si alloy exhibits an increasing trend followed by a decreasing trend with increasing aging temperature, and after aging at 450 °C, the residual stress after 24 h of loading still reaches the maximum value of 91.12% of the initial stress. Here, compared with the ratio of the remaining stress to the initial stress of the Cu-Cr alloy and the Cu-Cr-Si alloy developed by Du et al. [9] after 14 h of loading under the same working condition, which is 81.04% and 84.73%, the stress relaxation resistance of the Cu-Cr-Ag-Si alloy under the control of aging process parameters is significantly improved. The increase in the remaining stress is mainly attributed to the formation of precipitated phases due to the precipitation of solute atoms in the matrix after aging. These precipitated phases increase the resistance to dislocation motion, thereby enhancing the deformation resistance and improving the stress relaxation performance [21,22]. However, after aging at 600 °C, the remaining stress decreases sharply. This could be attributed to the disappearance of dislocation strengthening, resulting in a reduction in the resistance to dislocation motion in the material and a drastic decrease in deformation resistance, leading to easier stress relaxation. Furthermore, the material exhibits optimal properties after aging at 450 °C. The microhardness reaches 178.72 HV, the tensile strength is 495.25 MPa, the electrical conductivity is 84.2% IACS, and the remaining stress is 91.12%. These exceptional performance indicators make it highly suitable for connector contact materials.

3.5. Analysis of Stress Relaxation Resistance

To investigate the influence of different temperatures on the stress relaxation behavior of the Cu-Cr-Ag-Si alloy, a comprehensive analysis was conducted, focusing on the effects of strengthening mechanisms on the flow stress and threshold stress at various aging temperatures. Performance and microstructural analysis revealed that the main strengthening mechanisms present in the material are work hardening and precipitation hardening, both of which contribute to the enhancement of the alloy’s flow stress [23,24,25,26]. Flow stress refers to the minimum stress required for the continuous movement of dislocations through a crystal and is generally similar to the material’s yield strength. A higher flow stress indicates greater resistance to dislocation motion in the material, resulting in higher yield strength and improved stress relaxation resistance. Work hardening is essentially the enhancement of flow stress through an interaction between dislocations, whereas precipitation hardening involves an interaction between the precipitated phase and dislocations, leading to an increase in the material’s rheological stress.
The Taylor equation expresses the influence of dislocation density on the flow stress of a material. The contribution of dislocation density to the flow stress is given by Equation (1) [27].
Δ σ ε = α MGb ρ ε 1 2
where Δ σ ε is the true flow stress, ε is the true strain, α is a hardening parameter, M is the Taylor factor of the Cu matrix, G is the shear modulus and b is the magnitude of the Burgers vector.
After aging at 450 °C, the precipitation phase in the alloy consists of the Cr precipitated phase and Cr-Si precipitated phase. These precipitated phases are known to exhibit cutting and bypass mechanisms, respectively. The contribution of the cutting mechanism to the flow stress of the alloy is typically calculated using the coherency strengthening formula. The contribution of the coherency-strengthening mechanism to the flow stress of the alloy is represented by Equation (2) [28].
Δ σ c = α MG ε 3 2 fr b 1 2
where Δ σ c   represents the increment in flow stress caused by the cutting mechanism (MPa) [28]. G stands for the shear modulus of the matrix, ε denotes the mismatch strain, and f represents the volume fraction of precipitated phases.
The contribution of the bypass mechanism to the flow stress can be represented by Equation (3) [29].
Δ σ c = 0.18 Gb 2 π 1 ν 1 2 ln 2 r b λ 2 r
where Δ σ c is the increase in flow stress caused by the Orowan mechanism (MPa) [29]. G is the matrix shear modulus, r is the radius of the precipitated phase, ν is the Poisson’s ratio, b is the size of the Burgers vector of the copper matrix, and λ is the average spacing between the precipitated phases.
An analysis of the variables in the three strengthening formulas mentioned above reveals that flow stress is primarily influenced by dislocation density, precipitate diameter, and volume fraction. The changes in yield strength at different temperatures generally reflect the variations in flow stress. Based on the analysis of the strengthening formulas and the changes in yield strength, it can be observed that stronger work hardening and precipitation strengthening effects result in higher flow stress. Figure 11 illustrates the variations in yield strength and stress relaxation resistance of the material at different temperatures. Using the material’s properties after natural aging as the control group, in the case of the Cu-Cr-Ag-Si alloy aged at 300 °C, the yield strength did not show a significant increase, while the remaining stress significantly increased. Analyzing the characterization results of the microstructure, the decrease in the average value of local misorientation represents a decrease in the work hardening effect to some extent. The formation of precipitated phases represents the occurrence of precipitation strengthening, and the increase in the Schmid factor indicates an increase in the mobility of dislocations. The comprehensive results show that the change in flow stress of the material is small, while the precipitates act as pinning points, and the threshold stress increases. Therefore, the yield strength of the material is not significantly improved, but the stress relaxation resistance is significantly improved. The effect of precipitation strengthening on stress relaxation resistance is more significant.
For the Cu-Cr-Ag-Si alloy aged at 450 °C, both the yield strength and remaining stress increase significantly. There is little change in the average value of local misorientation and the Schmid factor, but a large number of precipitated phases are formed in the material. The performance improvement is attributed to the significant precipitated phase hindering the annihilation of existing dislocations during the aging process, resulting in the combined effects of work hardening and precipitation strengthening [30,31,32,33]. Consequently, both the flow stress and threshold stress of the material are effectively enhanced. After aging at 600 °C, the yield strength and remaining stress of the Cu-Cr-Ag-Si alloy experience a sudden decline. The significant reduction in the average value of local misorientation and the significant increase in the frequency of the Schmid factor indicates that the work hardening effect is minimal at 600 °C, causing the material to soften and the flow stress and threshold stress to decrease sharply.
Based on the experimental results and analysis mentioned above, both work hardening and precipitation strengthening can enhance the yield strength and stress relaxation resistance of a Cu-Cr-Ag-Si alloy. These two types of reinforcement essentially increase the resistance to dislocation motion, thereby improving the mechanical properties of the material. The stress relaxation behavior of the material is fundamentally the transition from elastic deformation to plastic deformation, which is caused by dislocation motion. The synergistic effect of work hardening and precipitation strengthening raises the threshold stress for dislocation motion and increases the resistance to dislocation initiation.

4. Conclusions

In this paper, taking a Cu-Cr-Ag-Si alloy for connectors as the research object, the effect of aging temperature on the microstructure and stress relaxation resistance of the Cu-Cr-Ag-Si alloy was studied. The effects of precipitate phase and dislocation evolution on stress relaxation performance is emphatically analyzed. This paper can provide theoretical guidance for the development of a copper alloy with high stress relaxation resistance for connectors. The key findings of the present study are summarized as follows:
(1)
Under the experimental parameters in this paper, the Cu-Cr-Ag-Si alloy shows superior properties after aging at 450 °C. The alloy has a tensile strength of 495.25 MPa, an electrical conductivity of 84.2% IACS, and a residual stress of 91.12% at 195 °C, making it very suitable as a connector contact sheet material.
(2)
When aging at a low temperature, the precipitates of the alloy are mainly the Cr phase. With the increase in aging temperature, the proportion of Cr-Si composite precipitates in the alloy increases significantly. The strengthening mechanism after aging at 450 °C is the synergistic effect of work hardening and precipitation.
(3)
Work hardening and precipitation strengthening increased the flow stress and enhanced the deformation resistance of the alloy. Precipitation strengthening raised the threshold stress of the alloy, enhanced the resistance of dislocation motion, and significantly improved the stress relaxation resistance of the alloy.

Author Contributions

Conceptualization, H.L. and L.L.; methodology, H.L. and G.W.; software, G.W.; validation, L.L. and G.W.; formal analysis, G.W.; investigation, G.W. and L.L.; resources, H.L.; data curation, Y.L.; writing—original draft preparation, L.L.; writing—review and editing, H.L. and Y.L.; visualization, L.L.; supervision, Y.L.; project administration, H.L.; funding acquisition, H.L. All authors have read and agreed to the published version of the manuscript.

Funding

This work was supported by the Henan key research and development project (221111230600), the Luoyang major science and technology innovation special project (2201017A), and National Natural Science Foundation of China (52071133).

Institutional Review Board Statement

Not applicable.

Informed Consent Statement

Not applicable.

Data Availability Statement

The raw data supporting the conclusions of this article will be made available by the authors on request.

Conflicts of Interest

The authors declare no conflicts of interest.

References

  1. Krüger, K.; Yuan, H.; Song, J. The Influence of the Vibration Test Mode on the Failure Rate of Electrical Connectors. Microelectron. Reliab. 2022, 135, 114567. [Google Scholar] [CrossRef]
  2. Buggy, M.; Conlon, C. Material Selection in the Design of Electrical Connectors. J. Mater. Process. Technol. 2004, 153–154, 213–218. [Google Scholar] [CrossRef]
  3. Weber, M.; Helm, D. Prediction of the Behaviour of Copper Alloy Components under Complex Loadings by Electro-Thermomechanical Coupled Simulations. Mater. Sci. Technol. 2020, 36, 899–905. [Google Scholar] [CrossRef]
  4. Stobrawa, J.; Ciura, L.; Rdzawski, Z. Rapidly Solidified Strips of Cu-Cr Alloys. Scr. Mater. 1996, 34, 1759–1763. [Google Scholar] [CrossRef]
  5. Varol, T.; Güler, O.; Akçay, S.B.; Çolak, H. The Evolution of Microstructure and Properties of Cu-Cr Alloys Synthesized via Flake Powder Metallurgy Assisted by Mechanical Alloying and Hot Pressing. Mater. Today Commun. 2022, 33, 104452. [Google Scholar] [CrossRef]
  6. Du, Y.; Zhou, Y.; Song, K.; Huang, T.; Hui, D.; Liu, H.; Cheng, C.; Yang, J.; Niu, L.; Guo, H. Zr-Containing Precipitate Evolution and Its Effect on the Mechanical Properties of Cu–Cr–Zr Alloys. J. Mater. Res. Technol. 2021, 14, 1451–1458. [Google Scholar] [CrossRef]
  7. Sun, Y.; Peng, L.; Huang, G.; Feng, X.; Xie, H.; Mi, X.; Liu, X. Effect of Mg on the Stress Relaxation Resistance of Cu–Cr Alloys. Mater. Sci. Eng. A 2021, 799, 140144. [Google Scholar] [CrossRef]
  8. Watanabe, C.; Monzen, R.; Tazaki, K. Mechanical Properties of Cu–Cr System Alloys with and without Zr and Ag. J. Mater. Sci. 2008, 43, 813–819. [Google Scholar] [CrossRef]
  9. Du, Y.; Zhou, Y.; Song, K.; Huang, T.; Hui, D.; Yang, J. Influence of Trace Silicon Addition on the Strengthening Precipitates, Mechanical Properties and Stress Relaxation Resistance of Cu-Cr Alloy. J. Alloys Compd. 2023, 948, 169619. [Google Scholar] [CrossRef]
  10. Wang, G.; Liu, H.; Song, K.; Zhou, Y.; Cheng, C.; Guo, H.; Guo, Y.; Tian, J. Aging Process and Strengthening Mechanism of Cu–Cr–Ni Alloy with Superior Stress Relaxation Resistance. J. Mater. Res. Technol. 2022, 19, 3579–3591. [Google Scholar] [CrossRef]
  11. Kamaya, M.; Maekawa, N. A Procedure to Obtain Correlation Curve between Local Misorientation and Plastic Strain. Mater. Charact. 2023, 198, 112725. [Google Scholar] [CrossRef]
  12. Xu, G.; Zhu, Y.; Peng, L.; Xie, H.; Li, Z.; Huang, S.; Yang, Z.; Zhang, W.; Mi, X. Effect of Sn Addition on Microstructure, Aging Properties and Softening Resistance of Cu-Cr Alloy. Materials 2022, 15, 8441. [Google Scholar] [CrossRef]
  13. Zhang, J.T.; Lin, J.; Wang, Q.; Du, X.L.; Wang, Y.H. Recrystallization Behaviour during Annealing of Cold-Rolled Cu–5Fe–2Sn Alloy. Mater. Sci. Technol. 2020, 36, 1162–1168. [Google Scholar] [CrossRef]
  14. Hughes, D.A.; Hansen, N. The Microstructural Origin of Work Hardening Stages. Acta Mater. 2018, 148, 374–383. [Google Scholar] [CrossRef]
  15. Marinelli, M.C.; Alvarez-Armas, I.; Krupp, U. Cyclic Deformation Mechanisms and Microcracks Behavior in High-Strength Bainitic Steel. Mater. Sci. Eng. A 2017, 684, 254–260. [Google Scholar] [CrossRef]
  16. Sun, Y.; Peng, L.; Huang, G.; Xie, H.; Mi, X.; Liu, X. Effects of Mg Addition on the Microstructure and Softening Resistance of Cu–Cr Alloys. Mater. Sci. Eng. A 2020, 776, 139009. [Google Scholar] [CrossRef]
  17. Zeng, H.; Sui, H.; Wu, S.; Liu, J.; Wang, H.; Zhang, J.; Yang, B. Evolution of the Microstructure and Properties of a Cu–Cr-(Mg) Alloy upon Thermomechanical Treatment. J. Alloys Compd. 2021, 857, 157582. [Google Scholar] [CrossRef]
  18. Bishara, H.; Lee, S.; Brink, T.; Ghidelli, M.; Dehm, G. Understanding Grain Boundary Electrical Resistivity in Cu: The Effect of Boundary Structure. ACS Nano 2021, 15, 16607–16615. [Google Scholar] [CrossRef]
  19. Bishara, H.; Ghidelli, M.; Dehm, G. Approaches to Measure the Resistivity of Grain Boundaries in Metals with High Sensitivity and Spatial Resolution: A Case Study Employing Cu. ACS Appl. Electron. Mater. 2020, 2, 2049–2056. [Google Scholar] [CrossRef]
  20. Orlova, T.S.; Mavlyutov, A.M.; Bondarenko, A.S.; Kasatkin, I.A.; Murashkin, M.Y.; Valiev, R.Z. Influence of Grain Boundary State on Electrical Resistivity of Ultrafine Grained Aluminium. Philos. Mag. 2016, 96, 2429–2444. [Google Scholar] [CrossRef]
  21. Huang, L.; Cui, Z.; Meng, X.; Li, X.; Sheng, X.; Lei, Q. Effect of Trace Alloying Elements on the Stress Relaxation Properties of High Strength Cu–Ti Alloys. Mater. Sci. Eng. A 2022, 846, 143281. [Google Scholar] [CrossRef]
  22. Wei, H.; Chen, Y.; Li, Z.; Shan, Q.; Yu, W.; Tang, D. Microstructure Evolution and Dislocation Strengthening Mechanism of Cu–Ni–Co–Si Alloy. Mater. Sci. Eng. A 2021, 826, 142023. [Google Scholar] [CrossRef]
  23. Chen, P.; Zhang, Q.C.; Zhang, F.; Du, J.H.; Shi, F.; Li, X.W. Critical Role of κ-Carbides in the Multi-Stage Work Hardening Process of a Lightweight Austenitic Steel. Mater. Charact. 2023, 200, 112853. [Google Scholar] [CrossRef]
  24. Li, Y.; Xiong, Y.; Ma, Y.; Han, S.; He, T.; Wang, C.; Ren, F.; Wang, S. Effect of Aging Treatment on the Microstructure and Properties of a Novel Medium-Heavy NiWCoTa Alloy Subjected to Pre-Deformation. J. Mater. Eng. Perform. 2023, 32, 8314–8324. [Google Scholar] [CrossRef]
  25. Wang, Z.; Huang, S.; Wang, F.; Zhou, L.; Tie, D.; Mao, P.; Liu, Z. Effect of Aging-Treatment on Dynamic Compression Behaviour and Microstructure of ZK60 Alloy. Mater. Sci. Technol. 2021, 37, 1117–1128. [Google Scholar] [CrossRef]
  26. Li, D.; Qian, L.; Wei, C.; Liu, S.; Zhang, F.; Meng, J. The Tensile Properties and Microstructure Evolution of Cold-Rolled Fe–Mn–C TWIP Steels with Different Carbon Contents. Mater. Sci. Eng. A 2022, 839, 142862. [Google Scholar] [CrossRef]
  27. Tang, Y.; Kang, Y.; Yue, L.; Jiao, X. Mechanical Properties Optimization of a Cu–Be–Co–Ni Alloy by Precipitation Design. J. Alloys Compd. 2017, 695, 613–625. [Google Scholar] [CrossRef]
  28. He, J.Y.; Wang, H.; Huang, H.L.; Xu, X.D.; Chen, M.W.; Wu, Y.; Liu, X.J.; Nieh, T.G.; An, K.; Lu, Z.P. A Precipitation-Hardened High-Entropy Alloy with Outstanding Tensile Properties. Acta Mater. 2016, 102, 187–196. [Google Scholar] [CrossRef]
  29. Peng, L.; Xie, H.; Huang, G.; Xu, G.; Yin, X.; Feng, X.; Mi, X.; Yang, Z. The Phase Transformation and Strengthening of a Cu-0.71 Wt% Cr Alloy. J. Alloys Compd. 2017, 708, 1096–1102. [Google Scholar] [CrossRef]
  30. Zhu, L.; Liu, X.; Fan, P.; Dan, Y.; Wang, L. Creep Rupture Behaviour of Modified 9Cr-1Mo Heat-Resistant Steel Strengthened with Different Mechanisms. Mater. High Temp. 2019, 36, 548–561. [Google Scholar] [CrossRef]
  31. Krug, M.E.; Dunand, D.C. Modeling the Creep Threshold Stress Due to Climb of a Dislocation in the Stress Field of a Misfitting Precipitate. Acta Mater. 2011, 59, 5125–5134. [Google Scholar] [CrossRef]
  32. Suwanpreecha, C.; Toinin, J.P.; Michi, R.A.; Pandee, P.; Dunand, D.C.; Limmaneevichitr, C. Strengthening Mechanisms in Al–Ni–Sc Alloys Containing Al3Ni Microfibers and Al3Sc Nanoprecipitates. Acta Mater. 2019, 164, 334–346. [Google Scholar] [CrossRef]
  33. Yang, Y.; Zhan, L.; Liu, C.; Wang, X.; Wang, Q.; Tang, Z.; Li, G.; Huang, M.; Hu, Z. Stress-Relaxation Ageing Behavior and Microstructural Evolution under Varying Initial Stresses in an Al–Cu Alloy: Experiments and Modeling. Int. J. Plast. 2020, 127, 102646. [Google Scholar] [CrossRef]
Figure 1. Euler angle diagram of Cu-Cr-Ag-Si alloy at different aging temperatures: (a) room temperature; (b) 300 °C; (c) 450 °C; (d) 600 °C.
Coatings 14 00909 g001
Figure 2. Recrystallized, substructured, and deformed microstructure distribution and proportion statistics of Cu-Cr-Ag-Si alloy at different aging temperatures: (a) room temperature; (b) 300 °C; (c) 450 °C; (d) 600 °C; (e) proportion statistics.
Coatings 14 00909 g002
Figure 3. Distribution of local misorientation of Cu-Cr-Ag-Si alloy at different aging temperatures: (a) room temperature; (b) 300 °C; (c) 450 °C; (d) 600 °C.
Coatings 14 00909 g003
Figure 4. Dislocation microstructure of Cu-Cr-Ag-Si alloy at different aging temperatures: (a) room temperature; (b) 300 °C; (c) 450 °C; (d) 600 °C.
Coatings 14 00909 g004
Figure 5. Schmid factor distribution of Cu-Cr-Ag-Si alloy on {111} [1,2,3,4,5,6,7,8,9,10] slip system.
Coatings 14 00909 g005
Figure 6. TEM morphologies of Cu-Cr-Ag-Si alloy aged at room temperature under different scales: (a) 1 μm; (b) 500 nm; (c) 200 nm.
Coatings 14 00909 g006
Figure 7. TEM matrix morphology (a) and element distribution (b,c) of Cu-Cr-Ag-Si alloy after aging at 300 °C.
Coatings 14 00909 g007
Figure 8. TEM matrix morphology (a,d) and element enrichment distribution (b,c,e,f) of Cu-Cr-Ag-Si alloy after aging at 450 °C.
Coatings 14 00909 g008
Figure 9. TEM matrix morphology (a) and element enrichment distribution (be) of Cu-Cr-Ag-Si alloy after aging at 600 °C.
Coatings 14 00909 g009
Figure 10. Variation in microhardness and electrical conductivity of Cu-Cr-Ag-Si alloy at different aging temperatures.
Coatings 14 00909 g010
Figure 11. Variation in tensile strength, yield strength, and remaining stress of Cu-Cr-Ag-Si alloy at different aging temperatures.
Coatings 14 00909 g011
Table 1. Chemical composition of experimental material (wt.%).
Alloying ElementCrSiFeTiAgCu
Cu-Cr-Ag-Si0.260.0210.0180.0340.2Bal.
Disclaimer/Publisher’s Note: The statements, opinions and data contained in all publications are solely those of the individual author(s) and contributor(s) and not of MDPI and/or the editor(s). MDPI and/or the editor(s) disclaim responsibility for any injury to people or property resulting from any ideas, methods, instructions or products referred to in the content.

