Abstract
Urea–formaldehyde resin was used as a wall material and Toddalia asiatica (L.) Lam extract was used as a core material to prepare urea–formaldehyde resin-coated Toddalia asiatica (L.) Lam extract microcapsules (UFRCTEMs). The effects of UFRCTEM content and the mass ratio of core-to-wall material (Mcore:Mwall) on the performance of waterborne coatings on poplar surfaces were investigated by adding microcapsules to the waterborne topcoat. Under different Mcore:Mwall of microcapsules, as the content of microcapsules increased, the glossiness and adhesion of the coatings gradually decreased, and the color difference value of the coatings gradually increased. The cold liquid resistance, hardness, and impact resistance of the coatings were all improved, and the roughness of the coatings increased. The antibacterial rates of the coatings against Escherichia coli and Staphylococcus aureus were both on the rise, and the antibacterial rate against Staphylococcus aureus was slightly higher than that against Escherichia coli. When the microcapsule content was 7.0% and the Mcore:Mwall was 0.8:1, the surface coating performance on poplar wood was excellent. The glossiness was 3.43 GU, light loss was 75.55%, color difference ΔE was 3.23, hardness was 2H, impact resistance level was 3, adhesion level was 1, and roughness was 3.759 µm. The cold liquid resistance was excellent, and resistance grades to citric acid, ethanol, and cleaning agents were all 1. The antibacterial rates against Escherichia coli and Staphylococcus aureus were 68.59% and 75.27%, respectively.
1. Introduction
Wood, as a renewable biomass material, plays an extremely important role in ecological civilization, national economic construction, and people’s daily lives [1,2,3]. Wood is mainly composed of three components: lignin, cellulose, and hemicellulose, which make it susceptible to pests and diseases, as well as bacterial and fungal erosion [4,5]. Hard broad-leaved trees have a long growth cycle and are scarce in resources [6,7,8]. Poplar has the advantages of fast production speed, moderate material, tough wood, corrosion resistance, and strong stability [9,10]. Poplar is a fast-growing wood that can alleviate the current shortage of wood resources and has a wide range of application prospects in wooden furniture [11]. However, poplar has problems such as loose fiber structure, low density, easy moisture absorption and deformation, and difficulty in drying, which greatly limits its application range [12,13]. These issues have resulted in higher requirements for the antibacterial effect on the surface of poplar wood. Therefore, the antibacterial treatment of wood is an important means to extend its service life, improve its utilization level, and save wood resources [14]. As an environmentally friendly coating, waterborne coatings can have special properties that affect wood, such as antibacterial, anti-corrosion, heat-resistant, waterproof, and fireproof characteristics [15,16,17]. It has been found that excessive use of chemical antibacterial agents can easily cause environmental pollution, carcinogenic effects on humans and other organisms, and corrosion of metal objects [18,19,20]. Plant-derived antibacterial agents obtained from natural plants are extracted through physical or chemical separation and have advantages such as safety, efficiency, wide range of sources, wide variety, and minimal toxic side effects [21,22,23]. Therefore, a large number of plant extracts have been developed and applied in fields such as cosmetics, natural fungicides, and feed [24]. However, when plant extracts are directly used as wood antibacterial agents, there are various shortcomings such as a narrow range of insect-resistant bacteria, easy degradation, easy loss, short efficacy period, and sensitivity to external environmental factors (such as temperature, air humidity, light, rain, etc.), which result in overall poor antibacterial effect and limit its application range. Therefore, further research and expansion are needed [25].
The extract from the roots, stems, and leaves of Toddalia asiatica (L.) Lam contains a certain degree of bioactive substances such as antibacterial, antioxidant, and insecticidal properties [26]. The chemical components of Toddalia asiatica (L.) Lam anhydrous ethanol extract contain alkaloids, coumarins, triterpenes, and flavonoids with antibacterial activity [27]. Coumarin compounds can reduce the pathogenicity and drug resistance of bacteria by inhibiting the bacterial quorum sensing system, reducing the expression of related virulence factors, and forming biofilms [28]. Flavonoids act on the cell membrane of microorganisms, altering the permeability, and achieving the goal of inhibiting or killing bacteria [29]. Alkaloids can induce the release of membrane-bound cell wall autolytic enzymes, ultimately leading to lysis [30]. The antibacterial effect of terpenes is mainly attributed to their ability to interact with microbial membranes and destroy them, as well as the increased antibacterial and antifungal activity of terpenes by hydroxyl, ketone, and aldehyde groups [31]. However, it was not easily dispersed when directly applied to coatings, and antibacterial properties were not guaranteed. It is even more difficult to apply them in surface coatings for wooden products, and further research is needed to expand their application functions. The use of microcapsule technology can encapsulate some natural antibacterial agents or antibacterial substances to make antibacterial microcapsules, improve the processing performance of antibacterial agents, enhance the stability of natural antibacterial agents, and improve their usability, expanding their application scope. Therefore, Toddalia asiatica (L.) Lam extract was prepared into microcapsules and applied in wood antibacterial coatings. Raj et al. used different materials to sequentially extract the active ingredients from the leaves of Toddalia asiatica (L.) Lam. The results showed that the extract exhibited antibacterial activity against selected bacteria (Staphylococcus epidermidis, Enterobacter aerogenes, Shigella flexneri, Klebsiella pneumoniae, and Escherichia coli) and fungi (Aspergillus flavus, Candida krusei, and Botrytis cinereal) [32]. Roshan et al. prepared chitosan-based nanocapsules of Toddalia asiatica (L.) Lam essential oil (neTAEO) and the results confirmed that neTAEO exhibited stronger antifungal and aflatoxin B1 inhibitory activity than Toddalia asiatica (L.) Lam essential oil, and had greater development prospects [33].
Three types of urea–formaldehyde resin-coated Toddalia asiatica (L.) Lam extract microcapsules (UFRCTEMs) with the mass ratio of core-to-wall material (Mcore:Mwall) of 0.6:1, Mcore:Mwall of 0.8:1, and Mcore:Mwall of 1.2:1 were prepared. Three types of UFRCTEMs were added to waterborne coatings at concentrations of 1.0%, 3.0%, 5.0%, 7.0%, and 9.0%, respectively. Then, the waterborne coatings were applied on the surface of poplar wood. By testing and analyzing the microstructure, chemical composition, optical properties, mechanical properties, cold liquid resistance, and antibacterial properties of the surface coating of poplar wood, the influence of different UFRCTEMs and addition contents on the comprehensive performance of the surface coating on poplar wood was explored, providing a reference for the coating process of antibacterial coatings.
2. Materials and Methods
2.1. Materials and Instruments
The leaves of Toddalia asiatica (L.) Lam were obtained from Lingshan County, Qinzhou, China. The leaves were placed in a 40 °C oven to dry to a constant weight. The leaves were pulverized into powder by a crusher. The size of the poplar wood was 50 mm × 50 mm × 8 mm, which was smoothed using #800 and #1000 sandpaper. The coatings used were a waterborne acrylic topcoat and a primer, both from Jiangsu Haitian Technology Co., Ltd., Nanjing, China.
2.2. Preparation Method of Microcapsules
2.2.1. Preparation Method of Toddalia asiatica (L.) Lam Extract
The leaf powder was mixed with anhydrous ethanol, heated in a water bath, and centrifuged. A vacuum pump combined with a Buchner funnel was used to filter the solution. The specific preparation method used in this study is the same as in Reference [34].
2.2.2. Preparation Method of Microcapsules
According to Reference [35], three types of UFRCTEMs with 0.6:1, 0.8:1, and 1.2:1 Mcore:Mwall were prepared. Table 1 shows the proportion of the UFRCTEM raw materials.

Table 1.
The proportion of the microcapsule raw materials.
2.3. Painting Method for Poplar Board
According to the technical specifications for the application of waterborne wood coatings on furniture surfaces, a uniform layer of coating was manually applied to the poplar board, with a one-time application amount of 60 g/m2 to 80 g/m2. The coating was applied with a brush-painting technique. A coating method of two layers of primer and two layers of topcoat was adopted. The selected coating amount for each layer was 80 g/m2, and the total coating amount for the primer and topcoat was 320 g/m2. The thickness of each coating on the surface of the wood was about 80 μm, and the total thickness was about 320 μm. Taking into account the loss error during the coating process, the actual consumption of the coating was 1.8 times the theoretical application amount. The total mass of the coating applied to the surface of the poplar wood was 1.44 g. Table 2 shows the materials used for the waterborne coatings.
Table 2.
List of materials used for the waterborne coatings.
The specific coating process for the surface coating of poplar wood was as follows: A #360 sandpaper was used to treat the rough edges of the poplar board, and a #800 sandpaper was used to remove the surface of the poplar board and polish it smooth. Then, the first layer of primer was applied with a brush. After the first application of primer, the coating was leveled at room temperature for 20 min before being transferred to an oven to dry. After the coating was completely cured, it was taken out and polished with #800 sandpaper. The above-described procedures of brushing, leveling, and curing were repeated. The total mass of the topcoat was kept constant, and the three UFRCTEM samples, #1, #2, and #3, prepared in the early stage were added to the topcoat in a mass ratio of 1.0%, 3.0%, 5.0%, 7.0%, and 9.0%, and they were mixed evenly. The first layer of the topcoat was applied using a brush. The above-described procedures of brushing, leveling, and curing the topcoat were repeated. Then, #1000 sandpaper was used to polish the coating before the second layer of topcoat was applied. In addition, a pure primer and a pure topcoat were applied to the poplar board as control group specimens for future use.
2.4. Testing and Characterization
2.4.1. Performance Characterization of Microcapsules
- (1)
- Coverage rate (C): UFRCTEMs with a mass of M1 were weighed. M2 was the weight of the weighing filter paper. The UFRCTEMs were soaked in ethanol, filtered, and dried after 24 h. The total mass of the dried filter paper and wall material was M3. The calculation of the coverage rate is shown in Formula (1).
- (2)
- Yield rate (Y): The total mass of materials used for preparing the UFRCTEM samples was denoted as M1. The mass of the UFRCTEMs after drying was recorded as M2. The calculation of the yield rate is shown in Formula (2).
- (3)
- Analysis of microstructure and chemical composition: a Zeiss optical microscope (OM, Carl Zeiss AG, Oberkochen, Germany) was used to observe the morphology of the UFRCTEMs. Scanning electron microscopy (SEM, Tescan, Brno, the Czech Republic) was used to analyze the microstructure of the UFRCTEMs and coatings. Fourier-transform infrared spectroscopy (FTIR, Brucker AG, Karlsruhe, Germany) was used to analyze the chemical composition of the UFRCTEMs and coatings.
2.4.2. Color Difference Testing of Coatings
In the light of GB/T 11186.3-1989 [36], the chromaticity value of the coatings was measured and recorded using a SEGT-J colorimeter (Zhuhai Tianchuang Instrument Co., Ltd., Zhuhai, China) and a color difference was calculated. The color difference ΔE between the coating with UFRCTEMs added and the pure coating was calculated using the color difference shown in Formula (3), where ∆L = L1 − L2, ∆a = a1 − a2, and ∆b = b1 − b2; ΔL represent the difference in brightness of the coating; Δa represents the red–green difference in the coating; and Δb represents the yellow–blue difference in the coating.
2.4.3. Test for Glossiness and Reflectivity of Coatings
The sample was treated according to the requirements of GB/T 4893.6-2013 [37]. The glossiness values of the coating at three incidence angles of 20°, 60°, and 85° were tested and recorded using a glossmeter (Shenzhen Linshang Technology Co., Ltd., Shenzhen, China), with the unit being GU.
The reflection curve of the coating in the visible light wavelength range (380–780 nm) was tested and recorded using a Hitachi UV spectrophotometer (Zhuhai Tianchuang Instrument Co., Ltd., Zhuhai, China). The reflectance R value was calculated using Formula (4).
where i(λ) is the standard radiation intensity for sunlight, and the unit is W∙m−2∙nm−1. r(λ) is the reflectance value obtained through testing.
2.4.4. Roughness Testing of Coatings
The roughness value was tested and recorded using a JB-4C roughness tester (Cangzhou Oupu Testing Instrument Co., Ltd., Cangzhou, China). The macro knob was rotated to fine tune the probe position until the red display point was at the zero-scale line. The test button was activated and data were recorded. The unit of roughness value is µm.
2.4.5. Cold Liquid Resistance Test of Coatings
According to GB/T 4893.1-2021 [38], 10% citric acid solution, undescended ethanol with a volume fraction of 96%, and a cleaning agent (Guangdong Baiyun Cleaning Group Co., Ltd., Guangzhou, China) were chosen as the experimental liquids. The damage to the surface was inspected under specified lighting conditions. The test results were evaluated using numerical levels.
2.4.6. Antibacterial Performance Testing of Coatings
According to GB/T 21866-2008 [39], test operations were carried out. Firstly, Escherichia coli (ATCC25922, Shanghai Shifeng Biotechnology Co., Ltd., Shanghai, China) and Staphylococcus aureus (ACTT6538, Shanghai Shifeng Biotechnology Co., Ltd., Shanghai, China) were subjected to live bacterial manipulation. An amount of 24 g of agar medium (Huankai Microbial Technology Co., Ltd., Guangdong, China) and 1000 mL of distilled water were weighed to prepare an agar plate medium, and a sterilization treatment was performed. Slanted preserved bacterial strains were inoculated onto agar plates and placed in a constant temperature and humidity incubator (Shanghai Zhetu Scientific Instrument Co., Ltd., Shanghai, China) with a relative temperature of 38 °C for cultivation for 18–20 h. Next, the required bacterial suspension was prepared. Finally, sample testing was conducted according to References [35,40]. The formula for calculating the antibacterial rate is shown in Formula (5), where R represents the antibacterial rate and the unit is %. B represents the average number of recovered colonies of pure coating samples after 48 h, in CFU/piece. C represents the average number of recovered bacteria in the antibacterial coating sample after 48 h, in CFU/piece.
2.4.7. Hardness, Impact Resistance, and Adhesion Testing of Coatings
(1) Hardness: according to GB/T 6739-2022 [41], a pencil with a hardness of 9B-9H was used, which was determined by a QHQ-A portable pencil hardness tester (Shenzhen Weichuangjie Testing Instrument Co., Ltd., Shenzhen, China). The pencil was inserted diagonally at a 45° angle into the pencil hardness tester with a load of 750 g for hardness testing.
(2) Impact resistance: according to the content of GB/T 4893.9-2013 “Physical and chemical properties testing of furniture surface coating—Part 9: determination of impact resistance” [42], the impact resistance of the wood surface coatings was tested with a coating impactor (Dongguan Jiaxin Measuring Instrument Co., Ltd., Dongguan, China). A magnifying glass was used to observe the number of cycles of surface rupture of the coating to evaluate the impact resistance level. Each sample was subjected to 5 impacts. The nearest integer to the arithmetic mean of the evaluation level was taken as the result of the level evaluation. The impact resistance level increased sequentially from level 5 to level 1, and the evaluation table for the coating impact site level is shown in Table 3.
Table 3.
Evaluation table of coating impact position grade.
(3) Adhesion: According to GB/T 4893.4-2013 [43], the adhesion of the coating was tested using a coating adhesion tester (Quzhou Aipu Measuring Instrument Co., Ltd., Quzhou, China). The coating was cross-cut with the blade at a vertical angle of 90 degrees. A 3M adhesive tape was applied on the grid surface and peeled off at an angle close to 60°, quickly and smoothly. The adhesion level decreased from level 0 to level 5.
3. Results and Discussion
3.1. Morphology and Chemical Composition Analysis of Microcapsules
3.1.1. Microscopic Morphology Analysis of Microcapsules
SEM images of the UFRCTEMs are shown in Figure 1. Figure 1A–C show the morphology of UFRCTEM samples #1–#3 under low magnification, while Figure 1D–F show the morphology of the UFRCTEMs under high magnification. The UFRCTEMs with Mcore:Mwall of 0.6:1 had more spherical and rounded shapes, with a small difference in particle size. The UFRCTEMs with Mcore:Mwall of 0.8:1 were spherical, plump, and had a relatively uniform particle size distribution, but they aggregated more severely. The UFRCTEMs with Mcore:Mwall of 1.2:1 had large adherent and irregularly shaped substances, and the difference in UFRCTEM particle size was relatively small. As the Mcore:Mwall increased, the agglomeration phenomenon of the microcapsules continued to strengthen.
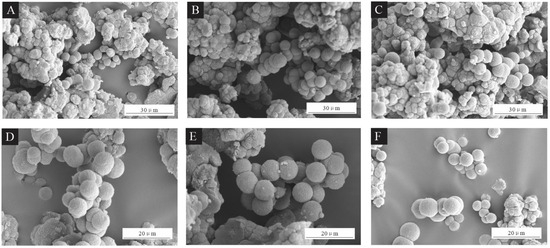
Figure 1.
SEM images of UFRCTEMs with different Mcore:Mwall. Under low magnification: (A) 0.6:1, (B) 0.8:1%, and (C) 1.2:1. Under high magnification: (D) 0.6:1, (E) 0.8:1, and (F) 1.2:1.
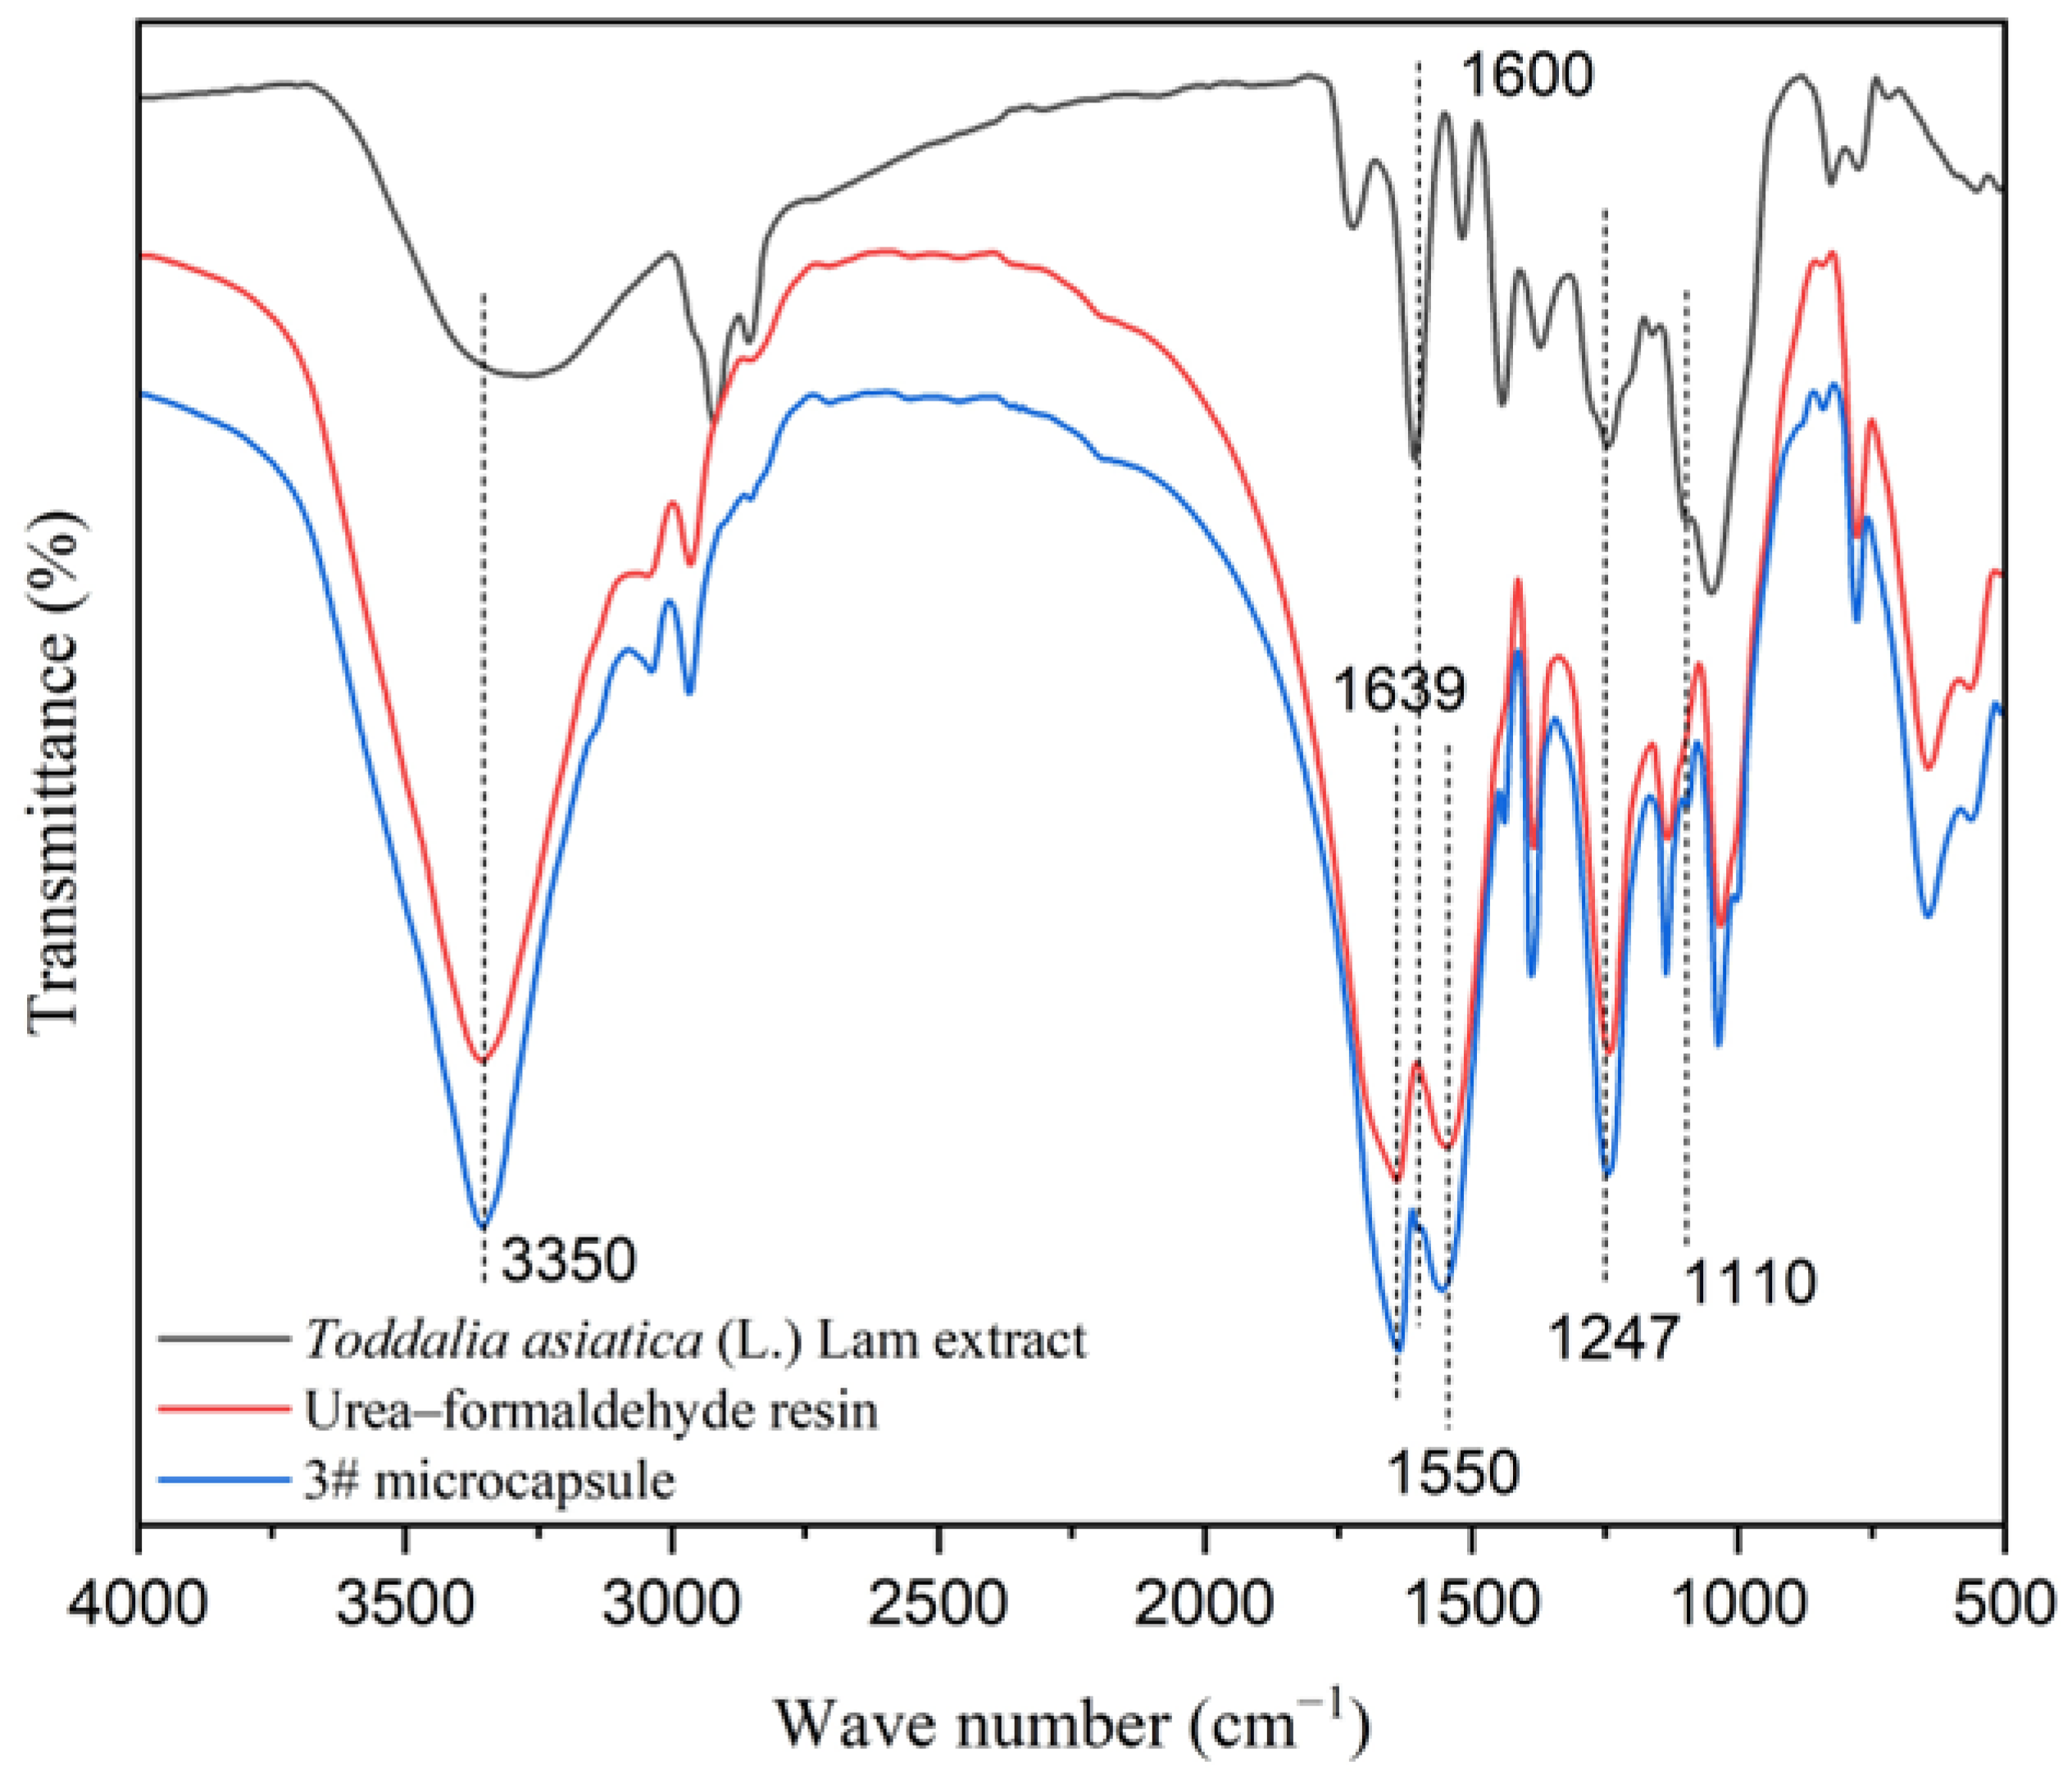
3.1.2. Chemical Composition Analysis of Microcapsules
As shown in Figure 2, the absorption peak at 3350 cm−1 was the stretching vibration peak of C-O in the core material and -NH and -OH in the wall material [44]. The characteristic peaks of C=O and C=N in the urea–formaldehyde resin appeared at 1639 cm−1 and 1550 cm−1, respectively. The absorption peak at 1247 cm−1 was caused by the stretching vibration of C-N and the deformation vibration of N-H in the urea–formaldehyde resin, indicating the presence of the chemical composition of urea–formaldehyde resin in the UFRCTEMs [45]. The characteristic peaks of C=N and C-O in coumarin compounds in the core material were located at 1600 cm−1 and 1110 cm−1, which existed on the absorption curve of the microcapsules, proving the presence of Toddalia asiatica (L.) Lam extract in the UFRCTEMs [46].
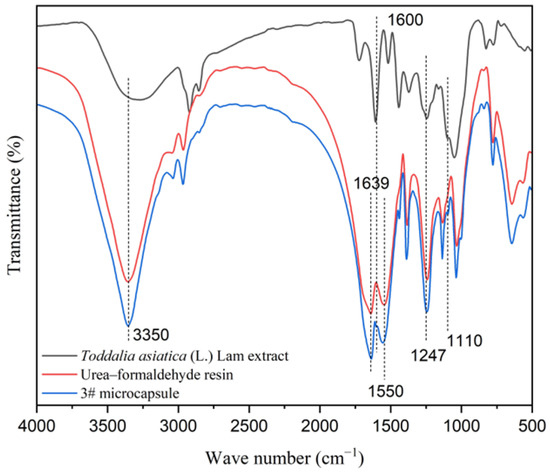
Figure 2.
Infrared spectra of core materials, wall materials, and UFRCTEMs.
The above results indicate that the UFRCTEMs contain characteristic peaks of the core and wall materials.
3.2. Optical Performance Analysis of Coatings
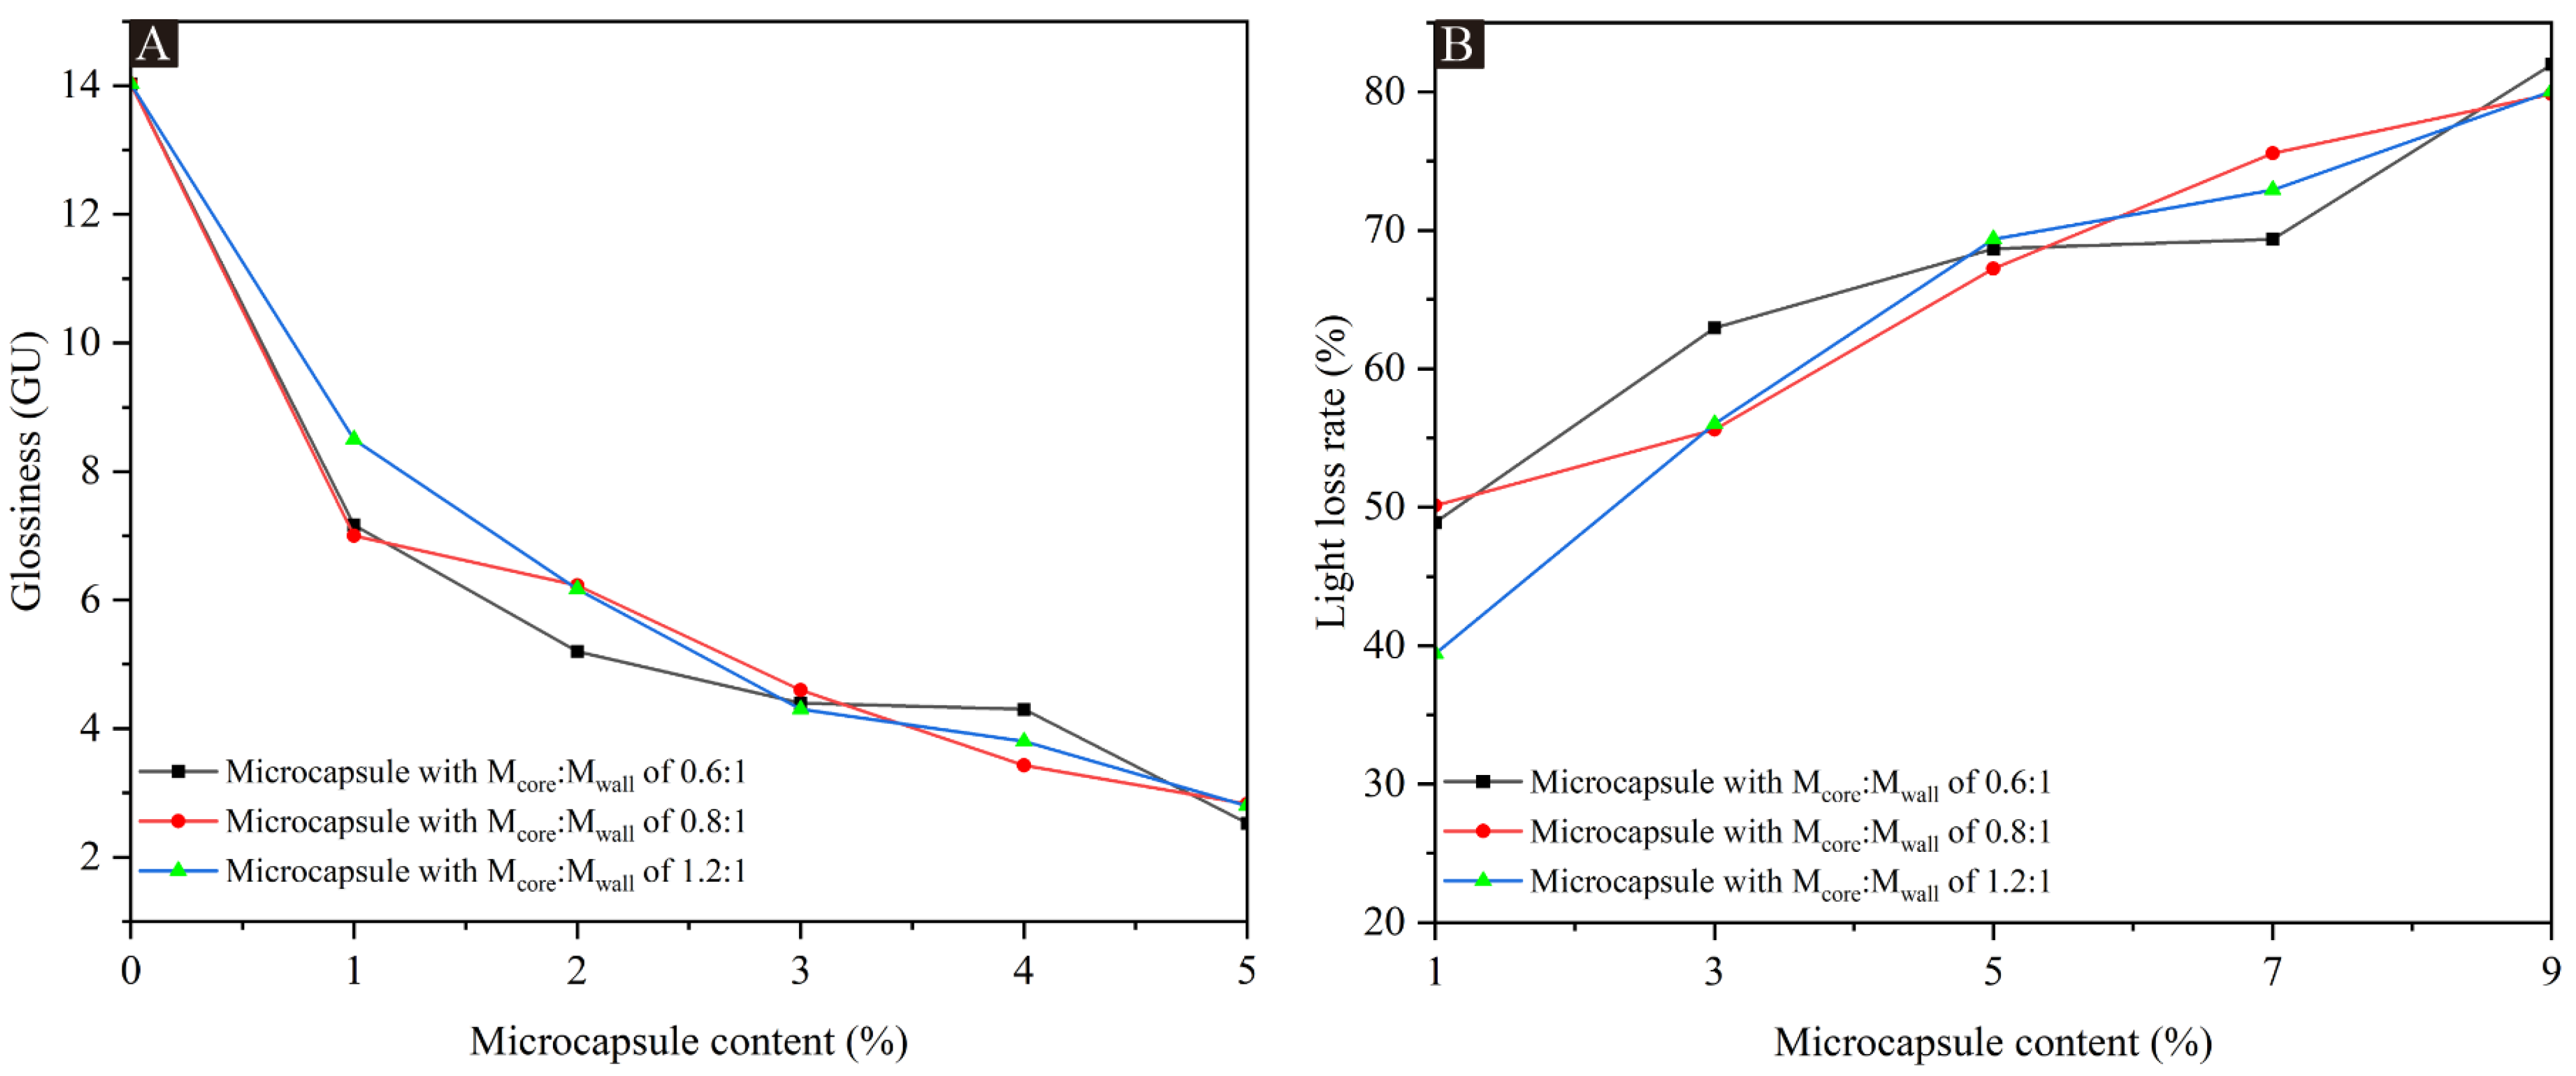
The results of the coating glossiness and light loss rate for the UFRCTEMs with different Mcore:Mwall and different contents are shown in Table 4. The data at a 60° incidence angle are plotted in Figure 3. Compared with the surface coating of poplar wood without UFRCTEMs added, the glossiness of the three coatings prepared with UFRCTEMs with different Mcore:Mwall decreased with the increase in UFRCTEM content, and the difference in glossiness data between them was relatively small. When the Mcore:Mwall of the added UFRCTEMs was 0.8:1, the overall glossiness of the coating was slightly higher, and the optical performance was relatively excellent. When the content of the UFRCTEMs in the coating was between 1.0% and 5.0%, the glossiness on the surface of poplar wood decreased rapidly. When the content of the UFRCTEMs was greater than 5.0%, the trend of glossiness changes tended to be gentle. When the Mcore:Mwall of the UFRCTEMs was 0.8:1, the optical performance of the coating was better, and the maximum glossiness of the coating was 7.00 GU.
Table 4.
Glossiness and light loss rate of poplar surface coatings with different Mcore:Mwall and different content.
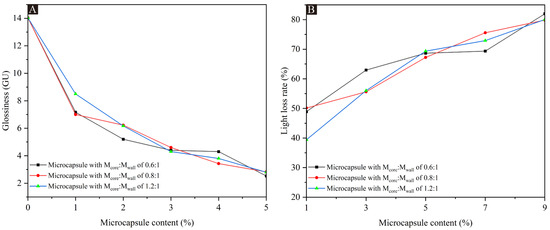
Figure 3.
The effects of UFRCTEMs with different Mcore:Mwall on glossiness and light loss rate of poplar surface coatings: (A) glossiness and (B) light loss rate.
The lower the light loss of the wood surface coating, the better the optical performance of the coating [47,48]. Table 4 shows that when the UFRCTEMs with the same Mcore:Mwall were added to the coating, the light loss was positively correlated with the content of UFRCTEMs in the coating.
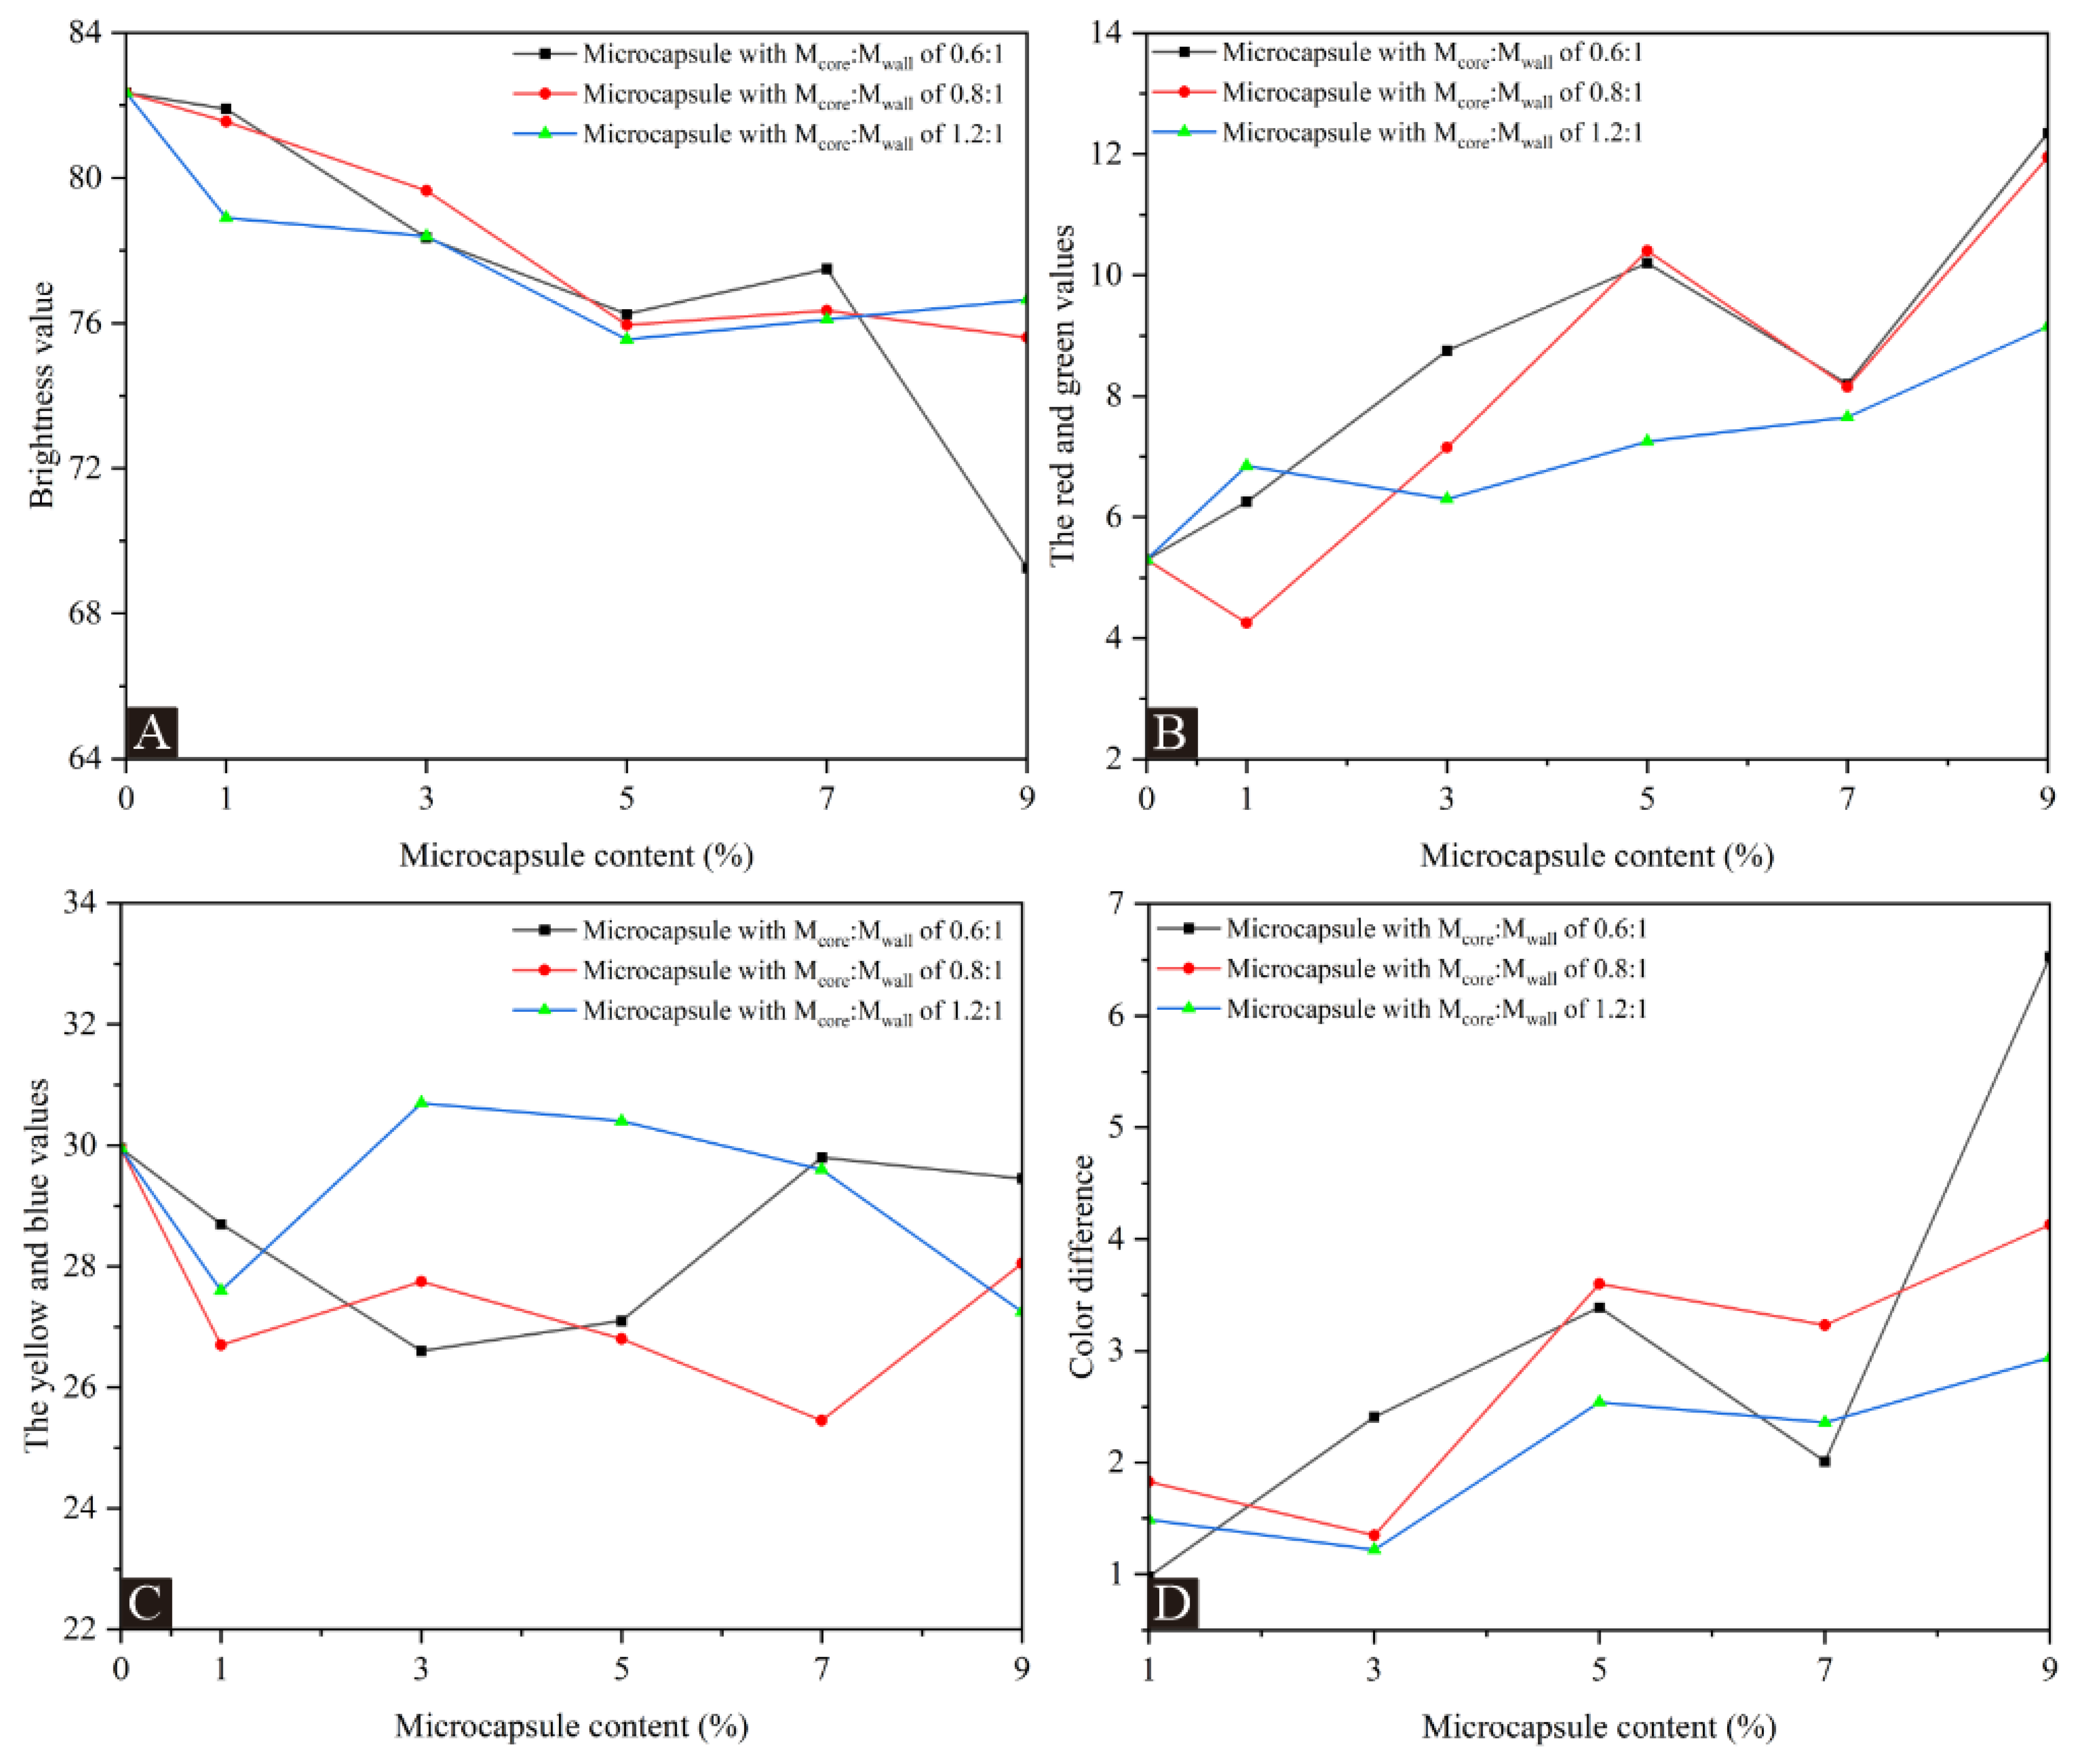
Table 5 and Figure 4, respectively, show the results and trends of coating chromaticity values for UFRCTEMs with different Mcore:Mwall and contents. Compared with the coating without UFRCTEMs in Figure 4A, the brightness value decreased with the continuous increase in UFRCTEM content. The addition of UFRCTEMs causes protrusions on the coating, weakening the coating’s ability to reflect light and reducing the brightness value. Figure 4B,C show a positive correlation between the red and green values and the content of UFRCTEMs. The yellow and blue values generally show a trend of first increasing, then decreasing, and then increasing with the increase in UFRCTEM content. In Figure 4D, the color difference value shows an overall upward trend with the increase in UFRCTEM content. For the wood surface coating containing the UFRCTEMs with Mcore:Mwall of 0.6:1, the minimum color difference of the coating was 0.98 when the microcapsule content was 1.0%. The minimum color difference value with 0.8:1 Mcore:Mwall of UFRCTEMs added to the coating was 1.35 when the UFRCTEM content was 3.0%. When Mcore:Mwall of 1.2:1 UFRCTEMs was added to the coating, the minimum color difference of the coating was 1.22 when the UFRCTEM content was 3.0%.
Table 5.
Chromaticity and color difference of poplar surface coatings with different Mcore:Mwall and different content.
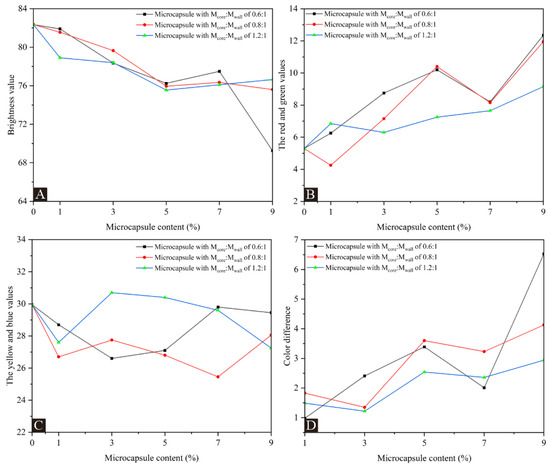
Figure 4.
The effects of UFRCTEMs with different Mcore:Mwall on chromaticity and color difference of the poplar surface coatings: (A) L value, (B) a value, (C) b value, and (D) ΔE.
Comparing the color difference values corresponding to the coatings prepared by three types of UFRCTEMs, the overall color difference with Mcore:Mwall of 1.2:1 added was relatively small. Because the UFRCTEMs with Mcore:Mwall of 1.2:1 have a higher content of core material, the prepared UFRCTEMs have a darker color compared to the other two samples, which can balance the color difference caused by the wood grain on the surface of the poplar.
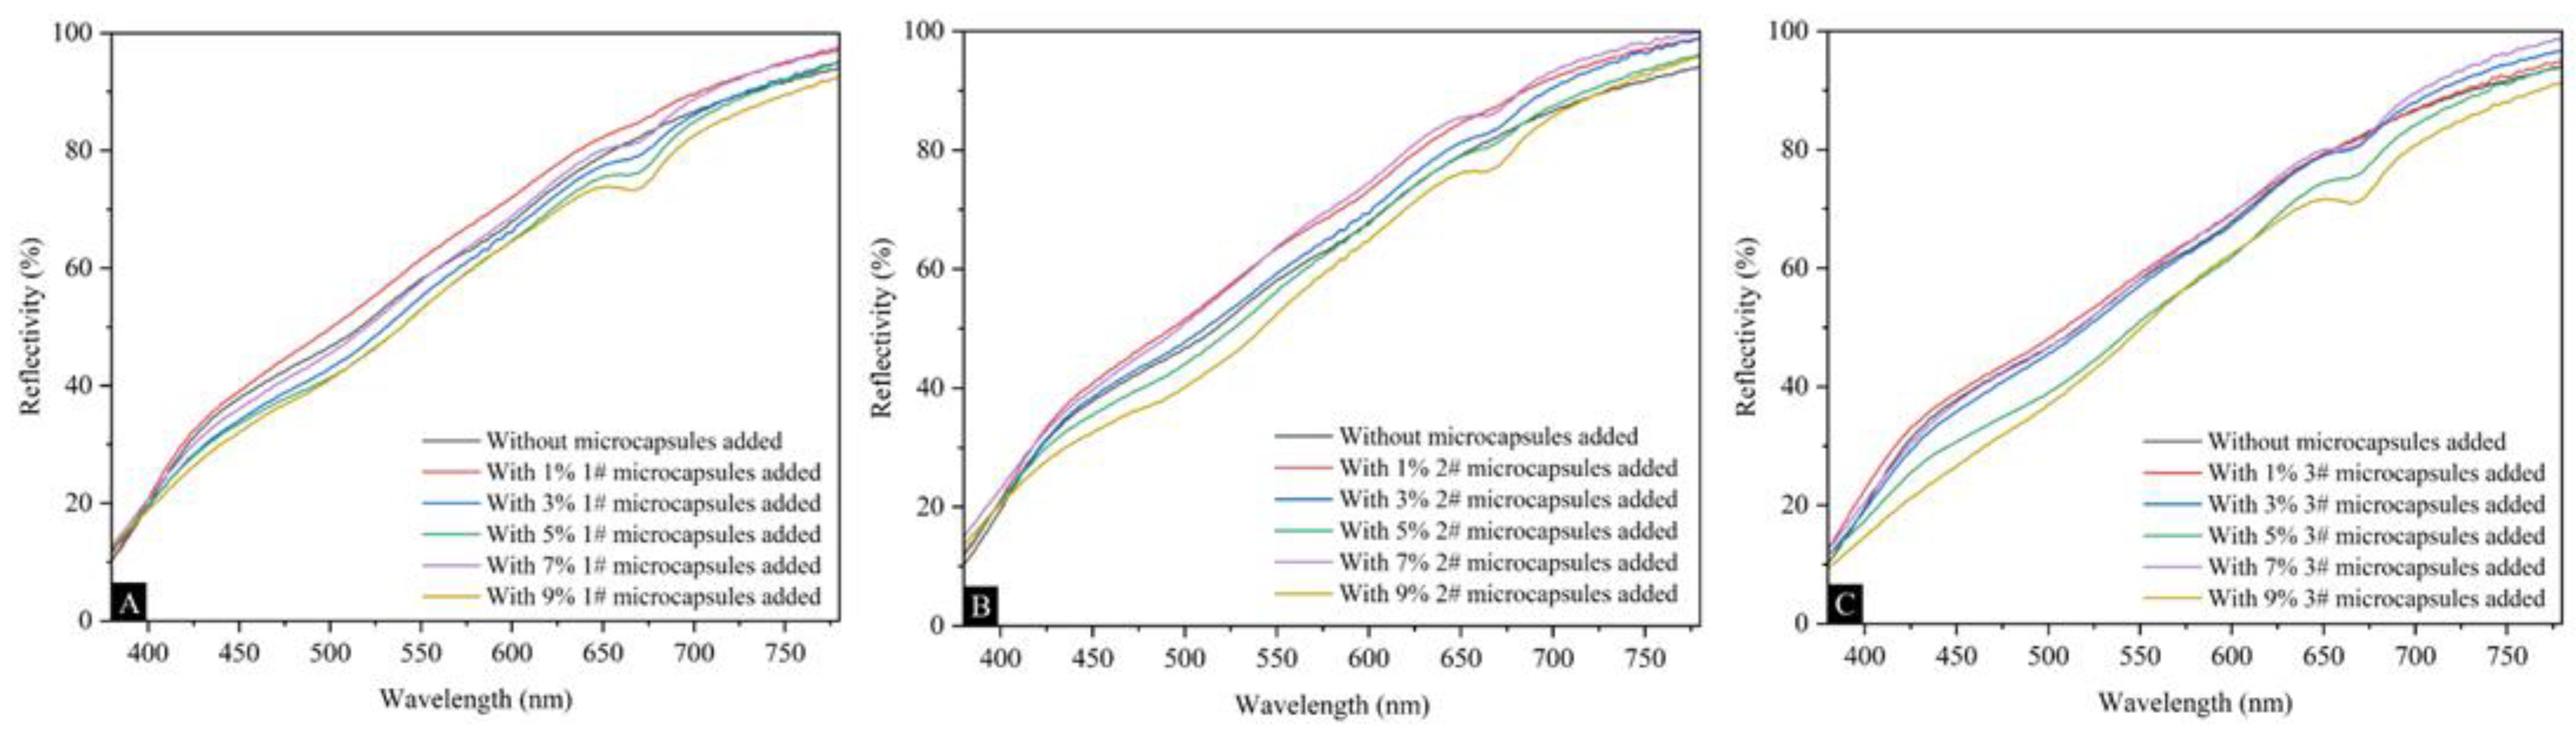
Figure 5 shows the effects of UFRCTEMs with different Mcore:Mwall on the surface coating reflectivity of poplar wood. The reflectivity curves of wood surface coatings prepared using three types of UFRCTEMs were highly similar. As the content of UFRCTEMs increased, the overall reflectivity showed an upward trend. Table 6 shows the effect of UFRCTEM content on the coating reflectivity R value of UFRCTEMs with different Mcore:Mwall. The content of UFRCTEMs had a relatively small impact on the reflectivity R value of the coating, and it was consistent with the change in the reflectivity curve. When adding UFRCTEMs with Mcore:M wall of 0.6:1, the coating reflectivity showed a trend of first increasing, decreasing, and then increasing again. When the UFRCTEM content was 1.0%, the largest reflectivity value was 0.6472. When the Mcore:Mwall of UFRCTEMs was 0.8:1, the reflectivity fluctuated and generally showed an upward trend. When the content was 7.0%, the largest reflectivity value was 0.6699. When the Mcore:Mwall of UFRCTEMs was 1.2:1, the reflectivity showed a trend of first increasing and then decreasing. When the UFRCTEM content was 7.0%, the largest reflectivity value was 0.6310.
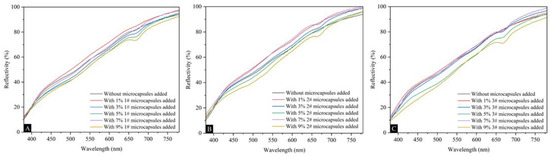
Figure 5.
The effects of UFRCTEMs with different Mcore:Mwall on the reflectivity of the poplar surface coating: (A) 0.6:1, (B) 0.8:1, and (C) 1.2:1.
Table 6.
The effects of UFRCTEMs with different Mcore:Mwall on the poplar surface coating reflectance R value.
The higher the reflectivity of the coating, the weaker the light absorption ability, and thus the corresponding heat absorption ability was also weaker. The absorption capacity of coatings for solar infrared and ultraviolet rays decreases, weakening the accumulated heat on the coating surface, thereby extending the lifespan of wooden substrates and their surface coatings [49].
3.3. Cold Liquid Resistance of Coatings
Table 7 shows the cold liquid resistance level of surface coatings on poplar wood with different Mcore:Mwall and different amounts. The citric acid resistance level of the surface coatings on poplar prepared by using three types of UFRCTEMs increased to level 1. The ethanol and cleaning agent resistance levels upgraded from level 3 to level 1 or 2. The addition of UFRCTEMs had a positive protective effect on the liquid resistance of the surface coating on poplar wood. As the Mcore:Mwall of UFRCTEMs increased, the liquid resistance of the coating became increasingly excellent. When the Mcore:Mwall of UFRCTEMs was 0.6:1 and the UFRCTEM content was 9.0%, the liquid resistance performance of the coating was level 1. The liquid resistance of the coating was level 1 when the Mcore:Mwall of UFRCTEMs was 0.8:1 and the UFRCTEM content was greater than or equal to 7.0%. When the Mcore:Mwall of UFRCTEMs was 1.2:1 and the UFRCTEM content was greater than or equal to 5.0%, the liquid resistance performance of the coating was level 1.
Table 7.
Cold liquid resistance grades of the poplar surface coatings with different Mcore:Mwall and different content.
The addition of UFRCTEMs to waterborne coatings can protect the coating from erosion by the test liquid. Poplar is affected by various stains, watermarks, and other factors during use. Improving the cold liquid resistance of the coating can provide protection for the substrate and surface coating on poplar wood, thereby extending the service life of the coating and the poplar wood [50].
3.4. Mechanical Properties of Surface Coatings
3.4.1. Hardness of Surface Coating on Poplar Wood
The hardness of wood surface coating refers to the resistance of the coating to a series of mechanical forces such as scratches, impacts, and squeezing, and is an important indicator of the mechanical strength of the coating. As shown in Table 8, the hardness of the surface coating on poplar wood changed. The hardness of the surface coating on wood without the addition of UFRCTEMs was B. For UFRCTEMs with Mcore:Mwall of 0.6:1 and 0.8:1, the hardness of the coating increased from B to 2H with the increase in microcapsule content. For UFRCTEMs with Mcore:Mwall of 0.8:1, the coating hardness increased from B to 3H with the increase in microcapsule content.
Table 8.
The hardness of the poplar surface coatings with different Mcore:Mwall of UFRCTEMs and different content.
The larger the Mcore:Mwall of microcapsules, the higher the hardness of the surface coating of the poplar wood. This is because UFRCTEMs are small particles with a certain volume; adding UFRCTEMs to waterborne coatings can fill the pores in the coating matrix. The addition of microcapsules increases the solid content of waterborne coatings, thereby increasing the density of the coating and gradually increasing the hardness [51].
3.4.2. Impact Resistance of Surface Coating on Poplar Wood
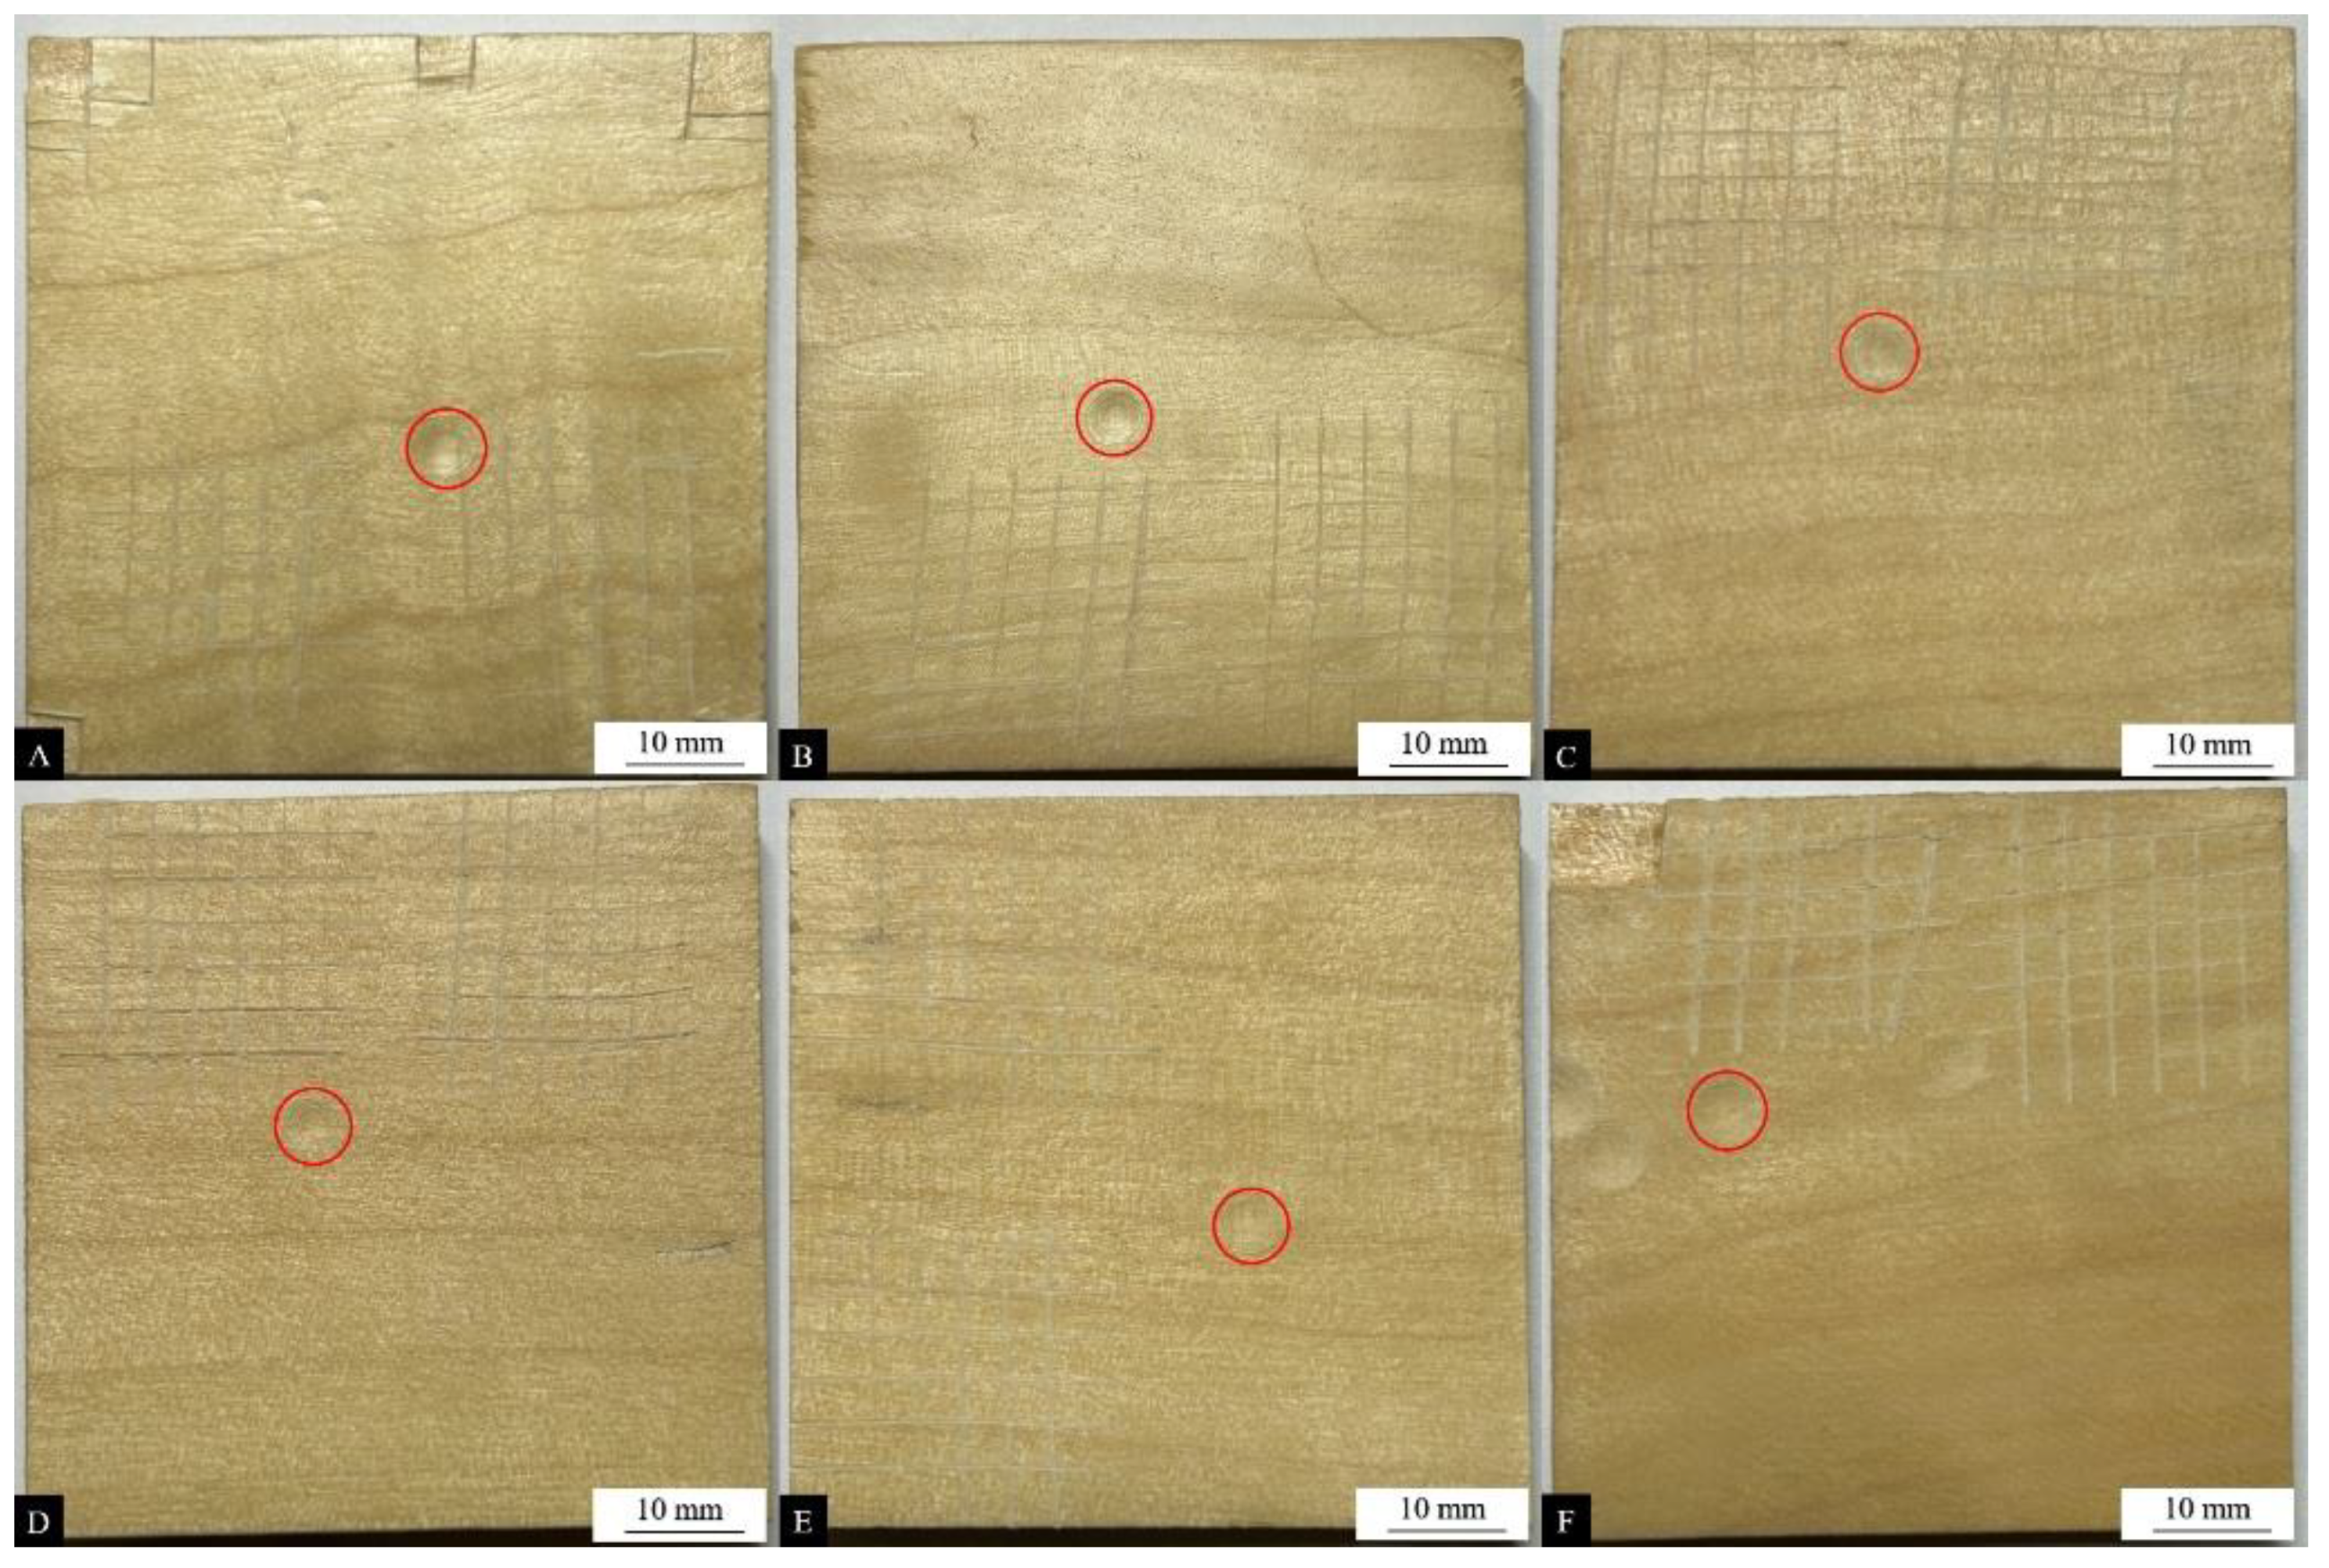
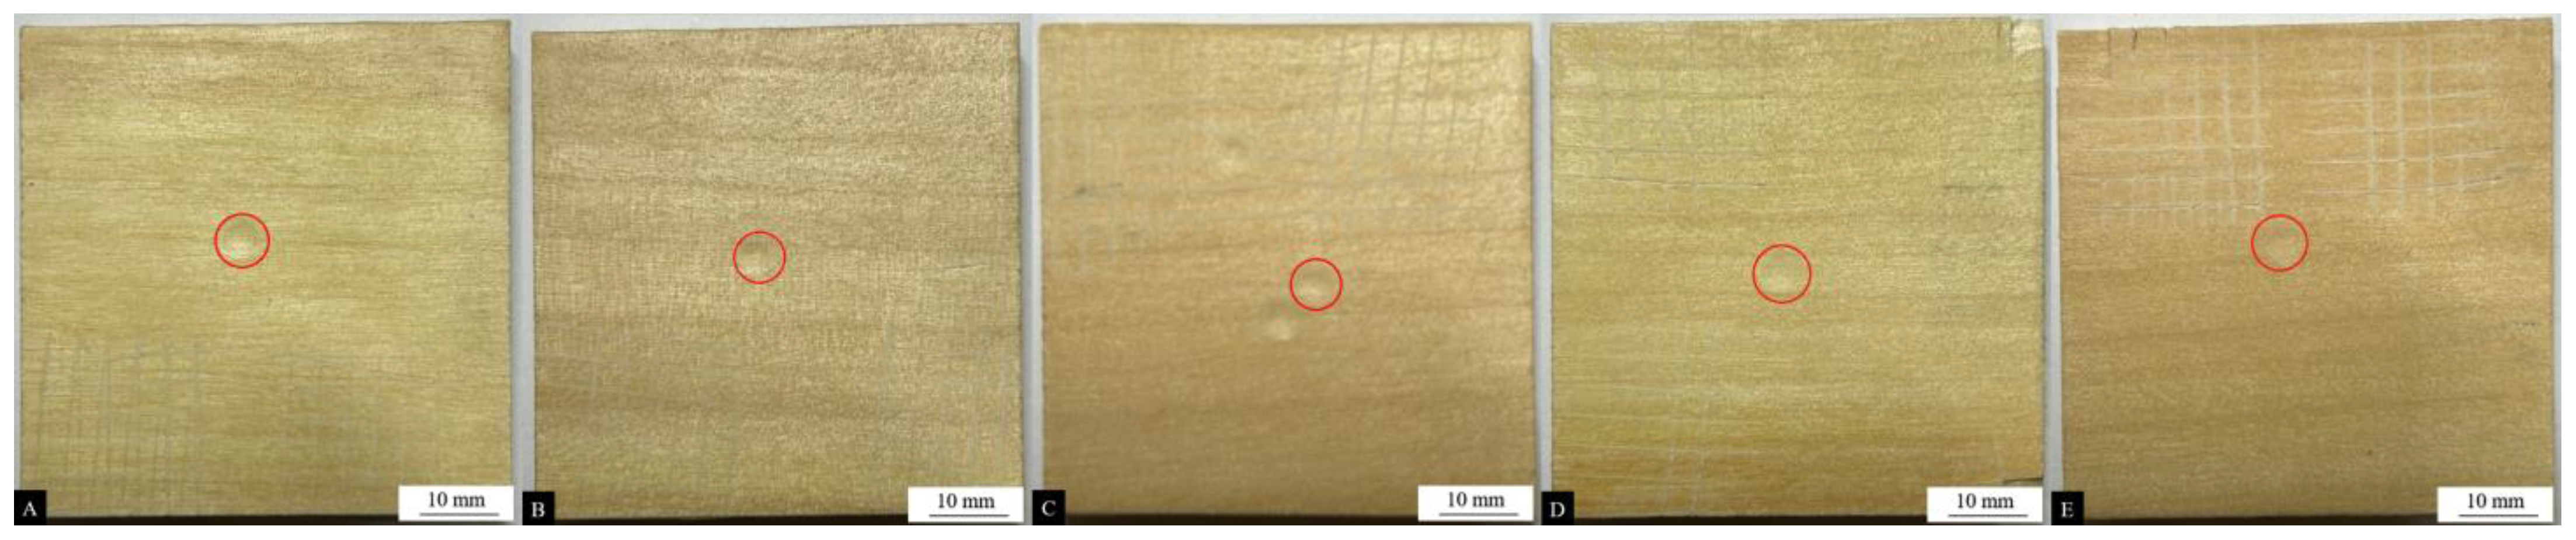
The impact resistance of a layer, also known as impact strength, is the ability of a surface coating to withstand heavy impact without cracking. Table 9 shows the changes in the impact resistance level of surface coatings on poplar wood. Figure 6, Figure 7 and Figure 8 show the surface condition of the poplar coatings after impact resistance testing. The impact resistance level of the wood surface coating without UFRCTEMs was level 5, and the performance was poor and did not meet the qualified standards. When the Mcore:Mwall of UFRCTEMs in the coating was 0.6:1, the impact resistance level of the coating was increased from level 4 to level 3. When the content of UFRCTEMs exceeded 7.0%, the surface coating of the poplar wood met the qualified standard for surface coating of wooden furniture (GB/T 3324-2017) [52]. When the Mcore:Mwall was 0.8:1, the impact resistance level of the coating was increased from level 4 to level 3. When the content of UFRCTEMs exceeded 5.0%, the surface coating of the poplar wood met the qualified standard. When the Mcore:Mwall was 1.2:1 and the microcapsule content was greater than 3.0%, the impact resistance level of the coating reached the qualified standard.
Table 9.
Impact resistance grades of poplar surface coatings with different Mcore:Mwall of UFRCTEMs and different content.
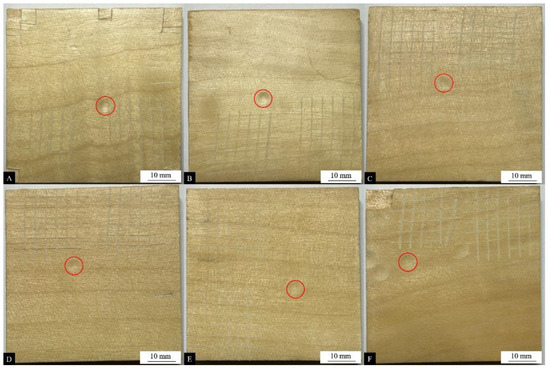
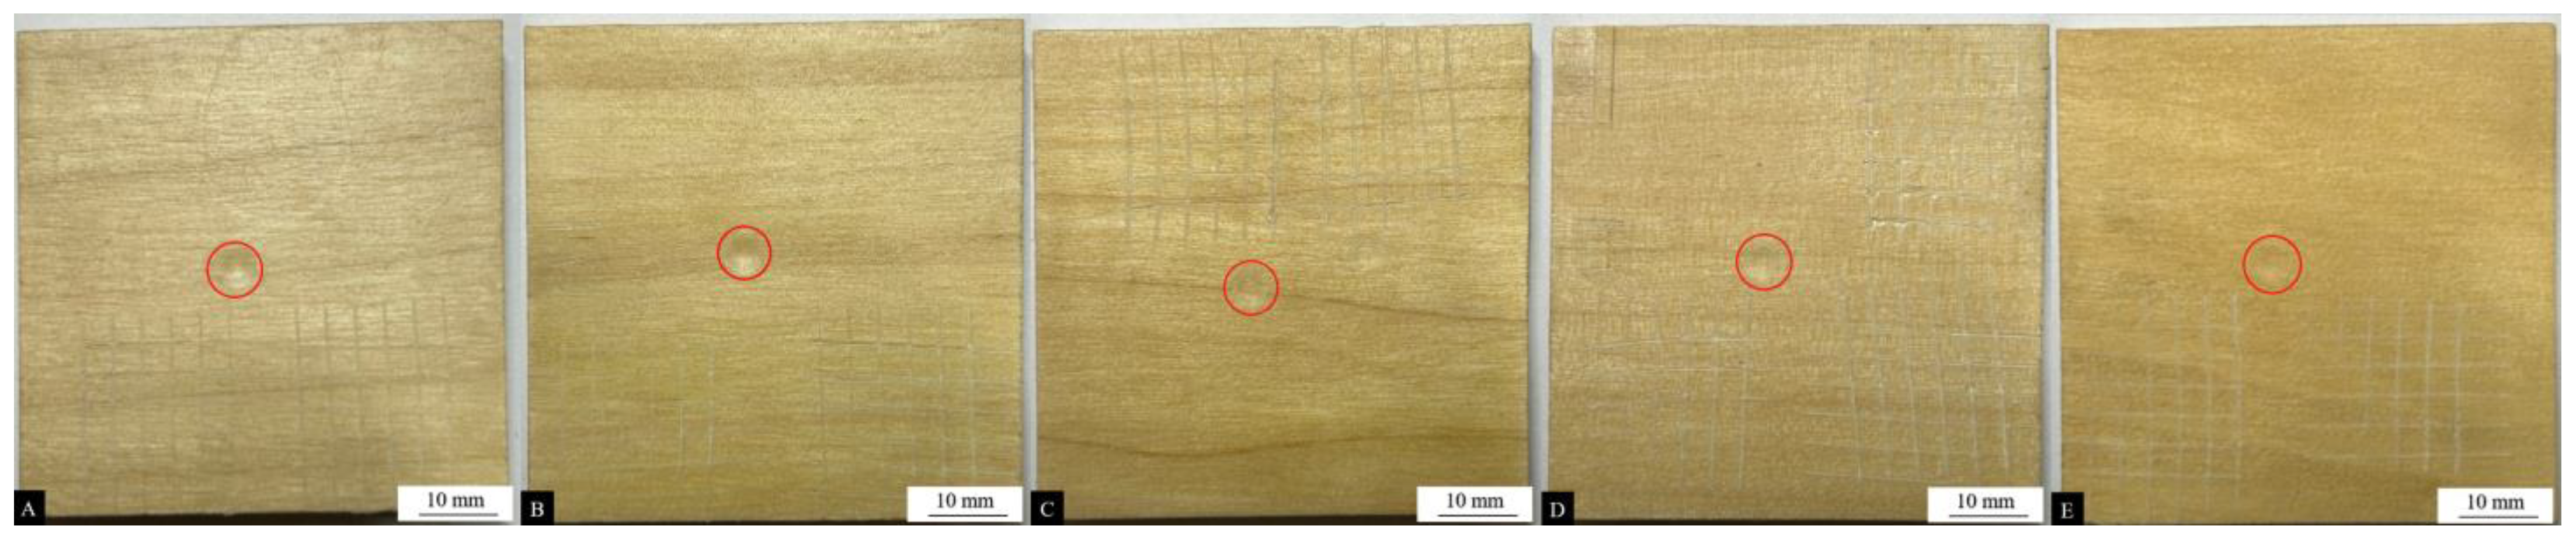
Figure 6.
Impact resistance test results of coatings (the red circle) with different contents of the #1 microcapsule type: (A) 0%, (B) 1%, (C) 3%, (D) 5%, (E) 7%, and (F) 9%.
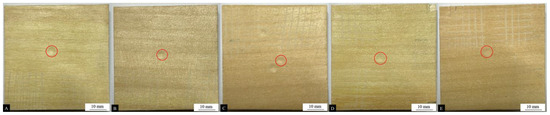
Figure 7.
Impact resistance test results of coatings (the red circle) with different contents of the #2 microcapsule type: (A) 1%, (B) 3%, (C) 5%, (D) 7%, and (E) 9%.
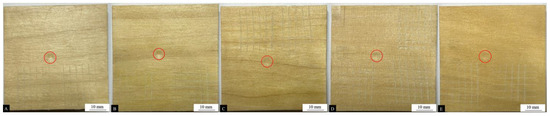
Figure 8.
Impact resistance test results of coatings (the red circle) with different contents of the #3 microcapsule type: (A) 1%, (B) 3%, (C) 5%, (D) 7%, and (E) 9%.
The Mcore:Mwall of UFRCTEMs had a significant impact on the impact resistance of the coating. As the Mcore:Mwall of UFRCTEMs increased, the impact resistance gradually improved. This is because the structure of UFRCTEMs is dense, and when they are added as solid powder fillers to waterborne coatings, UFRCTEMs can enhance the mechanical strength and suppress the cracking of the coating due to stress [53].
3.4.3. Adhesion of Surface Coating on Poplar Wood
Table 10 reflects the changes in the adhesion level of the surface coating of poplar wood. For UFRCTEMs with Mcore:Mwall of 0.6:1 and 0.8:1, when the microcapsule content was between 1.0% and 7.0%, the adhesion level of the coating remained stable at level 1. When the content of microcapsules exceeded 7.0%, the adhesion of the coating decreased to level 2. For UFRCTEMs with Mcore:Mwall of 1.2:1, when the microcapsule content was between 1.0% and 5.0%, the coating adhesion was level 1. When the content of microcapsules exceeded 5.0%, the adhesion of the coating decreased to level 2. Overall, the adhesion performance of UFRCTEMs in the coating was superior when the Mcore:Mwall was 0.6:1 and 0.8:1, while the surface adhesion level of UFRCTEM coatings with Mcore:Mwall of 1.2:1 was poor.
Table 10.
Adhesion grades of the poplar surface coatings with different Mcore:Mwall and different content.
The addition of UFRCTEMs disrupts the uniformity of waterborne coatings, causing an agglomeration and stress concentration in the coating, and thus reducing the coating adhesion [54].
3.4.4. Roughness of Surface Coating on Poplar Wood
The roughness values of coatings on poplar wood are shown in Table 11. The roughness value of the surface coating on poplar without microcapsules was 0.260 µm. When adding UFRCTEMs with Mcore:Mwall of 0.6:1, the coating roughness increased from 1.030 µm to 4.571 µm as the microcapsule content gradually increased. When the Mcore:Mwall of UFRCTEMs was 0.8:1, the coating roughness increased from 0.951 µm to 4.961 µm with the increase in microcapsule content. When the Mcore:Mwall of the added UFRCTEMs was 1.2:1, the coating roughness increased from 1.387 µm to 4.226 µm as the microcapsule content gradually increased.
Table 11.
Surface coating roughness of the poplar with different Mcore:Mwall and different content.
This is because the UFRCTEMs contain solid powder and cannot be uniformly dispersed when mixed with waterborne coatings, resulting in an uneven coating surface. In addition, the manual brushing process used also affects the uniformity and smoothness of the coating, thus increasing the roughness of the coating to a certain extent. Overall, the Mcore:Mwall of three UFRCTEM samples had a certain degree of influence on the coating roughness on the wood surface. The coating with 0.8:1 of Mcore:Mwall had a higher roughness, followed by the coating with 0.6:1 of Mcore:Mwall, and the coating with 1.2:1 of Mcore:Mwall had a lower roughness. This is because the morphology of UFRCTEMs can affect the surface smoothness of the coating. The UFRCTEMs with Mcore:Mwall of 0.8:1 tend to agglomerate more severely, resulting in an uneven dispersion of UFRCTEMs in waterborne topcoats and an increase in coating roughness values.
3.5. Antibacterial Properties of Surface Coatings on Poplar Wood
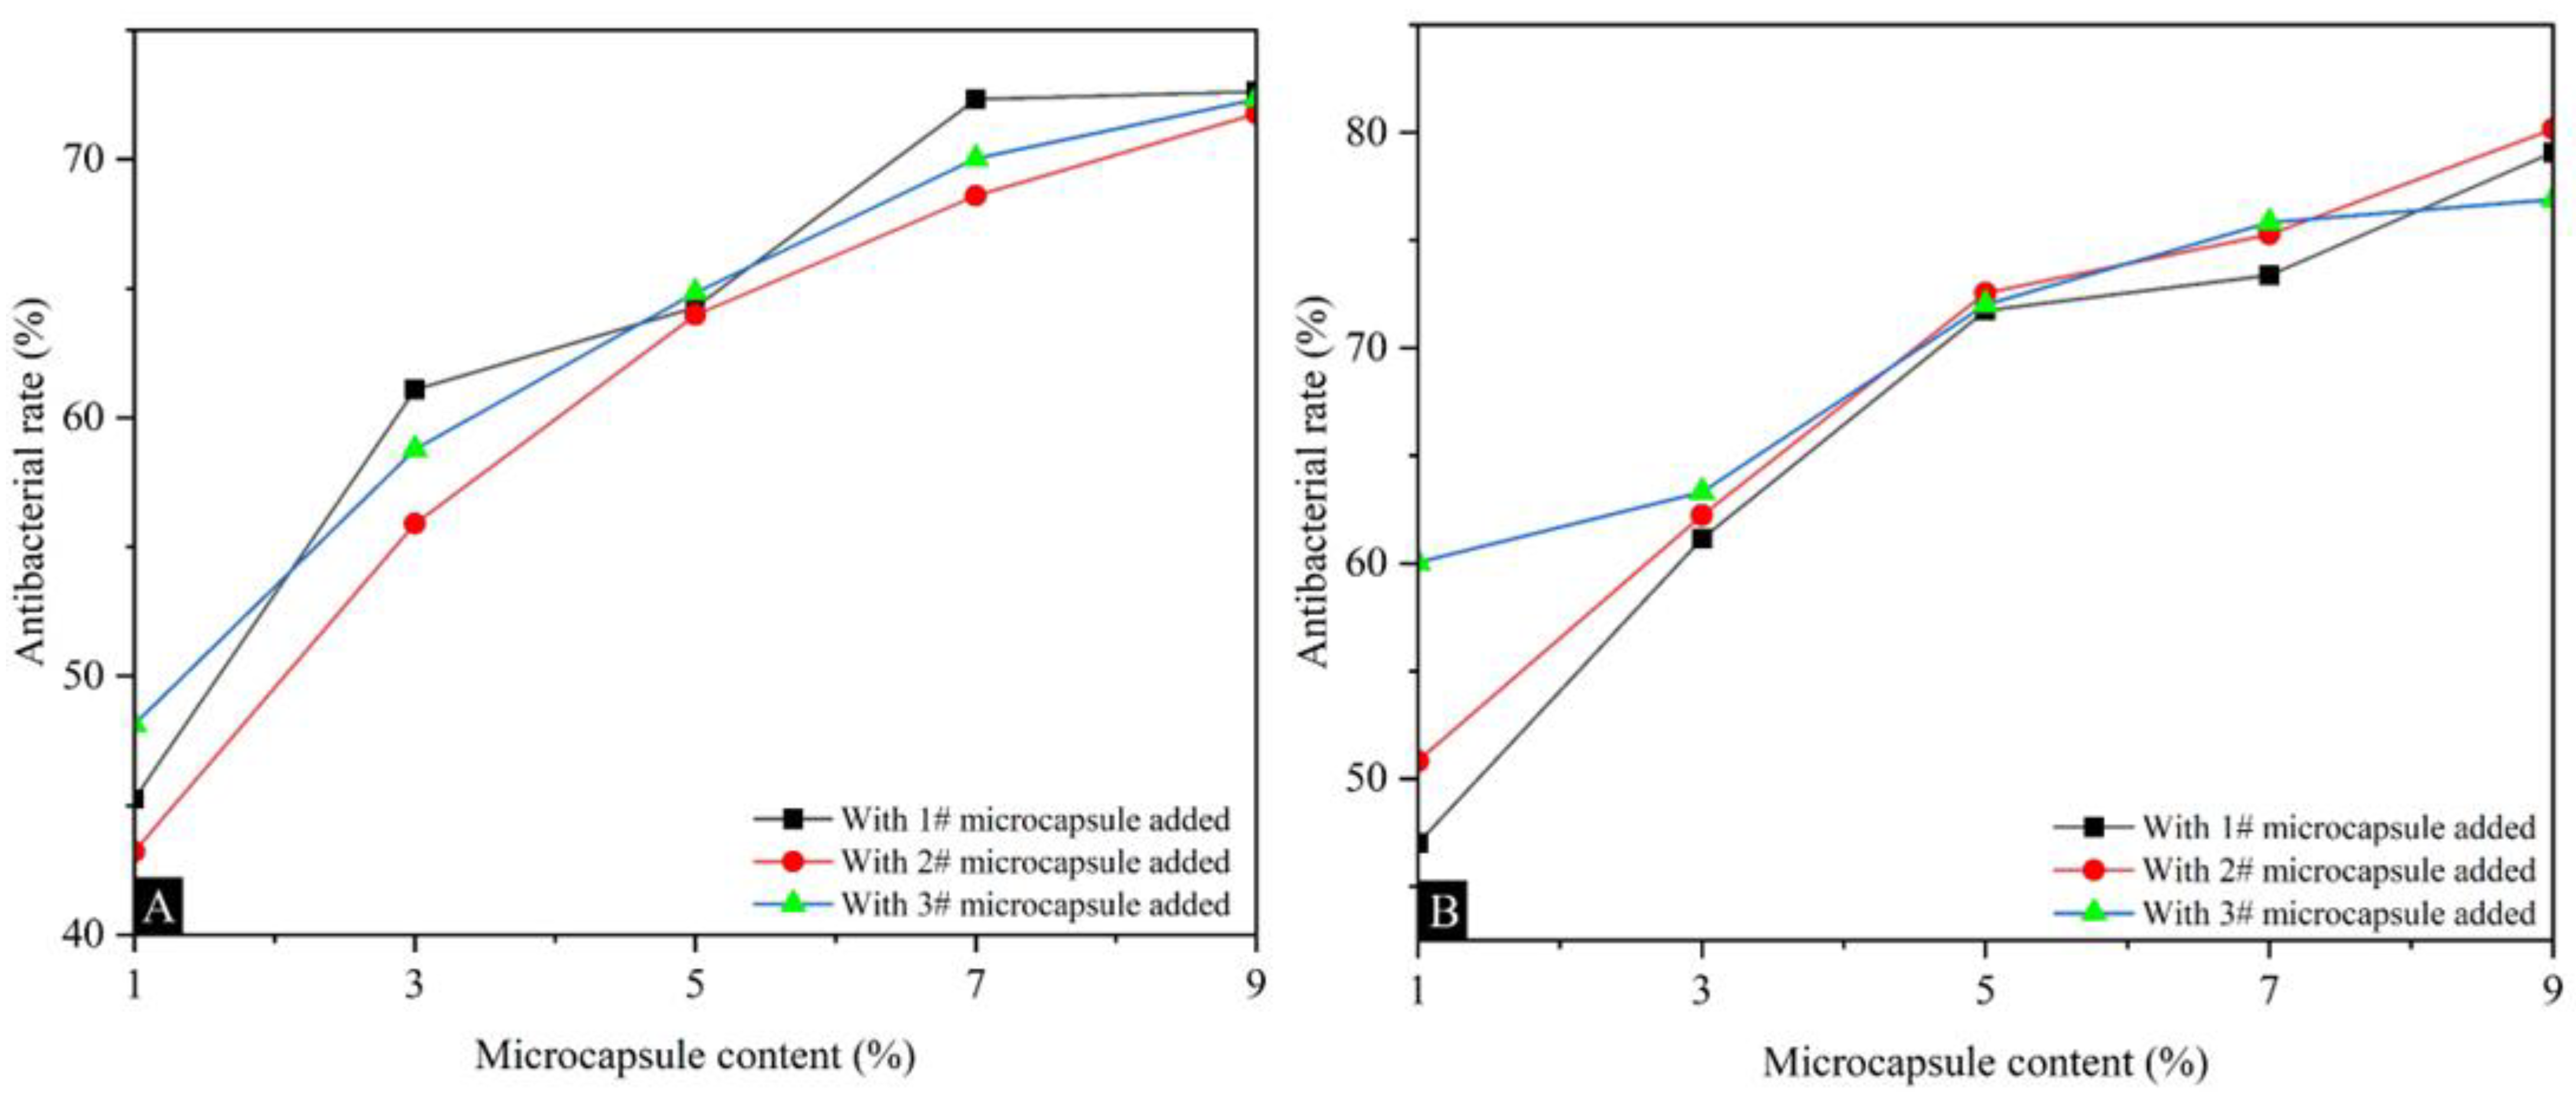
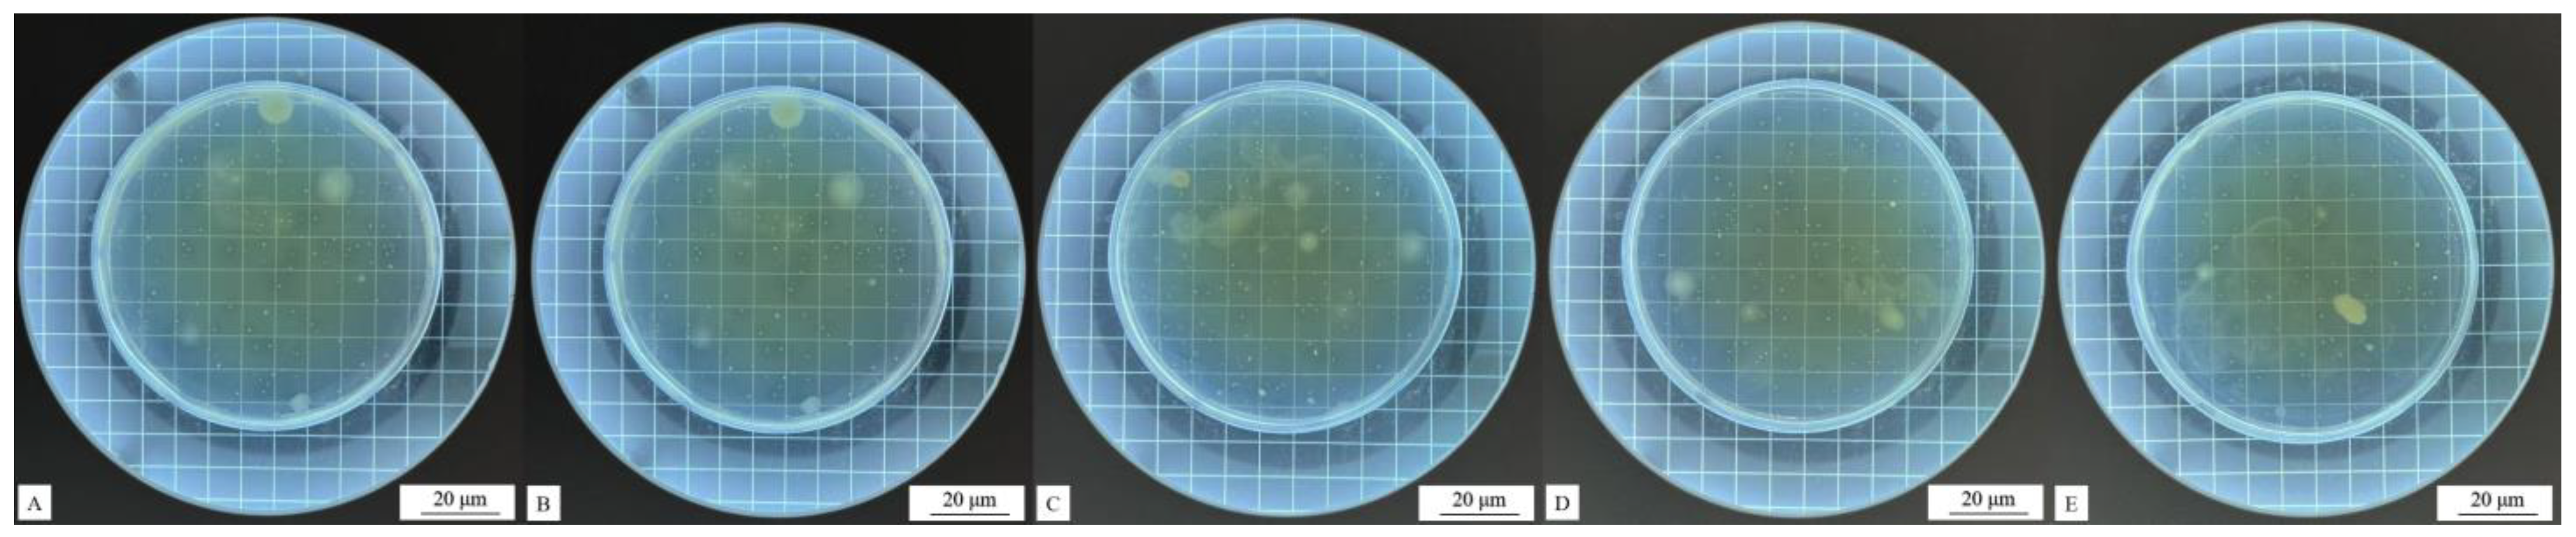
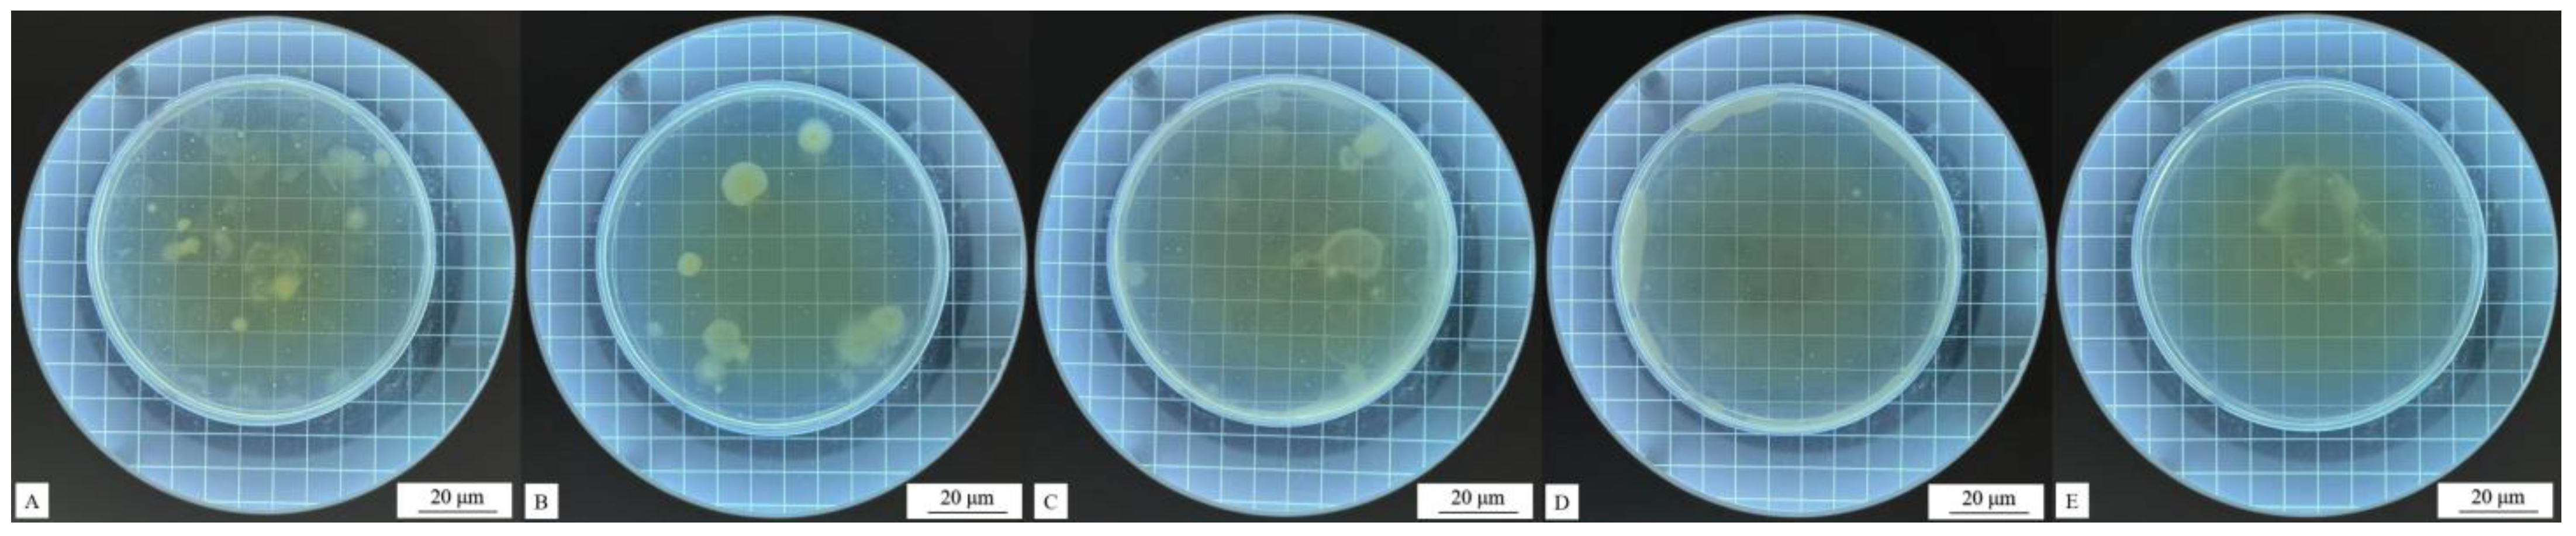
Table 12 shows the antibacterial rates of surface coatings on poplar against Escherichia coli and Staphylococcus aureus, and the average number of recovered colonies. The overall antibacterial rate of the three types of microcapsule coatings against Staphylococcus aureus was slightly higher than that of Escherichia coli, and the coating with Mcore:Mwall of 0.8:1 had the best comprehensive antibacterial rate. As the content of UFRCTEMs in the coating increased, the antibacterial rate of the coating also increased. Figure 9 shows the trend of antibacterial rate changes. Figure 10 and Figure 11 show the bacterial colonies of Escherichia coli in the culture dish after antibacterial testing with microcapsules #2 and #3. For Escherichia coli, when the content of UFRCTEMs in the coating was between 1.0% and 7.0%, the antibacterial rate increased significantly. When the content of UFRCTEMs was greater than 7.0%, the increase in antibacterial rate was gradual. For Staphylococcus aureus, when the content of UFRCTEMs in the coating was less than 5.0%, the antibacterial rate curve increased significantly. When the content of UFRCTEMs was greater than 7.0%, the antibacterial rate curve gradually stabilized. When adding UFRCTEMs with Mcore:Mwall of 0.6:1, the maximum antibacterial rate against Escherichia coli was 72.62%, and the maximum antibacterial rate against Staphylococcus aureus was 79.08%. When the Mcore:Mwall of UFRCTEMs was 0.8:1, the maximum antibacterial rate against Escherichia coli was 71.16%, and the maximum antibacterial rate against Staphylococcus aureus was 80.16%. When the Mcore:Mwall of UFRCTEMs was 1.2:1, the maximum antibacterial rate against Escherichia coli was 72.33%, and the maximum antibacterial rate against Staphylococcus aureus was 76.90%.
Table 12.
Average number of recovered colonies and antibacterial rate of the poplar surface coatings.
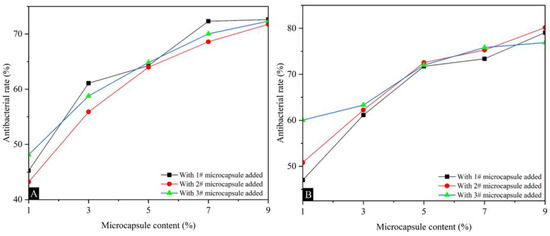
Figure 9.
The effects of UFRCTEMs with different Mcore:Mwall on the antibacterial rate of coatings: (A) antibacterial rate of Escherichia coli, (B) antibacterial rate of Staphylococcus aureus.
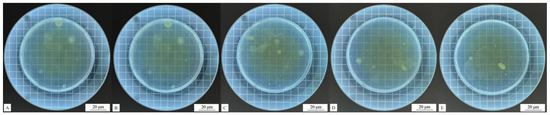
Figure 10.
Colony recovery of coatings with different contents of the #2 microcapsule type after the antibacterial test against Escherichia coli: (A) 1%, (B) 3%, (C) 5%, (D) 7%, and (E) 9%.
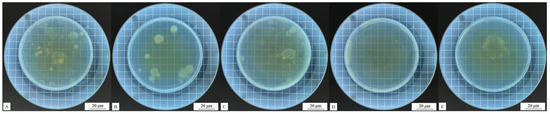
Figure 11.
Colony recovery of coatings with different contents of the #3 microcapsule type after the antibacterial test against Escherichia coli: (A) 1%, (B) 3%, (C) 5%, (D) 7%, and (E) 9%.
The addition of antibacterial microcapsules enhanced the antibacterial performance of waterborne coatings on the surface of poplar wood, proving that UFRCTEMs do indeed exert antibacterial effects.
3.6. Microscopic Morphology and Chemical Composition of Surface Coating on Poplar Wood
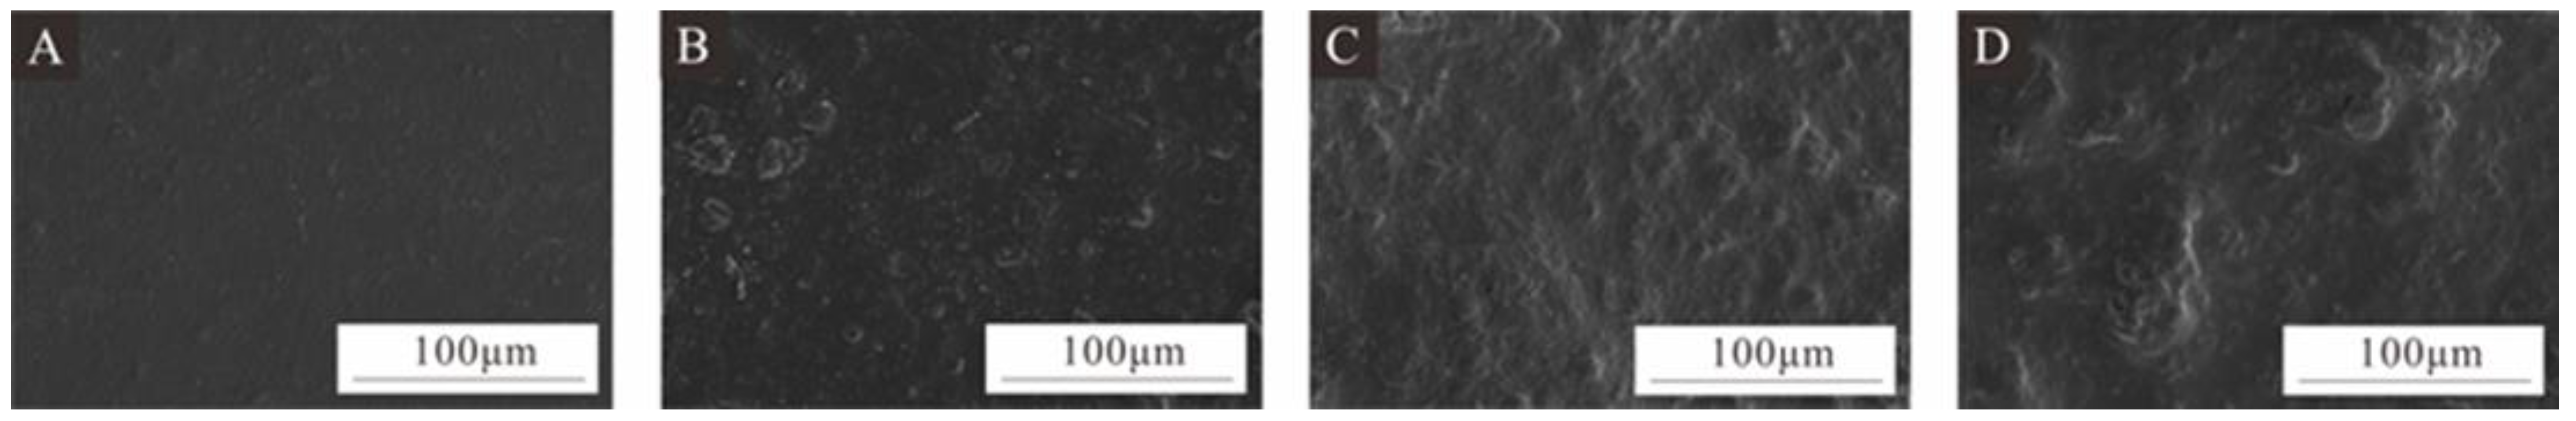
The coating with a 7.0% addition of UFRCTEMs had a better overall performance. Therefore, SEM analysis was performed on the coatings prepared using microcapsules with different Mcore:Mwall at 7.0% addition (Figure 12). The surface of the coating without UFRCTEMs was relatively flat, while the coating with Mcore:Mwall of 0.8:1 and 1.2:1 was relatively rough. Among them, the coating with Mcore:Mwall of 1.2:1 had significant protrusions on the surface. After adding microcapsules with Mcore:Mwall of 0.6:1, the coating showed less agglomeration and a smoother surface. At 7.0% additive content, the coating roughness values for Mcore:Mwall of 0.6:1, 0.8:1, and 1.2:1 were 3.522 µm, 3.759 µm, and 3.947 µm, respectively. The observed microstructure of the surface coating on the poplar wood was consistent with the roughness value analysis results.
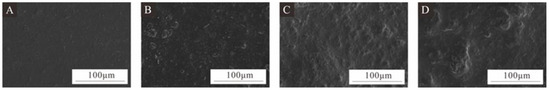
Figure 12.
SEM images of wood surface coatings prepared by adding 7.0% UFRCTEMs with different Mcore:Mwall: (A) without UFRCTEMs, (B) 0.6:1, (C) 0.8:1, and (D) 1.2:1.
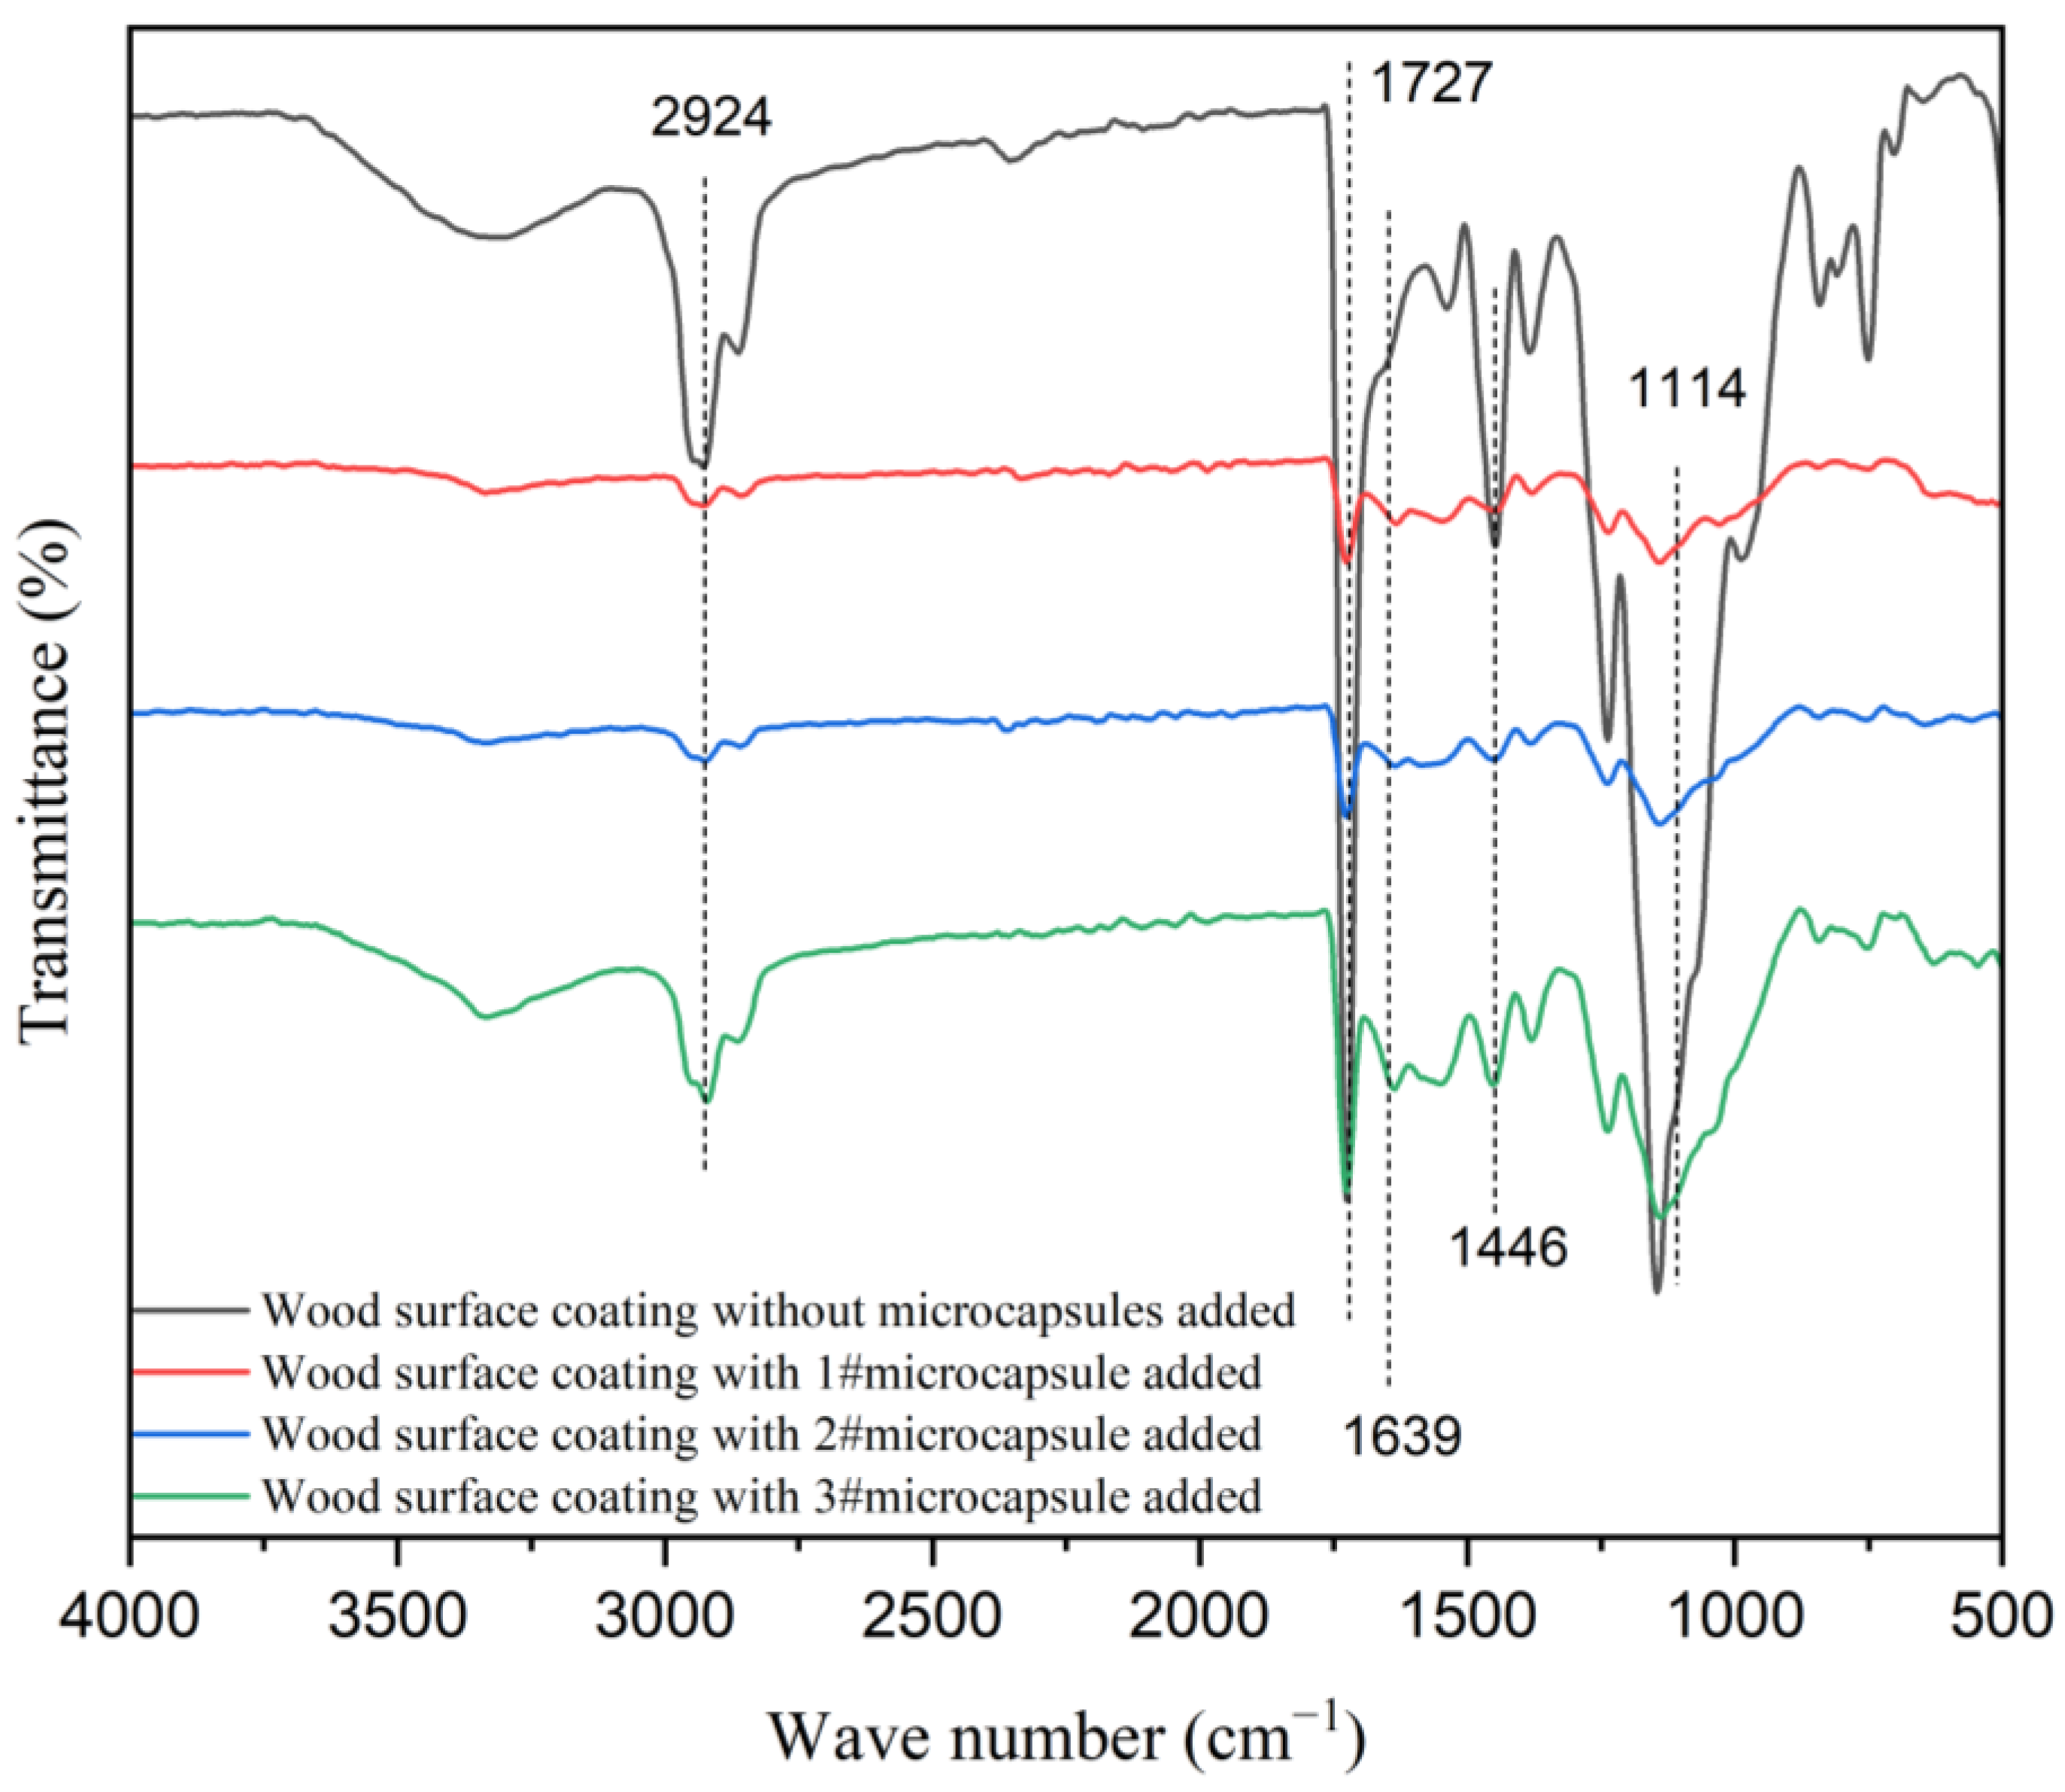
Figure 13 shows the infrared spectra of the waterborne coating on the surface of poplar with UFRCTEMs added and without UFRCTEMs added. The characteristic peak of around 1727 cm−1 belonged to the stretching vibration peak of C=O in waterborne coatings. The stretching vibration peaks of -CH3 and C=O in the urea–formaldehyde resin wall material of UFRCTEMs were located at 2924 cm−1 and 1639 cm−1, respectively [55]. The characteristic peak at 1114 cm−1 was the absorption peak of C-O in the UFRCTEM core material.
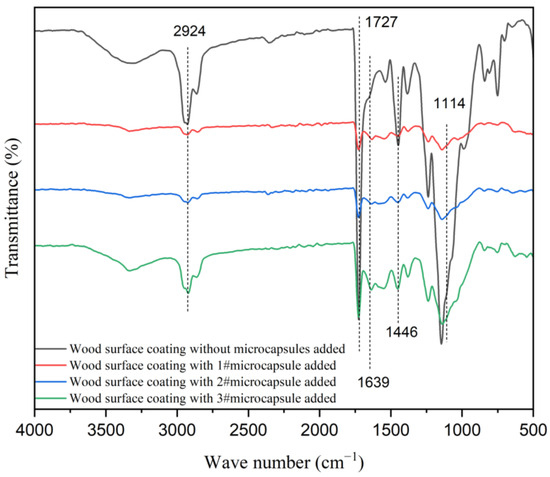
Figure 13.
Infrared spectra of UFRCTEM coatings with different Mcore:Mwall on a wood surface.
The above findings indicate that the chemical composition of the waterborne coating did not change after mixing with UFRCTEMs, and these results are consistent with the infrared analysis results of the UFRCTEMs.
3.7. Sectional Views Coatings with Different Mcore:Mwall on Wood Surface
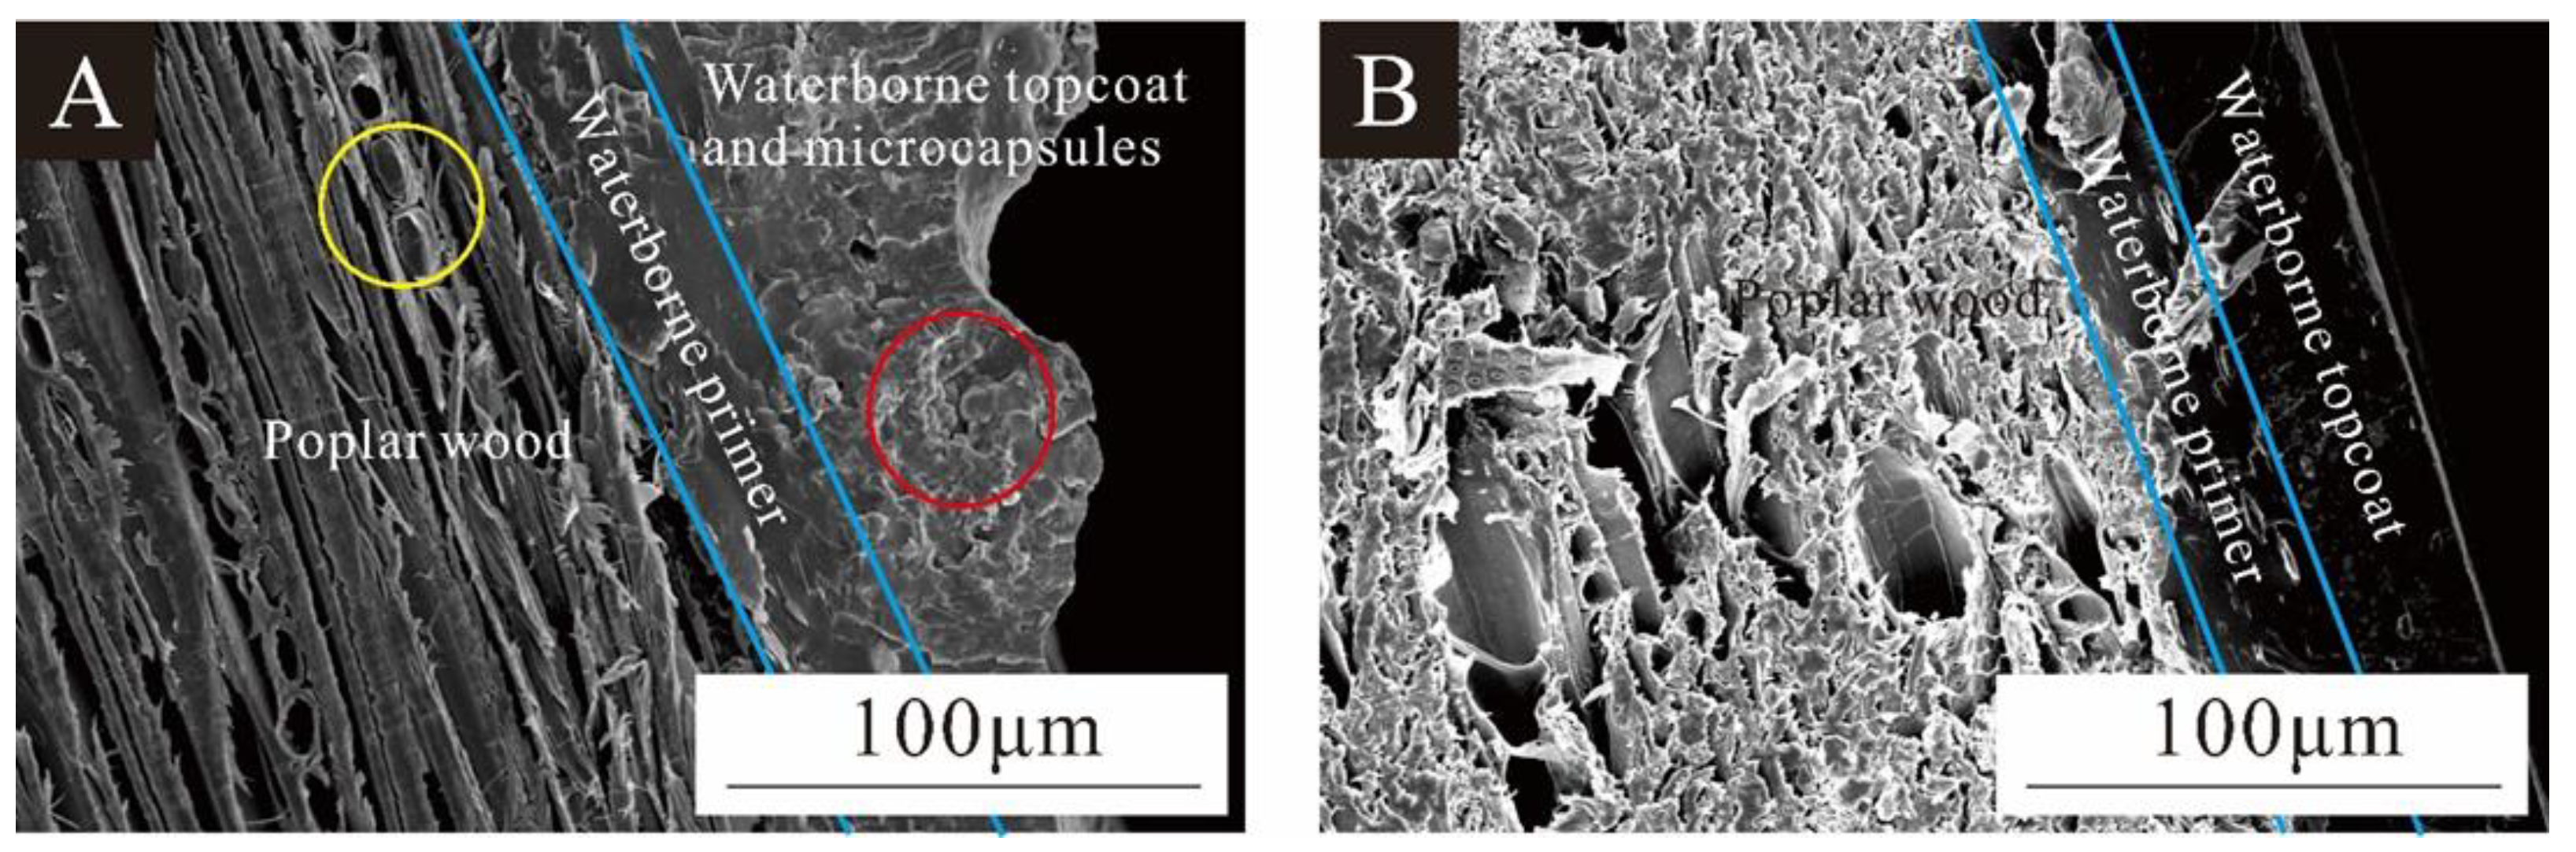
Figure 14 shows views of poplar wood coated with a UFRCTEM coating and a waterborne coating. Figure 14A shows the poplar layer, waterborne primer layer, and waterborne topcoat layer with UFRCTEMs added. The yellow circle indicates a small amount of waterborne primer penetrating and filling the conduit holes of poplar wood, while the red circle represents the UFRCTEMs distributed in the waterborne topcoat. In Figure 14A, the waterborne topcoat layer containing UFRCTEMs had poor flatness, while in Figure 14B, the section of the waterborne coating was relatively smooth and even. The results in Figure 9 are consistent with the optical and mechanical analysis results of the coating.
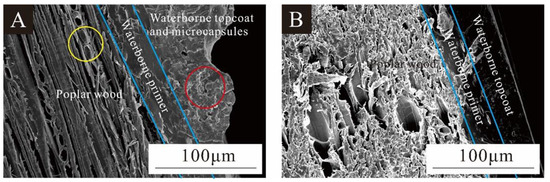
Figure 14.
SEM of the interface between the wood and the coating: (A) with UFRCTEM; (B) without UFRCTEM.
4. Conclusions
UFRCTEMs were added to waterborne paint and applied to poplar wood to explore the effects of different contents and Mcore:Mwall on the performance of waterborne coatings on the surface of poplar wood. Under different Mcore:Mwall of UFRCTEMs, as the content of UFRCTEMs increased, the glossiness and the visible light reflectance gradually decreased, and the light loss and the color difference gradually increased. Adding microcapsules to the coating improved the cold liquid resistance, enhanced the hardness, increased the surface roughness, and enhanced the impact resistance. However, to some extent, it weakened the adhesion. As the content of UFRCTEMs increased, the antibacterial rate against both bacteria showed an upward trend, and the overall antibacterial rate against Staphylococcus aureus was slightly higher than that against Escherichia coli. The UFRCTEMs in the coating did not react chemically with waterborne coatings, ensuring excellent performance of the UFRCTEMs. The coating on a poplar surface with Mcore:Mwall of 0.8:1 and UFRCTEM content of 7.0% had excellent comprehensive performance, ensuring good optical, cold liquid resistance, mechanical, and antibacterial properties of the coating. The glossiness was 3.43 GU, light loss was 75.55%, reflectance R value was 0.6699, color difference ΔE was 3.23, hardness was 2H, impact resistance level was level 3 at an impact height of 50 mm, adhesion level was level 1, and roughness value was 3.759 µm. The cold liquid resistance was excellent, with resistance to citric acid, ethanol, and cleaning agents of grade 1. The antibacterial rates against Escherichia coli and Staphylococcus aureus were 68.59% and 75.27%, respectively. These findings provide technical references for the application of UFRCTEMs in antibacterial coatings on poplar surfaces and expand their potential application prospects in industries such as coatings. The obtained microcapsule powder was relatively rough and adhesive, with a low encapsulation rate. Therefore, it was necessary to separate and purify the main antibacterial components of Toddalia asiatica (L.) Lam extract to prepare antibacterial microcapsules with better performance. The antibacterial performance of waterborne coatings on poplar wood surfaces was investigated after 48 h, without testing and analyzing the durability of microcapsules and the maximum antibacterial time of waterborne coatings containing microcapsules. Only microcapsules were added to waterborne topcoats, without exploring the effects of different methods of adding microcapsules and different types of wood on the surface coating. In the future, more in-depth exploration will be conducted on the above limitations.
Author Contributions
Conceptualization, methodology, writing—review and editing, Y.Z.; validation, resources, and data management, Y.W.; formal analysis, investigation, and supervision, X.Y. All authors have read and agreed to the published version of the manuscript.
Funding
This project was partly supported by Qing Lan Project and the Natural Science Foundation of Jiangsu Province (BK20201386).
Institutional Review Board Statement
Not applicable.
Informed Consent Statement
Not applicable.
Data Availability Statement
Data are contained within the article.
Conflicts of Interest
The authors declare no conflicts of interest.
References
- Brezina, D.; Michal, J.; Hlavácková, P. The Impact of Natural Disturbances on the Central European Timber Market—An Analytical Study. Forests 2024, 15, 592. [Google Scholar] [CrossRef]
- Wang, C.; Yu, J.H.; Jiang, M.H.; Li, J.Y. Effect of selective enhancement on the bending performance of fused deposition methods 3D-printed PLA models. BioResources 2024, 19, 2660–2669. [Google Scholar] [CrossRef]
- Wu, W.; Xu, W.; Wu, S. Mechanical performance analysis of double-dovetail joint applied to furniture T-shaped components. BioResources 2024, 19, 5862–5879. [Google Scholar] [CrossRef]
- Zhang, N.; Xu, W.; Tan, Y. Multi-attribute hierarchical clustering for product family division of customized wooden doors. Bioresources 2023, 18, 7889–7904. [Google Scholar] [CrossRef]
- Singh, A.P.; Kim, Y.S.; Chavan, R.R. Relationship of wood cell wall ultrastructure to bacterial degradation of wood. IAWA J. 2019, 40, 845–870. [Google Scholar] [CrossRef]
- Hu, J.; Liu, Y.; Wang, J.X.; Xu, W. Study of selective modification effect of constructed structural color layers on European beech wood surfaces. Forests 2024, 15, 261. [Google Scholar] [CrossRef]
- Hu, W.; Yu, R. Study on the strength mechanism of the wooden round-end mortise-and-tenon joint using the digital image correlation method. Holzforschung 2024. [Google Scholar] [CrossRef]
- Hu, W.G.; Li, S.; Liu, Y. Vibrational characteristics of four wood species commonly used in wood products. BioResources 2021, 16, 7100–7110. [Google Scholar] [CrossRef]
- Wu, S.S.; Tao, X.; Xu, W. Thermal conductivity of poplar wood veneer impregnated with graphene/polyvinyl alcohol. Forests 2021, 12, 777. [Google Scholar] [CrossRef]
- Wu, S.S.; Zhou, J.C.; Xu, W. A convenient approach to manufacturing lightweight and high-sound-insulation plywood using furfuryl alcohol/multilayer graphene oxide as a shielding layer. Wood Mater. Sci. Eng. 2024, 1–8. [Google Scholar] [CrossRef]
- Hu, W.G.; Liu, N.; Guan, H.Y. Experimental and numerical study on methods of testing withdrawal resistance of mortise-and-tenon joint for Wood products. Forests 2020, 11, 280. [Google Scholar] [CrossRef]
- Qi, Y.Q.; Zhang, Z.Q.; Sun, Y.; Shen, L.M.; Han, J.L. Study on the process optimization of peanut coat pigment staining of poplar wood. Forests 2024, 15, 504. [Google Scholar] [CrossRef]
- Qi, Y.Q.; Sun, Y.; Zhou, Z.W.; Huang, Y.; Li, J.X.; Liu, G.Y. Response surface optimization based on freeze-thaw cycle pretreatment of poplar wood dyeing effect. Wood Res. 2023, 68, 293–305. [Google Scholar] [CrossRef]
- Wu, X.Y.; Yang, F.; Gan, J.; Kong, Z.Q.; Wu, Y. A Superhydrophobic, Antibacterial, and Durable Surface of Poplar Wood. Nanomaterials 2021, 11, 1885. [Google Scholar] [CrossRef]
- Wan, B.Y.; Tian, L.X.; Fu, M.; Zhang, G.Y. Green development growth momentum under carbon neutrality scenario. J. Clean. 2021, 316, 128327. [Google Scholar] [CrossRef]
- Wang, C.; Zhang, C.Y.; Zhu, Y. Reverse design and additive manufacturing of furniture protective foot covers. BioResources 2024, 19, 4670–4678. [Google Scholar] [CrossRef]
- Zhao, Z.N.; Niu, Y.T.; Chen, F.Y. Development and Finishing Technology of Waterborne UV Lacquer-Coated Wooden Flooring. BioResources 2021, 16, 1101–1114. [Google Scholar] [CrossRef]
- Tompros, A.; Wilber, M.Q.; Fenton, A.; Carter, E.D.; Gray, M.J. Efficacy of Plant-Derived Fungicides at Inhibiting Batrachochytrium salamandrivorans Growth. J. Fungi 2022, 8, 1025. [Google Scholar] [CrossRef]
- Sang, R.J.; Yang, F. Effect of TiO2@CaCO3 waterborne primer on the coloring performance of inkjet-printed wood product coatings. Coatings 2023, 13, 2071. [Google Scholar] [CrossRef]
- Sang, R.J.; Yang, F.; Fan, Z.X. The effect of water-based primer pretreatment on the performance of water-based inkjet coatings on wood surfaces. Coatings 2023, 13, 1649. [Google Scholar] [CrossRef]
- Martins, C.H.G. Antibacterial Agents from Natural Sources. Molecules 2024, 29, 644. [Google Scholar] [CrossRef]
- Qi, Y.Q.; Zhou, Z.W.; Xu, R.; Dong, Y.T.; Liu, M.J.; Shen, L.M.; Han, J.L. Research on the dyeing properties of Chinese fir using ultrasonic-assisted mulberry pigment dyeing. Forests 2023, 14, 1832. [Google Scholar] [CrossRef]
- Qi, Y.Q.; Liu, G.Y.; Zhang, Z.; Zhou, Z.W. Optimization of green extraction process of Cinnamomum camphora fruit dye and its performance by response surface methodology. BioResources 2023, 18, 4916–4934. [Google Scholar] [CrossRef]
- Faccio, G. Plant Complexity and Cosmetic Innovation. iScience 2020, 23, 101358. [Google Scholar] [CrossRef]
- Aziz, I.M.; Alshalan, R.M.; Rizwana, H.; Alkhelaiwi, F.; Almuqrin, A.M.; Aljowaie, R.M.; Alkubaisi, N.A. Chemical Composition, Antioxidant, Anticancer, and Antibacterial Activities of Roots and Seeds of Ammi visnaga L. Methanol Extract. Pharmaceuticals 2024, 17, 121. [Google Scholar] [CrossRef] [PubMed]
- Li, P.; Lei, K.; Ji, L.S. Characterization of the complete chloroplast genome of Toddalia asiatica (L.) Lam. Mitochondrial DNA B 2021, 16, 1650–1651. [Google Scholar] [CrossRef] [PubMed]
- Zeng, Z.; Tian, R.; Feng, J.; Yang, N.A.; Yuan, L. A systematic review on traditional medicine Toddalia asiatica (L.) Lam.: Chemistry and medicinal potential. Saudi Pharm. J. 2021, 29, 781–798. [Google Scholar] [CrossRef]
- Kowalczyk, P.; Koszelewski, D.; Brodzka, A.; Kramkowski, K.; Ostaszewski, R. Evaluation of Antibacterial Activity against Nosocomial Pathogens of an Enzymatically Derived α-Aminophosphonates Possessing Coumarin Scaffold. Int. J. Mol. Sci. 2023, 24, 14886. [Google Scholar] [CrossRef]
- Li, Y.D.; Guan, J.P.; Tang, R.C.; Qiao, Y.F. Application of Natural Flavonoids to Impart Antioxidant and Antibacterial Activities to Polyamide Fiber for Health Care Applications. Antioxidants 2019, 8, 301. [Google Scholar] [CrossRef]
- Yan, Y.M.; Li, X.; Zhang, C.H.; Lv, L.J.; Gao, B.; Li, M.H. Research Progress on Antibacterial Activities and Mechanisms of Natural Alkaloids: A Review. Antibiotics 2021, 10, 318. [Google Scholar] [CrossRef]
- Masyita, A.; Sari, R.M.; Astuti, A.D.; Yasir, B.; Rumata, N.R.; Bin Emran, T.; Nainu, F.; Simal-Gandara, J. Terpenes and terpenoids as main bioactive compounds of essential oils, their roles in human health and potential application as natural food preservatives. Food Chem. X 2022, 13, 100217. [Google Scholar] [CrossRef] [PubMed]
- Raj, M.K.; Balachandran, C.; Duraipandiyan, V.; Agastian, P.; Ignacimuthu, S. Antimicrobial activity of Ulopterol isolated from Toddalia asiatica (L.) Lam.: A traditional medicinal plant. J. Ethnopharmacol. 2012, 140, 161–165. [Google Scholar]
- Roshan, A.B.; Venkatesh, H.N.; Dubery, N.K.; Mohana, D.C. Chitosan-based nanoencapsulation of Toddalia asiatica (L.) Lam. essential oil to enhance antifungal and aflatoxin B1 inhibitory activities for safe storage of maize. Int. J. Biol. Macromol. 2022, 204, 476–484. [Google Scholar] [CrossRef] [PubMed]
- Zhu, Y.; Wang, Y.; Yan, X.X. Preparation of chitosan-coated Toddalia asiatica (L.) Lam extract microcapsules and its effect on coating antibacterial properties. Coatings 2024, 14, 942. [Google Scholar] [CrossRef]
- Wang, Y.; Yan, X.X. Preparation of Toddalia asiatica (L.) Lam. Extract Microcapsules and Their Effect on Optical, Mechanical and Antibacterial Performance of Waterborne Topcoat Paint Films. Coatings 2024, 14, 655. [Google Scholar] [CrossRef]
- GB/T 11186.3-1989; Methods for Measuring the Color of Coatings—Part 3: Calculation of Color Difference. Standardization Administration of the People’s Republic of China: Beijing, China, 1989.
- GB/T 4893.6-2013; Testing of Physical and Chemical Properties of Furniture Surface Paint Films—Part 6: Gloss Determination Method. Standardization Administration of the People’s Republic of China: Beijing, China, 2013.
- GB/T 4893.1-2021; Test of Surface Coatings of Furniture—Part 1: Determination of Surface Resistance to Cold Liquids. Stanardization Administration of the People’s Republic of China: Beijing, China, 2021.
- GB/T 21866-2008; Test Method and Effect for Antibacterial Capability of Paints Film. Standardization Administration of the People’s Republic of China: Beijing, China, 2008.
- GB/T 4789.2-2022; Microbiological Examination of Food Hygiene—Aerobic Plate Count. Standardization Administration of the People’s Republic of China: Beijing, China, 2022.
- GB/T 6739-2022; Paints and Varnishes—Determination of Film Hardness by Pencil Test. Standardization Administration of the People’s Republic of China: Beijing, China, 2022.
- GB/T 4893.9-2013; Test of Surface Coatings of Furniture—Part 9: Determination of Resistance to Impact. Standardization Administration of the People’s Republic of China: Beijing, China, 2013.
- GB/T 4893.4-2013; Test of Surface Coating of Furniture—Part 4: Determination of Adhesion by Cross-Cut. Standardization Administration of the People’s Republic of China: Beijing, China, 2013.
- Ma, W.Y.; Ali, I.; Li, Y.L.; Hussain, H.; Zhao, H.Z.; Sun, X.; Xie, L.; Cui, L.; Wang, D.J. A Simple and Efficient Two-Dimensional High-Speed Counter-Current Chromatography Linear Gradient and Isocratic Elution Modes for the Preparative Separation of Coumarins from Roots of Toddalia asiatica (Linn.) Lam. Molecules 2021, 26, 5986. [Google Scholar] [CrossRef] [PubMed]
- Yan, X.X.; Tao, Y.; Qian, X.Y. Preparation and Optimization of Waterborne Acrylic Core Microcapsules for Waterborne Wood Coatings and Comparison with Epoxy Resin Core. Polymers 2020, 12, 2366. [Google Scholar] [CrossRef] [PubMed]
- Gangopadhyay, A. Plant-derived natural coumarins with anticancer potentials: Future and challenges. J. Herb. Med. 2023, 42, 100797. [Google Scholar] [CrossRef]
- Zhou, J.C.; Xu, W. A fast method to prepare highly isotropic and optically adjustable transparent wood-based composites based on interface optimization. Ind. Crops Prod. 2024, 218, 118898. [Google Scholar] [CrossRef]
- Hu, J.; Liu, Y.; Xu, W. Impact of cellular structure on the thickness and light reflection properties of structural color layers on diverse wood surfaces. Wood Mater. Sci. Eng. 2024, 1–11. [Google Scholar] [CrossRef]
- Lim, T.; Bae, S.H.; Yu, S.H.; Baek, K.Y.; Cho, S. Near-Infrared Reflective Dark-Tone Bilayer System for LiDAR-Based Autonomous Vehicles. Macromol. Res. 2022, 30, 342–347. [Google Scholar] [CrossRef]
- Hu, W.G.; Wan, H. Comparative study on weathering durability properties of phenol formaldehyde resin modified sweetgum and southern pine specimens. Maderas Cienc. Tecnol. 2022, 24, 100417. [Google Scholar] [CrossRef]
- Hazir, E.; Koc, K.H. Evaluation of wood surface coating performance using water based, solvent based and powder coating. Maderas Cienc. Tecnol. 2019, 21, 467–480. [Google Scholar] [CrossRef]
- GB/T 3324-2017; General Technical Requirements for Wooden Furniture. Standardization Administration of the People’s Republic of China: Beijing, China, 2017.
- Jia, X.; Zeng, H.H.; Gao, Q.; Huang, Z.X.; Bai, X.J.; Zhao, Y.; Zhao, H.F. Impact Resistance and Structural Optimization of POZD Coated Composite Plates. Int. J. Crashworthiness 2023, 28, 601–615. [Google Scholar] [CrossRef]
- Tao, X.; Tian, D.X.; Liang, S.Q.; Li, S.M.; Peng, L.M.; Fu, F. Enhanced Paint Adhesion of Puffed Wood-Based Metal Composites via Surface Treatment with Silane Coupling Agent. Wood Mater. Sci. Eng. 2023, 19, 573–579. [Google Scholar] [CrossRef]
- Yan, X.X.; Zhao, W.T.; Wang, L.; Qian, X.Y. Effect of Microcapsule Concentration with Different Core-Shell Ratios on Waterborne Topcoat Film Properties for Tilia europaea. Coatings 2021, 11, 1013. [Google Scholar] [CrossRef]

Disclaimer/Publisher’s Note: The statements, opinions and data contained in all publications are solely those of the individual author(s) and contributor(s) and not of MDPI and/or the editor(s). MDPI and/or the editor(s) disclaim responsibility for any injury to people or property resulting from any ideas, methods, instructions or products referred to in the content. |
© 2024 by the authors. Licensee MDPI, Basel, Switzerland. This article is an open access article distributed under the terms and conditions of the Creative Commons Attribution (CC BY) license (https://creativecommons.org/licenses/by/4.0/).