Article

Numerical Investigation of the Effects of Process Parameters on Temperature Distribution and Cladding-Layer Height in Laser Cladding

School of Mechanical Engineering, Jiangsu University, Zhenjiang 212013, China
*
Author to whom correspondence should be addressed.
Coatings 2024, 14(8), 1020; https://doi.org/10.3390/coatings14081020
Submission received: 11 July 2024 / Revised: 6 August 2024 / Accepted: 7 August 2024 / Published: 12 August 2024
(This article belongs to the Section Laser Coatings)

Abstract

:
To delve into the effects of process parameters on temperature distribution and cladding-layer height in laser cladding, as well as the interaction between these two aspects, a thermal–fluid coupling numerical model was established considering process parameters (i.e., laser power and scanning velocity), the Marangoni effect, molten pool dynamics, and solid–liquid transition. The numerical findings indicate that the Marangoni effect is the main factor for the growth of the cladding layer. The cladding-layer height increasingly influences heat-transfer efficiency as it develops. Higher laser power or lower scanning velocity, or a combination of both, can lead to higher cladding temperatures and greater cladding-layer height. Under the combination of laser power of 1750 W and scanning velocity of 4 mm/s, the numerical simulation predicts a cladding-layer height of 1.12 mm, which closely aligns with the experimentally determined height of 1.11 mm. Additionally, the comprehensive error being below 5% demonstrates the model’s considerable instructional value for practical applications.

1. Introduction

As a common additive manufacturing method [1,2,3], laser-cladding technology is a process that uses a high-energy laser beam as a heat source to generate a high-temperature molten pool on the surface of the substrate and a metallurgical bonding layer with the cladding material to ultimately improve the surface properties of the substrate. This technology not only reduces material costs but also significantly enhances the service life of components [4,5]. Therefore, laser cladding holds great potential for application in part repair [6] and has been widely utilized in surface modification.
As the main component of automobile body manufacturing, hot working dies easily wear and crack on the surface due to long-term service under high temperature and pressure, thereby reducing product quality and ultimately shortening the service life of the hot working die. Consequently, applying laser cladding to the surface of a hot working die can significantly enhance its service life. Moreover, due to the cooling characteristics and temperature distribution of the metal material, solid–liquid transition occurs at the edge of the molten pool. The Marangoni effect is a phenomenon of mass transfer caused by surface-tension gradients, which will affect the growth of the cladding-layer height. In addition, the temperature distribution also has an impact on the surface tension and thus on the Marangoni effect [7].
To date, various numerical simulations and experimental measurements have been conducted. Lv et al. [8] constructed a finite element model to analyze the macroscopic temperature distribution in the laser-cladding process and applied a cellular automaton method integrated with finite element analysis to depict the microstructure development of an IN718 alloy. Tamanna et al. [9] used a titanium alloy as the substrate to conduct a three-dimensional simulation of a cladding layer of different materials and obtained appropriate cladding materials by comparing stress distribution. Chai et al. [10] studied the morphology of the cladding layer by using a cellular automaton simulation model, which considered the thermophysical properties and the interaction between powder and beam. To forecast the solidification dynamics of the molten pool and the development patterns of the cladding layer, Chen et al. [11] established a three-dimensional numerical model of fluid–heat coupling considering powder influence. Gao et al. [12] constructed a numerical prediction model that integrates phase transition dynamics, employing the birth–death element method to analyze the stress and temperature distributions. This model provides a deeper insight into the complex interplay of mechanical and thermal behaviors during phase change processes. Taisei Izumi et al. [13] also investigated the laser-cladding stress field by using the birth–death element method.
Compared with the above, more specific fixing and preheating schemes were proposed to reduce the residual stress. Yousub Lee et al. [14] established a numerical model of additive and subtraction manufacturing using finite element technology, which simplified the martensitic transformation of materials, and verified the model using neutron diffraction technology. Li et al. [15] obtained the relevant thermal property parameters by calculating the phase diagram and then established a multi-field coupled finite element analysis model, which studied the flow field of the molten pool. The morphology calculated by the model is consistent with that of the experiment. Li et al. [16] established a mathematical analysis model considering the Marangoni effect and gravity effect and conducted research and experimental verification on inclined plane multi-track laser cladding. Meng et al. [17] proposed a multi-field coupled transient model to study the crack mechanism induced by pores in the cladding layer and experimentally verified the residual stress of the model.
In order to study the non-isothermal flow of the molten pool during laser cladding, Jie et al. [7] established a three-dimensional numerical model considering phase transformation, thermal properties, and buoyancy, and they tested the microhardness. Baoxian Nie et al. [18] established a finite element numerical model to study the difference in element distribution caused by molten pool flow in the process of laser cladding. The model shows that the faster the laser-scanning velocity, the more obvious the convection in the molten pool. Shen et al. [19], Song et al. [20], and Nikhil Thawari et al. [21] all established transient numerical models and studied the morphology and temperature evolution of the molten pool during the cladding process. Wang et al. [22], in their pursuit to forecast the variations and distribution of powder temperature during the laser-cladding process, have crafted a sophisticated numerical calculation model. This model takes into account the influential effects of air flow on temperature dynamics. Wu et al. [23] conducted an analysis of the temperature and stress distributions within the composite cladding layer. To achieve this, they developed a transient three-dimensional finite element model. This model provides a dynamic framework for understanding the complex interactions between thermal and mechanical properties during the cladding process, thereby enhancing the predictive capabilities in the realm of composite material applications. Xi et al. [24] conducted a numerical prediction for a complex cladding structure, while Yan et al. [25] predicted the influence of process parameters on the welding temperature field. Doaa Youssef et al. [26] established a transient numerical model based on finite difference analysis and used the model to simulate the growth process of the molten pool and the size of the cladding layer with a substrate of TC4.
The quality of the cladded component, such as microstructure and mechanical properties, is mainly affected by the temperature distribution and cladding-layer height [27,28,29]. Process parameters (laser power and scanning speed) are the most direct control variables in the laser-cladding process. It is of great significance to explore the impact of process parameters on the temperature distribution and cladding-layer height [30,31]. However, quantitative studies on the effects of process parameters (laser power and scanning velocity) on temperature distribution and cladding-layer height are insufficient for hot working dies. At the same time, the numerical models for calculating the temperature distribution and cladding-layer height are relatively crude. Therefore, in this study, a thermal–fluid coupling numerical model was established considering process parameters (i.e., laser power and scanning velocity), the Marangoni effect, molten pool dynamics, and solid–liquid transition. In addition, the model was used to study how process parameters affect temperature distribution and cladding height in laser cladding, as well as the interplay between temperature distribution and cladding-layer height.

2. Establishment of Numerical Model of Laser Cladding

2.1. Material Selection and the Thermophysical Properties of Materials

AISI H13 steel is a typical material in mold manufacturing around the world. Its chemical composition is shown in Table 1. Because of its high toughness, good wear resistance, thermal fatigue resistance, and thermal stability, AISI H13 steel is widely used in hot stamping dies, hot extrusion dies, and other hot working dies.
Fe-based alloy powder is suitable for parts requiring wear resistance and easy deformation, and its chemical composition is shown in Table 2. Its comprehensive performance and price are better; thus, it has become the most widely studied and useful cladding material. The cladding layer is more similar to the AISI H13 in phase because of the similar elemental composition of the Fe-based alloy powder and AISI H13, so the cladding layer and substrate can achieve closer metallurgical bonding.
According to the chemical composition of the substrate and powder, the physical characteristics of the substrate and powder changing with temperature are calculated based on the Calculation of Phase Diagrams [11,15] and simulation of JMatPro [7,23], as shown in Figure 1.

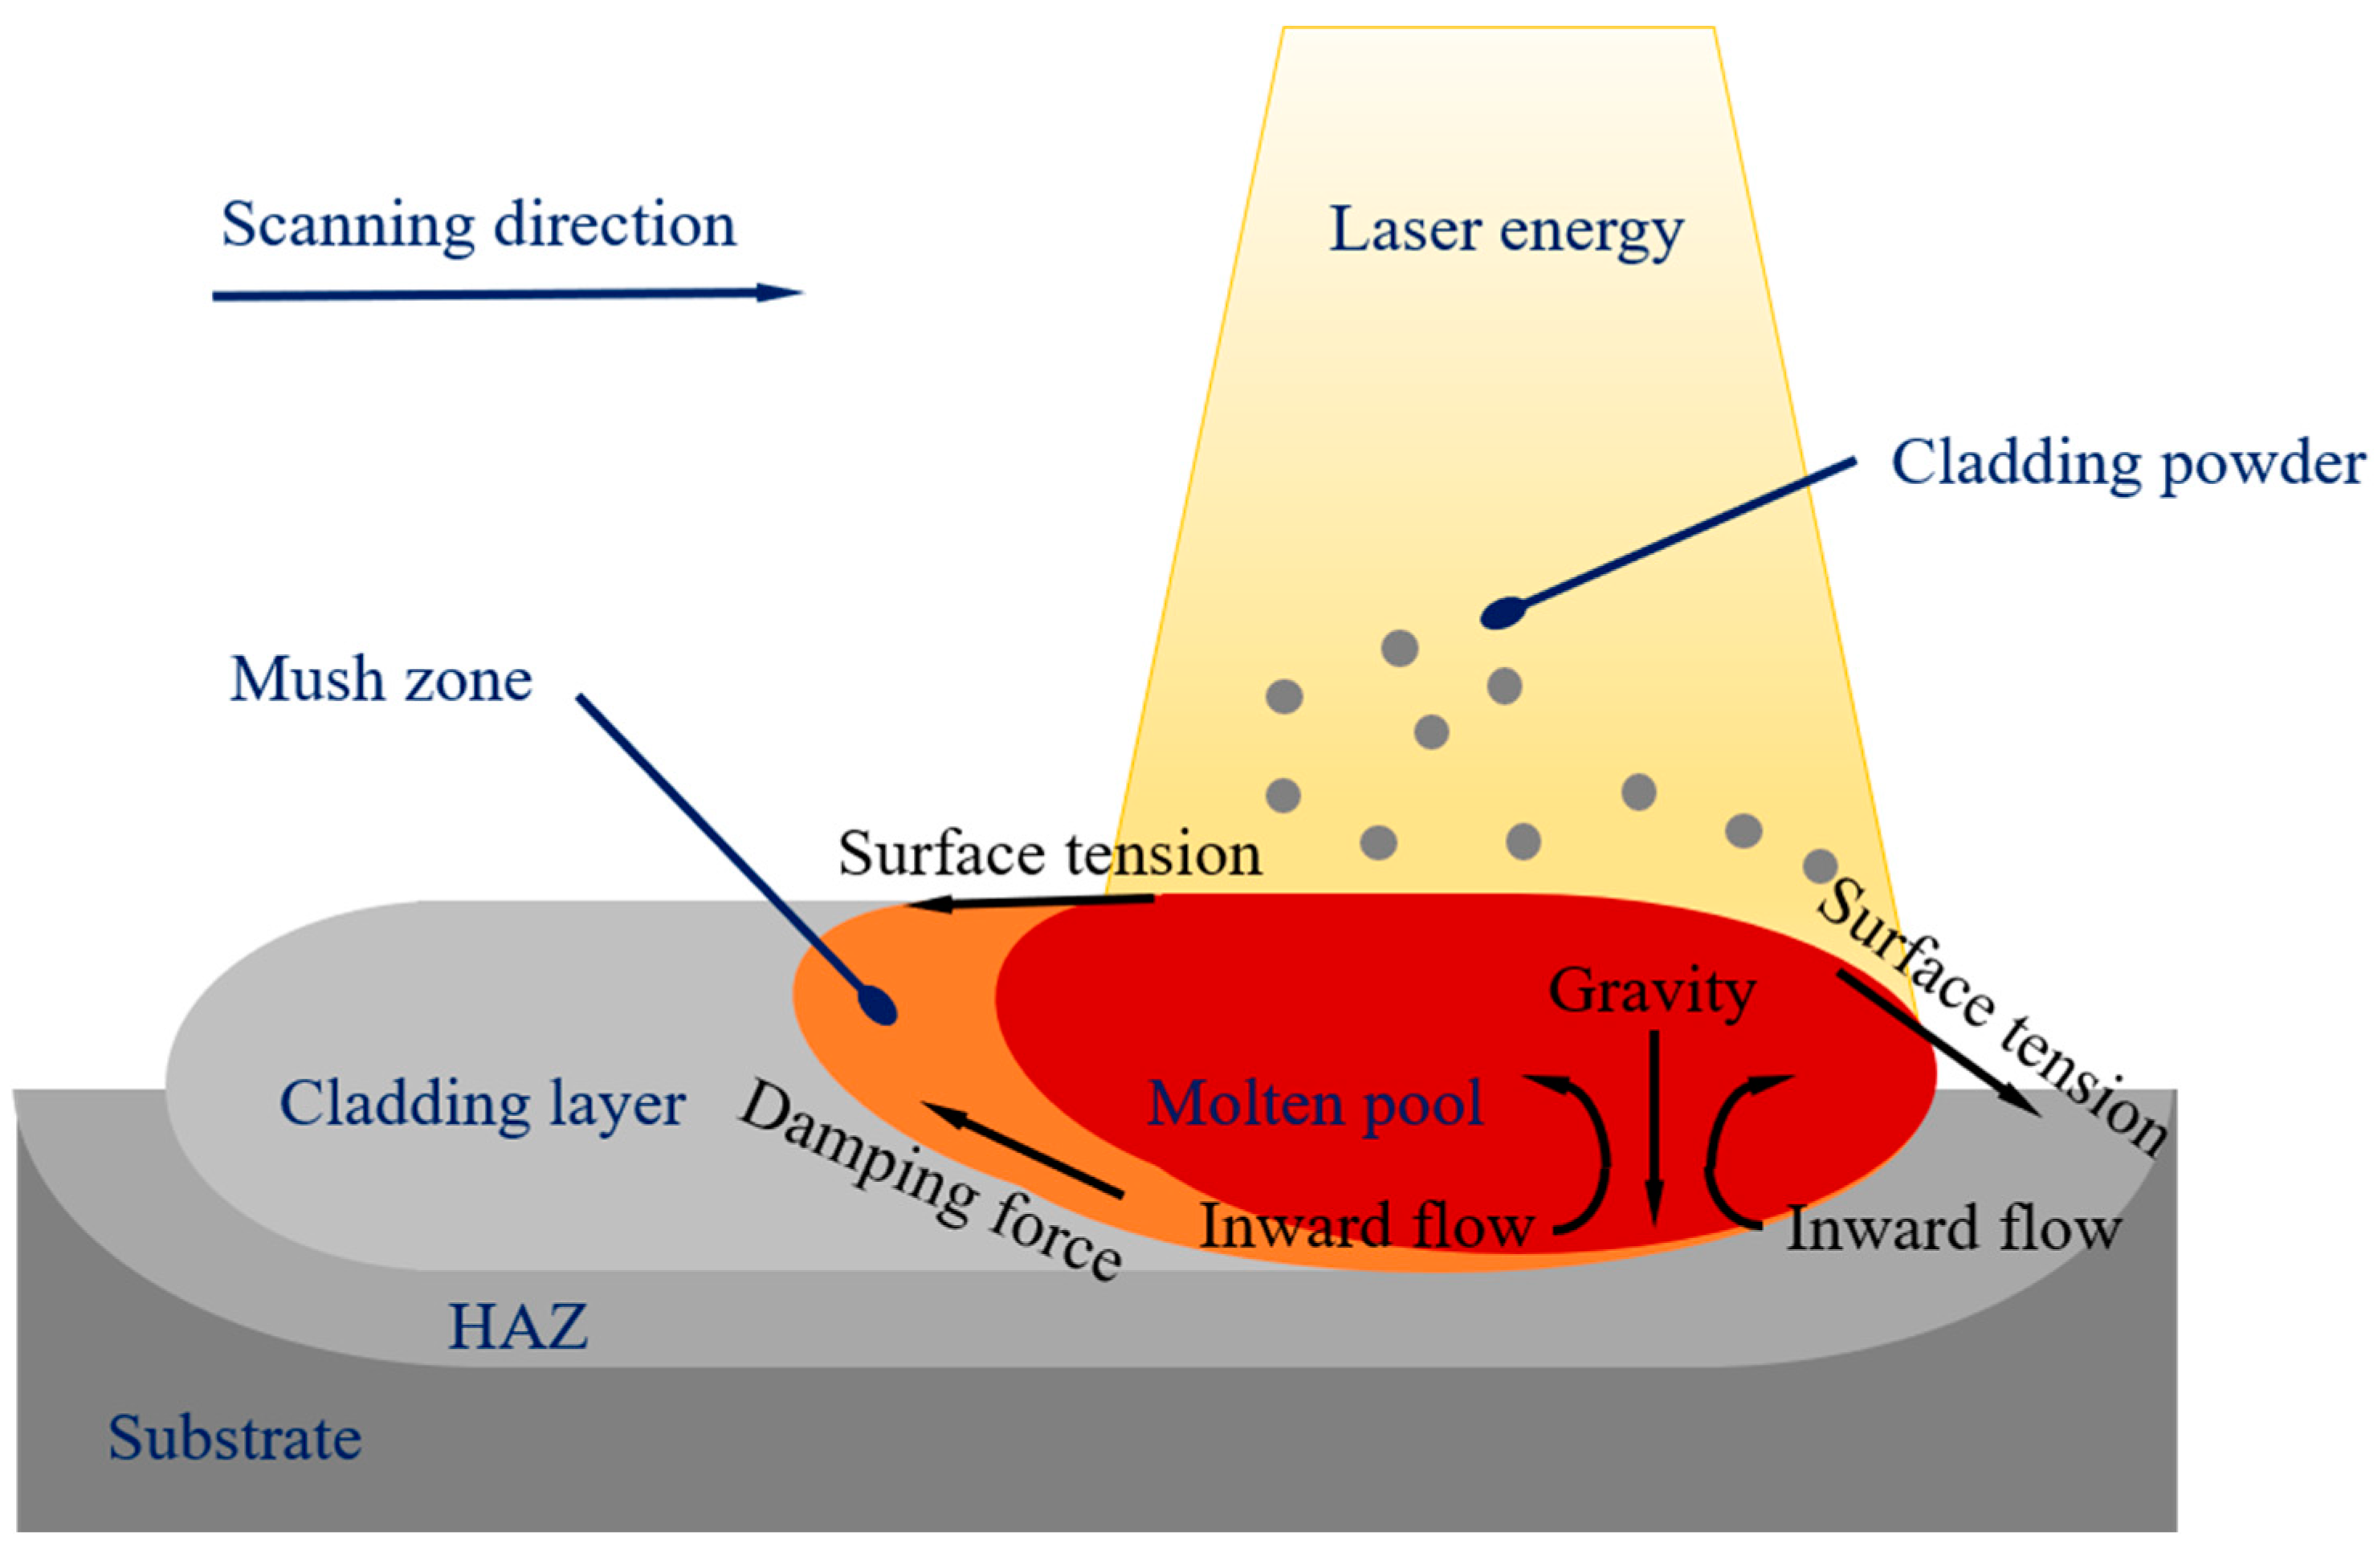
2.2. Thermal–Fluid Coupling Numerical Model of Laser Cladding

As depicted in Figure 2, the laser-cladding process involves the controlled translation of the heat source, facilitated by the precise regulation of process parameters such as laser power and scanning velocity. This movement sustains the molten pool in a state of perpetual flux [28,32], characterized by the continuous circulation of molten material and the formation of a stable yet dynamic interface.
The efficacy of the laser-cladding process is governed by a complex interplay of factors [32,33,34], including the laser power and scanning velocity, which exert direct control over the energy input and temperature distribution. Additionally, as shown in Figure 2, the Marangoni effect, driven by surface-tension gradients, significantly influences the flow patterns within the melting pool. Furthermore, the dynamics of the melting pool, characterized by the interplay between thermal gradients and fluid flow, play a crucial role in determining the stability of the cladding-layer height during the phase transition from liquid to solid.
To simplify the calculations, the numerical model of this paper is based on the following assumptions and simplifications:
(1)
The material’s thermophysical attributes are governed by the inherent properties of the constituent powder and substrate;
(2)
The liquid phase is characterized as laminar, viscous, and incompressible Newtonian fluid;
(3)
The metallic alloy powder and substrate exhibit isotropic properties, precluding segregation during simulation;
(4)
Metal powders are deposited through the motion of a free surface;
(5)
Only powders that fall into the melt pool contribute to the development of the cladding layer;
(6)
This model neglects the influence of vaporization of materials.
Based on the Navier–Stokes equation and combined with the flow characteristics of the laser-cladding pool and previous research [35,36,37], the continuity equation and momentum equation of fluid flow are expressed as shown in Equations (1) and (2):
ρ t + ρ u = 0
ρ u t + ρ u u = p + μ u + u T 2 3 μ u I + F
where ρ is the material density, t is the time, is the Hamilton operator; u is the flow velocity, p is the press, T is the temperature, μ is the Newtonian fluid dynamic viscosity, I is the identity matrix, and F is the volume force.
Based on the law of conservation of mass, law of conservation of momentum, law of conservation of energy, the heat-transfer characteristics of the laser-cladding layer, and the literature [38], the heat-transfer energy equation of the laser-cladding fluid is obtained as shown in Equation (3):
ρ C p T t + K T + ρ C p u T = Q
where C p is the specific heat capacity of the material, is the Hamilton operator, K is the thermal conductivity, and Q is the heat source.
Since the heat transfer includes three basic aspects, namely heat conduction, heat convection, and heat radiation, combined with the actual heat transfer in the laser-cladding process and the literature [25], heat source Q is given using Equation (4):
Q = Q l a s e r + h T a m b T + ε σ T a m b 4 T 4
where Q l a s e r is the laser heat source, h is the convective heat-transfer coefficient, T a m b is the ambient temperature, ε is the surface emissivity, and σ is the Stefan–Boltzmann constant. Q l a s e r is used to describe the heat conduction of the laser heat source; h T a m b T is used to represent heat convection; ε σ T a m b 4 T 4 is used to describe thermal radiation.
To sum up, Equations (1)–(4) jointly govern the field equations of the laser-cladding heat-transfer process. In order to solve the differential equations of laminar flow heat transfer, boundary conditions need to be established.
As for the initial condition, when t = 0, the substrate has a uniform initial temperature, as shown in Equation (5); that is, the ambient temperature is 293.15 K.
T x , y , z , t t = 0 = T 0
Under the Neumann condition, the laser energy [39] was characterized by the Gauss heat-source model as shown in Equation (6):
Q l a s e r = 6 η P π π R 3 exp ( 3 r 2 R 2 )
where η is the laser efficiency, P is the laser power, R is the laser-spot size, and r is the scanning velocity.
Regarding the Robin condition, combined with the actual situation of convective heat transfer of a laser-cladding heated surface, the external heat-transfer equation is obtained by Fourier’s law and Newton’s cooling formula as shown in Equation (7):
K T = h T e x t T
In summary, Equations (5)–(7) and the thermal properties of materials constitute the boundary conditions of the differential equations of laminar flow heat transfer and make the equations have a definite solution.

2.3. Setting of Process Parameters

According to the literature [28,32,33] and the needs of the research group, the range of laser-cladding process parameters is determined. The laser powers of 1000 W, 1250 W, 1500 W, 1750 W, and 2000 W and the scanning velocity of 2 mm/s, 4 mm/s, 6 mm/s, 8 mm/s, and 10 mm/s were established, by which a total of 25 sets of orthogonal process parameters were defined.

3. Results and Discussion

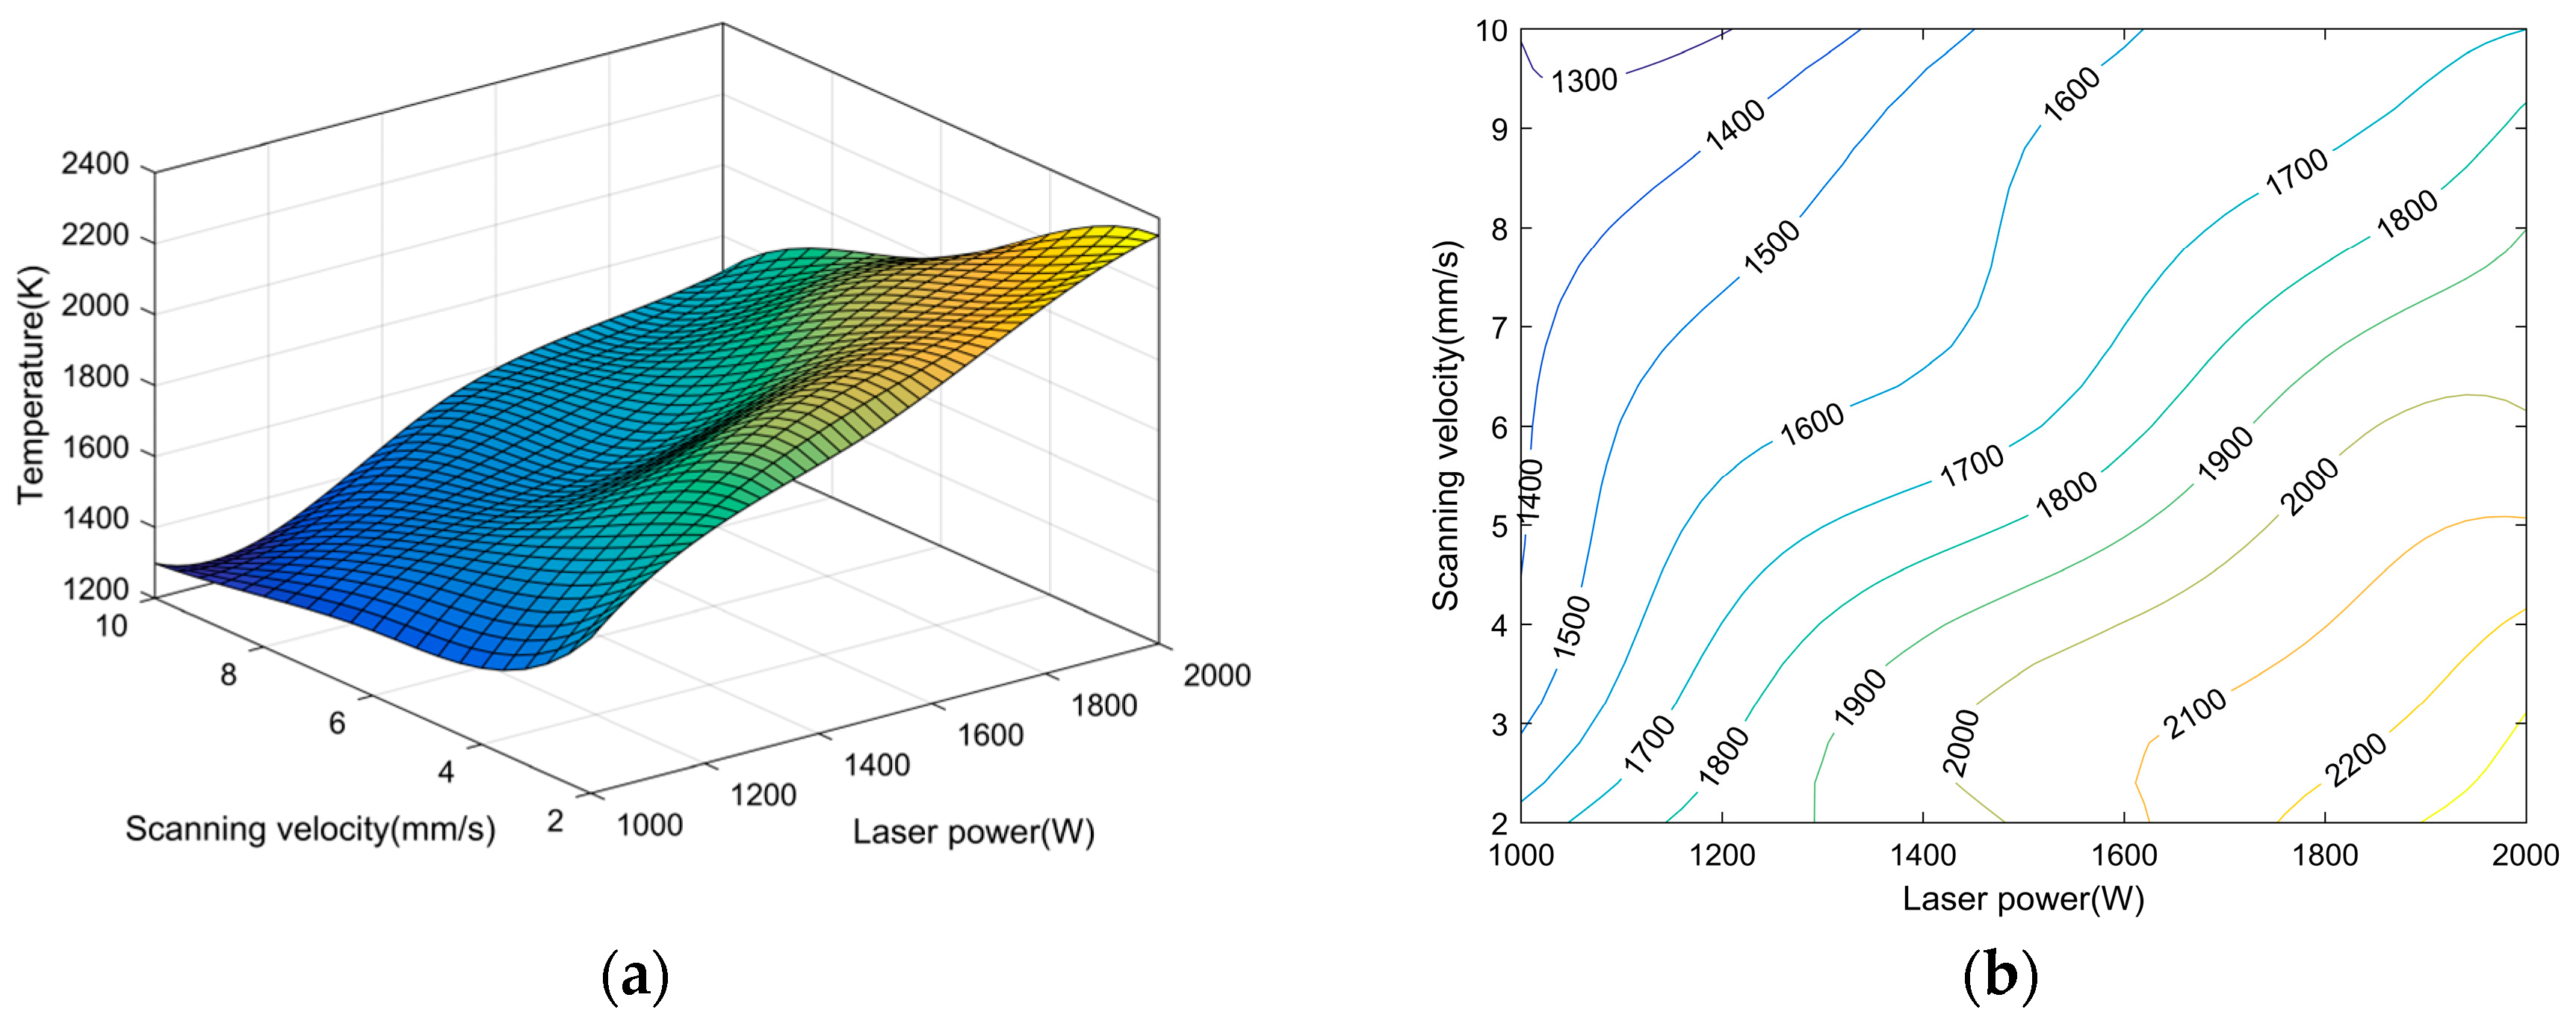
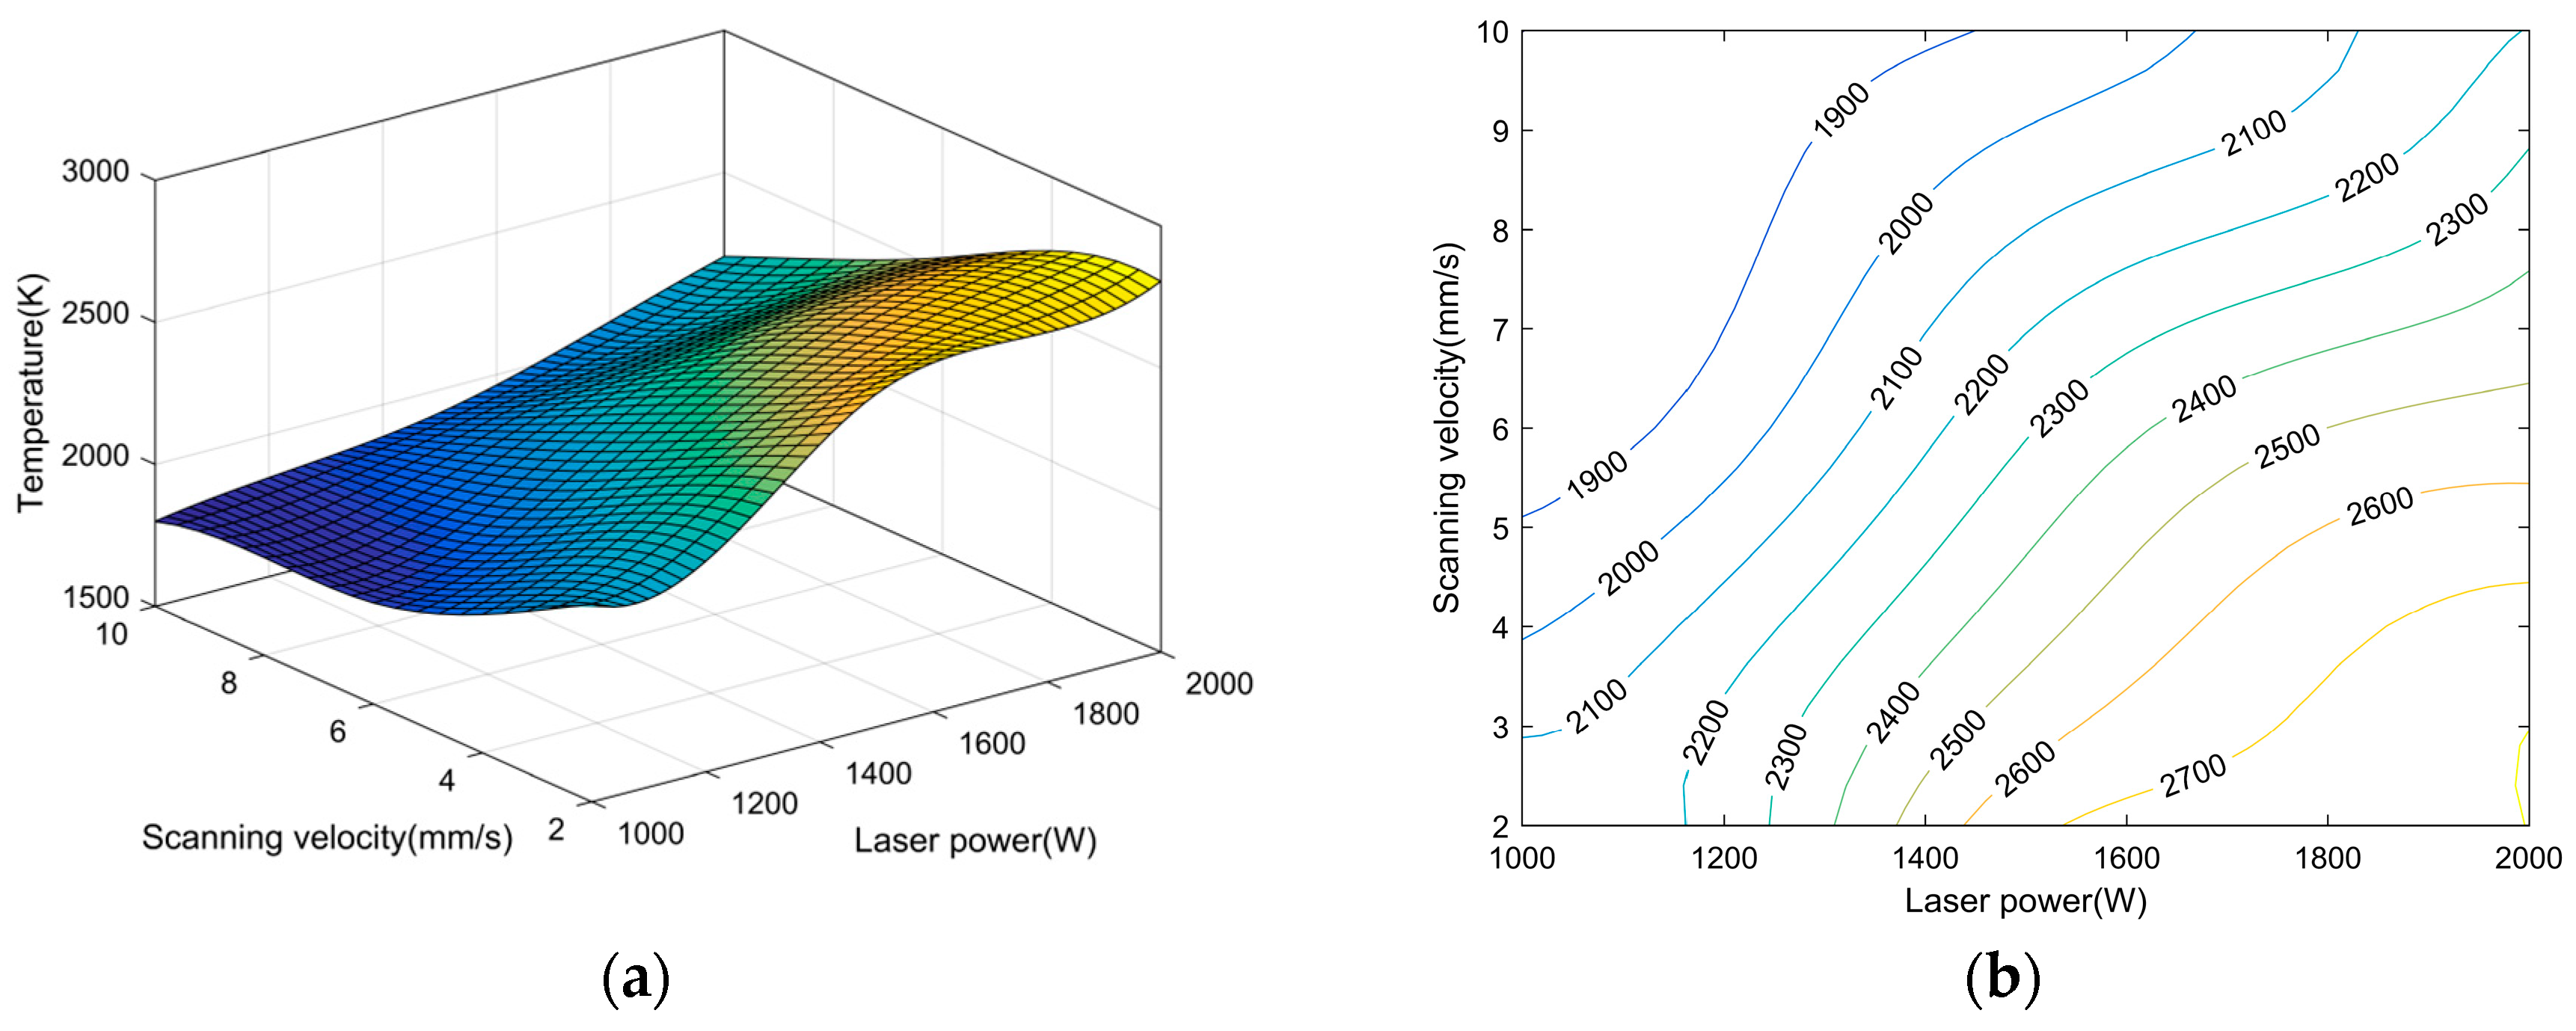
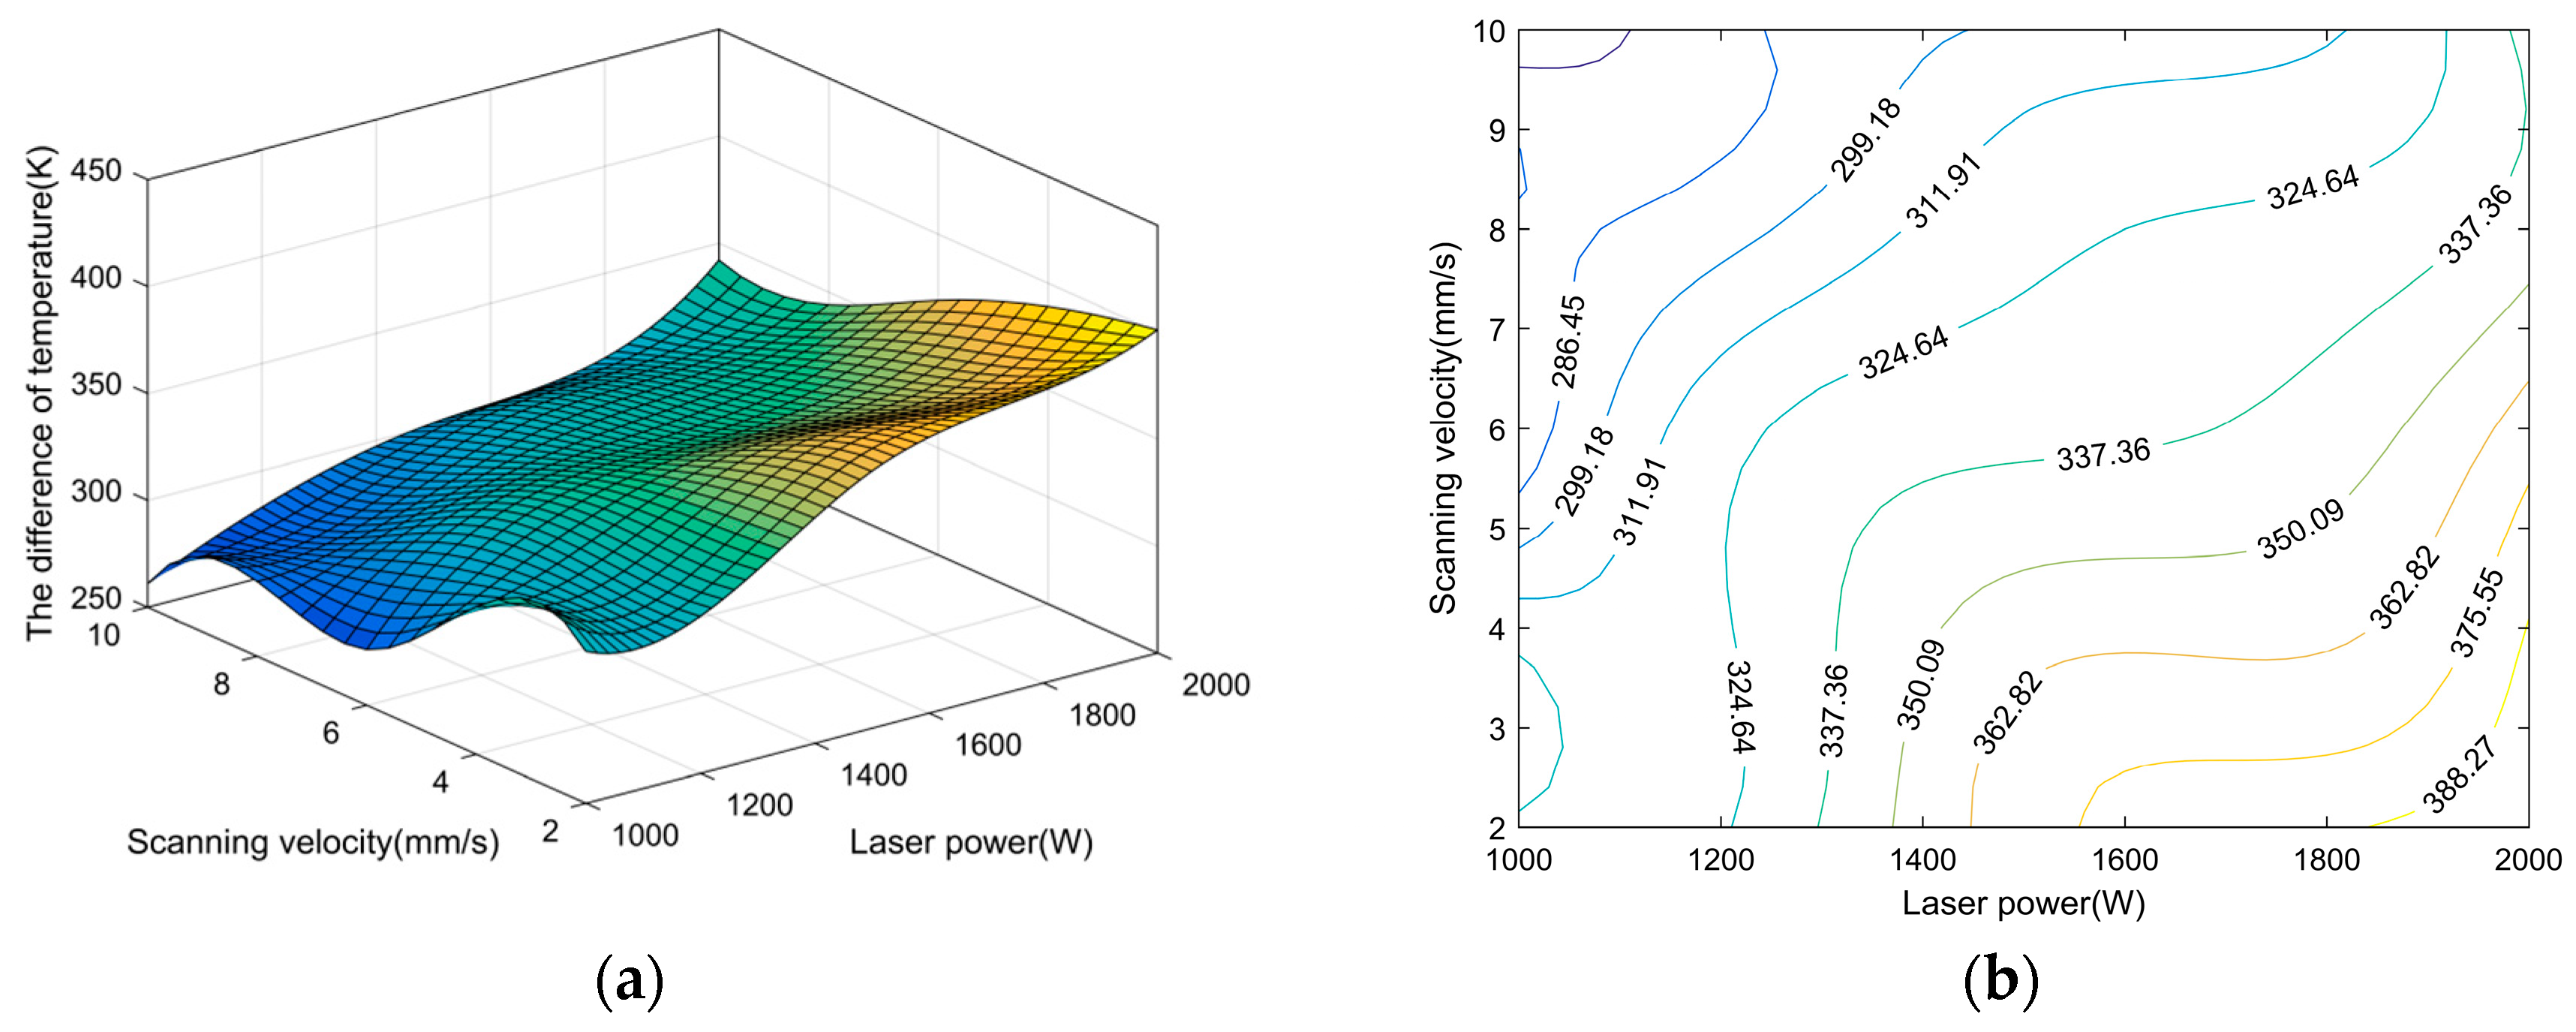
3.1. Influence of Process Parameters on Cladding Temperature

Figure 3 shows the surface temperature distribution and flow field of the laser-cladding layer. It can be observed that the temperature distribution of the laser-cladding parts presents the highest temperature at the direct light source, and the temperature decreases gradually from the direct light source to the surrounding area. This is because the laser heat source is the main heat source in the laser-cladding process, and the laser heat-source model of this finite element simulation is the Gauss heat source. This also results in a temperature distribution with a temperature value of “large in the middle and small around”.
It can be observed from Figure 3 that the flow direction of the molten pool is centered around the direct position of the light source, which is caused by the Marangoni effect of the surface-tension difference generated by the temperature gradient. At the higher temperature, due to the higher heat, the internal energy of liquid molecules increases, and the diffusion effect is enhanced significantly upon the liquid surface, resulting in the decrease in the number of molecules per unit volume and the increase in molecular spacing, as well as the decrease in the total gravitational attraction between molecules per unit volume and the decrease in surface tension. At the lower temperature, due to the lower heat, the internal energy of liquid molecules also increases, but the diffusion effect is enhanced non-significantly; consequently, it is less obvious than at the higher temperature that there is a decrease in the number of molecules per unit volume and an increase in molecular spacing, as well as a decrease in the total gravitational attraction between molecules per unit volume and a decrease in surface tension. Since the liquid flows to the surface tension where the surface-tension value is low, it can be seen that the flow direction is centered on the direct position of the light source and points around it.
It can be observed from Figure 3 that the flow velocity of the molten pool reaches its maximum near the direct position of the light source and decreases as it moves away from the direct position of the light source. This is because the temperature-gradient value near the direct light source is great, and the Marangoni effect is more obvious, so the flow rate is larger; at the position far away from the direct light source, the temperature-gradient value is small, and the Marangoni effect is less obvious. When the temperature gradient reaches a certain small value, the molten pool stops flowing. According to the relationship between material temperature and viscosity, as shown in Figure 1b, the viscosity increases with the decrease in temperature; that is, the farther away from the direct position of the light source, the more obvious the flow retardation of the molten pool. At the same time, as shown in Figure 1a, the melting points of the substrate and the powder are similar. Therefore, it can be well explained that the solidification boundary of the molten pool with a certain width and height is formed at the solidification position, and the cladding-layer height is the upper boundary of the solidification of the cladding layer.
Figure 4 shows the maximum temperature of the substrate with different combinations of laser power and scanning velocity, and Figure 5 shows the maximum temperature of the cladding layer with different combinations of laser power and scanning velocity. Combined with Figure 4a and Figure 5a, the temperature of the substrate and cladding layer increases with the increase in laser power when the scanning velocity is constant. When the laser power is constant, the temperature of the substrate and cladding layer decrease with the increase in scanning velocity, which is because the larger laser power can provide the larger heat energy, and the smaller scanning velocity can make the heat energy fully converted. When the scanning velocity is 2 mm/s and the laser power is 2000 W, the maximum temperature of the cladding layer reaches 2804 K, and the maximum temperature of the substrate reaches 2350 K.
It can be observed from Figure 4a and Figure 5a that the maximum temperature of the cladding layer under the same process parameters is greater than the maximum temperature of the substrate. This is because in the laser-cladding processing, the energy transfer of the laser light source as the main heat source is not directly attached to the surface of the substrate, but an energy transfer with a certain attenuation is generated under the thermal resistance of the cladding layer.
Comparing Figure 4b and Figure 5b, the contours of different temperatures in Figure 5b have a similar trend, while the contours of different temperatures in Figure 4b have a more chaotic trend, which is caused by the difference in the heat-transfer effect of the molten pool due to the different cladding-layer heights under each group of laser process parameters.

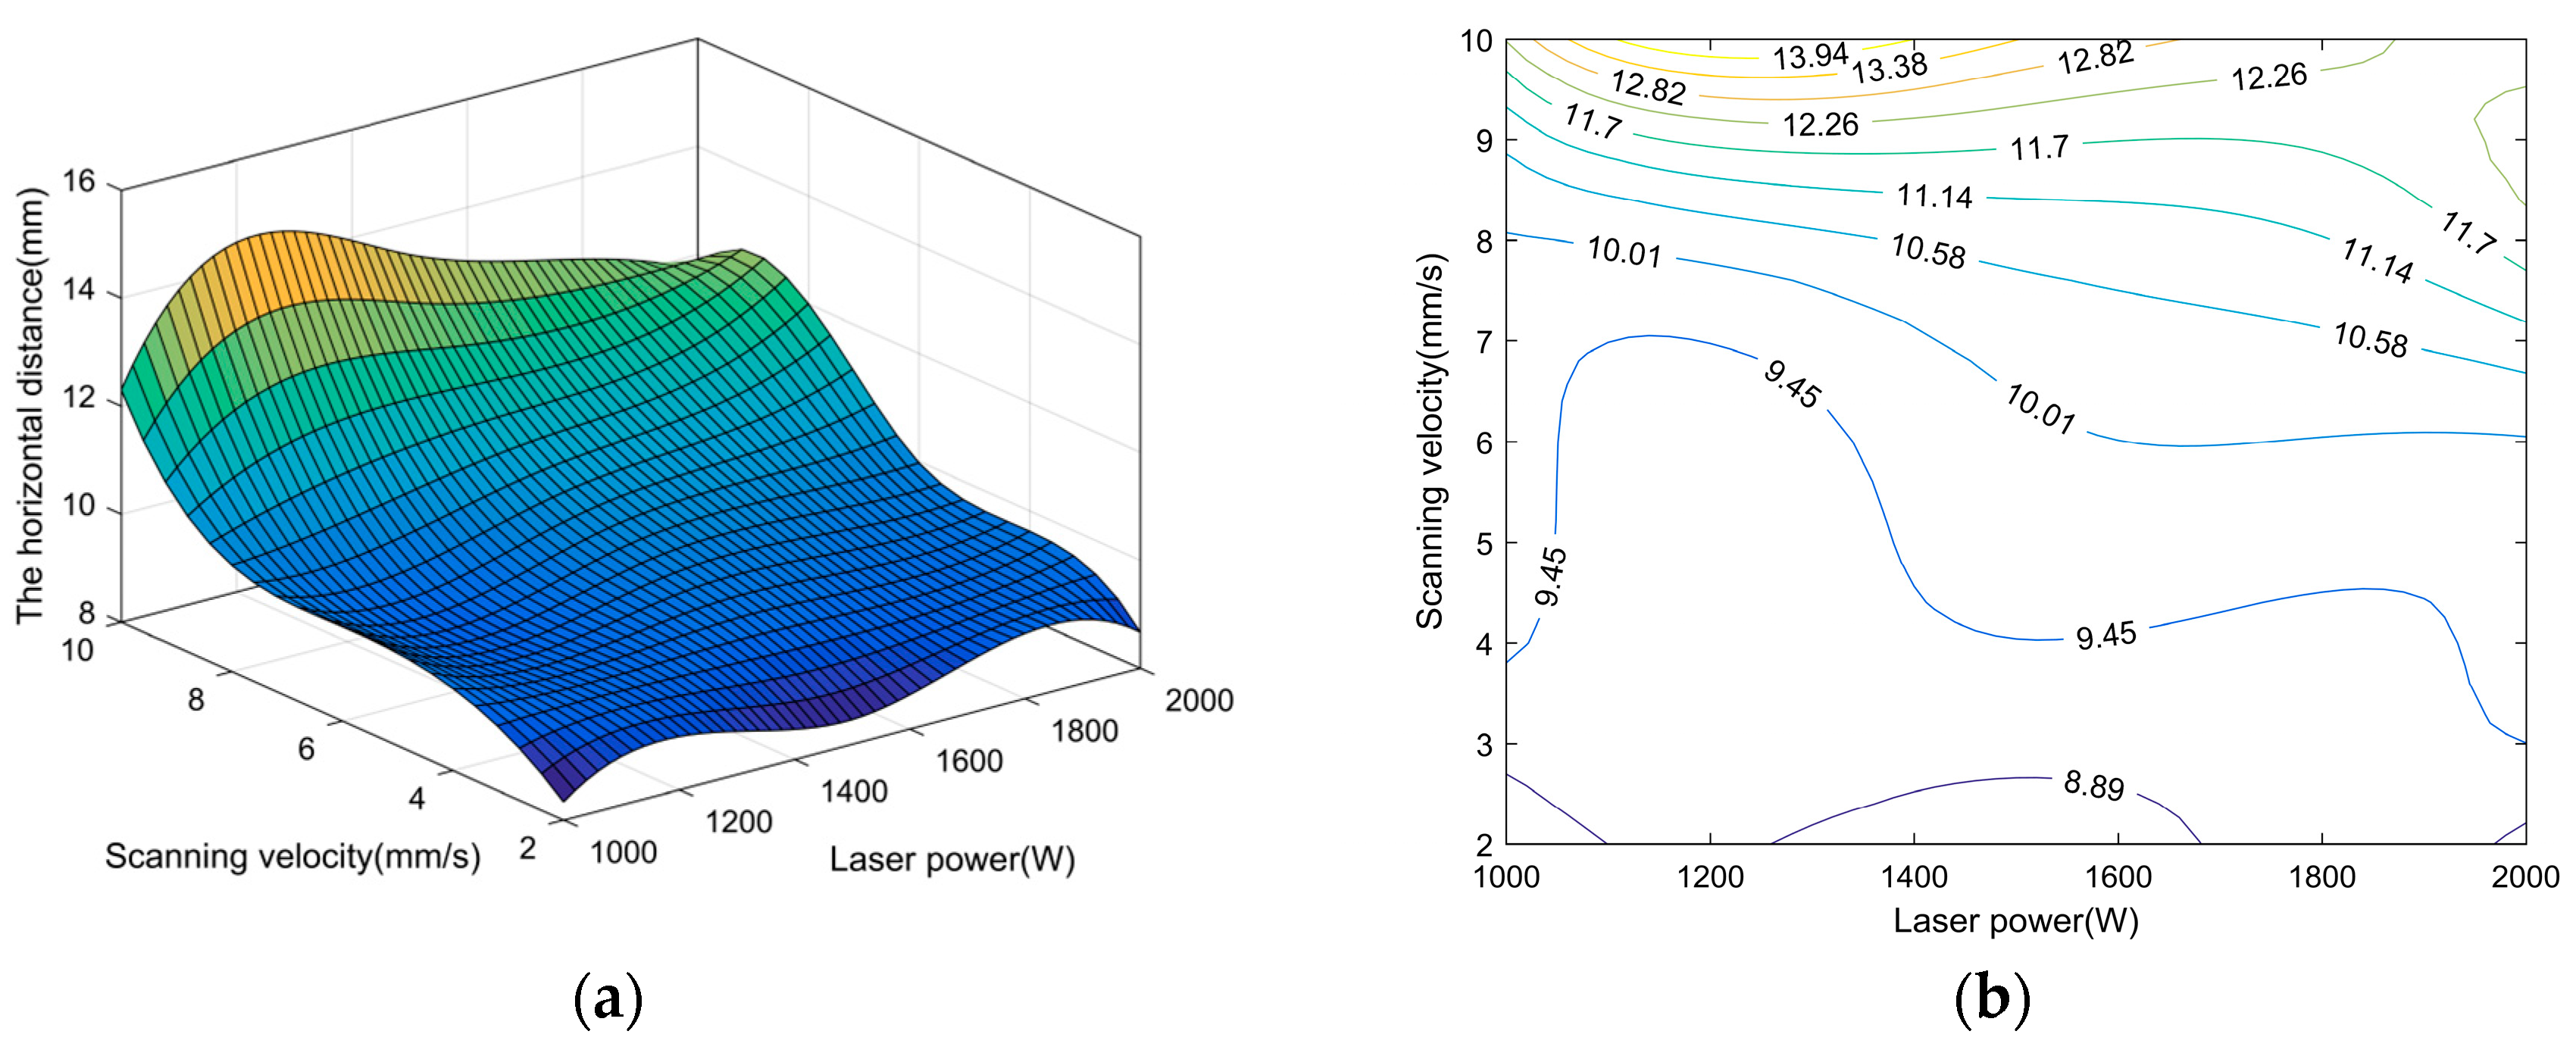
3.2. Influence of Process Parameters on the Cladding-Layer Height

Figure 6 presents the evolution of the cladding layer from a starting position with the process parameter combination of laser power of 1750 W and scanning velocity of 4 mm/s. When the time is from 0 ms to 1700 ms, the cladding-layer height continues to grow. It can be observed from Figure 6a that when the time is 1020 ms, the maximal cladding-layer height is 0.63 mm, and the horizontal distance from the starting point of the maximal cladding-layer height to the boundary is 6.51 mm. It can be observed from Figure 6b that when the time is 1690 ms, the maximal cladding-layer height is 1.04 mm, and the horizontal distance from the starting point of the maximal cladding-layer height to the boundary is 9.29 mm. It can be observed from Figure 6c that when the time is 1700 ms, the maximal cladding-layer height reaches 1.12 mm. Combined with Figure 6c,d, the maximal cladding-layer height remains at 1.12 mm, and the horizontal distance from the initial point of constant height to the boundary of the specimen is 9.34 mm. Therefore, it can be concluded that under the combination of process parameters with laser power of 1750 W and scanning velocity of 4 mm/s, the constant cladding-layer height is 1.12 mm, and the horizontal distance from the initial point of constant height to the specimen boundary is 9.34 mm. Combined with Figure 6a–c, it can be observed that when the cladding layer height does not reach a constant height, the horizontal distance from the maximal height to the specimen boundary is increasing, and the left side of the maximum height is a slope. This is because the fluid calculation model in this study is based on the Navier–Stokes equation and the characteristics of material temperature and density shown in Figure 1d. As the density increases with the decrease in temperature, the effect of gravity will eventually become more obvious. At the same time, the surface-tension gradient will be generated due to the certain temperature gradient of the melt pool, so the slope shape of the cladding layer will be generated under the joint action of gravity and surface-tension gradient. It is of great engineering significance to establish the horizontal distance from the initial point of constant height to the boundary of the specimen (i.e., the area to be bonded) for segmental laser cladding on long paths to prevent deformation.
Figure 7 shows the constant cladding-layer height with different combinations of laser power and scanning velocity. It can be observed that when the scanning velocity is constant, the constant cladding-layer height increases with the increase in laser power. When the laser power is constant, the constant cladding-layer height decreases with the increase in the scanning velocity, which is because the larger laser power can provide greater heat energy and improve the powder utilization rate. The smaller scanning velocity allows the heat energy to be fully transformed, so that the Marangoni effect is enhanced and the longitudinal growth rate of the cladding layer is increased. Under the combination of laser power of 1750 W and scanning velocity of 4 mm/s, the constant cladding-layer height is 1.12 mm. Under the combination of process parameters with laser power of 2000 W and scanning velocity of 2 mm/s, the constant cladding-layer height reaches the maximum, which is 1.24 mm.
The horizontal distance from the starting point of constant cladding-layer height to the boundary of specimens with different combinations of laser power and scanning velocity are shown in Figure 8. It can be observed that when the scanning velocity is constant, the horizontal distance from the starting point of constant cladding-layer height to the boundary does not change significantly with the laser power. When the laser power is constant, the horizontal distance from the initial point of the constant cladding-layer height to the boundary of the specimen increases with the increase in the scanning velocity. This is because a small scanning velocity can fully transform the heat energy and enhance the Marangoni effect, which increases the transverse growth rate of the cladding layer.

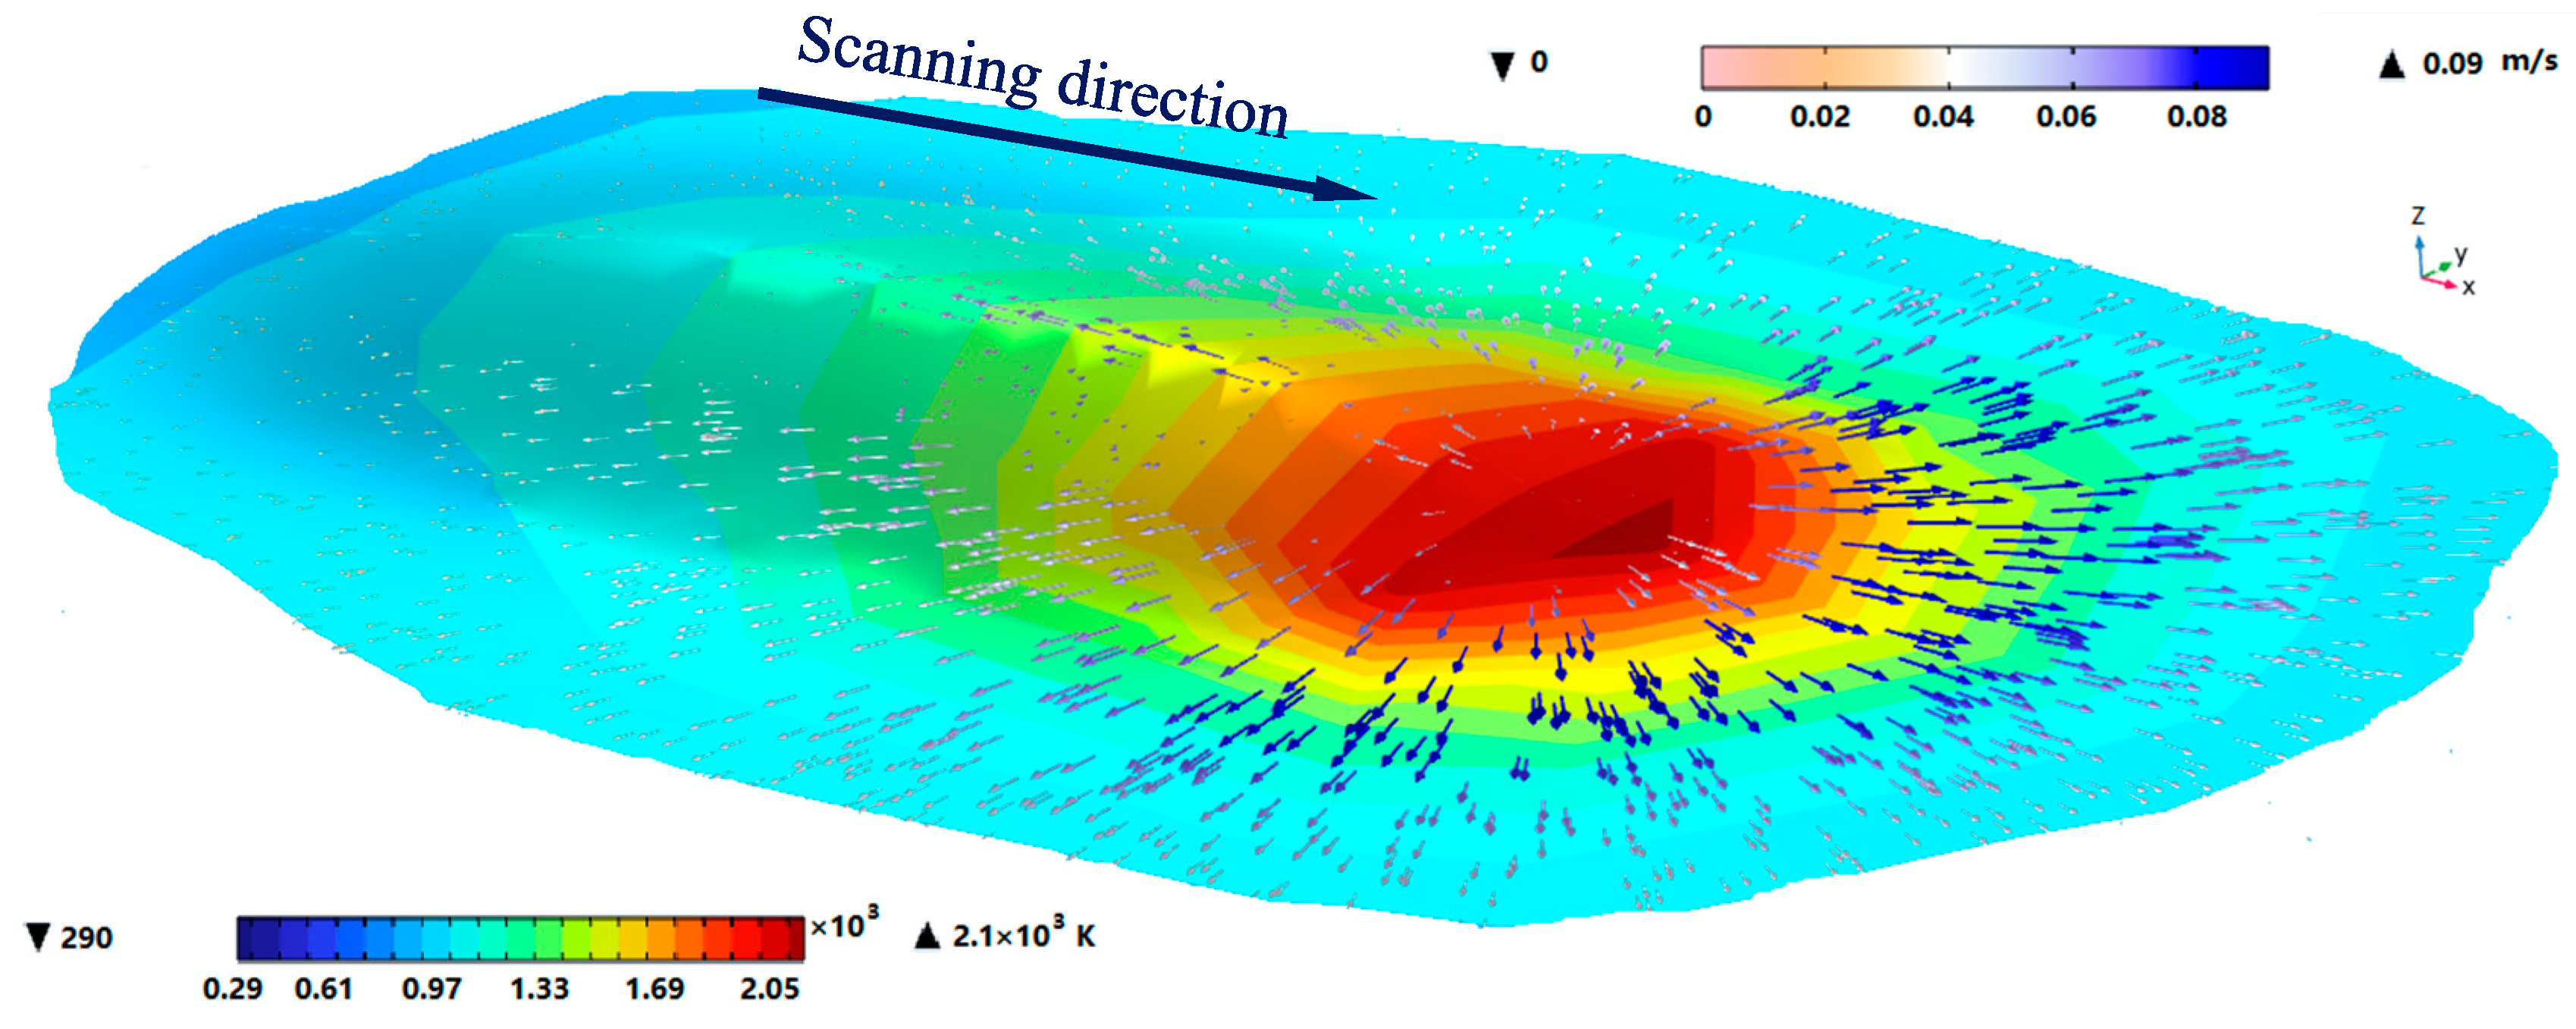
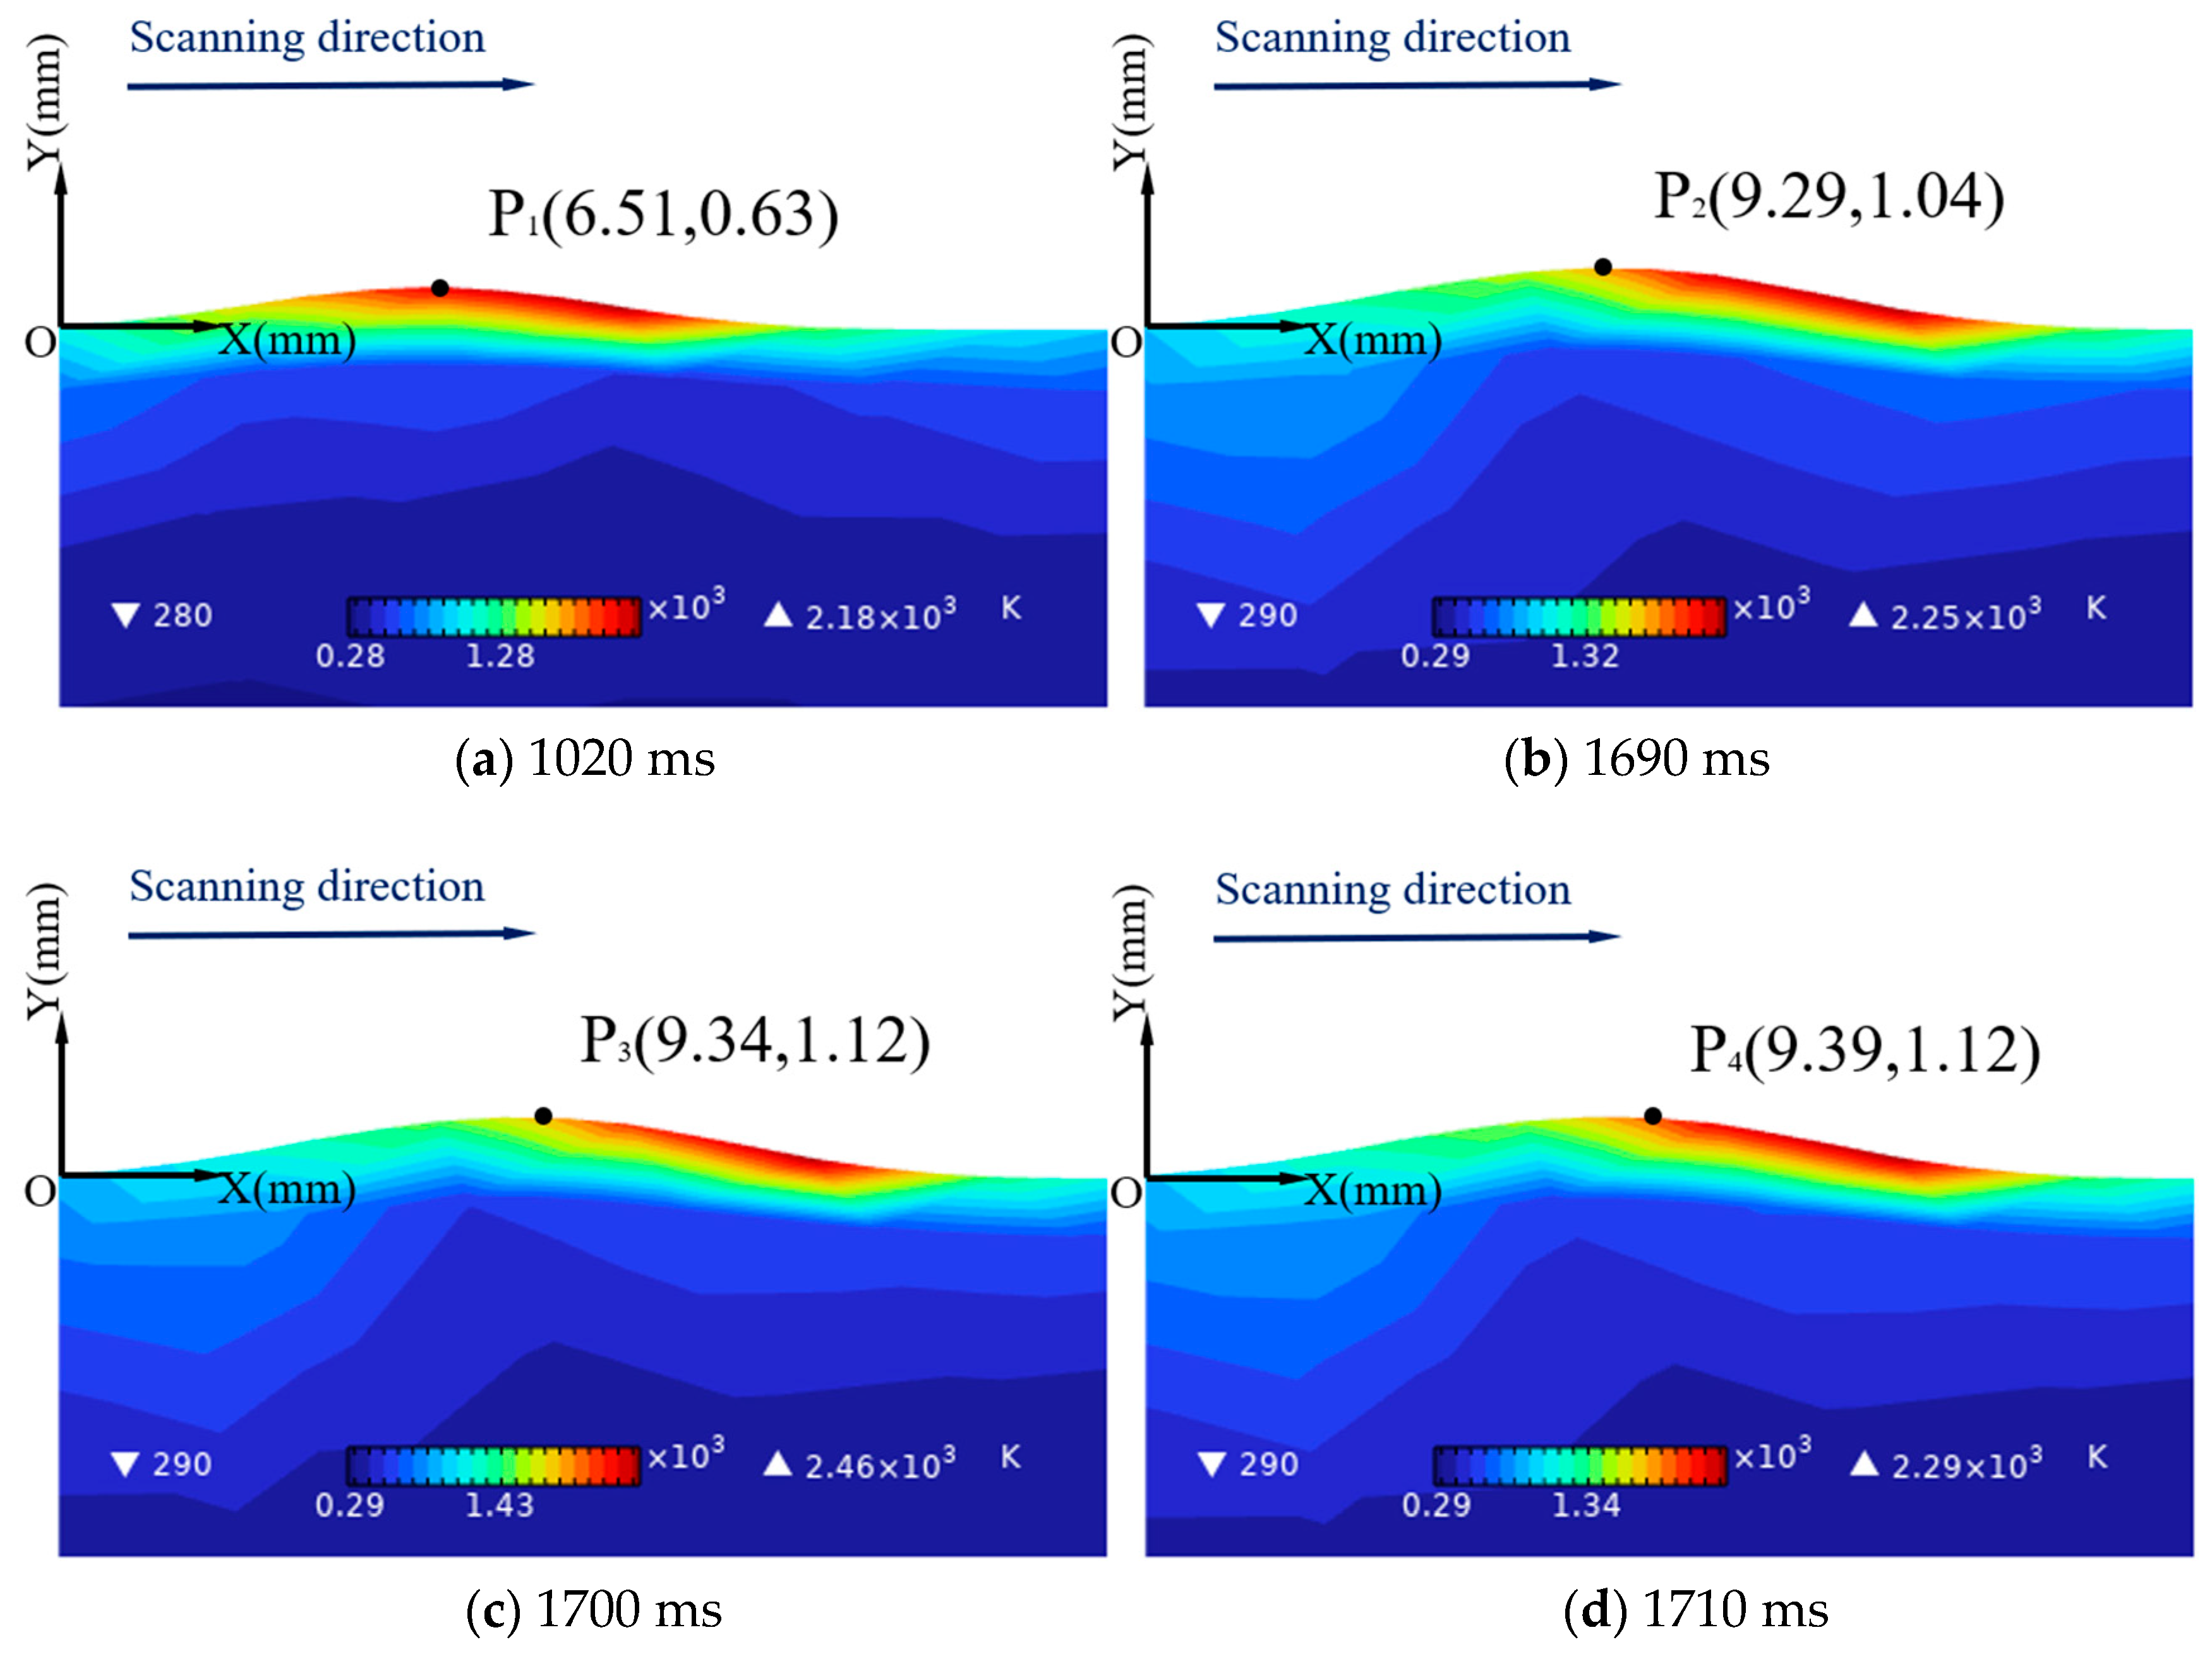
3.3. Mechanism of Influence of Cladding Layer for Temperature Distribution

It can be observed from Figure 6 that the highest temperature of the cladding layer is 2.18 × 10³ K at 1020 ms, the highest temperature of the cladding layer is 2.25 × 10³ K at 1690 ms, the highest temperature of the cladding layer is 2.46 × 10³ K at 1700 ms, and the highest temperature of the 1710 ms cladding layer after reaching a constant height is 2.29 × 10³ K. This is because when the laser initially shoots into the cladding powder, the laser photon and the powder molecule collide and then produce an energy transfer after the powder absorbs light energy; that is, the kinetic energy of the photon is converted into molecular kinetic energy. Due to the interference of other factors such as reflection, there is a certain conversion efficiency that dictates that the kinetic energy of the photon cannot be fully converted and is quickly converted into molecular kinetic energy. The temperature of the cladding layer increases; after the height of the cladding layer reaches equilibrium, the macromorphology of the cladding layer changes from triangle-like to trapezoid-like, and the change in geometric size leads to the increase in powder molecules requiring energy conversion, so the temperature value decreases under the irradiation of the same heat source.
Figure 9 shows the temperature difference between cladding layer and substrate on the initial position, arriving at constant cladding-layer height with different process parameters. It can be observed that when the scanning velocity is constant, the difference between the cladding-layer temperature and the substrate temperature at the position of constant height increases, for the first time, with the increase in laser power. When the laser power is constant, the difference decreases with the increase in the scanning velocity.
Combining Figure 7 and Figure 9, when the laser power is 1750 W and the scanning velocity is 4 mm/s, the constant cladding-layer height is 1.12 mm, and the difference between the cladding-layer temperature and the substrate temperature at the position where the constant height is reached for the first time is 359 K. When the laser power is 2000 W and the scanning velocity is 2 mm/s, the constant height is 1.24 mm, and the difference is 401 K. When the laser power is 1000 W and the scanning velocity is 10 mm/s, the constant height is 0.83 mm, the difference is 261 K, and the Z-values of the two figures have a similar trend, it can be seen that the greater the constant cladding-layer height, the greater the difference, and the smaller the constant height, the smaller the difference.
From the analysis in Section 3.1, it can be concluded that the temperature of the cladding layer is higher than the temperature of the substrate under the same process parameters due to the energy attenuation and transmission of the laser light source under the thermal resistance of the cladding layer. Combined with the observation and analysis in Figure 7 and Figure 9, it is found that the thermal resistance of the cladding layer increases with height. At the same time, from the thermal properties of the material in Figure 1c, it can be seen that as the temperature increases, the thermal conductivity is enhanced, which further indicates that the height of the cladding layer is the main factor affecting the energy transfer of the laser heat source.

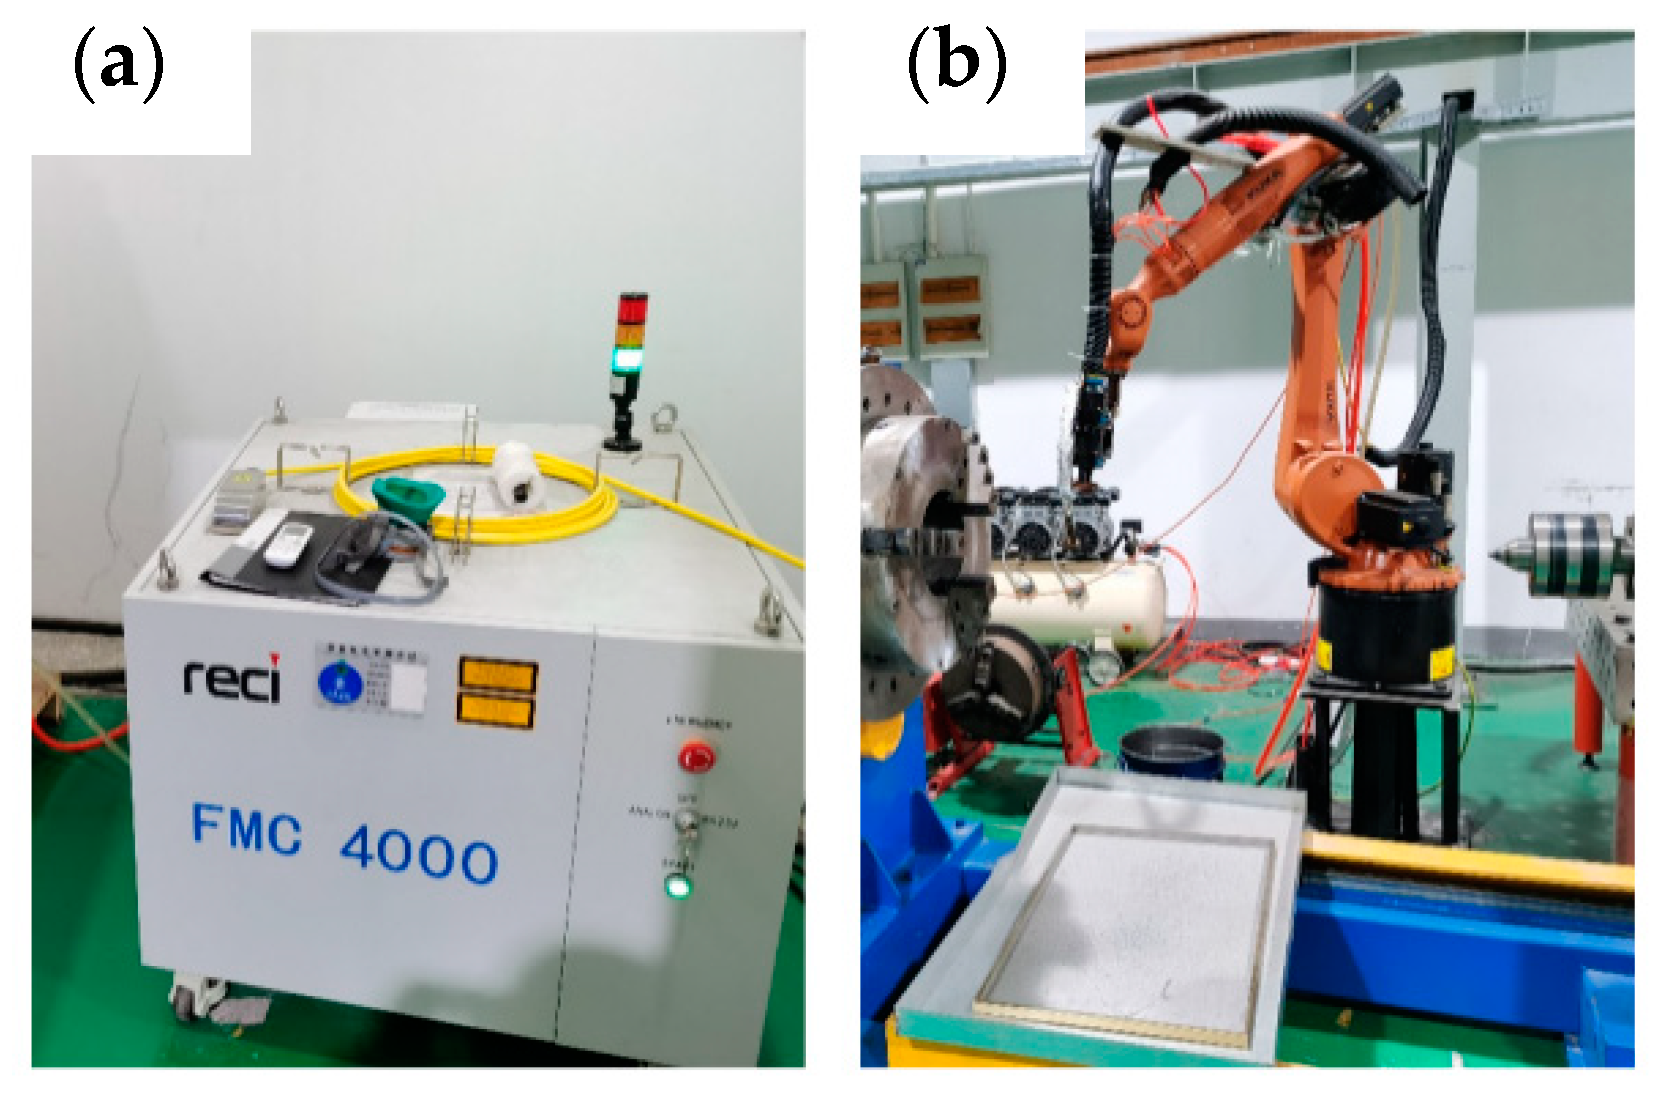
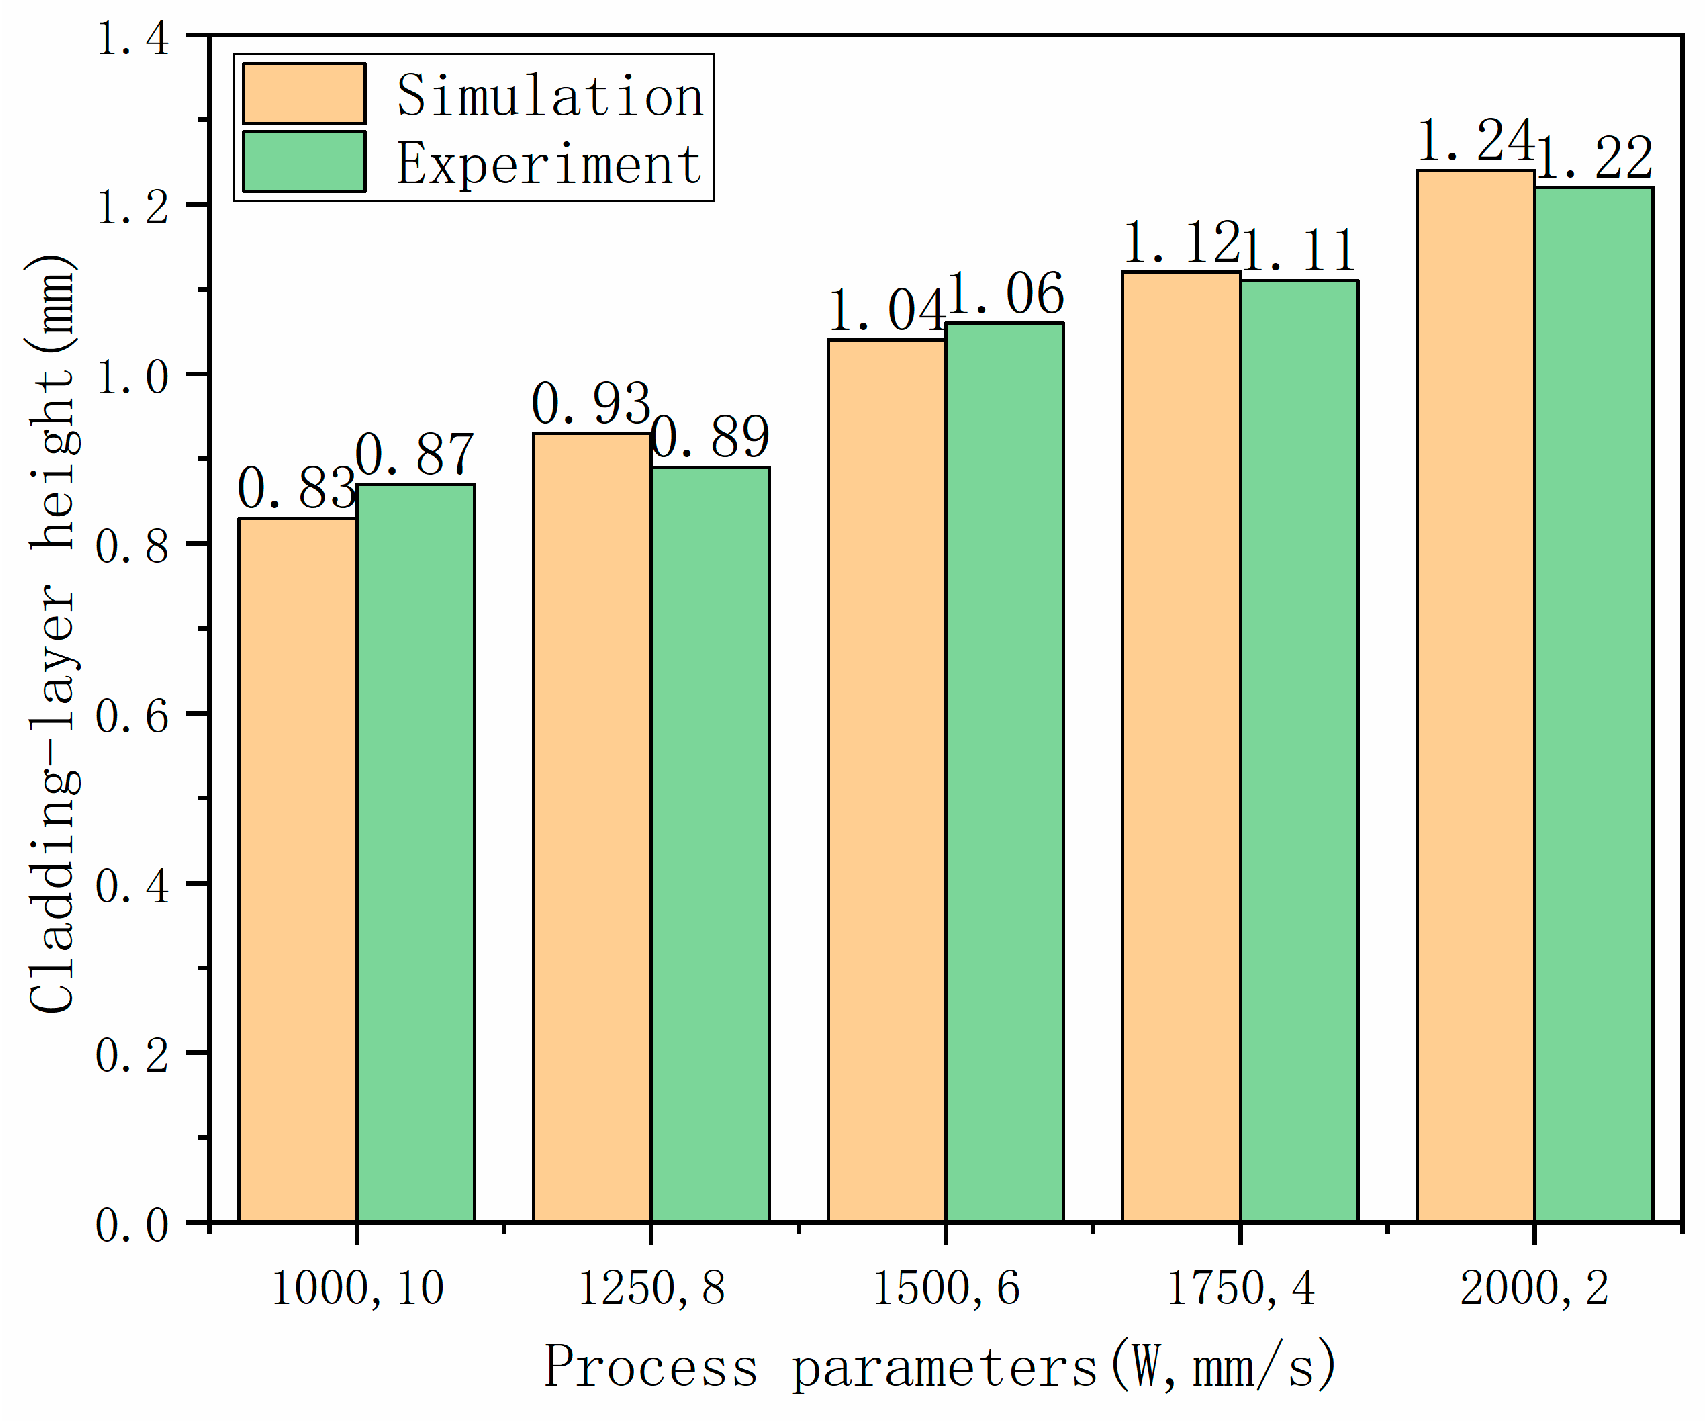
3.4. Verification Experiment

The entire laser-cladding system used in this laser-cladding test includes a FMC 4000 fiber laser produced by Beijing Reci Laser Co., Ltd., Beijing, China, with a rated power of 4000 W (adjustable in the range of 10%~100%) and a wavelength of 1080 ± 3 nm, which can be operated continuously or modulated; the laser-processing table and six-axis linkage robot system was produced by the KUKA company in Augsburg, Germany, and the repeated positioning accuracy of the manipulator is 0.05 mm (see Figure 10). Based on the mature commercial application of the relevant cooperative laser-cladding companies, the relevant process parameters for the preparation of Fe-based (the diameter of the powder is 45~109 μm) cladding layers were determined by setting up five groups of process parameter (laser power/scan velocity) experiments with the following parameters: 1000 W/10 mm/s, 1250 W/8 mm/s, 1500 W/6 mm/s, 1750 W/4 mm/s, and 2000 W/2 mm/s; a dimension of substrate of 35 mm × 20 mm × 10 mm; a laser-spot diameter of 4.5 mm; a powder-feeding speed of 13.5 g/min; and a carrying capacity of 5 L/min.
In the process of metal laser cladding, the characteristics of the metal surface and the splashing of cladding powder will make it impossible for infrared thermal imaging technology to accurately measure the temperature, so it is difficult to verify the temperature distribution of the numerical model through experiments. Therefore, this study carried out experimental verification of the height of the cladding layer.
To accurately measure the cladding-layer height (1750 W/4 mm/s), the method of combining macro and micro was used. On a macro level, the three heights of the processed cladding parts were measured by Coordinate Measuring Machine (with an accuracy of 5 microns), and its mean value was taken to subtract the original height of the specimen substrate, as shown in Figure 11a, and, consequently, the cladding-layer height was obtained, which is 1.11 mm. Microscopically, a tungsten-filament scanning electron microscope was used for measurement, as shown in Figure 11b,c, and the measured cladding-layer height was also 1.11 mm. By averaging the values obtained through macroscopic and microscopic measurements, the cladding-layer height was determined to be 1.11 mm.
The cladding-layer height of the remaining four specimens was measured by the above method and compared with the simulation values, as shown in Figure 12. The difference between the experimental and simulation values under each group of process parameters shown in Figure 12 was calculated and divided by the corresponding experimental values, and the errors were 4.6%, 4.5%, 1.9%, 1.0%, and 1.6%, respectively.
Overall, the comprehensive error of simulation is 4.6% less than 5%, indicating that the numerical model has certain guiding significance.

4. Conclusions

  • The temperature distribution and cladding-layer height are mutually affected. The Marangoni effect produced by temperature distribution and its temperature gradient affects the height growth of the cladding layer. When the temperature-gradient value is great, the flow of the molten pool is obvious, and when the temperature is small, the viscosity of the molten pool is enhanced to form a solidification boundary. The growth of the cladding-layer height will affect the heat transfer of the laser heat source and ultimately affect the temperature distribution. The higher the constant height of the cladding layer, the stronger the thermal resistance effect, and the worse the heat-transfer effect of the laser heat source and the lower the substrate temperature.
  • Laser power and scanning velocity jointly affect the laser-cladding temperature distribution. Using a higher laser power or a lower scanning velocity or a combination of higher laser power and lower scanning velocity process parameters can obtain a higher temperature. Using a combination of process parameters, including 2000 W laser power and 2 mm/s scanning velocity, results in the cladding layer reaching its maximum temperature of 2804 K, while the substrate reaches a maximum temperature of 2350 K.
  • Laser power and scanning velocity jointly affect the cladding-layer height. Using higher laser power or lower scanning velocity or the combination of higher laser power and lower scanning velocity process parameters can obtain a higher cladding-layer height. The cladding-layer height reaches 1.12 mm, which the error is 1.0% when compared with the actual experimentation, with the process parameter combination of laser power of 1750 W and scanning velocity of 4 mm/s. Furthermore, with the comprehensive error being less than 5%, it indicates that the model has a certain guiding significance.

Author Contributions

Investigation, Y.Z. and W.C.; Writing—original draft, C.D. All authors have read and agreed to the published version of the manuscript.

Funding

This research received no external funding.

Institutional Review Board Statement

Not applicable.

Informed Consent Statement

Not applicable.

Data Availability Statement

Data are contained within the article.

Conflicts of Interest

The authors declare no conflict of interest.

References

  1. Wang, S.; Ning, J.; Zhu, L.; Yang, Z.; Yan, W.; Dun, Y.; Xue, P.; Xu, P.; Bose, S.; Bandyopadhyay, A. Role of porosity defects in metal 3D printing: Formation mechanisms, impacts on properties and mitigation strategies. Mater. Today 2022, 59, 133–160. [Google Scholar] [CrossRef]
  2. Yang, Z.; Zhu, L.; Wang, S.; Ning, J.; Dun, Y.; Meng, G.; Xue, P.; Xu, P.; Xin, B. Effects of ultrasound on multilayer forming mechanism of Inconel 718 in directed energy deposition. Addit. Manuf. 2021, 48, 102462. [Google Scholar] [CrossRef]
  3. Zhu, L.; Xue, P.; Lan, Q.; Meng, G.; Ren, Y.; Yang, Z.; Xu, P.; Liu, Z. Recent research and development status of laser cladding: A review. Opt. Laser Technol. 2021, 138, 106915. [Google Scholar] [CrossRef]
  4. Farayibi, P.; Abioye, T.; Murray, J.; Kinnell, P.; Clare, A. Surface improvement of laser clad Ti-6Al-4V using plain waterjet and pulsed electron beam irradiation. J. Mater. Process. Technol. 2015, 218, 1–11. [Google Scholar] [CrossRef]
  5. Paydas, H.; Mertens, A.; Carrus, R.; Lecomte-Beckers, J.; Tchuindjang, J.T. Laser cladding as repair technology for Ti-6Al-4V alloy: Influence of building strategy on microstructure and hardness. Mater. Des. 2015, 85, 497–510. [Google Scholar] [CrossRef]
  6. Raj, D.; Maity, S.R.; Das, B. Optimization of Process Parameters of Laser Cladding on AISI 410 Using MEREC Integrated MABAC Method. Arab. J. Sci. Eng. 2023, 49, 10725–10739. [Google Scholar] [CrossRef]
  7. Jie, D.; Wu, M.; He, R.; Cui, C.; Miao, X. A multiphase modeling for investigating temperature history, flow field and solidification microstructure evolution of FeCoNiCrTi coating by laser cladding. Laser Technol. 2024, 169, 110197. [Google Scholar] [CrossRef]
  8. Lv, H.; Li, X.; Li, Z.; Wang, W.; Yang, K.; Li, F.; Xie, H. Investigation on the columnar-to-equiaxed transition during laser cladding of IN718 alloy. J. Manuf. Process. 2021, 67, 63–76. [Google Scholar] [CrossRef]
  9. Tamanna, N.; Kabir, I.R.; Naher, S. Thermo-mechanical modelling to evaluate residual stress and material compatibility of laser cladding process depositing similar and dissimilar material on Ti6Al4V alloy. Therm. Sci. Eng. Prog. 2022, 31, 101283. [Google Scholar] [CrossRef]
  10. Chai, Q.; Fang, C.; Hu, J.; Xing, Y.; Huang, D. Cellular automaton model for the simulation of laser cladding profile of metal alloys. Mater. Des. 2020, 195, 109033. [Google Scholar] [CrossRef]
  11. Chen, L.; Zhao, Y.; Song, B.; Yu, T.; Liu, Z. Modeling and simulation of 3D geometry prediction and dynamic solidification behavior of Fe -based coatings by laser cladding. Opt. Laser Technol. 2021, 139, 107009. [Google Scholar] [CrossRef]
  12. Gao, J.; Wu, C.; Hao, Y.; Xu, X.; Guo, L. Numerical simulation and experimental investigation on three-dimensional modelling of single-track geometry and temperature evolution by laser cladding. Opt. Laser Technol. 2020, 129, 106287. [Google Scholar] [CrossRef]
  13. Izumi, T.; Arai, M. Numerical simulation of the 3D propeller repair process by laser cladding of SUS316L on SUS304. J. Manuf. Process. 2023, 98, 234–253. [Google Scholar] [CrossRef]
  14. Lee, Y.; Feldhausen, T.; Fancher, C.M.; Nandwana, P.; Babu, S.S.; Simunovic, S.; Love, L.J. Prediction of residual strain/stress validated with neutron diffraction method for wire-feed hybrid additive/subtractive manufacturing. Addit. Manuf. 2024, 79, 103920. [Google Scholar] [CrossRef]
  15. Li, C.; Yu, Z.; Gao, J.; Zhao, J.; Han, X. Numerical simulation and experimental study of cladding Fe60 on an ASTM 1045 substrate by laser cladding. Surf. Coat. Technol. 2019, 357, 965–977. [Google Scholar] [CrossRef]
  16. Li, J.; Li, H.N.; Liao, Z.; Axinte, D. Overlapped wire-fed laser cladding on inclined surfaces: An analytical model considering gravity and a model application. J. Mater. Process. Technol. 2022, 304, 117559. [Google Scholar] [CrossRef]
  17. Meng, G.; Zhang, J.; Li, J.; Jiang, Z.; Gong, Y.; Zhao, J. Impact of pore defects on laser additive manufacturing of Inconel 718 alloy based on a novel finite element model: Thermal and stress evaluation. Opt. Laser Technol. 2023, 167, 109782. [Google Scholar] [CrossRef]
  18. Nie, B.; Xue, Y.; Wang, X.; Ding, Y.; Fu, K.; Zhong, C.; Gui, W.; Luan, B. On the elemental segregation and melt flow behavior of pure copper laser cladding. Surf. Coat. Technol. 2023, 452, 129085. [Google Scholar] [CrossRef]
  19. Shen, C.; Li, C.; Guo, Y.; Liu, C.; Zhang, X.; Feng, X. Modeling of temperature distribution and clad geometry of the molten pool during laser cladding of TiAlSi alloys. Opt. Laser Technol. 2021, 142, 107277. [Google Scholar] [CrossRef]
  20. Song, B.; Yu, T.; Jiang, X.; Xi, W.; Lin, X. Development mechanism and solidification morphology of molten pool generated by laser cladding. Int. J. Therm. Sci. 2021, 159, 106579. [Google Scholar] [CrossRef]
  21. Thawari, N.; Gullipalli, C.; Vanmore, H.; Gupta, T. In-situ monitoring and modelling of distortion in multi-layer laser cladding of Stellite 6: Parametric and numerical approach. Mater. Today Commun. 2022, 33, 104751. [Google Scholar] [CrossRef]
  22. Wang, L.; Wang, S.; Zhang, Y.; Yan, W. Multi-phase flow simulation of powder streaming in laser-based directed energy deposition. Int. J. Heat Mass Transf. 2023, 212, 124240. [Google Scholar] [CrossRef]
  23. Wu, S.; Liu, Z.; Gong, Y.; Liang, X.; Wu, Y.; Zhao, X. Analysis of the sequentially coupled thermal-mechanical and cladding geometry of a Ni60A-25%WC laser cladding composite coating. Opt. Laser Technol. 2023, 167, 109595. [Google Scholar] [CrossRef]
  24. Xi, W.; Song, B.; Chen, L.; Liang, Y.; Yu, T.; Wang, J.; Sun, Q. Multi-track, multi-layer cladding layers of YCF102: An analytical and predictive investigation of geometric characteristics. Opt. Laser Technol. 2023, 167, 109696. [Google Scholar] [CrossRef]
  25. Yan, S.; Meng, Z.; Chen, B.; Tan, C.; Song, X.; Wang, G. Prediction of temperature field and residual stress of oscillation laser welding of 316LN stainless steel. Opt. Laser Technol. 2022, 145, 107493. [Google Scholar] [CrossRef]
  26. Youssef, D.; Hassab-Elnaby, S.; Al-Sayed, S.R. New 3D model for accurate prediction of thermal and microstructure evolution of laser powder cladding of Ti6Al4V alloy. Alex. Eng. J. 2022, 61, 4137–4158. [Google Scholar] [CrossRef]
  27. Han, T.; Ding, Z.; Feng, W.; Yao, X.; Chen, F.; Gao, Y. Effects of Process Parameters on Microstructure and Wear Resistance of Laser Cladding A-100 Ultra-High-Strength Steel Coatings. Coatings 2024, 14, 669. [Google Scholar] [CrossRef]
  28. Luo, D.; Liu, C.; Wang, C.; Wang, Y.; Wang, X.; Zhao, J.; Jiang, S. Optimization of multilayer laser cladding process parameters based on NSGA-II-MOPSO algorithm. Opt. Laser Technol. 2024, 176, 111025. [Google Scholar] [CrossRef]
  29. Mousa, M.; Osman, H.; Azab, A.; El-Gaddar, A.; Baki, F. Characterization of laser cladding functional coatings: An in-situ monitoring and variability analysis approach. Int. J. Adv. Manuf. Technol. 2024, 133, 1155–1183. [Google Scholar] [CrossRef]
  30. Farahmand, P.; Kovacevic, R. An experimental-numerical investigation of heat distribution and stress field in single- and multi-track laser cladding by a high-power direct diode laser. Opt. Laser Technol. 2014, 63, 154–168. [Google Scholar] [CrossRef]
  31. Meng, G.; Zhang, J.; Zhu, L.; Lan, Q.; Jiang, Z. Effect of process optimization on laser additive manufacturing of Inconel 718 alloy based on finite element analysis: Thermal and structural evaluation. Opt. Laser Technol. 2023, 162, 109261. [Google Scholar] [CrossRef]
  32. Hulka, I.; Uțu, I.D.; Avram, D.; Dan, M.L.; Pascu, A.; Stanciu, E.M.; Roată, I.C. Influence of the Laser Cladding Parameters on the Morphology, Wear and Corrosion Resistance of WC-Co/NiCrBSi Composite Coatings. Materials 2021, 14, 5583. [Google Scholar] [CrossRef]
  33. Liu, Y.; Li, Q.; Ren, Z.; Jiang, Z.; Luo, H.; Zhang, X. Effect of Process Parameters on Stress Field of Laser Additive Manufacturing. Machines 2022, 10, 1197. [Google Scholar] [CrossRef]
  34. Gui, X.; Gao, X.; Zhang, Y.; Wu, J. Investigation of welding parameters effects on temperature field and structure field during laser-arc hybrid welding. Mod. Phys. Lett. B 2022, 36, 2150467. [Google Scholar] [CrossRef]
  35. Etsion, I. State of the art in laser surface texturing. J. Tribol.-Trans. Asme 2005, 127, 248–253. [Google Scholar] [CrossRef]
  36. Yin, B.F.; Li, X.D.; Fu, Y.H.; Wang, Y. Research on Tribological Performance of Cylinder Liner by Micro-Laser Surface Texturing. Adv. Sci. Lett. 2011, 4, 1318–1324. [Google Scholar] [CrossRef]
  37. Zhou, J.; Shen, H.; Pan, Y.; Ding, X. Experimental study on laser microstructures using long pulse. Opt. Lasers Eng. 2016, 78, 113–120. [Google Scholar] [CrossRef]
  38. Gan, Z.; Yu, G.; He, X.; Li, S. Numerical simulation of thermal behavior and multicomponent mass transfer in direct laser deposition of Co-base alloy on steel. Int. J. Heat Mass Transf. 2017, 104, 28–38. [Google Scholar] [CrossRef]
  39. Chai, Q.; Zhang, H.; Fang, C.; Qiu, X.; Xing, Y. Numerical and experimental investigation into temperature field and profile of Stellite6 formed by ultrasonic vibration-assisted laser cladding. J. Manuf. Process. 2023, 85, 80–89. [Google Scholar] [CrossRef]
Figure 1. The thermophysical properties of powder and substrate: (a) specific heat capacity, (b) viscosity, (c) thermal conductivity, (d) density.
Coatings 14 01020 g001
Figure 2. The schematic illustration of laser cladding.
Coatings 14 01020 g002
Figure 3. Temperature distribution and flow field on surface of cladding layer.
Coatings 14 01020 g003
Figure 4. The temperature maximum of substrate with different process parameters: (a) 3D distribution, (b) contour plot.
Coatings 14 01020 g004
Figure 5. The temperature maximum of cladding layer with different process parameters: (a) 3D distribution, (b) contour plot.
Coatings 14 01020 g005
Figure 6. The evolution of cladding layer from starting position with the process parameter combination of laser power of 1750 W and scanning velocity of 4 mm/s.
Coatings 14 01020 g006
Figure 7. Constant cladding-layer height with different process parameters: (a) 3D distribution, (b) contour plot.
Coatings 14 01020 g007
Figure 8. The horizontal distance from the starting point of constant cladding-layer height to the boundary of specimen with different process parameters: (a) 3D distribution, (b) contour plot.
Coatings 14 01020 g008
Figure 9. The temperature difference between cladding layer and substrate on initial position, arriving at constant cladding-layer height with different process parameters: (a) 3D distribution, (b) contour plot.
Coatings 14 01020 g009
Figure 10. Laser-cladding-related equipment: (a) Reci FMC 4000 CW fiber laser, (b) KUKA six-degree-of-freedom robot system and processing table.
Coatings 14 01020 g010
Figure 11. Macro and micro testing (1750 W/4 mm/s): (a) specimen and position of height measurement after processing, (b) macroscopic cross-section, (c) micrograph of the cross-section.
Coatings 14 01020 g011
Figure 12. Comparison of cladding-layer heights between simulations and experiments under five sets of process parameters.
Coatings 14 01020 g012
Table 1. Chemical composition of AISI H13 substrate (wt.%, weight fraction).
CSiMnCrMoVPSFe
0.31.00.45.11.50.90.020.0290.76
Table 2. Chemical composition of Fe901 powder (wt.%, weight fraction).
CCrMoBSiFe
0.1513.00.81.601.2083.25
Disclaimer/Publisher’s Note: The statements, opinions and data contained in all publications are solely those of the individual author(s) and contributor(s) and not of MDPI and/or the editor(s). MDPI and/or the editor(s) disclaim responsibility for any injury to people or property resulting from any ideas, methods, instructions or products referred to in the content.

