Article

Correlation between Surface Texture, Wettability and Mechanical Strength of Polylactic Acid Parts Fabricated by Fused Filament Fabrication

by
Fermín Bañón-García
*,
Carolina Bermudo Gamboa
,
José Andrés López-Fernández
,
Francisco Javier Trujillo-Vilches
and
Sergio Martín-Béjar
Department of Civil, Materials and Manufacturing Engineering, EII, University of Malaga, 29071 Málaga, Spain
*
Author to whom correspondence should be addressed.
Coatings 2024, 14(8), 1033; https://doi.org/10.3390/coatings14081033
Submission received: 11 July 2024 / Revised: 9 August 2024 / Accepted: 12 August 2024 / Published: 14 August 2024
(This article belongs to the Special Issue Recent Advances in Surface Functionalisation)

Abstract

:
This research investigates the generation and evaluation of various geometric surface textures on PLA components produced via fused filament fabrication (FFF). Textures, including grooves, pyramids, and cylinders, were created at different depth levels on the PLA surfaces. The surface quality of these textures was assessed using a 3D optical system, focusing on area parameters such as Sa and Sz. The wettability of each texture was evaluated through contact angle and sliding angle tests, revealing the ability to modulate contact angles and achieve either hydrophobic or hydrophilic surfaces depending on the texture type. Subsequently, pairs of textured PLA pieces were bonded using a cyanoacrylate adhesive following standardised protocols, and shear tests were conducted to determine the maximum shear stress at bond (τmax) of each texture. Notably, textured surfaces generally exhibited hydrophobic properties that reduce the adhesion between the adhesive and the piece, leading to reduced maximum shear stress at bond values compared to non-textured surfaces. However, groove textures notably increased τmax values. The results were analysed to establish correlations between surface quality, wettability, and shear strength. This comprehensive evaluation aims to elucidate the influence of surface texture on the mechanical performance and adhesive properties of FFF-manufactured PLA components.

1. Introduction

Additive manufacturing by material extrusion, commonly known as fused filament fabrication (FFF), is experiencing increasing demand in various industries due to its ability to produce specific products with high precision and meet the requirements of different sectors [1]. This technology makes it possible to create complex geometries that cannot be achieved by other manufacturing processes, using a wide range of materials to create products with high functional performance [2]. Abel et al. [3] stated that with FFF it is possible to produce large and complex components quickly with high material efficiency and combinations of materials such as stainless steel.
Despite its many advantages, FFF technology has limitations in the production of large objects [4]. Silva et al. [5] pointed out that there are practical limits to the shape and size of structures that can be produced by FFF, which may limit the production of large objects due to surface quality and dimensional accuracy issues.
To overcome this limitation, the strategies developed involve dividing the product into sub-elements that are then assembled. This assembly is often carried out using adhesives, with cyanoacrylate being one of the most common [6]. Alvarez et al. [7] characterised and optimised mechanically interlocking adhesive bonds using cyanoacrylate on FFF ABS parts, achieving tensile and yield strengths close to those of the base material. The effectiveness of the bond is highly dependent on the surface roughness of the parts, which is directly related to the surface activation and wetting capacity [8].
One strategy to improve adhesion is to create surface textures. Currently, there are lines of research focusing on the creation of specific geometric patterns that can alter the quality of the surface and modify its activation [9]. Depending on the shape and size of these patterns, it is possible to obtain either hydrophilic surfaces, which improve adhesive adhesion, or hydrophobic surfaces that provide greater resistance to liquids, the latter being useful for protecting internal mechanisms or circuits and reducing the hygroscopicity of materials such as PLA [10]. In this regard, Lee et al. [11] created superhydrophobic surfaces on PLA by printing surface textures and coating them with silica nanoparticles, improving liquid resistance and reducing water adhesion.
Recent research has evaluated these textures by means of wetting tests, relating the contact angle of different liquids to the texture obtained. Furthermore, the behaviour of the liquid when deposited has also been studied through the evaluation of the slip angle [12].
The combination of peaks and valleys in the roughness of the textures can allow rapid expansion of the liquid by tilting the surface or holding the liquid in near vertical positions [13]. This phenomenon was also observed by Lee et al. [14], who concluded that 3D printing of superhydrophobic polymer surfaces with gradient wettability enables effective control of droplet movement. They printed microscopic patterns replicating semicircular shapes with variable surface slope and demonstrated that these surfaces significantly reduced droplet and spray distances compared to conventional superhydrophobic surfaces. This technique was shown to be effective in controlling droplet velocity and improved fluid management in a variety of applications.
Surface roughness parameters such as Sa, Sz and, more recently, Sk and Vvc, have been used to more accurately define the final surface quality achieved [15]. Sa (arithmetic mean height) is the arithmetic average of the absolute heights of the surface measured from a reference line, providing a measure of average roughness and a general assessment of surface quality. Sz (maximum height) is the distance between the highest peak and the deepest valley on the measured surface and provides crucial insight into extreme surface characteristics that can affect material performance. Sk (core roughness depth) refers to the depth of core roughness, which represents the central portion of the surface used primarily in tribological applications; this parameter is essential in assessing the load-carrying capacity and wear resistance of a surface. Vvc (core void volume) indicates the void volume in the core region of the surface, a vital parameter for applications where the ability to retain lubricant on the surface is important, such as sliding components. The Sa parameter is useful for a general evaluation of surface roughness and is a metric commonly used in industry for quality control [16]. Sz provides crucial information about the extreme characteristics of the surface, essential for applications where peaks and valleys can affect material performance [17]. The Sk parameter is key in tribological applications, indicating the surface’s capacity to bear loads and resist wear [18]. Vvc is important for applications where lubricant retention on the surface is crucial, enhancing the component’s efficiency and durability [19].
Sousza et al. [20] stated that surface characterisation may/must include roughness parameters such as Sa, Sz, Sku and Ssk, and demonstrated that a reduction in Sa of up to 86% enhances surface quality and wettability.
Although there are studies that relate roughness and wettability in parts produced directly by FFF, most research concerning texturing patterns has focused on metallic materials and has been limited to technologies such as laser texturing. This has led to a gap in the current scientific literature on the creation of textured patterns directly during the FFF manufacturing process. In this regard, Feng et al. [21] concluded that laser texturing in dimple, groove and grid patterns improved surface roughness and wettability, with a significant increase in the shear strength of bonded joints, particularly on grid-patterned surfaces. Dwivedi et al. [22] demonstrated that texturing of 316L stainless steel with pyramidal patterns had a marked effect on surface roughness and wettability and exhibited hydrophilic behaviour. Concerning the texturization of polymers, Tofil et al. [23] found that laser texturing of polyethylene (PE) with geometric patterns significantly increased the shear strength of bonded joints, showing a considerable increase compared to materials without micropatterns.
In this scientific context, this article proposes the fabrication of various texture patterns using fused filament fabrication (FFF) at different heights, with the objective of correlating the type of texture to its surface quality, particularly in terms of area and wettability. Additionally, mechanical tensile tests are conducted to evaluate the bonding strength of the textures when adhered with cyanoacrylate.
Furthermore, the study aims to analyse the behaviour of identical products manufactured through FFF when their surfaces are modified with specific geometric textures. By systematically varying the texture patterns and assessing their impact on surface characteristics and bonding performance, the research seeks to provide a comprehensive understanding of how surface texturing can enhance the functional properties of FFF-produced components.
Previous studies on texturing in additive manufacturing processes such as fused filament manufacturing (FFF) have mainly focused on metallic materials and technologies such as laser texturing. For example, Feng et al. [21] investigated laser texturing on dimple, groove and grid patterns, and Dwivedi et al. [22] studied the effects of texturing on 316L stainless steel. However, there is a paucity of research exploring textured patterns created directly during the fabrication process using FFF on polymeric materials such as PLA. This work fills this gap by investigating the generation and evaluation of geometric textures in PLA components produced by FFF and their influence on surface quality, wettability and mechanical strength.
The novelty of this work lies in the creation of geometric textures directly during the fused filament fabrication (FFF) process and in the systematic correlation of these patterns with surface quality parameters and adhesion properties. This approach has not been sufficiently investigated in the existing literature. This study provides valuable data on how textures of different heights and geometries affect shear strength and wettability, thereby optimising bonding processes in industrial applications. This work offers a method for modifying surface properties without post-fabrication processes.

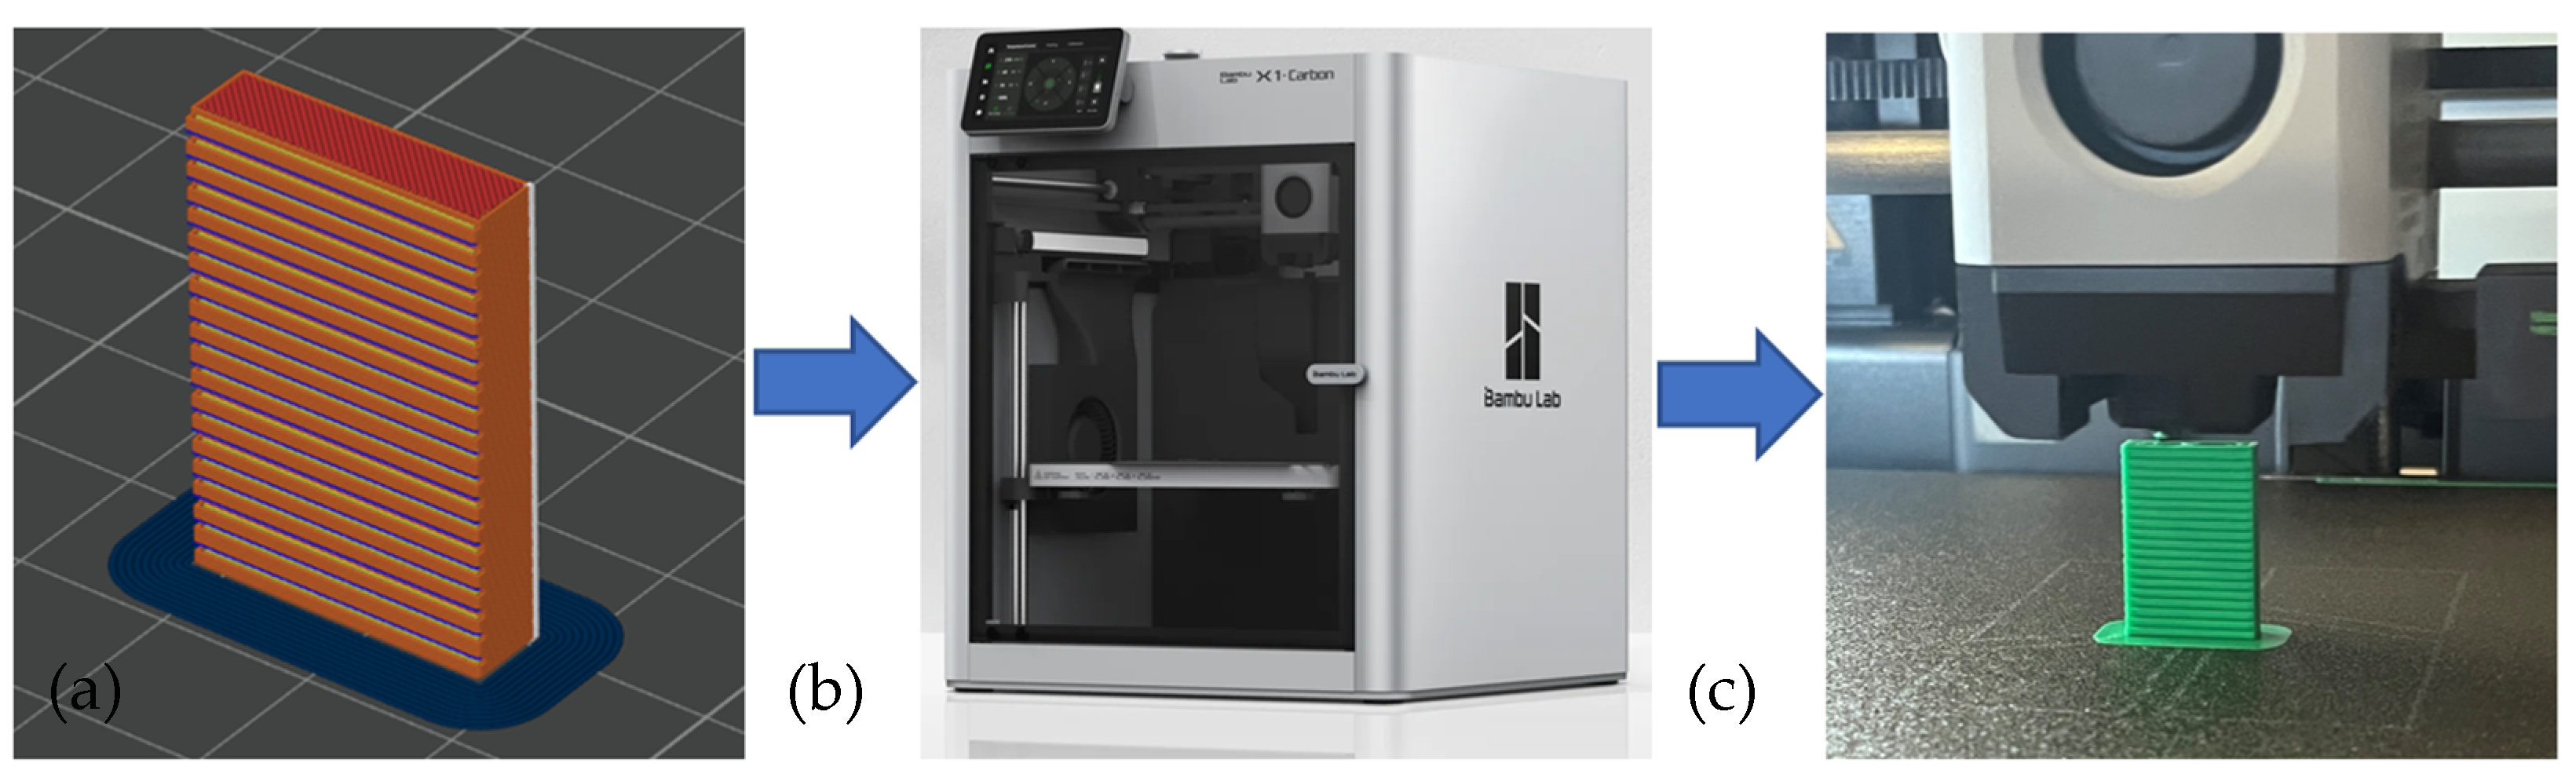
2. Materials and Methods

To evaluate the influence of surface textures on the wettability of a fluid, a set of test specimens were manufactured using additive manufacturing by material extrusion. The material used for the specimens was polylactic acid (PLA), a polymer frequently used in this type of manufacturing process due to its high stiffness, mechanical strength and ease of printing, as well as its status as a sustainable material. The filament used is manufactured and supplied by Raised 3D (USA) under the brand name “Premium 3D Printing Filament”. The filament diameter is 1.75 mm and the operating temperature is between 190 °C and 220 °C. Its modulus of elasticity is 2681 MPa and its tensile strength is 40 MPa.
The test specimens were rectangular polyhedrons with dimensions of 30 mm × 20 mm × 5 mm, with the two faces with the largest surface area measuring 600 mm2 (30 mm × 20 mm). On these surfaces, a variety of textures that protrude from the surface were generated, corresponding to simple geometrical shapes that included cones, square-based pyramids, cylinders and grooves. The design of the test specimens comprised a rectangular polyhedron geometry with dimensions of 30 mm × 20 mm × 5 mm. On one of the faces with the largest surface area (30 mm × 20 mm), a variety of textures were generated from simple geometrical shapes that protrude from the surface, including cones, square-based pyramids, cylinders and grooves. This specimens and the surface patterns are illustrated in Figure 1. Furthermore, to provide a reference of an untextured surface, a specimen with a surface that has not undergone any additional texturing was considered, corresponding to a topography that was obtained directly after the manufacturing process.
The texture geometries were designed with three different height values (H) and different gaps were considered according to the designed geometric characteristics. The values of the dimensional characteristics of each texture are presented in Table 1.
For each of the combinations, a specimen was obtained using a Bambu Lab 3D printer, model X1 Carbon (Shenzhen, China) (Figure 2). The lower height of the texture geometries, at 0.15 and 0.30 mm, necessitated that the material deposition be made in the direction of the geometries due to the larger nozzle size (0.40 mm diameter). The laminating software was Bambu Studio, specifically designed for the FFF printing equipment used. In a further instance, larger texture imperfections were observed, which negatively affected the test topography. To exclude the effect of manufacturing conditions on the final surface, these were maintained constant throughout all tests. The process parameters are presented in Table 2.
For each of the samples obtained, the topography of the surface with the texture, in three dimensions, was obtained from the Alicona optical system, InfiniteFocus SL model (Alicona Imaging GmbH, Graz, Austria) (Figure 3). Each specimen was analysed using the Focus-Variation optical system Alicona Infinite Focus®, obtaining the three-dimensional topography of each textured surface. This process is represented in Figure 3 for the textured surface corresponding to slots.
The microgeometry of the surface was quantified by measuring the arithmetical mean height of the surface (Sa), the maximum height of the surface (Sz), the core roughness depth (Sk), and the core void volume (Vvc). The measuring device scans and evaluates areas of 2 mm × 2 mm. Due to the repeatability of the generated texture, areas of 4 mm × 2 mm were scanned. The evaluation parameters for shape filtering and texture separation in terms of roughness were followed under ISO 25178. For the evaluation of the surface quality, the ISO 25178 standard was followed, applying a Gaussian filter for flat surfaces under ISO 16610-61).
The methodology to obtain the roughness parameters of area Sa, Sz, Sk and Vvc is shown in Figure 4. Figure 4a shows the digitised surface corresponding to the minimum evaluation area of 2 mm × 2 mm. Subsequently, the obtained surface was levelled by means of a least squares plane to align the surface. Using the Gaussian filter established by the ISO 25178 standard and the ISO 16610-61 standard, the shape defects of the digitised surface are eliminated by means of a cutoff established by the standard (Figure 4b). This allows the corresponding distribution of peaks and valleys to be obtained from the digitised and filtered area to calculate the area roughness parameters (Figure 4c).
The calculation of these area surface quality parameters is obtained through the following equations:
Sa is the arithmetic average of the absolute deviations of the surface from the reference line. The equation is expressed as follows:
S a = ( 1 A ) | z ( x , y ) |   d x   d y ,
where A is the total area of the measured surface and z(x, y) is the height of the surface at point (x, y).
Sz is the distance between the highest peak and the deepest valley within the measured surface. It is calculated as follows:
Sz = zmax − zmin,
where zmax is the maximum height and zmin is the minimum surface height.
Sk is the core roughness depth, defined as the total height between the values where the surface load curve intersects 10% and 80% of the material support. It is calculated as follows:
Sk = z80% − z10%,
where z80% is the height corresponding to 80% of the material support and z10% is the height corresponding to 10% of the material support.
Vvc is the void volume in the core region of the surface, determined by the area fraction of the voids in the core. It is calculated by integrating the core area and dividing by the total area as follows:
Vvc = ( 1 A ) [ z ( x , y ) z mean ]   d x   d y ,
where zmean is the average core height.
The values obtained in each test specimen allowed us to determine the influence of the surface topography on the wettability of a fluid. For this purpose, a 20 mm³ water drop was deposited using a pipette (Figure 5a). Once the drop had been deposited, a photographic image of the drop was taken, and the contact angle formed by the drop with respect to the surface of the part was measured (Figure 5b). The deviation obtained in the deposition of different drops under the same conditions was less than 1°. This enabled the surface to be classified as hydrophobic (θ > 90°) or hydrophilic (θ < 90°). The value of the contact angle was obtained from the image using the open software Image J. To guarantee the consistency of the results, this process was repeated three times for each specimen, obtaining the mean value of all measurements. Furthermore, the angle of the drop was measured independently in two directions: one in the direction of material deposition and the second in the perpendicular direction. This was carried out mainly due to the anisotropy of the pieces obtained by FFF.
Another factor that has been considered is the fluid retention capacity of each surface obtained. To determine the slip angle (α), the angle of inclination at which the deposited droplet ceases to behave statically and moves because of gravity was measured (Figure 5c). This was achieved using a turntable and an angular standard block which enabled the measurement of angles of inclination up to 75°. As with the static contact angle, the operation was repeated up to three times, and the resulting average value is presented.
Considering the initial wettability results obtained for the samples printed by FFF, an analysis of the influence of topography on the bonding of two surfaces by means of adhesives was carried out. Considering the wettability results obtained for the samples printed by FFF, an analysis was conducted to assess the influence of the topography on the bonding of two surfaces by means of adhesive. A new set of printed specimens with surface textures in the form of pyramids, cones, grooves and cylinders was obtained for this purpose (Figure 6). The maximum length was 40 mm, and the maximum width was 25 mm. The textured area was 12.5 mm × 25 mm. The heel of the sample had a height of 4 mm, and the total thickness of the sample was 8 mm. However, for the purposes of this study, only the most representative specimens were selected, corresponding to those with the greatest expansion of liquid on the surface in the wettability tests, which were characterised by a lower value of θ for each of the geometries evaluated. The geometrical conditions of each specimen are presented in Table 3.
To facilitate the joining process, two samples were obtained for each configuration. The samples were produced using the same FFF equipment and under the same conditions as shown in Table 2.
The bond was created using ethyl cyanoacrylate, which is an adhesive recommended for bonding polymeric materials, with a ultimate strength of approximately 20 N/mm². Prior to the application of the adhesive, the entire surface was subjected to a dry-cleaning process. Subsequently, the adhesive was applied evenly to the textured surface and left for 24 h to ensure maximum bond hardening.
For the purposes of the adhesion analysis, a Servosis Testing Machine universal tensile machine, model SERIE ME-402 (Madrid, Spain), was employed (Figure 6), applying shear stresses to the bonded surface. A total of five tests were conducted for each of the configurations under investigation. A strain rate of 2 mm/min was used during the tests. The test results yielded the maximum stress that the adhesive bond could withstand with the different textures implemented.
The adhesion analysis was conducted through shear tests using a Servosis Testing Machine universal tensile machine, model SERIE ME-402 (Figure 7). The specimens were designed to allow the application of shear stresses to the bonded surface, thereby maintaining their alignment during the test. A total of five tests were conducted for each of the configurations under investigation. The displacement of the fixtures was set to 2 mm/min and maintained until the separation of the two parts of the specimens was achieved, thus allowing the ultimate stress that the adhesive bond could withstand for each texture to be determined.

3. Results

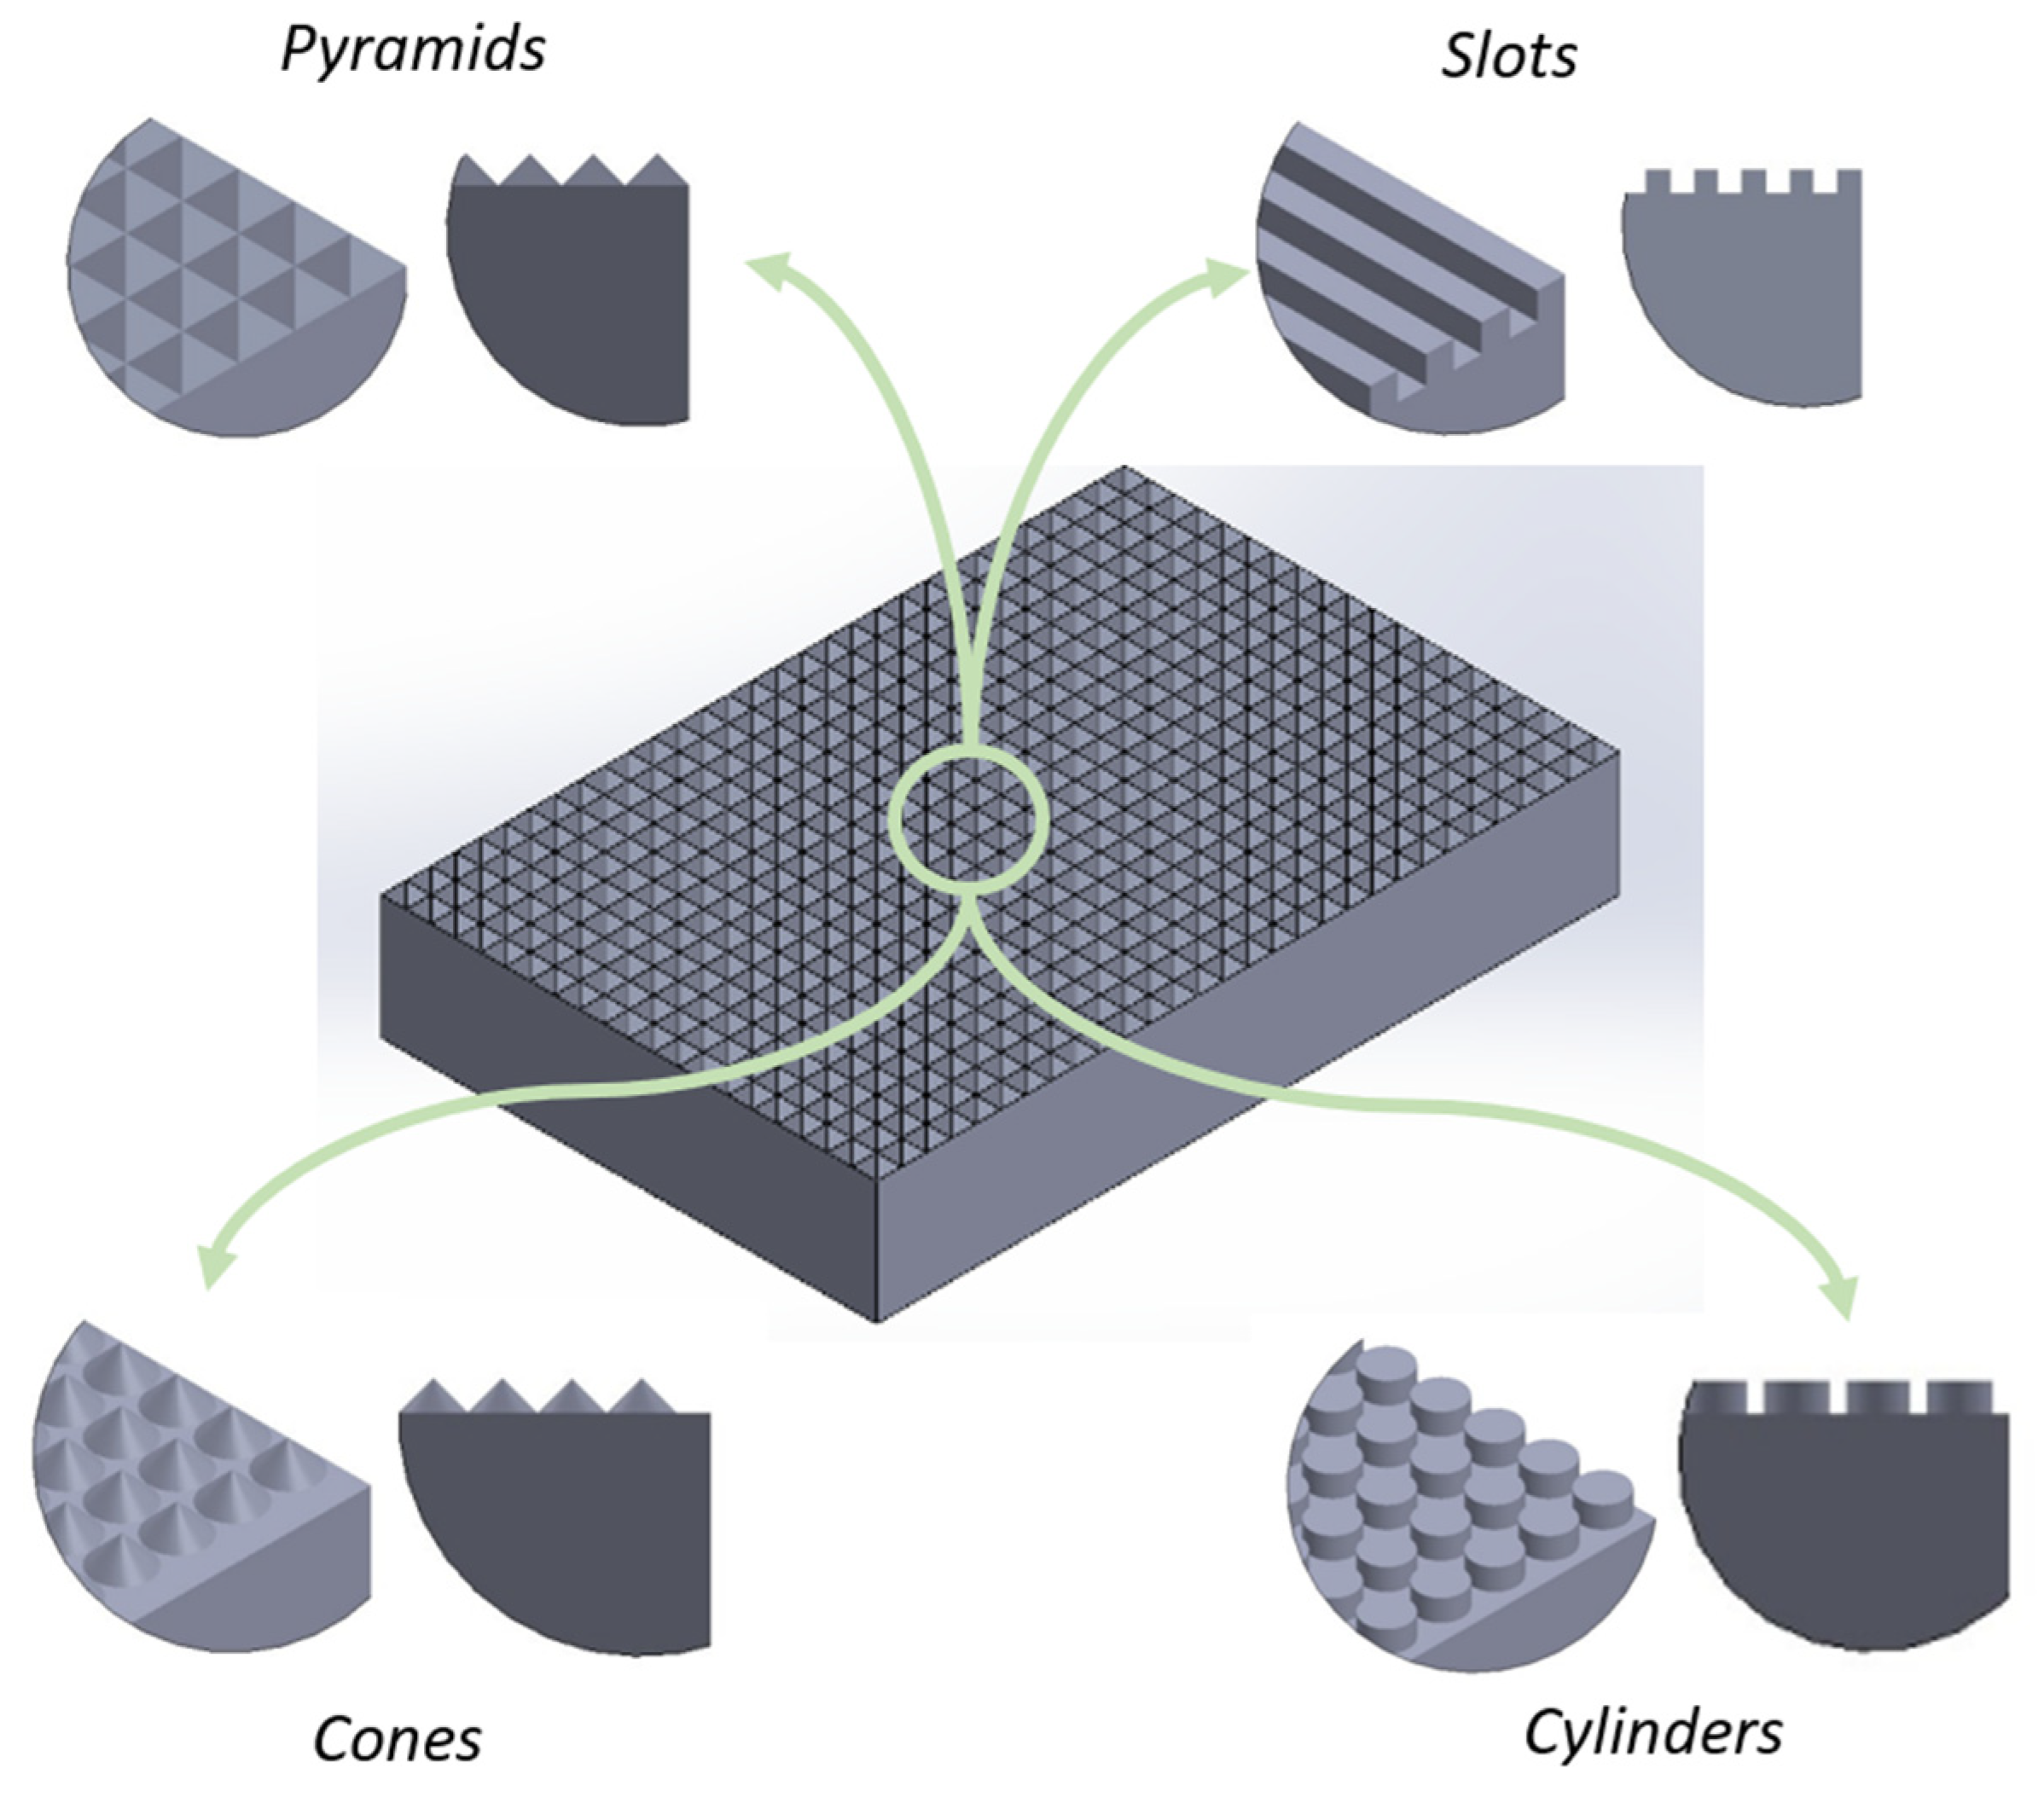
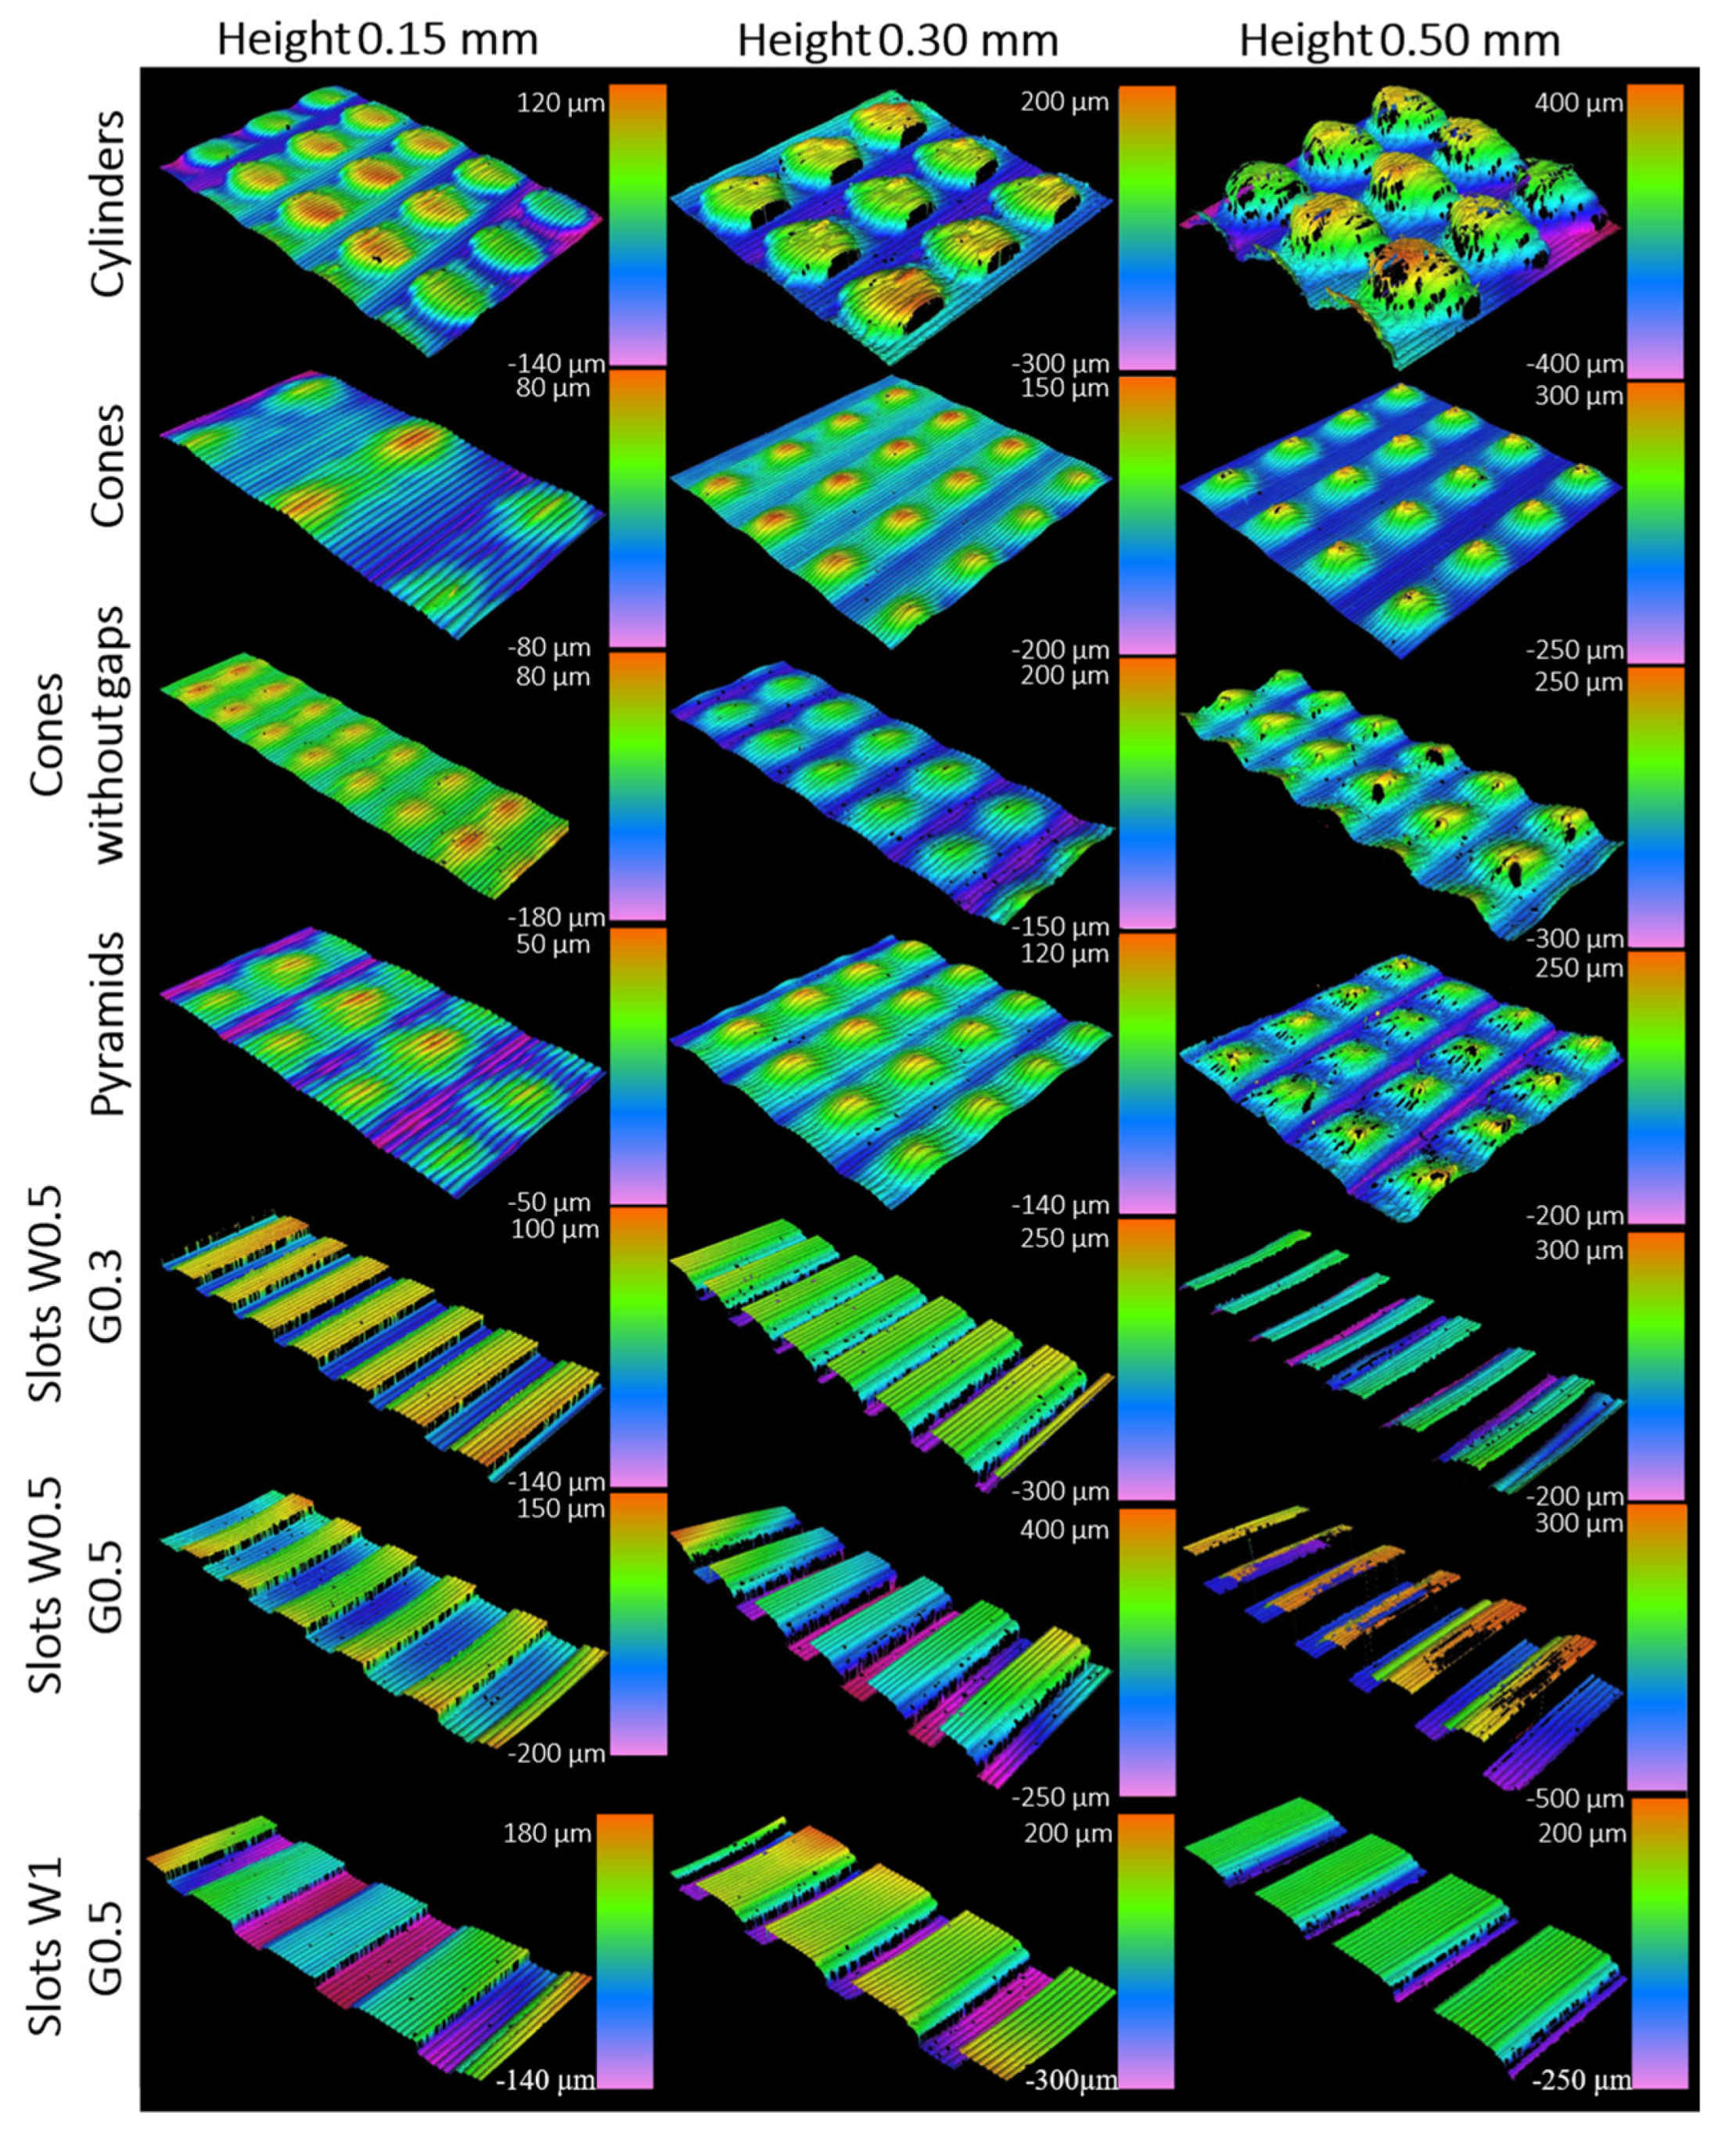
3.1. Geometric Texture Results

The aim of this study is to obtain different geometric textures to record the geometry, surface quality and wettability to determine their influence on adhesive bonding operations. The study of textures obtained by FFF (fused filament fabrication) for different geometries and texture heights revealed variations in their definition and quality. In this regard, Figure 8 illustrates these textures and clearly shows the differences according to the height and geometry used. It is important to note that the black areas observed in the images are a consequence of the lack of light reflection during digitisation, which can be attributed to irregularities in the texture or to the inherent depth of the texture.
Regarding the overall geometry of the texture, it was found that the texture height is directly related to the accuracy of the surface. In this regard, those textures with texture heights of 0.15 mm and 0.3 mm were well defined, whereas for a value of 0.5 mm, the textures presented less quality. Concretely, it has been observed that a higher texture height produces a sharper and less defined pattern in cylinder and groove geometries. In contrast, cone and pyramid textures show better definition as the height is increased.
In the specific case of cone textures, the elimination of a possible gap between them seems to reduce the texture effect, especially at a height of 0.5 mm. This phenomenon, combined with printing the piece in a vertical position to ensure the dimensional accuracy of the texture, seems to result in a less defined pattern.
To compare the accuracy of the different textures generated by FFF, the xy profile of the textures corresponding to a height of 0.15 mm is represented in Figure 9. Firstly, Figure 9a shows the surface of a part printed directly in FFF with no added texture. In this case, the roughness represented corresponds to the deposition of each filament, which had an approximate layer height of 0.8 mm.
A very similar profile is observed between the gap cone texture (Figure 9c) and the pyramid texture (Figure 9e). However, the transition between peak and trough in the cone texture is smoother, which may allow for better accommodation of the adhesive. In contrast, the abrupt transition in the pyramid texture, especially when the height of the texture is greater, may result in the incorrect accommodation of the adhesive between the patterns, creating possible air pockets that would reduce the quality of the final bond [24]. A similar phenomenon is observed in the gapless cone texture (Figure 9d) where this distribution can affect the final roughness and expansion of the adhesive.
In the groove textures (Figure 9f,g), a slightly increasing slope is observed due to the homogeneity of the texture and its depth. This effect is due to the pressure arrangement of the part. As the textured surface is arranged vertically, the sides of the slots are printed horizontally without printing supports, being the cantilevered surface of the texture deformed by gravity. This results in a texture that is not perfectly symmetrical. However, this defect can be minimised by reducing the height of the texture.

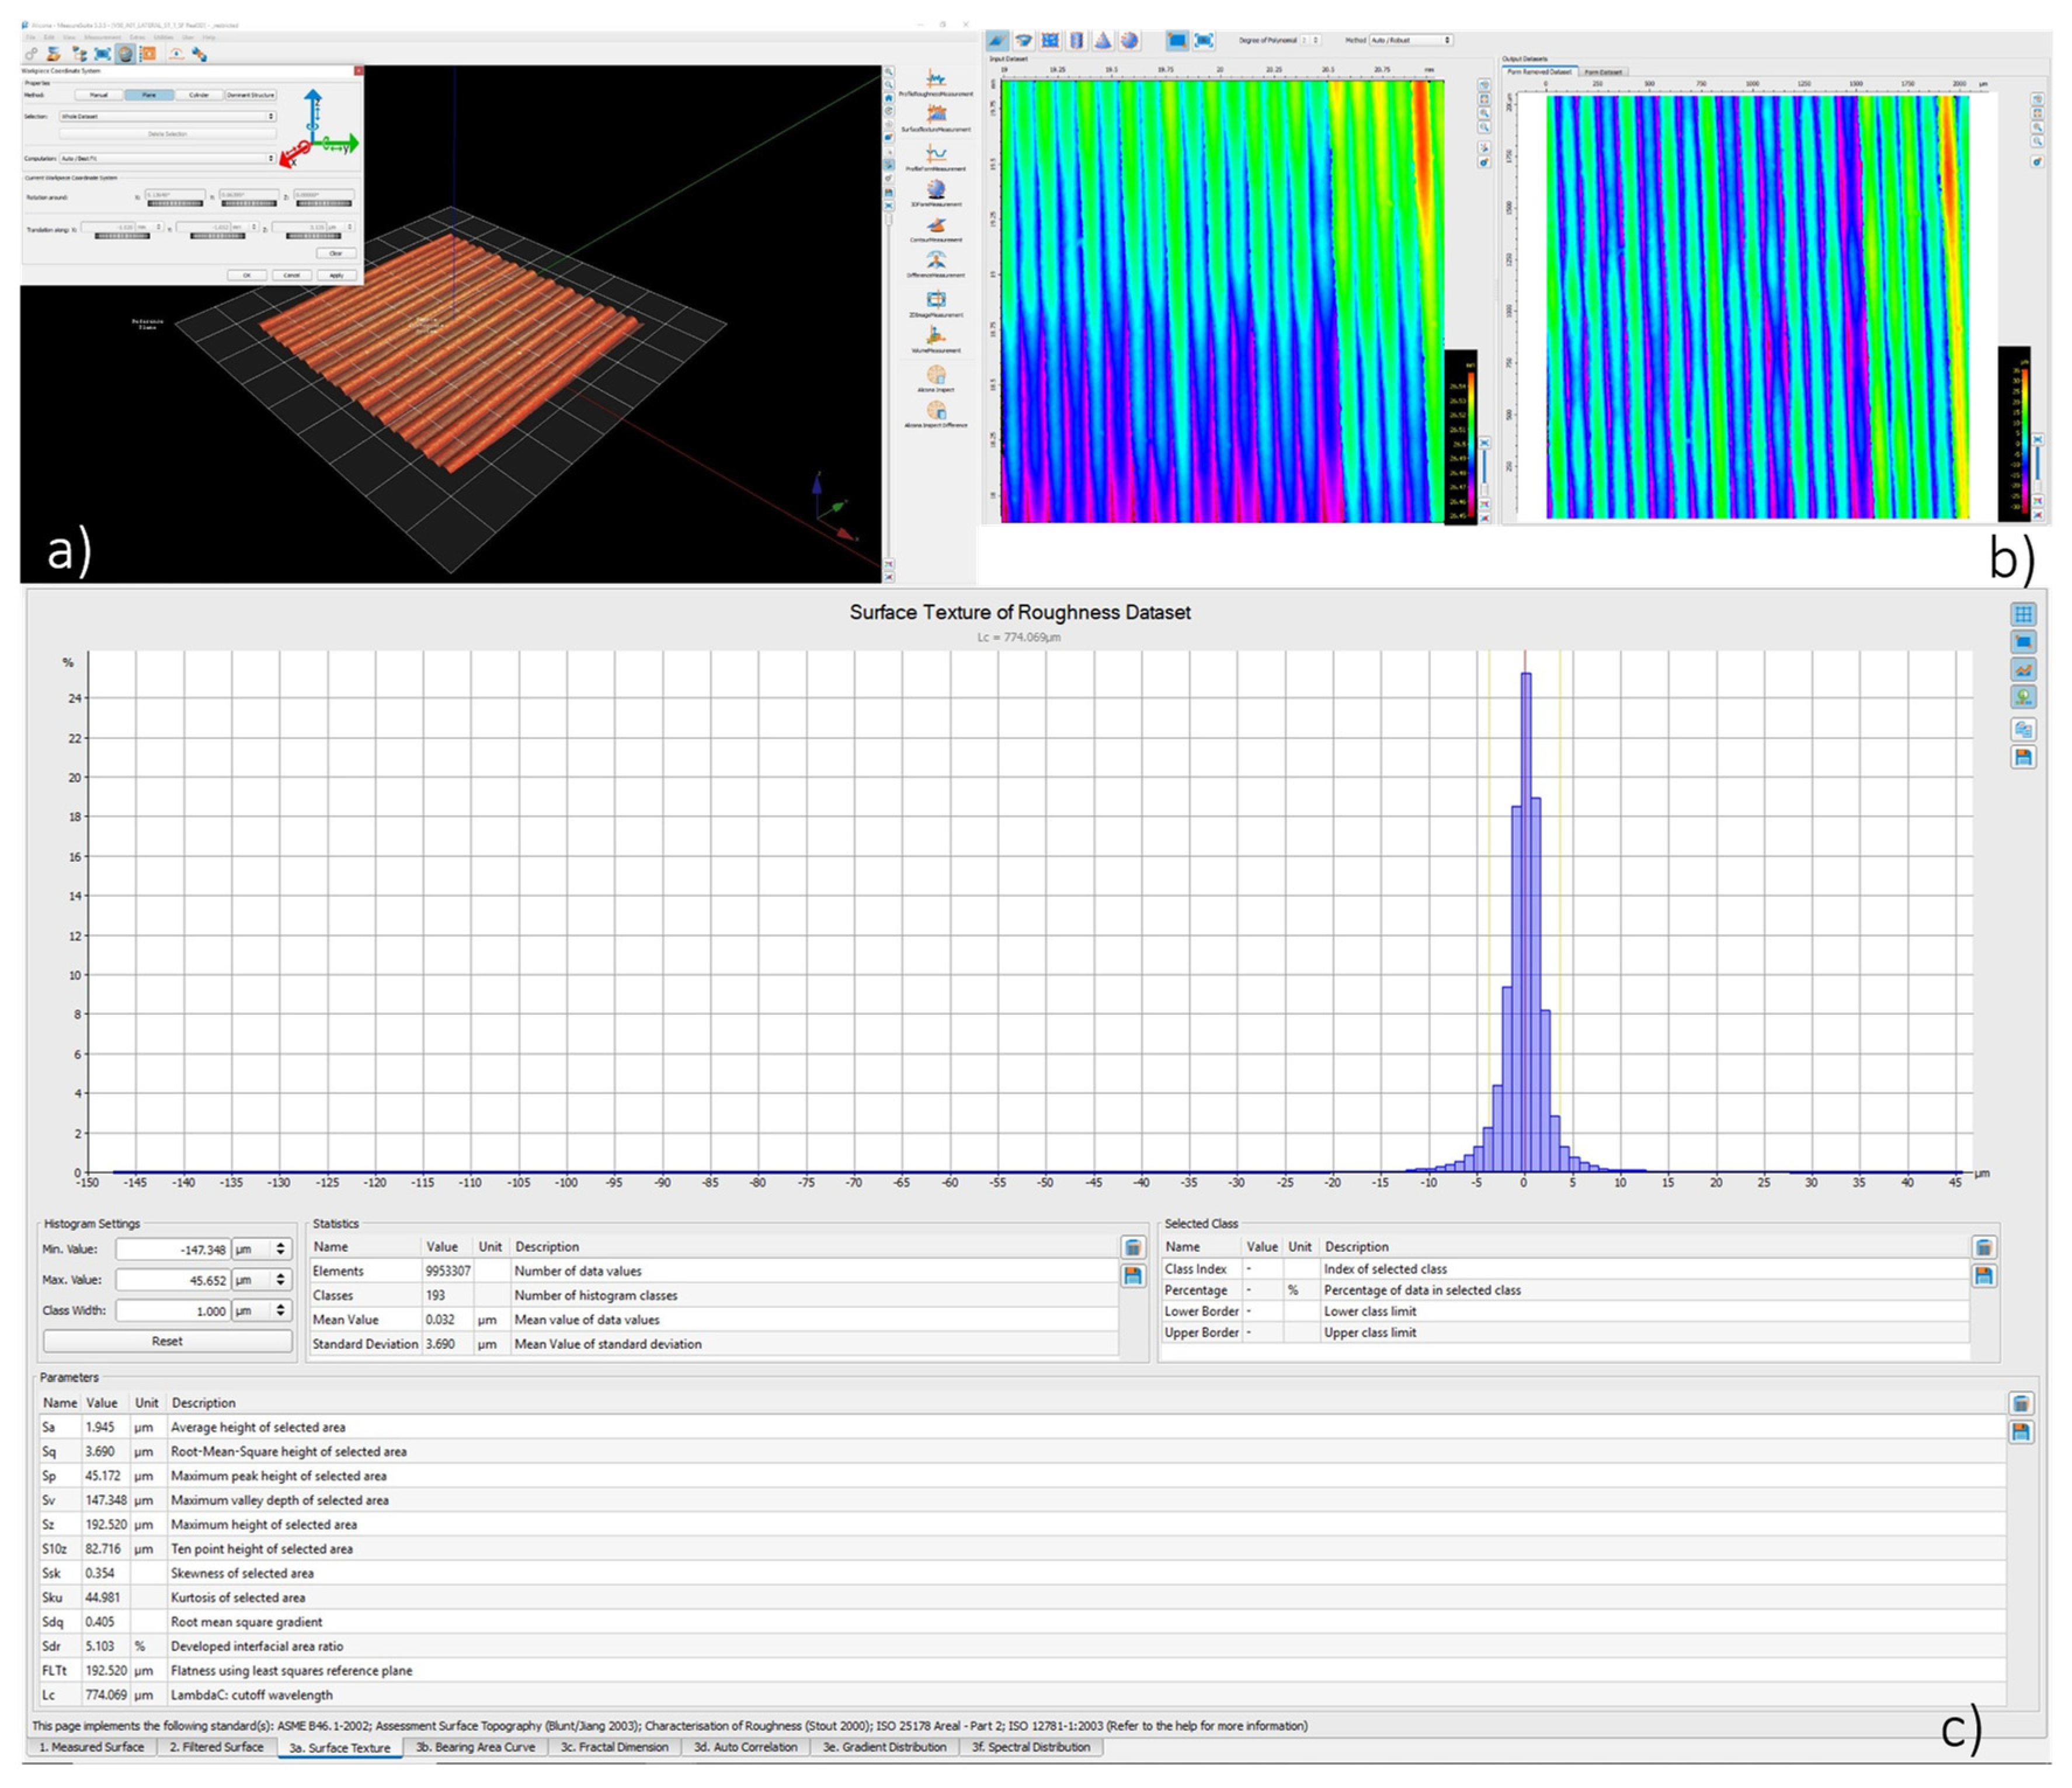
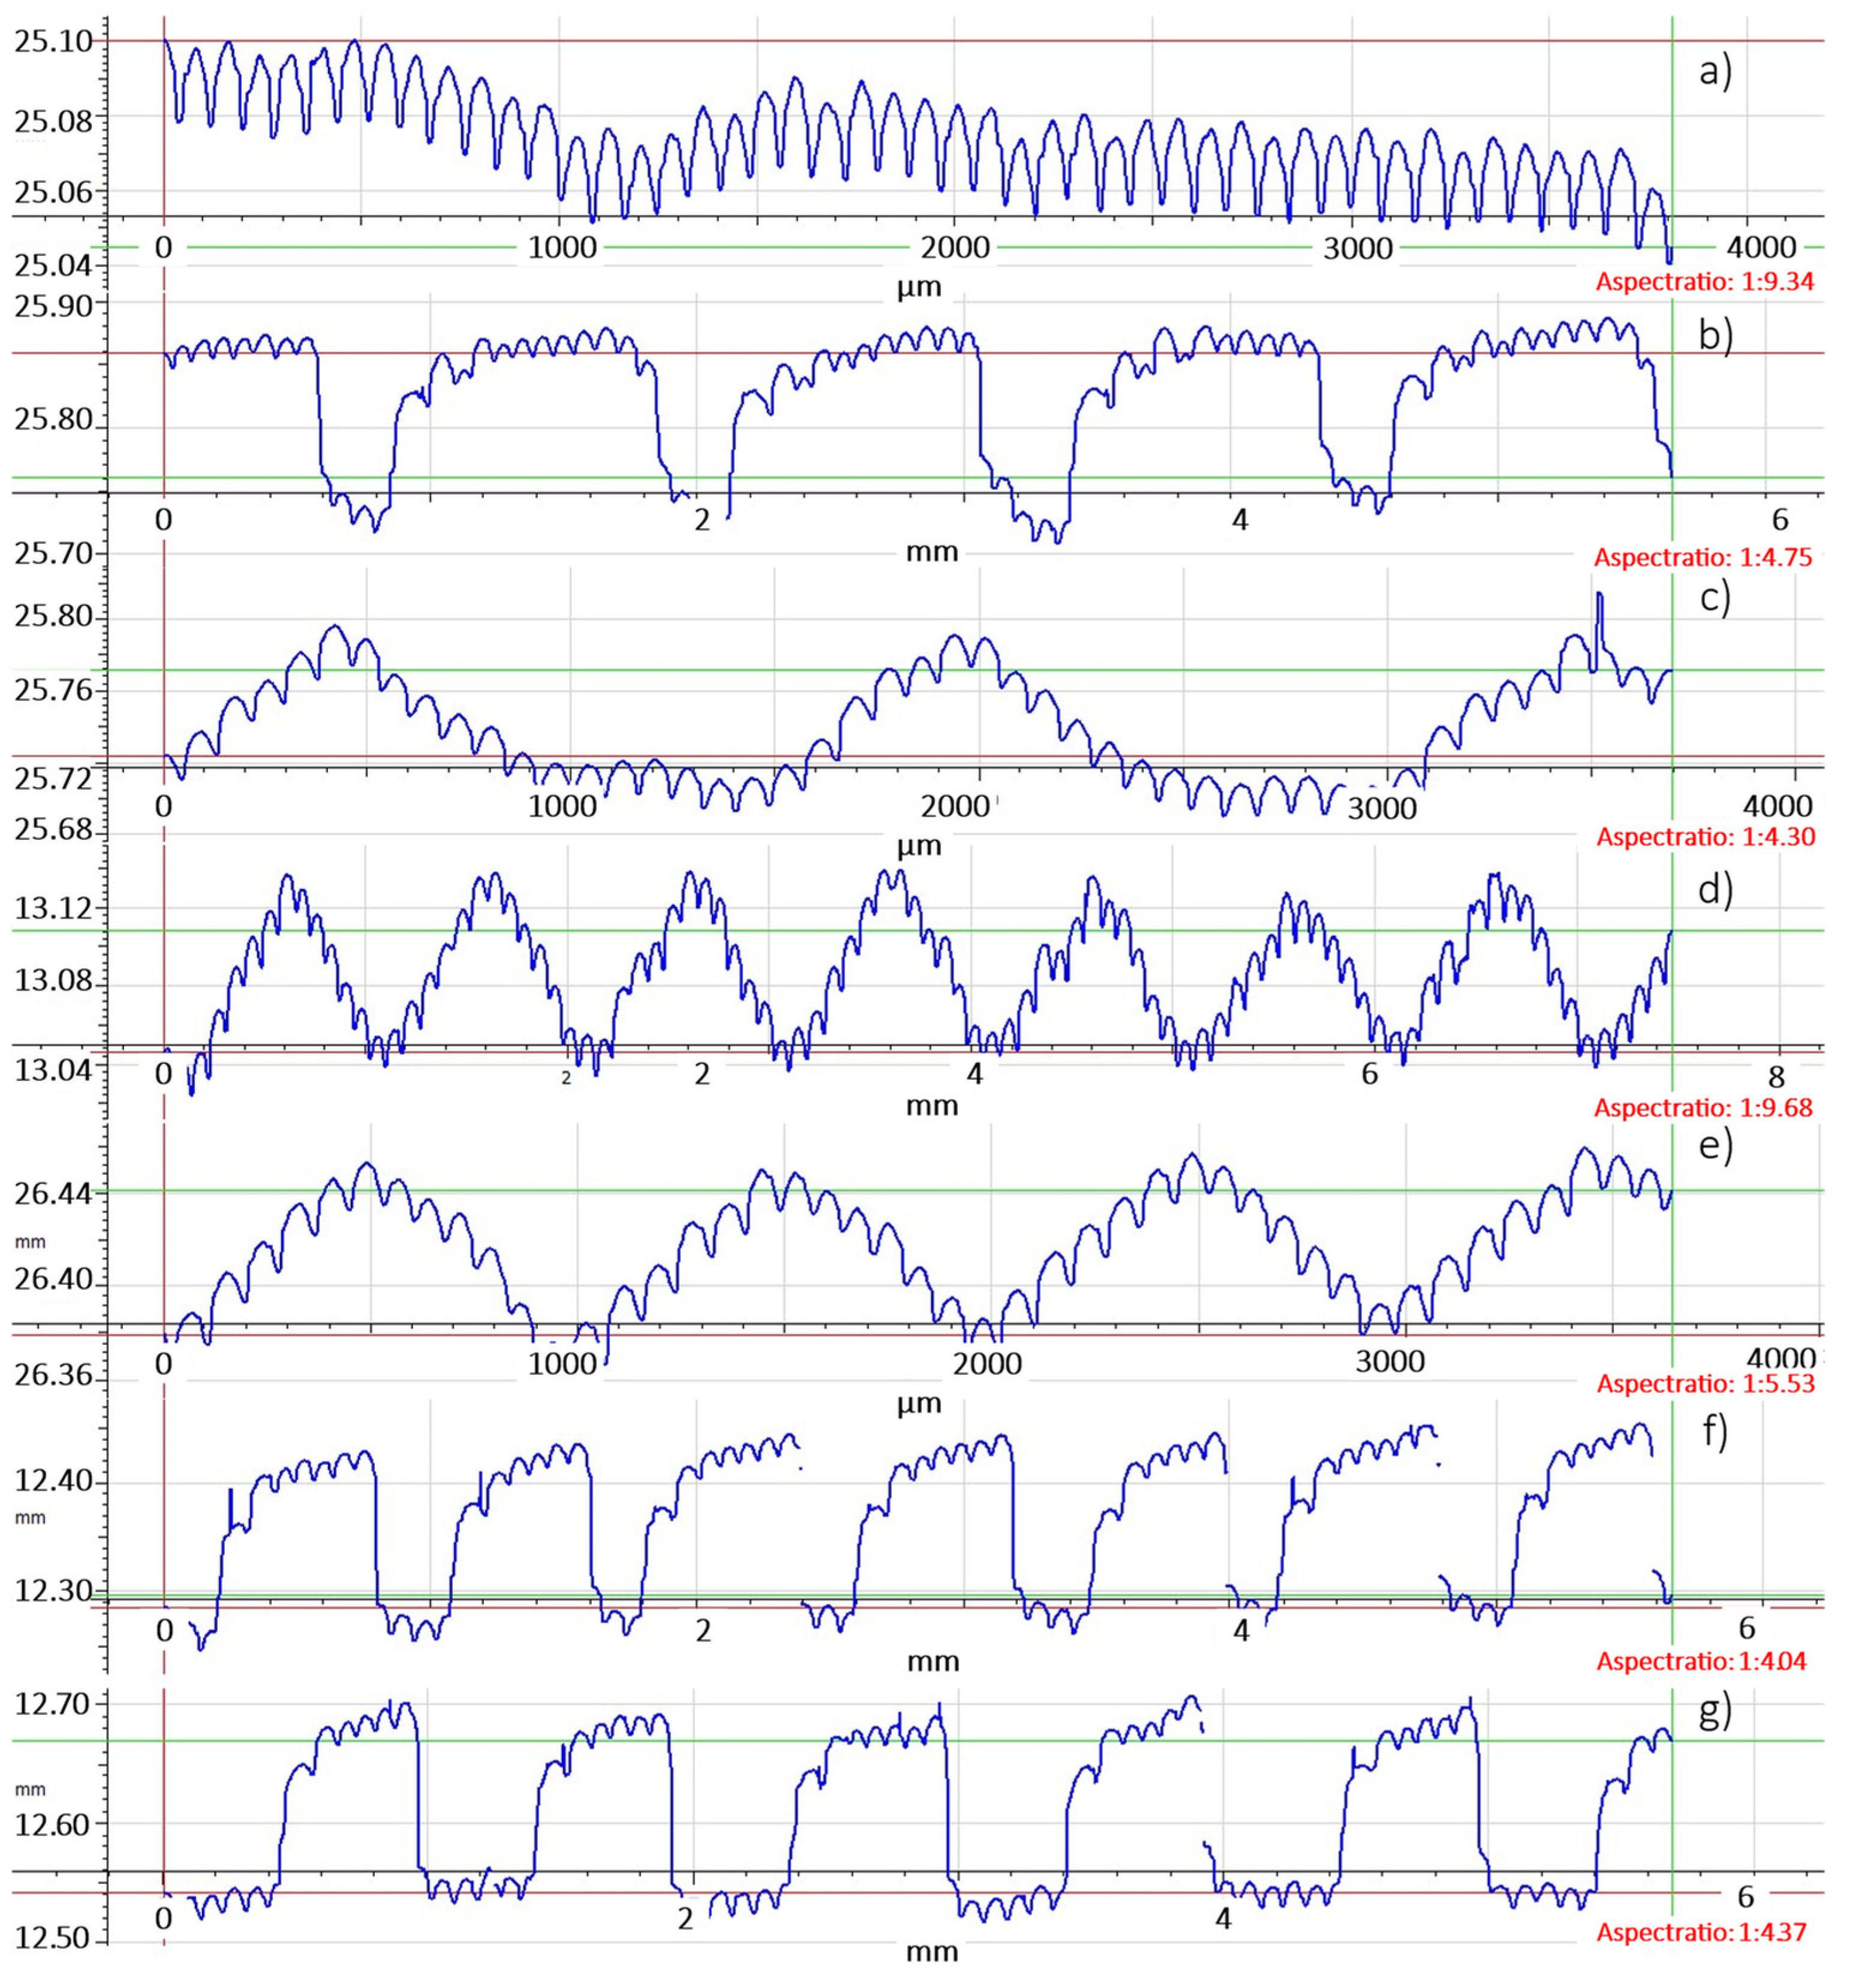
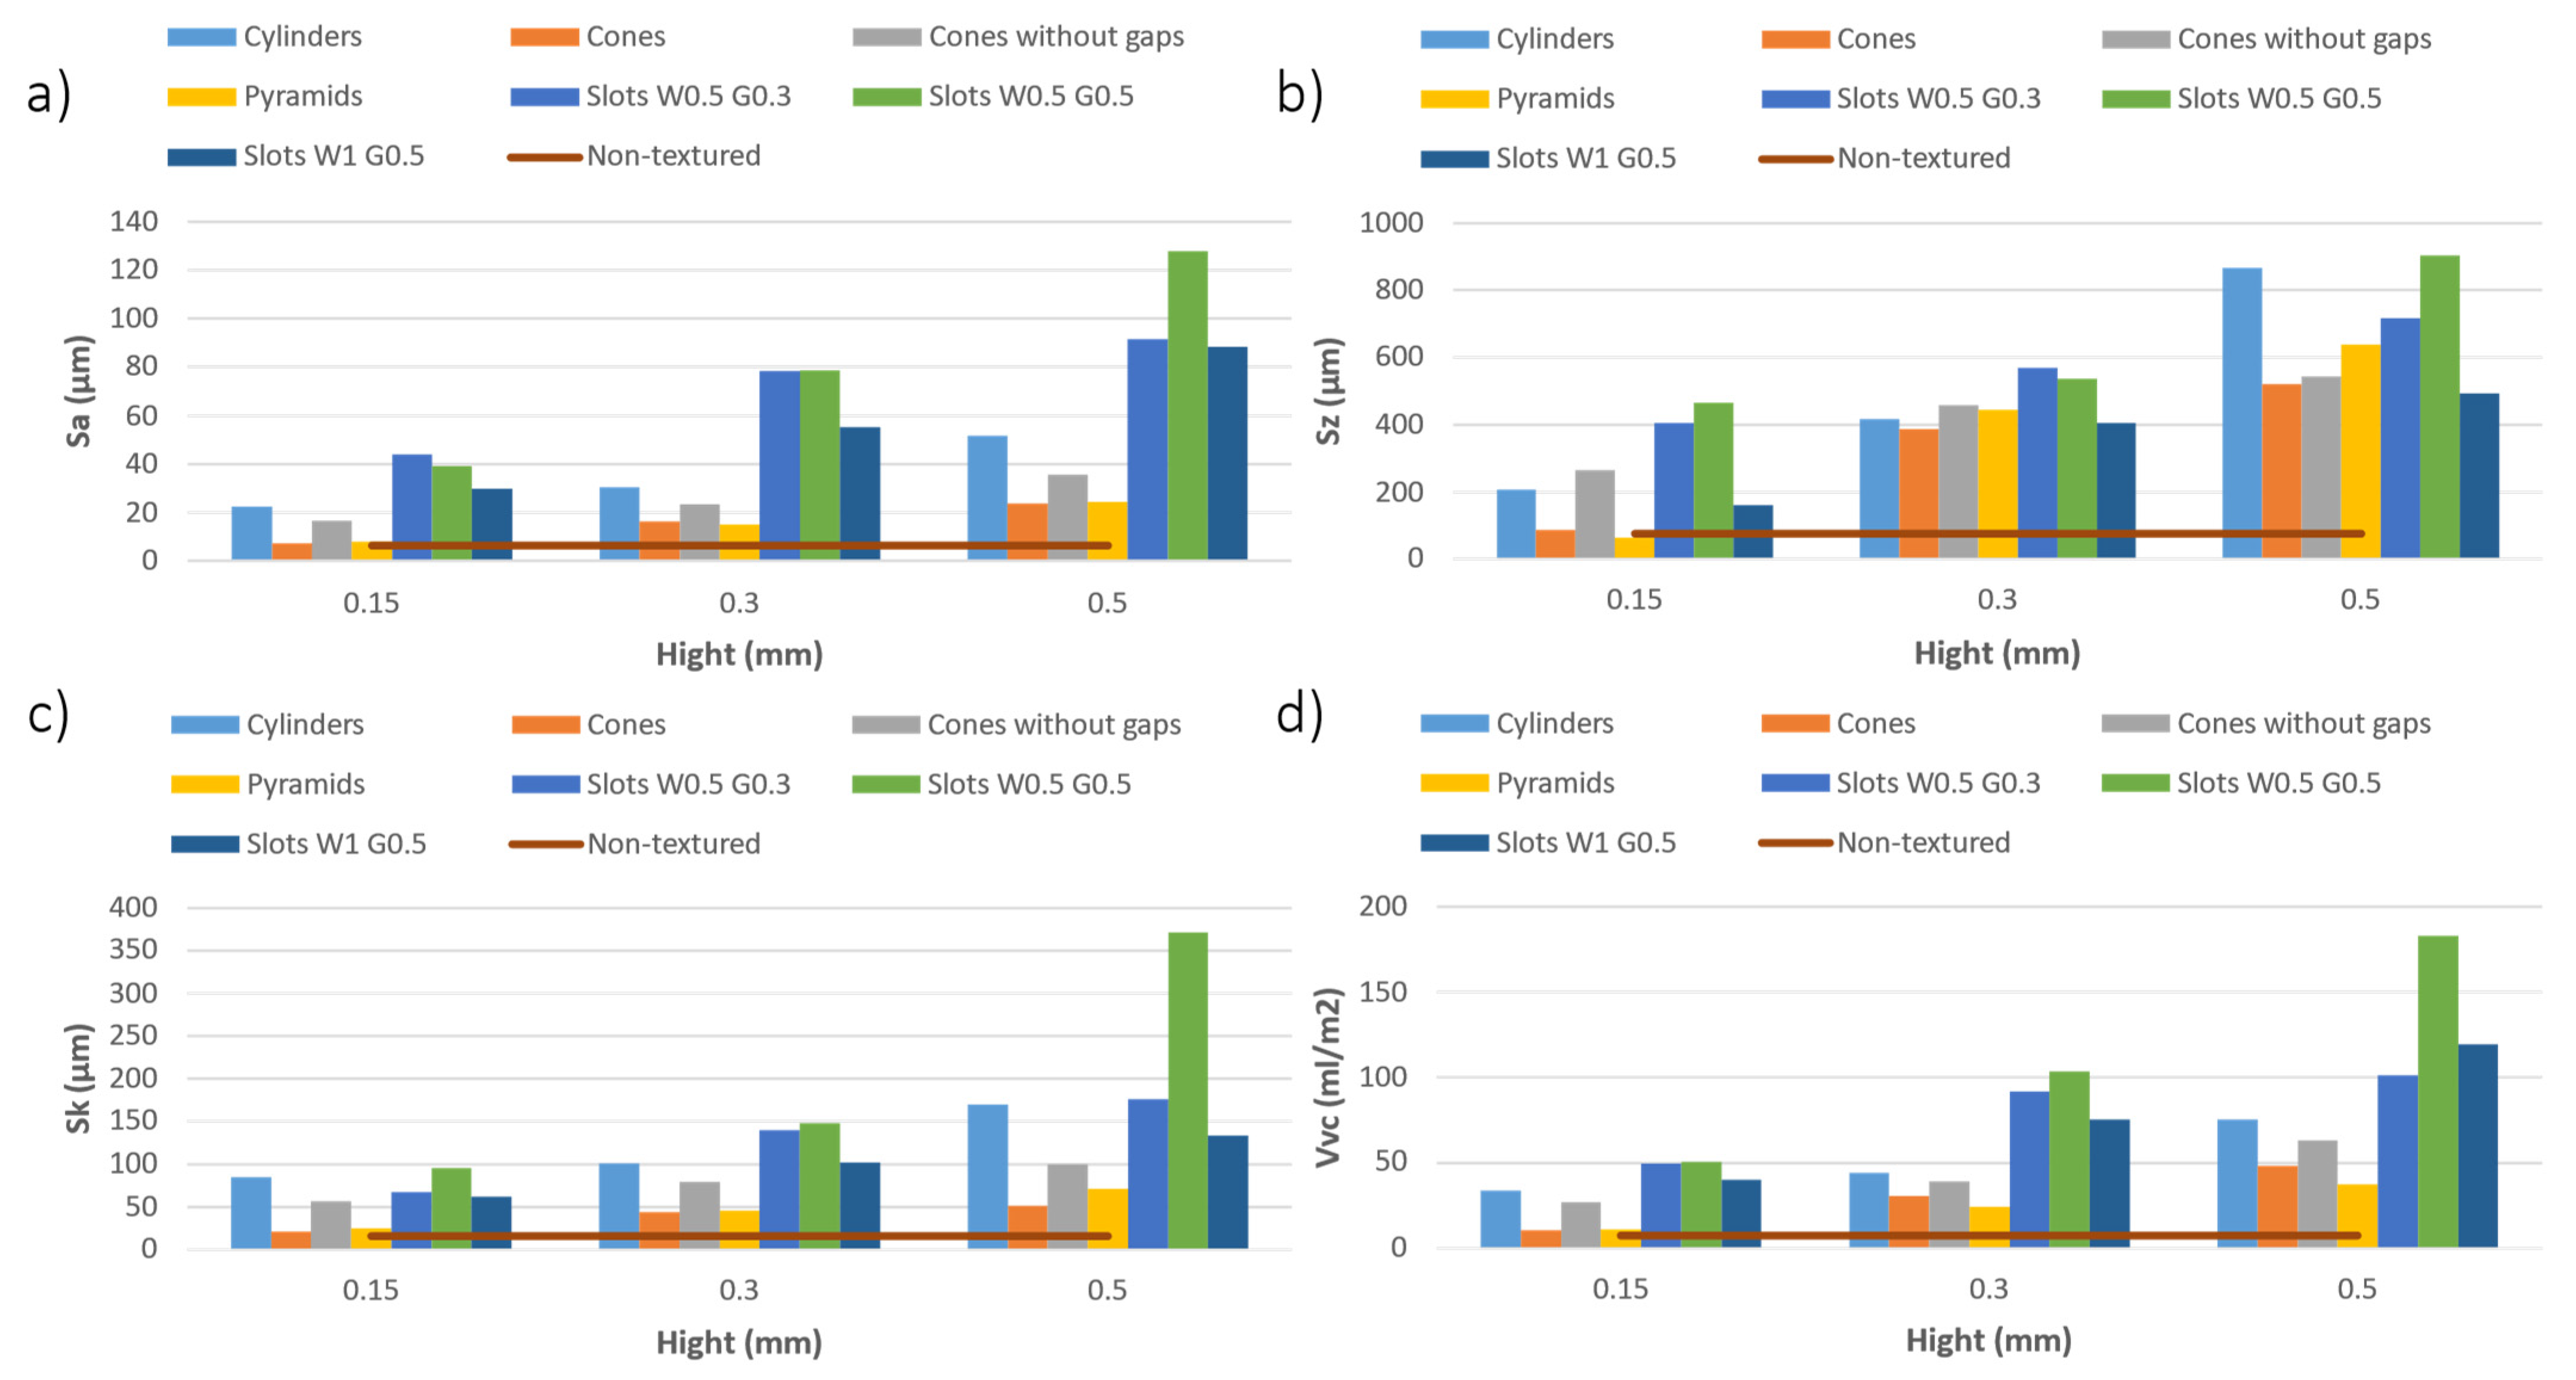
3.2. Surface Quality

The results of the surface quality obtained as a function of the type of texturing pattern are shown in Figure 10.
In studying surface roughness, it was observed that the average roughness (Sa) exhibited an increase with the height of the structures, as shown in Figure 10a. For example, in the cylinders, the Sa increased from 22.43 µm to 51.55 µm as the height increased from 0.15 mm to 0.5 mm. It is important to note that different textures have different Sa levels at the same height. For example, cones have a lower Sa (7.28 µm at 0.15 mm) than cylinders at the same height.
The maximum roughness parameter (Sz), represented in Figure 10b, also increases with height. For instance, in the specific case of cones, Sz varies from 86.94 µm to 519.89 µm with increasing height from 0.15 mm to 0.5 mm. In the generation of cylindrical textures or textures with conical shapes by means of FFF, for the same value of layer height, the surface quality depends on the slope of the generatrix of the cone. As the height of the cone increases, the slope of the cone becomes steeper, resulting in a cylindrical shape. Conversely, the lower the cone height, the lower the slope, resulting in a reduction in Sa and Sz.
Similarly, the core depth parameter (Sk) increases with height. For the W0.5 G0.5 grooves, Sk increased from 95.08 µm to 370.63 µm as the height increased from 0.15 mm to 0.5 mm. Textures have a significant effect on Sk, with grooves showing higher values compared to cylinders and cones. According to previous studies [25], a reduced Sk value indicates a more uniform surface, which can result in better lubricant distribution and reduced friction, thus improving wear resistance. In the case of an adhesive, it would also improve its distribution and therefore wettability by creating a hydrophilic surface.
A relevant study investigating the relationship between surface roughness parameters, including Sk and Vvc, and tribological behaviour is that of Chen L. et al. [26]. This study analyses how different surface morphologies affect friction and wear and shows that parameters such as Sk and Vvc have a significant effect on tribological behaviour by influencing lubricant retention and load distribution.
The core volume (Vvc) also tends to increase with height. For example, in the W0.5 G0.5 grooves, Vvc increases from 50.622 mL/m2 to 182.833 mL/m2 as the height increases from 0.15 mm to 0.5 mm. However, different textures result in different Vvc values, with grooves having the highest values compared to other textures.
The study by Molnár V. et al. [27] concluded that one of the parameters characterising the core zone is Vvc, with higher values indicate higher fluid retention capacity. They also demonstrated that high Sk values (positive) indicate surfaces with more peaks than valleys, which can improve initial bond strength due to increased contact area and adhesive penetration into the peaks. However, excessive roughness can hinder uniform adhesive distribution and lead to premature bond failure. Surfaces with low (negative) Sk values tend to have more valleys, which can increase adhesive retention and thus improve long-term adhesion due to the increased effective contact area [28].
Conversely, higher Vvc values indicate that the surface has pro-deep valleys that can hold more adhesive, improving long-term adhesion and bond life due to the greater amount of adhesive trapped in the valleys. This is particularly useful in applications where resistance to corrosion and harsh environments is required [29].
However, surfaces with moderate roughness (average values of Sk and Vvc) generally show better initial and long-term adhesion. Surfaces that are too smooth or too rough may not optimise adhesion due to lack of effective contact area or uneven adhesive distribution [30].
Surfaces without textures generally have lower values for Sa, Sz, Sk and Vvc because the addition of textures such as cylinders, cones, pyramids and grooves introduce irregularities and variations in the surface. Textures significantly increase the values of average roughness (Sa), maximum roughness (Sz), core depth (Sk) and core volume (Vvc) compared to a smooth surface without texture.

3.3. Wettability Results

In general, it has been observed that an increase in average roughness (Sa) is associated with a decrease in the lateral angle for most textures (Figure 11a,d,f,g). This phenomenon suggests that a higher average roughness may lead to a lower lateral angle, which could indicate a higher wetting capacity on rougher surfaces [31]. For example, for cones, as Sa increases from 7.28 µm (height 0.15 mm) to 23.81 µm (height 0.5 mm), the lateral angle decreases from 91.52° to 55.89°. Similarly, for pyramids, as Sa increases from 8.03 µm (height 0.15 mm) to 24.32 µm (height 0.5 mm), the side angle decreases from 81.11° to 59.67°.
The relationship between surface roughness and contact angle is not invariably linear and may vary depending on the morphology and arrangement of surface textures. Although an increase in average roughness (Sa) is generally associated with a decrease in contact angle, this behaviour is not universal for all geometries and configurations of textured surfaces. Several factors can influence this relationship: different geometric configurations of textures (such as cones, cylinders, grooves) can have diverse effects on the interaction of the surface with liquids. Studies have shown that specific textures can maintain or even increase the contact angle despite an increase in surface roughness due to capillary effects and the formation of air pockets in the surface microstructures [32,33].
The dimensions and spacing of textures play a crucial role in modulating the contact angle. Surfaces with densely packed textures or specific spacings can induce different wetting states, such as the Cassie–Baxter effect, where liquid droplets rest on a composite of air and solid surface, maintaining or increasing the contact angle even with greater roughness. In our study, observations in Figure 11b,c,e reveal divergent behaviours due to the complex interactions between textural geometries and the intrinsic properties of the materials used. These variations align with previous research, which documented that microtextured surfaces can exhibit a wide range of contact angles under different roughness conditions.
The behaviour of the frontal angle shows a similar trend to that of the lateral angle. In general, the frontal angle also tends to decrease with increasing Sa for most textures. This could indicate that a rougher surface facilitates liquid dispersion, thereby reducing the frontal contact angle [34]. For example, for cones, the frontal angle decreases from 61.24° to 42.48° as Sa increases, and for pyramids, the frontal angle decreases from 57.26° to 41.24° as Sa increases. The differences observed between the frontal and lateral angles could be due to the orientation of the layers when the filament is deposited during the texturing process.
On the other hand, the slip angle does not show as clear a relationship with Sa as the lateral and front angles. It seems that this angle depends more on the texture type than on the average roughness. For example, for cylinders, the slip angle remains constant at 75° despite the increase in Sa, and for slots (Slots W0.5 G0.3) the slip angle remains constant at 15° regardless of the changes in Sa. For most textures, the slip angle increases as the height increases. This may be more related to the Vvc parameter. By increasing the depth of the valleys, it allows a greater retention of the liquid, allowing the drop to be held at a greater slope.
In conclusion, there is a remarkable relationship between the average roughness (Sa) and the lateral and frontal wettability angles. As Sa increases, these angles tend to decrease, indicating that rougher surfaces (with higher Sa) have better wettability. However, the slip angle does not show a clear relationship with Sa, suggesting that it is more influenced by geometry and texture type than average roughness.

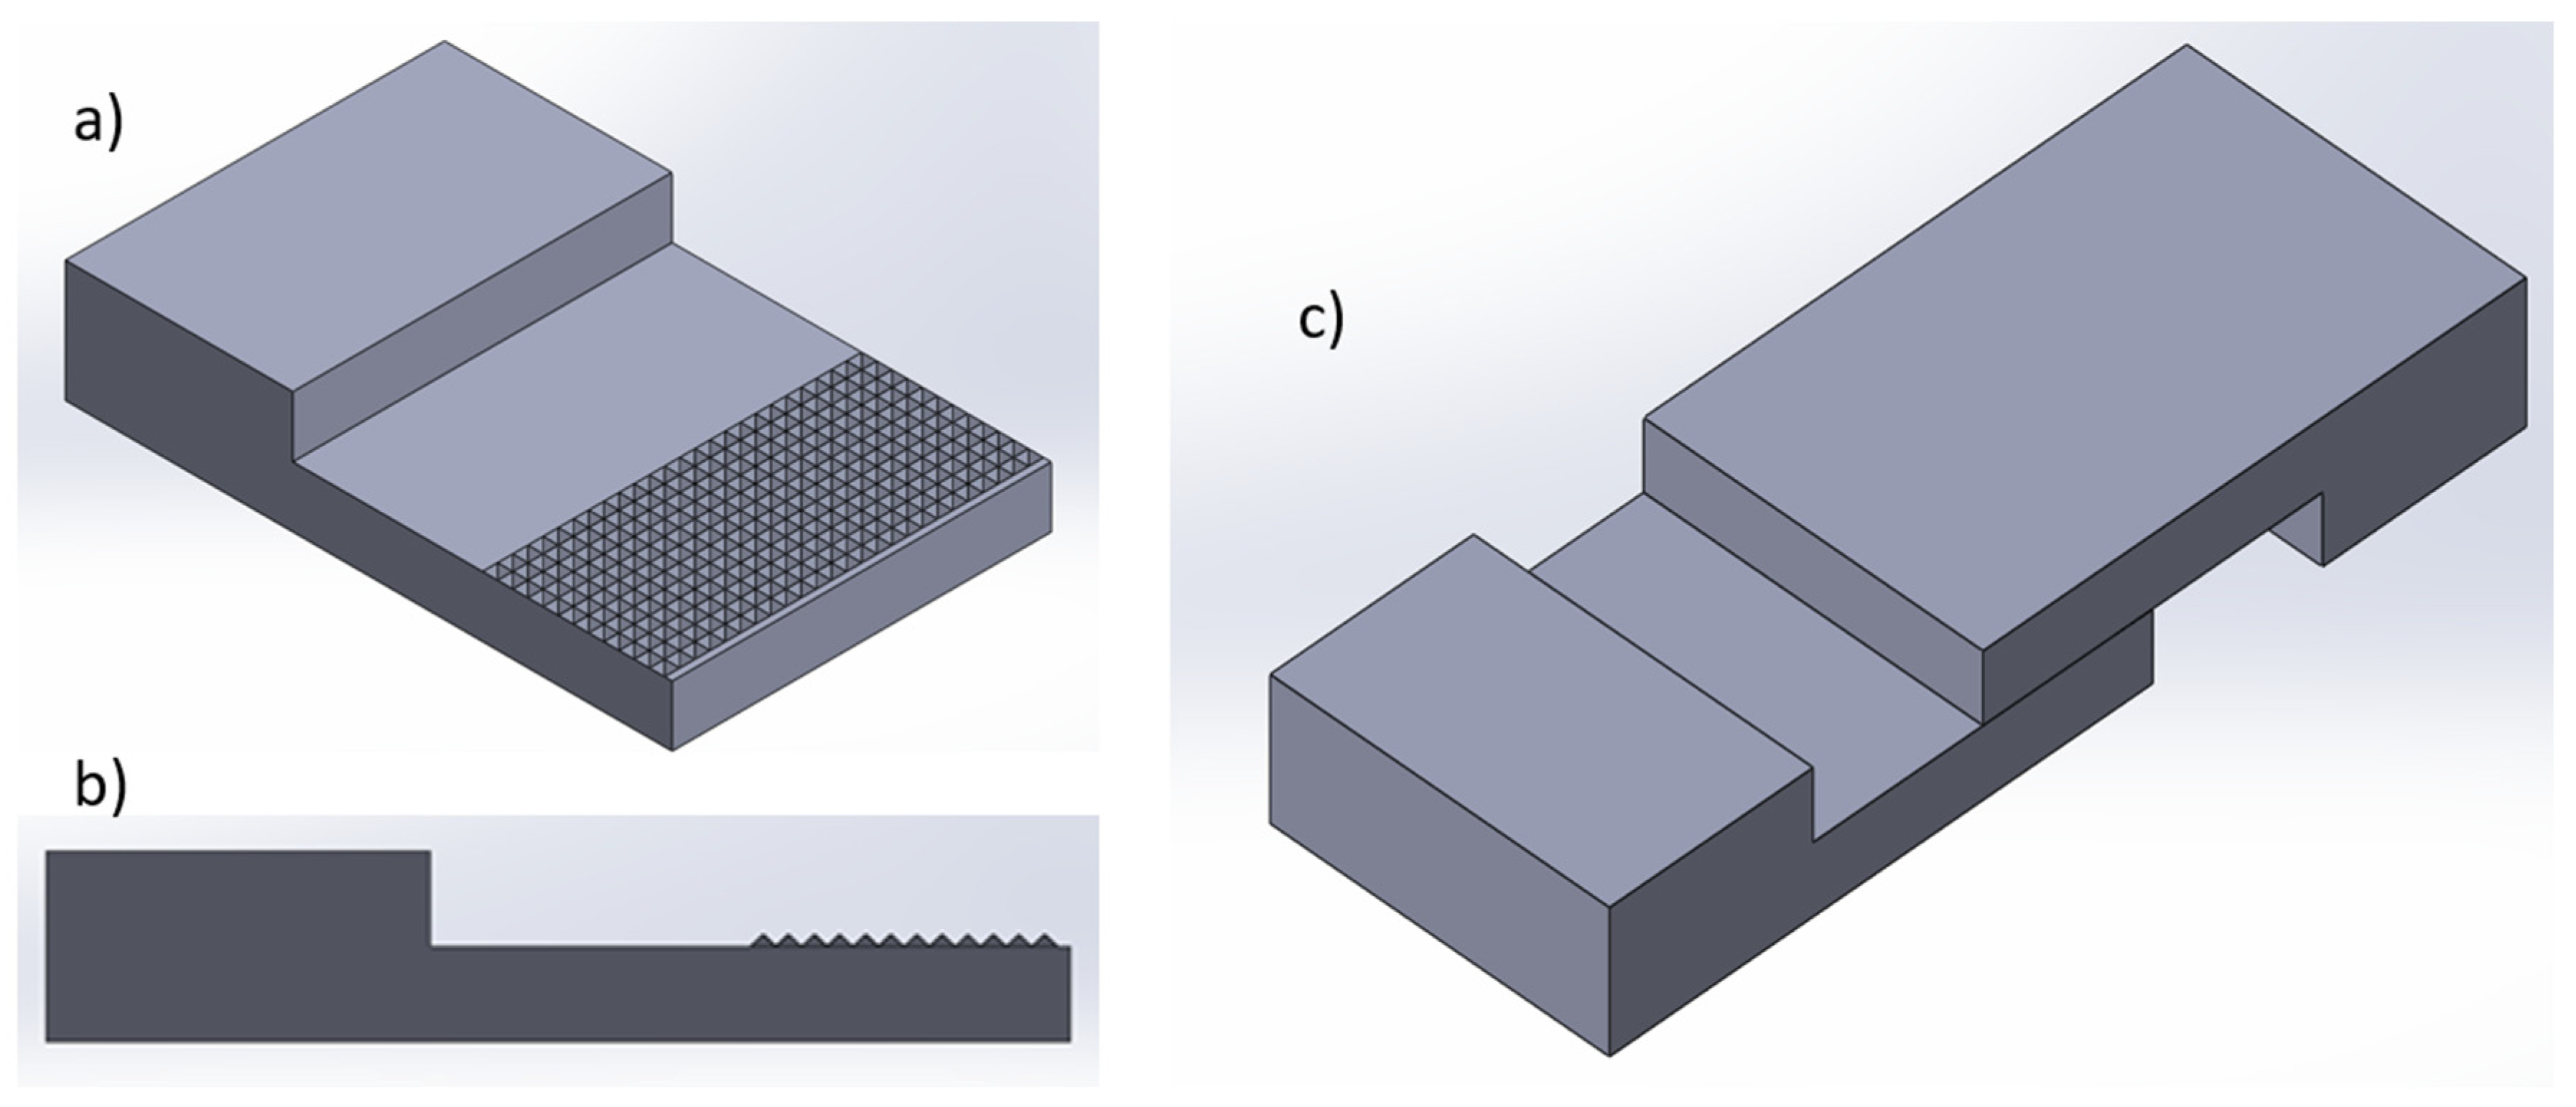
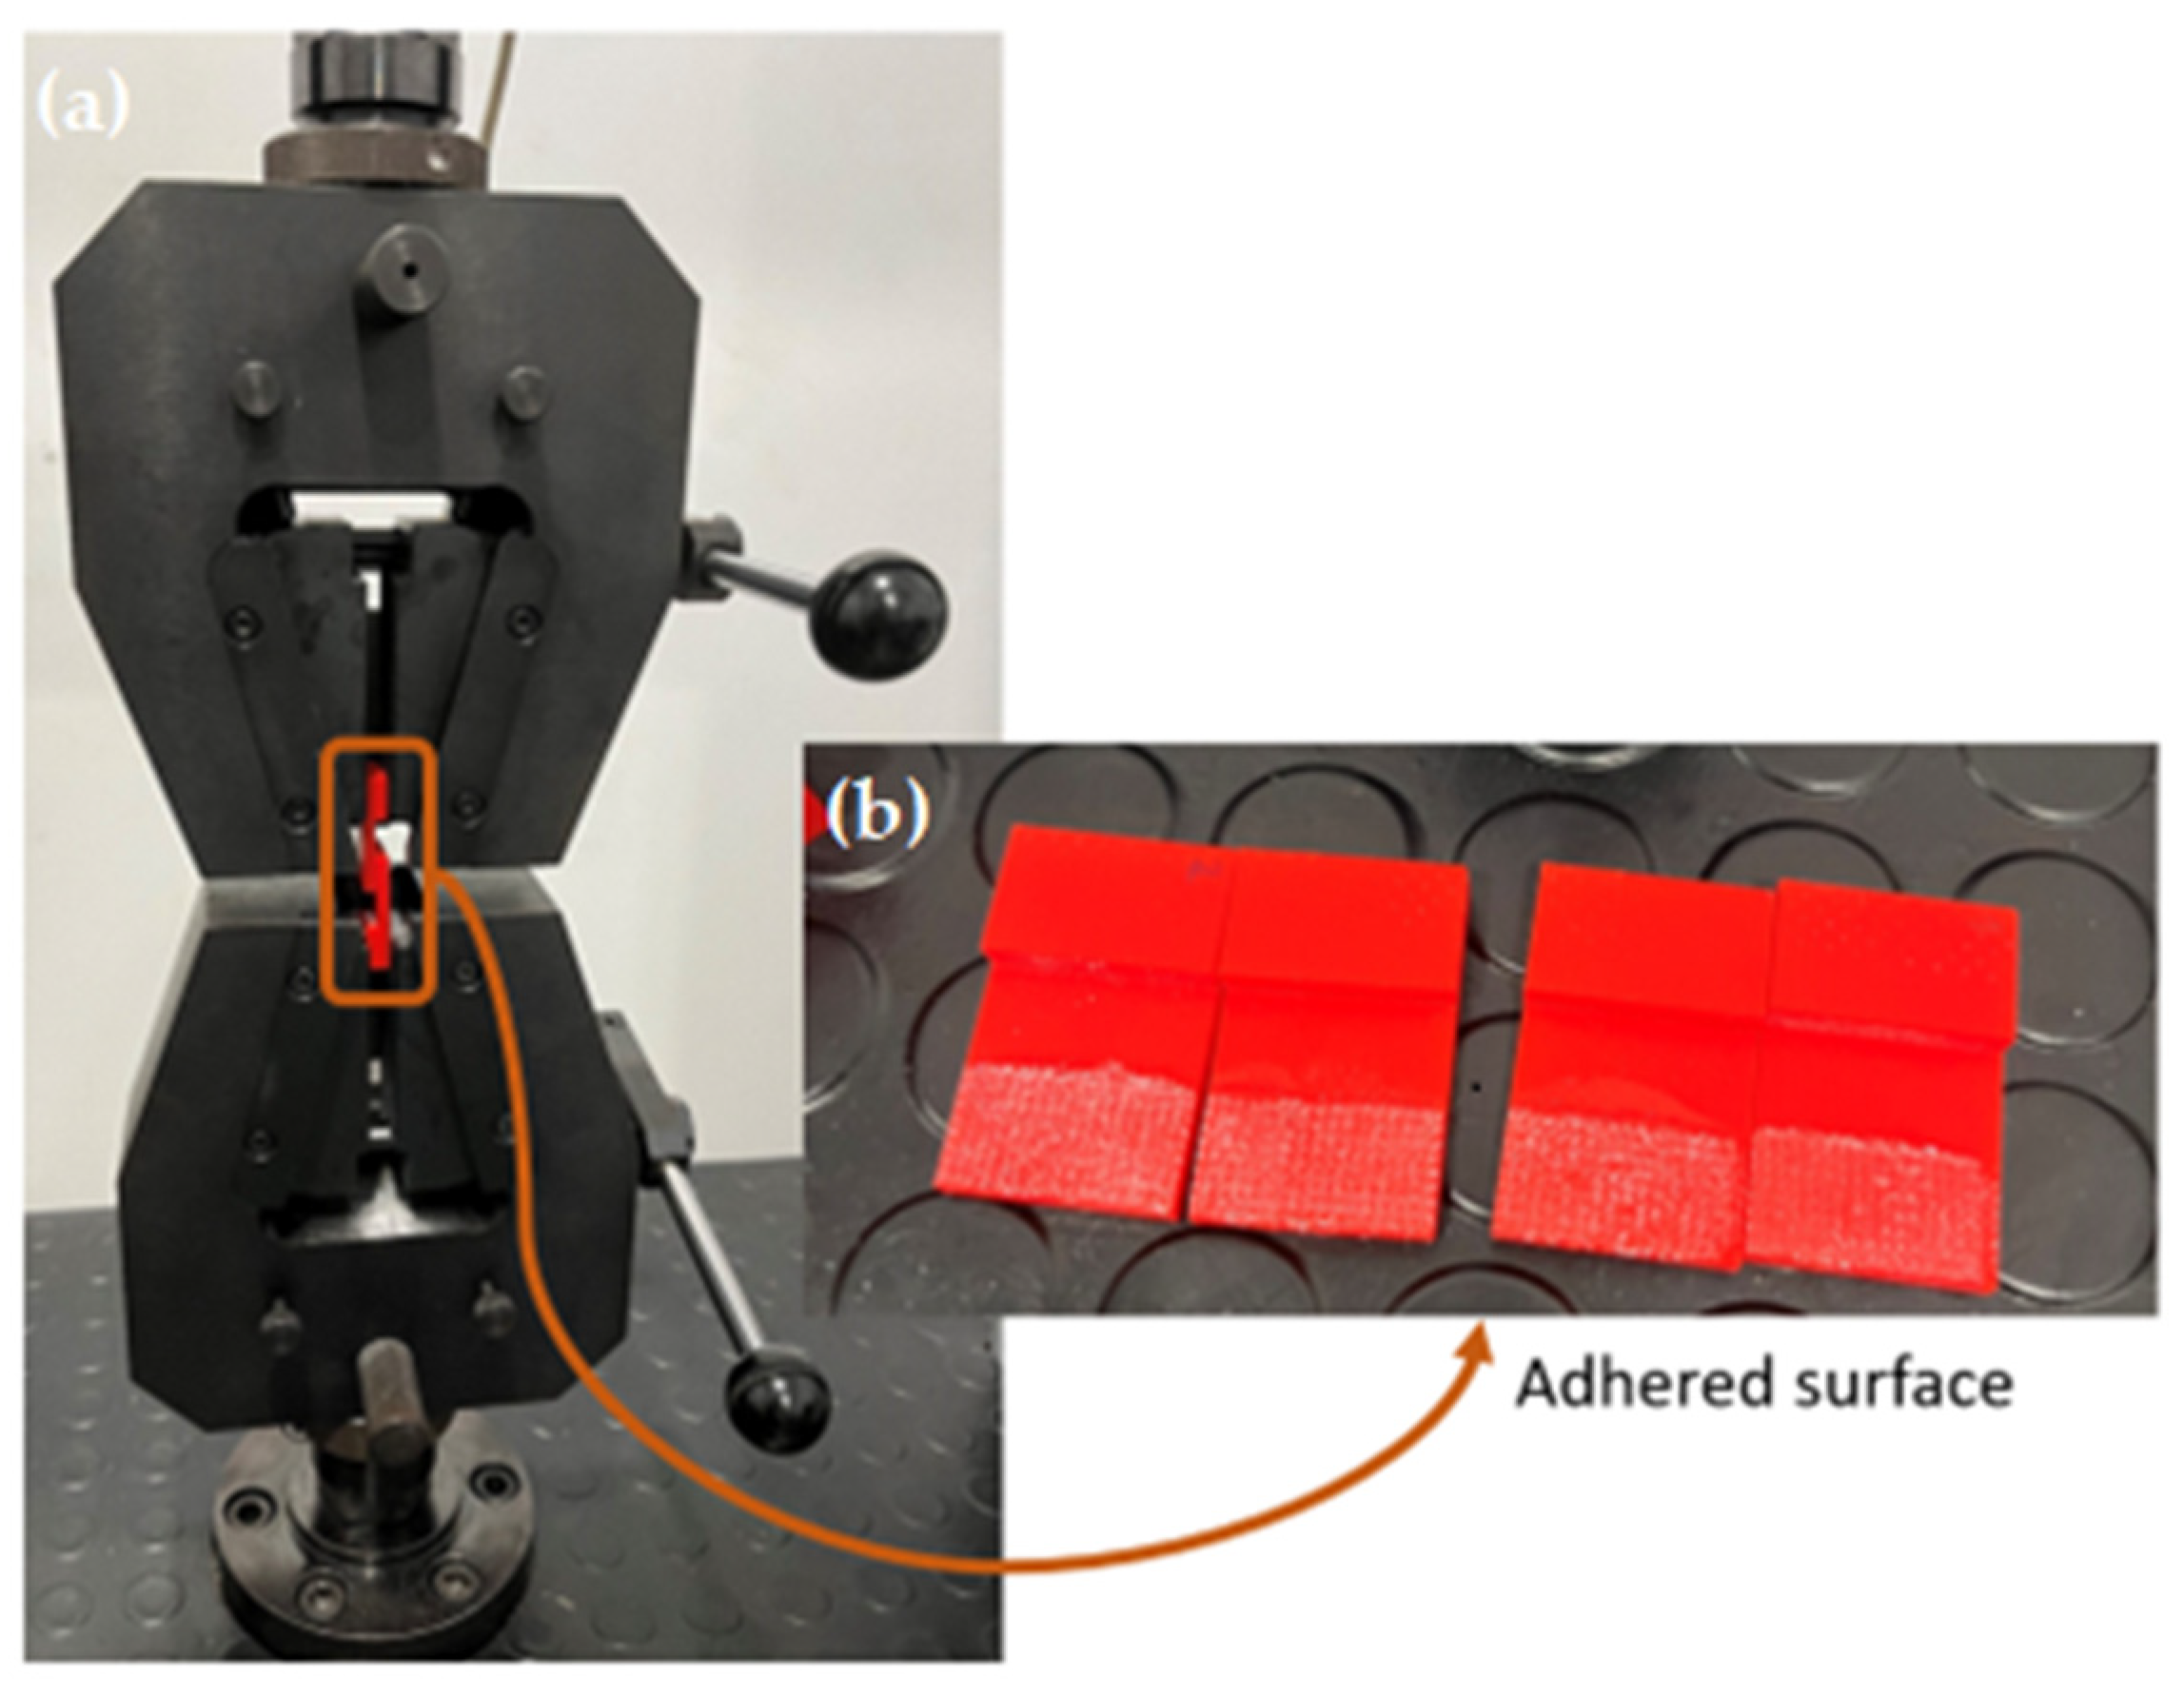
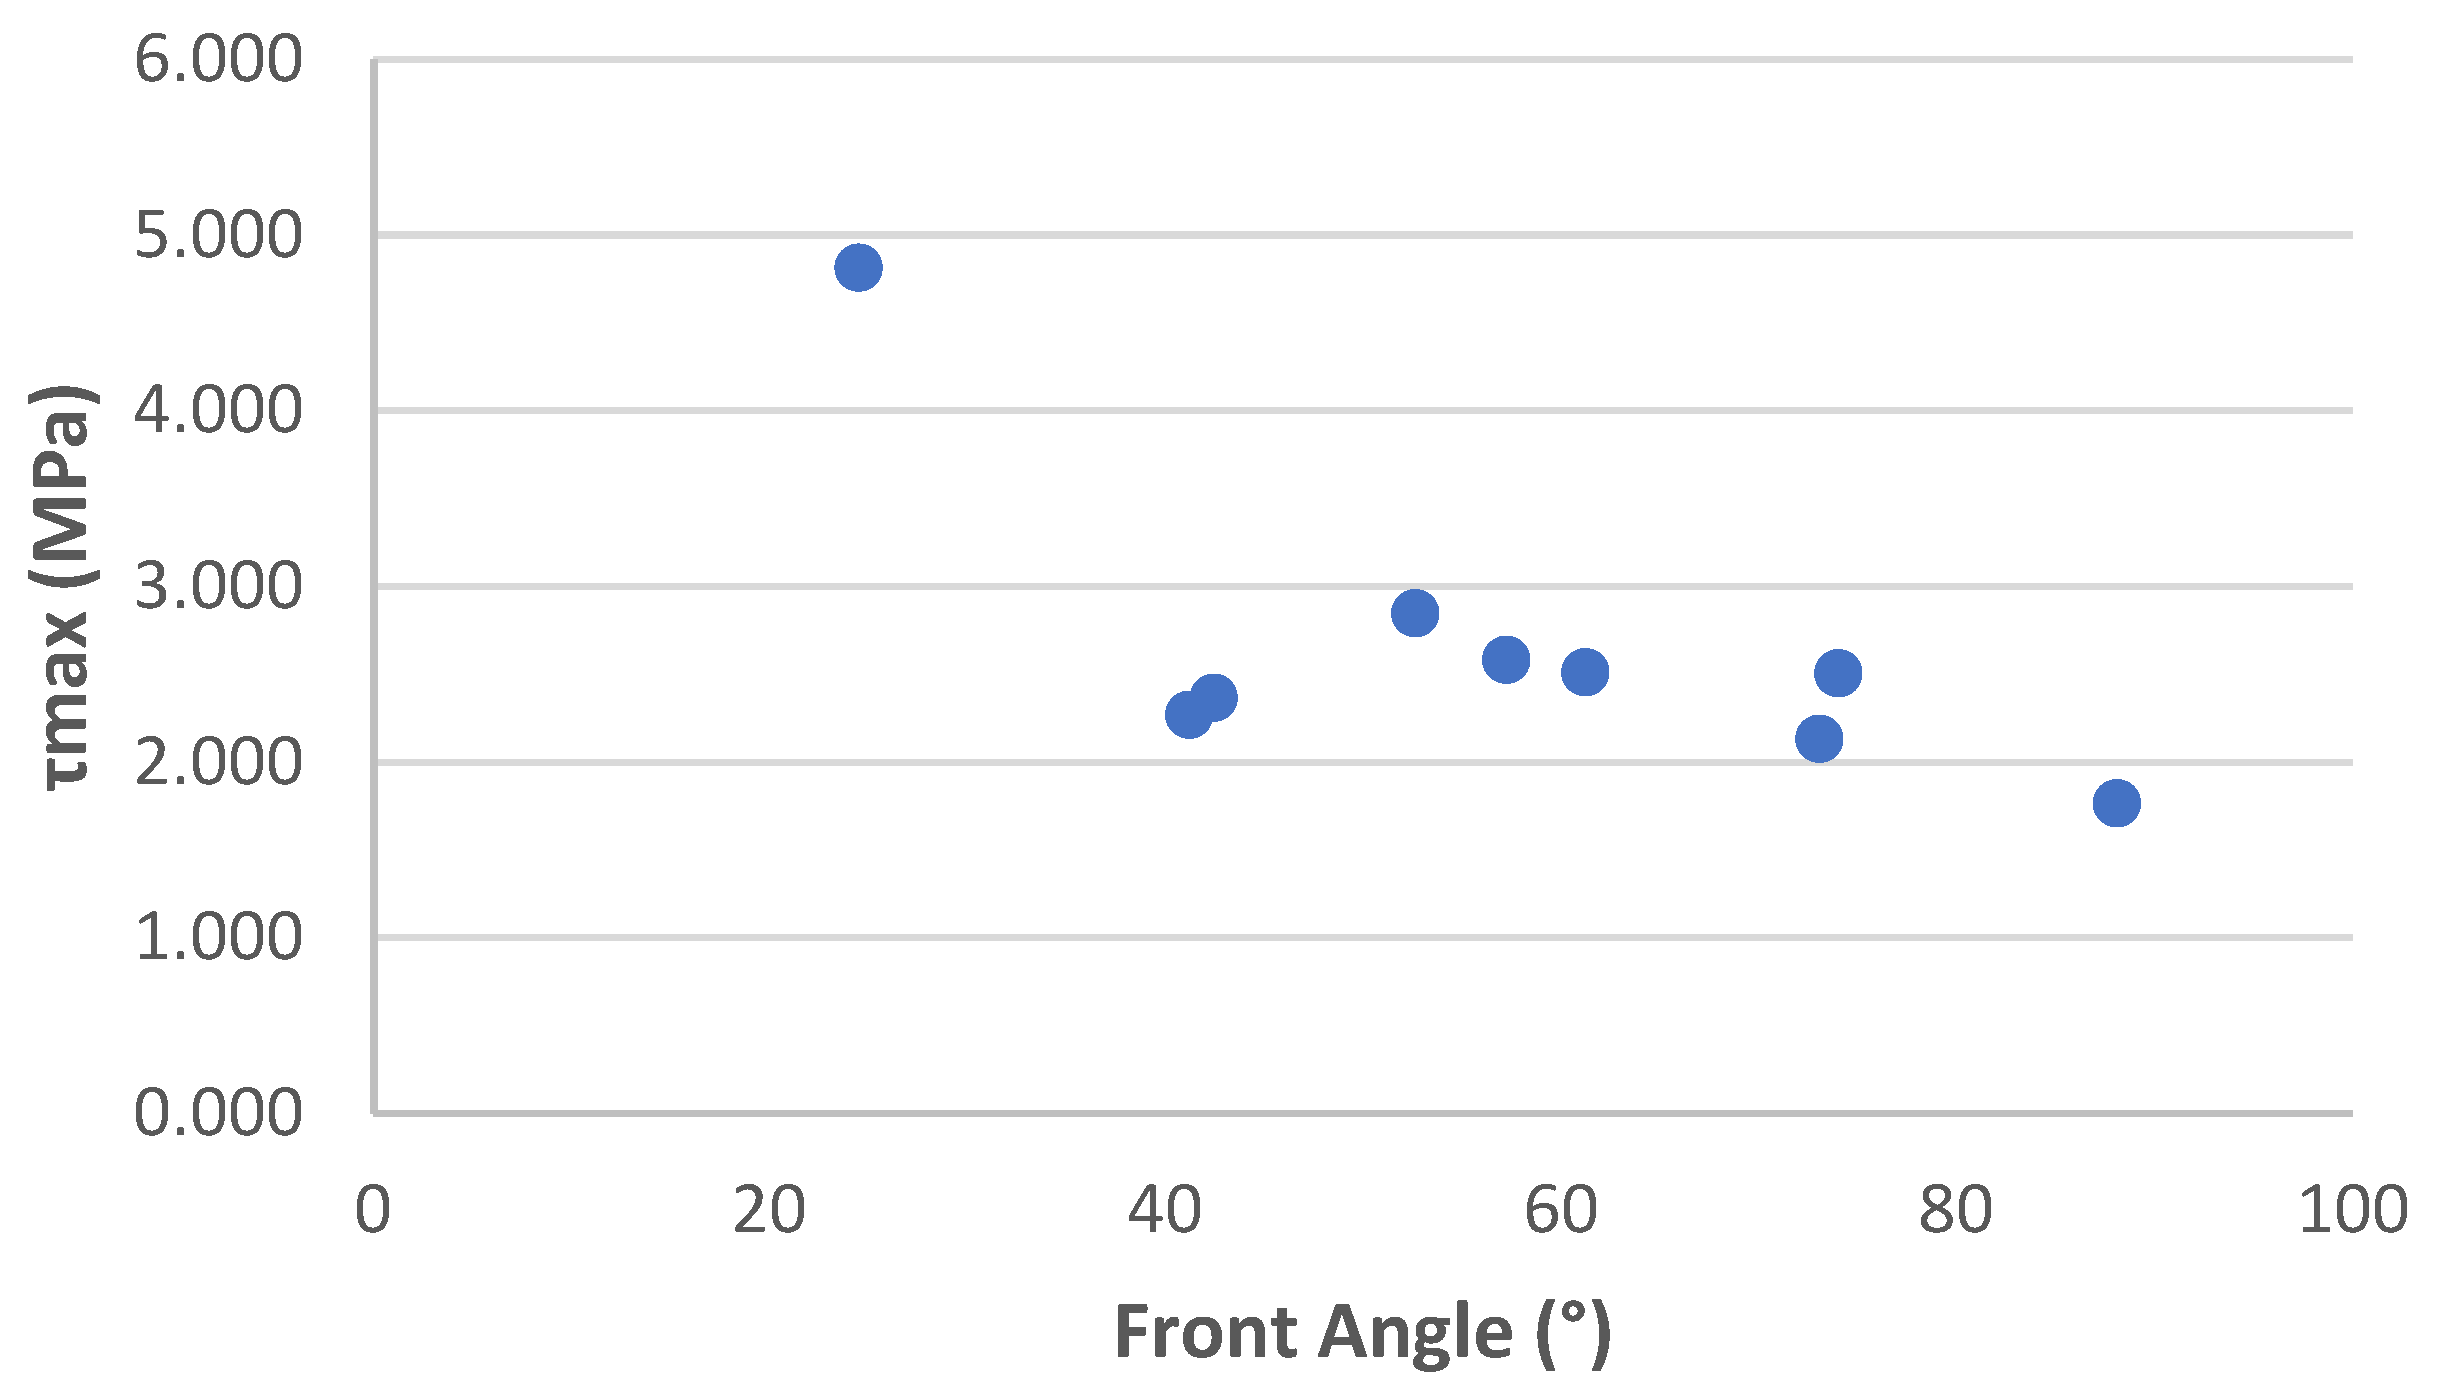
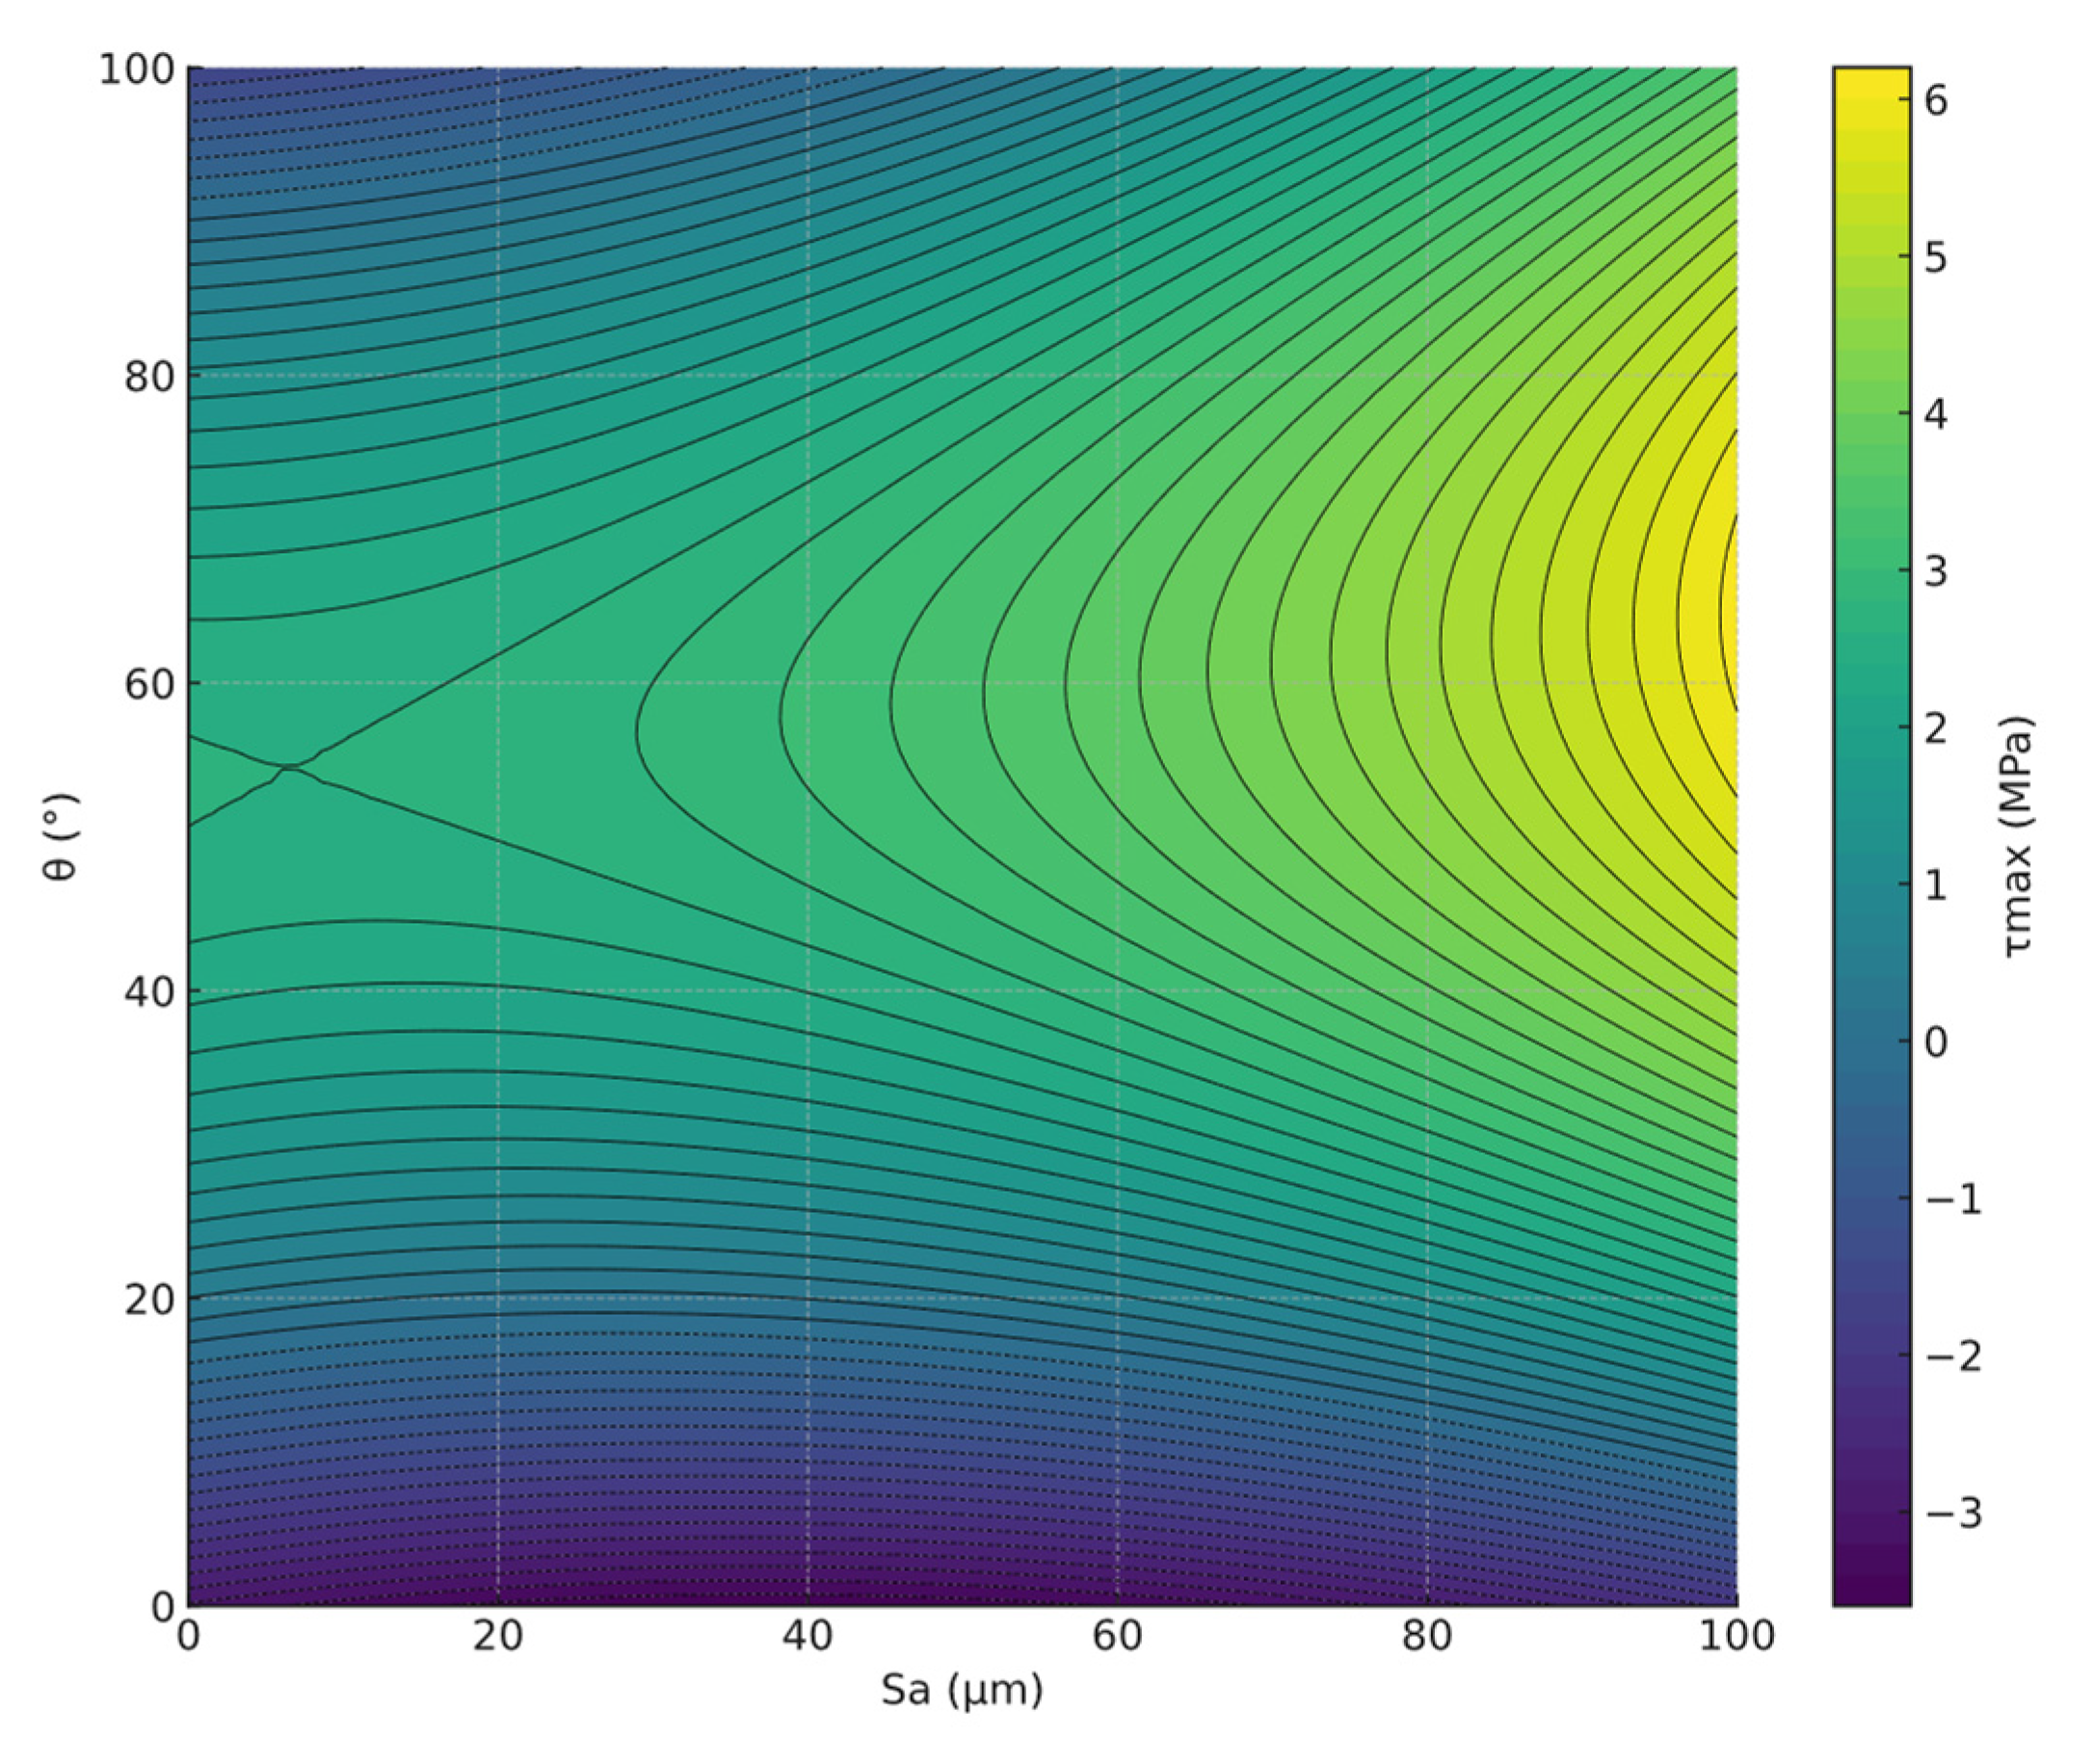
3.4. Shear Stress Results

Previous results on surface quality and wettability indicated that certain textures showed a direct correlation between the two parameters (Figure 11). These textures, which included cylinders, spaced cones, pyramids and grooves with a width and spacing of 0.5 mm, were evaluated by shear testing after the application of an adhesive. In addition, the effect of texture height was investigated, with heights of 0.15 mm and 0.5 mm, respectively.
The results of these tests, depicted in Figure 12, provide a more detailed understanding of how variations in surface texture can affect adhesive performance. The above textures were chosen for their ability to demonstrate a clear relationship between surface quality and wettability, both of which are critical factors in adhesive performance. The inclusion of different texture heights allows an evaluation of how the vertical dimension of the textures affects tensile strength, providing valuable data for optimising bonding processes in industrial applications.
Different textures such as cylinders, cones, pyramids and grooves have different characteristics that affect the maximum shear stress at bond (τmax) and the bond strength (Figure 12).
Cylinders with different heights can influence the amount of contact area and the distribution of adhesive (Figure 13a,b). At lower heights, the τmax is higher, reaching 2.13 MPa, indicating better adhesion. However, at higher heights (0.5 mm) the τmax decreases to 1.76 MPa, possibly due to uneven adhesive distribution and higher stress concentration at the texture peaks. This behaviour indicates that taller cylinders do not provide as effective adhesion, which may result in lower load-carrying capacity and higher deformation under tensile stress. This is consistent with the results of Zhang et al. [35]. Their study concludes that tensile strength decreases on textured surfaces with cylinders compared to smooth surfaces, especially at higher cylinder heights, suggesting that adhesive distribution and concentrated stresses affect adhesion and mechanical strength.
The cones (Figure 13c,d) show high τmax at both low (2.51 MPa) and higher heights (2.36 MPa). This suggests that the cones allow good adhesive distribution and effective bonding even at higher heights [36]. The ability of the cones to maintain good adhesion and load-carrying capacity at different heights makes them suitable for applications where strong adhesion and uniform distribution of adhesive is required.
The pyramids (Figure 13e,f) have a high τmax at low heights (2.58 MPa), indicating strong adhesion. However, the τmax decreases to 2.26 MPa at higher heights, which may reflect less effective adhesive distribution on higher and more complex surfaces. This suggests that although pyramids provide good adhesion at low heights, their effectiveness decreases with increasing height, limiting their use in applications requiring high and complex surfaces. This is consistent with the findings of Zhang et al. [37] in which he examines how the orientation of pyramid textures affects strength and deformation under different loading directions. His study concludes that texture and pyramid shape have a significant effect on tensile properties, with a high τmax at low heights and a decrease at higher heights.
The slots (Figure 13g,h) particularly the W0.5 G0.5 slots, have an extremely high τmax at 0.5 mm (4.813 MPa). This indicates that the slots provide an excellent contact area and adhesive distribution, resulting in very strong adhesion [38]. The ability of the grooves to withstand high loads with less deformation makes them ideal for applications where maximum adhesion and mechanical strength are required. Yan et al. [39] report in their study that the inclusion of parallel grooves in aluminium substrates significantly reduces the peak stresses at the media bond line. Both groove length and groove depth influence the stress distribution: a longer groove length initially reduces the peak stresses, but if it is too long it increases them again. A greater groove depth reduces the peak stresses at the groove position. Adhesives with a high modulus of elasticity show a greater reduction in peak stresses due to the grooves, while adhesives with a low modulus of elasticity are hardly affected by the grooves.
For the same strain rate, the applied stress varies with texture type and height, indicating differences in how textures affect adhesion and load-carrying capacity. Textures such as grooves at higher heights can withstand high stresses before deforming significantly, indicating strong adhesion and stiffness. In contrast, textures such as cylinders at higher heights can deform more for the same stress, indicating less effective adhesion and greater ductility.
The reduction in τmax with height for cylinders indicates that taller cylinders do not provide as effective adhesion, which may result in lower load-carrying capacity and greater deformation under load. In contrast, cones maintain good adhesion and load-carrying capacity at higher heights, suggesting that they are suitable for applications where strong adhesion and uniform adhesive distribution are required. Pyramids, while showing strong adhesion at low heights, show a decrease in adhesion with increasing height, which may limit their use in applications requiring high and complex surfaces. Grooves, on the other hand, exhibit extremely strong adhesion and high load-bearing capacity at higher heights, making them ideal for applications where maximum adhesion and mechanical strength are required.
Texture and height have a significant effect on the adhesion and stress–strain behaviour of bonded materials. The variation in the slope in the stress–strain curve for the different textures affects the stiffness and load-carrying capacity of the bonded material. Textures that provide better adhesion will allow higher stresses to be withstood before deformation, whereas textures that are less effective at adhesion will result in greater deformation for the same load. In specific applications, textures should be selected based on adhesion and strength requirements. Textures such as grooves may be preferable in applications requiring high strength, while textures such as cylinders may be useful in applications requiring greater ductility and energy absorption.
The different textures present varied behaviours in terms of τmax (Figure 14). For example, for cylinder textures, at lower heights (0.15 mm), the τmax is high, reaching 2.13 MPa. However, as the height increases to 0.5 mm, the τmax decreases to 1.76 MPa. In contrast, the cone textures show a high τmax at both 0.15 mm (2.51 MPa) and 0.5 mm (2.36 MPa). The pyramid textures also show a high τmax at 0.15 mm (2.581 MPa), but this decreases to 2.26 MPa as the height increases to 0.5 mm. On the other hand, the W0.5 G0.5 slot textures exhibit a significantly high τmax at 0.5 mm (4.81 MPa) and at 0.15 mm (2.50 MPa).
In general, τmax tends to decrease with increasing height for most textures. This phenomenon can be attributed to the fact that textures with more height usually have larger exposed surface areas, leading to a reduction in ultimate tensile strength due to higher stress concentrations and potential failure points [40].
In terms of the influence of material behaviour, cylinder textures demonstrated a reduction in τmax with increasing height, indicating that materials with higher cylinder textures may be less resistant to shear stress. This is particularly relevant in applications where high mechanical strength is required. Cone textures also show a decrease in τmax with increasing height, but this decrease is less pronounced compared to cylinders. Cones appear to maintain good strength at higher heights, which can be beneficial in applications where the combination of roughness and strength is important.
Similarly, pyramid textures have a high τmax at low heights, although their strength decreases with height. Consequently, pyramids may be useful in applications where a good balance between roughness and strength is required. Finally, slot textures, particularly slots W0.5 G0.5, have a very high τmax at higher heights, suggesting that slots can significantly improve the mechanical strength of the material, which can be critical in applications where high tensile strength is required.
In conclusion, both texture and texture height have a significant influence on the τmax values [41]. For cylindrical textures, increasing the height tends to reduce the τmax value while maintaining the dispersion of results obtained in various tests. In contrast, for pyramid and cone textures, the increase in height does not seem to influence the maximum shear strength values but significantly increases the result dispersion. This phenomenon may be due to the difficulty in properly filling the cavities with cyanoacrylate as the height increases, leading to greater dispersion.
For cylindrical, cone, and pyramid textures, a height of 0.15 mm appears more effective in terms of shear strength compared to a height of 0.5 mm. However, slots (slots W0.5 G0.5) benefit significantly from increased texture height to 0.5 mm, showing greater shear strength compared to a height of 0.15 mm.
At a height of 0.5 mm, slots provide the highest shear strength, whereas at a height of 0.15 mm, the untextured surface appears the most resistant. Cylinders, cones, and pyramids perform similarly at both heights, but slots stand out at greater texture height. Cylinders and cones exhibit moderate result dispersion, particularly at 0.15 mm height, with a slight decrease in dispersion at 0.5 mm, indicating greater consistency.
Pyramids show relatively low dispersion at both heights, suggesting good consistency in shear strength results. Slots (slots W0.5 G0.5) exhibit greater result dispersion at 0.5 mm compared to 0.15 mm.
The texture height significantly influences cyanoacrylate dispersion and, consequently, the variability in shear strength results. Lower textures tend to allow for more uniform adhesive distribution, resulting in less dispersion in strength values. Conversely, higher textures can create more irregular surfaces, hindering uniform cyanoacrylate distribution and increasing result dispersion. This phenomenon is clearly observed in the graph, where higher textures present greater variability in shear strength.
Finally, a relationship is shown between the τmax values obtained and the front angle wettability of the results obtained (Figure 15). An almost linear decreasing trend is observed as the wettability angle increases. This confirms previous results and indicates that different textures and texture heights influence the surface quality and wettability of the surfaces, producing hydrophilic or hydrophobic surfaces [38]. This variation in wettability affects the bond quality of the cyanoacrylate. Therefore, the ability to produce different textures in the final manufacturing process using a fused filament fabrication (FFF) process can significantly alter the mechanical behaviour of parts in adhesive bonding operations.
An increase in Sa typically indicates a rougher surface, which can increase either hydrophobicity or hydrophilicity depending on the nature of the textures present. The contact angle (θ) is a measure of wettability; a higher contact angle generally indicates a more hydrophobic surface, while a lower angle indicates greater hydrophilicity. Surfaces with higher roughness tend to exhibit increased hydrophobicity due to the presence of microcapillaries and the structure of peaks and valleys that trap air, creating a “Cassie–Baxter” effect that increases the contact angle. This effect can improve the adhesion of the cyanoacrylate and consequently increase the shear strength [16].
The improved adhesion of cyanoacrylate to rough surfaces is due to a larger effective contact area and the ability of the microstructures to retain the adhesive, thereby better distributing the applied forces and increasing mechanical resistance. This relationship between surface roughness, hydrophobicity and adhesion is critical for understanding how to optimise material performance in various applications, particularly where improved adhesive properties and mechanical strength are desired.
This relationship can be established through Equation (5) which shows the relationship between the maximum shear strength, the surface quality in terms of Sa and the face contact angle obtained with a 99% adjustment. These results have been fitted to a second-order polynomial model with factor interaction that provides good fits to texturing processes and relates wettability to roughness [42].
τmax = −3.037 − 0.02826*Sa + 0.21092*θ + 0.000375*Sa2 − 0.001967*θ2 + 0.000430*Sa*θ,
This relationship between τmax and face angle wettability is crucial for understanding how variations in surface texture can optimise or detract from material adhesion (Figure 16). The almost linear downward trend suggests that as the wettability angle increases, the quality of the bond decreases, a significant finding for industrial applications that require precise control of adhesive properties. By manipulating the surface texture characteristics through the FFF process, it is possible to design surfaces that enhance cyanoacrylate adhesion, providing a valuable tool for engineers and designers in the production of components with specific bonding properties [36].
In summary, the ability to control surface texture through FFF processes not only affects the aesthetics and functionality of parts, but also plays a critical role in the mechanical properties of adhesive bonds, which can have a significant impact on the durability and performance of final products.

4. Conclusions

Surfaces with higher average roughness (Sa) have lower contact angles, both lateral and frontal, indicating better wettability. This behaviour suggests that rougher surfaces may have a greater wetting capacity.
However, the slip angle does not show a clear relationship with Sa and is more dependent on the type of texture and its geometry. Textures such as grooves and pyramids have higher values of core volume (Vvc) and core depth (Sk), suggesting better adhesive retention and consequently improved long-term adhesion.
Surfaces with moderate values of Sk and Vvc generally exhibit better initial and long-term adhesion, whereas surfaces that are either too smooth or too rough may not optimise adhesion due to a lack of effective contact area or the uneven distribution of adhesive.
Cylindrical textures display a high τmax (2.13 ± 0.40 MPa) at lower heights (0.15 mm), but this decreases (1.76 ± 0.51 MPa) at higher heights (0.5 mm), indicating a reduction in the effective adhesive distribution and an increase in stress concentrations. Conversely, both conical and pyramidal textures demonstrate an increase in height that has a minimal impact on the stress value, with τmax of 2.51 ± 0.08 MPa and 2.36 ± 0.40 MPa for conical, and 2.58 ± 0.21 MPa and 2.26 ± 0.33 MPa for pyramidal at low and higher heights, respectively. Moreover, the mean results for both heights fall within the dispersion range. The slots (slots W0.5 G0.5) exhibit a notably high τmax at a height of 0.5 mm (4.81 ± 0.18 MPa), indicative of an optimal contact area and adhesive distribution, resulting in a robust adhesion.
Concerning the dispersion of results, a reduction is observed at heights of 0.15 mm for cone and pyramid textures. This reduction suggests a higher consistency at lower heights. However, it is noteworthy that this dispersion of results may be due to poor expansion of the cyanoacrylate adhesive, which affects the uniformity of adhesion and stress distribution on the textured surfaces.
There is an almost direct decreasing linear trend between the τmax values and the frontal wettability angle, suggesting that as the wettability angle increases, the bond quality decreases.
In conclusion, this study addresses the creation of textured patterns during the filament fabrication (FFF) process and fills a significant gap in the current literature, which to date has focused on the texturing of metallic materials using technologies such as lasers.
This work provides an in-depth understanding of how surface texturing can enhance the functional properties of components produced by FFF, exploring the relationship between surface quality, wettability and shear strength, areas that have not been sufficiently investigated.
It also evaluates different texture types and heights, providing valuable data on how the vertical dimension of these textures affects tensile strength, with the aim of optimising bonding processes in industrial applications.

Author Contributions

Conceptualisation, F.B.-G. and C.B.G.; methodology, F.B.-G., C.B.G. and S.M.-B.; software, F.B.-G. and C.B.G.; validation, S.M.-B., J.A.L.-F. and F.J.T.-V.; investigation, F.B.-G., C.B.G. and S.M.-B.; data curation, F.B.-G.; writing—original draft preparation, F.B.-G., C.B.G. and S.M.-B.; writing—review and editing, J.A.L.-F. and F.J.T.-V.; funding acquisition, F.B.-G. All authors have read and agreed to the published version of the manuscript.

Funding

This research received no external funding.

Institutional Review Board Statement

Not applicable.

Informed Consent Statement

Not applicable.

Data Availability Statement

Data are contained within this article.

Acknowledgments

The authors are grateful to the University of Malaga for the development of the work through a project of young researchers “FAAVI, JA.B1-41-Proyectos plan propio Junta de Andalucía 08.09.20.33.31” that has allowed the development of these results.

Conflicts of Interest

The authors declare no conflicts of interest.

Abbreviations

FFFFused filament fabrication
PLAPolylactic acid
ABSAcrylonitrile butadiene styrene
SaAverage height of selected area
SzMaximum height of selected area
SkCore roughness depth, height of the core material
VvcCore void volume of the surface
HHeight
GGap
WWidth
τmaxMaximum shear stress at bond

References

  1. Singh, S.; Singh, G.; Prakash, C.; Ramakrishna, S. Current Status and Future Directions of Fused Filament Fabrication. J. Manuf. Process. 2020, 55, 288–306. [Google Scholar] [CrossRef]
  2. Mazzei Capote, G.A.; Rudolph, N.M.; Osswald, P.V.; Osswald, T.A. Failure Surface Development for ABS Fused Filament Fabrication Parts. Addit. Manuf. 2019, 28, 169–175. [Google Scholar] [CrossRef]
  3. Abel, J.; Scheithauer, U.; Janics, T.; Hampel, S.; Cano, S.; Müller-Köhn, A.; Günther, A.; Kukla, C.; Moritz, T. Fused Filament Fabrication (FFF) of Metal-Ceramic Components. J. Vis. Exp. 2019, 143, e57693. [Google Scholar] [CrossRef]
  4. Gao, X.; Qi, S.; Kuang, X.; Su, Y.; Li, J.; Wang, D. Fused Filament Fabrication of Polymer Materials: A Review of Interlayer Bond. Addit. Manuf. 2021, 37, 101658. [Google Scholar] [CrossRef]
  5. Guerra Silva, R.; Torres, M.J.; Zahr Viñuela, J.; Zamora, A.G. Manufacturing and Characterization of 3D Miniature Polymer Lattice Structures Using Fused Filament Fabrication. Polymers 2021, 13, 635. [Google Scholar] [CrossRef] [PubMed]
  6. Fico, D.; Rizzo, D.; Casciaro, R.; Esposito Corcione, C. A Review of Polymer-Based Materials for Fused Filament Fabrication (FFF): Focus on Sustainability and Recycled Materials. Polymers 2022, 14, 465. [Google Scholar] [CrossRef] [PubMed]
  7. Molino Alvarez, E.; Quintana González, S.A.; Lopez Taborda, L.L.; Niebles Nuñez, E.E. Experimental Study of Adhesive Joints with Mechanical Interlocking of Acrylonitrile Butadiene Styrene (ABS) Parts Fabricated for Fused Filament (FFF). Rapid Prototyp. J. 2023, 29, 1984–2000. [Google Scholar] [CrossRef]
  8. Frascio, M.; Mandolfino, C.; Moroni, F.; Jilich, M.; Lagazzo, A.; Pizzorni, M.; Bergonzi, L.; Morano, C.; Alfano, M.; Avalle, M. Appraisal of Surface Preparation in Adhesive Bonding of Additive Manufactured Substrates. Int. J. Adhes. Adhes. 2021, 106, 102802. [Google Scholar] [CrossRef]
  9. Mashayekhi, F.; Bardon, J.; Westermann, S.; Addiego, F. Adhesion Optimization between Incompatible Polymers through Interfacial Engineering. Polymers 2021, 13, 4273. [Google Scholar] [CrossRef]
  10. Nagam, V.B.; Narayanan, V. Effect of Process Parameters on Mechanical Properties and Wettability of Polylactic Acid by Fused Filament Fabrication Process. Int. J. Mater. Res. 2023, 114, 1088–1100. [Google Scholar] [CrossRef]
  11. Lee, K.-M.; Park, H.; Kim, J.; Chun, D.-M. Fabrication of a Superhydrophobic Surface Using a Fused Deposition Modeling (FDM) 3D Printer with Poly Lactic Acid (PLA) Filament and Dip Coating with Silica Nanoparticles. Appl. Surf. Sci. 2019, 467–468, 979–991. [Google Scholar] [CrossRef]
  12. Shimada, K.; Hirai, T.; Mizutani, M.; Kuriyagawa, T. Unidirectional Wetting Surfaces Fabricated by Ultrasonic-Assisted Cutting. Int. J. Autom. Technol. 2019, 13, 191–198. [Google Scholar] [CrossRef]
  13. Edachery, V.; Shashank, R.; Kailas, S.V. Influence of Surface Texture Directionality and Roughness on Wettability, Sliding Angle, Contact Angle Hysteresis, and Lubricant Entrapment Capability. Tribol. Int. 2021, 158, 106932. [Google Scholar] [CrossRef]
  14. Sung, J.; Lee, H.M.; Yoon, G.H.; Bae, S.; So, H. One-Step Fabrication of Superhydrophobic Surfaces with Wettability Gradient Using Three-Dimensional Printing. Int. J. Precis. Eng. Manuf.-Green Technol. 2023, 10, 85–96. [Google Scholar] [CrossRef]
  15. Sagbas, B.; Durakbasa, N.M. Profile and Areal Surface Characterization of Additive Manufacturing Polymer and Metal Parts. In Proceedings of the 12th International Conference on Measurement and Quality Control-Cyber Physical Issue: IMEKO TC 14 2019, Belgrade, Serbia, 4–7 June 2019; Springer: Berlin/Heidelberg, Germany, 2019; pp. 240–246. [Google Scholar]
  16. Gao, H.; Ma, B.; Singh, R.P.; Yang, H. Areal Surface Roughness of AZ31B Magnesium Alloy Processed by Dry Face Turning: An Experimental Framework Combined with Regression Analysis. Materials 2020, 13, 2303. [Google Scholar] [CrossRef] [PubMed]
  17. Duo, Y.; Jinyuan, T.; Fujia, X.; Wei, Z. Surface Roughness Characterization and Inversion of Ultrasonic Grinding Parameters Based on Support Vector Machine. J. Tribol. 2022, 144, 094501–094507. [Google Scholar] [CrossRef]
  18. Maros, Z.; Felhő, C.; Vass, Z.; Maros, M.B. Application of 2D-3D Surface Geometrical Features in Tribological Analysis of Ceramics and Ceramic Layers. Mater. Sci. Forum 2015, 812, 435–440. [Google Scholar] [CrossRef]
  19. Sedlaček, M.; Gregorčič, P.; Podgornik, B. Use of the Roughness Parameters Ssk and Sku to Control Friction—A Method for Designing Surface Texturing. Tribol. Trans. 2017, 60, 260–266. [Google Scholar] [CrossRef]
  20. Souza, A.M.; Ferreira, R.; Barragán, G.; Nuñez, J.G.; Mariani, F.E.; da Silva, E.J.; Coelho, R.T. Effects of Laser Polishing on Surface Characteristics and Wettability of Directed Energy-Deposited 316L Stainless Steel. J. Mater. Eng. Perform. 2021, 30, 6752–6765. [Google Scholar] [CrossRef]
  21. Feng, Z.; Zhao, H.; Tan, C.; Zhu, B.; Xia, F.; Wang, Q.; Chen, B.; Song, X. Effect of Laser Texturing on the Surface Characteristics and Bonding Property of 30CrMnSiA Steel Adhesive Joints. J. Manuf. Process. 2019, 47, 219–228. [Google Scholar] [CrossRef]
  22. Dwivedi, S.; Dixit, A.R.; Das, A.K.; Srivastava, A.K. Time-Dependent Wetting Behavior of the Micro-Textured Stainless Steel 316L Using the Mechanical Indentation Method. Proc. Inst. Mech. Eng. Part E J. Process. Mech. Eng. 2023, 144, 094501–094507. [Google Scholar] [CrossRef]
  23. Tofil, S.; Kurp, P.; Manikandan, M. Surface Laser Micropatterning of Polyethylene (PE) to Increase the Shearing Strength of Adhesive Joints. Lubricants 2023, 11, 368. [Google Scholar] [CrossRef]
  24. Abd El Wahab, S.; El-Sharkawy, Z. Effect of Different Surface Treatments on Cone Beam Computed Tomography Image and Push Out Bond Strength of Conventional and Reinforced Fiber Posts. Al-Azhar Dent. J. Girls 2017, 4, 79–94. [Google Scholar] [CrossRef]
  25. Yu, H.; Ju, J.; Yang, T.; Wang, C.; Zhang, T.; Peng, P.; Feng, T.; Ding, C.; Kang, M.; Wang, J. Experimental and Finite Element Simulation Studies of the Bio-Tribological Behavior of L-PBF Ti-6Al-4V Alloys with Various Surface Roughness. Tribol. Int. 2024, 194, 109514. [Google Scholar] [CrossRef]
  26. Chen, L.; Liu, Z.; Wang, X.; Wang, Q.; Liang, X. Effects of Surface Roughness Parameters on Tribological Performance for Micro-Textured Eutectic Aluminum–Silicon Alloy. J. Tribol. 2020, 142, 021702. [Google Scholar] [CrossRef]
  27. Molnár, V.; Sztankovics, I. Analysis of Roughness Parameters Determining Tribological Properties in Hard Turned Surfaces. Hung. J. Ind. Chem. 2021, 49, 77–84. [Google Scholar] [CrossRef]
  28. Perez, F.; Bissonnette, B.; Courard, L.; Morency, M. Correlation between the Roughness of the Substrate Surface and the Debonding Risk. In Concrete Repair, Rehabilitation and Retrofitting II; CRC Press: Boca Raton, FL, USA, 2008; pp. 347–348. [Google Scholar]
  29. van Dam, J.P.B.; Abrahami, S.T.; Yilmaz, A.; Gonzalez-Garcia, Y.; Terryn, H.; Mol, J.M.C. Effect of Surface Roughness and Chemistry on the Adhesion and Durability of a Steel-Epoxy Adhesive Interface. Int. J. Adhes. Adhes. 2020, 96, 102450. [Google Scholar] [CrossRef]
  30. Tan, A.W.-Y.; Sun, W.; Bhowmik, A.; Lek, J.Y.; Song, X.; Zhai, W.; Zheng, H.; Li, F.; Marinescu, I.; Dong, Z.; et al. Effect of Substrate Surface Roughness on Microstructure and Mechanical Properties of Cold-Sprayed Ti6Al4V Coatings on Ti6Al4V Substrates. J. Therm. Spray Technol. 2019, 28, 1959–1973. [Google Scholar] [CrossRef]
  31. Wang, J.; Wu, Y.; Cao, Y.; Li, G.; Liao, Y. Influence of Surface Roughness on Contact Angle Hysteresis and Spreading Work. Colloid Polym. Sci. 2020, 298, 1107–1112. [Google Scholar] [CrossRef]
  32. Nosonovsky, M.; Bhushan, B. Multiscale Effects and Capillary Interactions in Functional Biomimetic Surfaces for Energy Conversion and Green Engineering. Philos. Trans. R. Soc. A Math. Phys. Eng. Sci. 2009, 367, 1511–1539. [Google Scholar] [CrossRef] [PubMed]
  33. Lafuma, A.; Quéré, D. Superhydrophobic States. Nat. Mater. 2003, 2, 457–460. [Google Scholar] [CrossRef] [PubMed]
  34. AlRatrout, A.; Blunt, M.J.; Bijeljic, B. Wettability in Complex Porous Materials, the Mixed-Wet State, and Its Relationship to Surface Roughness. Proc. Natl. Acad. Sci. USA 2018, 115, 8901–8906. [Google Scholar] [CrossRef] [PubMed]
  35. Zhang, Y.; Wang, X.; Li, H.; Wang, B. Adhesive Behavior of Micro/Nano-Textured Surfaces. Appl. Surf. Sci. 2015, 329, 174–183. [Google Scholar] [CrossRef]
  36. Liao, L.; Huang, C.; Sawa, T. Effect of Adhesive Thickness, Adhesive Type and Scarf Angle on the Mechanical Properties of Scarf Adhesive Joints. Int. J. Solids Struct. 2013, 50, 4333–4340. [Google Scholar] [CrossRef]
  37. Zhang, Y.; Li, G.; Liu, C.; Yuan, F.; Han, F.; Ali, M.; Guo, W.; Gu, H. The Effect of Three-Dimensional Loading and Texture on Deformation Mechanism of Zircaloy-4 Alloy: Using Space Schmid Factor Model. Mater. Sci. Eng. A 2019, 761, 137992. [Google Scholar] [CrossRef]
  38. Tan, N.; Xing, Z.; Wang, X.; Wang, H.; Jin, G.; Xu, B. Effects of Texturing Patterns on the Adhesion Strength of Atmosphere Plasma Sprayed Coatings. J. Mater. Res. 2017, 32, 1682–1692. [Google Scholar] [CrossRef]
  39. Yan, Z.-M.; You, M.; Yi, X.-S.; Zheng, X.-L.; Li, Z. A Numerical Study of Parallel Slot in Adherend on the Stress Distribution in Adhesively Bonded Aluminum Single Lap Joint. Int. J. Adhes. Adhes. 2007, 27, 687–695. [Google Scholar] [CrossRef]
  40. Miazio, Ł. The Influence of Layer Height on the Tensile Strength of Specimens Printed in the FDM Technology. Tech. Sci. 2021, 24, 51–56. [Google Scholar] [CrossRef]
  41. Sedlaček, M.; Podgornik, B.; Ramalho, A.; Česnik, D. Influence of Geometry and the Sequence of Surface Texturing Process on Tribological Properties. Tribol. Int. 2017, 115, 268–273. [Google Scholar] [CrossRef]
  42. Bañon, F.; Martin, S.; Vazquez-Martinez, J.M.; Salguero, J.; Trujillo, F.J. Predictive Models Based on RSM and ANN for Roughness and Wettability Achieved by Laser Texturing of S275 Carbon Steel Alloy. Opt. Laser Technol. 2024, 168, 109963. [Google Scholar] [CrossRef]
Figure 1. Representation of the four texture geometries analysed, including pyramids, slots, cones and cylinders.
Coatings 14 01033 g001
Figure 2. Specimen printing process including (a) the design of the software Bambu Studio, (b) the 3D printer Bambu Lab, and (c) one of the specimens under the printing head.
Coatings 14 01033 g002
Figure 3. Three-dimensional texture capture. Focus-variation topography analysis using Alicona® system: (a) measurement setup and (b) topography of the textured surface corresponding to slots.
Coatings 14 01033 g003
Figure 4. (a) Levelling of the digitised surface through a least squares plane; (b) removal of shape defects through Gaussian filtering under ISO standards; (c) calculation of area roughness parameters.
Coatings 14 01033 g004
Figure 5. Wettability analysis. (a) Water drop deposition; (b) deposited water drop depicting the contact angle (θ); (c) measurement of the sliding angle using inclinable table (α).
Coatings 14 01033 g005
Figure 6. CAD representation of a corresponding specimen used in the adhesive bonding analysis: (a) isometric view of one of the elements to be bonded; (b) side view of the element; (c) assembly of the two parts forming the adhesive bonding specimen.
Coatings 14 01033 g006
Figure 7. Test equipment and procedure for the shear stress analysis in the adhesive bonding. (a) Adhesive bonded specimen within the universal testing machine and (b) bonded specimens after the testing procedure.
Coatings 14 01033 g007
Figure 8. Scanning of the texturing patterns produced by FFF.
Coatings 14 01033 g008
Figure 9. Geometric slices of the textures generated by FFF. (a) Without texture; (b) cylinders; (c) cones; (d) cones without gaps; (e) pyramids; (f) slots W0.5 G0.3; (g) slots W0.5 G0.5.
Coatings 14 01033 g009
Figure 10. Corresponding results of the evaluation of the surface quality as a function of the texturing pattern using the parameters: (a) Sa; (b) Sz; (c) Sk; (d) Vvc.
Coatings 14 01033 g010
Figure 11. Results corresponding to the relationship between surface quality and wettability as a function of texture pattern: (a) cones; (b) cones without spacing; (c) cylinders; (d) pyramids; (e) grooves with width 0.5 mm and gap 0.3 mm; (f) grooves with width 0.5 mm and gap 0.5 mm; (g) grooves with width 1 mm and gap 0.3 mm.
Coatings 14 01033 g011
Figure 12. Deformation strain graph obtained in the shear tests when bonding the different textures.
Coatings 14 01033 g012
Figure 13. Macrographs of the interlayers after applying a cyanoacrylate adhesive between the different texturing patterns: (a) cylinders at 8X; (b) cylinders at 16X; (c) cones at 8X; (d) cones at 16X; (e) pyramids at 8X; (f) pyramids at 16X; (g) grooves at 8X; (h) grooves at 16X.
Coatings 14 01033 g013
Figure 14. The τmax results in relation to the type of texturing pattern and the influence of texture height.
Coatings 14 01033 g014
Figure 15. Relationship between the τmax and the frontal wettability angle of the results obtained for all textures.
Coatings 14 01033 g015
Figure 16. Contour plot based on the predictive model relating maximum shear strength to wettability and surface quality in terms of Sa for the results obtained.
Coatings 14 01033 g016
Table 1. Geometric parameters of the surface textures for the wettability analysis texture dimensions for wettability analysis.
GeometryWidth (W) (mm)Height (mm)Gaps (G) (mm)
Non-textured---
Pyramids1.0 (per side)0.15
0.30
0.50
0.0
Cylinders1.0 (diameter)0.15
0.30
0.50
0.25
Cones1.0 (diameter)0.15
0.30
0.50
0.0
0.50
Slots0.5 (width)0.15
0.30
0.50
0.30
Slots0.5 (width)0.15
0.30
0.50
0.50
Slots1.0 (width)0.15
0.30
0.50
0.50
Table 2. Printing conditions for wettability analysis specimens.
Layer thickness0.08 mm
Speed deposition60 mm/s
Temperature200 °C
Infill density15%
Infill patternGiroid
Number of surface layers9
Table 3. Texture dimensions for the adhesive bonding analysis.
GeometryBase Size (mm)Height (mm)Gaps (mm)
Pyramids1 (per side)0.15
0.50
0.00
Cylinders1 (diameter)0.15
0.50
0.25
Cones1 (diameter)0.15
0.50
0.50
Slots0.5 (width)0.15
0.50
0.50
Disclaimer/Publisher’s Note: The statements, opinions and data contained in all publications are solely those of the individual author(s) and contributor(s) and not of MDPI and/or the editor(s). MDPI and/or the editor(s) disclaim responsibility for any injury to people or property resulting from any ideas, methods, instructions or products referred to in the content.

