
Numerical Simulation of Fluid Flow Characteristics and Heat Transfer Performance in Graphene Foam Composite

 ,
,
Abstract
:1. Introduction
2. Methodology
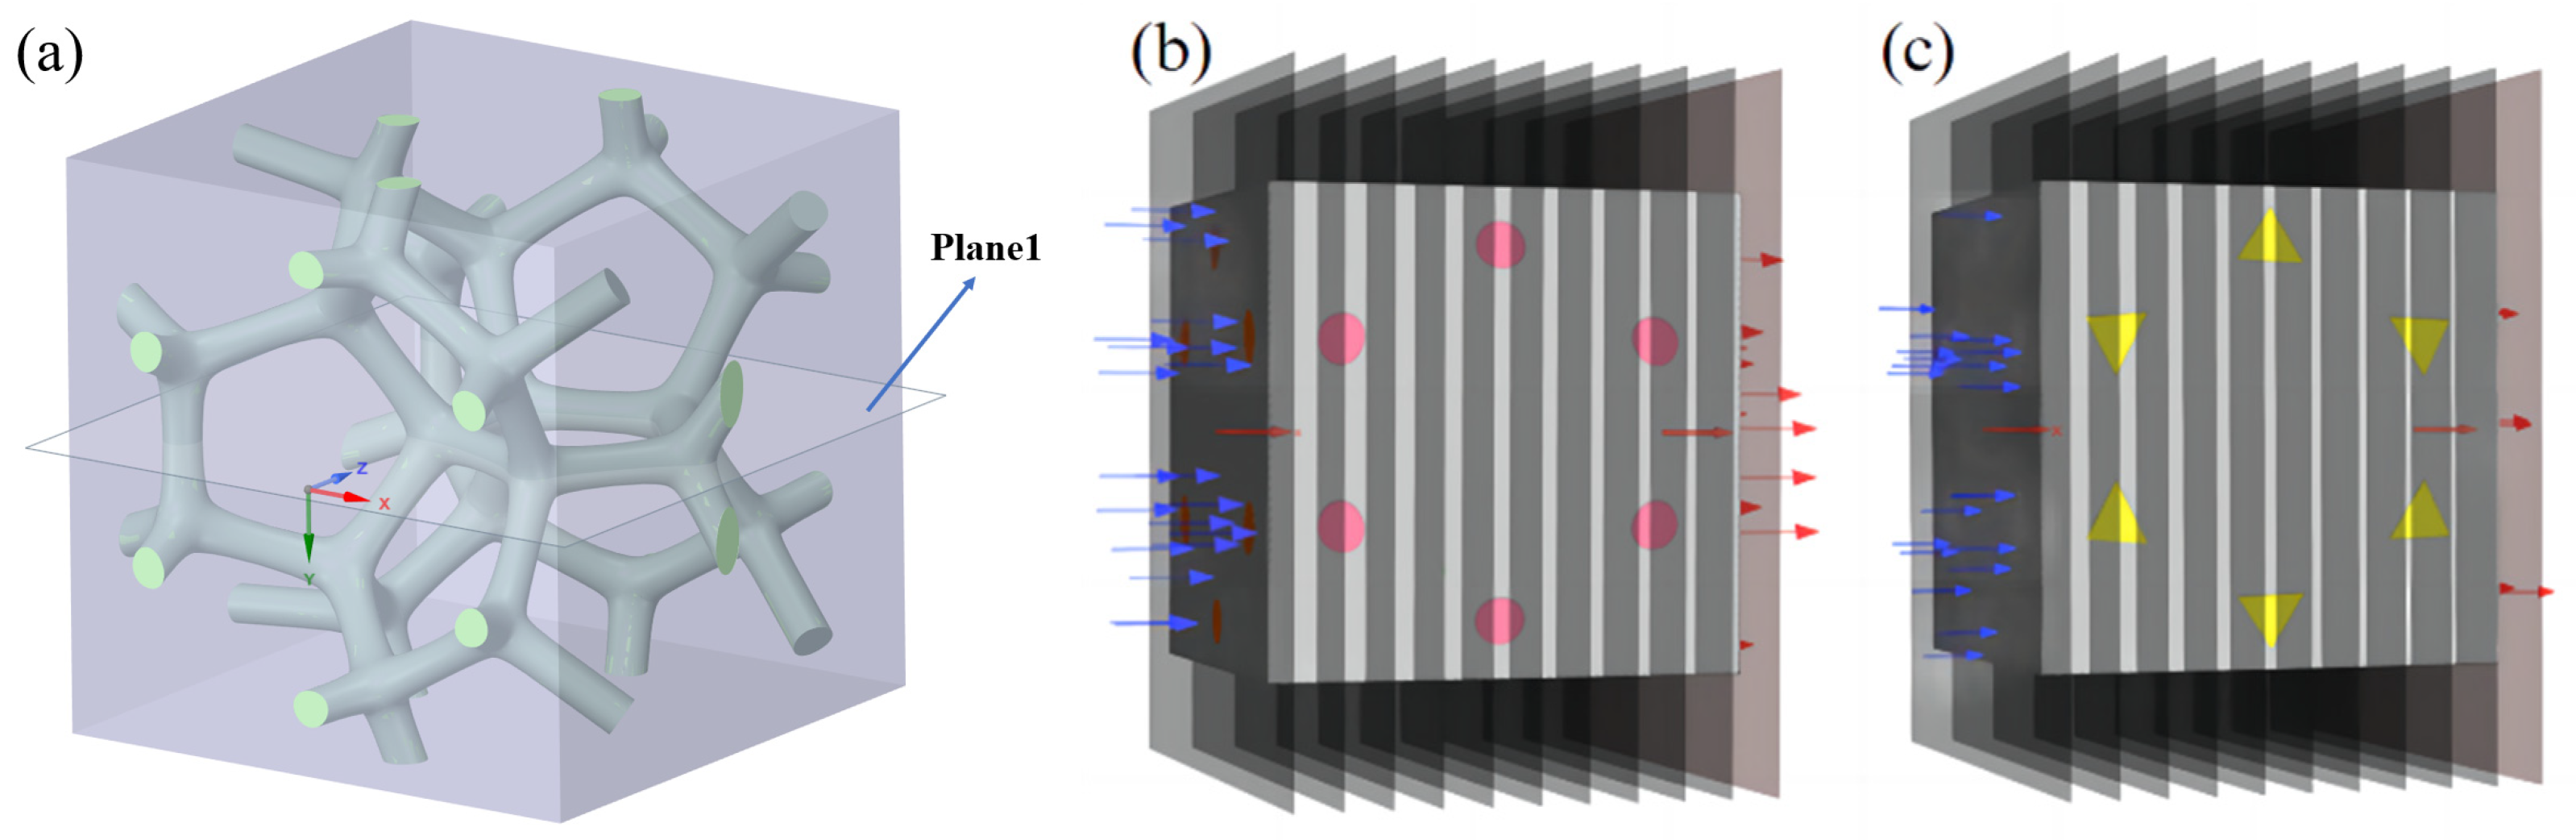
2.1. Physical Model
2.2. Governing Equations
2.3. Boundary Condition
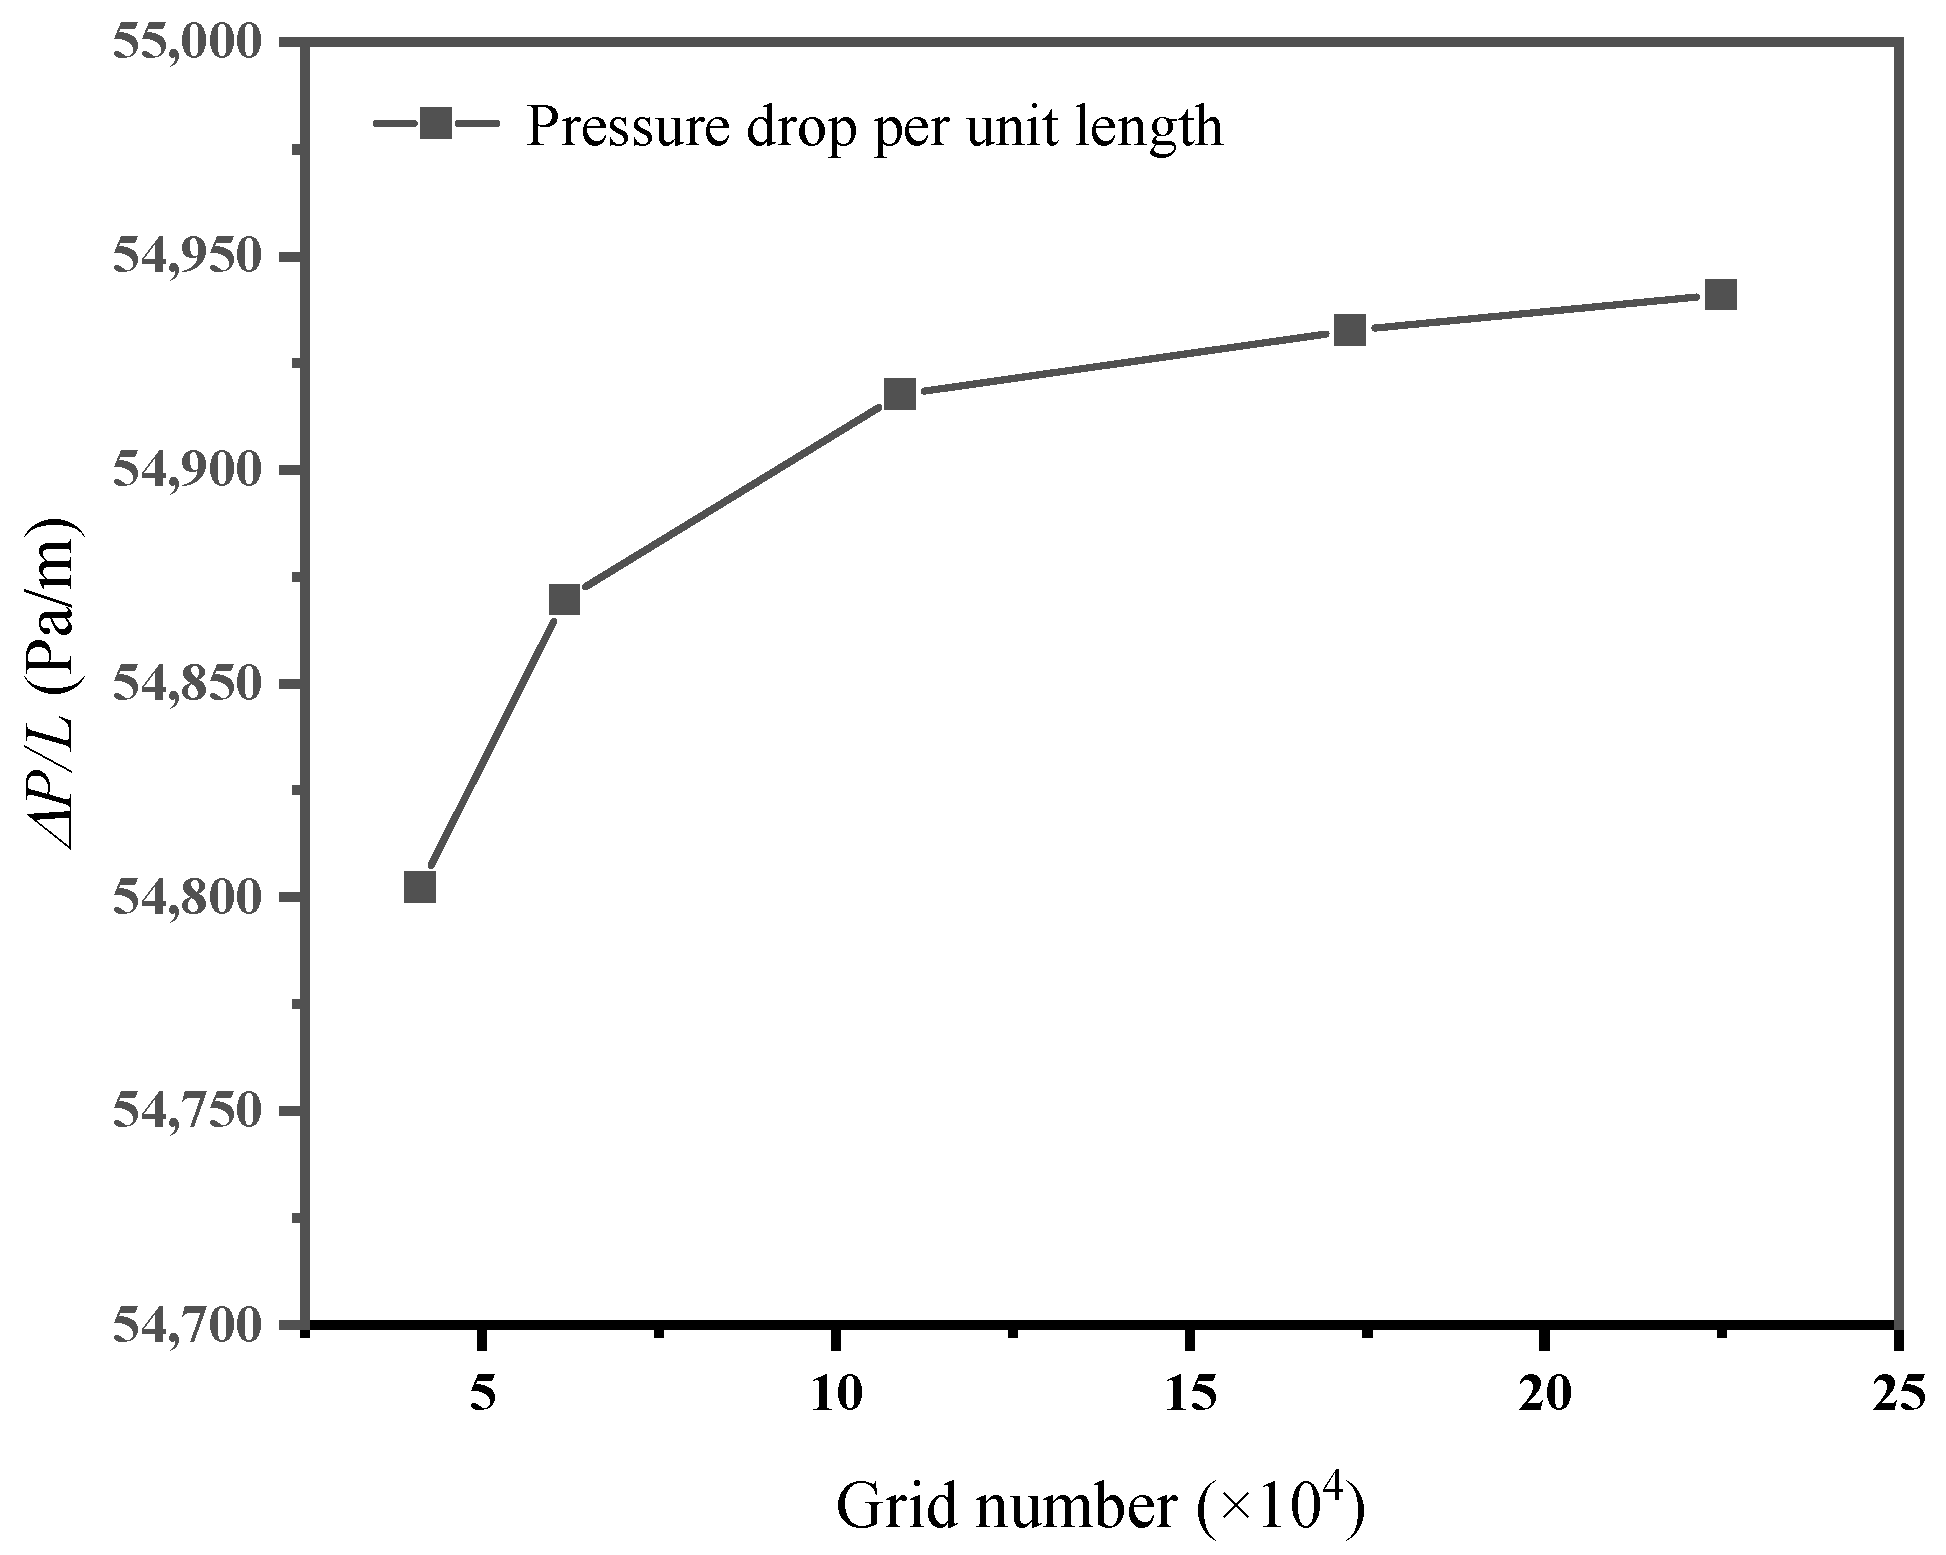
2.4. Grid Independence Verification
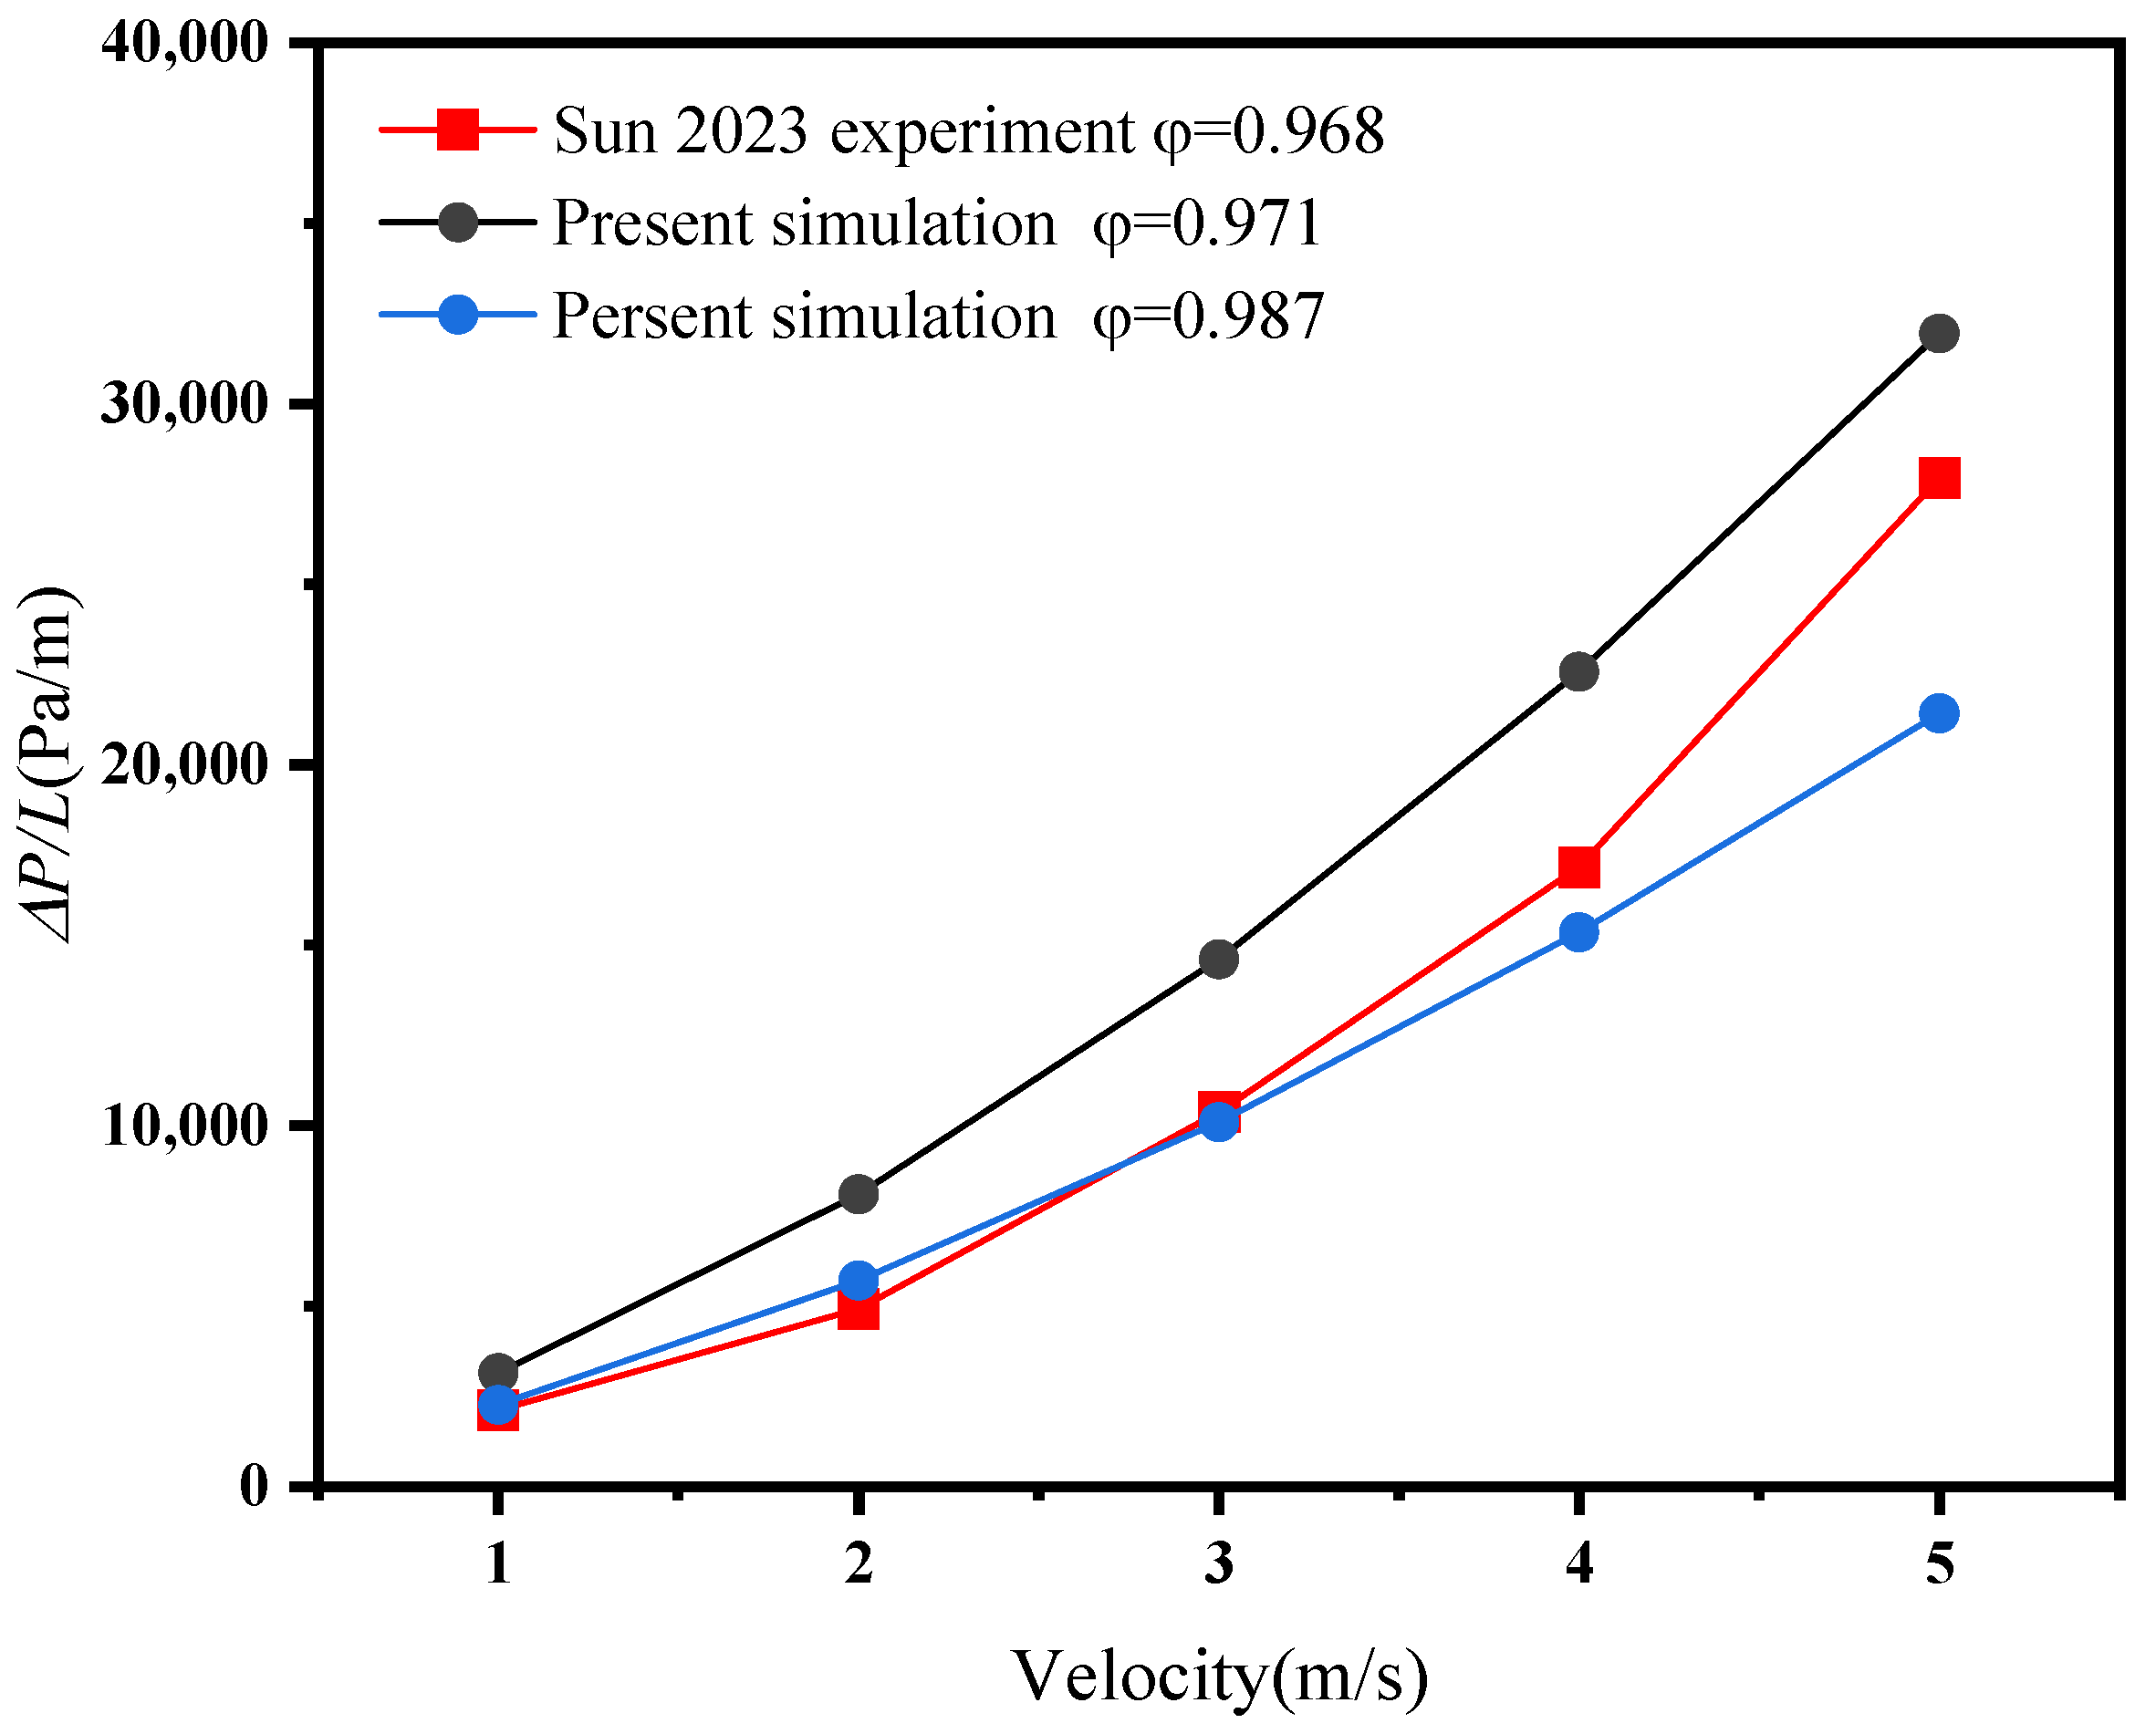
2.5. Numerical Simulation Validation
3. Results and Discussion
3.1. Flow Characteristics Analysis
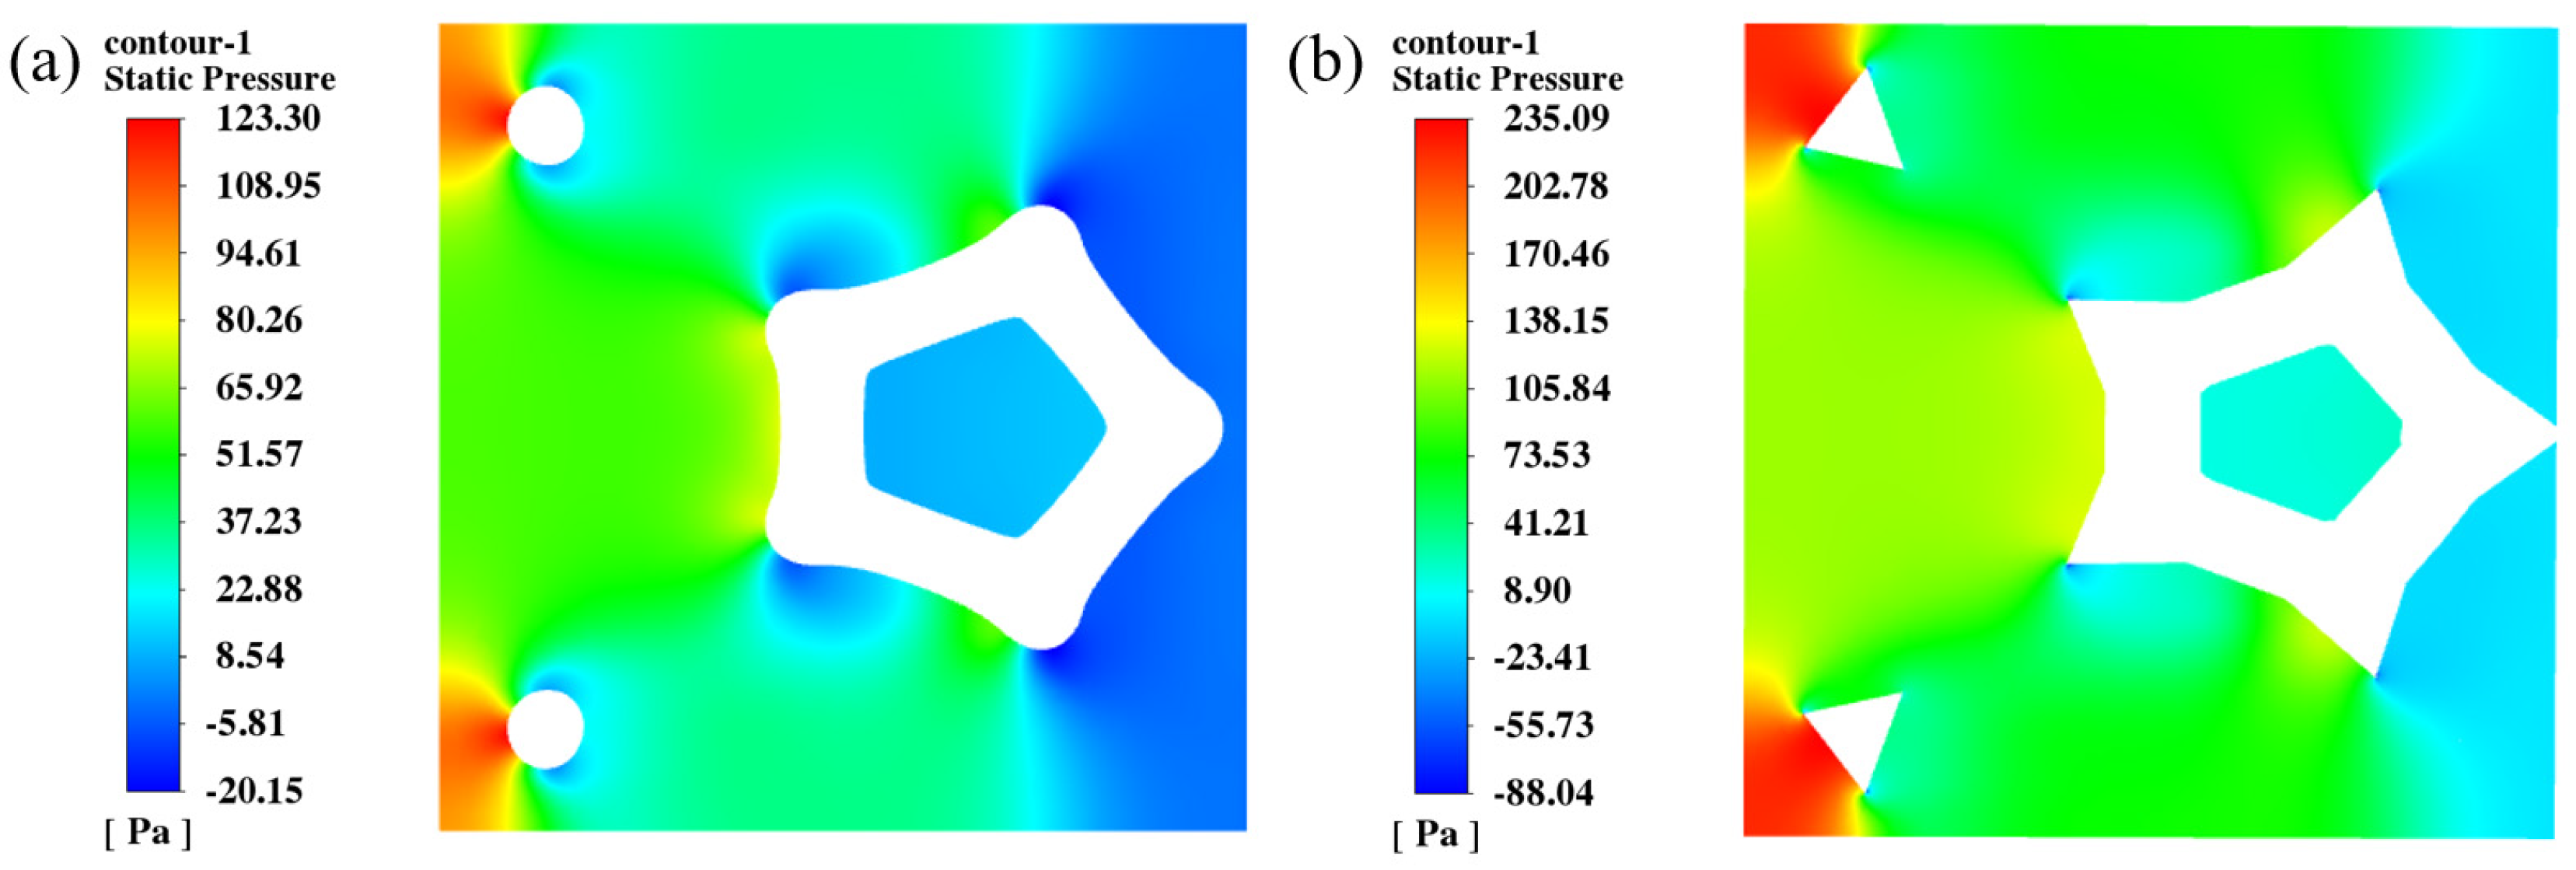
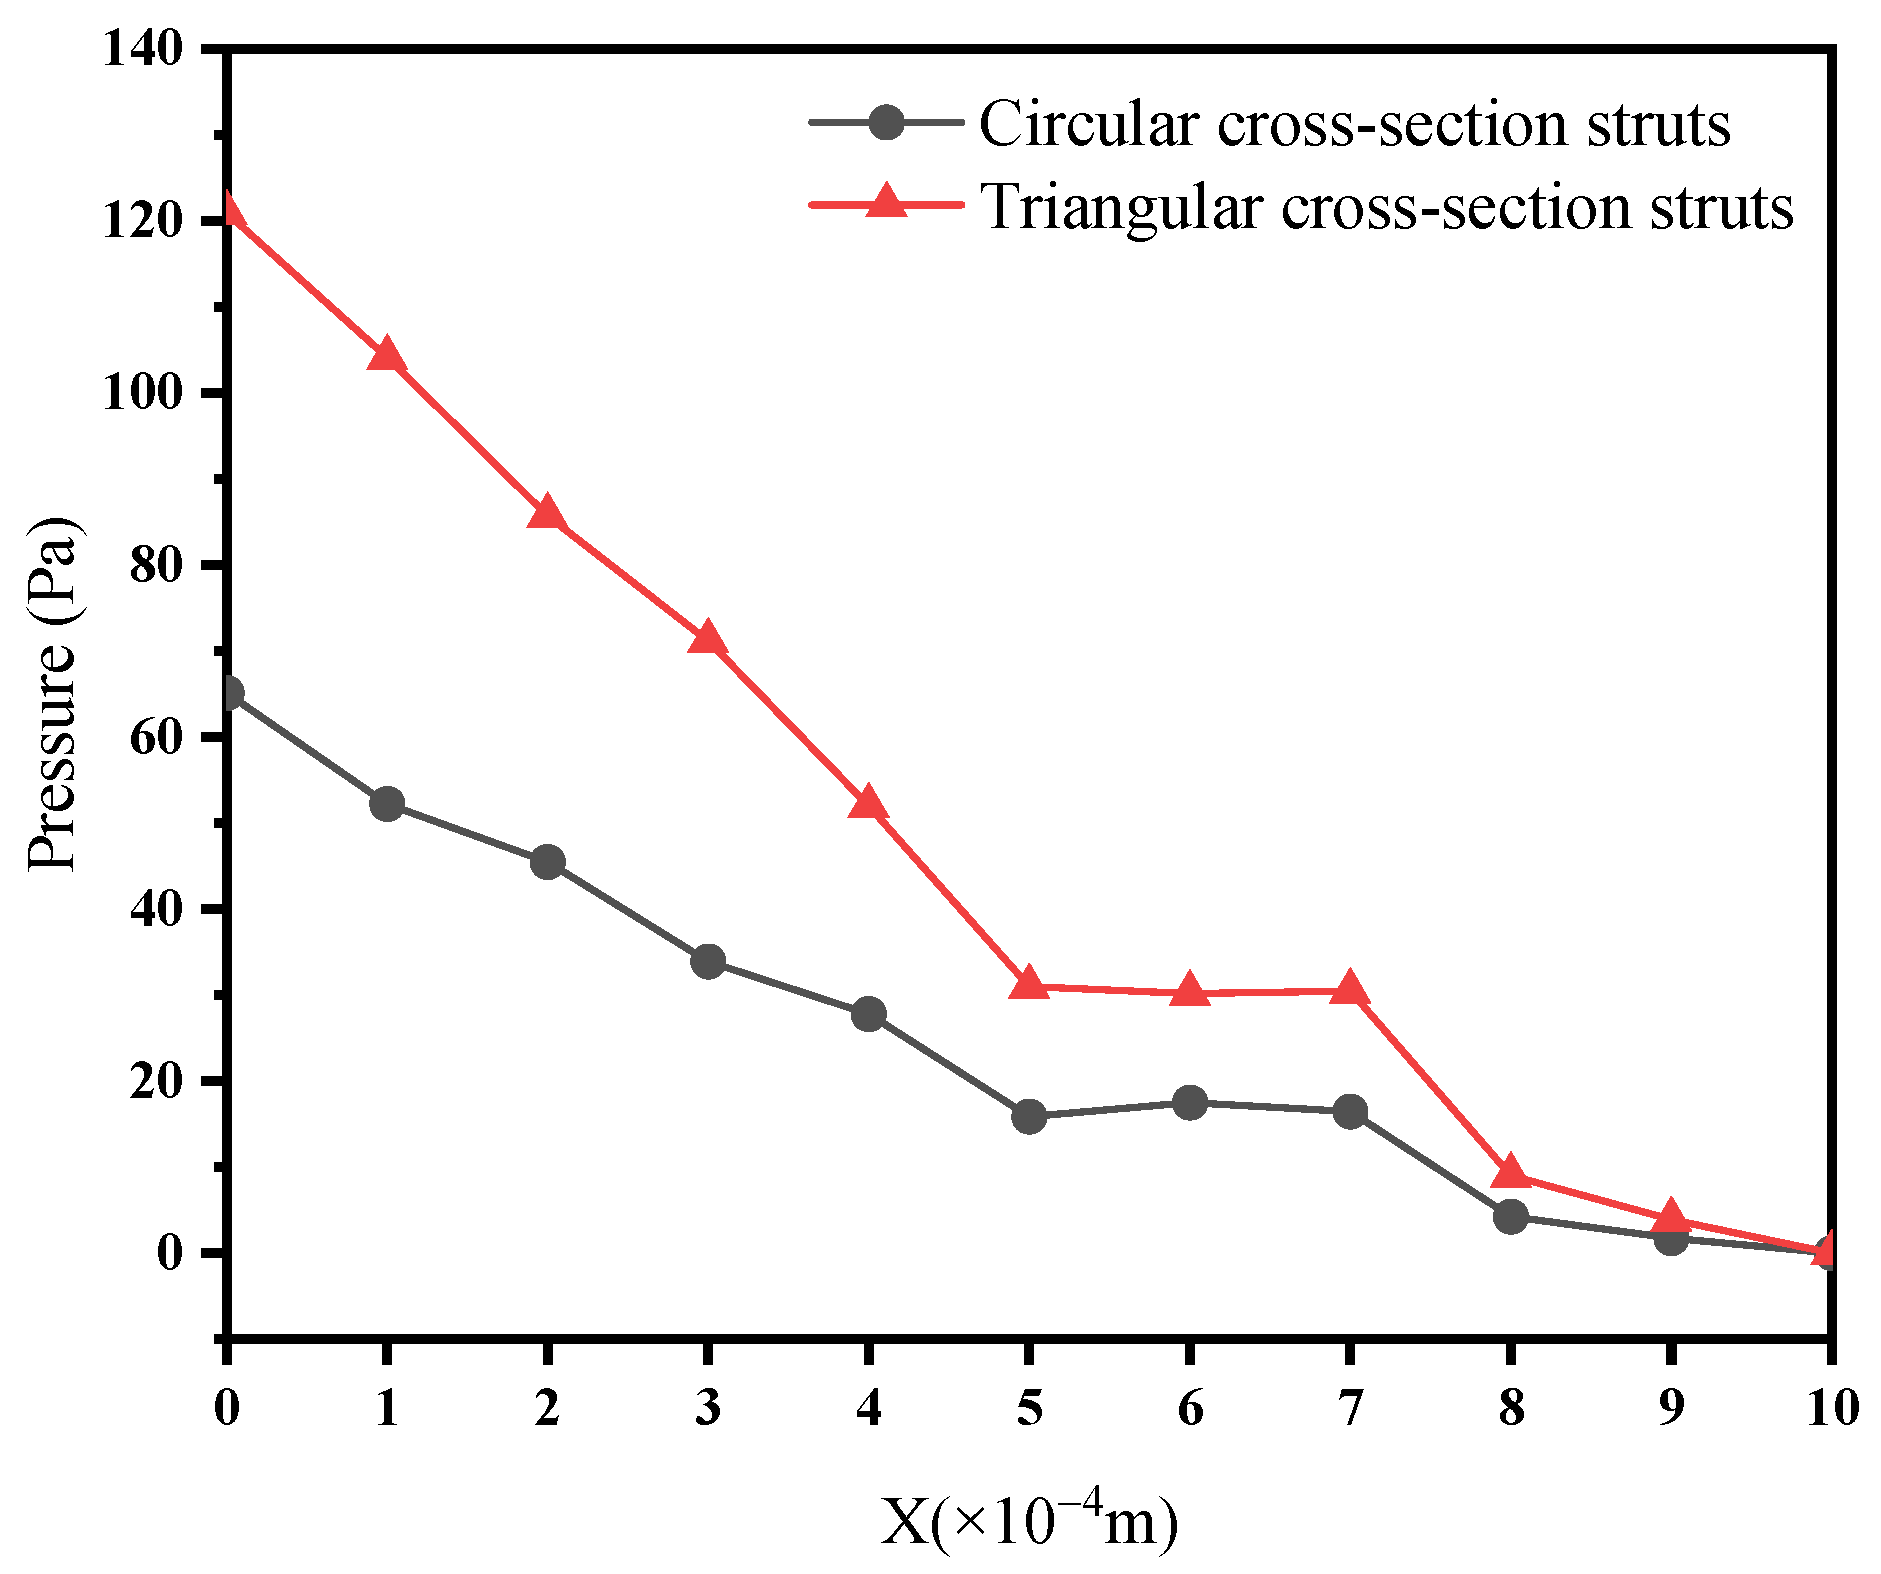
3.1.1. Pressure Distribution
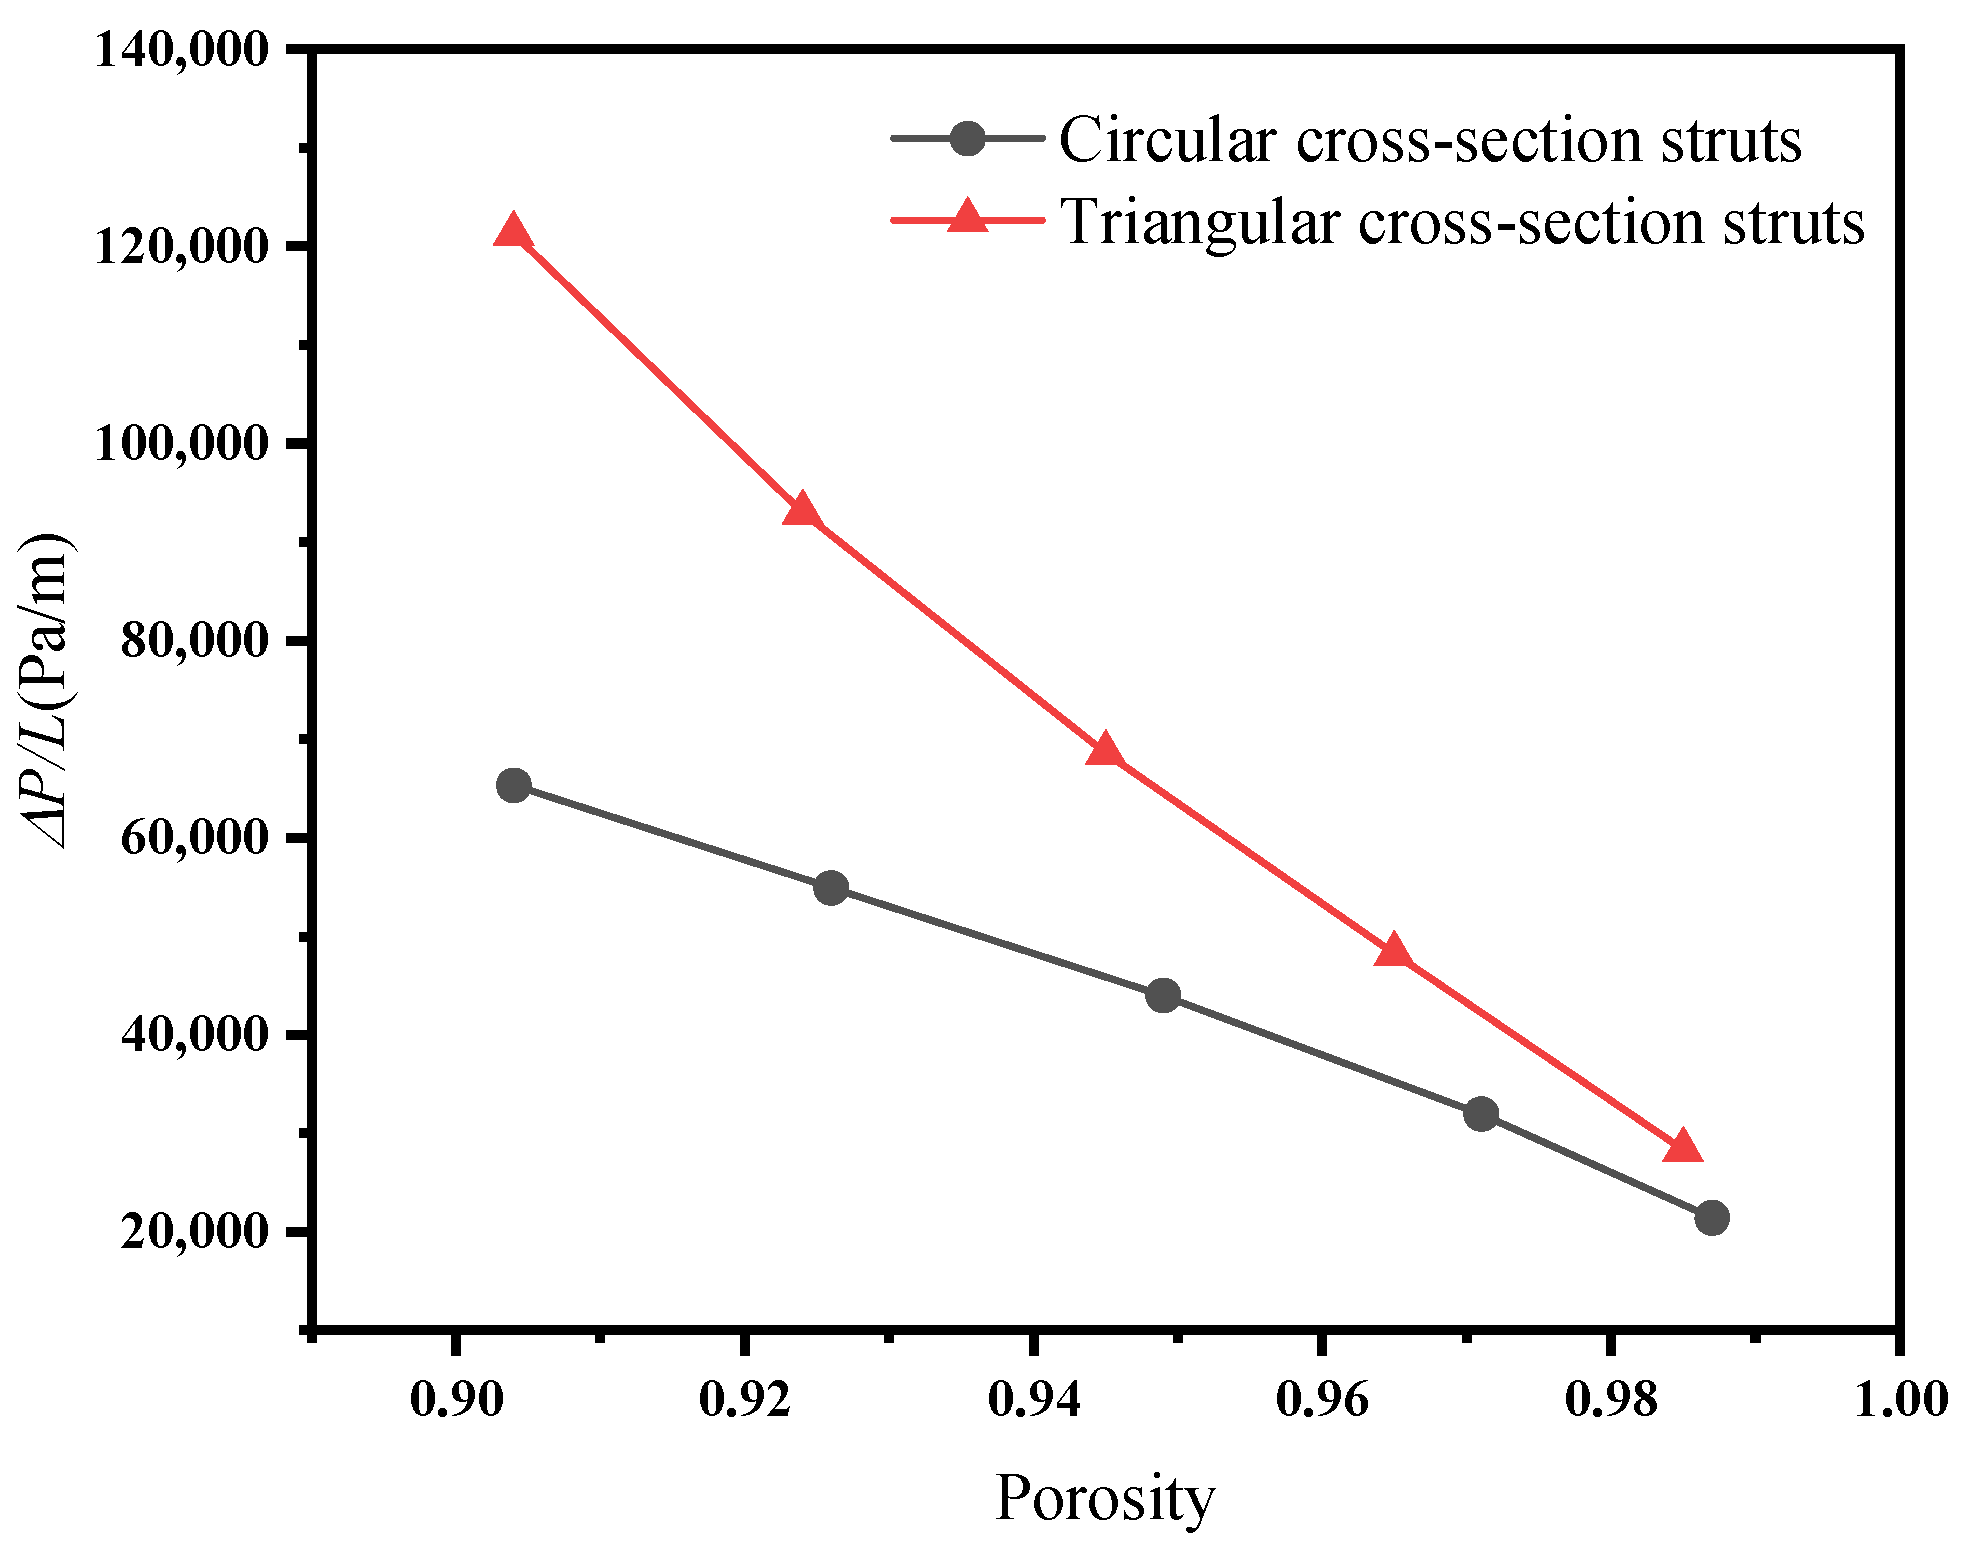
3.1.2. Influence of Porosity on Pressure Drop
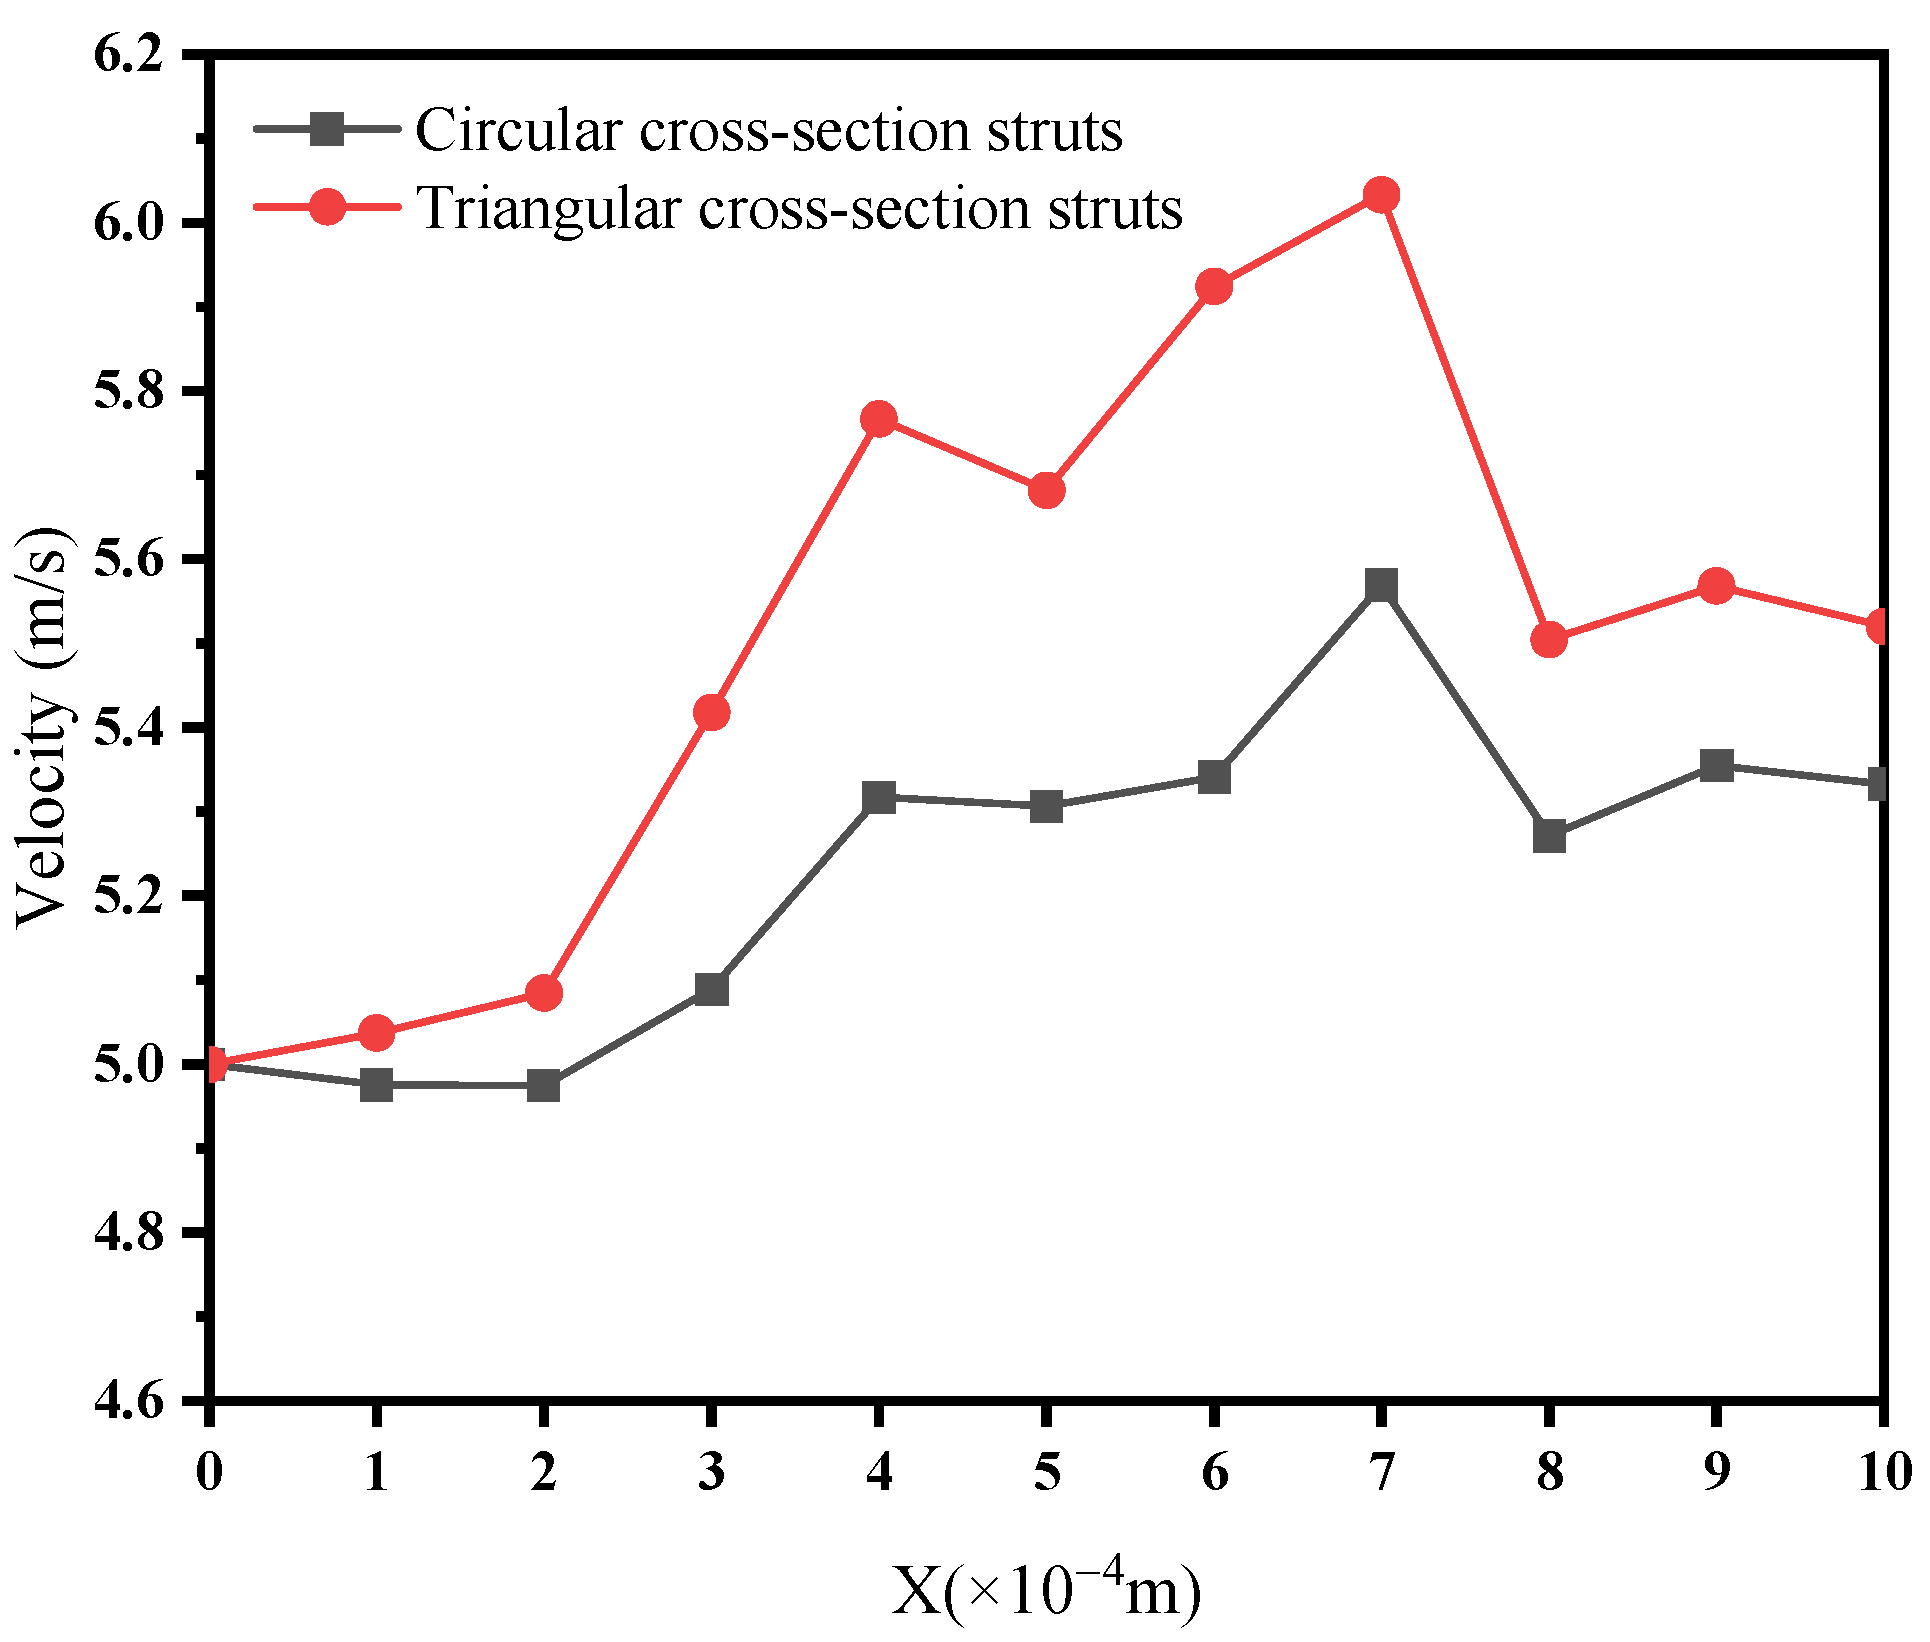
3.1.3. Influence of Velocity and Cross-Section Shape of Struts on Pressure Drop
3.1.4. Influence of Flow Direction on Pressure Drop
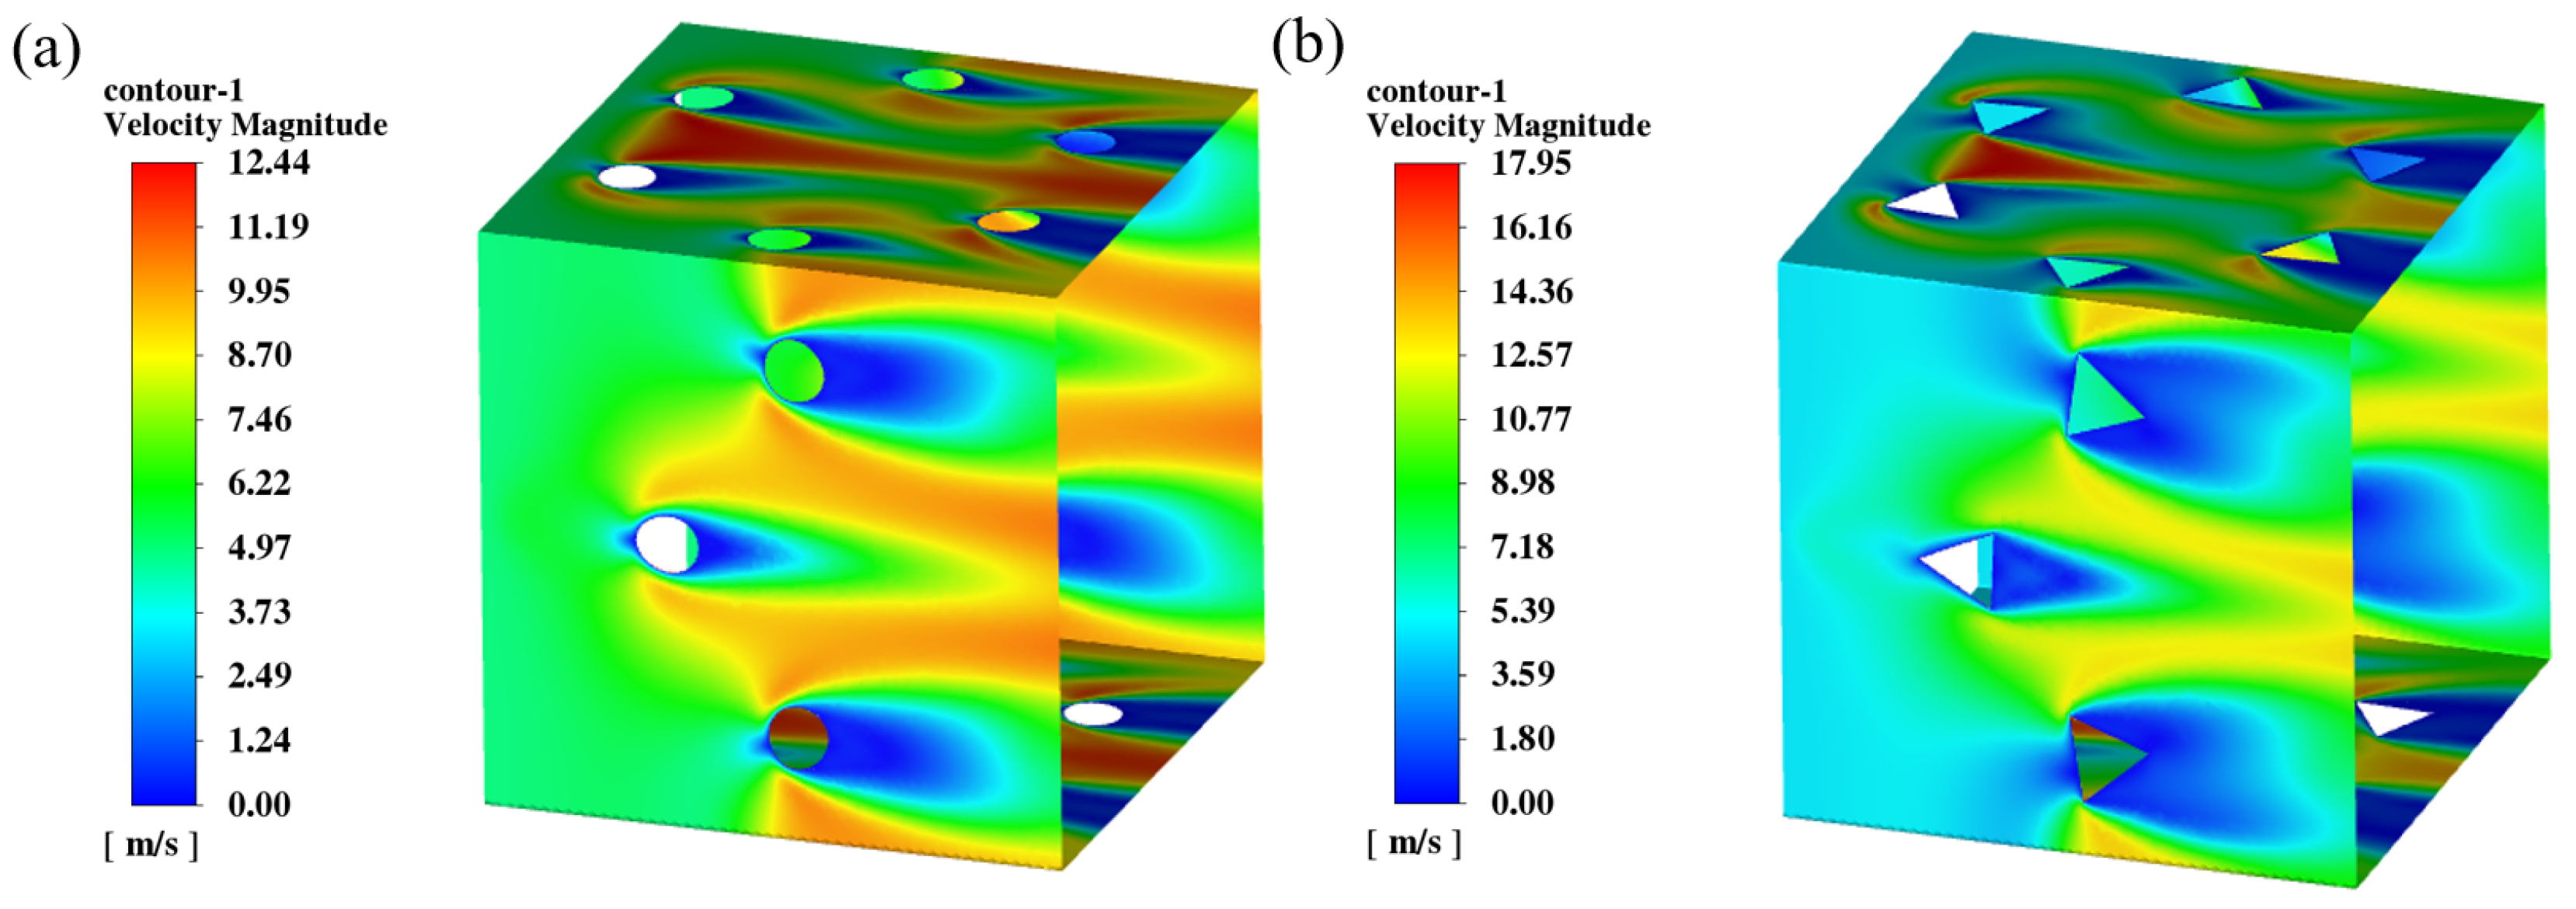
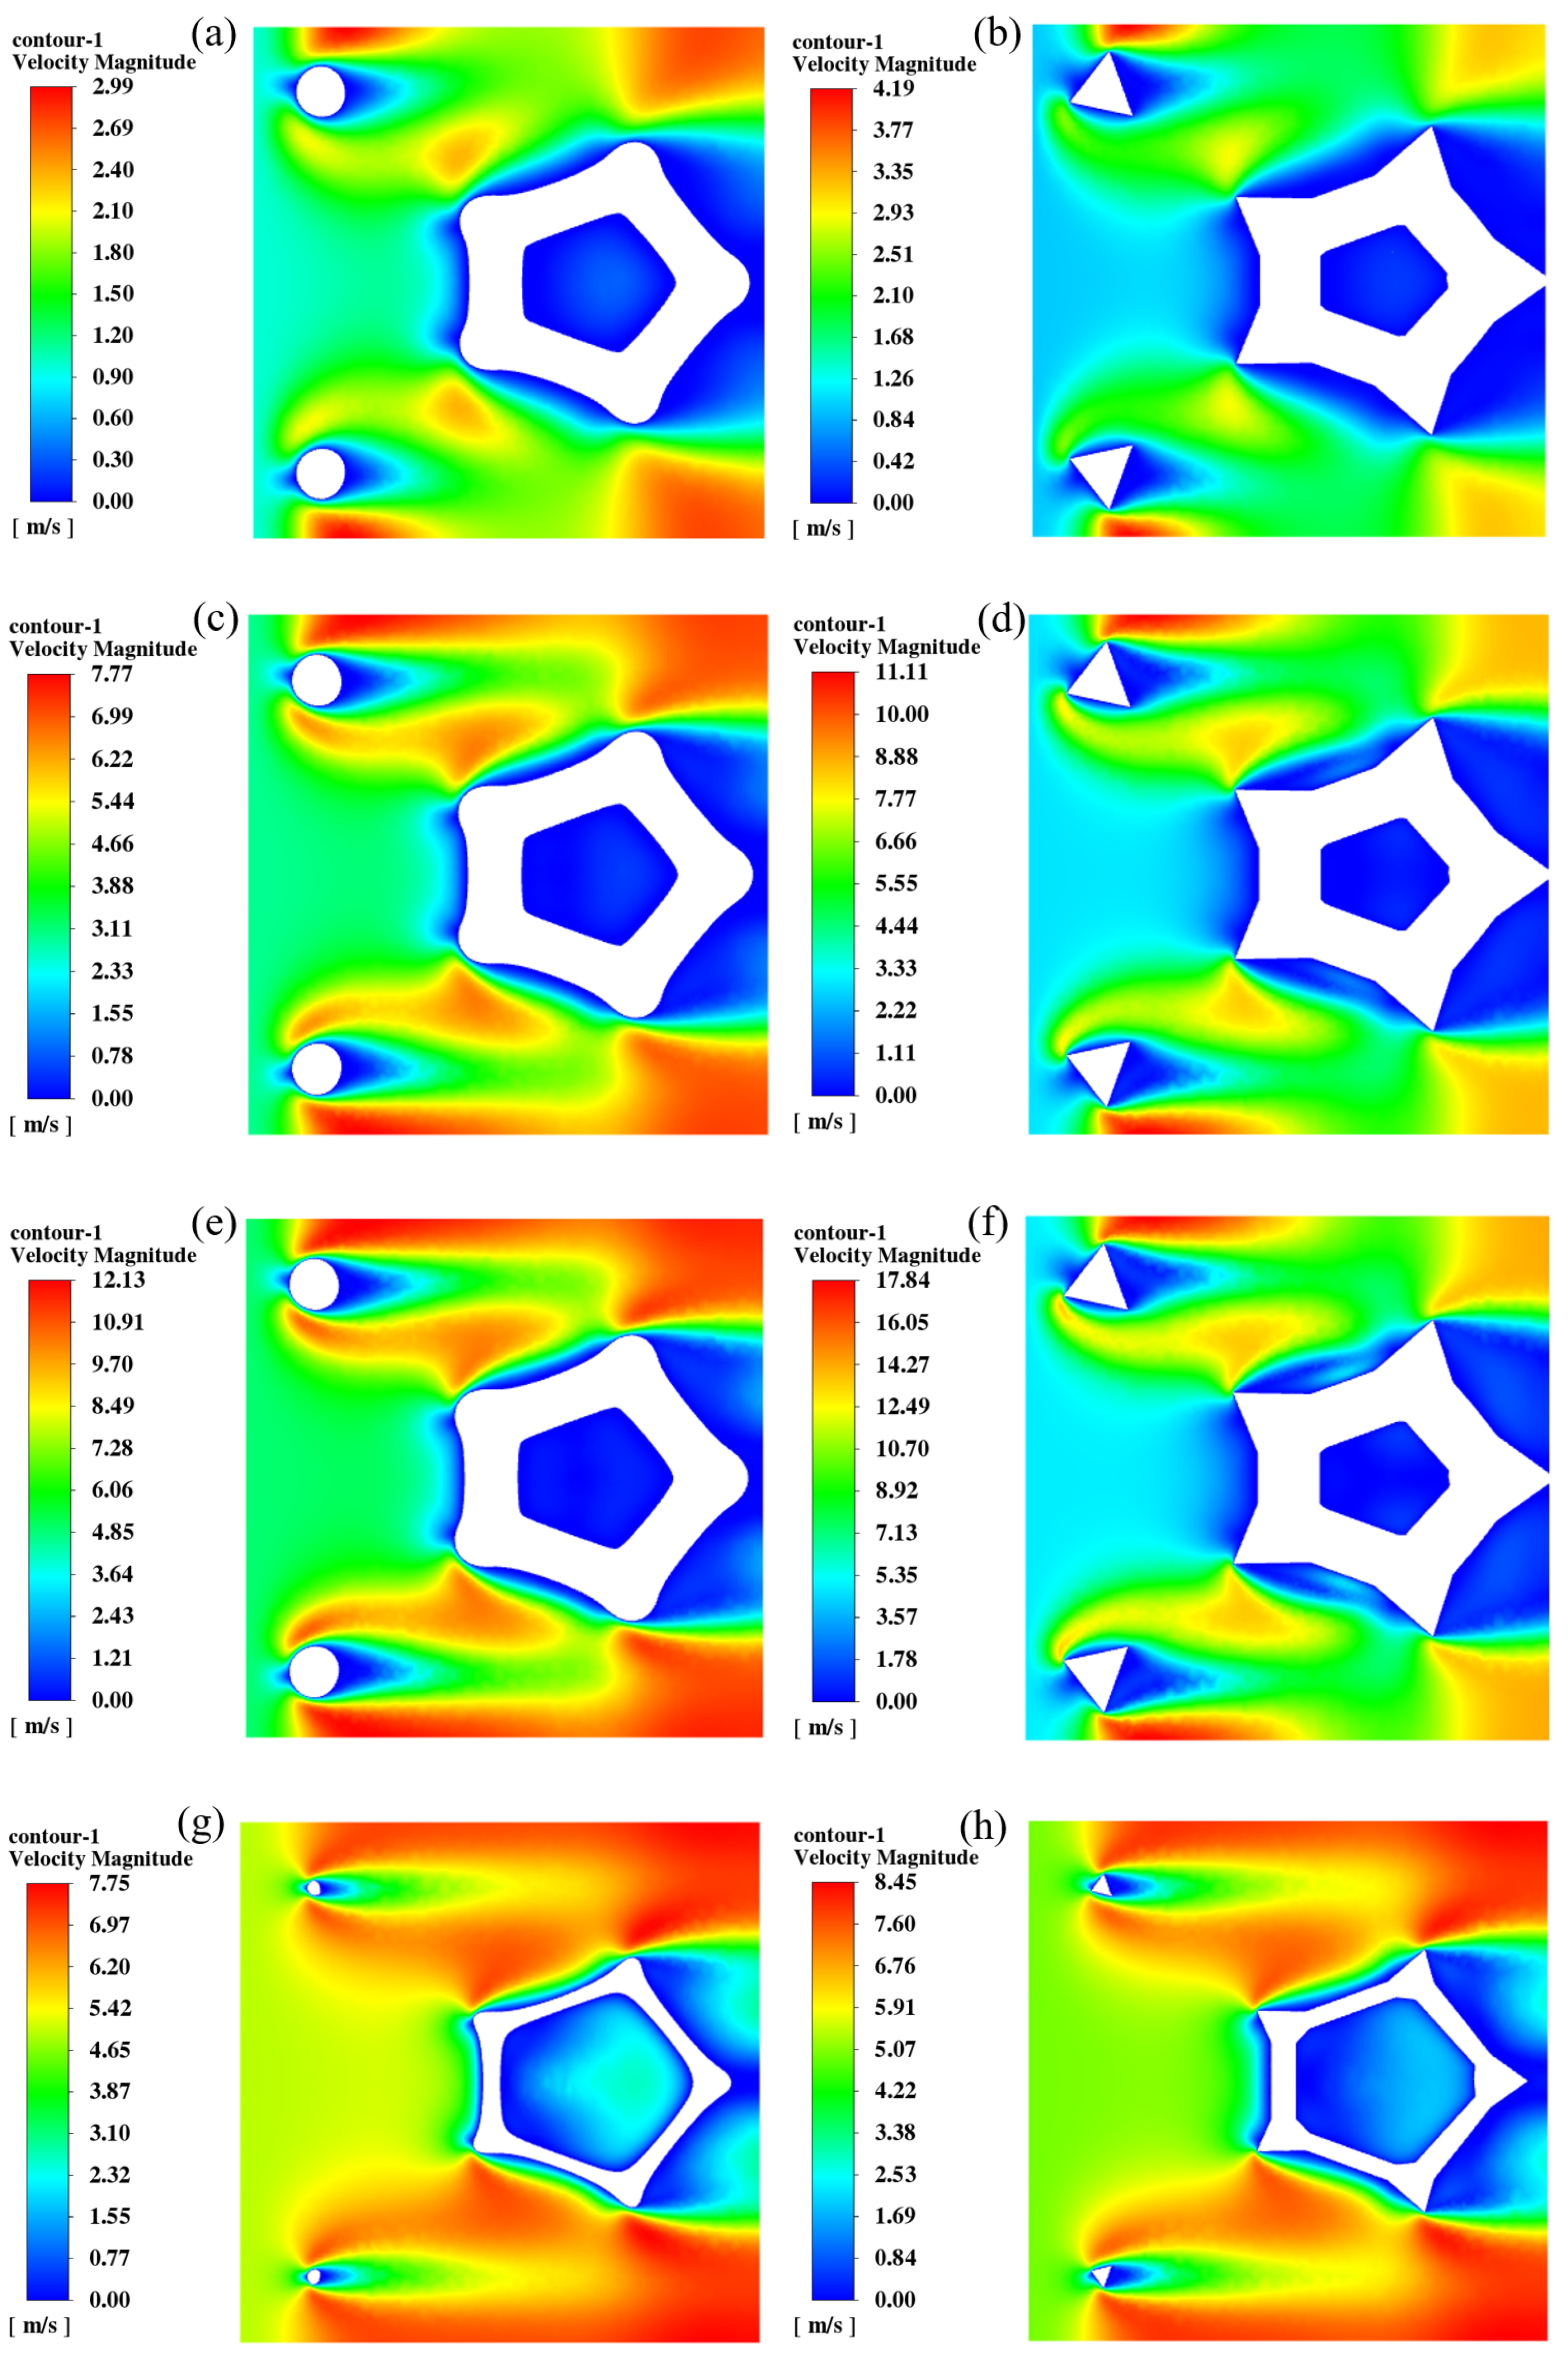
3.2. Velocity Field Analysis
3.3. Temperature Distribution
3.4. Convective Heat Transfer Performance
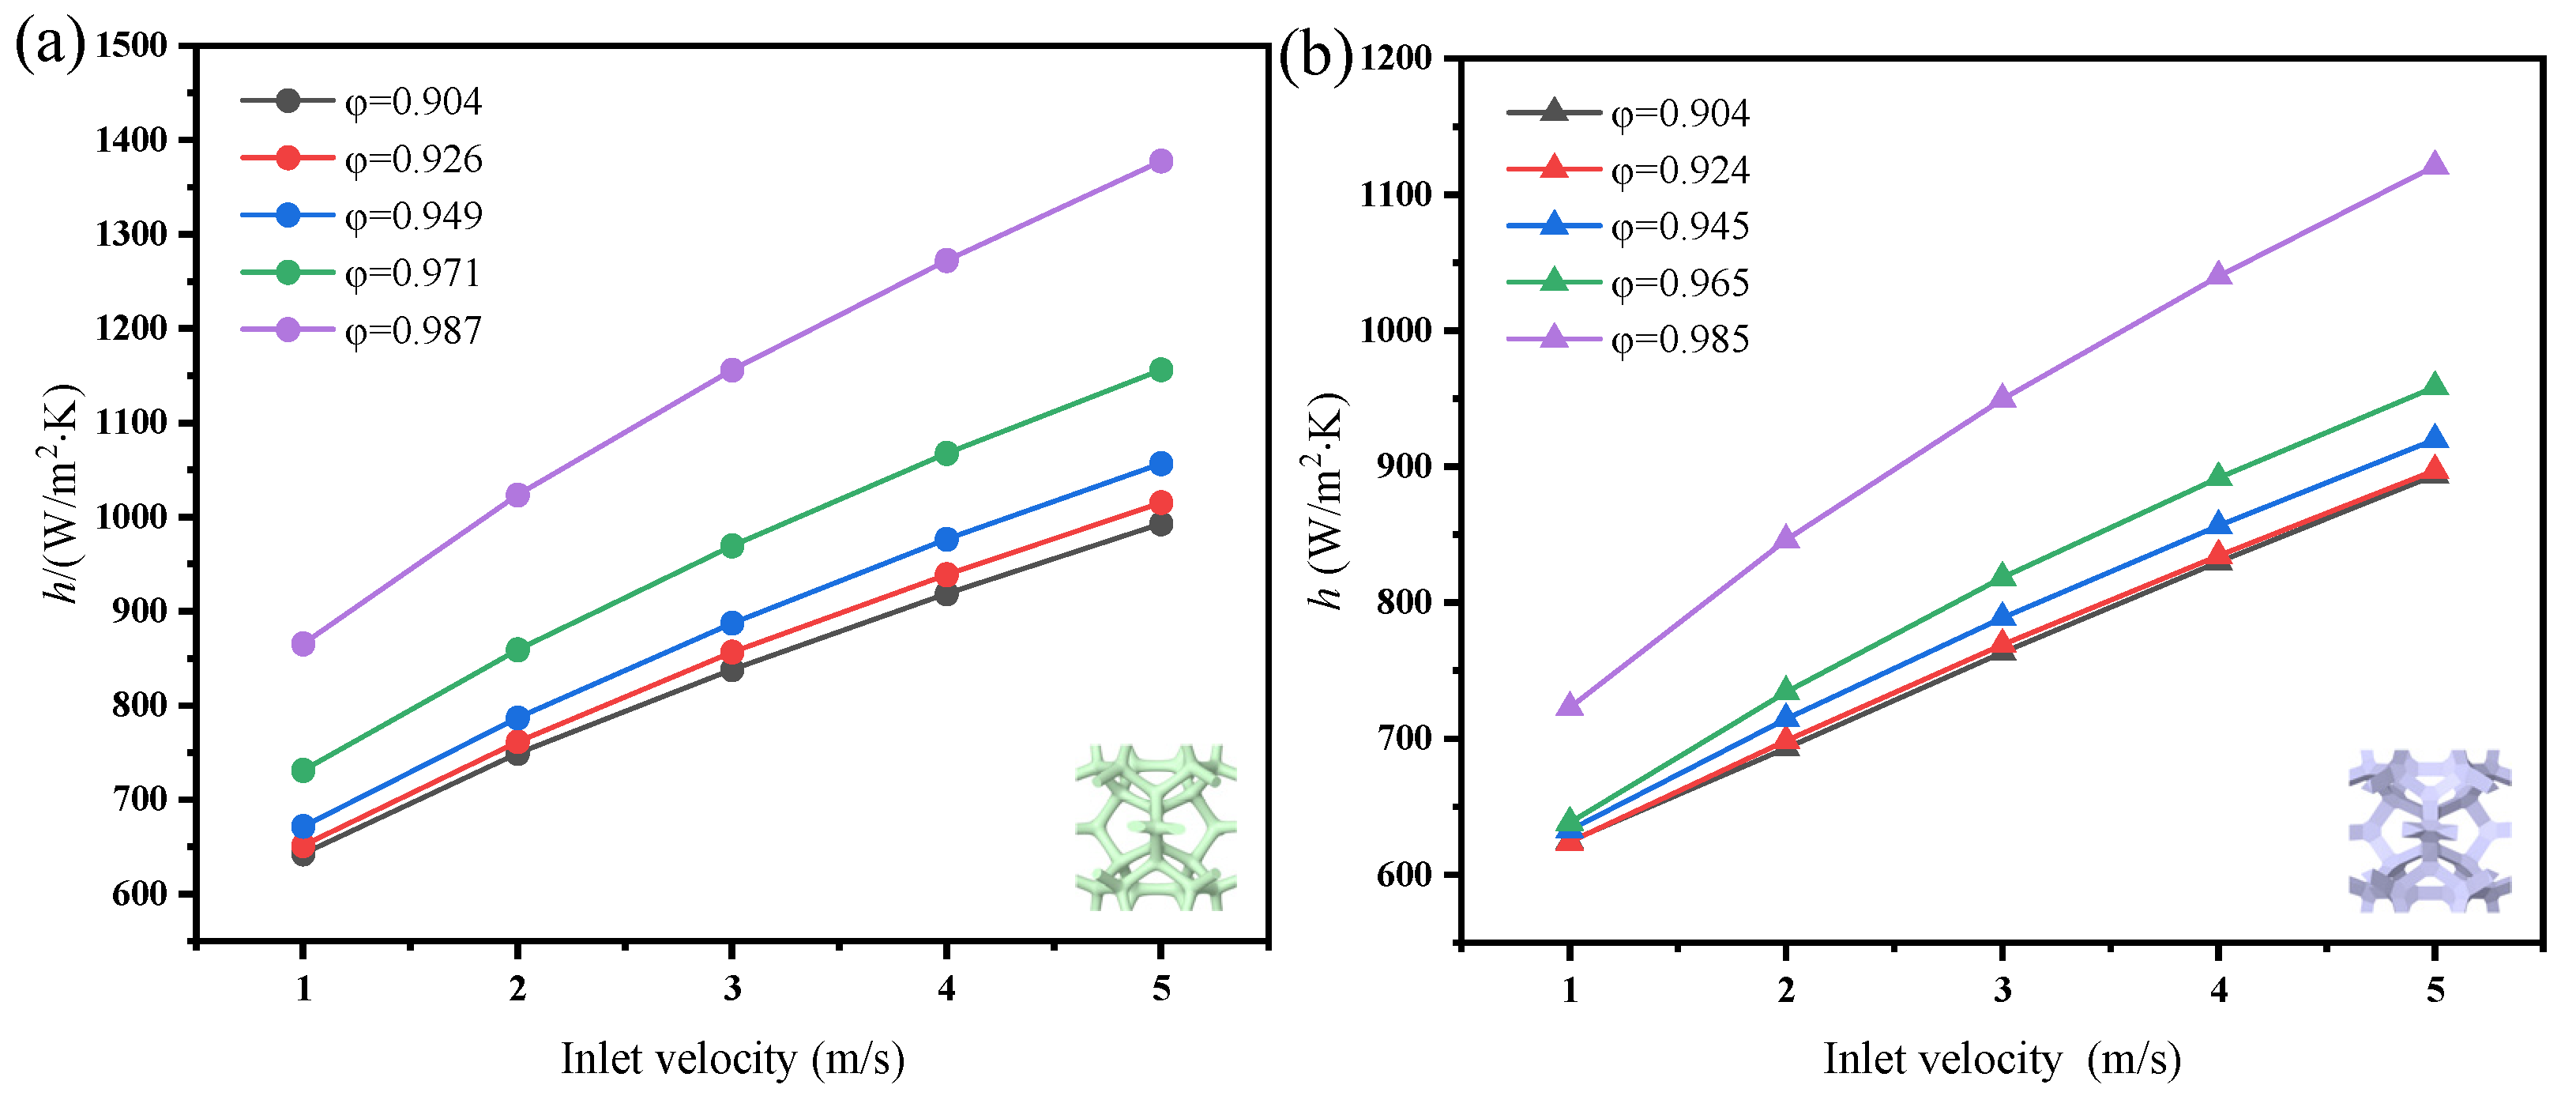
3.4.1. Influence of Velocity and Porosity on the Convective Heat Transfer Coefficient
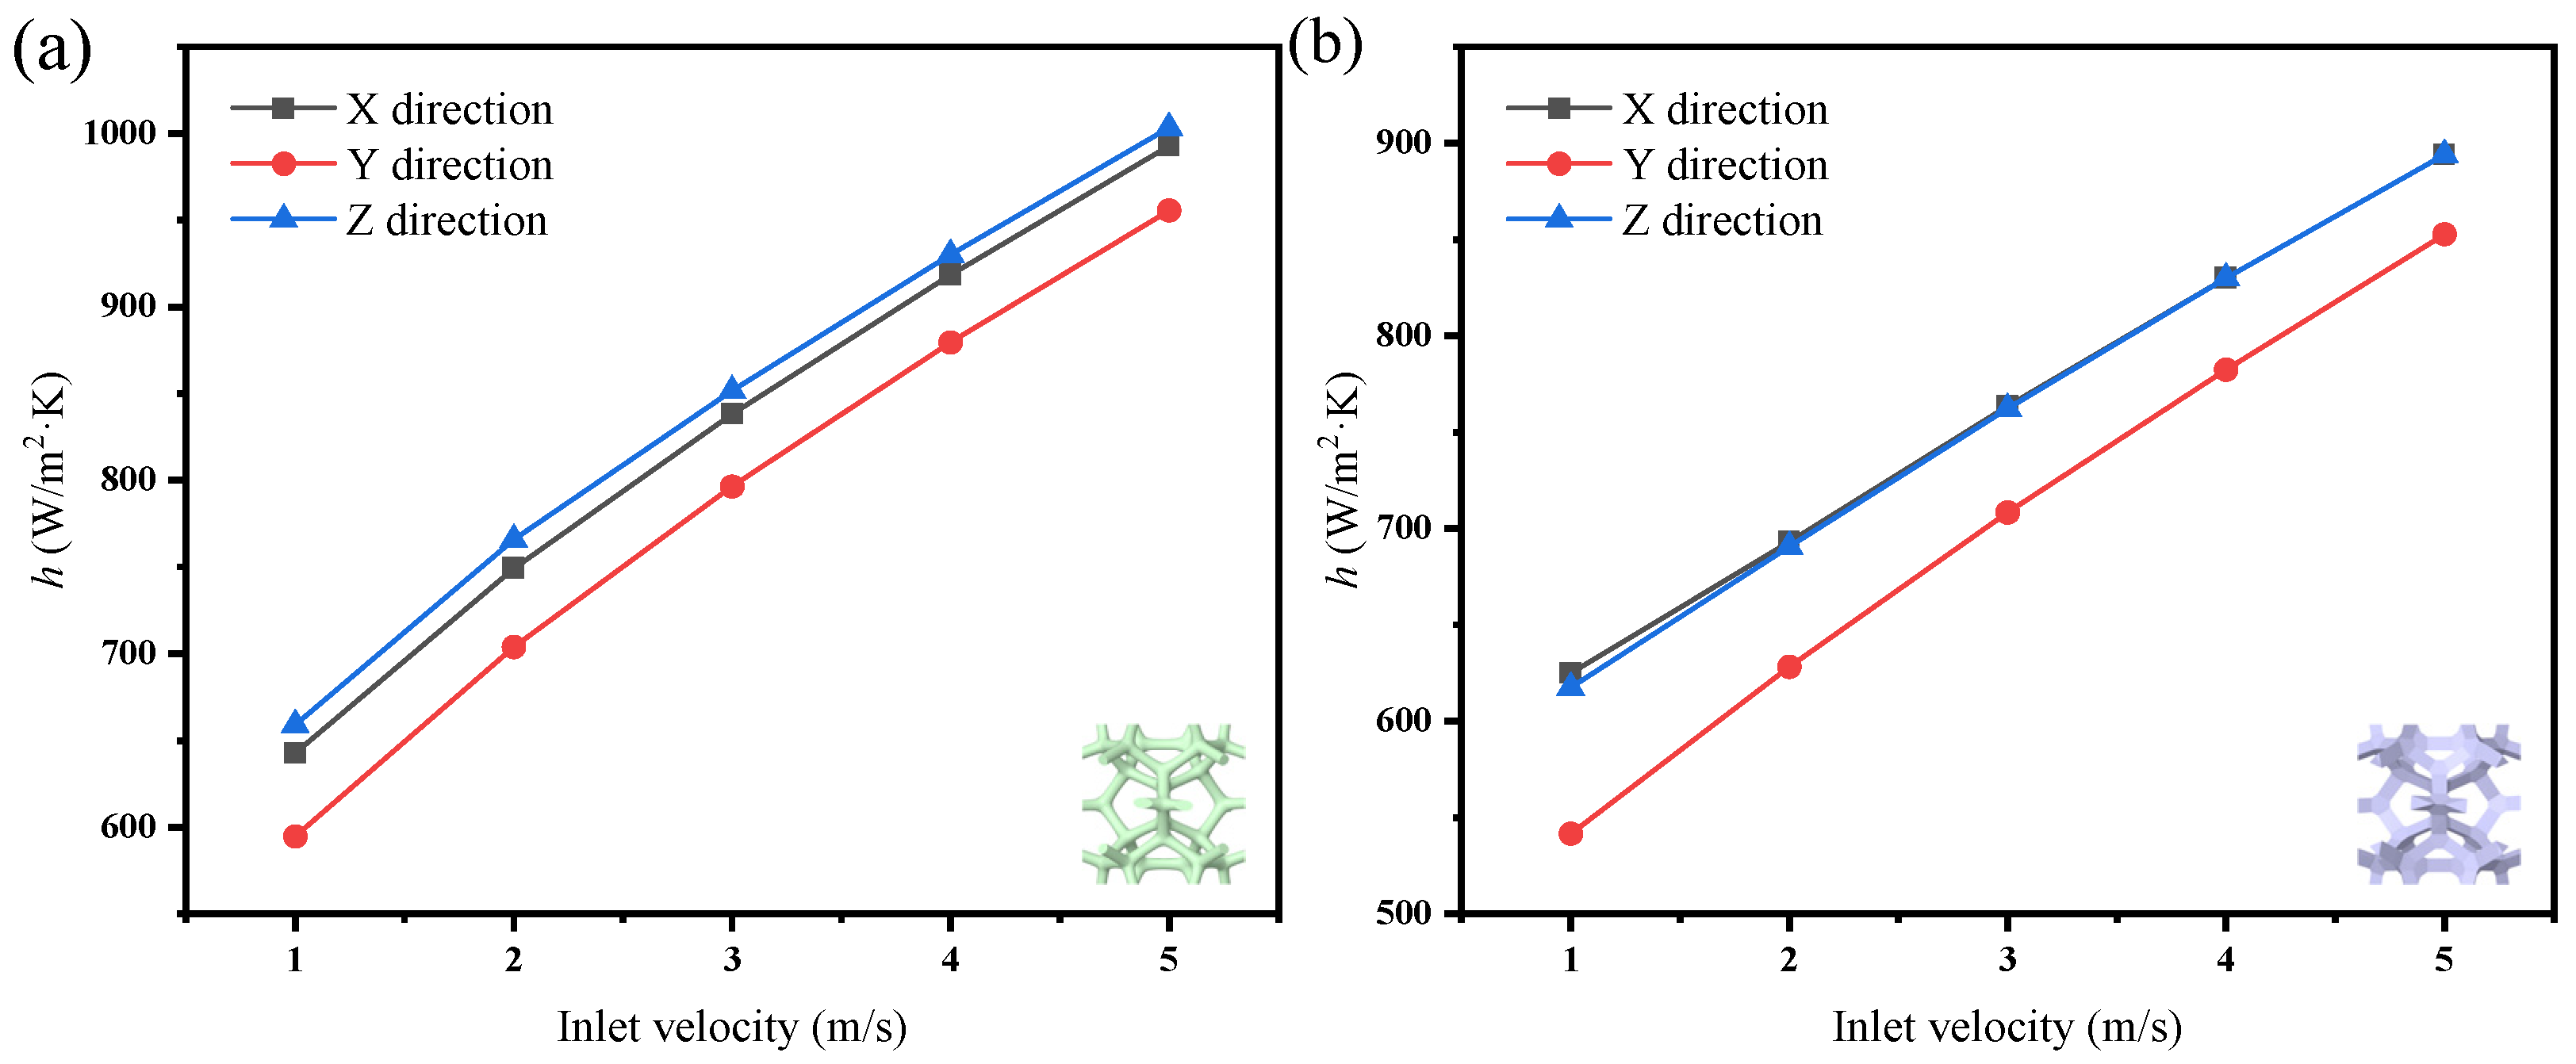
3.4.2. Influence of Flow Direction on the Convective Heat Transfer Coefficient
4. Conclusions
Author Contributions
Funding
Institutional Review Board Statement
Informed Consent Statement
Data Availability Statement
Conflicts of Interest
References
- Ai, D.; Ma, Y.H.; Yu, H.; Chang, Y.; Wu, C.L.; Han, Y.T.; Cheng, Y.H.; Dong, C.Y. Lightweight graphene foam composites with enhanced electrical conductivity and microwave absorption for electromagnetic interference shielding. Mater. Res. Bull. 2024, 175, 112764. [Google Scholar] [CrossRef]
- Yang, B.; Yang, N.; Zhao, D.; Chen, F.; Yuan, X.; Hou, Y.; Xie, G. Numerical simulation of a simplified reaction model for the growth of graphene via chemical vapor deposition in vertical rotating disk reactor. Coatings 2023, 13, 1184. [Google Scholar] [CrossRef]
- Oyedotun, K.O.; Manyala, N. Graphene foam-based electrochemical capacitors. Curr. Opin. Electrochem. 2020, 21, 125–131. [Google Scholar] [CrossRef]
- Liu, S.; Wang, S.S.; Wang, H.; Lv, C.J.; Miao, Y.C.; Chen, L.; Yang, S.D. Gold nanoparticles modified graphene foam with superhydrophobicity and superoleophilicity for oil-water separation. Sci. Total Environ. 2021, 758, 143660. [Google Scholar] [CrossRef]
- Han, B.; Chen, H.Y.; Hu, T.; Ye, H.J.; Xu, L.X. High electrical conductivity in polydimethylsiloxane composite with tailored graphene foam architecture. J. Mol. Struct. 2020, 1203, 127416. [Google Scholar] [CrossRef]
- Zehri, A.; Samani, M.K.; Latorre, M.G.; Nylander, A.; Nilsson, T.; Fu, Y.F.; Wang, N.; Ye, L.L.; Liu, J. High porosity and light weight graphene foam heat sink and phase change material container for thermal management. Nanotechnology 2020, 31, 424003. [Google Scholar] [CrossRef] [PubMed]
- Fernández, J.; Bonastre, J.; Molina, J.M.; Cases, F. Enhancement of the Electrochemical Properties of an Open-Pore Graphite Foam with Electrochemically Reduced Graphene Oxide and Alternating Current Dispersed Platinum Particles. Coatings 2020, 10, 551. [Google Scholar] [CrossRef]
- Du, T.T.; Xiong, Z.X.; Delgado, L.; Liao, W.Z.; Peoples, J.; Kantharaj, R.; Chowdhury, P.R.; Amy, M.A.; Ruan, X.L. Wide range continuously tunable and fast thermal switching based on compressible graphene composite foams. Nat. Commun. 2021, 12, 4915. [Google Scholar] [CrossRef] [PubMed]
- Gao, J.S.; Xie, D.M.; Wang, X.W.; Zhang, X.; Yue, Y.N. High thermal conductivity of free-standing skeleton in graphene foam. Appl. Phys. Lett. 2020, 117, 251901. [Google Scholar] [CrossRef]
- Wei, C.Y.; Li, Y.; Song, J.L.; Cheng, J.X.; Tang, Z.F. Supercooling suppression and thermal conductivity enhancement of erythritol using graphite foam with ultrahigh thermal conductivity for thermal energy storage. Int. Commun. Heat Mass Transf. 2024, 153, 107392. [Google Scholar] [CrossRef]
- Khosravani, S.; Sadr, M.H.; Carrera, E.; Pagani, A.; Masia, R. Multi-scale analysis of thermal conductivity of graphene foam/PDMS composites. Mech. Adv. Mater. Struc. 2023, 1–13. [Google Scholar] [CrossRef]
- Zhao, Y.H.; Wu, Z.K.; Bai, S.L. Study on thermal properties of graphene foam/graphene sheets filled polymer composites. Compos. Part A Appl. Sci. Manuf. 2015, 72, 200–206. [Google Scholar] [CrossRef]
- Zhou, R.Y.; Lv, Y.X.; Du, T.T.; Bi, J.P. Numerical Investigation on Thermal Properties of Graphene Foam Composite for Thermal Management Applications. Materials 2024, 17, 3300. [Google Scholar] [CrossRef]
- Khalil, A.M.E.; Han, L.; Maamoun, I.; Tabish, T.A.; Chen, Y.; Eljamal, O.; Zhang, S.; Butler, D.; Memon, F.A. Novel Graphene-Based Foam Composite As a Highly Reactive Filter Medium for the Efficient Removal of Gemfibrozil from (Waste) Water. Adv. Sustain. Syst. 2022, 6, 2200016. [Google Scholar] [CrossRef]
- Rana, K.; Kaur, H.; Singh, N.; Sithole, T.; Singh, S.S. Graphene-based materials: Unravelling its impact in wastewater treatment for sustainable environments. Next Mater. 2024, 3, 100107. [Google Scholar] [CrossRef]
- Bindu, M.; Pradeepan, P. Graphene and its derivatives for air purification: A mini review. Results Eng. 2024, 21, 101809. [Google Scholar]
- Vishwanath, H.S.; Shilpa, M.P.; Gurumurthy, S.C.; Gedda, M.; Ramam, K.; Eshwarappa, K.M.; Kirana, R.; Mishra, N.N.; Mundinamani, S. Flexible, large-area, multi-layered graphene/ cellulose composite for dye filtration applications. Mater. Today Commun. 2022, 20, 103134. [Google Scholar]
- Zafari, M.; Panjepour, M.; Emami, M.D.; Meratian, M. Microtomography-based numerical simulation of fluid flow and heat transfer in open cell metal foams. Appl. Therm. Eng. 2015, 80, 347–354. [Google Scholar] [CrossRef]
- Nie, Z.W.; Lin, Y.Y.; Tong, Q.B. Numerical investigation of pressure drop and heat transfer through open cell foams with 3D Laguerre-Voronoi model. Int. J. Heat Mass Transf. 2017, 113, 819–839. [Google Scholar] [CrossRef]
- Lu, X.; Zhao, Y.; Zhang, Y.; Wu, M. Numerical Study on Fluid Flow Behavior and Heat Transfer Performance of Porous Media Manufactured by a Space Holder Method. Materials 2024, 17, 2695. [Google Scholar] [CrossRef]
- Yang, T.H.; Wang, Z.L.; Wang, H.; Yu, P.X.; Wang, Y. Numerical study of flow and heat transfer in a three-dimensional metal foam considering different direction micropores in skeleton structure. Int. Commun. Heat Mass Transfer. 2022, 134, 106052. [Google Scholar] [CrossRef]
- Yu, P.X.; Wang, Y.; Ji, R.T.; Wang, H.; Bai, J.Q. Pore-scale numerical study of flow characteristics in anisotropic metal foam with actual skeleton structure. Int. Commun. Heat Mass Transf. 2021, 126, 105401. [Google Scholar] [CrossRef]
- Xu, Q.; Wu, Y.; Chen, Y.; Nie, Z. Unlocking the Thermal Efficiency of Irregular Open-Cell Metal Foams: A Computational Exploration of Flow Dynamics and Heat Transfer Phenomena. Energies 2024, 17, 1305. [Google Scholar] [CrossRef]
- Zhang, Y.; Yang, F.; Yu, C.; Niu, Z.; Lu, P.; Zhang, Y.; Liu, J. Improved thermal properties of three-dimensional graphene network filled polymer composites. J. Electron. 2022, 51, 420–425. [Google Scholar] [CrossRef]
- Ingham, D.B.; Pop, I. Transport Phenomena in Porous Media; Elsevier: Amsterdam, The Netherlands, 1998. [Google Scholar]
- Sun, M.R.; Hu, C.Z.; Zha, L.G.; Xie, Z.Y.; Yang, L.; Tang, D.W.; Song, Y.C.; Zhao, J.F. Pore-scale simulation of forced convection heat transfer under turbulent conditions in open-cell metal foam. Chem. Eng. J. 2020, 389, 124427. [Google Scholar] [CrossRef]
- Della, A.; Montenegro, G.; Tabor, G.R.; Wears, M.L. CFD characterization of flow regimes inside open cell foam substrates. Int. J. Heat Fluid Flow 2014, 50, 72–82. [Google Scholar] [CrossRef]
- Sun, J.Z.; Nie, Z.W.; Chen, Y. Air flow and heat transfer characteristics in foam metal with high porosity. Adv. New Renew. Energy 2023, 11, 411–416. (In Chinese) [Google Scholar]


| Material | Density ρ (kg/m3) | Specific Heat Cp (J/kg·K) | Thermal Conductivity k (W/m·K) | Dynamic Viscosity μ (kg/m·s) |
|---|---|---|---|---|
| Air | 1.225 | 1006.43 | 0.0265 | 1.8 × 10⁻⁵ |
| Graphene | 2250 | 709 | 500 | - |
| Nickel | 8900 | 460.6 | 106 | - |
Disclaimer/Publisher’s Note: The statements, opinions and data contained in all publications are solely those of the individual author(s) and contributor(s) and not of MDPI and/or the editor(s). MDPI and/or the editor(s) disclaim responsibility for any injury to people or property resulting from any ideas, methods, instructions or products referred to in the content. |
© 2024 by the authors. Licensee MDPI, Basel, Switzerland. This article is an open access article distributed under the terms and conditions of the Creative Commons Attribution (CC BY) license (https://creativecommons.org/licenses/by/4.0/).
Share and Cite
Bi, J.; Zhou, R.; Lv, Y.; Du, T.; Ge, J.; Zhou, H. Numerical Simulation of Fluid Flow Characteristics and Heat Transfer Performance in Graphene Foam Composite. Coatings 2024, 14, 1046. https://doi.org/10.3390/coatings14081046
Bi J, Zhou R, Lv Y, Du T, Ge J, Zhou H. Numerical Simulation of Fluid Flow Characteristics and Heat Transfer Performance in Graphene Foam Composite. Coatings. 2024; 14(8):1046. https://doi.org/10.3390/coatings14081046
Chicago/Turabian StyleBi, Jinpeng, Rongyao Zhou, Yuexia Lv, Tingting Du, Juan Ge, and Hongyang Zhou. 2024. "Numerical Simulation of Fluid Flow Characteristics and Heat Transfer Performance in Graphene Foam Composite" Coatings 14, no. 8: 1046. https://doi.org/10.3390/coatings14081046