Article

The Evolution of Surfaces on Medium-Carbon Steel for Fatigue Life Estimations

by
Phanuphak Seensattayawong
* and
Eberhard Kerscher
Materials Testing (AWP), RPTU Kaiserslautern-Landau, 67663 Kaiserslautern, Germany
*
Author to whom correspondence should be addressed.
Coatings 2024, 14(8), 1077; https://doi.org/10.3390/coatings14081077
Submission received: 26 July 2024 / Revised: 12 August 2024 / Accepted: 13 August 2024 / Published: 22 August 2024
(This article belongs to the Special Issue Microstructure, Fatigue and Wear Properties of Steels, 2nd Edition)

Abstract

:
Early in fatigue life, fatigue cracks are often initiated at persistent slip bands (PSBs), which play the main role in surface evolution when the components are subjected to cyclic loading. Therefore, this paper aims to study the behavior of the surface development of medium-carbon steel, specifically 42CrMo4 (SAE 4140). Tests were conducted using tension–compression fatigue testing with stress amplitudes set at 30%, 40%, and 50% of the ultimate tensile strength (UTS); a load ratio of R = −1; and a frequency of f = 10 Hz. The ultimate number of test cycles was 2 × 10⁵. The fatigue test specimens with as-machined surface quality (Ra < 100 nm) were tested on a servo-hydraulic push–pull testing machine, and the tests were interrupted a few times to bring the specimens out for surface measuring with a confocal microscope. The linear roughness values of the arithmetic mean deviation (Ra), maximum height (Rz), maximum profile peak height (Rp), and maximum profile valley depth (Rv) were investigated and further used to determine the roughness evolution during cyclic loading (REC) by analyzing the inclinations of the fitting curves of roughness and number-of-cycles diagrams. REC could then be used to estimate and classify the fatigue lifetime.

1. Introduction

42CrMo4 (SAE 4140) steel is widely used for components in the automotive, aerospace, and marine industries since this steel exhibits high strength and reasonable ductility and toughness. Hence, this steel is popularly manufactured for crankshafts, axles, and other parts [1,2]. This steel has also been investigated from several points of view, including fatigue mechanisms, strength [1,3,4], and lifetime regime estimations [2], due to the fact that the most dominant failure mechanism of these components is fatigue failure [5]. Moreover, the reliability of parts has been considered and investigated to prevent failures due to fatigue cracks. In particular, life predictions still need to be improved to achieve a higher level of part reliability [6,7,8]. Recent measurements and models have been applied for monitoring crack initiation, predicting crack propagation, and estimating the lifetime regime [2,3,9,10,11,12,13,14]. Typically, there are three stages of fatigue due to cyclic loading: crack initiation, crack propagation, and final rupture. Most researchers have mentioned that dislocation rearrangement and local plastic strain deformation occur in the early stages of fatigue crack initiation [15,16,17]. Therefore, the early stages of crack initiation must be studied to understand the development of microstructures and surfaces. In a few studies, when specimens were subjected to cyclic loading, persistent slip bands (PSBs) were simultaneously generated due to the high plastic strain concentration created in the bands, which can appear at grain, twin, and phase boundaries [15,18,19]. Therefore, the cyclic plastic deformation due to the heterogeneity of the cyclic plastic strain in several PSBs acts as the major mechanism in the early stages of crack initiation. PSBs promote extrusions and intrusions that emerge not only on free surfaces but also on the grain boundaries as persistent slip markings (PSMs) [20,21,22,23]. Researchers have characterized microstructural changes, PSBs, and PSMs, as well as crack initiation, due to fatigue loading. Some groups of researchers have studied surface roughness alteration and confirmed that the developed surfaces were encouraged by the formation of PSBs and the emergence of PSMs [24]. Researchers have also utilized various measurements and observation techniques to explain the growth mechanisms of PSBs and PSMs in the early stages of fatigue crack initiation [11,22,23,25,26,27,28].
In this study, the surface roughness evolutions resulting from extrusions and intrusions promoted by PSBs during axial fatigue tests were determined and measured to conduct life estimations. The fatigue tests were carried out using a tension–compression testing machine. During the tests, 42CrMo4 specimens with as-machined surfaces (Ra < 100 nm) were periodically measured to determine surface roughness using a confocal microscope. Generally, in the study of PSM and PSB characterizations, the initial surfaces of the specimens need to be prepared with electropolishing to observe and confirm their formations on a microstructural scale [22,23]. In this study, the surfaces were prepared with regular machining and polishing processes because the prepared surfaces can represent the developed surface behavior of the actual fatigue components. Thus, the surface investigation conducted in this study was expected to display similar surface development behavior to that which is exhibited on the imperfect surfaces of the actual parts. The measured roughness of the specimens in the initial stages and the developed stages was plotted to calculate roughness evolution during cyclic loading (REC) to identify and classify fatigue lifetime. The following linear roughness parameters were considered: Ra (arithmetic mean deviation), Rz (maximum height), Rp (maximum profile peak height), and Rv (maximum profile valley depth). These parameters can provide general and valuable roughness information for surface investigations. In particular, Rp and Rv parameters can be used to represent the formation of extrusions and intrusions that develop during tests [26]. Moreover, these parameters can be measured using a profilometer machine, which is widely used in several industries and general surface measurement laboratories. They were useful in our approach as a guideline with which to compare the results and develop measuring methods to estimate the fatigue lifetime. Thus, the new approach provided in this study, based on roughness evolution during cyclic loading (REC), is a notable approach for determining and categorizing fatigue life estimations. However, other factors or roughness parameters (for example, the root mean square slope: Rdq) are also interesting for helping us to understand different aspects of the fatigue life estimation. We are currently conducting research in this direction to understand the surface development behavior of steel during cyclic loading. We are also trying to measure and investigate the surfaces of fatigue specimens with other devices to explore and understand additional factors that may be involved.

2. Materials and Methods

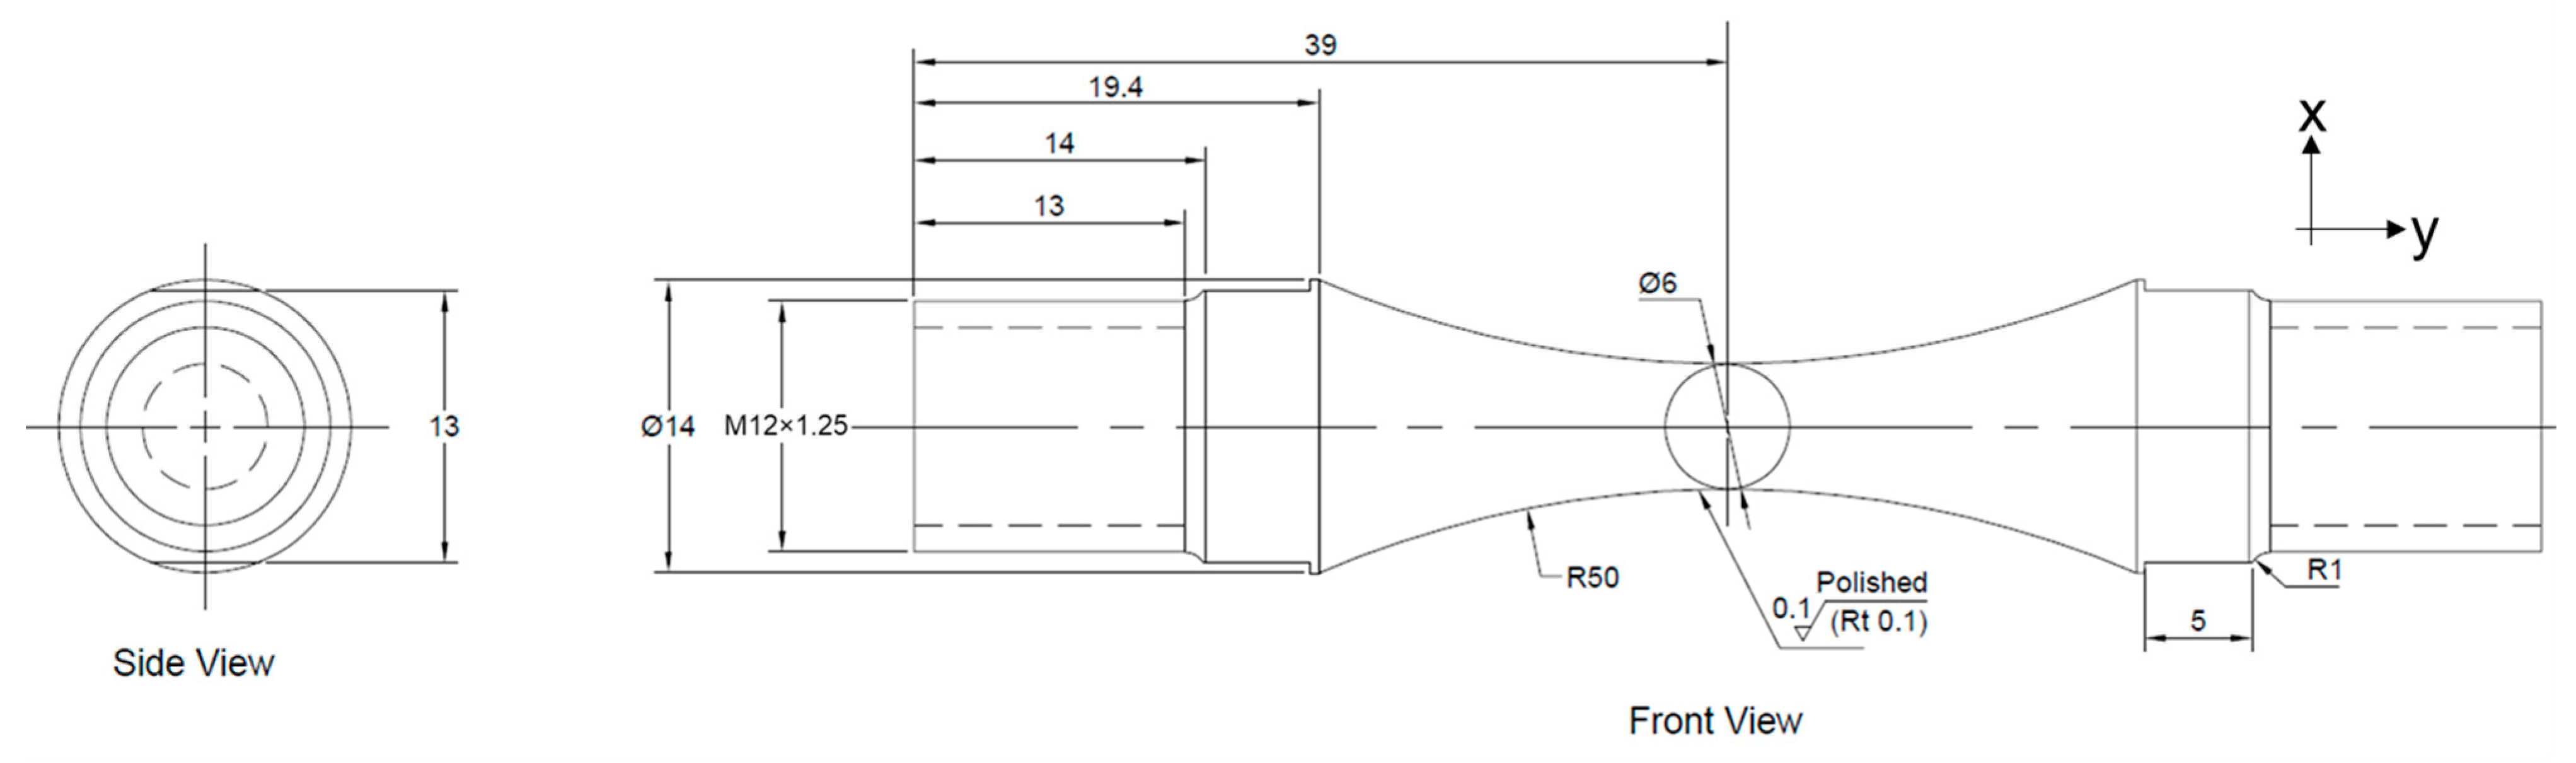
2.1. Material and Specimen Preparations

The test specimens were produced using the material 42CrMo4 (also known as SAE 4140) under as-supplied conditions, and the microstructure of tempered martensite was observed. Chemical compositions and mechanical properties are shown in Table 1. The test specimens were measured using universal hardness testing via a Vickers hardness scale, and the applied load was 10 kgf. Three measuring points on each specimen were measured to obtain the average hardness value. The ultimate tensile strength (UTS) was converted from an average hardness value using the hardness conversion table referred to as DIN 50,150 [29]. The fatigue specimens’ geometries were designed according to ASTM E466-15 [30], as shown in Figure 1. The coefficient of the notch factor at the gauge area is 1.004, which was calculated using (1) originally given in [31]. The specimens were manufactured in the University’s workshop via machining and polishing techniques; therefore, the surface quality of the specimens is called “as-machined” in this study. After the machining process, specimens were randomly selected for the tests.

2.2. Fatigue Test Setups

The fatigue tests were performed using a servo-hydraulic push–pull testing machine (SCHENCK-PSA, Darmstadt, Germany) with a capacity of 100 kN. The fatigue test frequency was 10 Hz, and the load ratio, R, was −1, which was calculated using (2). The stress amplitudes were 30% (358.5 MPa), 40% (478.0 MPa), and 50% (597.5 MPa) of the ultimate tensile strength (UTS), and they were calculated using (3). Based on several studies of surface relief and occurrences of PSMs during cyclic loading, one specimen at each tested stress amplitude was characterized regarding the surface development mechanisms generated by the formation of extrusions and intrusions [9,25,26,27]. Although we used only one specimen at each tested stress amplitude for our studies, several areas of concern needed to be analyzed. The tested specimens with low applied stress (30% of UTS), medium applied stress (40% of UTS), and high applied stress (50% of UTS) were labeled LAS30, MAS40, and HAS50, respectively. The tests were finished when an ultimate number of cycles (Nu) of 2 × 10⁵ was reached, and these specimens were designated as run-outs. During the fatigue testing, the tests were interrupted at 1 × 10³, 1 × 10⁴, 1 × 10⁵, and 2 × 10⁵ cycles. In the interrupted cycles, the surface roughness of the specimens was measured with a confocal microscope. Afterwards, the specimens were remounted on the fatigue testing machine for the tests with the next sequence of cycles.
α 1 = 1 + A t ρ k + B 1 + a ρ l a ρ 3 l 2 + C a ρ a ρ + t ρ 1 t ρ m 1 2
where α 1 is notch factor, and A, B, C, k, l, m, t, ρ , and a are 0.1, 1.6, 0.11, 0.55, 2.5, 1.5, 4 mm, 50 mm, and 3 mm, respectively, values that were used for the round specimen with a notch, the parameters of which were described in chapter 5.3 in [31].
R = σ min σ max
σ a = σ max σ min 2
where σ a ,   σ m i n ,   and   σ m a x   are stress amplitude, minimum applied stress, and maximum applied stress in MPa, respectively. R is the load ratio.

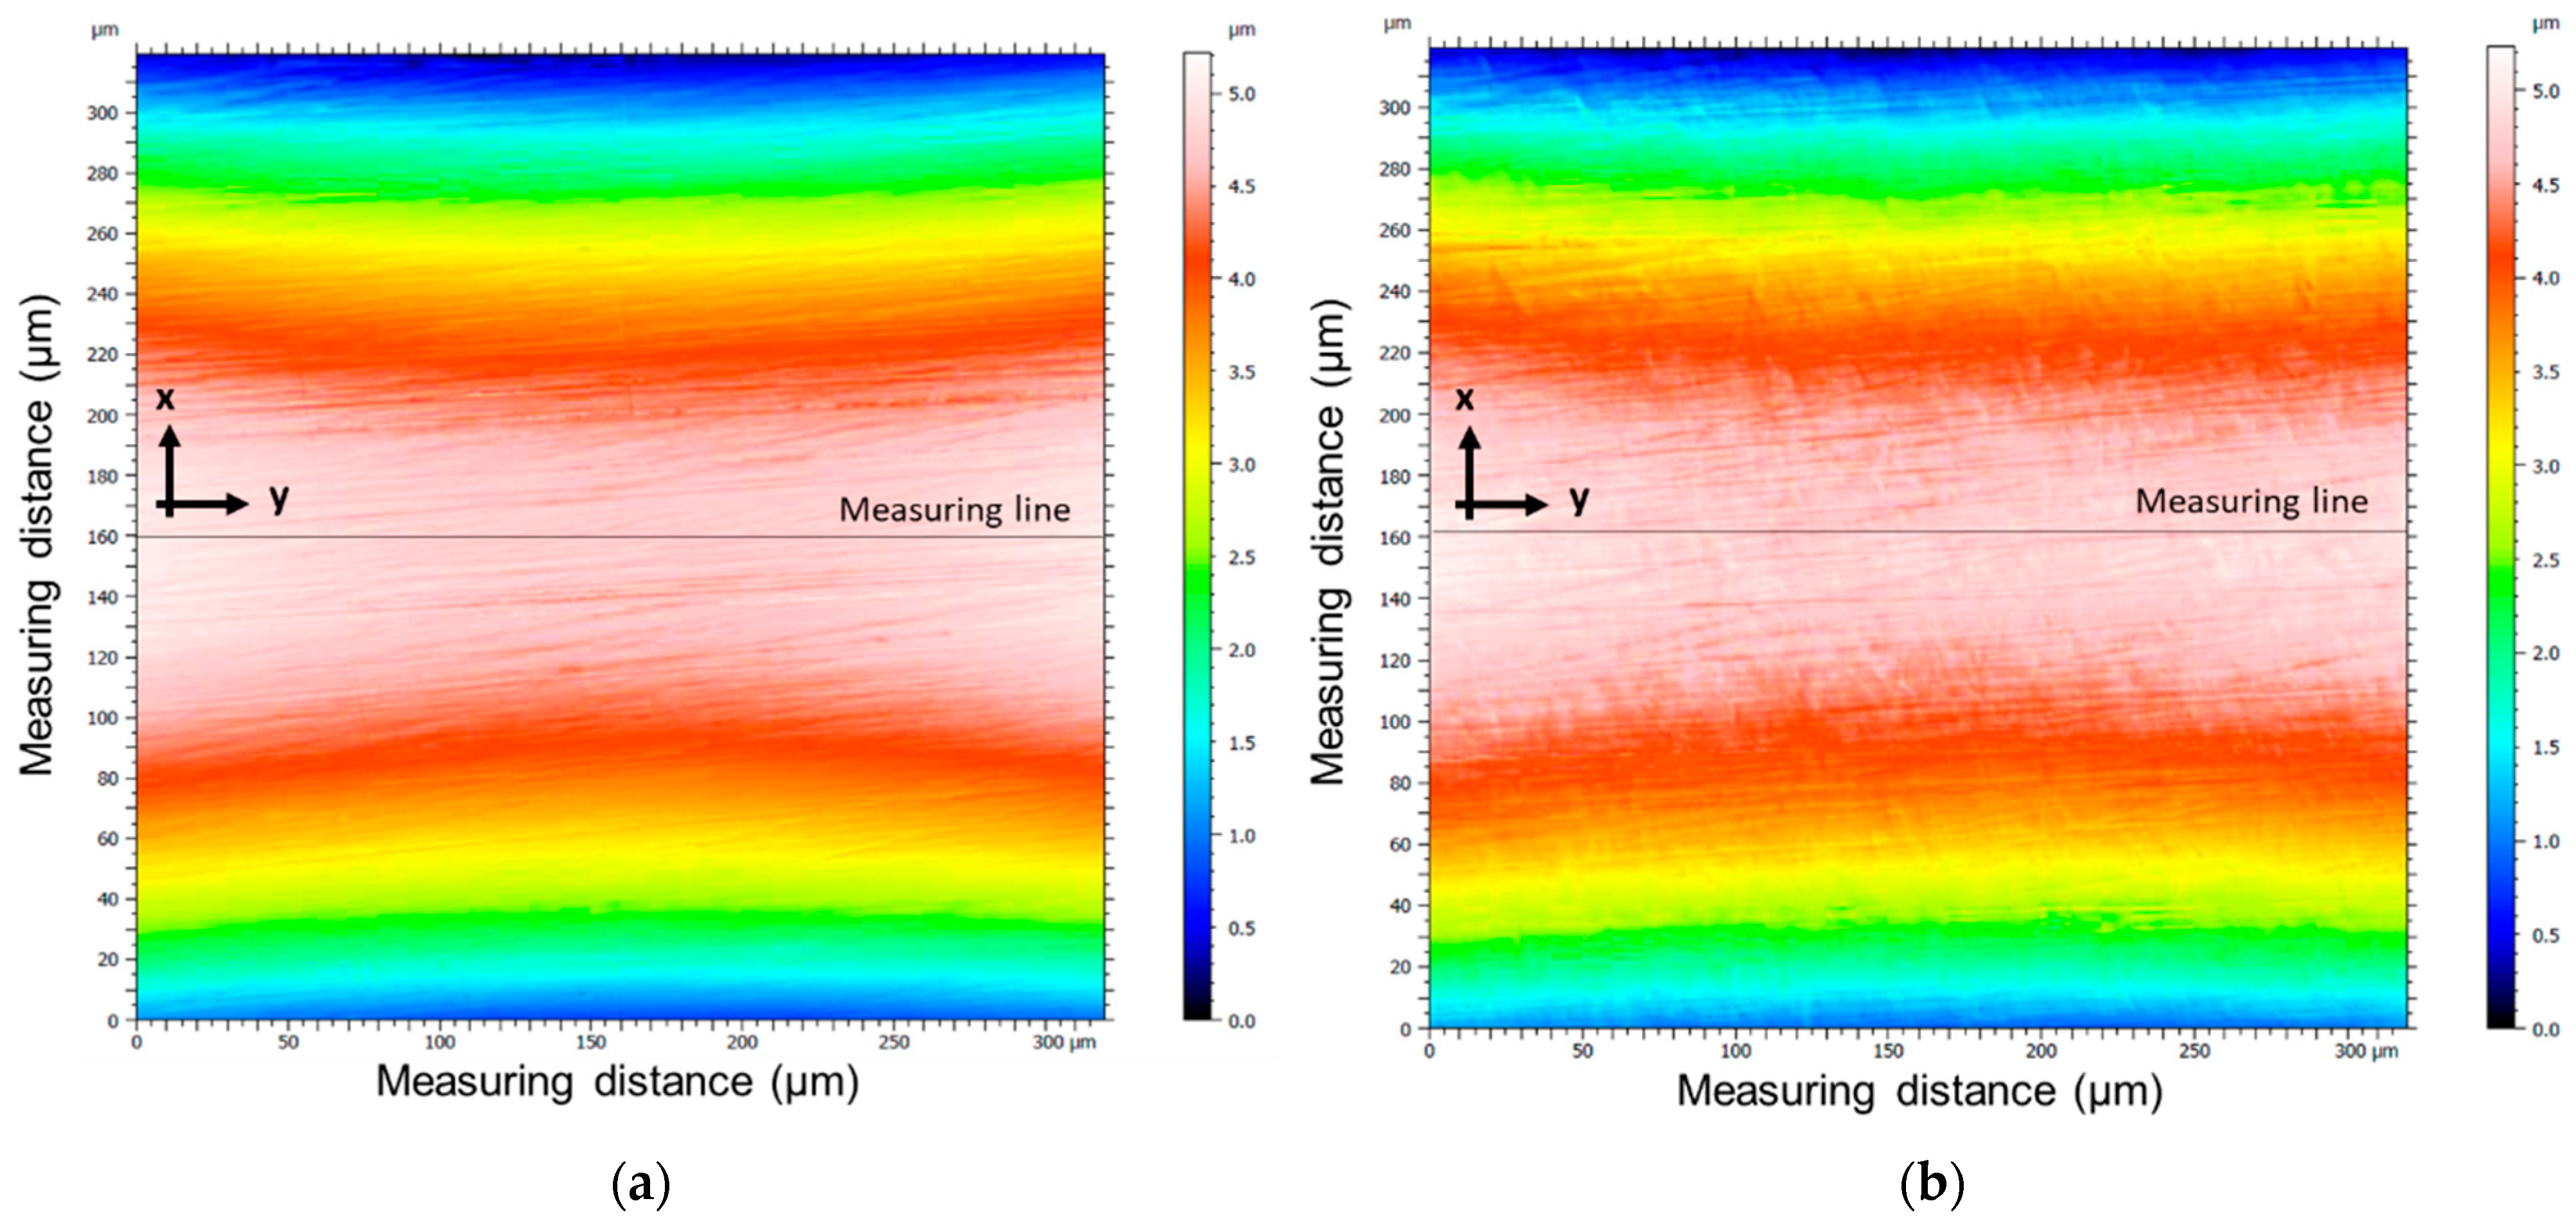
2.3. Surface Measurements

Due to the formation of PSMs on free surfaces, roughness is a factor that can be measured when the parts are subjected to cyclic loading. Moreover, roughness development caused by PSM formation also plays the main role in the early stages before fatigue cracks are initiated. The roughness parameters Ra, Rz, Rp, and Rv were determined and used to identify the roughness modification. The parameters Rp and Rv are employed to describe the formation of extrusions and intrusions.
To measure the initial and developed surfaces, the surface roughness of the specimens was measured using a confocal microscope: “Nanofocus-µsurf”. The surface roughness of cycled specimens was measured on the same four measured sides as measured on the initial surfaces (rotation angles: 0°, 90°, 180°, and 270°). Furthermore, on each side measured, the five cut lines on the y-axis at the gauge length areas were applied for linear profile roughness measurements. In addition, the roughness parameters Ra, Rz, Rp, and Rv were considered, and they were calculated using Equations (4), (5), (6), and (7), respectively, in reference to ISO DIN 4287: 2010 [32]. MountainMap Expert 8.0 was used to determine the roughness values, with 0.08 mm of S-filter (ʎs) and 2.5 µm of L-filter (ʎc).
  Ra = 1 L 0 L Z ( x ) d x
Rz = Rp + Rv
Rp = m a x ( Z ( x ) )
Rv = m i n   ( Z ( x ) )
where Ra is arithmetic mean deviation, Z(x) denotes ordinate values, L is sampling length, Rz is maximum height, Rp is maximum profile peak height, and Rv is maximum profile valley depth.

3. Results

Figure 2 shows the confocal topography images of the HAS50 specimen taken using Nanofocus (Oberhausen, Germany), and examples of the measuring cut lines on the y-axis (which is in the same direction as that for stress) are also displayed in the images. Figure 2a shows the initial surface (the as-machined surface), and Figure 2b shows the developed surface of the HAS50 specimen at 1 × 10³ cycles. Obviously, a significant change in the surface’s topography occurred. Figure 3 shows the linear surface roughness results obtained using the HAS50 specimen, Figure 3a shows the linear roughness in the initial stage, and Figure 3b shows the roughness of the developed surface at 1 × 10³ cycles. Both roughness results came from the same measuring area. The change on the surface was observed because the number of ordinate values Z(x) of linear roughness at 1 × 10³ cycles provided more points than the initial stage. It seems that the surface topography shown in Figure 3b has not changed, which means that the newly created peaks or valleys emerged in between the initial peaks and valleys. We assume that the extrusions and intrusions were created during the fatigue testing. However, no obvious evidence of extrusions and intrusions was obtained in this study because the initial surface quality was too rough. Moreover, the roughness also contained random peaks and valleys in the measured data. Thus, it is difficult to identify the appearance of extrusions and intrusions on the developed surface. The roughness results calculated using four measured sides with five cut lines on each measured side are reported as the maximum, minimum, and average values and shown in Table 2.
The LAS30 specimen was employed to measure the surfaces at the initial stage and after 1 × 10³, 1 × 10⁴, 1 × 10⁵, and 2 × 10⁵ cycles (N), which being marked as run-out specimens since it reached Nu (2 × 10⁵) without failure. Regarding the mean values of the LAS30 specimen, the Ra increased from 15.69 nm to 16.15 nm, Rz increased from 89.10 nm to 94.64 nm, Rp slightly increased from 46.79 nm to 47.47 nm, and Rv increased from 40.80 nm to 47.17 nm. All of the considered parameters increased as the number of cycles increased, although the changes in these parameters are tiny. At higher levels of stress amplitudes, MAS40 and HAS50 were used to determine the roughness at the initial stage (0 cycles) and after 1 × 10³ and 1 × 10⁴ (only for MAS40) cycles since the specimens of MAS40 and HAS50 broke at 27,240 cycles and 2078 cycles, respectively. At 40% and 50% of UTS as stress amplitudes, the surface roughness significantly changed during fatigue testing. As a result, the Ra, Rz, Rp, and Rv of the MAS40 specimen changed from 25.24 nm to 29.04 nm, 136.66 nm to 152.36 nm, 69.56 nm to 70.74 nm, and 67.10 nm to 81.62 nm, respectively. In addition, HAS50 presented significant changes in all parameters. The roughness changed from 40.08 nm to 46.62 nm for Ra, 218.81 nm to 275.54 nm for Rz, 98.99 nm to 138.53 nm for Rp, and 119.84 nm to 137.01 nm for Rv.
Figure 4, Figure 5, Figure 6 and Figure 7 show graphs of the roughness results for Ra, Rz, Rp, and Rv, respectively, versus the number of test cycles. HAS50 shows significant surface developments, and the specimen with the lowest stress amplitudes (LAS30) demonstrated only slightly different surface roughness values. The MAS40 specimen showed greater alteration of its surfaces than LAS30. Another attractive aspect of this study is the roughness evolution during cyclic loading (REC) of the considered linear roughness parameters. Regarding the purposes of this study, the slopes of the trending lines in Figure 4b, Figure 5b, Figure 6b and Figure 7b were focused on to investigate the effect of the development of surface roughness during cyclic loading on the different roughness parameters. The general form of the trending line equations is Ri = m × (lnN) + c, where Ri is the considered roughness parameter, m is an inclination value, N is the number of cycles, and c is a constant value. RECs are the inclination (m) of the fitted trend lines (the dashed lines in Figure 4, Figure 5, Figure 6 and Figure 7), which were addressed in the trendline equations. The RECs on Ra and Rz can be determined by referring to the dashed lines in Figure 4b and Figure 5b. The trendlines were estimated using the average values of the considered parameters. Consequently, the REC can describe the relationship between the developed surface roughness degrees at various numbers of cycles. The calculated RECs of the investigated roughness parameters are presented in Table 3. In this case, RECs are the individual slope values (m) for the different roughness parameters. The RECs in the equations confirmed that the specimen with the highest level of stress amplitude (HAS50) showed the highest values of RECs for all parameters. The REC of the Ra of the HAS50 specimen is +7.099 × 10⁻¹. On the other hand, the specimens with lower stress amplitudes presented the lower RECs for Ra, namely, +0.9 × 10⁻¹ (LAS30) and +3.7 × 10⁻¹ (MAS40). Regarding the Rz results, the RECs of the LAS30, MAS40, and HAS50 specimens are +9.346 × 10⁻¹, +17.514 × 10⁻¹, and +61.594 × 10⁻¹, respectively.
In previous studies on PSBs analyzed through the appearance of extrusions and intrusions, Rp and Rv were used to represent the development of extrusions and intrusions on the analyzed specimens’ surfaces during cyclic loading [26]. Figure 6 shows a graph of the Rp results versus the number of tested cycles, and the Rv results are shown in Figure 7. The REC of LAS30 regarding Rp (extrusions) does not definitively indicate an alteration since the REC for Rp has an extremely low value (+2.261 × 10⁻¹). In contrast, the Rv results for LAS30 reveal a slightly higher value of REC (+8.15 × 10⁻¹) than the REC of Rp. Regarding the results concerning the Rp and Rv of LAS30, the formation of intrusions is the dominant surface development behavior. The surface development behavior for the LAS30 specimen also presented on the MAS40 specimen because the REC of MAS40 with respect to Rp is lower than the REC regarding Rv, with values of +3.474 × 10⁻¹ and +14.04 × 10⁻¹, respectively. Nevertheless, HAS50 yielded an REC for Rp result of +42.933 × 10⁻¹, which is a significantly higher value than the REC for Rv (+18.63 × 10⁻¹). Thus, the surface development behavior for the HAS50 specimen is dominated by the appearance of extrusions. All the RECs of the considered parameters are summarized in Table 3.

4. Discussion

The surfaces of the specimens changed during fatigue testing, and the surface roughness was measured using a confocal microscope to confirm the surface roughness evolution. Moreover, the roughness evolution of the specimens at several applied stress amplitudes might correlate with the lifetime. The LAS30 specimen showed only a slight difference in regard to the developed surfaces. Nevertheless, an alteration could be observed and described as the REC, which was developed in this study, showing positive results, as given in Table 3. The results for the LAS30 specimen at 2 × 10⁵ cycles show more shrinkage than the earlier stages because of the scattering of the measured values. As in [26], the extrusions and intrusions could be investigated by analyzing the Rp and Rv results. The extrusions and intrusions were expected to be generated by the dislocation arrangement behavior during cyclic plastic strains in the PSBs because the PSBs can emerge on free surfaces as PSMs [18,20,22,23,33]. The PSMs on the surfaces can be detected and determined through surface roughness measurements [26,27,28]. For the LAS30 and MAS40 specimens, the RECs for Rv indicate a higher value than the RECs for Rp, which means that the intrusions can be assumed to be the dominant behavior for surface development at low and medium stress amplitudes. In contrast, the specimen with the highest level of stress amplitude (HAS50) presents a different behavior since the REC for Rp has a higher value than the Rv. Hence, the development of extrusions might be the dominant behavior. According to previous research, a high level of stress amplitude can produce larger PSBs and higher PSMs [26].
Regarding the Wöhler curve and our results, the specimens of MAS40 and HAS50 have a short fatigue life, and they can be considered to have finite life. The LAS30 specimen exhibited a longer fatigue life, which is designated as infinite life [34]. Based on the fatigue limit calculation determined using hardness (1.6 HV) [35], the MAS40 and LAS30 specimens should be considered to have infinite fatigue life since the fatigue strength estimated according to the hardness is higher than the applied stress. Nevertheless, there are several factors that can influence the fatigue strength of materials, for example, microstructure, surface roughness, inclusion size, surface defects, etc. [34,35,36,37,38]. Hence, according to our investigations, we confirmed that the MAS40 and HAS50 specimens underwent plastic strain deformation during the fatigue tests. Moreover, the surface modifications promoted by extrusions and intrusions confirmed that the local plastic strain in the surface grains was generated during cyclic loading [18,21,34]. For the LAS30 specimen, surface changes were detected, although the changes were not significant and the specimen was a run-out. Thus, we can assume that local plastic strain also developed on the LAS30 specimen even though it was only generated at a minute degree. Moreover, the LAS30 specimen might fail at a higher number of cycles (N) than the number we tested, and then cracks might form after a significantly higher number of cycles at the surface, at inclusions, or at inner defects [36,37,39]. Therefore, the results for the LAS30 specimen confirm that although the specimen can undergo high-cycle-fatigue (HCF) or very-high-cycle-fatigue (VHCF) regimes, surface development is still a measurable factor in the low-cycle-fatigue (LCF) regime.
As mentioned above, the surface roughness of all specimens altered during cyclic loading. However, the roughness development for the LAS30 and MAS40 specimens was selected to explain the roughness modification because the specimens presented fluctuating results (an increase, a steady period, and a decrease). The measured surface behavior and assumed modification behavior of the LAS30 and MAS40 specimens are illustrated in Figure 8. Three assumptions (cases A, B, and C) were made regarding the types of surface modifications that would occur on the surfaces. According to case A, the initial roughness developed would be deeper and higher in valleys and peaks, respectively; this hypothesis was used to explain the results regarding the change in roughness with an increase in Ra, Rz, Rp, and Rv. On the other hand, some results exhibit a decrease in these parameters, as given in case B. The phenomenon of case B was found after the occurrence of case A. This means that the surface change of case B was a continuation of the development from case A. In case B, the extrusions and intrusions possibly formed between the previous peaks and valleys from case A. Comparing the development of the profiles in Figure 2 and Figure 3 reveals a case B behavior, and the corresponding results can support our assumptions: the decrease in roughness over the specimen’s lifetime is an effect of the shorter distance between neighboring peaks and valleys (case B in Figure 8). Moreover, the steepness of the extrusion peaks was rearranged and reformed, and this can be used to explain the decrease in Ra, Rz, and Rp. The influence of spread-out or scattered measured values mixed with case-B behavior reflected case-C behavior. However, further studies related to the occurrence of extrusions and intrusions on a rough surface are still required to confirm the surface modification behaviors.
However, we could not ensure the occurrence of PSMs on the surfaces because the surface quality at the initial stages was too rough, and random peaks and valleys regarding the roughness were observed. Hence, the verification of PSMs on the developed surfaces using the observation techniques is still complicated, although the RECs of HAS50 exhibit significant alterations.
The slope values in the equations (as mentioned in Table 3) were named roughness evolution during cyclic loading (REC). The RECs of the run-out specimen (LAS30) showed lower values than those of the failed specimens (MAS40 and HAS50). Figure 9 shows a graph of the plotted RECs of the investigated parameters versus different levels of stress amplitudes. The dashed lines given in Figure 9 are the reasonable trend lines for the REC estimation. Since we expected that the surface roughness development encouraged the formation of extrusions and intrusions at the low stress amplitude, it was not possible to measure significant changes. The dependency of RECs on the levels of stress amplitudes is presented in the equations, and the reliability of the dependency is given in Table 4. The reliability of the trendline of the REC of the Rv parameter is 96.80%, which is the highest value of reliability. Thus, the REC of the Rv parameter seems to be appropriate for REC growth estimations. Furthermore, the growth of extrusions and intrusions was represented by the RECs of the Rp and Rv parameters that were investigated to identify the dominant behavior on the developed surfaces. In particular, intrusions were reported in several studies to be the major cause of fatigue crack initiation [18,22,26]. Hence, the relation equation of Rv given in Table 4 could be used to calculate the REC of the Rv for fatigue life estimations and categorizations. Another interesting aspect, as shown by the green and blue dashed lines, are the trend lines of Rp and Rv, which reveal that the RECs of the surfaces with a lower stress amplitude than approximately 550 MPa (denoted by the arrow in Figure 9) are dominated by intrusion formation. On the other hand, for the specimen with a stress amplitude higher than 550 MPa, the extrusions will play the main role in the formation of the roughness of the investigated surfaces.

5. Conclusions

This study on roughness evolution during cyclic loading (REC) on 42CrMo4 (SAE 4140) during push–pull fatigue tests with different stress amplitudes for fatigue lifetime estimations can be summarized as follows:
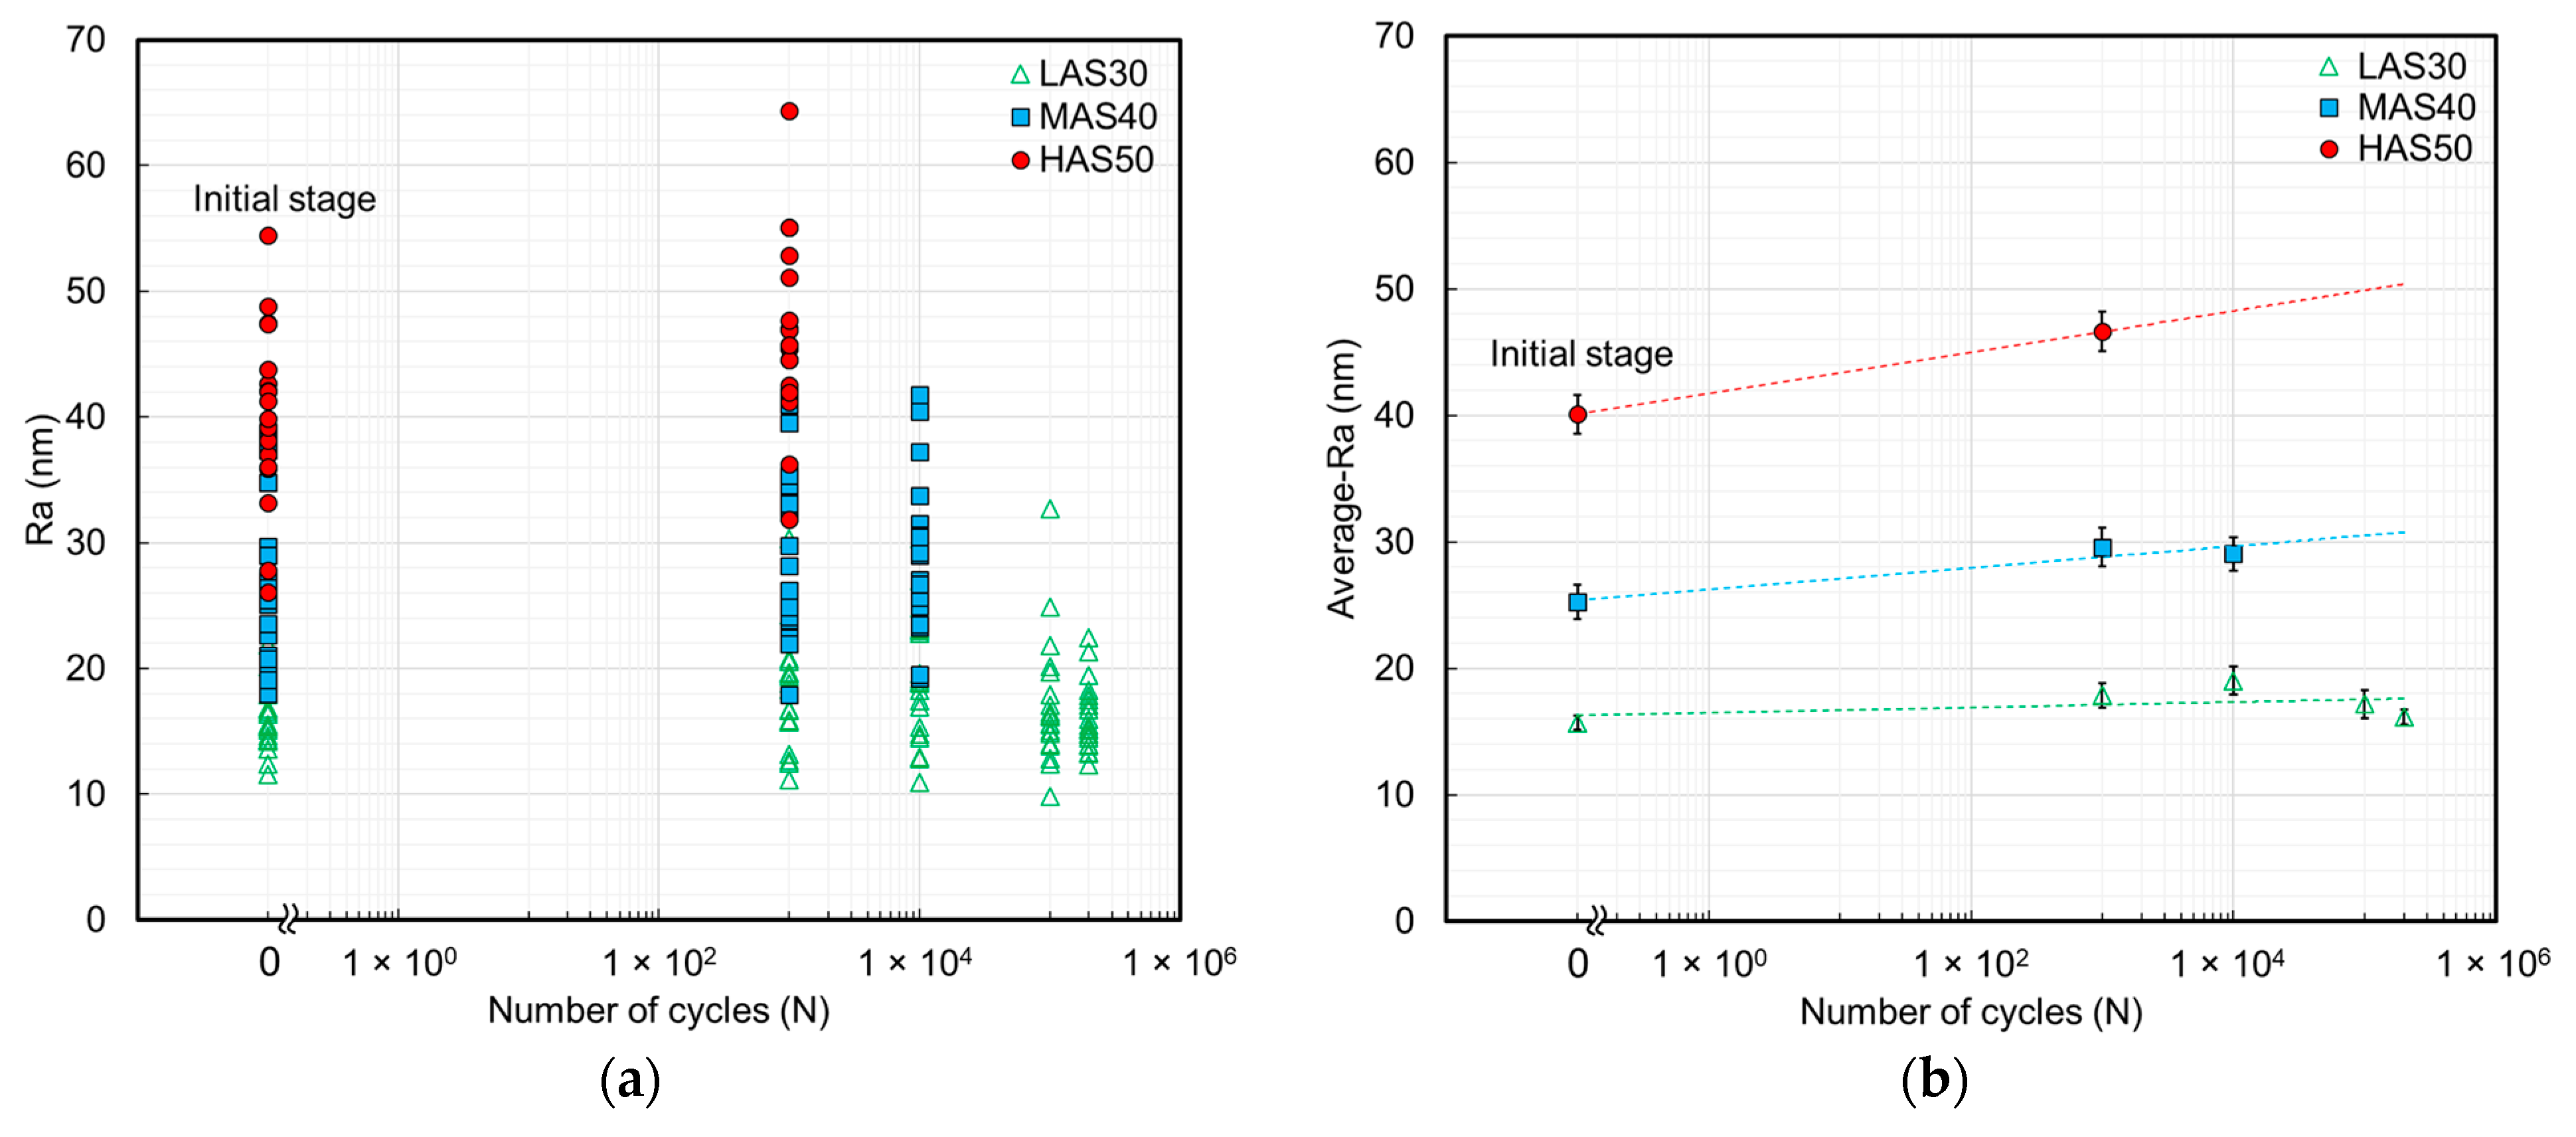
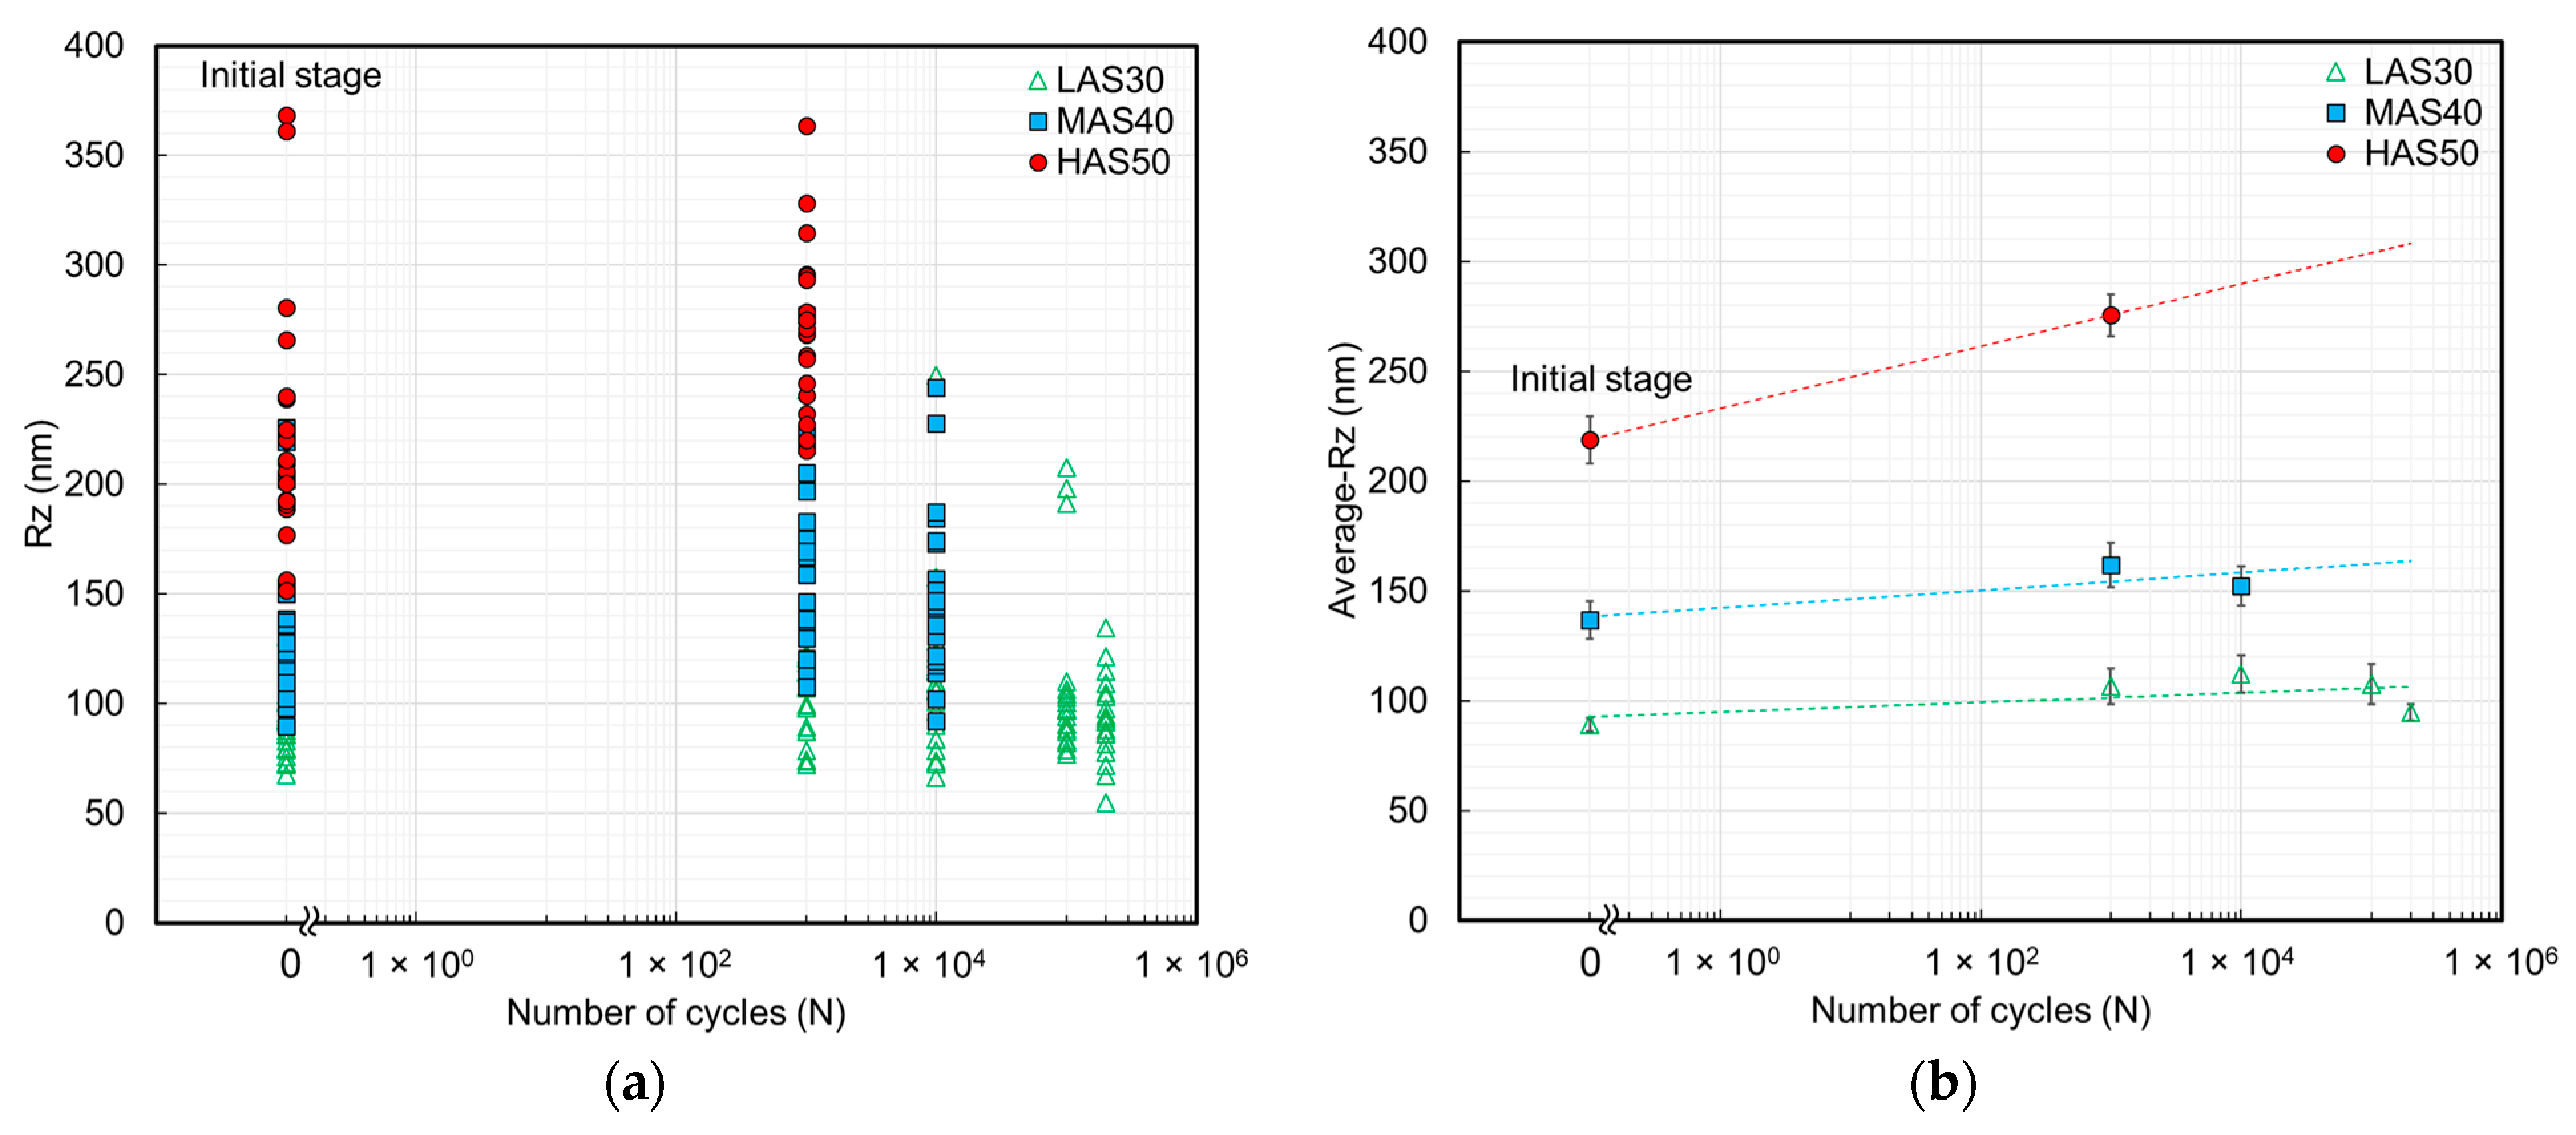
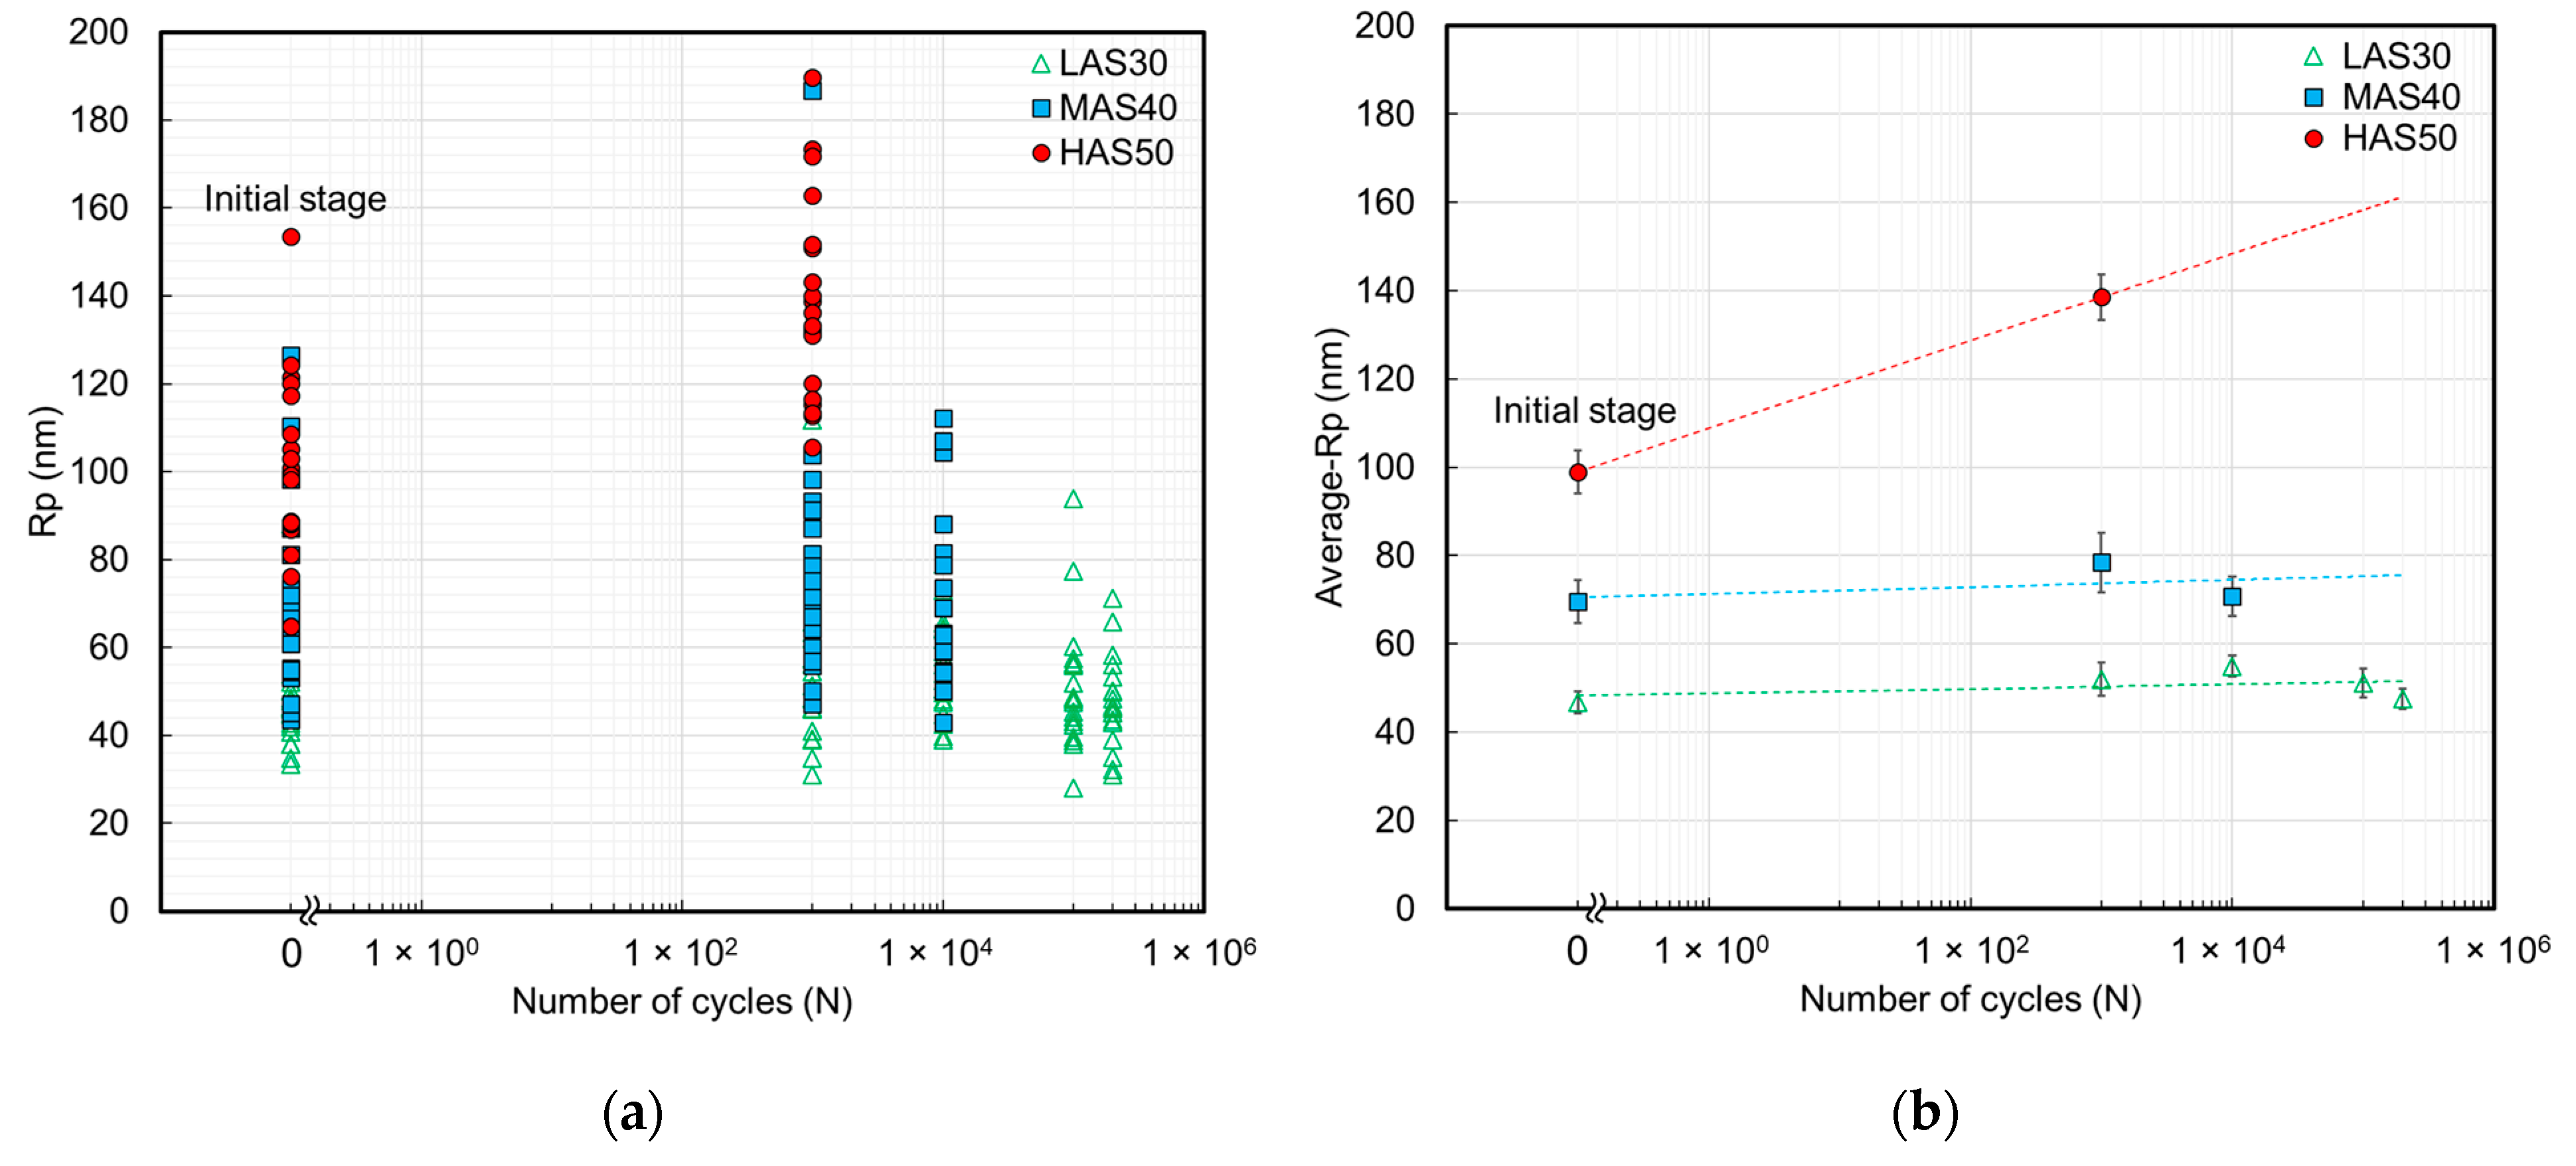
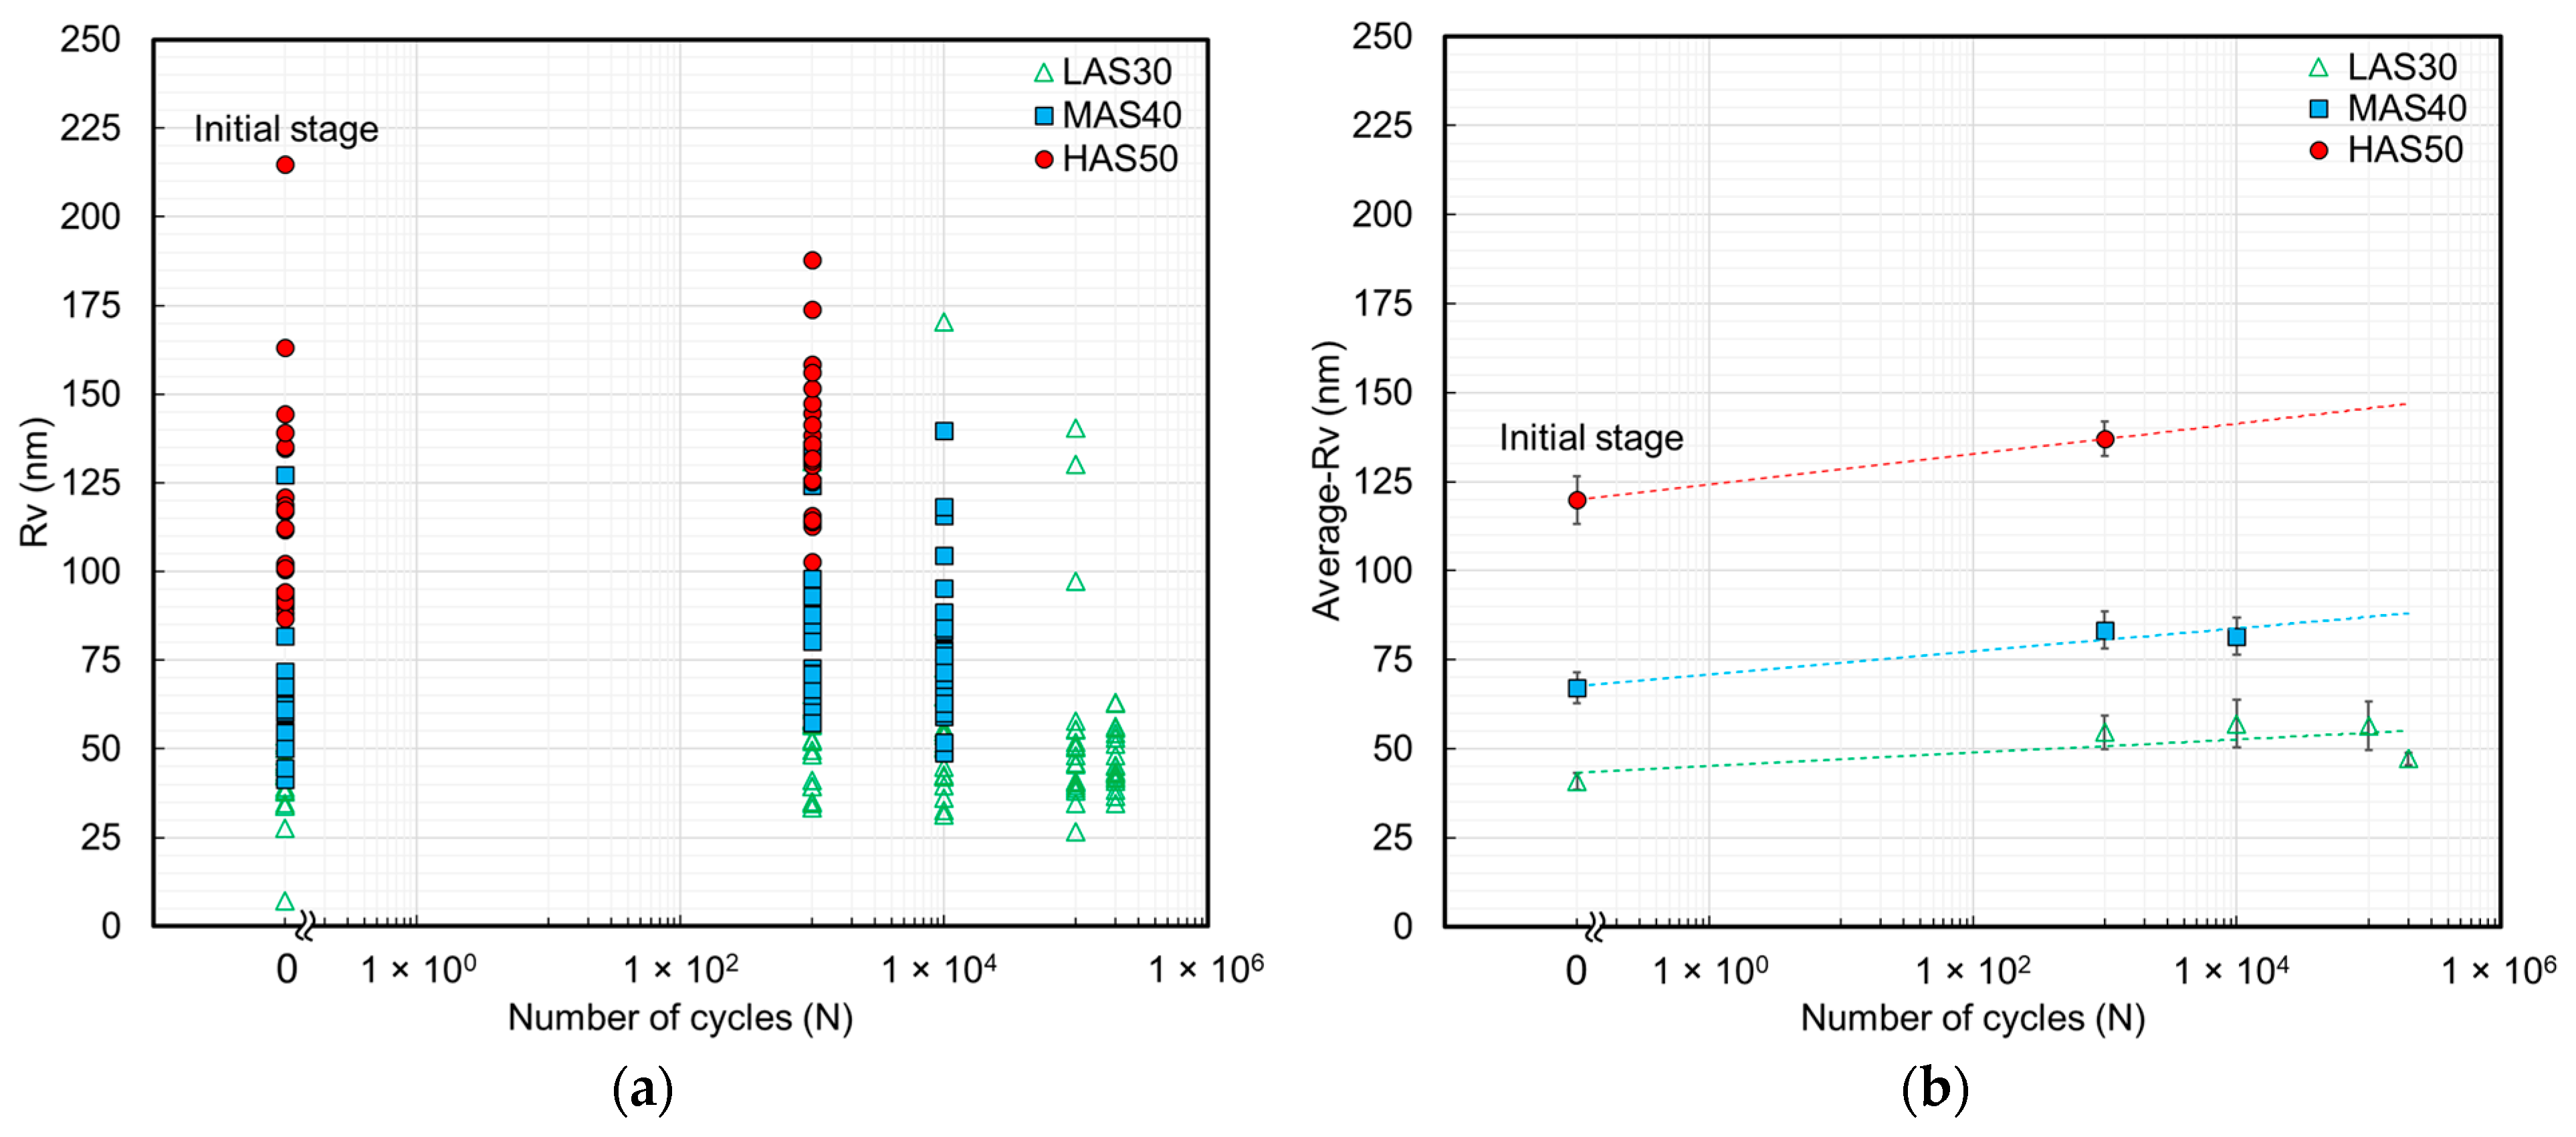
  • Using 40% (MAS40) and 50% (HAS50) of UTS as stress amplitudes, the specimens were tested until failure, which revealed significant changes in their Ra, Rz, Rp, and Rv values. However, for the LAS30 specimen (the run-out specimen), surface roughness development was observed even with a small amount of alteration.
  • Regarding the HAS50 specimen, the RECs exhibited higher values than the specimens subjected to lower stress amplitudes.
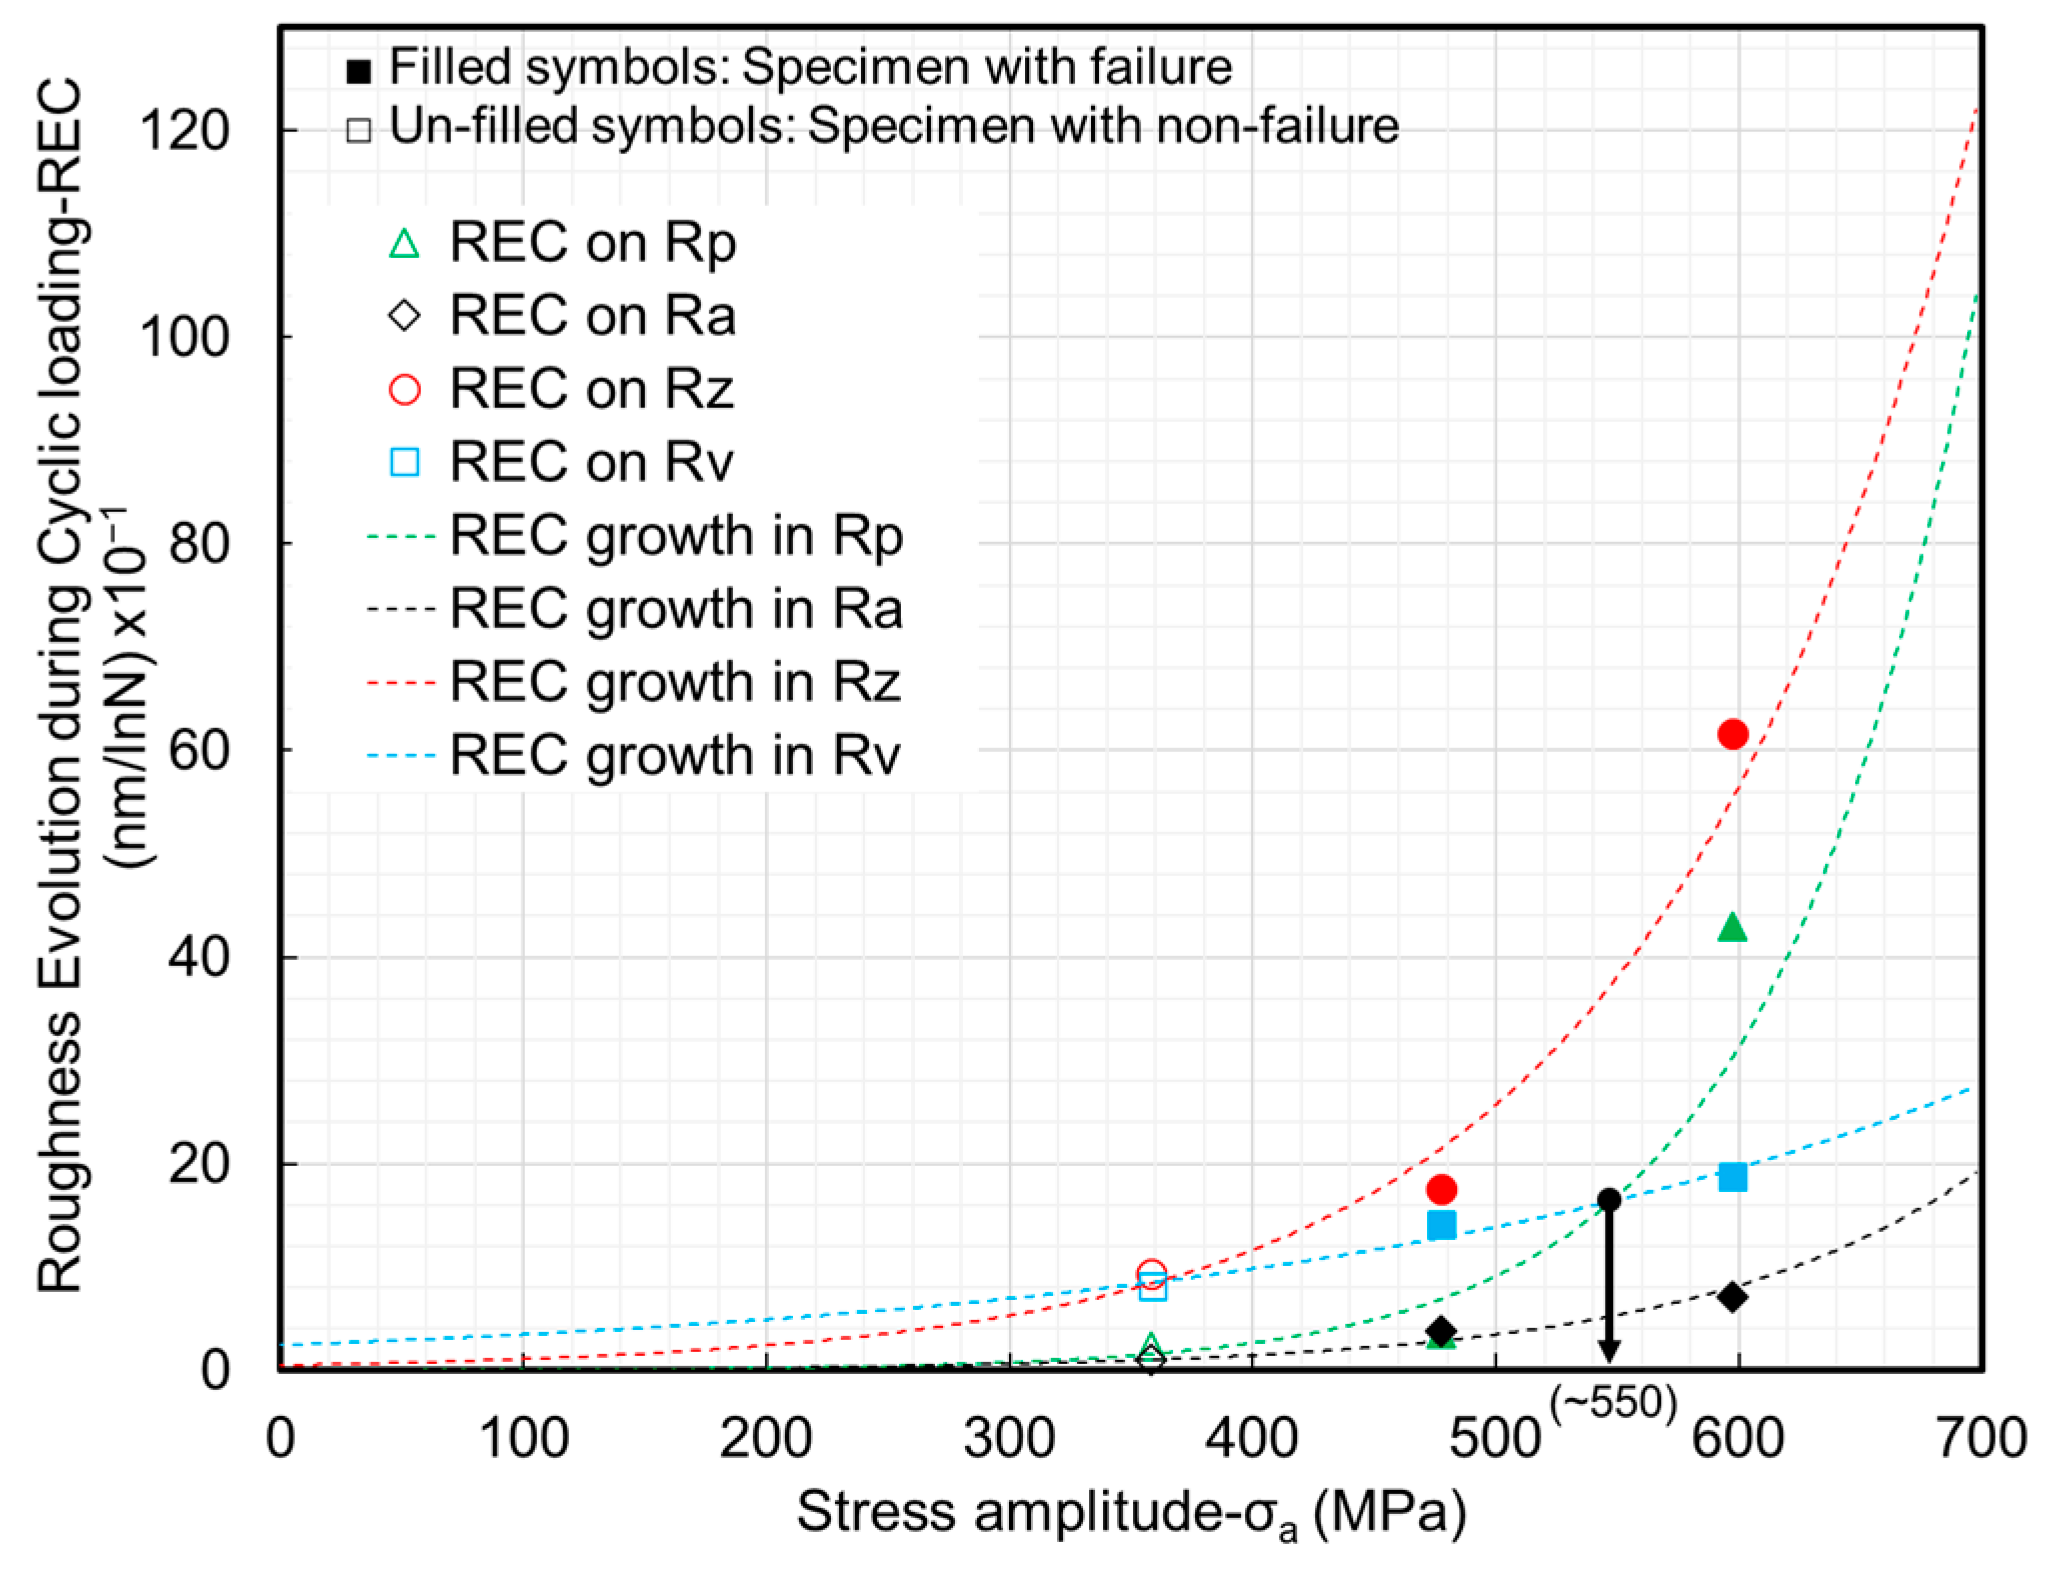
  • The surface roughness of the tested specimens was completely enhanced by increasing the stress amplitude, and the evidence to confirm its effect is the increase in inclinations (RECs).
  • The PSBs were more readily generated by higher than lower stress amplitudes.
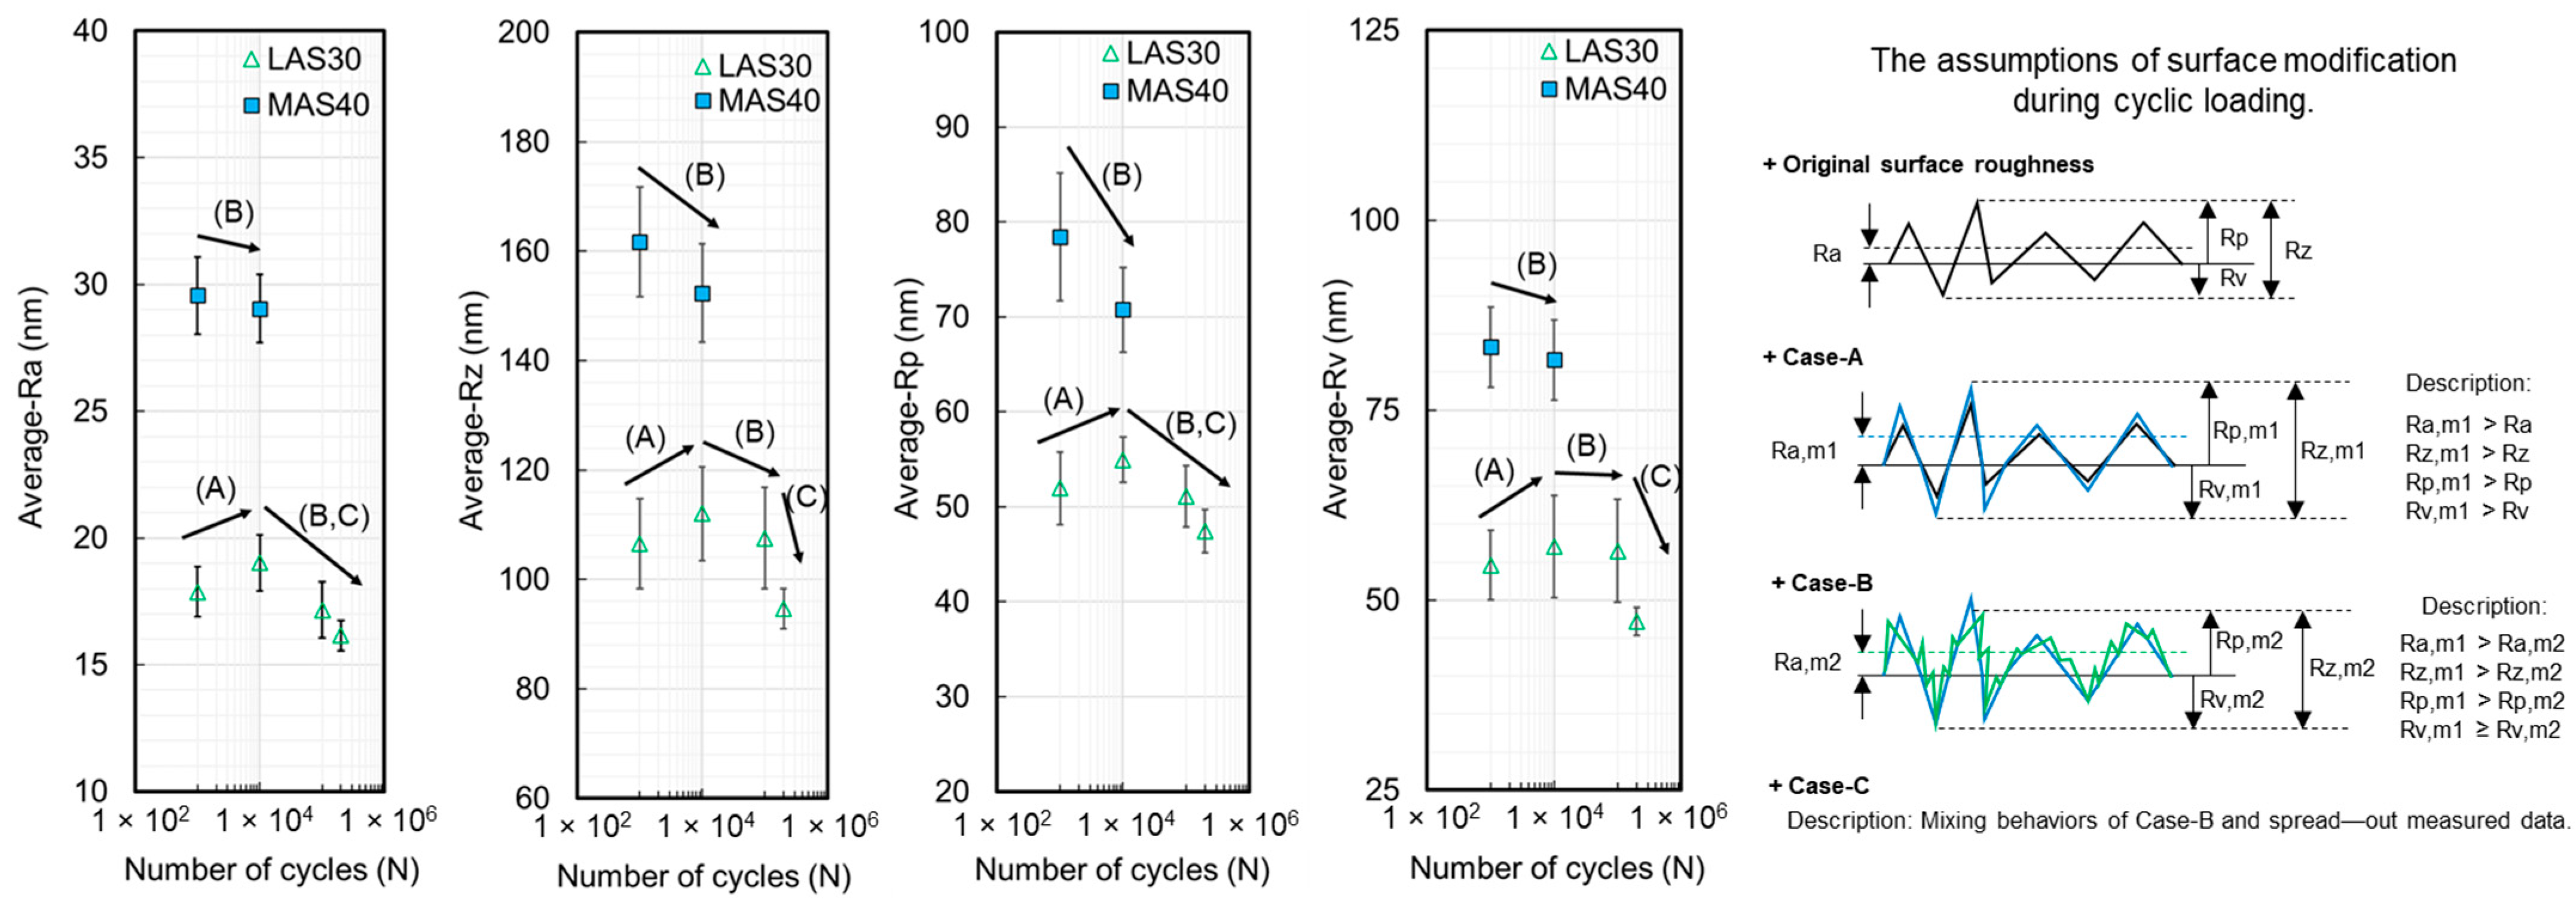
  • The specimens with a finite fatigue life (MAS40 and HAS50) revealed significant surface development, which means that the local plastic strain completely formed on the surface grains.
  • Although the LAS30 specimen was designated as having infinite fatigue life in this study, the roughness modification results confirmed that local plastic strain could have been generated, which can modify the specimen surfaces in the LCF regime.
  • The REC of Rv (intrusions) indicated that the dominant behavior on the developed surfaces at stress amplitudes lower than 550 MPa was the formation of intrusions. But at higher stress levels, Rp (extrusions) served as the main surface development behavior.
The limitations of this study are the rough specimen surfaces in the initial stages; thus, the characterization of extrusions and intrusions was complicated. Therefore, the authors would like to note that the surface quality of tested specimens in the initial stages is an important issue for the PSB and PSM verification. Hence, a smoother surface quality of tested specimens in the initial stages is required for the characterization of PSMs. Moreover, a new surface measurement technique should also be used to obtain new insights into extrusion and intrusion investigation.

Author Contributions

Conceptualization, P.S. and E.K.; methodology, P.S. and E.K.; formal analysis, P.S. and E.K.; investigation, P.S.; writing—original draft preparation, P.S.; writing—review and editing, E.K.; supervision, E.K. All authors have read and agreed to the published version of the manuscript.

Funding

This research received no external funding.

Institutional Review Board Statement

Not applicable.

Informed Consent Statement

Not applicable.

Data Availability Statement

Data are contained within the article.

Acknowledgments

The authors would like to thank the Royal Thai Government’s Scholarships for funding one of the authors (Phanuphak Seensattayawong) and the Institute for Measurement and Sensor Technology (MTS) at RPTU Kaiserslautern-Landau for aiding in the use of the roughness measuring devices.

Conflicts of Interest

The authors declare no conflicts of interest.

Nomenclature

α 1 coefficient of notch factor
A, B, C, k, l, mmaterial constant values for round specimens with a notch
tnotch thickness
ρ notch radius
aradius of the diameter of gauge length
kNkilonewton
MPamegapascal
nmnanometer
µmmicrometer
Riconsidered roughness parameter
Raarithmetic mean deviation
Rzmaximum height
Rpmaximum profile peak height
Rvmaximum profile valley depth
Z(x)ordinate value
Lroughness sampling length
∂Ra/∂ln(N)roughness/number of cycles rate
σminminimum stress
σmaxmaximum stress
σastress amplitude
Rload ratio
ffatigue test frequency
Nnumber of cycles
Nuultimate number of cycles
R2coefficient of determination
HVVickers hardness
UTSultimate tensile strength
LCFlow cycle fatigue
HCFhigh cycle fatigue
VHCFvery high cycle fatigue
PSBpersistent slip band
PSMpersistent slip mark
RECroughness evolution during cyclic loading
LAS30specimen with a stress amplitude of 30% of ultimate tensile strength
MAS40specimen with a stress amplitude of 40% of ultimate tensile strength
HAS50specimen with a stress amplitude of 50% of ultimate tensile strength
ASTMAmerican Society for Testing and Materials
DINDeutsches Institut für Normung e. V.
SAESociety of Automotive Engineers
ISOInternational Organization for Standardization

References

  1. Bartošák, M.; Horváth, J.; Španiel, M. Isothermal low-cycle fatigue and fatigue-creep of a 42CrMo4 steel. Int. J. Fatigue 2020, 135, 105538. [Google Scholar] [CrossRef]
  2. Kreethi, R.; Sivateja, C.; Mondal, A.K.; Dutta, K. Ratcheting life prediction of quenched–tempered 42CrMo4 steel. J. Mater. Sci. 2019, 54, 11703–11712. [Google Scholar] [CrossRef]
  3. Görzen, D.; Ostermayer, P.; Lehner, P.; Blinn, B.; Eifler, D.; Beck, T. A New Approach to Estimate the Fatigue Limit of Steels Based on Conventional and Cyclic Indentation Testing. Metals 2022, 12, 1066. [Google Scholar] [CrossRef]
  4. Di Marzo, M.; Tomassi, A.; Placidi, L. A Methodology for Structural Damage Detection Adding Masses. Res. Nondestruct. Eval. 2024, 35, 172–196. [Google Scholar] [CrossRef]
  5. Qiu, B.; Lan, T.; Ji, X.; Lei, H.; Zhang, S. Optimizing fatigue life prediction of high strength bolts in bolted spherical joints. J. Constr. Steel Res. 2024, 217, 108635. [Google Scholar] [CrossRef]
  6. Xu, Y.; Li, X.; Zhang, Y.; Yang, J. Ultra-Low Cycle Fatigue Life Prediction Model—A Review. Metals 2023, 13, 1142. [Google Scholar] [CrossRef]
  7. Li, K.-S.; Yao, S.-L.; Cheng, L.-Y.; Wang, R.-Z.; Sun, L.; Gu, H.-H.; Wang, J.; Lu, T.-W.; Zhang, C.-C.; Zhang, X.-C.; et al. Creep-fatigue life prediction of notched structure after an advanced surface strengthening treatment in a nickel-based superalloy at 650 °C. Int. J. Plast. 2024, 173, 103861. [Google Scholar] [CrossRef]
  8. Gao, C.; Pang, J.; Hu, D.; Li, S.; Qi, K.; Wang, B.; Zhang, Y.; Nie, L.; Yang, M.; Zhang, Z. A new method for predicting the fatigue strength at various stress ratios based on damage of metallic materials. Fatigue Fract. Eng. Mat. Struct. 2024, 47, 2103–2126. [Google Scholar] [CrossRef]
  9. Cretegny, L.; Saxena, A. Evolution of surface deformation during fatigue of PH 13-8 Mo stainless steel using atomic force microscopy. Fatigue Fract. Eng. Mat. Struct. 2002, 25, 305–314. [Google Scholar] [CrossRef]
  10. Bjørheim, F.; Siriwardane, S.C.; Pavlou, D. A review of fatigue damage detection and measurement techniques. Int. J. Fatigue 2022, 154, 106556. [Google Scholar] [CrossRef]
  11. Gonchar, A.V.; Kurashkin, K.V.; Andreeva, O.V.; Anosov, M.S.; Klyushnikov, V.A. Fatigue life prediction of structural steel using acoustic birefringence and characteristics of persistent slip bands. Fatigue Fract. Eng. Mat. Struct. 2022, 45, 101–112. [Google Scholar] [CrossRef]
  12. Sharma, D.; Singh, I.V.; Kumar, J.; Ahmed, S. Microstructure based fatigue life prediction of polycrystalline materials using SFEM and CDM. Int. J. Fract. 2024, 247, 265–284. [Google Scholar] [CrossRef]
  13. Gao, H.; Zhan, J.; Yu, B.; Li, W.; Lin, Z.; Shang, H. Multi-scale characterization of fatigue crack tip deformation and propagation in QP steel. Mater. Charact. 2024, 210, 113822. [Google Scholar] [CrossRef]
  14. Mehdizadeh, M.; Haghshenas, A.; Khonsari, M.M. In-situ Technique for Fatigue Life Prediction of Metals Based on Temperature Evolution. Int. J. Mech. Sci. 2021, 192, 106113. [Google Scholar] [CrossRef]
  15. Fourel, L.; Noyel, J.-P.; Bossy, E.; Kleber, X.; Sainsot, P.; Ville, F. Towards a grain-scale modeling of crack initiation in rolling contact fatigue—Part 2: Persistent slip band modeling. Tribol. Int. 2021, 163, 107173. [Google Scholar] [CrossRef]
  16. Goto, M.; Yakushiji, T.; Kim, S.; Yamamoto, T.; Han, S.Z. Formation process of fatigue slip bands with unique configurations of ultrafine-grained high-purity Cu fabricated by severe plastic deformation. J. Alloys Compd. 2022, 899, 163263. [Google Scholar] [CrossRef]
  17. Meng, F.; Ferrié, E.; Déprés, C.; Fivel, M. 3D discrete dislocation dynamic investigations of persistent slip band formation in FCC metals under cyclical deformation. Int. J. Fatigue 2021, 149, 106234. [Google Scholar] [CrossRef]
  18. Polák, J. Role of Persistent Slip Bands and Persistent Slip Markings in Fatigue Crack Initiation in Polycrystals. Crystals 2023, 13, 220. [Google Scholar] [CrossRef]
  19. Zhang, P.; Zhang, L.; Baxevanakis, K.P.; Lu, S.; Zhao, L.G.; Bullough, C. Discrete crystal plasticity modelling of slip-controlled cyclic deformation and short crack growth under low cycle fatigue. Int. J. Fatigue 2021, 145, 106095. [Google Scholar] [CrossRef]
  20. Polák, J.; Mazánová, V.; Heczko, M.; Petráš, R.; Kuběna, I.; Casalena, L.; Man, J. The role of extrusions and intrusions in fatigue crack initiation. Eng. Fract. Mech. 2017, 185, 46–60. [Google Scholar] [CrossRef]
  21. Essmann, U.; Gösele, U.; Mughrabi, H. A model of extrusions and intrusions in fatigued metals I. Point-Defect. Prod. Growth Extrus. Philos. Mag. A 1981, 44, 405–426. [Google Scholar]
  22. Polák, J.; Jadlovský, D.; Kruml, T. Extrusions and intrusions in the cyclic plastic zone of the growing fatigue crack in polycrystalline copper. Int. J. Fatigue 2024, 179, 108063. [Google Scholar] [CrossRef]
  23. Polák, J.; Babinský, T.; Vražina, T.; Kruml, T. The Role of Extrusions and Intrusions in the Initiation and Intergranular Growth of Fatigue Cracks. Adv. Eng. Mater. 2024, 2400313. [Google Scholar] [CrossRef]
  24. Schaefer, F.; Geyer, S.; Motz, C. How Hydrogen Affects the Formation and Evolution of Persistent Slip Bands in High-Purity α-Iron. Adv. Eng. Mater. 2023, 25, 2201932. [Google Scholar] [CrossRef]
  25. Polák, J. Atomic force microscopy and high resolution scanning electron microscopy evidence concerning fatigue crack nucleation. The Abstracts of ATEM International Conference on Advanced Technology in Experimental Mechanics Asian Conference on Experimental Mechanics; The Japan Society of Mechanical Engineers: Tokyo, Japan, 2003. [Google Scholar]
  26. Lacerda, J.C.d.; Martins, G.D.; Signoretti, V.T.; Teixeira, R. Evolution of the surface roughness of a low carbon steel subjected to fatigue. Int. J. Fatigue 2017, 102, 143–148. [Google Scholar] [CrossRef]
  27. Man, J.; Obrtlík, K.; Polák, J. Study of surface relief evolution in fatigued 316L austenitic stainless steel by AFM. Mater. Sci. Eng. A 2003, 351, 123–132. [Google Scholar] [CrossRef]
  28. Phung, N.L.; Favier, V.; Ranc, N.; Valès, F.; Mughrabi, H. Very high cycle fatigue of copper: Evolution, morphology and locations of surface slip markings. Int. J. Fatigue 2014, 63, 68–77. [Google Scholar] [CrossRef]
  29. DIN 50150; DIN Deutsches Institut für Normung e. V. Testing of metallic materials: Conversion of hardness values. Beuth Verlag GmbH: Berlin, Germany, 2000.
  30. ASTM E466; Standard Practice for Conducting Force Controlled Constant Amplitude Axial Fatigue Tests of Metallic Materials. ASTM International: West Conshohocken, PA, USA, 2015.
  31. Haibach, E. Betriebsfestigkeit: Verfahren und Daten zur Bauteilberechnung; korrigierte und ergänzte Auflage; Springer: Berlin/Heidelberg, Germany, 2006; ISBN 9783540293644. [Google Scholar]
  32. DIN EN ISO 4287; DIN Deutsches Institut für Normung e. V. Geometrical Product Specifications (GPS)—Surface Texture: Profile Method—Terms. Beuth Verlag GmbH: Berlin, Germany, 2010.
  33. Polák, J.; Man, J.; Kruml, T. The sources of cyclic slip irreversibility. Acta Mater. 2024, 267, 119709. [Google Scholar] [CrossRef]
  34. Mughrabi, H. Microstructural mechanisms of cyclic deformation, fatigue crack initiation and early crack growth. Philos. Trans. A Math. Phys. Eng. Sci. 2015, 373, 20140132. [Google Scholar] [CrossRef]
  35. Murakami, Y. Effect of surface roughness on fatigue strength. In Metal Fatigue; Elsevier: Amsterdam, The Netherlands, 2019; pp. 407–430. ISBN 9780128138762. [Google Scholar] [CrossRef]
  36. Murakami, Y.; Nomoto, T.; Ueda, T. Factors influencing the mechanism of superlong fatigue failure in steels. Fatigue Fract. Eng. Mat. Struct. 1999, 22, 581–590. [Google Scholar] [CrossRef]
  37. Mughrabi, H. On ‘multi-stage’ fatigue life diagrams and the relevant life-controlling mechanisms in ultrahigh-cycle fatigue. Fatigue Fract. Eng. Mat. Struct. 2002, 25, 755–764. [Google Scholar] [CrossRef]
  38. Beard, W.; Lancaster, R.; Barnard, N.; Jones, T.; Adams, J. The influence of surface finish and build orientation on the low cycle fatigue behaviour of laser powder bed fused stainless steel 316L. Mater. Sci. Eng. A 2023, 864, 144593. [Google Scholar] [CrossRef]
  39. Bui, T.P.; Miyashita, Y.; Mutoh, Y.; Morikage, Y.; Tagawa, T.; Handa, T.; Otsuka, Y. Fatigue crack deflection and branching behavior of low carbon steel under mechanically large grain condition. Int. J. Fatigue 2021, 148, 106217. [Google Scholar] [CrossRef]
Figure 1. The fatigue specimen dimensions used for the tests (in mm).
Coatings 14 01077 g001
Figure 2. Confocal topography images of as-machined surfaces from the HAS50 specimen. (a) The surface in the initial stage (0 cycles). (b) The developed surface at 1 × 10³ cycles; the measuring lines show examples of the linear roughness measuring direction (y-axis).
Coatings 14 01077 g002
Figure 3. Surface roughness on the HAS50 specimen: (a) at the initial stage (0 cycles); (b) the developed surface at 1 × 10³ cycles.
Coatings 14 01077 g003
Figure 4. Surface roughness results for the specimens with various stress amplitudes regarding Ra: (a) raw measured values; (b) average Ra results with standard error bars and fitting curve equations for LAS30, MAS40, and HAS50: Ra = 0.0900lnN + 16.51, Ra = 0.3700lnN + 26.25, and Ra = 0.7099lnN + 41.72, respectively.
Coatings 14 01077 g004
Figure 5. Surface roughness results of the specimens with various stress amplitudes in regard to Rz: (a) raw measured values; (b) average Rz results with standard error bars and fitting curve equations for LAS30, MAS40, and HAS50: Rz = 0.9346lnN + 94.96, Rz = 1.7514lnN + 142.18, and Rz = 6.1594lnN + 232.99, respectively.
Coatings 14 01077 g005
Figure 6. Surface roughness results of the specimens with various stress amplitudes regarding Rp: (a) raw measured values; (b) average Rp results with standard error bars and fitting curve equations for LAS30, MAS40, and HAS50: Rp = 0.2261lnN + 48.76, Rp = 0.3474lnN + 71.30, and Rp = 4.2933lnN + 108.87, respectively.
Coatings 14 01077 g006
Figure 7. Surface roughness results of the specimens with various stress amplitudes with respect to Rv: (a) raw measured values; (b) Rv results with standard error bars and fitting curve equations for LAS30, MAS40, and HAS50: Rv = 0.8153lnN + 45.10, Rv = 1.4041lnN + 70.88, and Rv = 1.8631lnN + 124.13, respectively.
Coatings 14 01077 g007
Figure 8. Surface modifications and the assumptions of modified surfaces regarding Ra, Rz, Rp, and Rv during cyclic loading applied to the LAS30 and MAS40 specimens with several different numbers of cycles (N). A is the case of roughness modification for original peaks and valleys, B is the case of roughness modification regarding developed roughness (case-A) with newly formed peaks and valleys, and C denotes the case of mixed roughness modifications of the case-B type and measured scattered data.
Coatings 14 01077 g008
Figure 9. Roughness evolution during cyclic loading (REC) regarding Ra, Rz, Rp, and Rv at several stress amplitude levels.
Coatings 14 01077 g009
Table 1. Chemical compositions (DIN EN ISO 683-2) and mechanical properties (own measurement).
MaterialChemical Compositions (wt.%)Mechanical Properties
CSiMnCrFeHardness (HV10)UTS (MPa)
42CrMo40.38–0.450.17–0.350.50–0.800.90–1.20Bal.372 ± 5.41195 *
* The converted value using an average of Vickers hardness.
Table 2. Surface roughness results after different stress amplitudes and numbers of cycles were reached.
Specimen-ID (σa)Number of CyclesRa (nm)Rz (nm)Rp (nm)Rv (nm)
Min.Max.MeanMin.Max.MeanMin.Max.MeanMin.Max.Mean
LAS30
(358.5 MPa)
Initial stage11.5421.8515.6967.45130.5089.1033.4988.1146.797.1253.6140.80
1 × 10311.1330.3517.8766.24242.70106.5631.00111.7051.9733.35131.0054.59
1 × 10410.9630.3419.0272.45249.50112.0138.9878.9354.9631.41170.5057.05
1 × 1059.8132.6617.1654.73207.60107.5728.0393.9351.0826.71140.5056.49
2 × 10512.3122.4316.1566.93134.3094.6431.0571.2147.4734.6163.2147.17
MAS40
(478.0 MPa)
Initial stage18.0038.6225.2489.89225.70136.6643.54126.4069.5641.43127.3067.10
1 × 10317.9441.5929.56107.50277.10161.7247.08186.7078.4057.42134.4083.31
1 × 10419.2341.7829.0491.96244.10152.3643.01112.2070.7448.95139.6081.62
HAS50
(597.5 MPa)
Initial stage26.0654.4540.08151.60368.50218.8164.80153.6098.9986.77214.90119.84
1 × 10331.8864.3346.62215.40363.60275.54105.50189.80138.53102.70187.90137.01
Table 3. Correlation equations of surface roughness results with respect to the number of cycles and the roughness evolution during cyclic loading (REC).
Specimen IDLAS30MAS40HAS50
Stress Amplitude
(MPa)-σa
358.5478.0597.5
Failed atRun-Out24,240 N2078 N
Slope (REC)-∂Ra/∂ln(N)Ra+0.900 × 10−1+3.700 × 10⁻¹+7.099 × 10⁻¹
Rz+9.346 × 10⁻¹+17.514 × 10⁻¹+61.594 × 10⁻¹
Rp+2.261 × 10⁻¹+3.474 × 10⁻¹+42.933 × 10⁻¹
Rv+8.15 × 10⁻¹+14.04 × 10⁻¹+18.63 × 10⁻¹
Table 4. Calculated REC growth for the investigated roughness parameters depending on the stress amplitudes.
DescriptionRaRzRpRv
Equationln(REC) = 0.009 (σ) + ln(0.046)ln(REC) = 0.007(σ) + ln(0.666)ln(REC) = 0.012(σ) + ln(0.019)ln(REC) = 0.004(σ) + ln(2.461)
Reliability (R2)95.66% (0.9566)93.66% (0.9366)85.68% (0.8568)96.80% (0.968)
Disclaimer/Publisher’s Note: The statements, opinions and data contained in all publications are solely those of the individual author(s) and contributor(s) and not of MDPI and/or the editor(s). MDPI and/or the editor(s) disclaim responsibility for any injury to people or property resulting from any ideas, methods, instructions or products referred to in the content.

