
Ice Distribution Characteristics on the DU25 and NACA63-215 Airfoil Surfaces of Wind Turbines as Affected by Ambient Temperature and Angle of Attack
Abstract
:1. Introduction
- (1)
- There are few studies on the physical mechanism of the ice distribution characteristics of asymmetric airfoil surfaces;
- (2)
- The effect of ambient temperature and angles of attack on the ice distribution mechanism of the DU25 and NACA63-215 airfoil surfaces has not been reported.
2. Model
2.1. Mathematical Model
2.1.1. Airflow and Temperature Fields Model outside the Wind Turbine Blade
2.1.2. Droplet Flow Model
2.1.3. Water Film and Ice Accretion Model
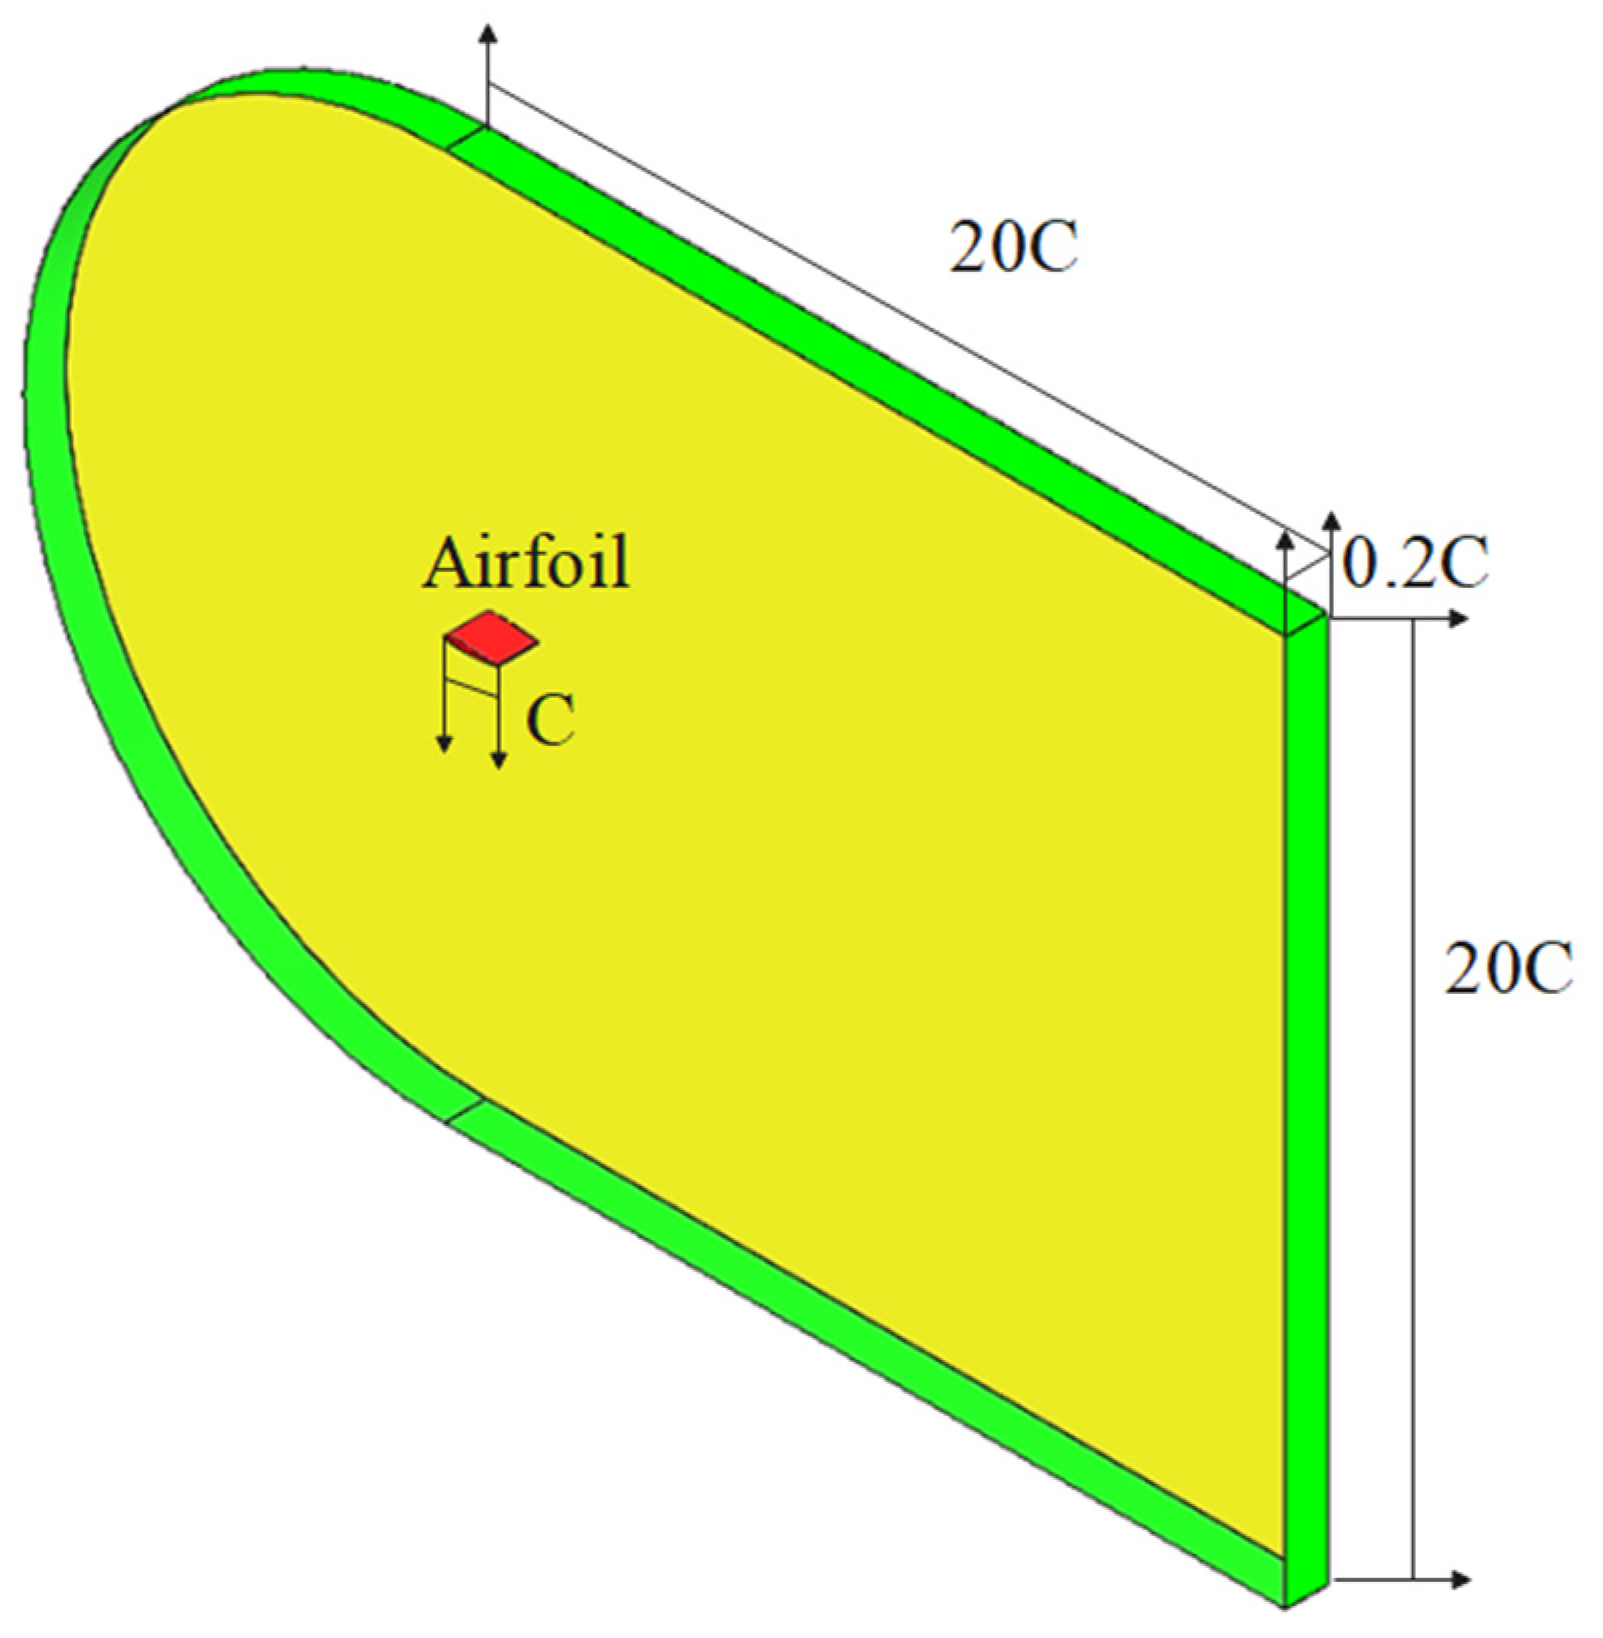
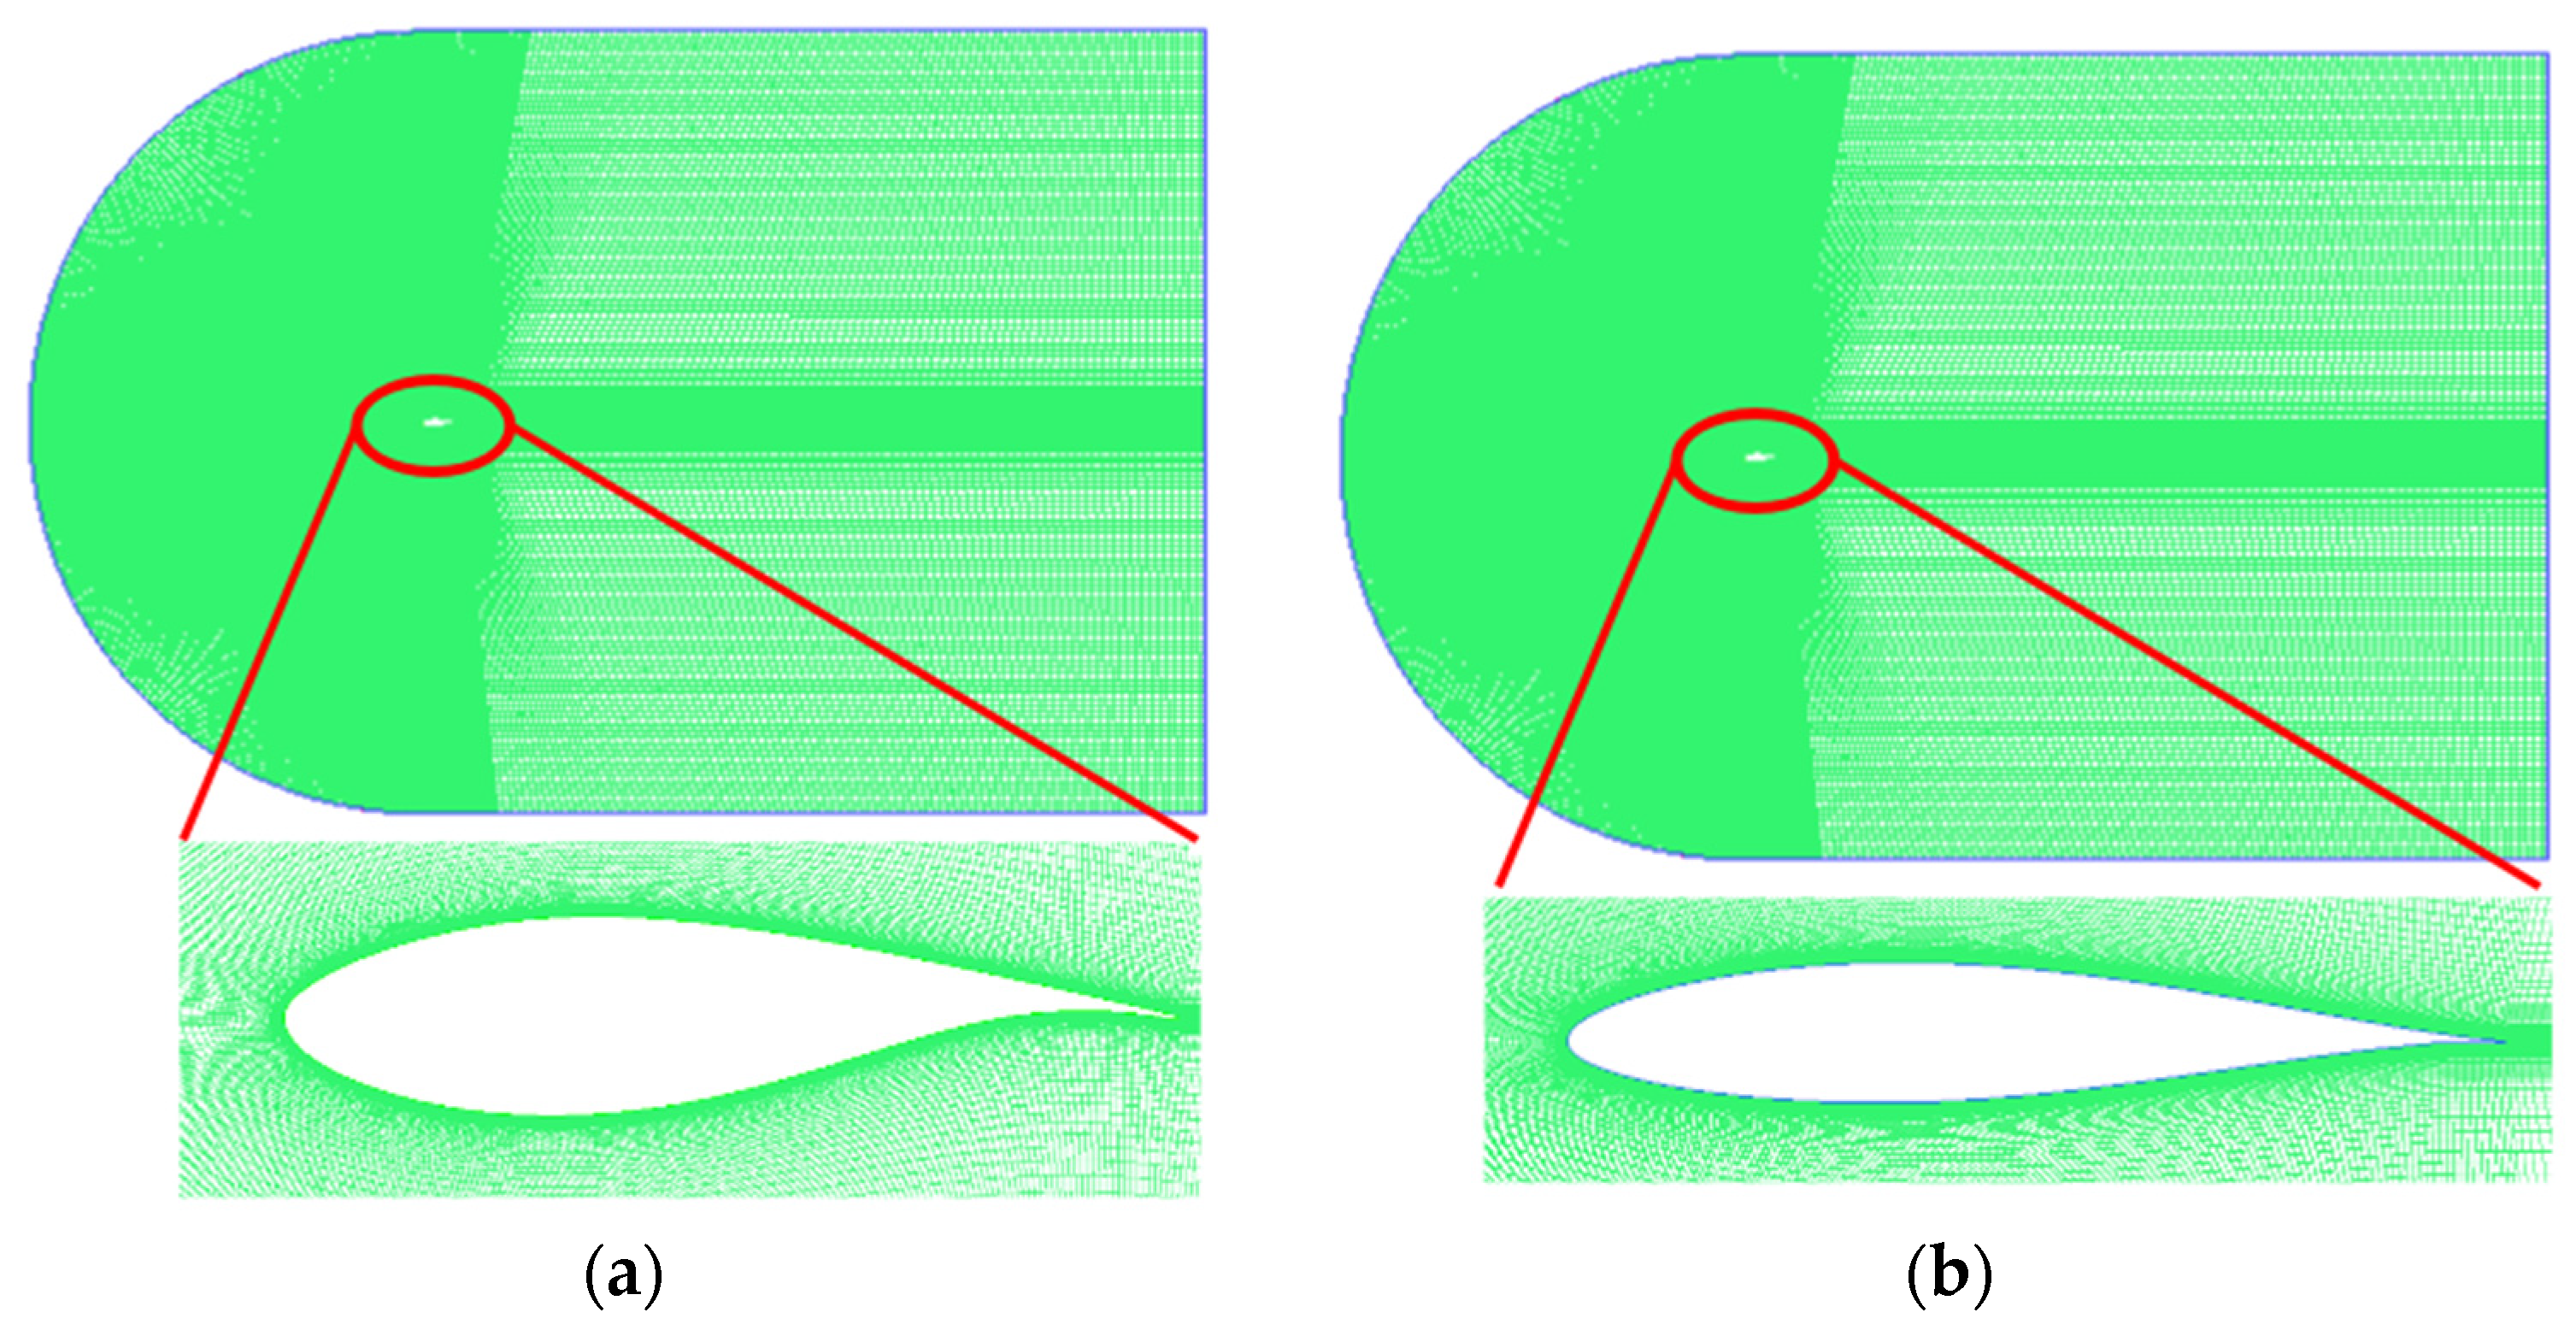
2.2. Computational Domain and Mesh
2.3. Boundary Conditions and Solution Method
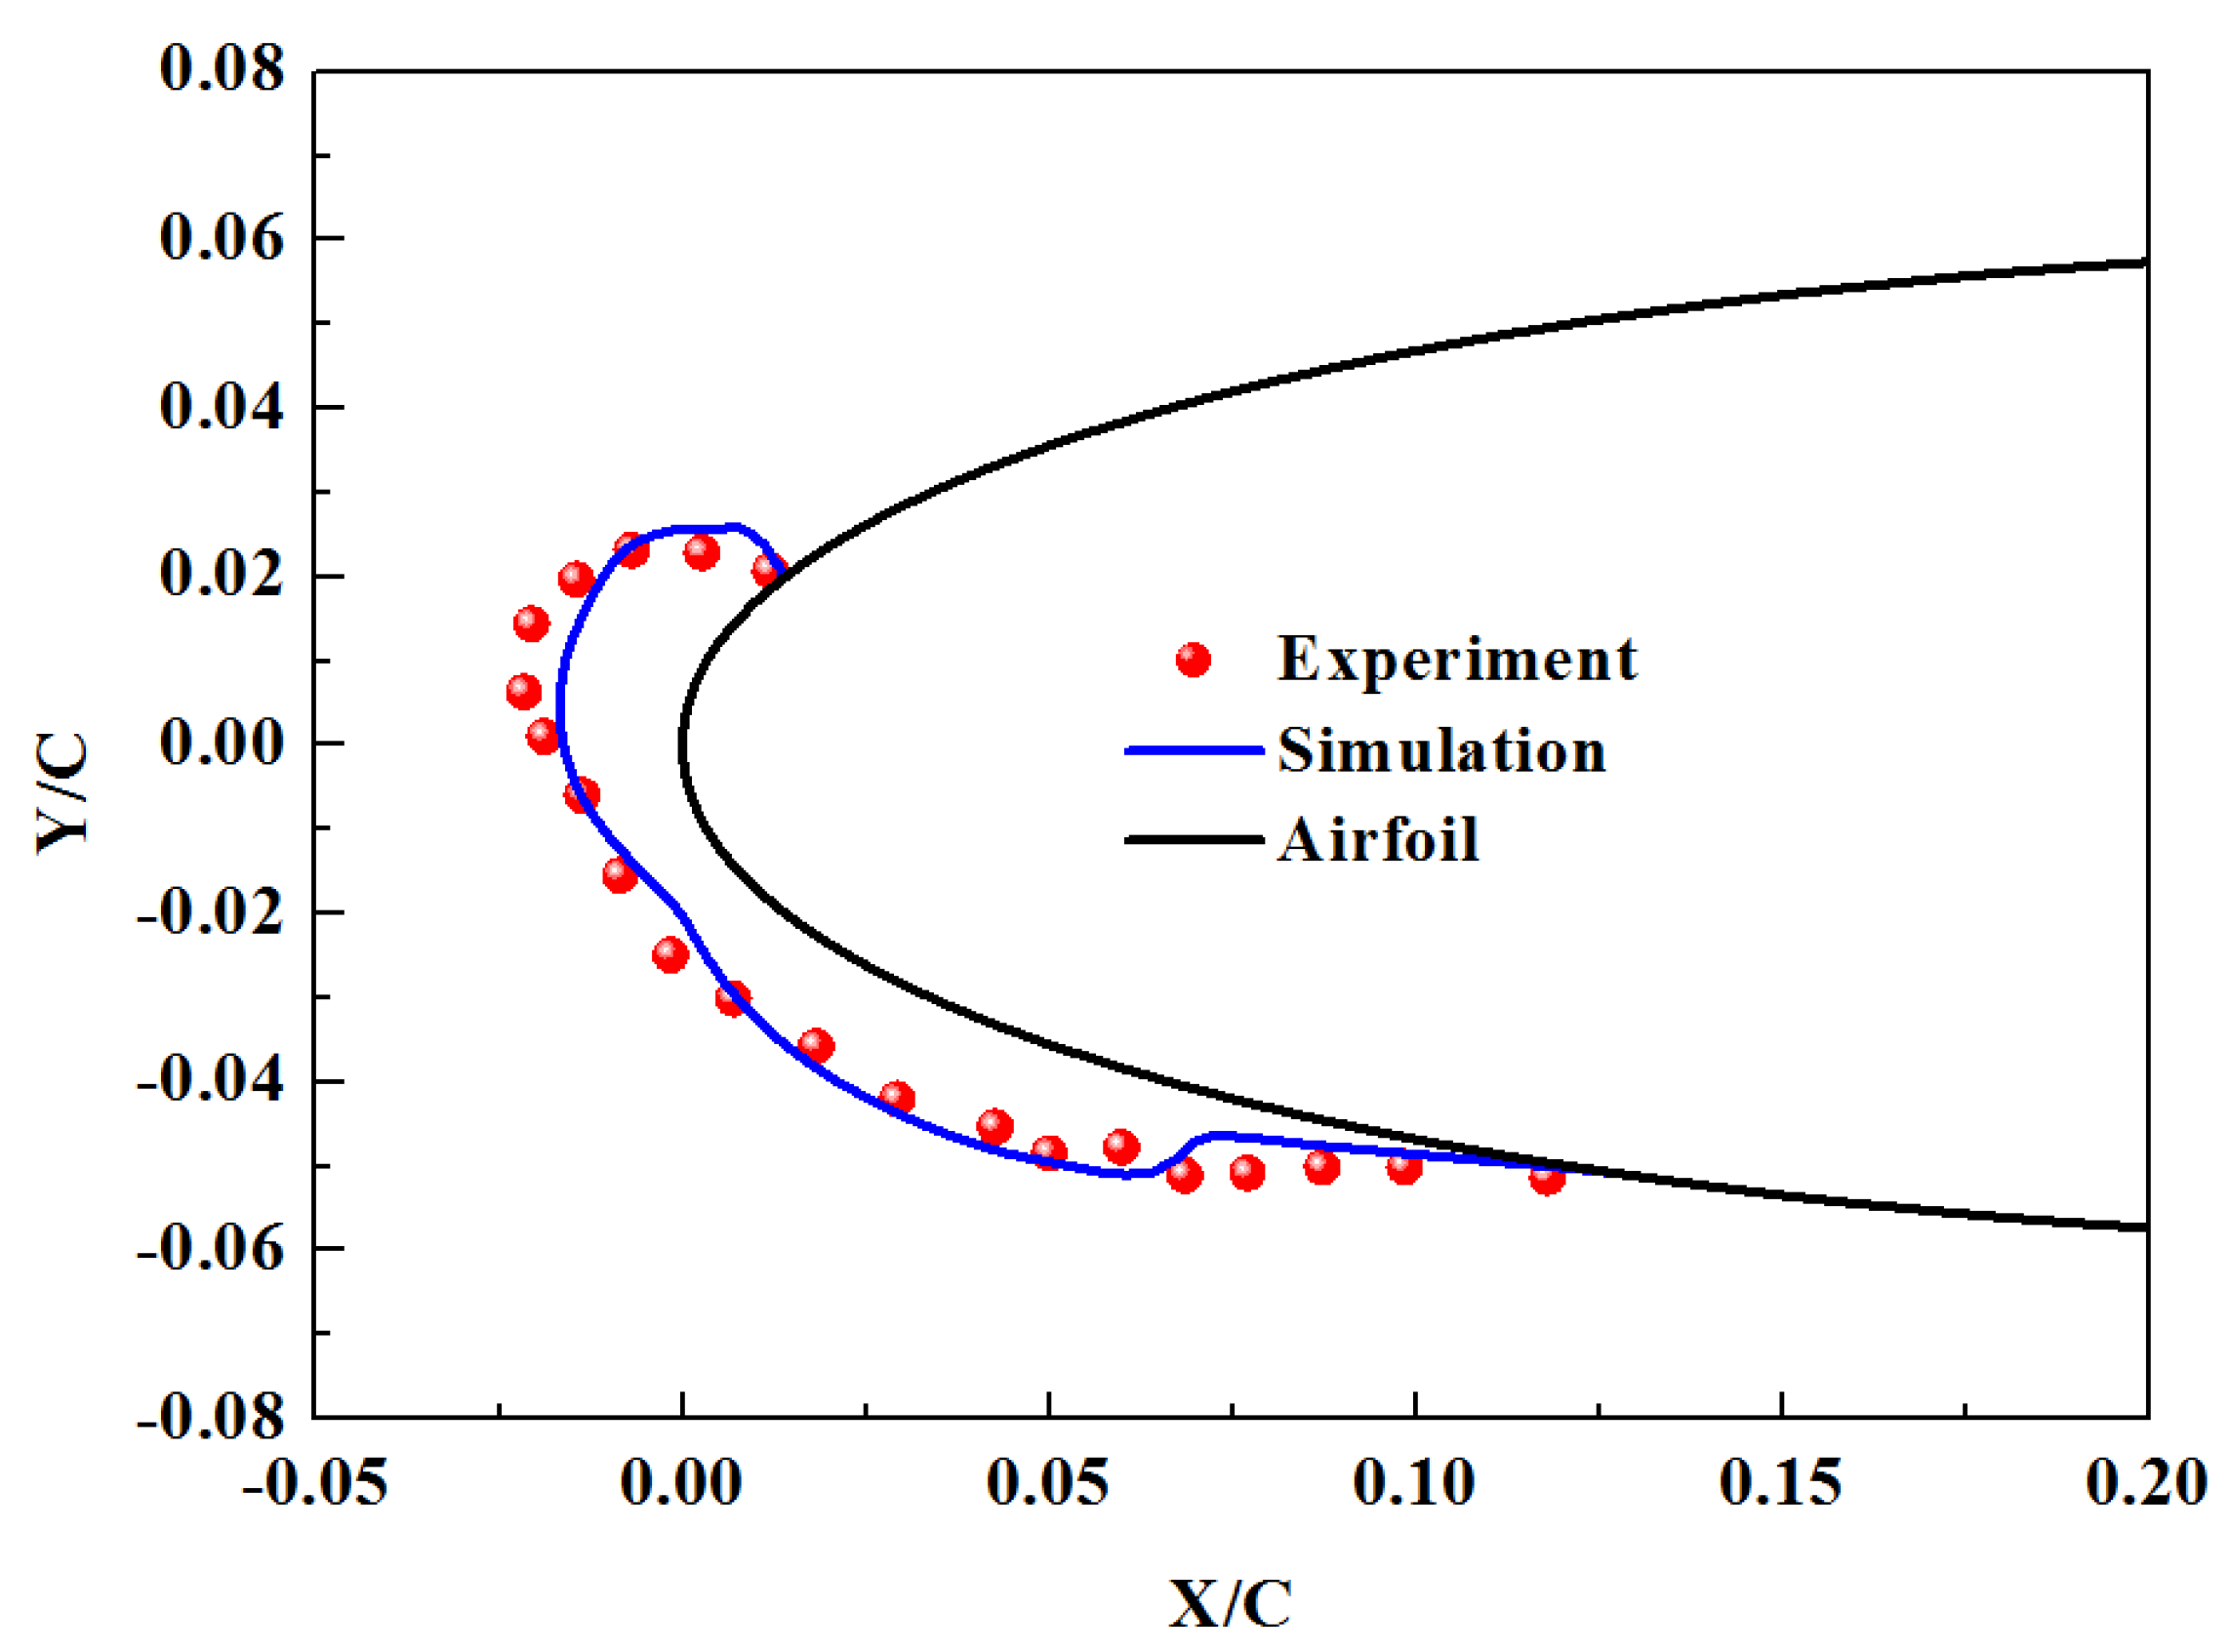
2.4. Model Validation
3. Results and Discussion
3.1. Effect of Ambient Temperature
3.2. Effect of Angle of Attack
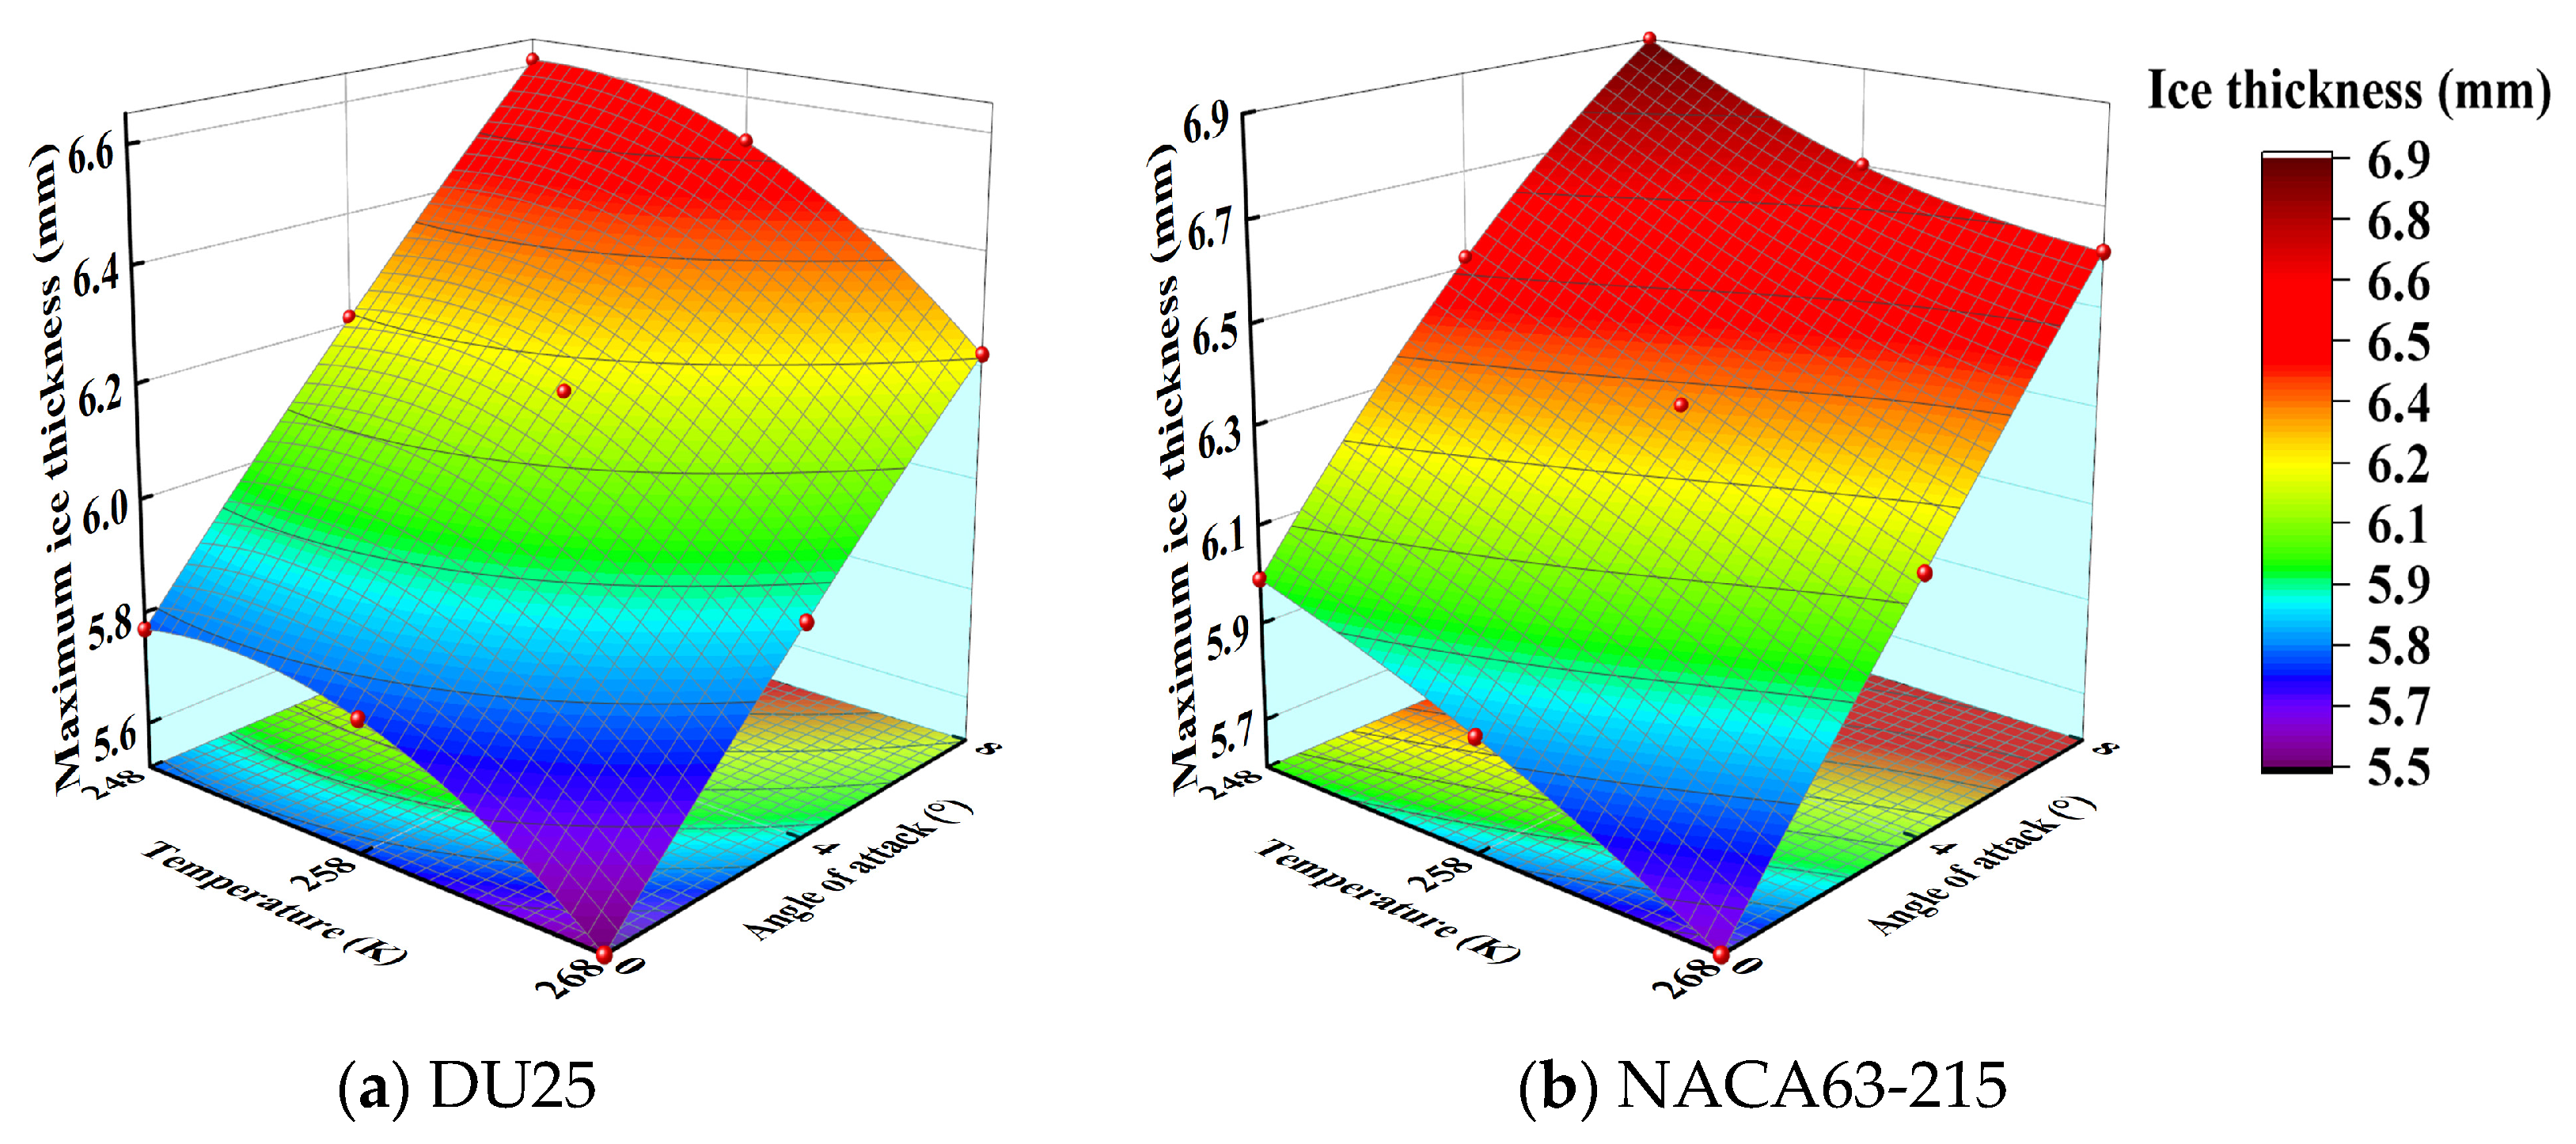
3.3. Coupling Effect of Ambient Temperature and Angle of Attack
4. Conclusions
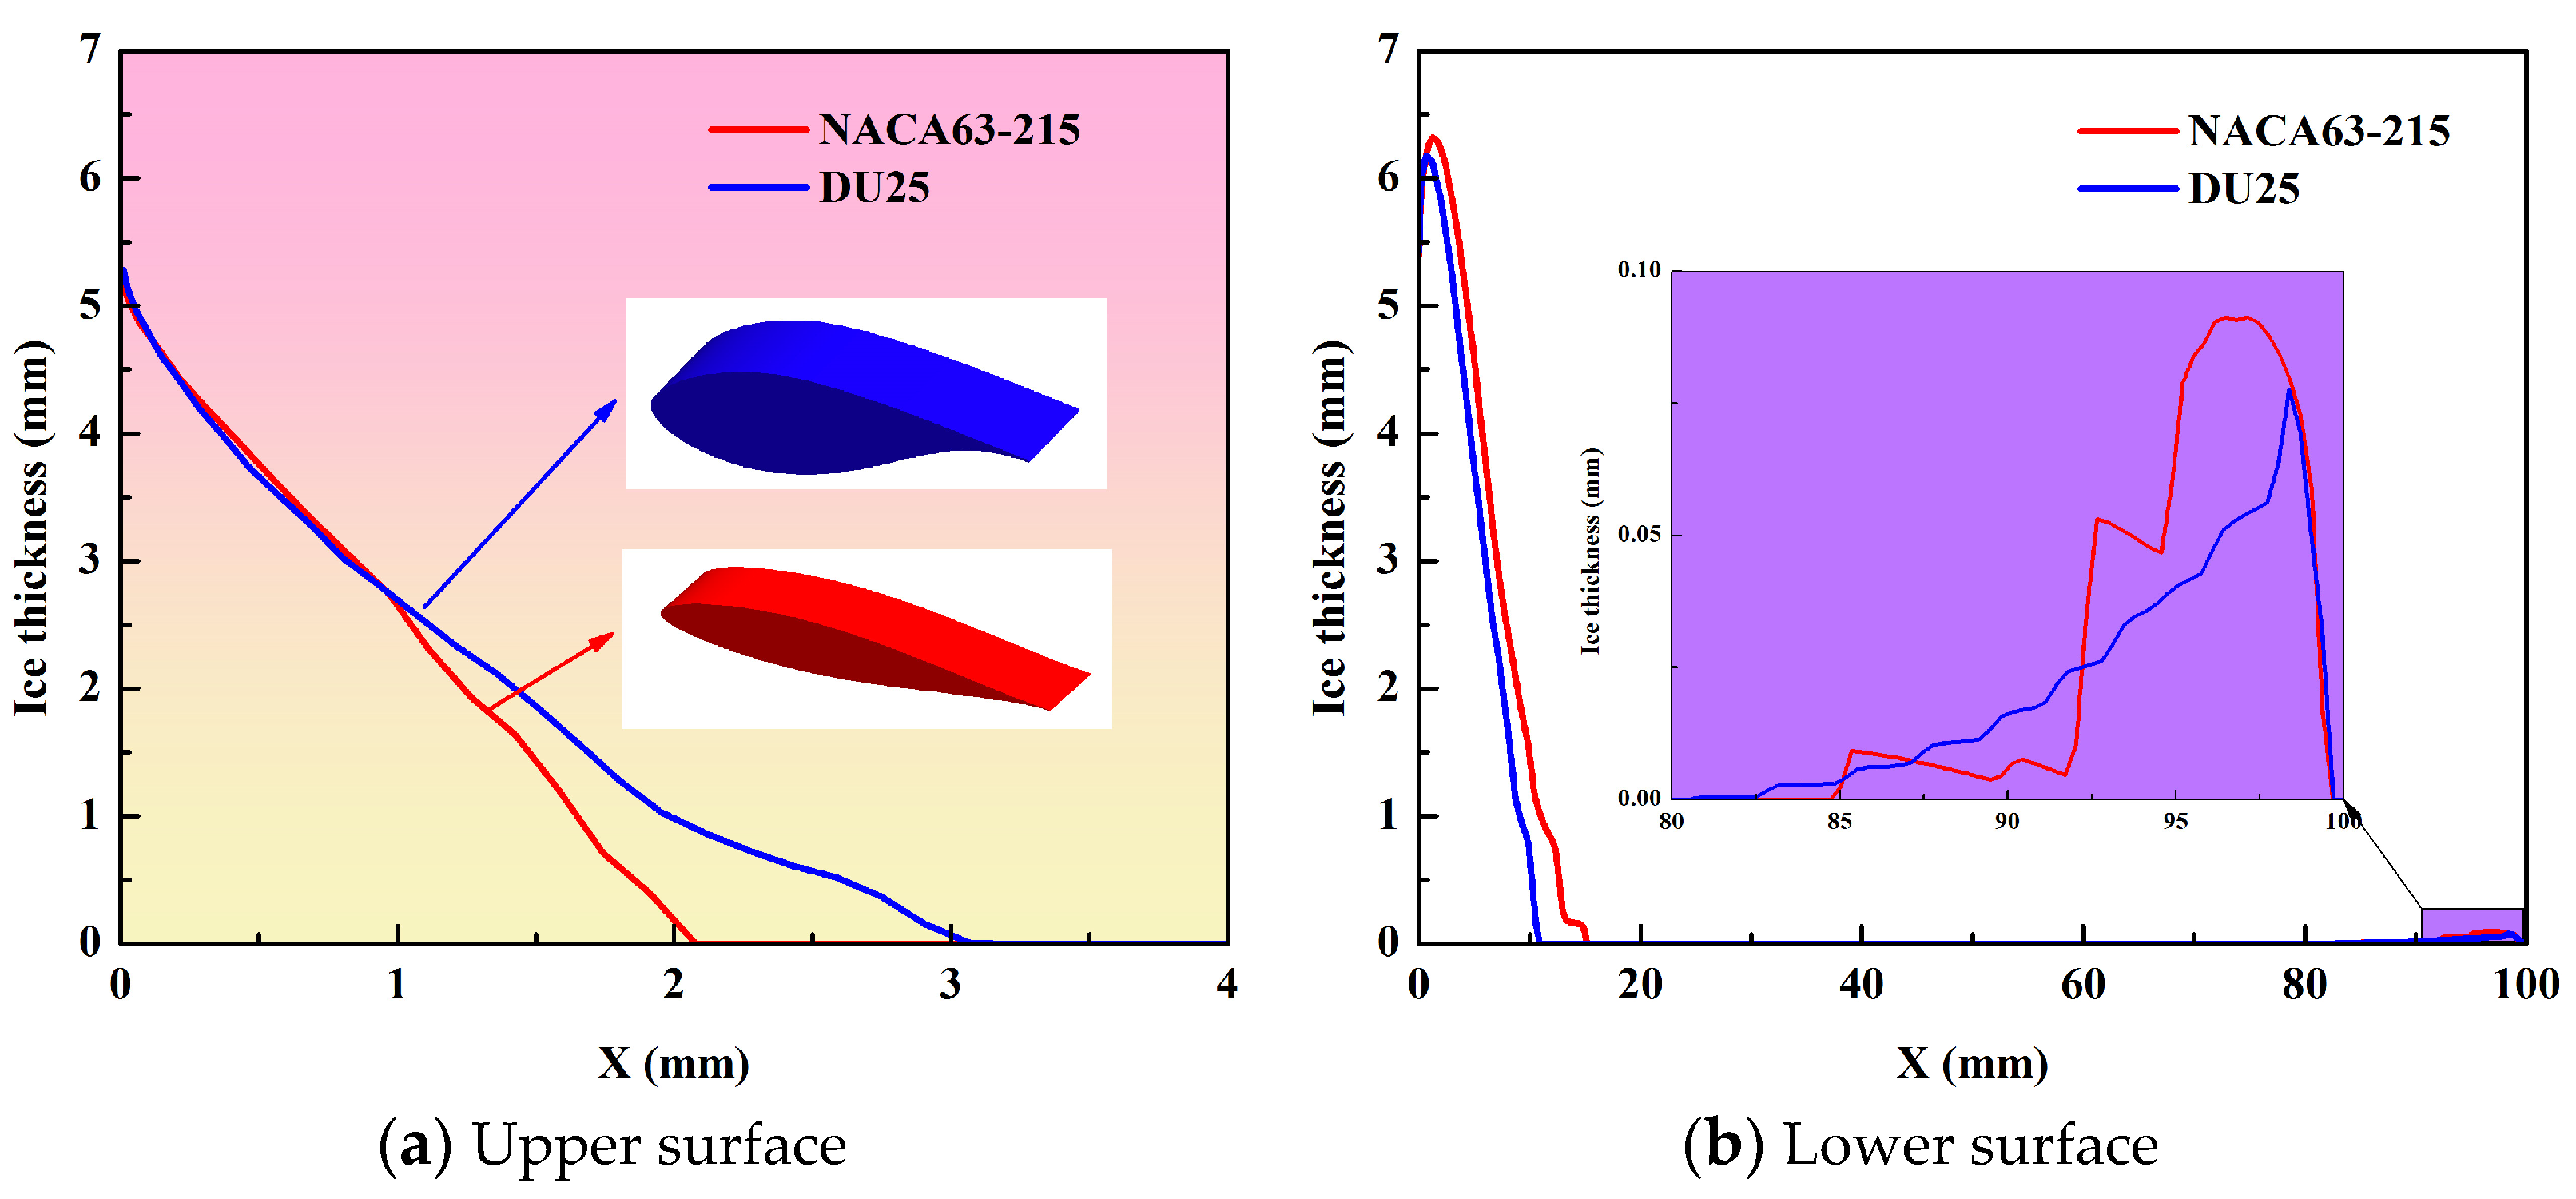
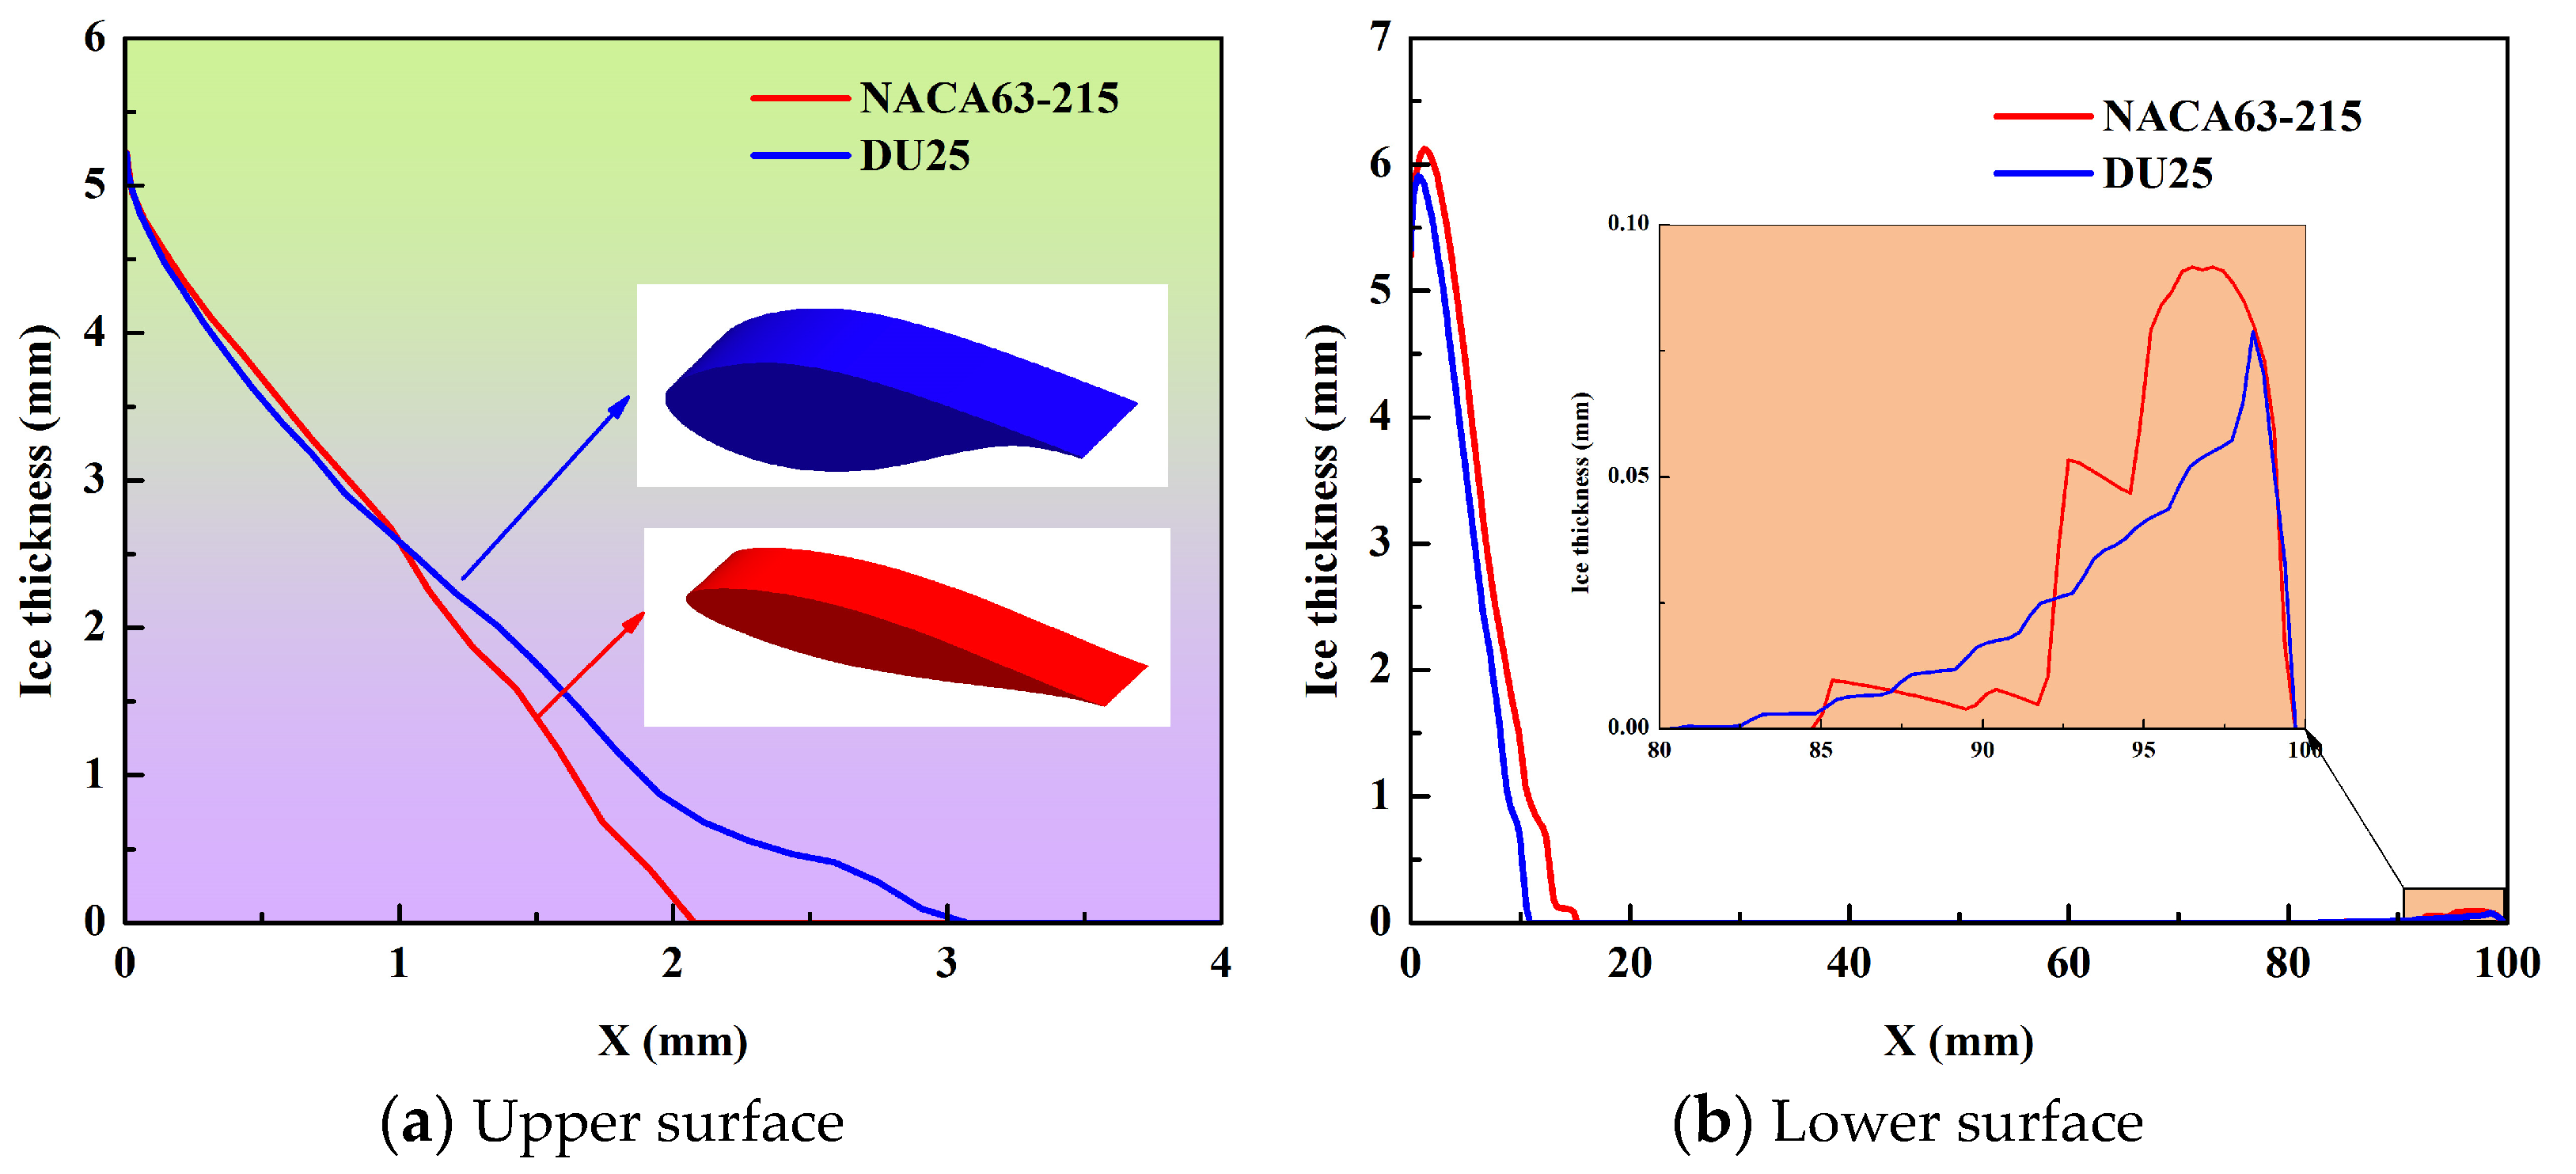
- For the upper surface, when the ambient temperature increases from 248 K to 268 K, the peak ice thickness on the leading edge of the DU25 and NACA63-215 airfoils is diminished by 2.1% and 3.2%, respectively.
- For the lower surface, the peak ice thickness on the leading edge of the DU25 and NACA63-215 airfoils drops by 4.8% and 6.1%, respectively.
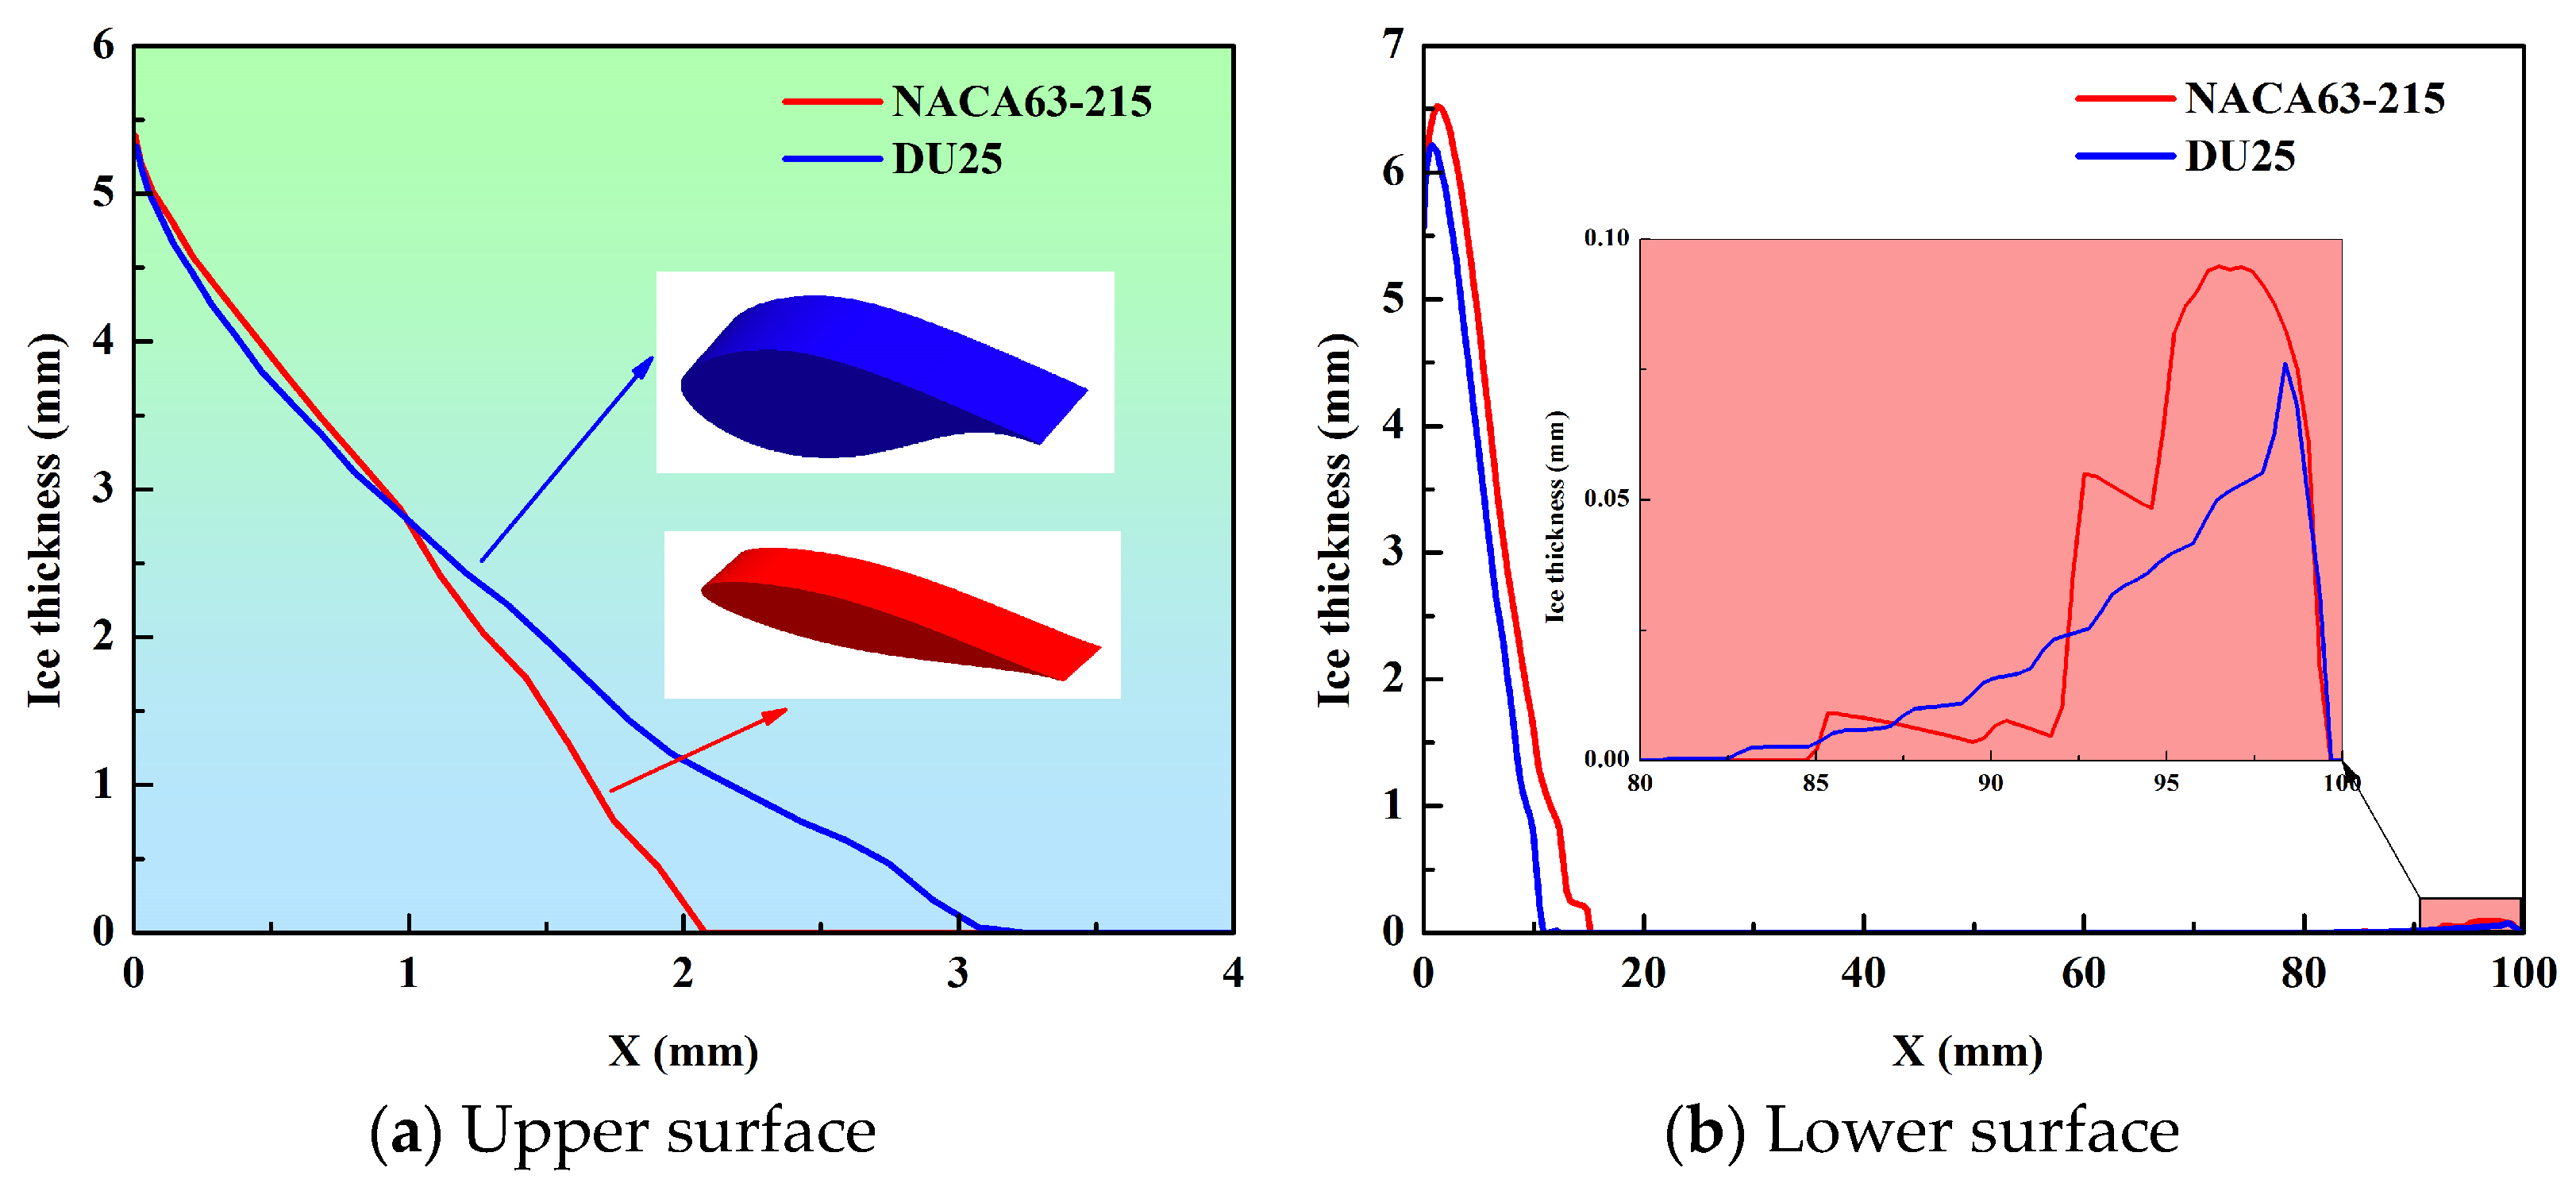
- For the leading edge of airfoils, the ice distribution range on the upper surface of the DU25 airfoil (0–3.07 mm) is wider than that of the NACA63-215 airfoil (0–1.91 mm), while the ice distribution range on the lower surface of the DU25 airfoil (0–12.13 mm) is narrower than that of the NACA63-215 airfoil (0–15.18 mm).
- For the trailing edge of airfoils, the ice distribution range of the DU25 airfoil (80.55–99.36 mm) is broader than that of the NACA63-215 airfoil (85.03–99.36 mm).
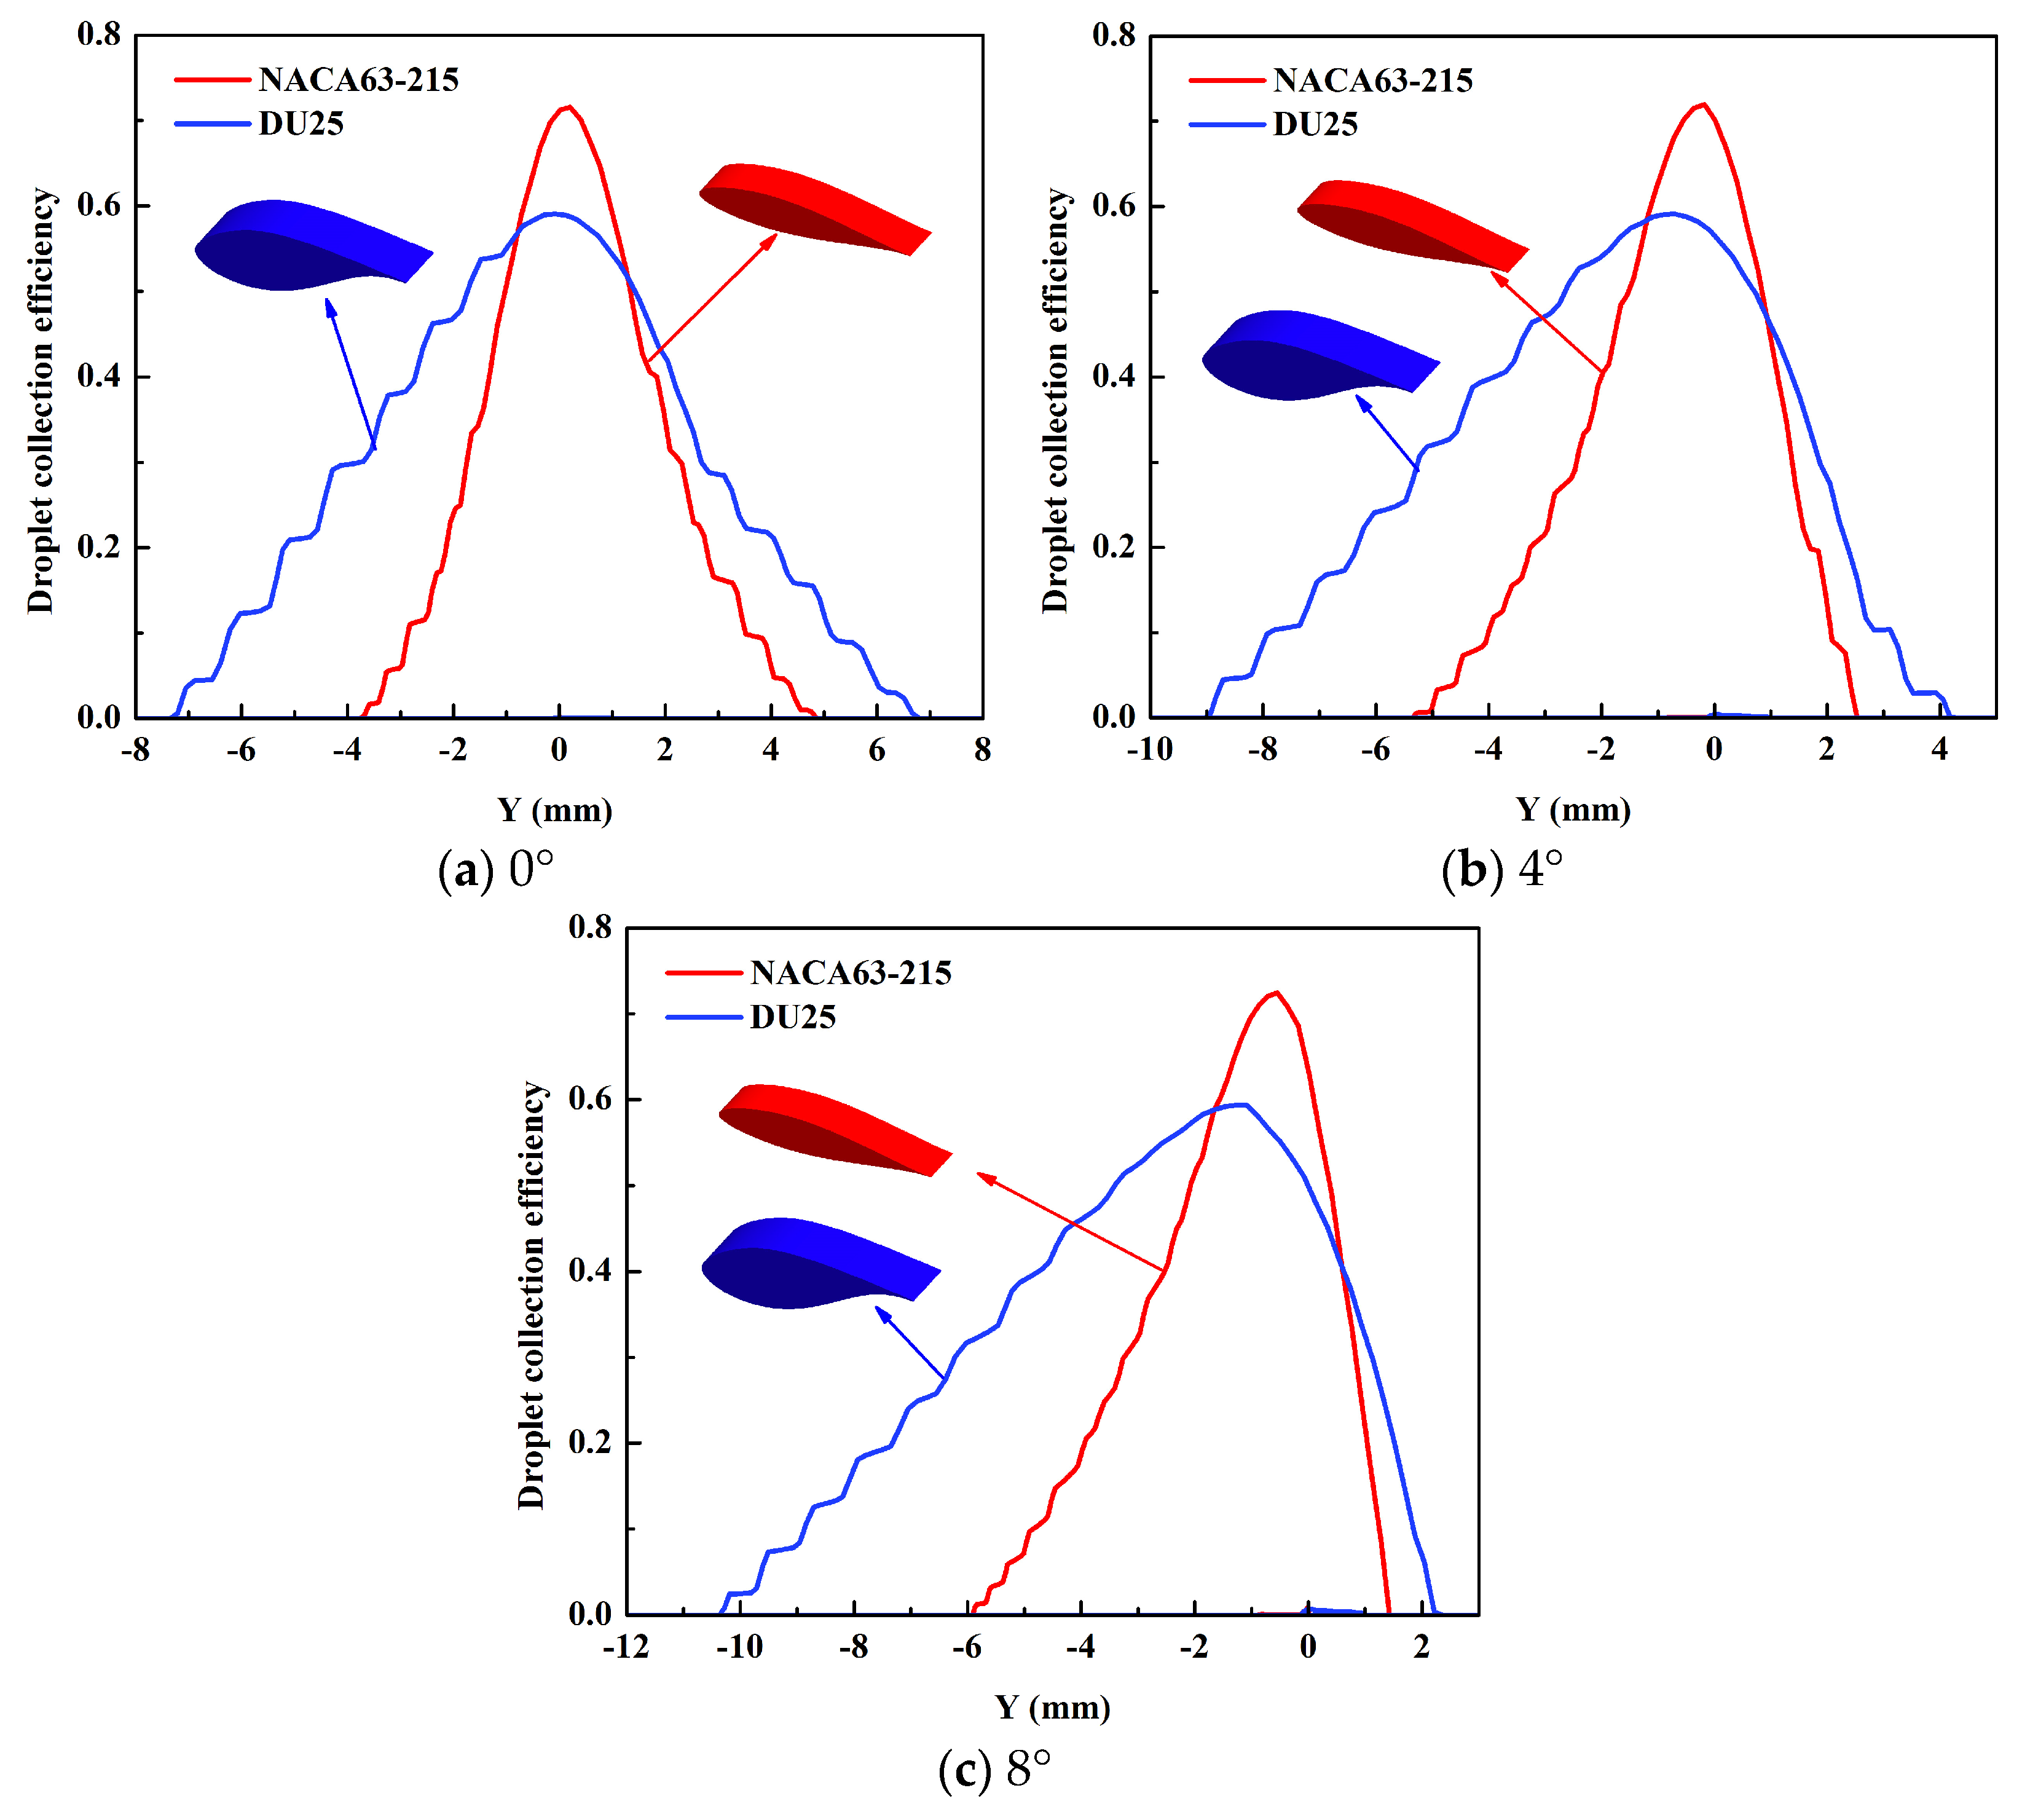
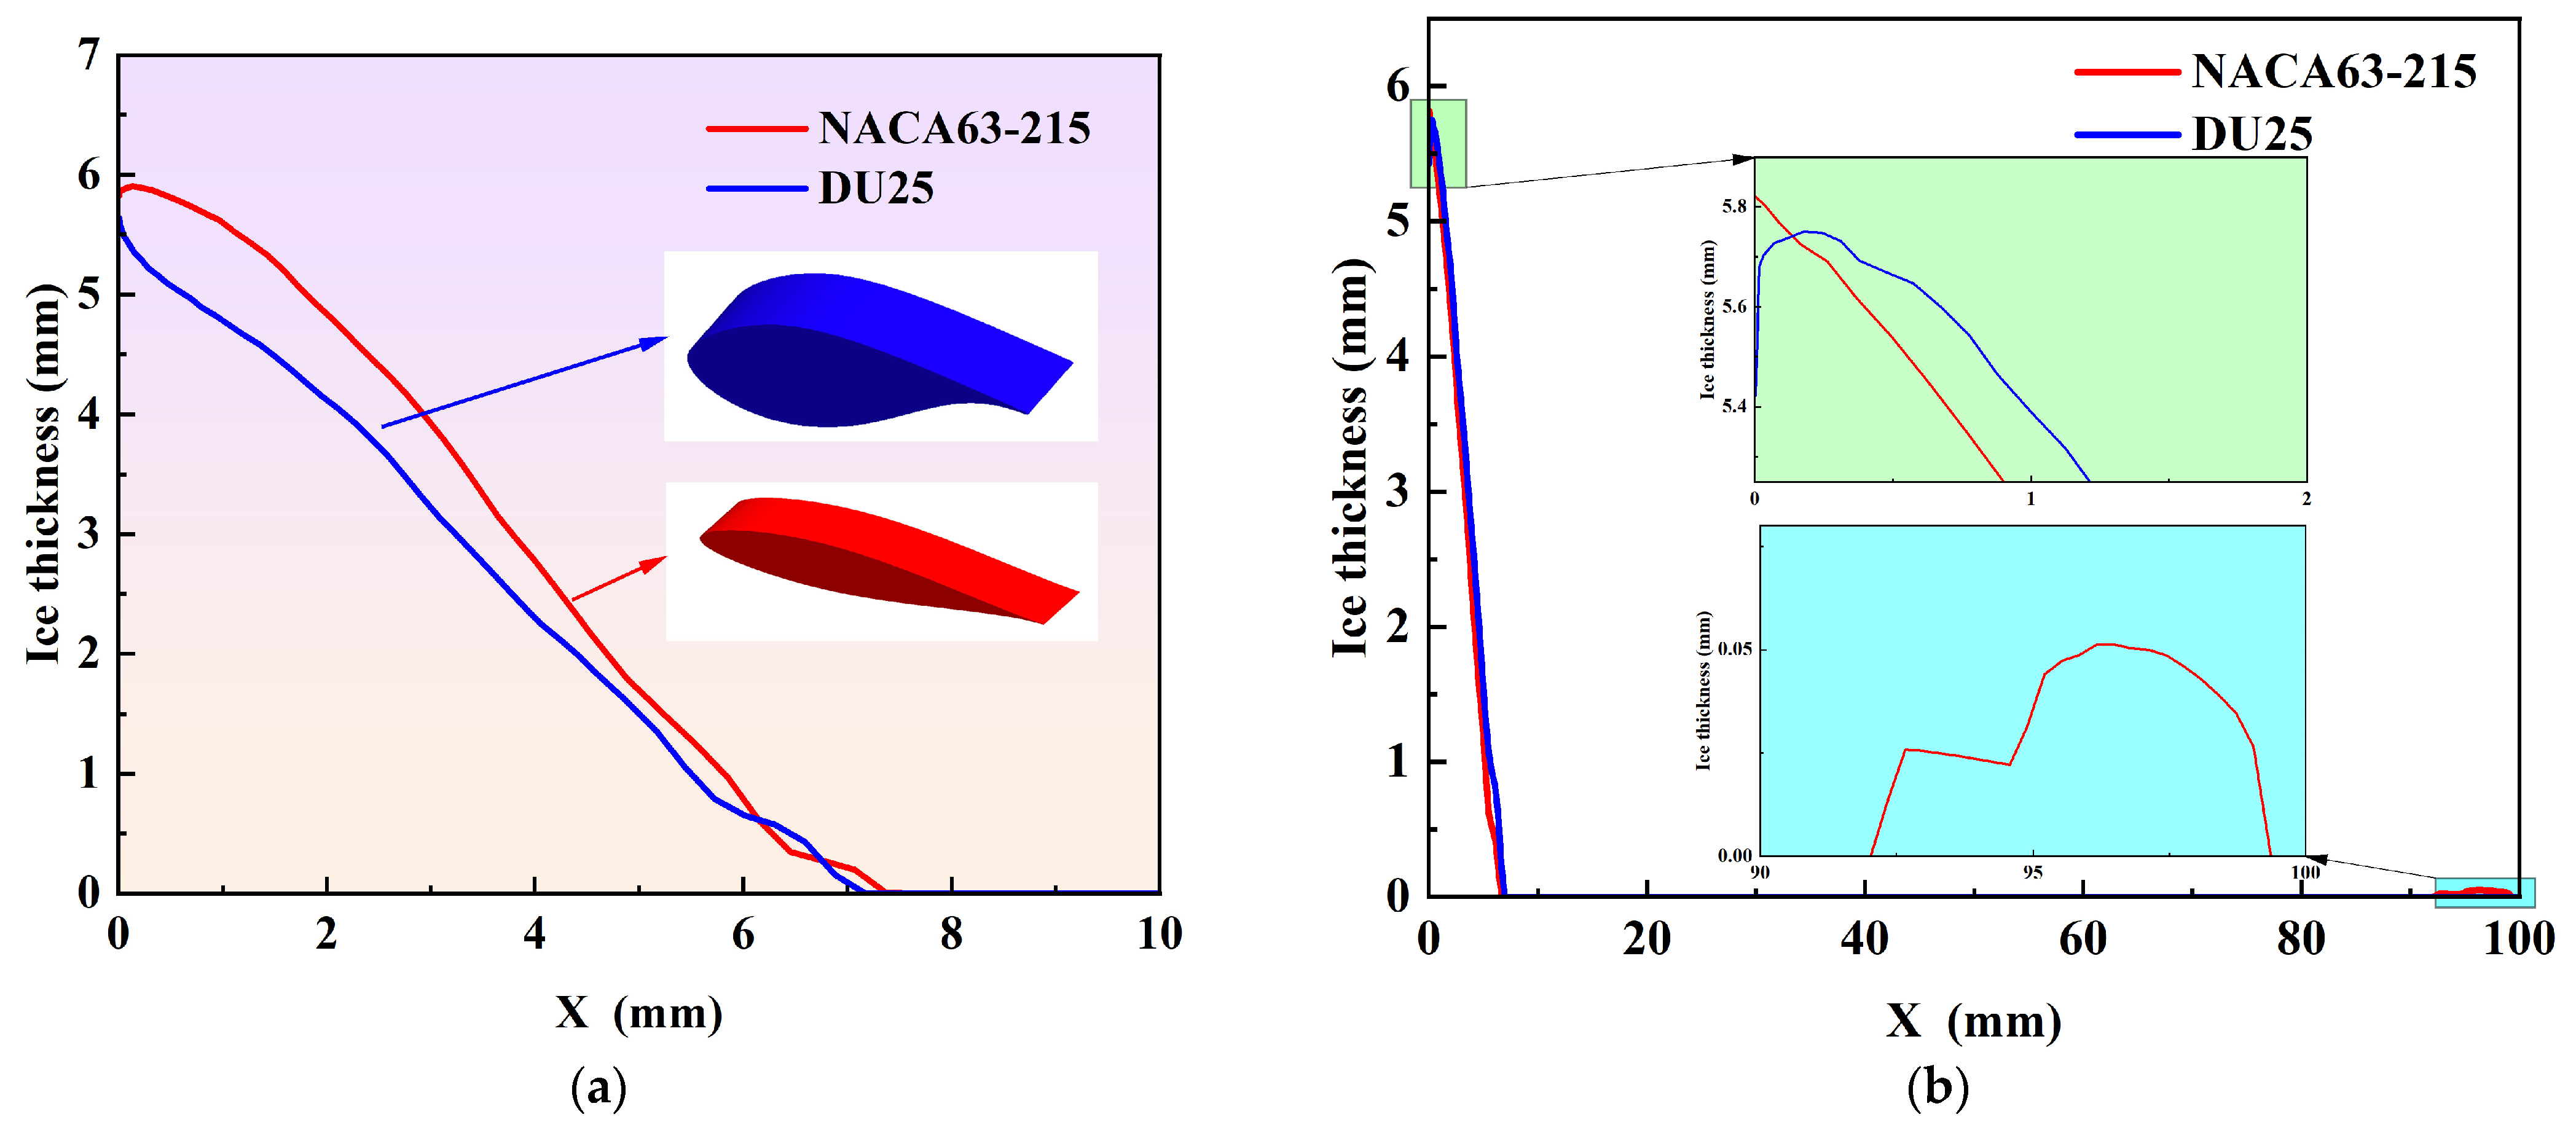
- For the upper surface, when the angle of attack increases from 0° to 8°, the peak ice thickness on the NACA63-215 airfoil (32.1% reduction) reduces more dramatically than that of the DU25 airfoil (15.2% reduction).
- For the lower surface, the peak ice thickness on the surface of the DU25 airfoil is smaller than that of the NACA63-215 airfoil.
- At an angle of attack of 0°, the ice distribution range on the upper surface of the DU25 airfoil is almost the same as that of the NACA63-215 airfoil.
- At an angle of attack of 8°, the ice distribution range on the upper surface of the DU25 airfoil (0–1.05 mm) is broader than that of the NACA63-215 airfoil (0–0.675 mm), whereas the ice distribution range on the lower surface of the DU25 airfoil (0–17 mm) is narrower than that of the NACA63-215 airfoil (0–20 mm).
- The angle of attack has a much greater effect on the peak ice thickness than ambient temperature.
Author Contributions
Funding
Institutional Review Board Statement
Informed Consent Statement
Data Availability Statement
Conflicts of Interest
Nomenclature
| chord length (m) | temperature (K) | ||
| specific heat capacity of the water film (J/kg K) | the interface equilibrium temperature (°C) | ||
| specific heat capacity of the ice (J/kg K) | velocity (m/s) | ||
| drag coefficient | distance normal to the wall (m) | ||
| friction coefficient | Greek symbols | ||
| characteristic length (m) | droplet volume fraction | ||
| thermal conduction coefficient (W/m K) | droplet collection efficiency | ||
| surface roughness (m) | emissivity | ||
| inertia parameter | dynamic viscosity (Pa s) | ||
| latent heat (J/kg) | shear stress (kg/m s2) | ||
| internal energy (J/kg) | Subscripts | ||
| Froude number | air | ||
| water film thickness (m) | droplet | ||
| internal enthalpy (J/kg) | evaporation | ||
| liquid water content (g/m3) | fusion | ||
| Reynolds number | water film | ||
| mass rate per unit area (kg/m2·s) | Ice | ||
| heat flux (W/m2) | sublimation | ||
| gravity vector (m/s2) | free stream | ||
| time (s) | |||
References
- Chehouri, A.; Younes, R.; Ilinca, A.; Perron, J. Review of performance optimization techniques applied to wind turbines. Appl. Energy 2015, 142, 361–388. [Google Scholar] [CrossRef]
- Lamraoui, F.; Fortin, G.; Benoit, R.; Perron, J.; Masson, C. Atmospheric icing impact on wind turbine production. Cold Reg. Sci. Technol. 2014, 100, 36–49. [Google Scholar] [CrossRef]
- Zhang, Y.; Tang, N.; Niu, Y.; Du, X. Wind energy rejection in China: Current status, reasons and perspectives. Renew. Sustain. Energy Rev. 2016, 66, 322–344. [Google Scholar] [CrossRef]
- Zhang, T.; Lian, Y.; Xu, Z.; Li, Y. Effects of wind speed and heat flux on de-icing characteristics of wind turbine blade airfoil surface. Coatings 2024, 14, 852. [Google Scholar] [CrossRef]
- Douvi, E.; Douvi, D. Aerodynamic characteristics of wind turbines operating under hazard environmental conditions: A review. Energies 2023, 16, 7681. [Google Scholar] [CrossRef]
- Li, Y.; Wang, S.; Liu, Q.; Feng, F.; Tagawa, K. Characteristics of ice accretions on blade of the straight-bladed vertical axis wind turbine rotating at low tip speed ratio. Cold Reg. Sci. Technol. 2018, 145, 1–13. [Google Scholar] [CrossRef]
- Shu, L.; Li, H.; Hu, Q.; Jiang, X.; Qiu, G.; McClure, G.; Yang, H. Study of ice accretion feature and power characteristics of wind turbines at natural icing environment. Cold Reg. Sci. Technol. 2018, 147, 45–54. [Google Scholar] [CrossRef]
- Gao, L.; Liu, Y.; Hu, H. An experimental investigation of dynamic ice accretion process on a wind turbine airfoil model considering various icing conditions. Int. J. Heat Mass Transf. 2019, 133, 930–939. [Google Scholar] [CrossRef]
- Gao, L.; Liu, Y.; Zhou, W.; Hu, H. An experimental study on the aerodynamic performance degradation of a wind turbine blade model induced by ice accretion process. Renew. Energy 2019, 133, 663–675. [Google Scholar] [CrossRef]
- Jin, J.Y.; Virk, M.S. Study of ice accretion along symmetric and asymmetric airfoils. J. Wind. Eng. Ind. Aerodyn. 2018, 179, 240–249. [Google Scholar] [CrossRef]
- Jin, J.Y.; Virk, M.S. Study of ice accretion and icing effects on aerodynamic characteristics of DU96 wind turbine blade profile. Cold Reg. Sci. Technol. 2019, 160, 119–127. [Google Scholar] [CrossRef]
- Jin, J.Y.; Virk, M.S. Experimental study of ice accretion on S826 & S832 wind turbine blade profiles. Cold Reg. Sci. Technol. 2020, 169, 102913. [Google Scholar]
- Hu, Q.; Xu, X.; Leng, D.; Shu, L.; Jiang, X.; Virk, M.; Yin, P. A method for measuring ice thickness of wind turbine blades based on edge detection. Cold Reg. Sci. Technol. 2021, 192, 103398. [Google Scholar] [CrossRef]
- Sundaresan, A.; Arunvinthan, S.; Pasha, A.A.; Pillai, S.N. Effect of ice accretion on the aerodynamic characteristics of wind turbine blades. Wind. Struct. 2021, 32, 205–217. [Google Scholar]
- Han, Y.; Lei, Z.; Dong, Y.; Wang, Q.; Li, H.; Feng, F. The icing characteristics of a 1.5 MW wind turbine blade and its influence on the blade mechanical properties. Coatings 2024, 14, 242. [Google Scholar] [CrossRef]
- Ibrahim, G.M.; Pope, K.; Muzychka, Y.S. Effects of blade design on ice accretion for horizontal axis wind turbines. J. Wind. Eng. Ind. Aerodyn. 2018, 173, 39–52. [Google Scholar] [CrossRef]
- Wang, Q.; Xiao, J.; Zhang, T.; Yang, J.; Shi, Y. A new wind turbine icing computational model based on free wake lifting line model and finite area method. Renew. Energy 2020, 146, 342–358. [Google Scholar] [CrossRef]
- Sheidani, A.; Salavatidezfouli, S.; Stabile, G.; Gerdroodbary, M.B.; Rozza, G. Assessment of icing effects on the wake shed behind a vertical axis wind turbine. Phys. Fluids 2023, 35, 095135. [Google Scholar] [CrossRef]
- Lu, H.; Xu, Y.; Li, H.; Zhao, W. Numerical study on glaze ice accretion characteristics over time for a NACA 0012 Airfoil. Coatings 2024, 14, 55. [Google Scholar] [CrossRef]
- Xu, Z.; Zhang, T.; Li, X.; Li, Y. Effects of ambient temperature and wind speed on icing characteristics and anti-icing energy demand of a blade airfoil for wind turbine. Renew. Energy 2023, 217, 119135. [Google Scholar] [CrossRef]
- Xu, Z.; Zhang, T.; Lian, Y.; Feng, F. A parametric study on the effect of liquid water content and droplet median volume diameter on the ice distribution and anti-icing heat estimation of a wind turbine airfoil. Results Eng. 2024, 22, 102121. [Google Scholar] [CrossRef]
- Wang, C.; Lin, W.; Lin, X.; Wu, T.; Meng, Z.; Cai, A.; Xu, Z.; Li, Y.; Feng, F. The influence of angle of attack on the icing distribution characteristics of DU97 blade airfoil surface for wind turbines. Coatings 2024, 14, 160. [Google Scholar] [CrossRef]
- Hannat, R.; Morency, F. Numerical validation of conjugate heat transfer method for anti-/de-icing piccolo system. J. Aircr. 2014, 51, 104–116. [Google Scholar] [CrossRef]
- Ahn, G.B.; Jung, K.Y.; Myong, R.S.; Shin, H.B.; Habashi, W.G. Numerical and experimental investigation of ice accretion on rotorcraft engine air intake. J. Aircr. 2015, 52, 903–909. [Google Scholar] [CrossRef]
- Clift, R.; Grace, J.R.; Weber, M.E. Bubbles, Drops, and Particles; Academic Press: New York, NY, USA, 1978. [Google Scholar]
- Beaugendre, H.; Morency, F.; Habashi, W.G. Development of a second generation in-flight icing simulation code. J. Fluids Eng. Trans. ASME 2006, 128, 378–387. [Google Scholar] [CrossRef]
- Fouladi, H.; Habashi, W.G.; Ozcer, I.A. Quasi-steady modeling of ice accretion on a helicopter fuselage in forward flight. J. Aircr. 2013, 50, 1169–1178. [Google Scholar] [CrossRef]
- Tompson, B.E.; Marrochello, M.R. Rivulet formation in surface-water flow on an airfoil in rain. AIAA J. 1999, 37, 45–49. [Google Scholar] [CrossRef]
- Beaugendre, H.; Morency, F.; Habashi, W.G.; Benquet, P. Roughness implementation in FENSAP-ICE: Model calibration and influence on ice shapes. J. Aircr. 2003, 40, 1212–1215. [Google Scholar] [CrossRef]
- Battisti, L. Wind Turbines in Cold Climates; Springer: Dordrecht, GX, The Netherlands, 2015. [Google Scholar]
- Shin, J.; Bond, T.H. Results of an Icing Test on a NACA0012 Airfoil in the NASA Lewis Icing Research Tunnel. In Proceedings of the 30th Aerospace Sciences Meeting & Exhibit, Reno, NV, USA, 6–9 January 1992; pp. 1–19. [Google Scholar]
- Guiet, J.; Reggio, M.; Teyssedou, A. Implementation and Application of the Lattice Boltzmann Method Using Matlab. Eng. Appl. Comput. Fluid Mech. 2011, 5, 117–126. [Google Scholar] [CrossRef]


| Types | Values |
|---|---|
| Far-field | Pressure: 101,325 Pa |
| Temperature: 248–268 K | |
| LWC: 1 g/m3 | |
| MVD: 20 μm | |
| Speed: 10 m/s | |
| Wall | No slip |
Disclaimer/Publisher’s Note: The statements, opinions and data contained in all publications are solely those of the individual author(s) and contributor(s) and not of MDPI and/or the editor(s). MDPI and/or the editor(s) disclaim responsibility for any injury to people or property resulting from any ideas, methods, instructions or products referred to in the content. |
© 2024 by the authors. Licensee MDPI, Basel, Switzerland. This article is an open access article distributed under the terms and conditions of the Creative Commons Attribution (CC BY) license (https://creativecommons.org/licenses/by/4.0/).
Share and Cite
Xu, Z.; Na, P.; Zhang, T.; Wang, Z. Ice Distribution Characteristics on the DU25 and NACA63-215 Airfoil Surfaces of Wind Turbines as Affected by Ambient Temperature and Angle of Attack. Coatings 2024, 14, 929. https://doi.org/10.3390/coatings14080929
Xu Z, Na P, Zhang T, Wang Z. Ice Distribution Characteristics on the DU25 and NACA63-215 Airfoil Surfaces of Wind Turbines as Affected by Ambient Temperature and Angle of Attack. Coatings. 2024; 14(8):929. https://doi.org/10.3390/coatings14080929
Chicago/Turabian StyleXu, Zhi, Peiyao Na, Ting Zhang, and Zixin Wang. 2024. "Ice Distribution Characteristics on the DU25 and NACA63-215 Airfoil Surfaces of Wind Turbines as Affected by Ambient Temperature and Angle of Attack" Coatings 14, no. 8: 929. https://doi.org/10.3390/coatings14080929