Abstract
Manufacturers of adhesives for industrial use determine the strength of adhesive joints during shear tests. Most often, components made of the same material are joined. In contrast, the roughness of the surfaces to be joined results from the use of a specific surface treatment technology. In adhesive manufacturers’ recommendations for metal-to-metal joints, surface technologies can be found without specifying numerical requirements for roughness. Modern techniques for shaping the geometric accuracy of components allow the formation of determined irregularities on the surface, which are characterised by their height and mutual distribution. Furthermore, regular irregularities can be obtained by using the appropriate tool and technological machining parameters. In this way, surfaces with similar load-bearing capacity, core volume, texture or expected hydrophobic properties can be produced by various methods. However, a basic prerequisite is the careful definition of the numerical requirements, both for the basic roughness indices and those of a complementary nature. As a rule, the strength of the adhesive joint is also lower than the strength of the adhesive itself. The strength of an adhesive joint depends on the ‘mechanical anchorage’ of the adhesive and the adhesion phenomenon on the surface. The research assumes that it is possible to induce an interaction between the geometric state of the surface and the properties of the adhesive, so as to guarantee the maximum strength of the adhesive joint. To verify this, a series of experimental tests were developed and carried out for two different adhesives characterised by different viscosities and offered bond strength. Based on the tests carried out, recommendations were made to the designers of adhesive joints, where, in addition to the height of the surface irregularities, the properties related to fluid retention and the shape of the irregularities in the valleys should be determined.
1. Introduction
In mechanical and equipment engineering, there are many connections that include both detachable [1,2,3,4] and non-detachable joints [5,6,7,8,9,10,11]. Most often, these are important bonds that enable structures to function properly. This article deals specifically with one type of such connections, which are adhesive joints transferring shear loads in structures that use different types of adhesives in their construction [12,13]. The offered strength, durability, and resistance of the adhesive joint to aggressive environmental influences can be at a level similar to mechanical joints. However, the simple technology and low cost of bonding processes under production conditions place this type of joint at an advantage over mechanical joints. Furthermore, adhesive joints usually achieve an even distribution of stresses in the adhesive layer, in contrast to, for example, welded joints, where additional residual stresses are often present [14]. Among the advantages of adhesive joints is also that they can be formed from both similar and dissimilar materials (for instance: metal and polymer laminate composite, metal and ceramic). Hence, increasing interest in this type of joint has been observed in recent years.
The feasibility of technological processes such as bonding, dyeing, or varnishing is determined by the wettability of the surfaces to be joined. This phenomenon plays a special role where adhesive joints are created, as it is an important indicator of the correctness of the surface structure.
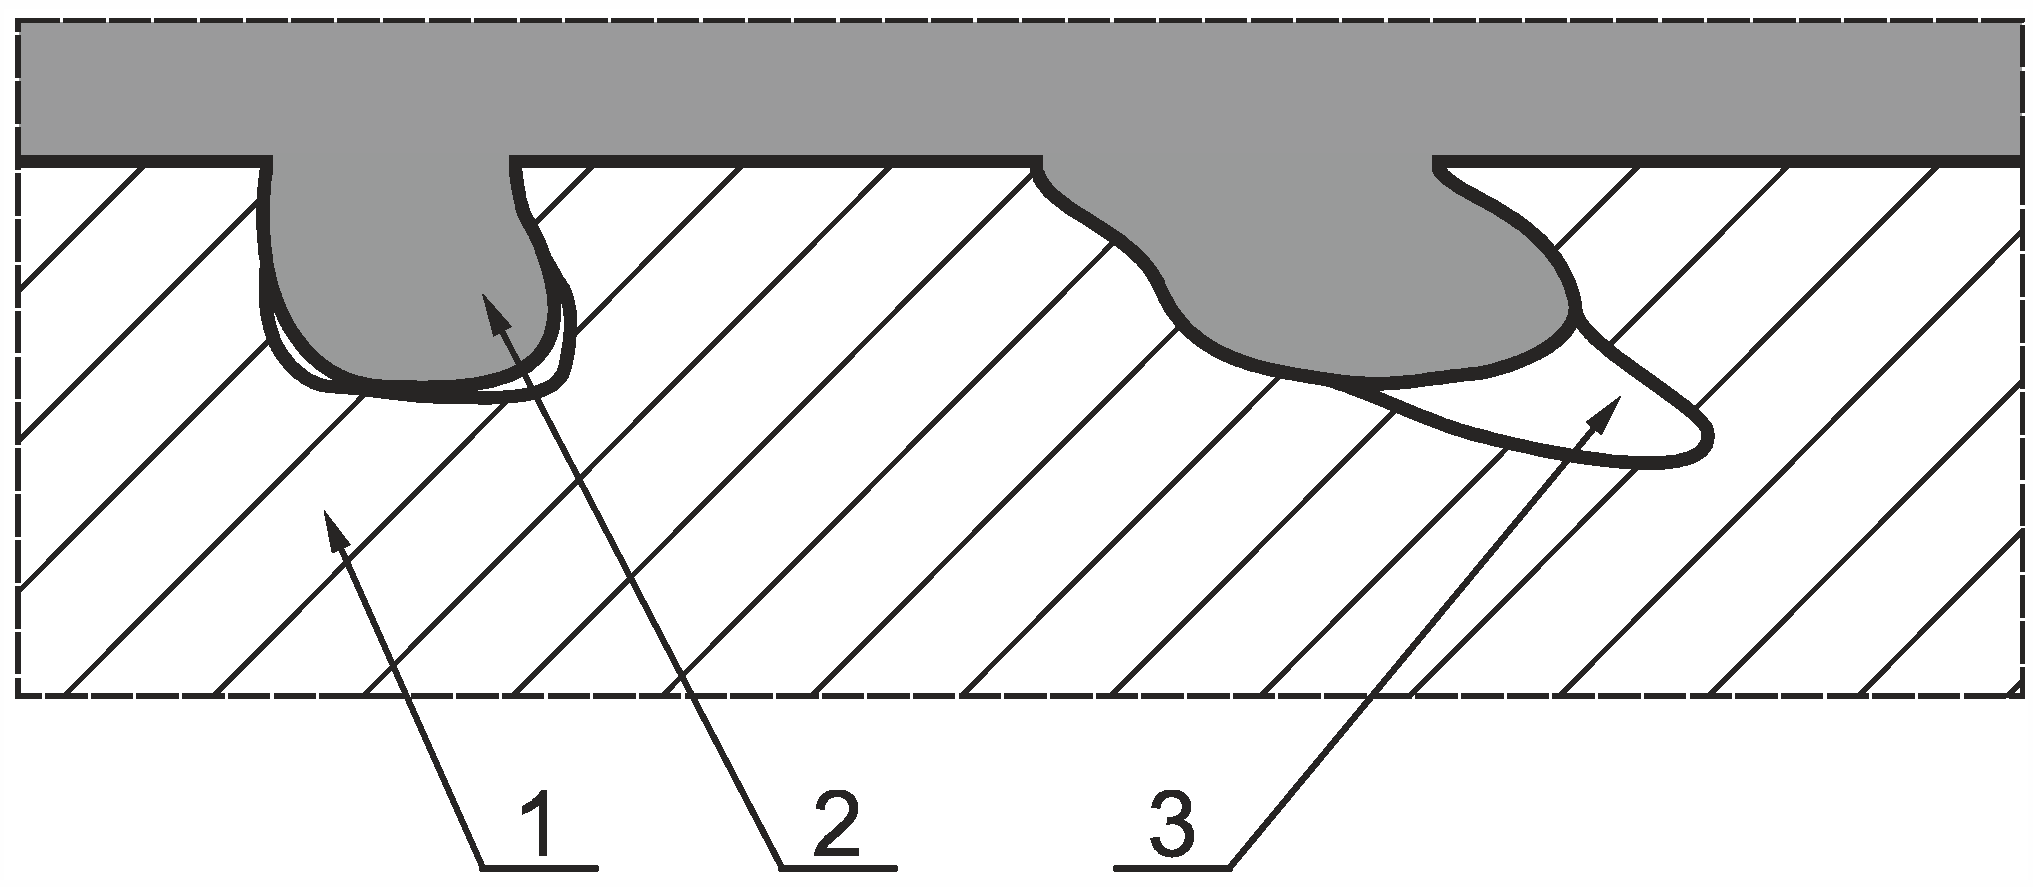
In order for an adhesive joint to form, there must be an interaction between the adhesive and the parts to be joined, i.e., adhesion [15]. In general, adhesion is the bonding force between two surfaces. It is a phenomenon occurring on a surface that can be described by various theories including mechanical or electrostatic theory [16,17]. The mechanical theory of adhesion assumes that adhesion is the result of the resistance of the adhesive to an external force as a result of mechanical deposition. This deposition can be augmented by the selection of a specific surface treatment, affecting the formation of irregularities by which the geometric surface area of the adhesive is increased (Figure 1). As the roughness of the surface layer of the part increases, a greater number of indentations are created into which the adhesive can penetrate [18,19]. It can be concluded from this that surfaces with an optimum roughness can guarantee a higher strength of adhesive joints than completely smooth surfaces [20]. However, it is not at all easy to create the right geometrical structure of the surface, as too many narrow indentations cause problems for the adhesive, especially with a high viscosity, to fill them. This is because the adhesive will only remain on the tops of the irregularities, and air bubbles are trapped in the interiors of the valleys, resulting in a weakened joint [21].
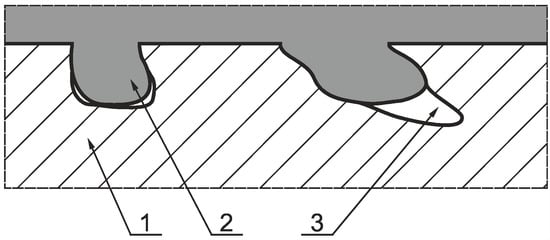
Figure 1.
Diagram of mechanical adhesion: (1) adhesive surface; (2) adhesive; (3) non-adhesive interiors of irregularities.
The electrostatic theory of adhesion, on the other hand, states that the forces responsible for the interaction between the adhesive and the adjacent parts are electrostatic in nature, meaning that there are relatively positive and negative areas on both the surface of the material and the bond that attract each other, leading to adhesion [22].
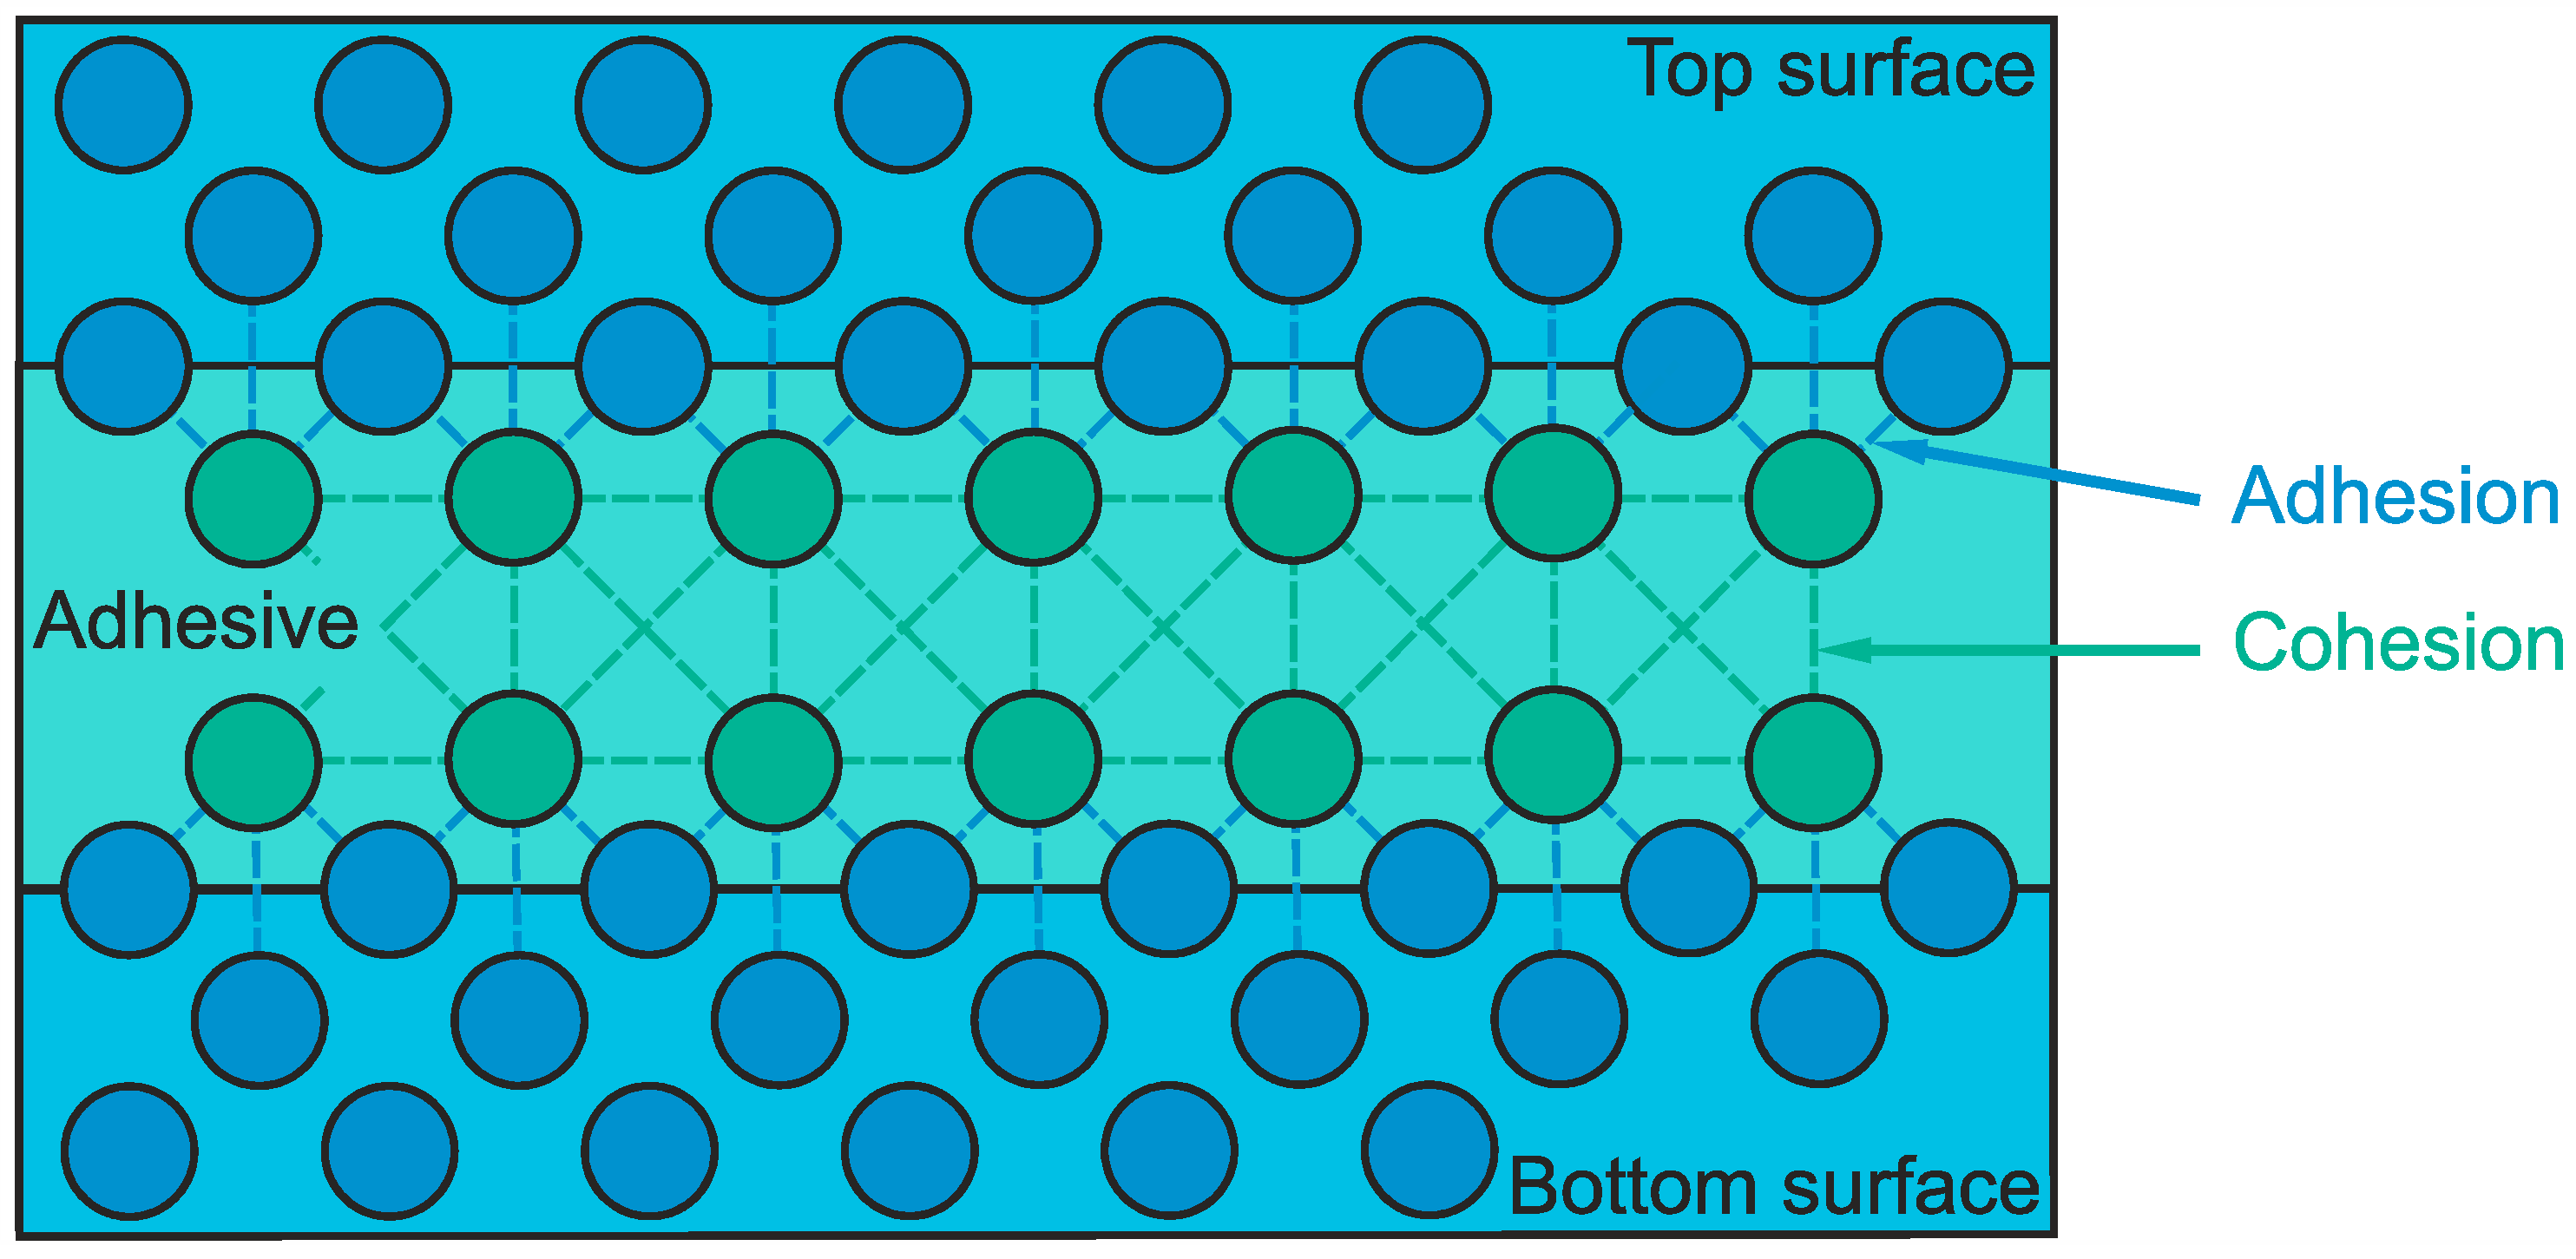
The second phenomenon that is important in adhesive joints is cohesion, i.e., the presence of sufficient internal consistency in the adhesive to produce a bond with the expected strength [22]. The polymers in the adhesive are responsible for this, with areas of partial positive or negative charge causing strong intermolecular interactions (Figure 2).
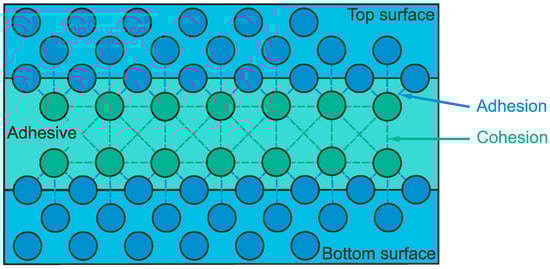
Figure 2.
Mechanics of the adhesive joint.
It is worth noting that adhesive failure is the failure of the interfacial bond between the adhesive and the substrate, while cohesive failure occurs when a crack propagates through the adhesive layer and causes the adhesive layer to remain on both surfaces of adhesion.
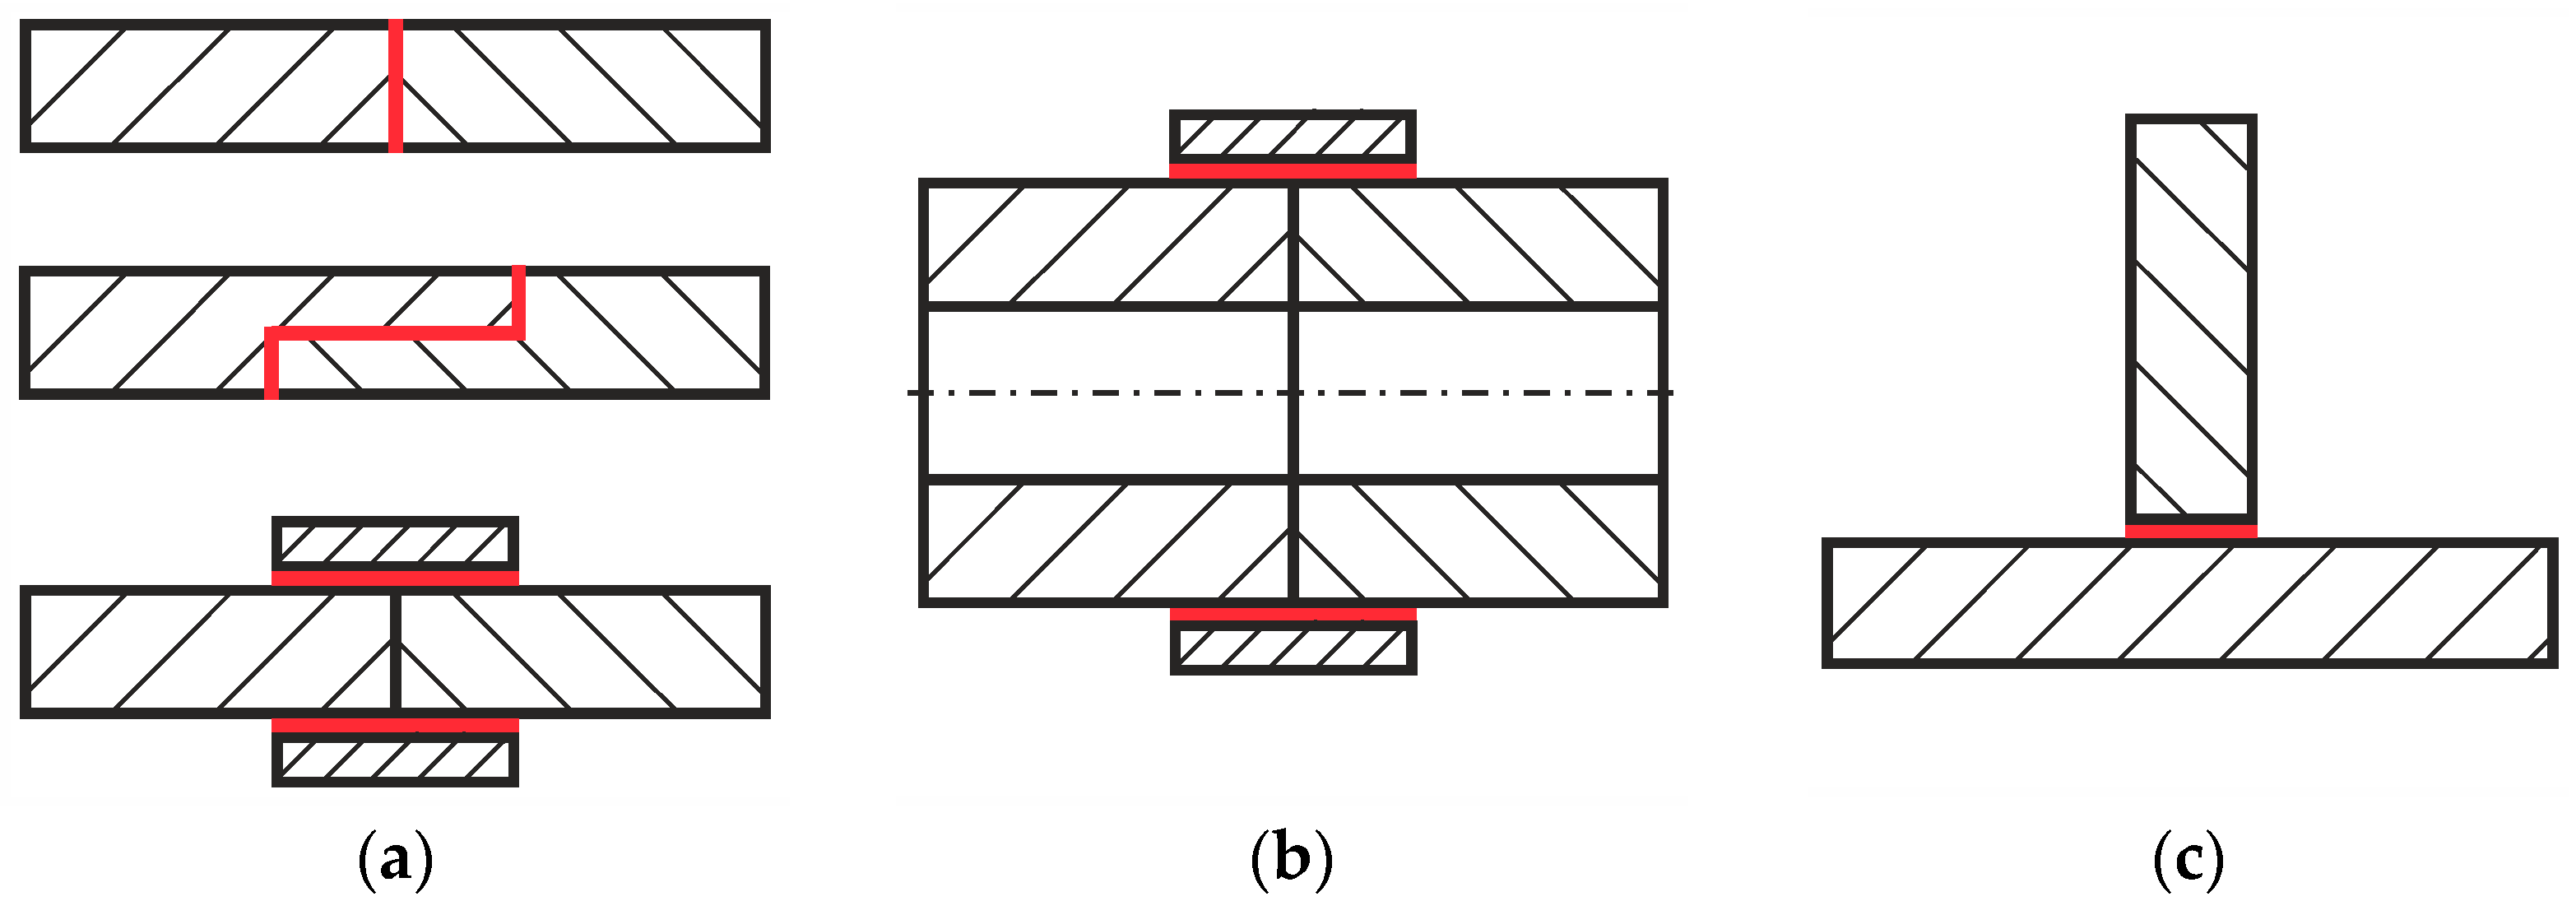
The entire process of creating an adhesive joint must be properly designed. Above all, one of the most important issues is the uniform distribution of stress in the parts to be joined. Therefore, the designer, using knowledge or numerical simulations, should determine how the parts to be joined will be loaded. The type of adhesive joint can then be selected, the surface area determined, and the type of adhesive chosen to ensure that the predetermined stresses can be transferred. In the technology for machining the surfaces of interconnected parts, a surface roughness condition is usually given that cannot be exceeded. Typically, the value of roughness parameters such as Ra, Rz, or Rmax [23] can be found on construction drawings. Depending on the position of the surfaces of the parts to be joined, the adhesive joints encountered in practice can be divided according to the classification shown in Figure 3. A broader breakdown of adhesive joints has been described by Kubit et al. [24] and Wei et al. [25], among others.

Figure 3.
Basic types of adhesive joints: (a) joints used for plates; (b) pipe joint; (c) angle joint.
During the design process of an adhesive joint, aspects such as the possibility of reducing peeling and splitting forces, which affect the disturbance of the stress distribution in the joint, should be taken into account [26]. Most often, this also involves avoiding eccentric forces in lap adhesive joints, which, like peeling forces, lead to disruption of shear stress distributions in such joints. In addition, eccentric forces create a bending moment, which is responsible for the formation and development of tensile stresses at the ends of the bond.
Finally, an important aspect is to ensure that the bonding area can be maximised. Too small a surface area can result in high peeling or splitting stresses, while its maximisation significantly hinders the technological performance of the adhesive joint.
In addition to the irregularities, which are usually measured in height and length (e.g., according to ISO 4287 [27] or ISO 4288 [28]), the real surface also contains texture (otherwise known as morphology), which is of increasing interest. The texture depends mainly on the geometry of the tool used for machining and the kinematic-geometric relationships during the manufacturing process. The three-dimensional state of a surface texture can be described using a wide variety of indices. Among them, a distinction should be made between groups depending on the application, i.e., height, functional, spatial, volumetric, and indices determined from the course of the bearing area curve in accordance with ISO 25178-2 [29]. Surface texture surveys are most often carried out with non-contact measuring systems using the confocal effect or white light interference. Just as important as the acquisition of the point cloud of the measured surface is its subsequent post-processing (artefact removal, levelling, or filtering). Only from the set of points prepared in this way are the indices describing the investigated aspect of the surface texture determined. For the strength of the adhesive joint, in addition to typical surface height parameters such as Sa, Sq, or Sz [30], indices from the volumetric group can be particularly useful. They contain information about the usable adjacent surface, limited by the geometrical conditions of the adhesive joint or overlaps. The research hypothesis adopted in this article is that deliberate shaping of the product surface, leading to an interaction between the surface texture and the adhesive properties, can guarantee maximum strength of the adhesive joint.
Adhesive joints will only fulfil their function in a construction if they are characterised by high strength. Strength is understood here as the ability to withstand destructive mechanical influences, which can be considered to be loads of various kinds. In order to be able to use adhesive joints in a construction, strength tests must first be carried out to assess their quality. An important aspect of such tests is that the critical load value at which failure of the joint occurs can be determined. Therefore, it is important to know the strength of the adhesive joints during their design and operation, which can be determined using the various methods for testing adhesive joints described, for example, in [21,31,32]. The most important of these methods are the single lap shear test, the tensile test, and the peel test, which are carried out for adhesive joints in accordance with the relevant standards.
The most commonly used method for the adhesion strength of joints is their shear test [33,34,35,36]. This is the predominant method of load realisation among designers for adhesive joints, because in this way the joints are able to carry the maximum load values. This test is both simple and economically advantageous. Above all, it replicates and determines the value of the load to which adhesives are normally subjected in service. The shear strength of the adhesive and the shear modulus are usually given as the basic strength properties of the adhesive. Therefore, this article also investigates the shear strength of adhesive joints.
The impact of surface topography on the operating properties of machine parts is demonstrated, for example, by Grzesik [37]. The relationships between surface topography parameters and the performance properties of machine parts shaped by different cavity machining processes are presented in this article. It also identifies the dominant 2D and 3D roughness parameters in relation to contact deformation, fatigue strength, friction and wear, and corrosion resistance.
With regard to adhesive joints, studies of the impact of the type of joint surface treatment and the surface roughness obtained with them on the load-bearing capacity and strength of the joints have been conducted in several articles. Zielecki et al. [38] investigated the impact of surface roughness after milling and sandblasting on the load-bearing capacity of lap adhesive joints made of aluminium alloy 2024. Their research proved that the use of sandblasting after milling increases the load-bearing capacity of adhesive joints. Similar tests, but for lap joints in S235JR steel are described by Zielecki et al. [39]. The results of a preliminary study on surface microtexturing of Ti-6Al-4V and SS316L alloys using high-pulse fibre lasers to improve bonding performance were published by Tseng and Chen [40]. Similar studies are described in the study by Moroni et al. [41]. In contrast, the effect of plasma treatment parameters on the mechanical strength of adhesive joints was studied by Mandolfino et al. [42] and Qiao et al. [43]. Da Silva et al. [44], Alderucci et al. [45], and Zhou and Ning [46] showed the effect of grooves on the strength of adhesive joints. Zarei et al. [47] discussed the impact of surface roughness on the mechanical response of silicone-based adhesive joints. They introduced a dimensionless parameter, defined as the ratio of the adhesive thickness to the root mean square roughness, which can be used as an index to evaluate the importance of roughness in the peel response. Van Dam et al. [48] investigated the impact of surface roughness and chemistry on the initial adhesion and durability of steel–epoxy adhesive joints. Based on a combination of different mechanical tests, they evaluated the joint performance under different environmental and loading conditions. Guo et al. [49] explored the effect of surface treatment and adhesive thickness on the shear strength of precision adhesive joints. Hygrothermal aging of adhesive joints with nanotube-reinforced adhesives under different surface treatments of carbon fibre/epoxy substrates was investigated by Gude et al. [50]. Leena et al. [51] described the effect of surface pretreatment on the surface characteristics and adhesive bond strength of an aluminium alloy. Akpinar [52], on the other hand, proposed chemical etching and the use of a nanostructured epoxy additive coating to increase the adhesion strength in aluminium joints bonded with a nanostructured additive adhesive. The effect of protective and decorative coatings on the strength of hot-dip galvanised steel sheet adhesive joints is described by Rudawska [53].
Assessments of adhesive joints are also carried out using numerical methods. Rudawska and Dębski [31] evaluated the strength of single-lap adhesive joints of 2024PLT3 and 7075PLT0 aluminium alloy sheets loaded in shear using the finite element method (FEM). The tests completed made it possible to simulate the failure process of the adhesive joint and to determine the moment of initiation of this failure. Using FEM, Xiong et al. [54] investigated the impact of adhesive-embedded inclusions on the stress distribution and strength of single-lap adhesive joints. Other works in which the strength behaviour of lap adhesive joints was simulated using FEM include [55,56].
Despite the extensive literature on studies of the impact of the structure of adjacent surfaces on the properties of adhesive joints, the topic is still not exhausted. In order to fill the knowledge gaps on this subject, our article describes the results of a study showing that, with proper surface preparation and quality assurance, the external dimensions of surfaces bonded with adhesive can be reduced without losing the strength of the joint. The paper uses the most common adhesives in technology, for which the manufacturers do not provide technology specifications for the surfaces to be bonded, leaving considerable freedom in their preparation. Metallic surfaces of the specimens were selected for testing, as objects for which the state of the geometrical structure can be achieved in a reproducible manner, and the results of the research work can also be reproduced (in other scientific centres or by engineers in industry).
2. Programme of Experimental Studies
In order to determine the appropriate surface shaping conditions, the relationship of the surface technology to the strength of the joint was investigated, with the description of the surface texture condition using the following indices [57,58]:
- Vv—void volume per unit area for a given material fraction (mm3/mm2);
- Vvv—volume of valley voids located at a given surface level (mm3/mm2);
- Vvc—volume of the core void space (mm3/mm2).
In addition, functional indices based on the bearing area curve were also selected to distinguish between surface features having the same Sa or Sz index value. From this group, the following were selected for testing:
- Svk—reduced valley depth, a measure of the valley depth below the core roughness (µm);
- Sci—surface core fluid retention index representing the ability of the core to retain fluid through the inequality core (no unit);
- Svi—surface valley fluid retention index representing the ability of valleys located below the core to retain fluid (no unit).
Of the three functional indices mentioned above, the Svk index is particularly important, as it is most often used to measure the ability of sliding surfaces to hold fluid, where lubricant can accumulate in the indentations of irregularities created. In the case of an adhesive joint, on the other hand, the value of this index can indicate the degree to which the adhesive fills the irregularities as it is applied to the surface. Large values of this parameter are favourable for surfaces in need of lubrication, and this article examines whether the same relationship exists for adhesive surfaces. In turn, the values of the Sci and Svi indices can depend on the viscosity of the adhesive.
Depending on the surface treatment, a different sample specimen roughness can be obtained. Its value and the shape of the irregularities determine the wettability of the adjacent surfaces [59]. The type of machining used contributes to the development of a surface texture that influences adhesion. On the other hand, an increase in the number of indentations results in an increase in the active contact area between the adhesive and the material to be bonded, as the surfaces have different adhesive properties after each of the selected processing technologies.
2.1. Specimen Preparation and Surface Texture Measurements
To investigate the extent to which a change in the state of the geometric texture of the surface can alter the strength of adhesive joints, an experiment was planned in which the surfaces of the adhesive specimens were subjected to three different treatments, such as milling (M), grinding (G), and polishing (P).
The specimens were radially turned with a feed per revolution of 0.15 mm at a cutting speed of 100 m/min and depth of cut of 1 mm. The surfaces of the specimens were then ground with a feed per revolution of 1.5 mm at a cutting speed of 5.5 m/min and a depth of cut of 0.2 mm. Finally, the specimens were polished by hand on a laboratory grinder for metallographic specimens using aqueous abrasive paper with a gradation of P2000.
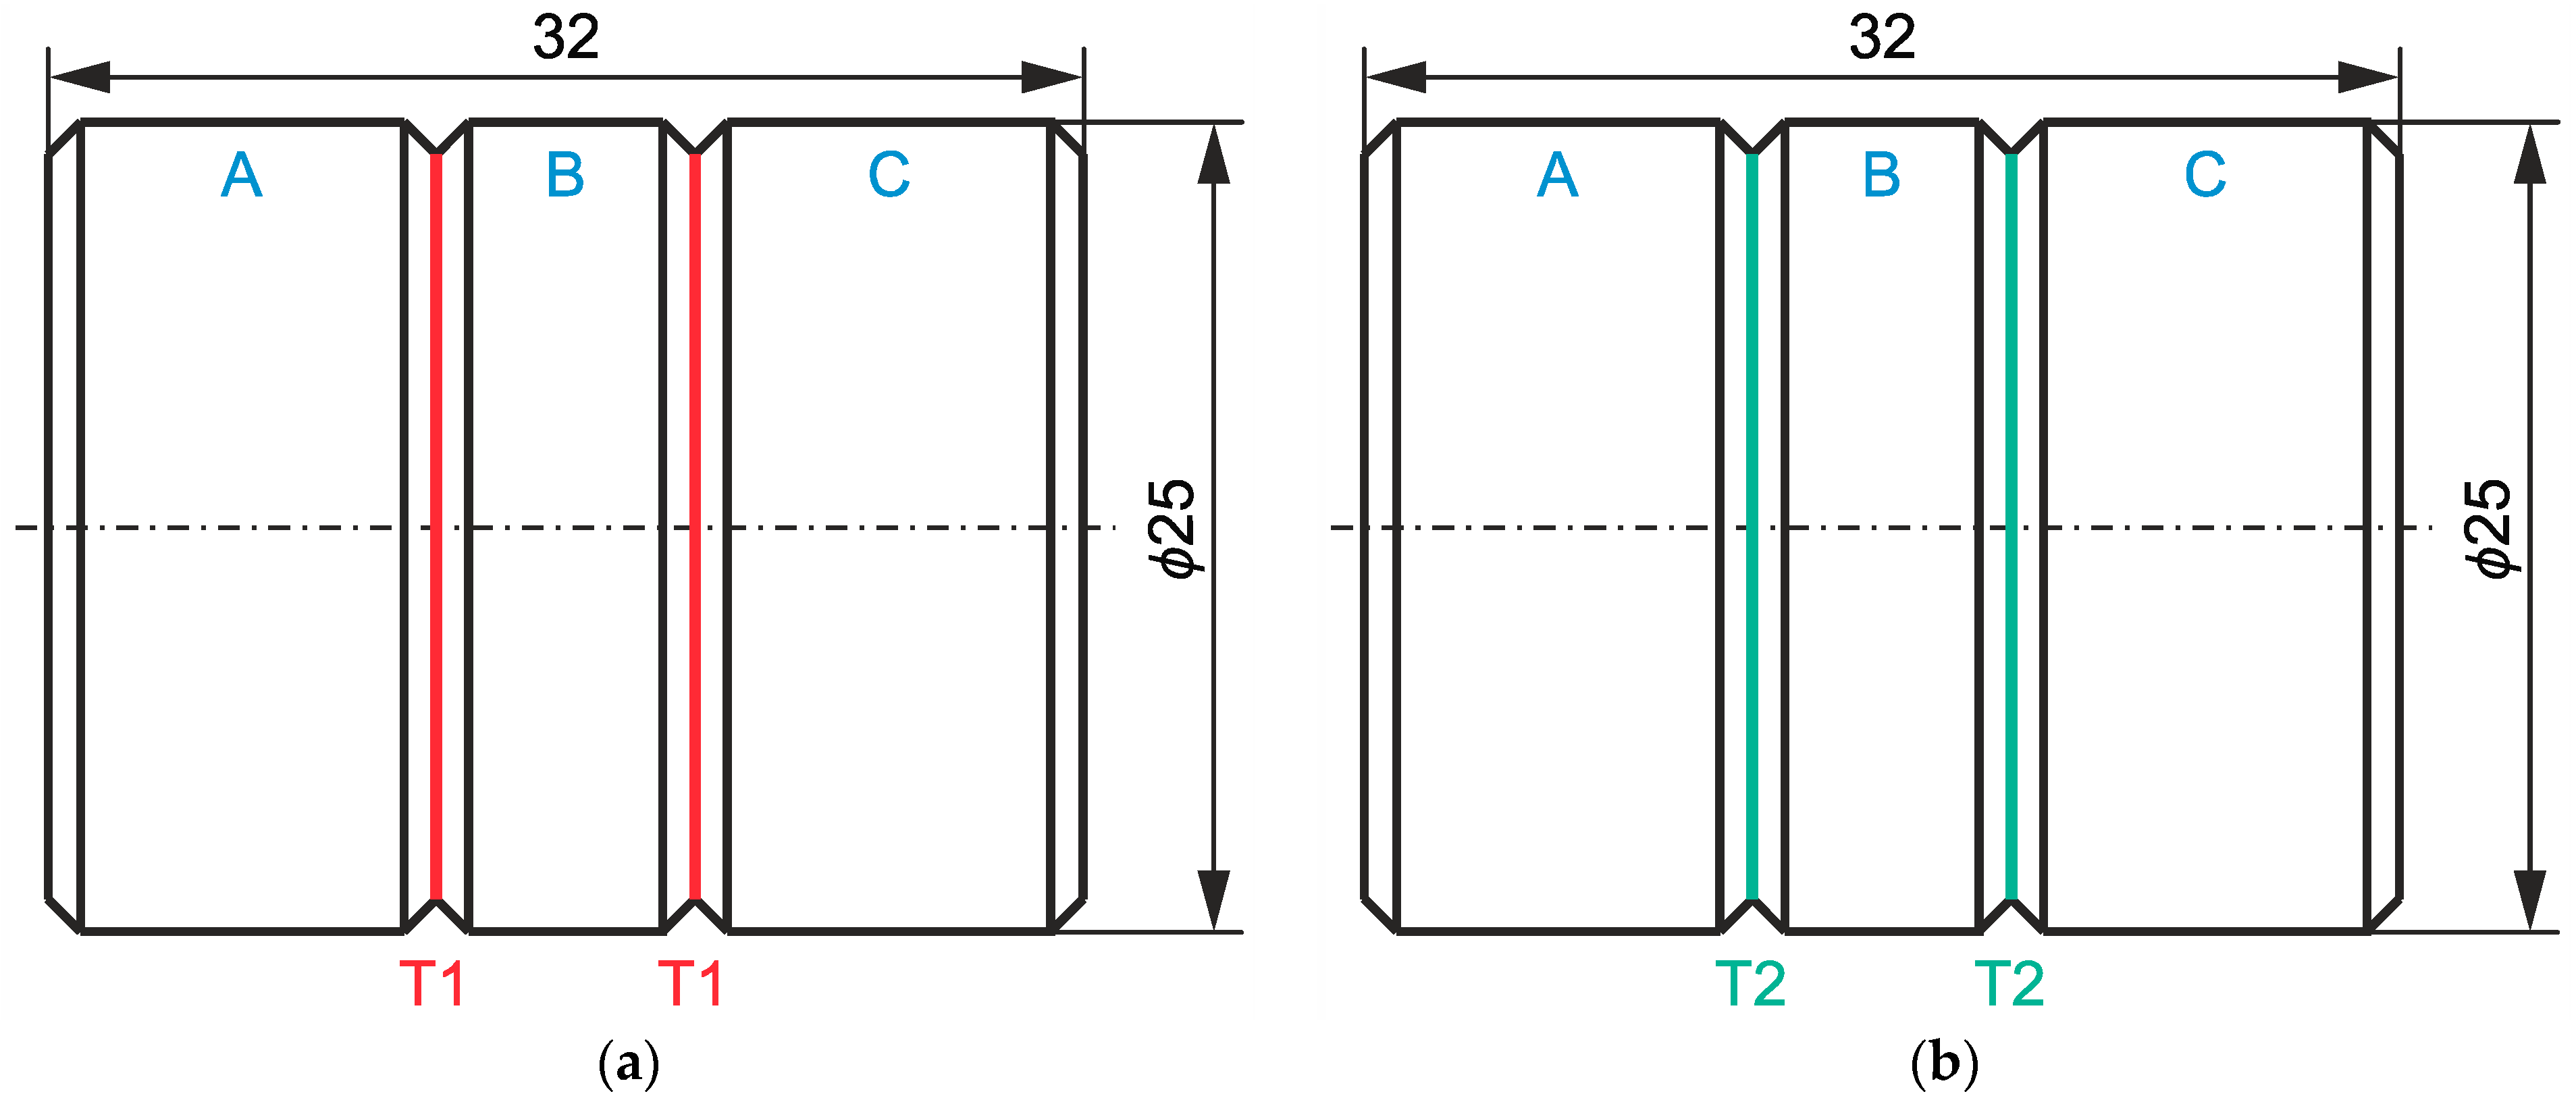
The adhesive joints were made of three separate cylindrical specimens marked as in Figure 4 with symbols A, B, and C. Three specimens of each of types A, B, and C were prepared. Stainless steel X46Cr13 (1.4034) was used as the material for the bonded specimens. Two adhesives were used to bond the samples: T1 epoxy adhesive and T2 cyanoacrylate adhesive, with characteristics given in Table 1.
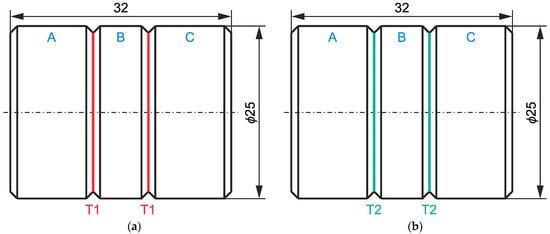
Figure 4.
Diagram of the adhesive joint for: (a) T1 epoxy adhesive sample; (b) T2 cyanoacrylate adhesive sample.

Table 1.
Characteristics of T1 and T2 adhesives.
The layer thickness of the adhesive coating was not controlled; the specimens were pressed with a force of approximately 100 N throughout the adhesive setting period. The main objective of the tests was to determine representative numerical values of the indices of geometrical texture of the surface (for T1 and T2 adhesives), which would constitute an acceptance level for surfaces prepared with any technology. In this respect, adhesive manufacturers usually quote maximum adhesive bond strength values for steel–steel surfaces prepared by sandblasting. From practice, it has been found that the value of the Sa index of such a prepared surface can range from 6.3 to 63 μm or even wider. As a supplement to the technological requirements, the Svk and Svi indices can be used, depending on the type and viscosity of the adhesive. Using this knowledge, the designer can define requirements (numerical, as to the type and value of a given indicator of the geometrical texture of the surface), which can be realised by any technique. At the same time, after measurement and evaluation, the designer can be sure that the strength of the adhesive joint in series production of the products will not be radically changed.
As mentioned above, individual joints were created from three specimens (A, B, and C). As three of each sample were prepared and two different types of adhesive were used (as shown in Figure 4), a total of 18 types of adhesive joints were created, the association of which is summarised in Table 2. In each joint, the four faces of the specimens (located at the contact between specimens A and B and B and C) were bonded together. The evaluation of the texture of these surfaces was carried out according to the following scheme:
Table 2.
Programme of experimental studies.
- For sample B, both faces were examined;
- For the other specimens, only one selected face of specimens A or C was examined, assuming that they were similar.
Thus, a total of 54 specimen faces were measured.
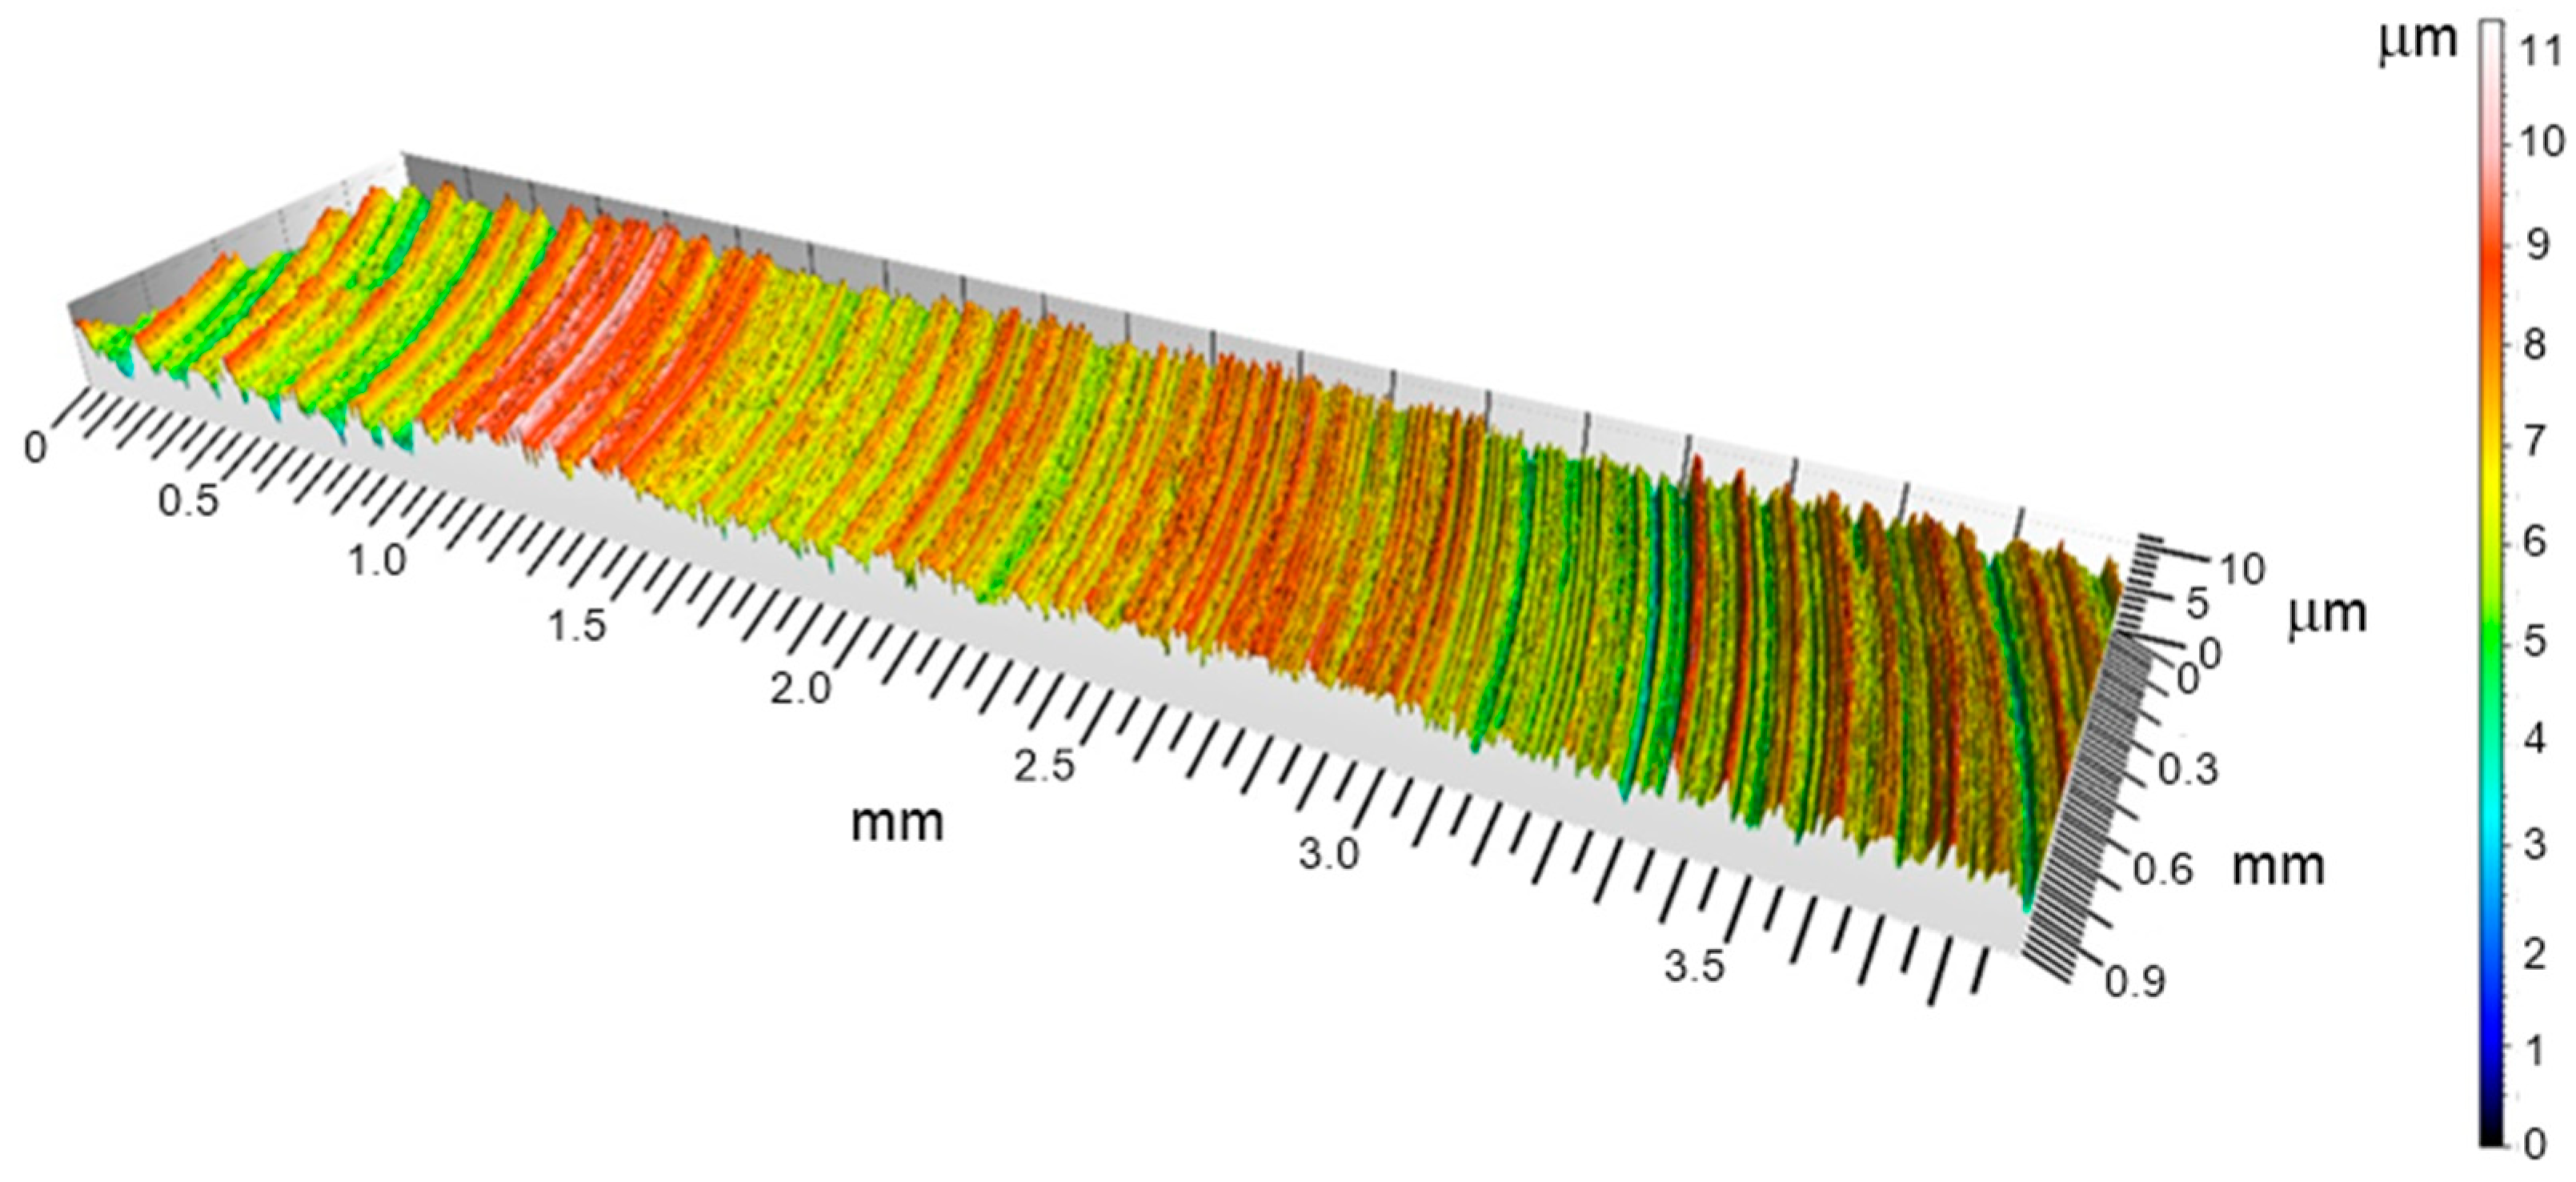
After machining, all surfaces were cleaned using an ultrasonic cleaner with acetone. This removed contaminants from the surfaces and, in particular, residues of cutting fluids that had been used in previous machining operations. The next step was to measure the surface texture of the specimens, an example of which is shown in Figure 5, Figure 6 and Figure 7.
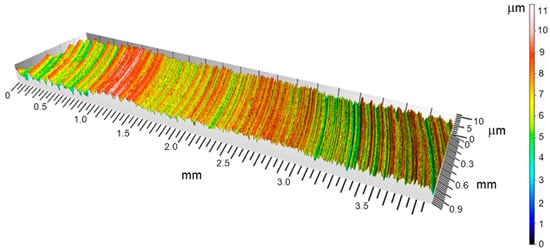
Figure 5.
Surface view of an example specimen obtained after milling treatment.
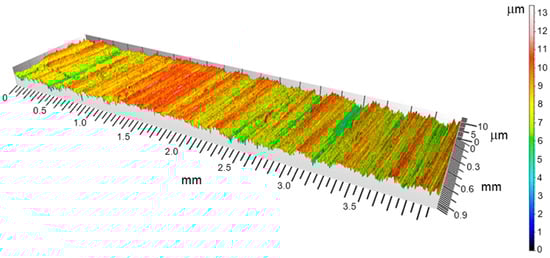
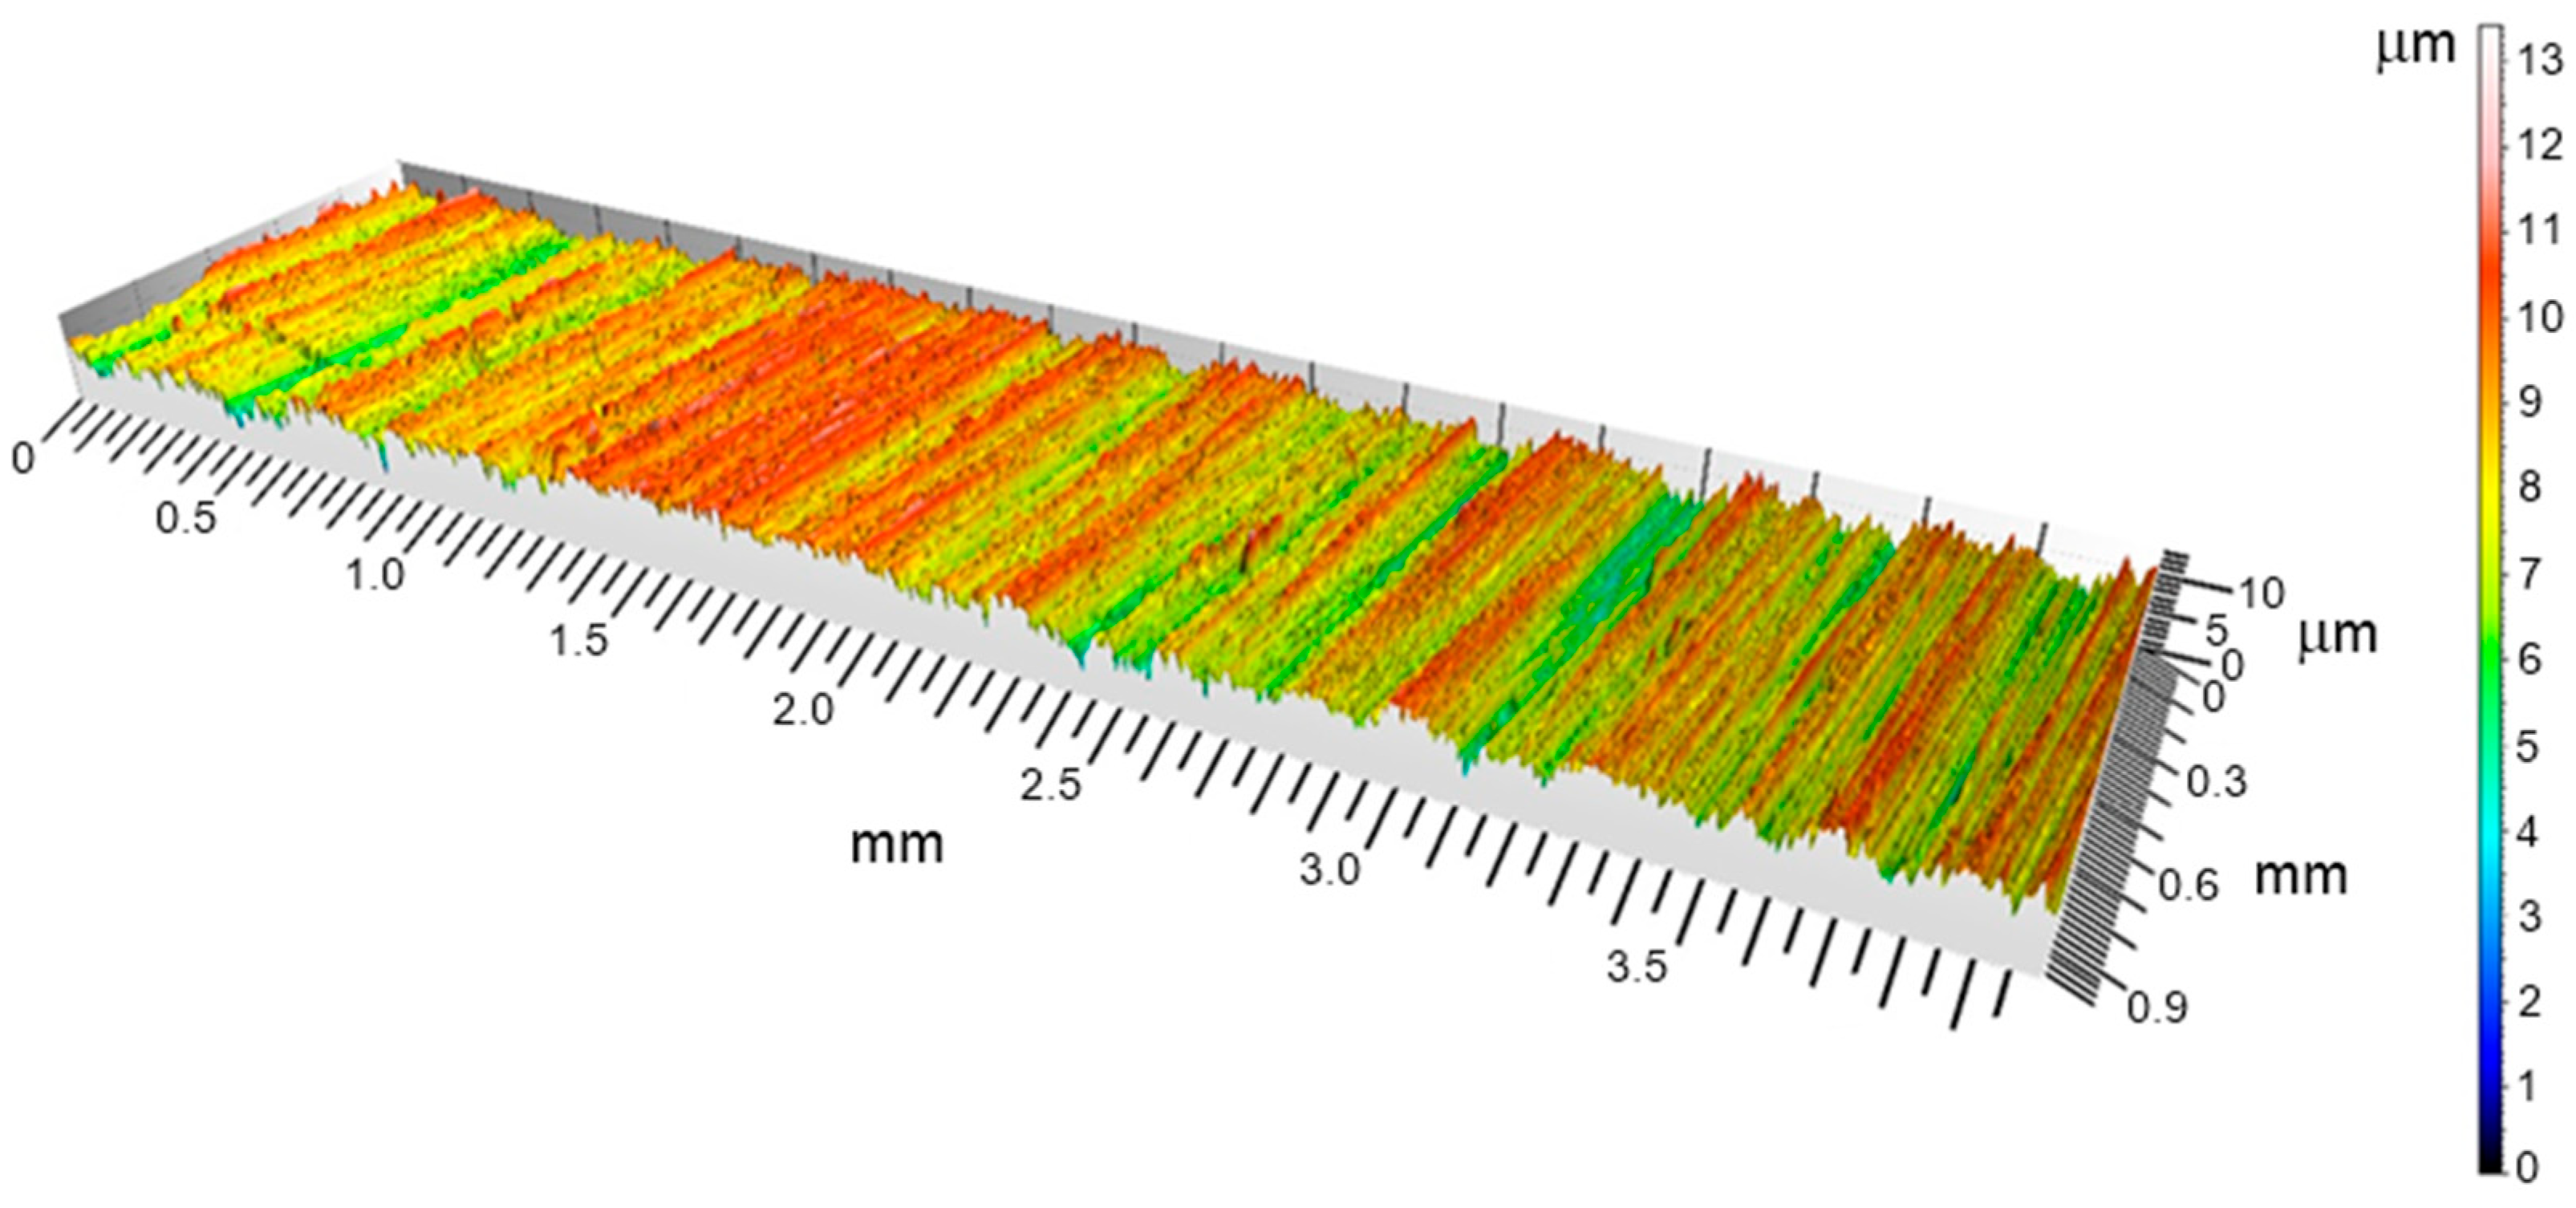
Figure 6.
Surface view of an example specimen obtained after milling and grinding treatment.

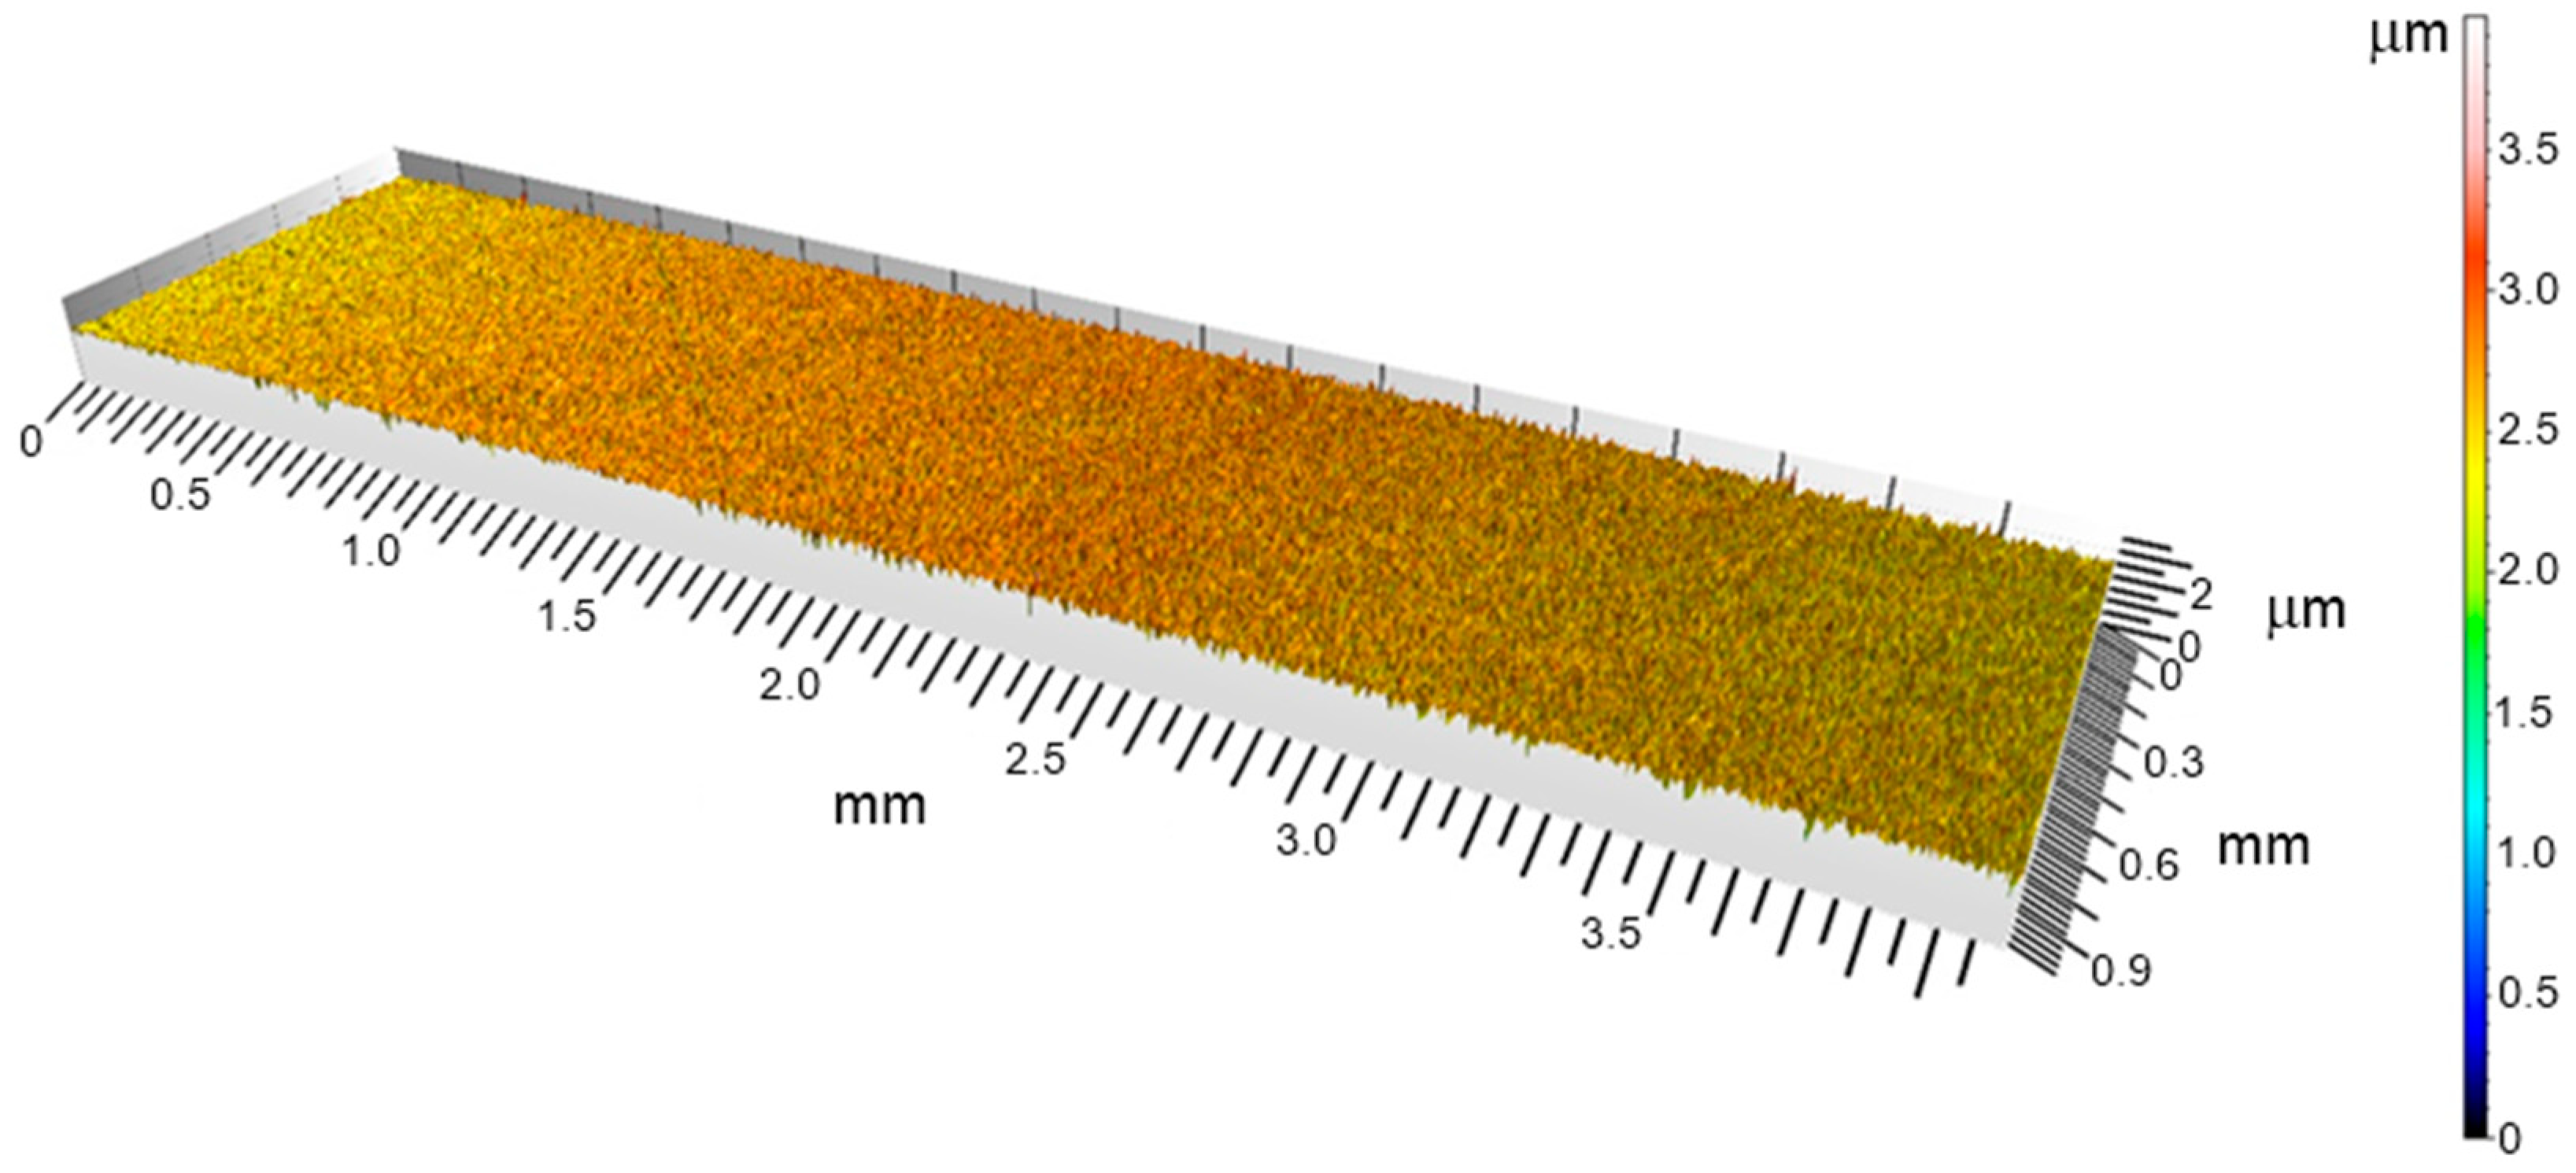
Figure 7.
Surface view of an example specimen obtained after milling, grinding and polishing treatment.
An Altisurf A520 multisensor measurement system (Altimet, Thonon-les-Bains, France) was used to measure the surface topography, which was equipped with a CL2 confocal white light sensor with an operating range of up to 400 μm and a resolution in the optical axis of the instrument of 22 nm. Digital processing of the recorded point cloud and determination of selected values of surface texture indices were carried out using MountainsMap Premium 7.4 software (Digital Surf, Besançon, France). The surface was aligned on LS-plane and the artefact threshold was automatically set below 0.05% and above 99.95% of the core points. The roughness as the S-L surface was extracted on a metrological filter according to ISO 16610-61 [61] with a cut-off size of 0.8 mm. The resulting average values of the measured surface parameters for each specimen are presented in Table 3.
Table 3.
Average values of selected surface texture indices on the surfaces of bonded specimens (A, B, and C).
So far, the literature in the field of adhesive bonding technology does not encounter specific requirements for the state of the surface texture (as described by parameters according to ISO 25178-2 [29], which allow maximum adhesion forces to be achieved). Therefore, in our study, in addition to a set of the most common parameters (i.e., Sa, Sq, and Sz), additional indices of surface texture state (such as Svi and Sci) were selected, as mentioned at the beginning of Section 2.
The data in Table 3 are also presented as graphs in Figure 8, Figure 9 and Figure 10. By analysing the graph of arithmetic mean surface heights Sa (see Figure 8), it can be seen that grinding resulted in a greater geometric development, i.e., an increase in surface roughness, compared to the other machining methods for the specimens. Consequently, more irregularities appeared on the surface compared to milling. Both milling itself and additional grinding of the specimens result in regular irregularities on the surface, which provide a very good base for the mechanical anchorage of the adhesive. The reverse is true for the surface of polished specimens. In this case, an approximately tenfold decrease in roughness can be observed compared to the preceding grinding. The polished surfaces show an average Sa value of 0.12 µm, which means that their roughness has decreased by an average of 1.1 µm compared to the preceding treatment.
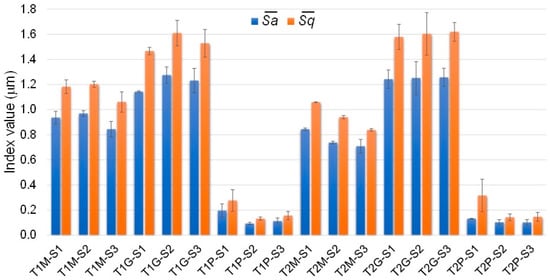
Figure 8.
Average values of and indices for the study surfaces.
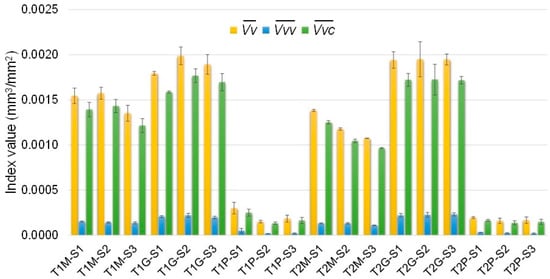
Figure 9.
Average values of , and indices for the study surfaces.
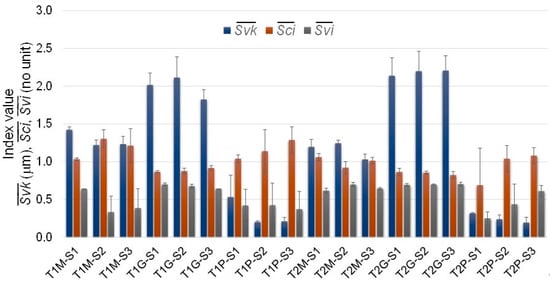
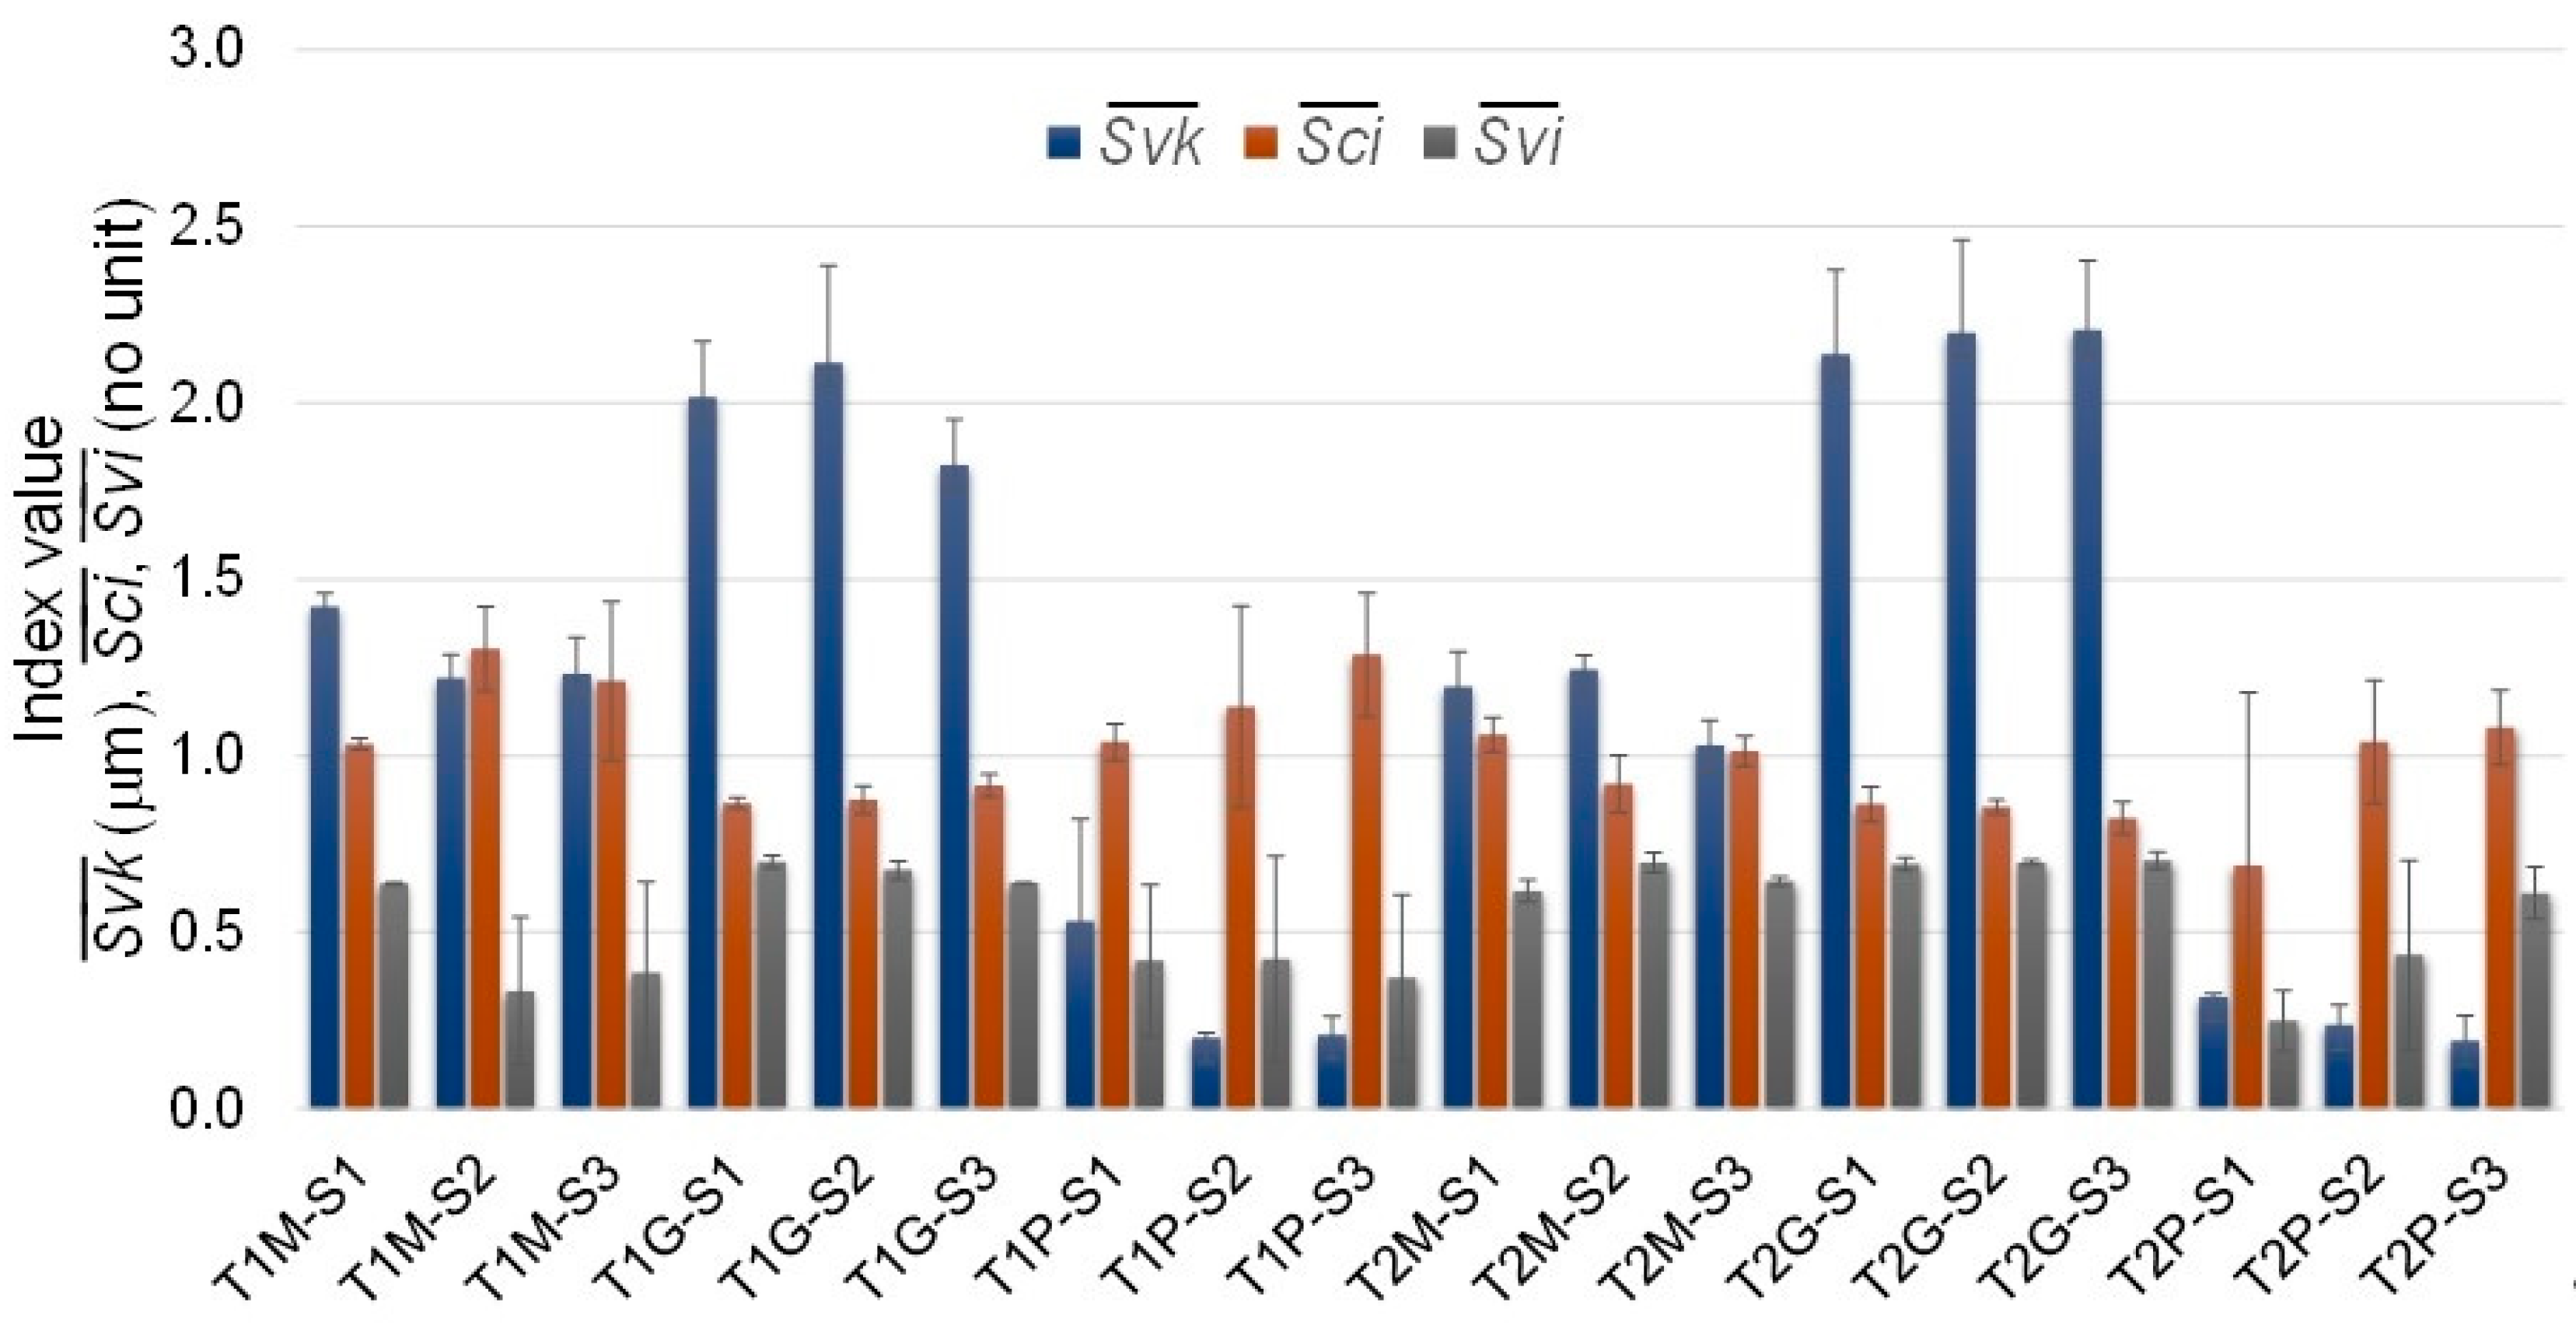
Figure 10.
Average values of , and indices for the study surfaces.
The polishing procedure has largely levelled out surface irregularities, surface scratches, or nicks. The consequence of polishing is a reduction in the geometric development of the surface layer of the material. An analogous situation is observed in the case of changes in the value of the index describing the mean square height of the surface. The values of the and indices are insensitive to variations in the amount and shape and spacing between the peaks and valleys. Thus, observing only their value may be misleading, as many surfaces with grossly different stereometric features (e.g., turned and ground) may have the same or , but at the same time exhibit completely different functional properties.
The selected values of the volumetric indices , and indicate the void volumes of the surface (Figure 9). Despite the similar values of the height indices, there is a noticeable increase in the active surface area of the material after grinding treatment. The increase in the proportion of core voids and pits for grinding ranges from 25 to nearly 50% compared to the surface area after milling. Increasing these values also results in a deterioration of surface wettability. The wettability of a flat surface depends on the wetting angle between the adhesive and the substrate. It is therefore more advantageous for bonded surfaces during bonding to consider tension and viscosity in surface preparation. In the case of a rough surface, surface tension is not the single variable governing wettability, as there may be other variables, but surface tension is always the key variable. This information is important because T1 epoxy adhesive is characterised by high viscosity. For polished surfaces, on the other hand, small void volumes should be better filled with T2 cyanoacrylate adhesive, which has a low viscosity. In addition, through the values of the volumetric indices of the surface structure, the surface requirement for the adhesive can be assessed in a certain way. The optimisation of the surface structure in this respect is certainly relevant for the implementation of bonding processes for mass-produced products under industrial conditions.
The index is a measure of the valley depth below the core roughness and can be related to adhesive retention. Large values of this parameter should be beneficial for adjacent surfaces. Mechanical anchorage of the adhesive should be strongest on ground surfaces, where the value is 40% to 50% higher than on turned surfaces. The graph depicting the index values of the ability of the core material to retain the liquid (Figure 10) shows the milling process as the most favourable. Interestingly, it is the polishing procedure that achieves a more favourable surface texture in this respect than after grinding.
The fluid retention capacity of the valleys located below the core of the material, as shown by the index, indicates an inverse relationship between surface technology and fluid retention capacity. This is particularly important when selecting a high-viscosity adhesive, which may be characterised by difficulty in penetrating small indentations and crevices. The bonded products must then be held together under considerable pressure during the initial process phase.
2.2. Testing the Strength of the Adhesive Joints
In the adhesive joint strength tests, shear tests were performed because a properly designed adhesive joint should only be loaded under this type of stress [21,31,32]. The shear strength of the adhesive and the shear modulus are usually considered to be the primary strength properties of the adhesive. The shear test was carried out on an INSTRON 8850 universal testing machine (Instron, Norwood, MA, USA), which was equipped with a special fixture designed to shear adhesive specimens. The fixture was designed so that the adhesive joints under test could be positioned and fixed unambiguously. It used interchangeable sleeves with holes machined to maintain a sliding fit on the outer diameter of the specimen. According to the developed test programme, 18 joints were tested for strength. The results obtained from the shear test are shown in Table 4.
Table 4.
Parameter values obtained during the shear test of adhesive joints.
The assessment of the type of crack (CF or SCF) was carried out on the two surfaces of the central specimen (B) for each of the adhesive joints (three joints were made combining specimens A, B, and C). The final assessment of the type of crack was carried out according to the guidelines of ISO 10365 [62]. The percentage of the type of failure in the joint and the ultimate stresses were determined from the average of the three values of the joints tested (see Table 4).
The strength values obtained clearly indicate that, for both types of adhesive, the most favourable state of the surface texture is the state after the grinding treatment. However, in the case of a low-viscosity adhesive (i.e., T2), the strength of the bond with the specimens after polishing is higher than the strength of the adhesive joint in which the surfaces of the specimens were only turned. The opposite situation is recorded for a high-viscosity adhesive (i.e., T1), for which the mechanical anchoring effect in the irregularities of well-wettable surfaces is stronger than the adhesive bonding effect of the adhesive molecules to the smooth metal surface (see Figure 11).
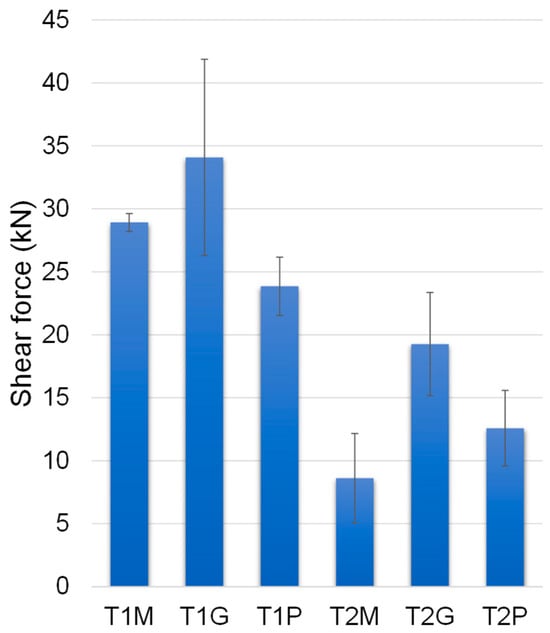
Figure 11.
Average shear force values for the study joints (M – milling, G – grinding, P – polishing).
The maximum recorded force at which fracture occurred in a joint with ground specimens bonded with T1 epoxy adhesive was 43.2 kN. This result is more than 13.4 kN higher than the highest result obtained for a joint with only turned specimens. The strength test confirmed the conclusions drawn from the analysis of the surface topography of the specimens. From the data read for joints with polished specimens glued with T1 epoxy adhesive, a reduction in strength can be observed (no mechanical anchoring effect). The lower strength of this type of joint is a consequence of the weaker alignment of irregularities and scratches on the surface, which translated into a reduced geometrical development of the surface for the higher viscosity adhesive. For the T1P-S1 and T2G-S1 joints, a similar value of shear force was achieved. For the T1P-S1 joint, it was 22.7 kN, and for the T2G-S1 joint, it was 23.2 kN. These results are similar despite the different adhesive used. In this case, insignificant mean values and scatter around the mean strength values of the entire series of T1P and T2G specimens are also observed.
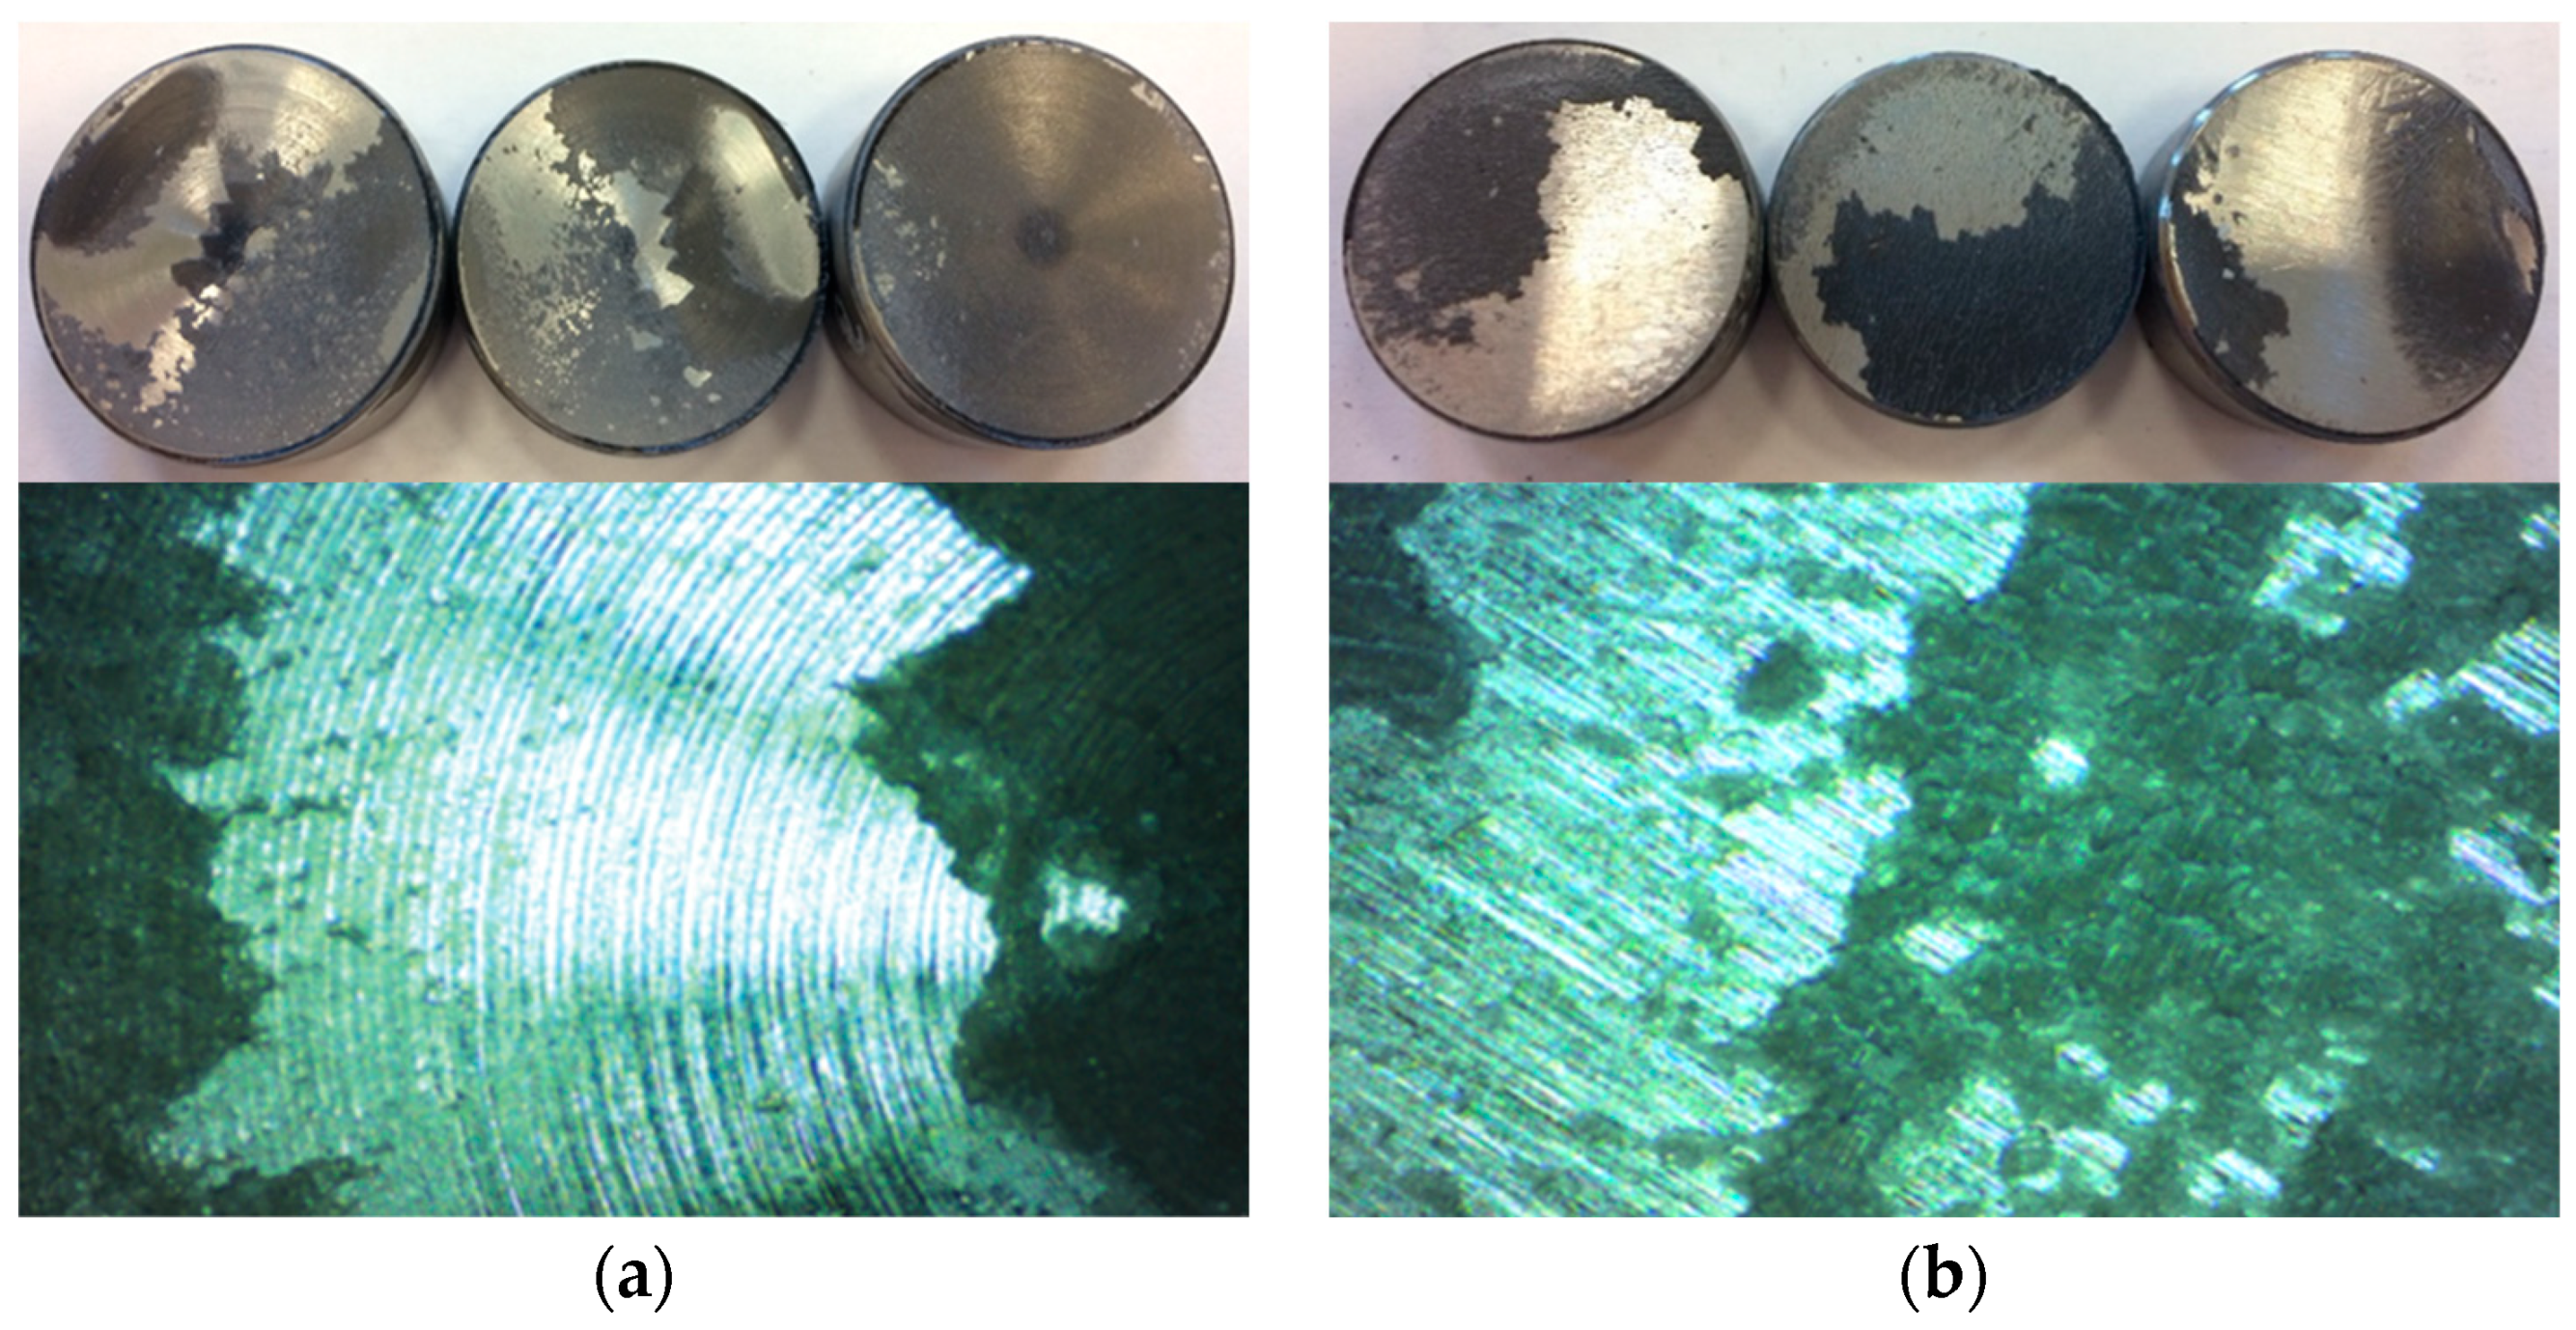
As the final part of the research work, documentation of the breakthrough on the adjacent surfaces of the samples was carried out using a HAWK Vision 250 measuring microscope (Vision Engineering Ltd, Send, Surrey, England) equipped with a 10 × magnification objective. Photographs of the specimens including the breakthrough are shown in Figure 12 and Figure 13.
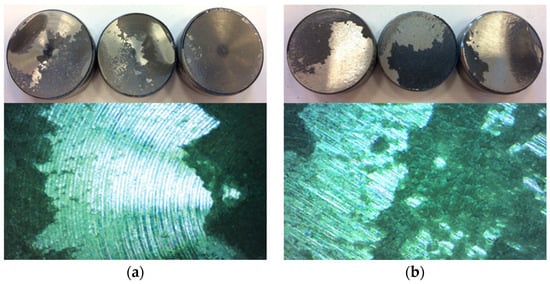
Figure 12.
Examples of mixed mode fracture views of specimens for: (a) T1M-S2: fracture at 28.58 kN (approx. 50% cohesive and 50% adhesive); (b) T1G-S2: fracture at 31.42 kN (approx. 60% cohesive and 40% adhesive).
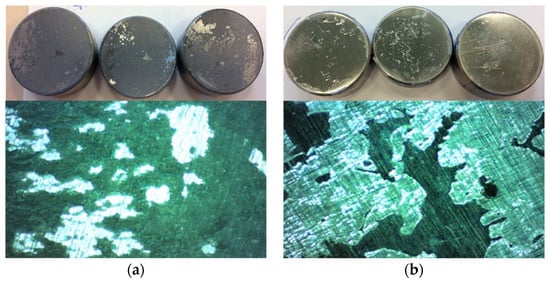
Figure 13.
Examples of mixed-mode fracture views of specimens for: (a) T1P-S2: fracture at 22.12 kN (approx. 20% cohesive and 80% adhesive); (b) T2P-S2: fracture at 19.99 kN (approx. 70% cohesive and 30% adhesive).
3. Discussion and Conclusions
The intensive development of materials engineering and manufacturing technologies and systems allowing the preparation of a specific geometrical texture of the surface makes the subject of the influence of roughness on the strength of adhesive joints still relevant. The analysis of the literature and the experiment carried out allow basic conclusions to be drawn regarding the influence of the geometric texture of the surface and the type of adhesive on the strength of adhesive joints.
The shear strength tests carried out confirmed the assumptions made during the analysis of the geometric texture of the surface. Based on the tests, it can be seen that the application of different surface treatments allows different strength values to be achieved. The difference in results is particularly apparent when comparing the joints with ground specimens with those with polished specimens. A force of almost 16.5 kN more was required to shear the joint with ground specimens compared to the joint with polished specimens and bonded with the same T1 epoxy adhesive. It can be concluded that adhesive joints made on surfaces characterised by considerable roughness have a significantly higher strength compared to joints where smooth surfaces are joined. Of course, this also depends on factors other than just the geometric condition of the surfaces to be joined, which include the type of adhesive and its specification, the influence of fillers or the aging performance. In a situation where an irregular adhesive surface is in contact with a rough surface, increasing the load on the joint leads to a much greater deformation of the bonding layer and material than in the case of a joint with a smooth surface. This is due to the higher energy taken up by the deformation, and therefore the higher energy required to decohesion such a joint. With the adhesive adhering less well to the surface, the strength of the bond is therefore reduced.
A no less important aspect that should not be overlooked is the type of adhesive used when joining components. The experiment confirms that epoxy adhesives, despite their high viscosity and thus inability to fill all the small gaps, are excellent at bonding rough materials. The tests clearly showed lower strength of joints bonded with cyanoacrylate glue compared to joints with epoxy adhesive. The best results were achieved for ground specimens bonded with T1 epoxy adhesive. In the case of turned surfaces, it is noticeable that the strength is nearly 5 times higher for the specimens bonded with T1 epoxy adhesive than those bonded with T2 cyanoacrylate adhesive. This result indicates that the higher-density adhesive bonds better mechanically to the uneven surface, resulting in better joint strength. The shear strength test shows that the optimum roughness for turned specimens bonded with epoxy adhesive corresponds to Sa = 0.93 µm.
As mentioned earlier, the best strength values were those of joints with ground specimens bonded with T1 epoxy adhesive, for which the values of the Sa parameter ranged from 1.12 to 1.38 µm, resulting in an average parameter value 0.30 µm higher than that of the turned specimens. The differences in the strength results of the adhesive joint are due to the fact that as the roughness increases, the number of irregularities increases and they become narrower and narrower. This makes it increasingly difficult for the T1 epoxy adhesive to fill them properly. Thus, air bubbles develop inside the indentations, which consequently weaken the joint. Selecting the optimum milling parameters can result in an increase in strength without the need for further processing, which significantly improves the economics of surface technology. However, it is much easier to ensure the repeatability of the geometric structure in the grinding procedures and thus achieve a much higher repeatability of the strength of the adhesive joint.
From the data obtained for joints formed with T2 cyanoacrylate adhesive, it can be seen that, despite the application of different surface treatments, the strength values obtained do not differ significantly from each other. This gives grounds for concluding that the durability of joints made with low-viscosity adhesives is not significantly affected by the expansion of the geometric texture of the surface. These types of adhesives perform less well compared to high-viscosity adhesives, but their ability to fill in irregularities found on surfaces may find their use in bonding components such as rubber. An exception to the above considerations are the joints of polished specimens, for which the T2 cyanoacrylate adhesive achieved similar strength to the apparently superior T1 epoxy adhesive. This means that appropriate surface technology even with a weaker adhesive can give very good strength properties at a much lower cost of preparing the parts to be joined. In the context of the experimental studies carried out, such a situation can be achieved when the conditions of the geometrical texture of the surface are defined by the designer according to the requirements shown in Figure 14.
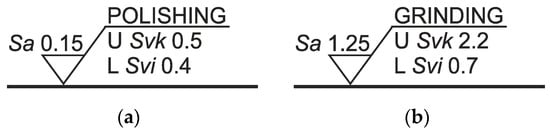
Figure 14.
Description of the geometrical texture of the surface to provide similar strength of the adhesive joint when using: (a) T1 epoxy adhesive; (b) T2 cyanoacrylate adhesive.
All the conclusions presented demonstrate that by consciously combining the parameters of the geometrical texture with a particular type of adhesive, optimum joint strength can be achieved. This is in line with other studies, for example, those given in the review by Naat et al. [63]. Due to its numerous advantages, adhesive technology is playing an increasingly important role in the development of modern structures. It stands out due to its versatility and cost-effectiveness. It is becoming a significant alternative to many traditional joining or sealing methods. However, it should be remembered that when designing an adhesive joint, it is important to select an adhesive depending on the geometric texture of the surface to be achieved, or to select a surface technology depending on the viscosity of the adhesive to be used. Such knowledge will save time and money that could be incurred as a result of poor joint design.
The work undertaken in the creation of the paper can be continued towards expanding the range of materials to be joined together and the surface preparation technology.
Author Contributions
Conceptualisation, D.G. and M.S.; methodology, D.G., K.K. and M.S.; software, D.G. and K.K.; validation, D.G. and R.G.; formal analysis, D.G.; investigation, D.G., K.K. and M.S.; resources, D.G.; data curation, D.G. and K.K.; writing—original draft preparation, D.G. and M.S.; writing—review and editing, R.G., K.K. and P.Z.; visualisation, D.G. and R.G.; supervision, P.Z.; project administration, R.G.; funding acquisition, P.Z. All authors have read and agreed to the published version of the manuscript.
Funding
This research received no external funding.
Institutional Review Board Statement
Not applicable.
Informed Consent Statement
Not applicable.
Data Availability Statement
The data presented in this study are available on request from the corresponding author.
Conflicts of Interest
The authors declare no conflicts of interest.
References
- Grzejda, R. Modelling Nonlinear Multi-Bolted Connections: A Case of Operational Condition. In Proceedings of the 15th International Scientific Conference ‘Engineering for Rural Development 2016’, Jelgava, Latvia, 25–27 May 2016; pp. 336–341. [Google Scholar]
- Grzejda, R. New method of modelling nonlinear multi-bolted systems. In Advances in Mechanics: Theoretical, Computational and Interdisciplinary Issues, 1st ed.; Kleiber, M., Burczyński, T., Wilde, K., Gorski, J., Winkelmann, K., Smakosz, Ł., Eds.; CRC Press: Leiden, The Netherlands, 2016; pp. 213–216. [Google Scholar]
- Jaszak, P.; Skrzypacz, J.; Borawski, A.; Grzejda, R. Methodology of leakage prediction in gasketed flange joints at pipeline deformations. Materials 2022, 15, 4354. [Google Scholar] [CrossRef] [PubMed]
- Semjon, J.; Jánoš, R.; Sukop, M.; Tuleja, P.; Marcinko, P.; Nowakowski, M. Verification of a newly developed mobile robot’s actuator parameters. Machines 2023, 11, 411. [Google Scholar] [CrossRef]
- Zmarzły, P. Influence of the Internal Clearance of Ball Bearings on the Vibration Level. In Proceedings of the 24th International Conference ‘Engineering Mechanics 2018’, Svratka, Czech Republic, 14–17 May 2018; pp. 961–964. [Google Scholar]
- Zmarzły, P. Influence of bearing raceway surface topography on the level of generated vibration as an example of operational heredity. Indian J. Eng. Mater. Sci. 2020, 27, 356–364. [Google Scholar]
- Mucha, W.; Kuś, W.; Viana, J.C.; Nunes, J.P. Operational load monitoring of a composite panel using artificial neural networks. Sensors 2020, 20, 2534. [Google Scholar] [CrossRef]
- Mucha, W. Comparison of machine learning algorithms for structure state prediction in operational load monitoring. Sensors 2020, 20, 7087. [Google Scholar] [CrossRef] [PubMed]
- LOCTITE 401, Technical Data Sheet. Available online: https://datasheets.tdx.henkel.com/LOCTITE-401-pl_PL.pdf (accessed on 2 July 2024).
- 3M Scotch-Weld Flexible Acrylic Adhesive DP8610NS, Technical Data Sheet. Available online: https://multimedia.3m.com/mws/media/2365850O/3m-scotch-weld-flexible-acrylic-adhesive-dp8610ns.pdf?&fn=3M-Scotch-Weld-Flexible-Acrylic-Adhesive-DP8610NS_R3.pdf (accessed on 2 July 2024).
- 63857—UHU All Purpose Adhesive Twist & Glue, Technical Data Sheet. Available online: https://www.uhu.com/getmedia/8a611b5a-8a1b-468e-9896-86b9a8a45be2/Print%20PDF.pdf (accessed on 2 July 2024).
- Rudawska, A. Effect of a type of epoxy adhesive on the selected mechanical properties of adhesive joints of the steel sheets. Assem. Tech. Technol. 2020, 109, 47–52. [Google Scholar]
- Safari, A.; Farahani, M.; Ghabezi, P. Experimental study on the influences of different surface treatment processes and adhesive type on the aluminum adhesive-bonded joint strength. Mech. Based Des. Struct. Mach. 2022, 50, 2400–2413. [Google Scholar] [CrossRef]
- Farhang, M.; Farahani, M.; Nazari, M.; Sam-Daliri, O. Experimental correlation between microstructure, residual stresses and mechanical properties of friction stir welded 2024-T6 aluminum alloys. Int. J. Adv. Des. Manuf. Technol. 2022, 15, 1–9. [Google Scholar]
- Liu, J.; Xue, Y.; Dong, X.; Fan, Y.; Hao, H.; Wang, X. Review of the surface treatment process for the adhesive matrix of composite materials. Int. J. Adhes. Adhes. 2023, 126, 103446. [Google Scholar] [CrossRef]
- Nasresfahani, M.R.; Asghari, S. Review of nondestructive methods for evaluating adhesive bonding on anodized coatings. Int. J. Adhes. Adhes. 2023, 127, 103491. [Google Scholar] [CrossRef]
- Xie, M.; Zhan, L.; Ma, B.; Hui, S. Classification of fiber metal laminates (FMLs), adhesion theories and methods for improving interfacial adhesion: A review. Thin-Walled Struct. 2024, 198, 111744. [Google Scholar] [CrossRef]
- Hay, K.M.; Dragila, M.I.; Liburdy, J. Theoretical model for the wetting of a rough surface. J. Colloid Interface Sci. 2008, 325, 472–477. [Google Scholar] [CrossRef] [PubMed]
- Serro, A.P.; Colaço, R.; Saramago, B. Adhesion forces in liquid media: Effect of surface topography and wettability. J. Colloid Interface Sci. 2008, 325, 573–579. [Google Scholar] [CrossRef] [PubMed]
- da Silva, L.F.M.; Carbas, R.J.C.; Critchlow, G.W.; Figueiredo, M.A.V.; Brown, K. Effect of material, geometry, surface treatment and environment on the shear strength of single lap joints. Int. J. Adhes. Adhes. 2009, 29, 621–632. [Google Scholar] [CrossRef]
- Rudawska, A. Surface Preparation for Bonding Selected Construction Materials; Lublin University of Technology: Lublin, Poland, 2017. (In Polish) [Google Scholar]
- Yuan, Y.; Zhu, X.; Chen, L. Relationship among cohesion, adhesion, and bond strength: From multi-scale investigation of asphalt-based composites subjected to laboratory-simulated aging. Mater. Des. 2020, 185, 108272. [Google Scholar] [CrossRef]
- Romanik, G.; Jaszak, P.; Grzejda, R.; Zmarzły, P. Minimisation of friction resistance of elastomeric lip seals on rotating shafts. Lubricants 2024, 12, 103. [Google Scholar] [CrossRef]
- Kubit, A.; Macek, W.; Zielecki, W.; Szawara, P.; Myśliwiec, P. Experimental study of the impact of notches and holes made in the front edge of adherends on the properties of static and fatigue strength of adhesive joints. Int. J. Adhes. Adhes. 2024, 129, 103596. [Google Scholar] [CrossRef]
- Wei, Y.; Jin, X.; Luo, Q.; Li, Q.; Sun, G. Adhesively bonded joints—A review on design, manufacturing, experiments, modeling and challenges. Compos. Part B Eng. 2024, 276, 111225. [Google Scholar] [CrossRef]
- Piekarczyk, M. Application of glued connections in metal structures. Tech. Trans. Civ. Eng. 2012, 109, 99–137. [Google Scholar]
- PN-EN ISO 4287; Geometrical Product Specifications (GPS), Surface Texture: Profile method, Terms, Definitions and Surface Texture Parameters. Polish Committee for Standardization: Warsaw, Poland, 1999.
- PN-EN ISO 4288; Geometrical Product Specifications (GPS), Surface Texture: Profile method, Rules and Procedures for the Assessment of Surface Texture. Polish Committee for Standardization: Warsaw, Poland, 2011.
- PN-EN ISO 25178-2; Geometrical Product Specifications (GPS), Surface Texture: Areal, Part 2: Terms, Definitions and Surface Texture Parameters. Polish Committee for Standardization: Warsaw, Poland, 2022.
- Grochała, D.; Grzejda, R.; Parus, A.; Berczyński, S. The wavelet transform for feature extraction and surface roughness evaluation after micromachining. Coatings 2024, 14, 210. [Google Scholar] [CrossRef]
- Rudawska, A.; Dębski, H. Experimental and numerical analysis of adhesively bonded aluminium alloy sheets joints. Eksploat. Niezawodn. Maint. Reliab. 2011, 49, 4–10. [Google Scholar]
- Karny, M. Adhesive joints in composite structures—A methodology review. Trans. Inst. Aviat. 2016, 244, 97–108. [Google Scholar]
- Wu, Y.; Lin, J.; Carlson, B.E.; Lu, P.; Balogh, M.P.; Irish, N.P.; Mei, Y. Effect of laser ablation surface treatment on performance of adhesive-bonded aluminum alloys. Surf. Coat. Technol. 2016, 304, 340–347. [Google Scholar] [CrossRef]
- Cui, J.; Wang, S.; Wang, S.; Chen, S.; Li, G. Strength and failure analysis of adhesive single-lap joints under shear loading: Effects of surface morphologies and overlap zone parameters. J. Manuf. Process. 2020, 56, 238–247. [Google Scholar] [CrossRef]
- Löbbecke, M.; Bayerbasi, T.J.; Bartsch, M.; Haubrich, J. Role of surface structures on long term stability of adhesive joints between Ti–15V–3Cr–3Sn–3Al and polyether-ether-ketone. Int. J. Adhes. Adhes. 2023, 120, 103282. [Google Scholar] [CrossRef]
- Ou, J.; Shao, Y.; Huang, C.; Bi, X. Bond behavior of CFRP sheets-to-steel shear joints with different steel surface treatments. Compos. Struct. 2023, 322, 117376. [Google Scholar] [CrossRef]
- Grzesik, W. Effect of the machine parts surface topography features on the machine service. Mechanik 2015, 88, 587–593. [Google Scholar] [CrossRef]
- Zielecki, W.; Dzierwa, A.; Guźla, E. Analysis of the impact of surface roughness on the bearing capacity of lap adhesive joints from aluminum alloy 2024. Assem. Tech. Technol. 2020, 109, 15–21. [Google Scholar]
- Zielecki, W.; Pawlus, P.; Perłowski, R.; Dzierwa, A. Surface topography effect on strength of lap adhesive joints after mechanical pre-treatment. Arch. Civ. Mech. Eng. 2013, 13, 175–185. [Google Scholar] [CrossRef]
- Tseng, S.-F.; Chen, Y.-S. Surface microtexturing of Ti-6Al-4V and SS316L alloys using high pulsed fiber lasers for improving the adhesive bonded performance. Opt. Laser Technol. 2021, 143, 107349. [Google Scholar] [CrossRef]
- Moroni, F.; Romoli, L.; Khan, M.M.A. Design of laser-textured surfaces to enhance the strength of adhesively bonded joints. Int. J. Adhes. Adhes. 2018, 85, 208–218. [Google Scholar] [CrossRef]
- Mandolfino, C.; Cassettari, L.; Pizzorni, M.; Saccaro, S.; Lertora, E. A design-of-experiments approach to estimate the effect of plasma-treatment parameters on the mechanical resistance of adhesive-bonded joints. J. Manuf. Process. 2021, 67, 177–194. [Google Scholar] [CrossRef]
- Qiao, Y.; Shin, Y.; Ramos, J.L.; Engelhard, M.H.; Seffens, R.J.; Merkel, D.R.; Simmons, K.L. Plasma treatment on both adhesive tape and adherends for significantly enhanced CFRTP-related adhesive joints. Appl. Surf. Sci. 2024, 649, 159092. [Google Scholar] [CrossRef]
- Da Silva, L.F.M.; Ferreira, N.M.A.J.; Richter-Trummer, V.; Marques, E.A.S. Effect of grooves on the strength of adhesively bonded joints. Int. J. Adhes. Adhes. 2010, 30, 735–743. [Google Scholar] [CrossRef]
- Alderucci, T.; Borsellino, C.; Di Bella, G. Effect of surface pattern on strength of structural lightweight bonded joints for marine applications. Int. J. Adhes. Adhes. 2022, 117, 103005. [Google Scholar] [CrossRef]
- Zhou, Y.; Ning, F. Joining CFRP/Ti stacks by directed energy deposition: Surface topography effects on interface formation and bonding. Compos. Part B Eng. 2022, 247, 110365. [Google Scholar] [CrossRef]
- Zarei, H.; Marulli, M.R.; Paggi, M.; Pietrogrande, R.; Üffing, C.; Weißgraeber, P. Adherend surface roughness effect on the mechanical response of silicone-based adhesive joints. Eng. Fract. Mech. 2020, 240, 107353. [Google Scholar] [CrossRef]
- Van Dam, J.P.B.; Abrahami, S.T.; Yilmaz, A.; Gonzalez-Garcia, Y.; Terryn, H.; Mol, J.M.C. Effect of surface roughness and chemistry on the adhesion and durability of a steel-epoxy adhesive interface. Int. J. Adhes. Adhes. 2020, 96, 102450. [Google Scholar] [CrossRef]
- Guo, L.; Liu, J.; Xia, H.; Li, X.; Zhang, X.; Yang, H. Effects of surface treatment and adhesive thickness on the shear strength of precision bonded joints. Polym. Test. 2021, 94, 107063. [Google Scholar] [CrossRef]
- Gude, M.R.; Prolongo, S.G.; Ureña, A. Hygrothermal ageing of adhesive joints with nanoreinforced adhesives and different surface treatments of carbon fibre/epoxy substrates. Int. J. Adhes. Adhes. 2013, 40, 179–187. [Google Scholar] [CrossRef]
- Leena, K.; Athira, K.K.; Bhuvaneswari, S.; Suraj, S.; Rao, V.L. Effect of surface pre-treatment on surface characteristics and adhesive bond strength of aluminium alloy. Int. J. Adhes. Adhes. 2016, 70, 265–270. [Google Scholar] [CrossRef]
- Akpinar, I.A. The effect of chemical etching and nanostructure additive epoxy coating technique on adhesion strength in aluminum joints bonded with nanostructure additive adhesive. Int. J. Adhes. Adhes. 2024, 129, 103584. [Google Scholar] [CrossRef]
- Rudawska, A. The effect of protective and decorative coatings on the strength of adhesive joints of hot-dip galvanized steel sheets. Int. J. Adhes. Adhes. 2022, 117, 103004. [Google Scholar] [CrossRef]
- Xiong, X.; Deng, Y.; Wei, J.; Ren, R.; Wang, J.; Cui, X.; Qu, F.; Li, G. The effect of inclusions embedded in the adhesive on the stress distribution and strength of single-lap adhesive joints: Analytical and numerical analysis. Int. J. Adhes. Adhes. 2022, 118, 103235. [Google Scholar] [CrossRef]
- Hamilton, A.; Xu, Y.; Kartal, M.E.; Kumar, S.; Gadegaard, N.; Mulvihill, D.M. Optimisation of interlocking microstructured adhesive joints via finite element modelling, design of experiments and 3D printing. Int. J. Adhes. Adhes. 2023, 120, 103292. [Google Scholar] [CrossRef]
- Ejaz, H.; Mubashar, A.; Uddin, E.; Ali, Z.; Arif, N.; Waqar, S. An experimental and simulation study of RGO effects on mechanical behaviour of structural adhesive and lap shear joints strength. Int. J. Adhes. Adhes. 2023, 126, 103480. [Google Scholar] [CrossRef]
- Romoli, L.; Lutey, A.H.A.; Lazzini, G. Laser texturing of Li-ion battery electrode current collectors for improved active layer interface adhesion. CIRP Ann. Manuf. Technol. 2022, 71, 481–484. [Google Scholar] [CrossRef]
- Krajewski, S.J.; Grochała, D.; Tomków, J.; Grzejda, R. Analysis of the surface stereometry of alloyed austenitic steel after fibre laser cutting using confocal microscopy. Coatings 2023, 13, 15. [Google Scholar] [CrossRef]
- Bashandeh, K.; Marchert, A.; Takayuki, U.; Polycarpou, A.A.; Meyer, J.; Lan, P. The effect of surface texturing on thin film reversible adhesive bond strength. Int. J. Adhes. Adhes. 2021, 107, 102829. [Google Scholar] [CrossRef]
- PN-ISO 4587; Adhesives, Determination of Tensile Lap-Shear Strength of High Strength Adhesives Bonds. Polish Committee for Standardization: Warsaw, Poland, 1994.
- PN-EN ISO 16610-61; Geometrical Product Specification (GPS), Filtration, Part 61: Linear Areal Filters, Gaussian Filters. Polish Committee for Standardization: Warsaw, Poland, 1994.
- PN-EN ISO 10365; Adhesives, Designation of Main Failure Patterns. Polish Committee for Standardization: Warsaw, Poland, 2022.
- Naat, N.; Boutar, Y.; Naïmi, S.; Mezlini, S.; da Silva, L.F.M. Effect of surface texture on the mechanical performance of bonded joints: A review. J. Adhes. 2023, 99, 166–258. [Google Scholar] [CrossRef]


Disclaimer/Publisher’s Note: The statements, opinions and data contained in all publications are solely those of the individual author(s) and contributor(s) and not of MDPI and/or the editor(s). MDPI and/or the editor(s) disclaim responsibility for any injury to people or property resulting from any ideas, methods, instructions or products referred to in the content. |
© 2024 by the authors. Licensee MDPI, Basel, Switzerland. This article is an open access article distributed under the terms and conditions of the Creative Commons Attribution (CC BY) license (https://creativecommons.org/licenses/by/4.0/).