Article

Influence of Ce3+ Doping on Photoluminescence Properties and Stability of Cs4SnBr6 Zero-Dimensional Perovskite

School of Materials Science and Engineering, Hanshan Normal University, Chaozhou 521041, China
*
Authors to whom correspondence should be addressed.
Coatings 2024, 14(8), 945; https://doi.org/10.3390/coatings14080945 (registering DOI)
Submission received: 3 July 2024 / Revised: 22 July 2024 / Accepted: 24 July 2024 / Published: 27 July 2024

Abstract

:
Zero-dimensional tin-based halide perovskites have garnered considerable interest owing to their remarkable optical properties, including broad-band emission, high photoluminescence (PL) efficiency, and low self-absorption. Nevertheless, enhancing the PL efficiency and stability of these materials remains a pressing challenge. In this study, the enhancement of PL and stability in Cs4SnBr6 zero-dimensional perovskite was investigated through Ce3+ doping. Our experimental results demonstrate that the incorporation of Ce3+ can significantly boost the light emission intensity from self-trapped excitons (STEs) in Cs4SnBr6, achieving over a 150% increase compared to the undoped sample, with a PL quantum yield of approximately 64.7%. Moreover, the thermal stability of the corresponding doped sample is markedly enhanced. Through comprehensive analyses, including X-ray diffraction, energy-dispersive spectroscopy, time-resolved PL, and temperature-dependent PL measurements, we elucidate that the enhanced light emission is attributed to the distortion of the [SnBr6]4− octahedral structure induced by Ce3+ doping, which strengthens electron–phonon coupling and elevates the binding energy of STEs.

1. Introduction

In recent years, metal halide perovskites have attracted considerable interest owing to their unique optoelectronic properties, such as high photoluminescence quantum yields, high carrier mobility, and substantial absorption coefficients. These semiconductors have demonstrated remarkable performance in photovoltaics, light-emitting devices, photodetectors, and beyond [1,2,3,4]. One of the most successful applications of three-dimensional halide perovskites is as the light-emitting layer in light-emitting devices [5,6]. The efficiency of these devices has dramatically increased from 8.5% in 2015 to over 30% in recent years [5,6]. However, the high toxicity of lead poses a significant threat to human health and the environment, limiting its commercial applications. Consequently, researchers have explored non-toxic or low-toxic alternatives, such as Sn2+ and Ge2+ equivalent substitutes and Bi3+ and Ag+ alternative substitutes, to develop lead-free perovskite luminescent materials [7,8,9,10]. Among these alternative elements, Sn2+ is considered the most promising substitute due to its similar coordination number and charge balance characteristics compared with Pb2+. Furthermore, the ionic radius of Sn closely matches that of Sn, which helps avoid significant lattice distortion caused by substitution. In addition, compared to lead-based perovskites, tin-based perovskites exhibit narrower band gaps and higher charge carrier mobility. Most importantly, the degradation product SnO2 formed by tin-based perovskites upon exposure to environmental air is an environmentally friendly material that does not pollute the environment [11]. Therefore, the use of low-toxicity tin to replace lead in halide perovskites (CsPbX3) is of great interest. To date, considerable efforts have been made to explore efficient and stable CsSnX3 [12,13,14]. For instance, Liu et al. proposed a colloid synthesis strategy that successfully yielded narrow band-emitting CsSnI3 nanocrystals with an emission efficiency of up to 18.4% by regulating the reactant ratios [12]. Similarly, Kang et al. developed a method for synthesizing CsSnX3 nanocrystals using Cs2CO3, SnC2O4, and NH4X as raw materials, achieving the stability of CsSnX3 nanocrystals by employing the antioxidant SnC2O4 as the reaction precursor [13]. Although CsSnX3 perovskites have made significant progress, their luminescent efficiency and stability still fall short of meeting the requirements for commercial applications.
Compared to three-dimensional cesium lead halide perovskites (CsSnX3), zero-dimensional cesium tin halide perovskites (Cs4SnBr6) have received widespread interest owing to their higher stability and PL quantum yield [15,16,17]. In zero-dimensional cesium tin halide perovskites, the strong electron–phonon interaction arising from their soft lattice characteristics facilitates the formation of states with self-trapped excitons. This results in efficient emission across the visible spectrum, making them ideal candidates for optoelectronic devices such as white LEDs [15,16]. For example, Kovalenko et al. demonstrated strong light emission from self-trapped excitons in Cs4SnBr6, with a room-temperature PL quantum yield reaching 15 ± 5% [15]. Up to now, significant efforts have been made to enhance the emission efficiency and stability of zero-dimensional halide perovskites [17,18,19,20]. For example, to address the air instability of Cs4SnBr6, Zhang and his colleagues substituted SnF2 for the easily oxidized SnBr2 as the tin source, effectively enhancing the structural stability of Cs4SnBr6 by utilizing F to suppress Sn2+ oxidation [17]. On the other hand, Ma and his team demonstrated that high pressure can robustly boost the PL efficiency of Cs4SnBr6, which is attributed to the amplified optical activity and increased binding energy of self-trapped excitons under compression [18]. In previous work, we extended the emission spectrum of Cs4SnBr6 through an Mn2+ doping strategy, enhancing the electron–phonon coupling effect as well as the binding energy of STEs, thereby significantly increasing the emission efficiency of Cs4SnBr6. The PL quantum yield reached approximately 75%, and the thermal stability was also improved [20]. In addition, we proposed a new strategy using rapid thermal treatment (RTT) to improve the emission of STEs in Cs4SnBr6. The improved emission is ascribed to the suitable electron–phonon coupling as well as the augmented binding energies of STEs brought about by RTT [21]. In zero-dimensional perovskites, the introduction of ions with different sizes at the B site can lead to deviations in the ionic radius, causing distortion of the [BX6]4− octahedral structure. This subtle structural change may open new avenues for controlling STE emissions. It is well known that the ionic radius of Ce3+ (1.01 Å) is slightly smaller than that of Sn2+ (1.18 Å) in a similar coordination environment. This indicates that substituting Ce3+ for Sn2+ in a crystal lattice can induce distortion in the [BX6]4− octahedral structure. However, the effects of Ce3+ doping on the PL characteristics and stability of Cs4SnBr6 remain unexplored to date.
In this paper, the synthesis of Ce3+-doped Cs4SnBr6 zero-dimensional perovskites was achieved via a water-assisted ball milling method, and the impact of Ce3+ doping on the luminescence characteristics and stability of Cs4SnBr6 were investigated. We demonstrated that the incorporation of Ce3+ significantly could boost the light emission intensity from STEs in Cs4SnBr6, achieving over a 150% increase compared to the undoped sample, with a PL quantum yield (QY) of approximately 64.74%. Moreover, the thermal stability of the corresponding doped sample is markedly enhanced. Through comprehensive analyses, including X-ray diffraction, energy-dispersive spectroscopy, time-resolved PL, and temperature-dependent PL measurements, the origin of the improved light emission was discussed.

2. Materials and Methods

2.1. Materials

Cesium bromide (CsBr, 99.9%), ammonium bromide (NH4Br, 99.99%), and cerium(III) bromide (CeBr3, 99.9%) were procured from Aladdin (Meridian Parkway, Riverside, CA, USA). Stannous fluoride (SnF2, 99.9%) was obtained from Macklin (Shanghai Macklin Biochemical Co., Ltd., Shanghai, China).

2.2. Synthesis of Cs4SnBr6 and Ce3+-Doped Cs4SnBr6

Cs4SnBr6 and Ce3+-doped Cs4SnBr6 powders were synthesized via a water-assisted wet ball-milling procedure, respectively. The reactant precursors employed in this study were CsBr, SnF2, NH4Br, and CeBr3. To synthesize Ce3+-doped Cs4SnBr6 with different levels, the molar quantities of CsBr, SnF2, and NH4Br were kept at 4 mmol, 1 mmol, and 2 mmol, respectively, and the molar quantities of CeBr3 were kept at 0 mmol, 0.1 mmol, 0.3 mmol, 0.5 mmol, and 0.8 mmol, corresponding to the samples named S-x (x = 0, 0.1, 0.3, 0.5, 0.8). The experimental procedure is as follows: the required precursors were thoroughly mixed and placed into a ball milling jar, to which 60 μL of deionized water was added. The mixture was then subjected to ball milling at 600 rpm for 30 min. After milling, the resulting product was subjected to vacuum drying by placing it in an oven set at 60 °C for a duration of 4 h. The sample was subsequently cooled to room temperature and subjected to additional dry ball milling at the same speed for 30 min. This process yielded the desired Ce3+-doped Cs4SnBr6 powder sample.

2.3. Characterizations

The PL properties were meticulously assessed by an Edinburgh Instrument FLS1000 PL spectrometer (Livingstone, UK). To examine the temperature-dependent behavior, PL spectra were recorded across a range of temperatures. Additionally, PL excitation spectra and PL decay were captured by utilizing the same instrument. The crystallographic structures of samples were examined through X-ray diffraction (XRD) with an X’pertPro Panlytical diffractometer (PANalytical, Almelo, The Netherlands), operating at 35 kV and 40 mA with Cu Kα (0.15418 nm) filtered radiation. The surface morphology and compositional analysis of samples were investigated via scanning electron microscopy (SEM) using a Hitachi SU5000 SEM instrument (Tokyo, Japan) and a Bruker EDS QUANTAX system (Karlsruhe, Germany), respectively.

3. Results and Discussion

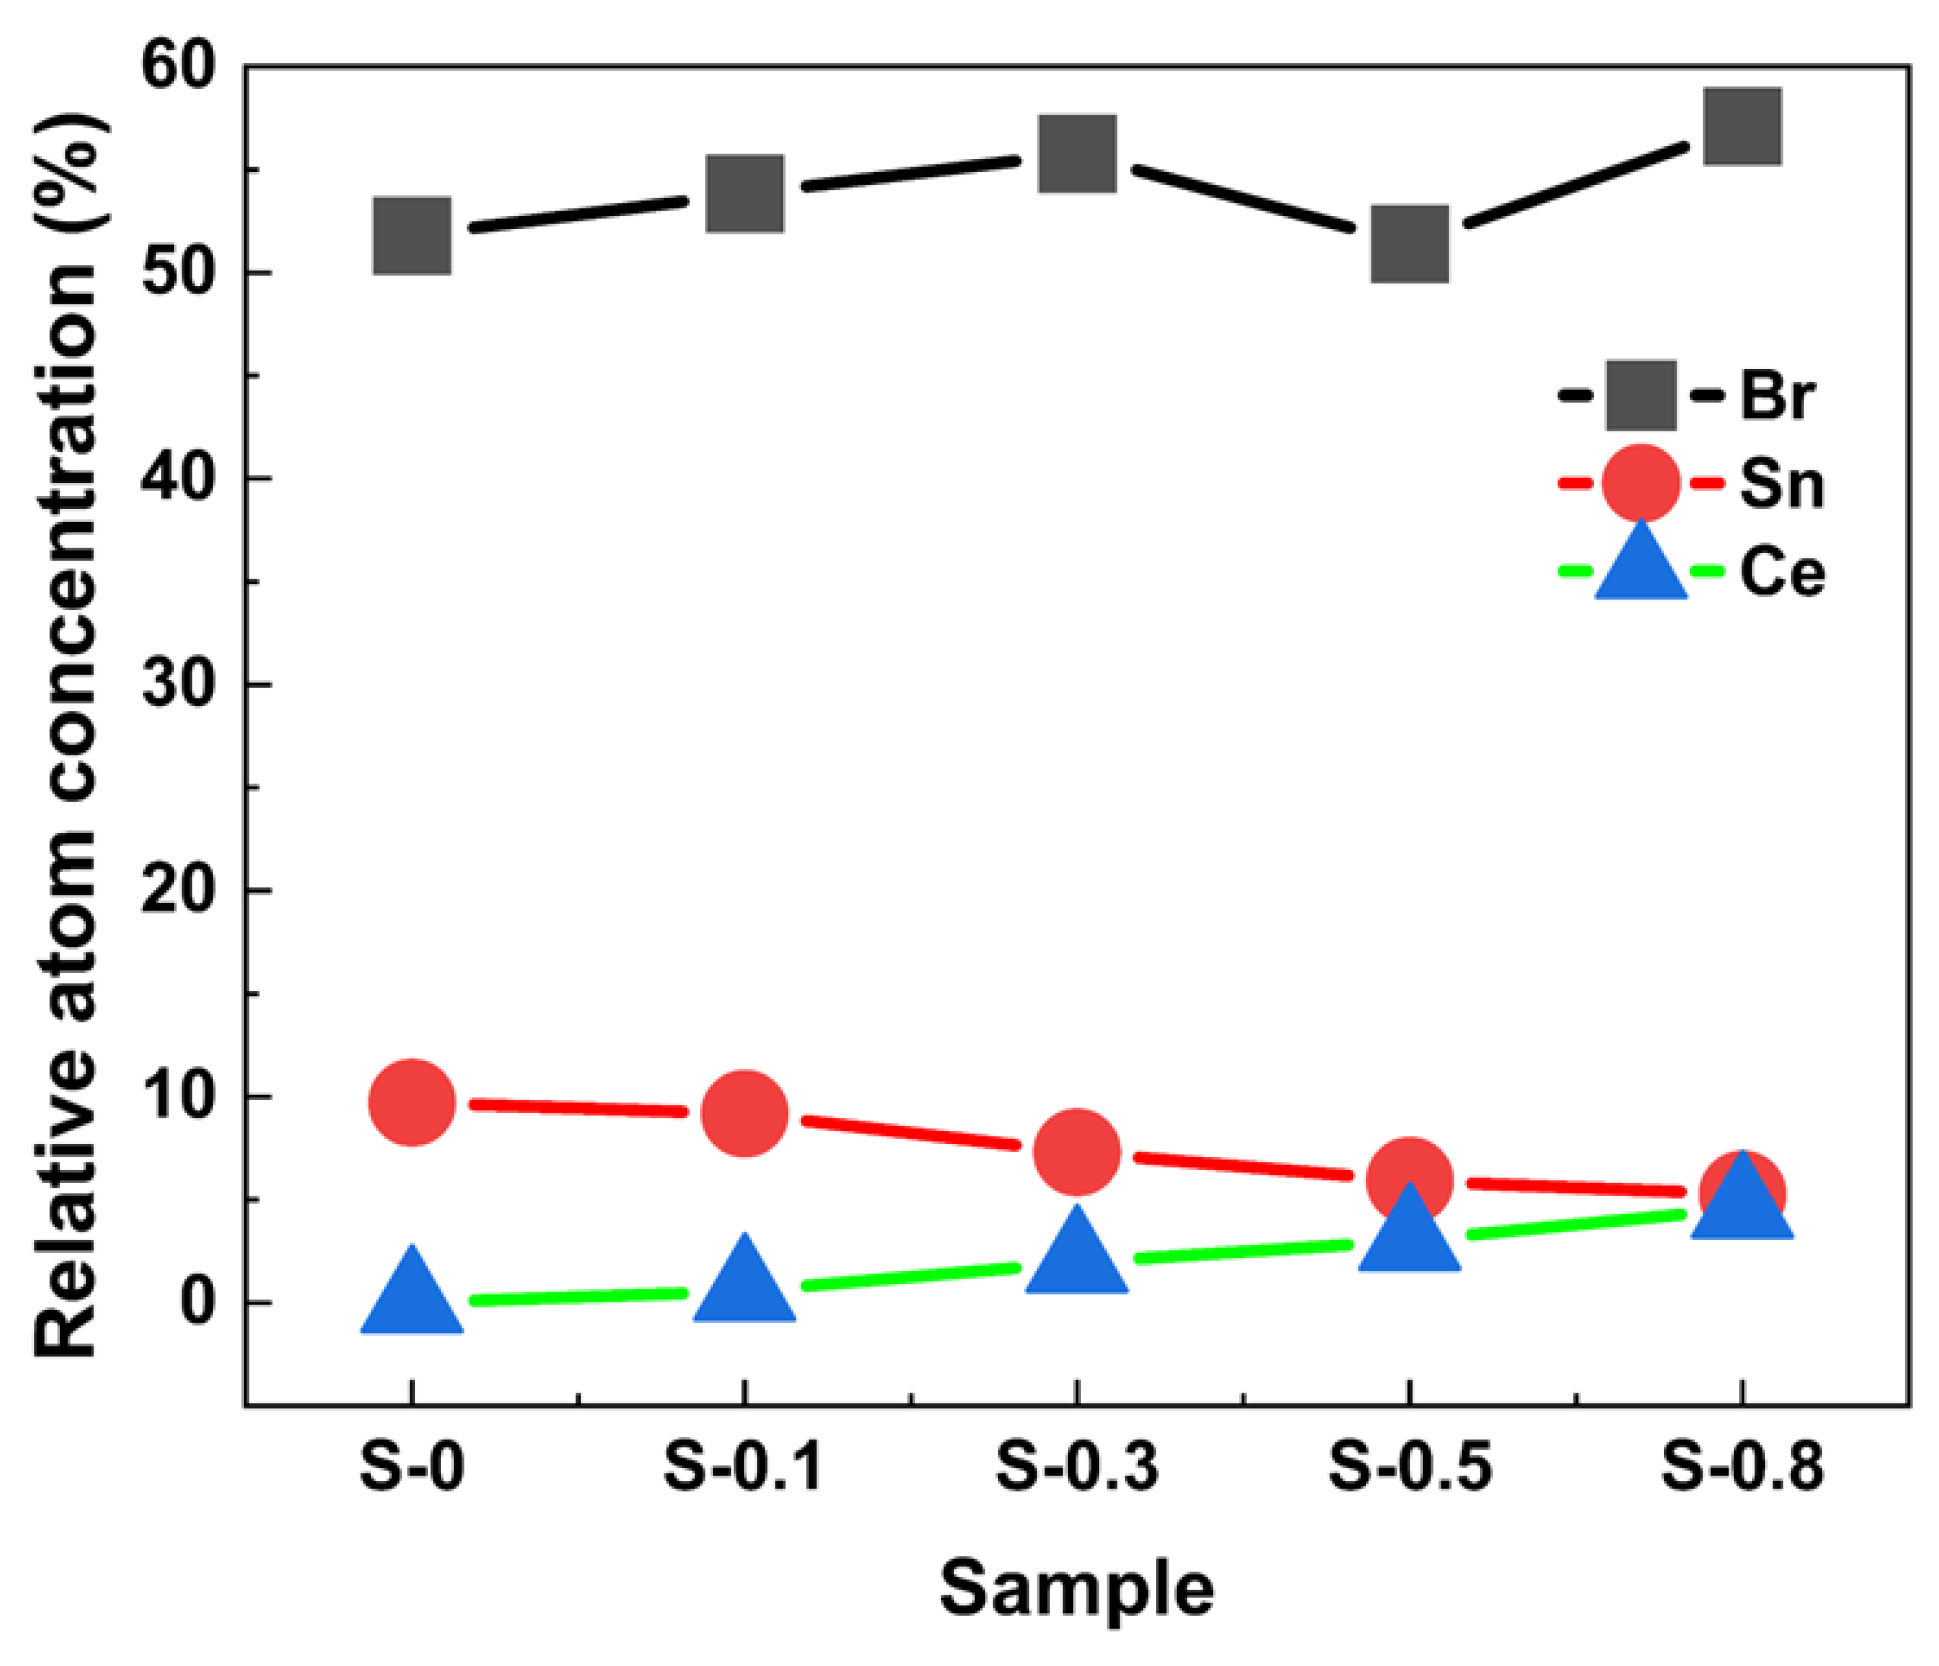
Figure 1a presents the SEM surface morphology of the S-0.3 sample. Figure 1b depicts the qualitative analysis spectrum acquired through EDS spectra for Br, Sn, Cs, F, and Ce elements in the S-0.3 sample. The distribution maps for Br, Sn, Cs, F, and Ce elements, respectively, are also shown in Figure 1c–g, which clearly indicate a relatively uniform distribution of these elements. Figure 2 illustrates the variation in the content of Ce, Sn, and Br elements across samples with various Ce3+ doping concentrations. The data presented in Figure 2 demonstrate a negative correlation between the Ce3+ doping concentration and the Sn content, indicating that an increase in Ce3+ doping leads to a corresponding decrease in Sn content. This suggests that Ce3+ ions are incorporated into the Cs4SnBr6 lattice, substituting for some of the Sn2+ sites.
Figure 3 presents the XRD patterns of samples with varying Ce3+ doping concentrations. The diffraction peaks correspond to the (110), (131), (223), (300), and (330) crystal planes of the Cs4SnBr6 phase, in agreement with previously reported patterns for SnF2-derived Cs4SnBr6 [17,22]. The high crystallinity of the samples is evidenced by these discernible diffraction peaks, suggesting that the primary crystal structure of Cs4SnBr6 remains undisturbed even with Ce3+ doping. Moreover, increasing the Ce3+ doping concentration results in the gradual deviation of the diffraction peaks from the standard positions, shifting towards higher 2θ values. This shift is attributed to lattice shrinkage caused by the substitution of Sn2+ (r = 1.18 Å, coordination number = 6) with the smaller Ce3+ ions (r = 1.01 Å, coordination number = 6) in the octahedral sites. Additionally, a strong diffraction peak at 29.7° was observed, originating from the CsBr phase. This indicates an incomplete chemical reaction involving the CsBr powder precursors during the solid-state synthesis process.
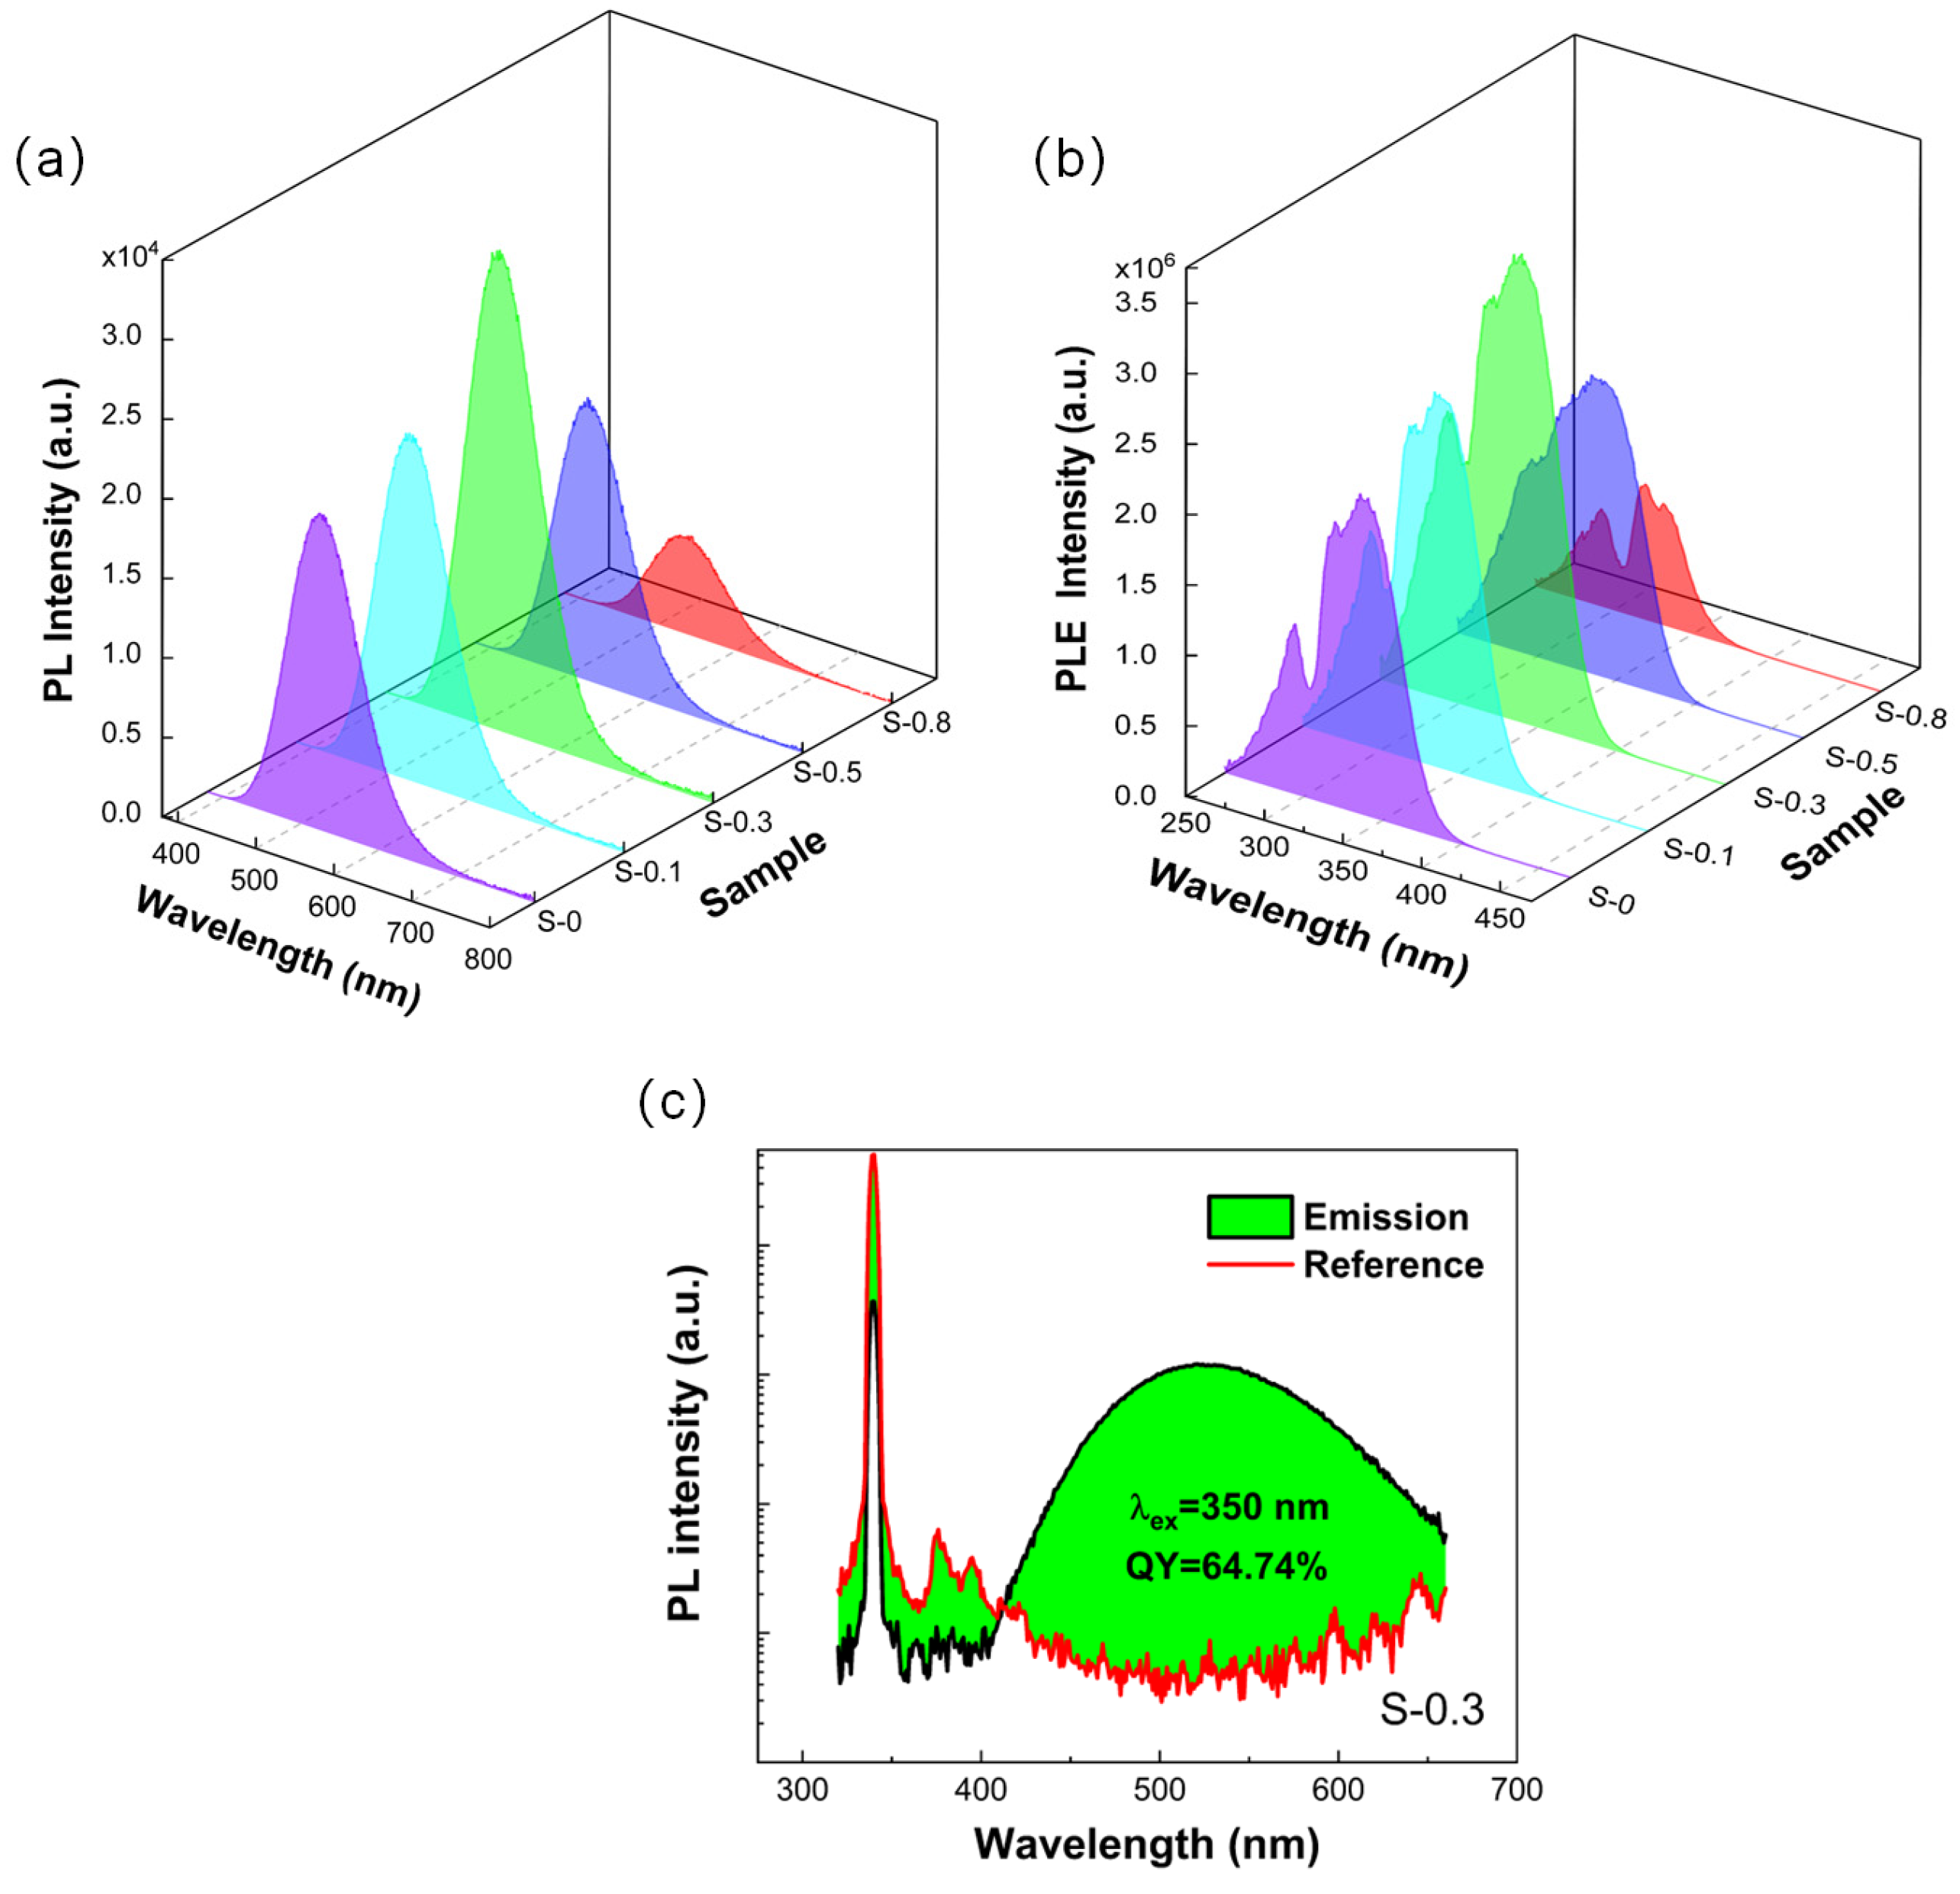
Figure 4 illustrates the PL characteristics of samples with varying Ce3+ doping concentrations. As shown in Figure 4a, the PL intensity increases progressively with higher Ce3+ doping concentrations, peaking at 525 nm with the maximum green emission when the Ce3+ doping concentration reaches 0.3 mmol. At this concentration, the PL efficiency attains approximately 64.74%, as depicted in Figure 4c. Beyond this point, further increases in Ce3+ doping concentration result in a decrease in PL intensity, likely due to the formation of non-radiative recombination centers caused by excessive Ce3+ doping, which in turn diminishes the PL intensity. Moreover, Figure 4b indicates that introducing a small amount of Ce3+ significantly enhances the PLE intensity from Cs4SnBr6 samples. This enhancement is beneficial for improving light absorption and conversion, thereby boosting light emission. A comparison of Figure 4a,b reveals that all samples exhibit a substantial Stokes shift of approximately 1.3 eV.
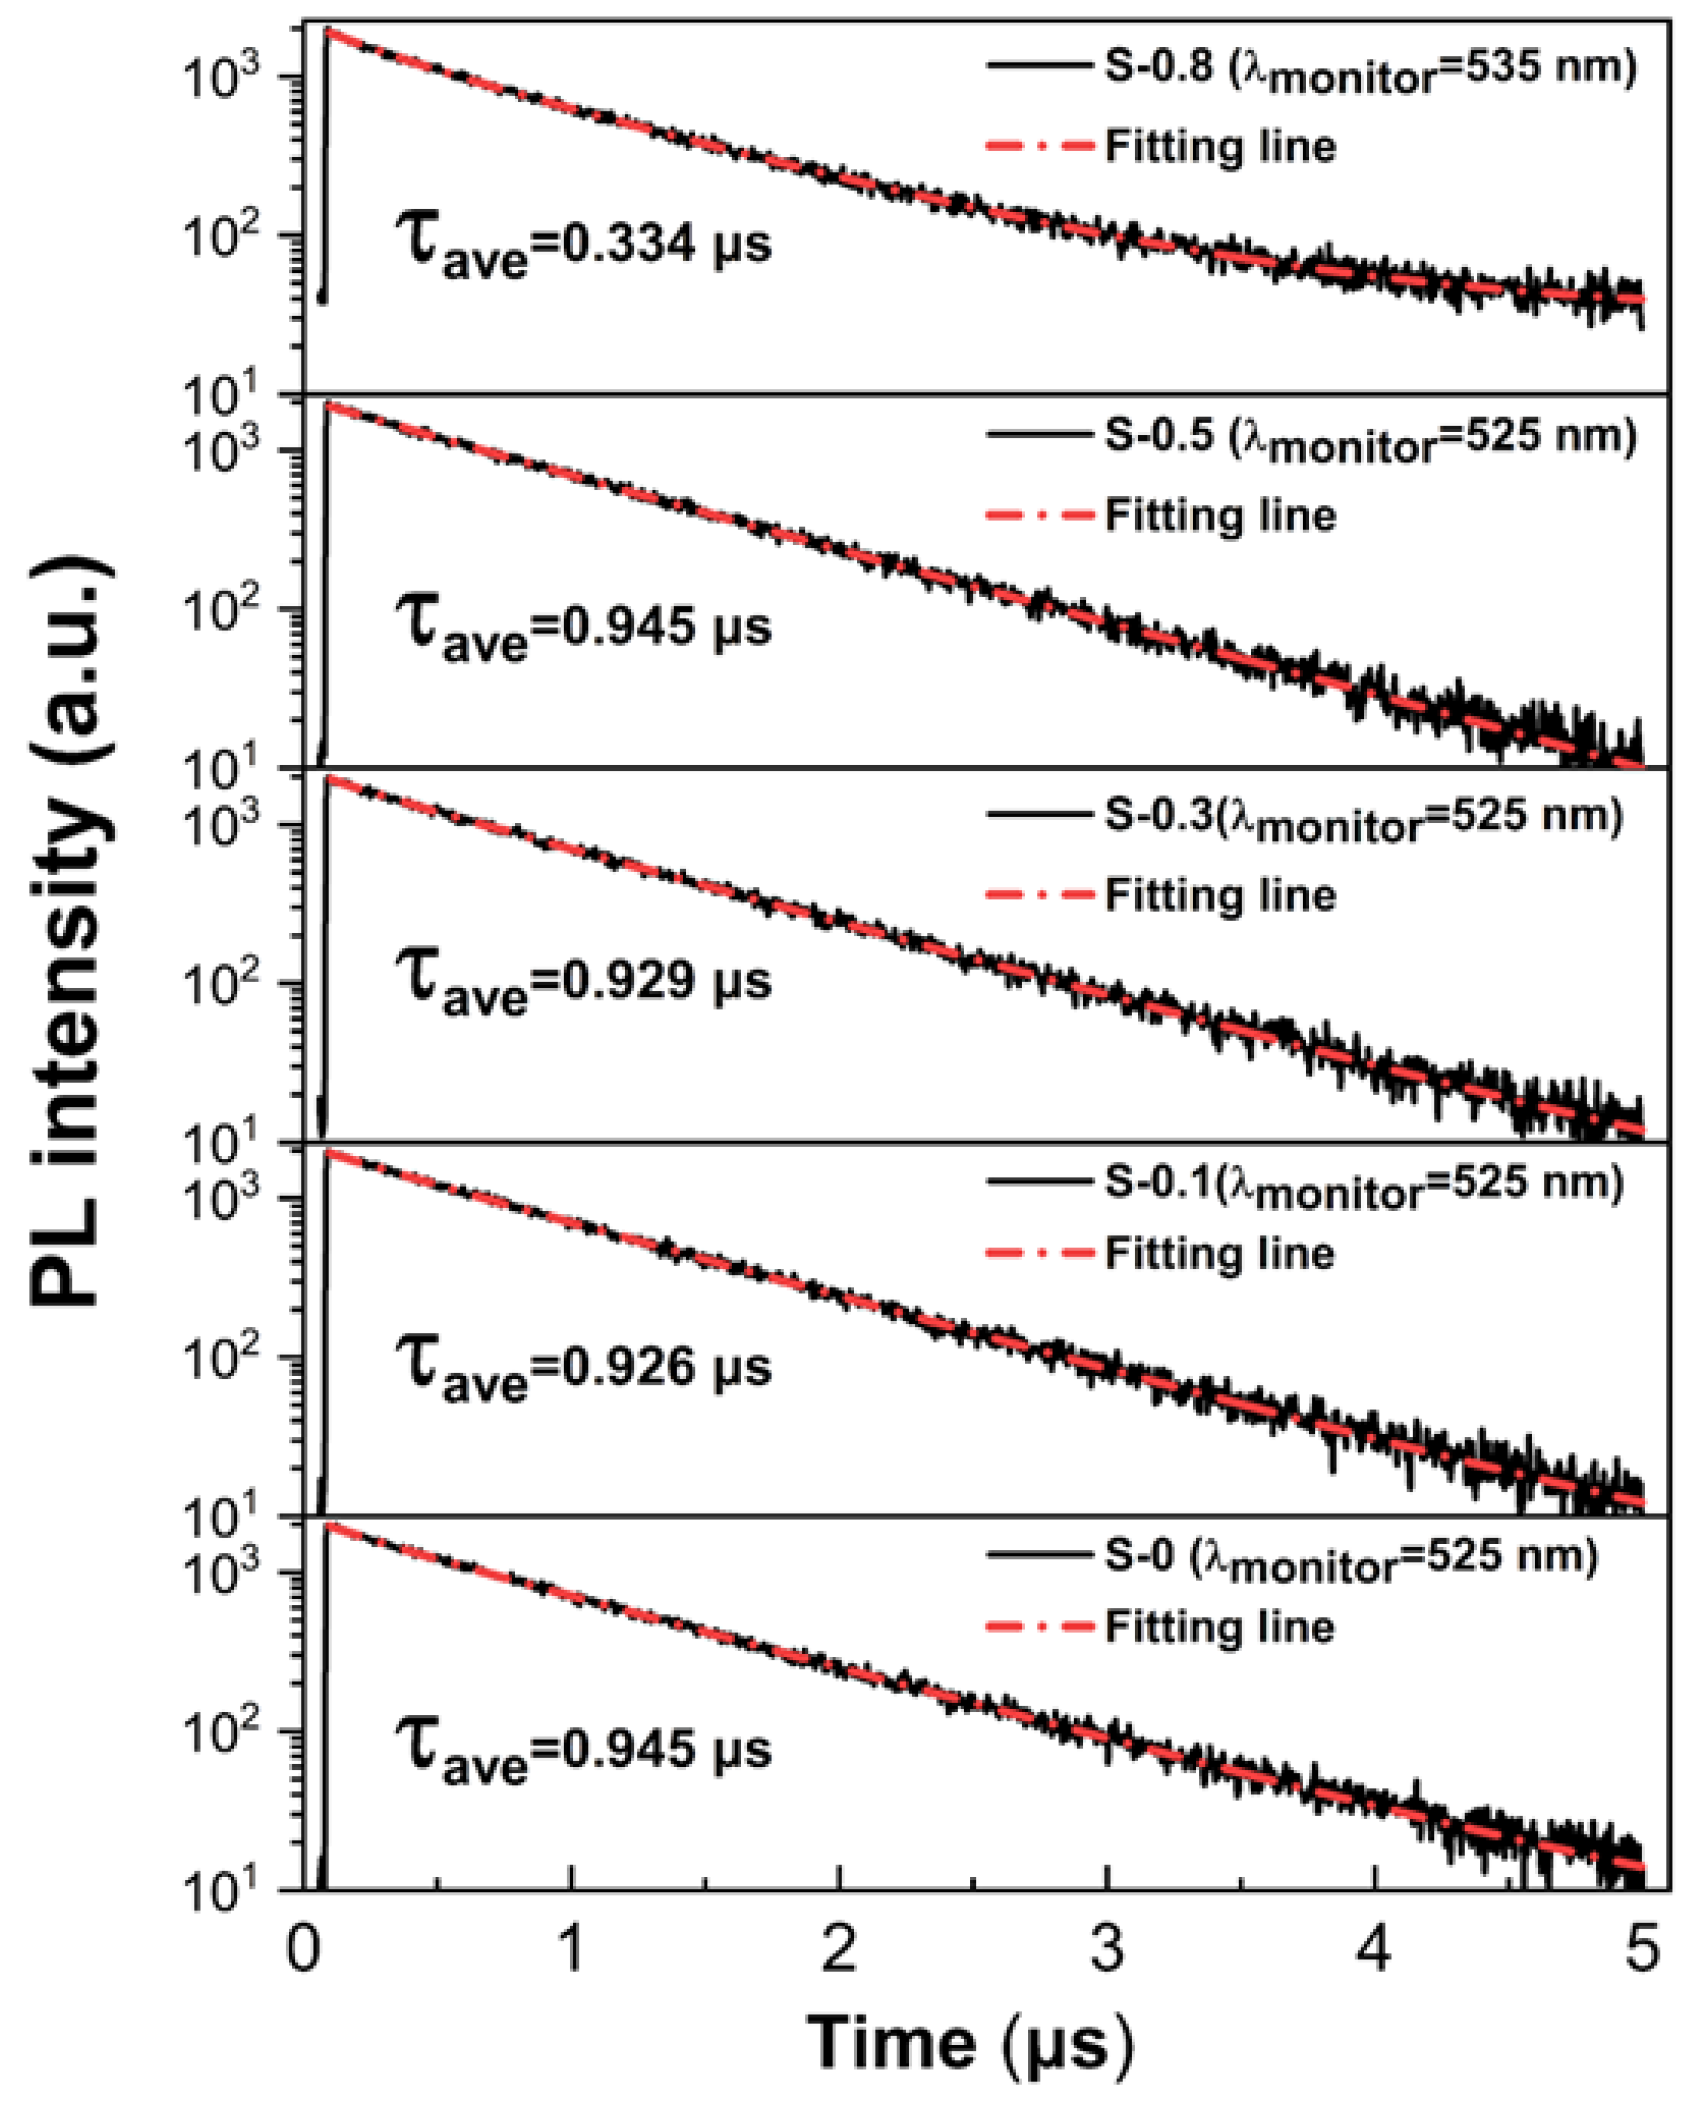
To better understand the PL properties, we measured the PL decay curves using an excitation wavelength of 375 nm, facilitated by 70 ps laser pulses. As depicted in Figure 5, the green emission from all samples exhibits a slow decay characteristic. We observed that all PL decay curves can be well-fitted by a biexponential function, described by the equation [23]:
I t = A 1 e t / τ 1 + A 2 e t / τ 2
where τ 1 and τ 2 are the time constants, and A1 and A2 are the normalized amplitudes of the lifetime components. The intensity-weighted average PL lifetime was determined by ( A 1 τ 1 2 + A 2 τ 2 2 ) / ( A 1 τ 1 + A 2 τ 2 ) accordingly [23]. Notably, the PL lifetimes of all samples are on the order of microseconds, indicative of self-trapped exciton emission characteristics [20,22]. However, we observed a significant decrease in PL lifetime as the CeBr3 molar ratio increased to 0.8 mmol, suggesting that excessive Ce3+ doping increases the probability of non-radiative recombination. Combined with the XRD analysis in Figure 3, we inferred that high Ce3+ doping levels cause severe distortion of the [SnBr6]4− octahedra in Cs4SnBr6, resulting in the formation of more defect states. This finding aligns with the observed decrease in emission intensity at higher Ce3+ doping levels, as shown in Figure 4a.
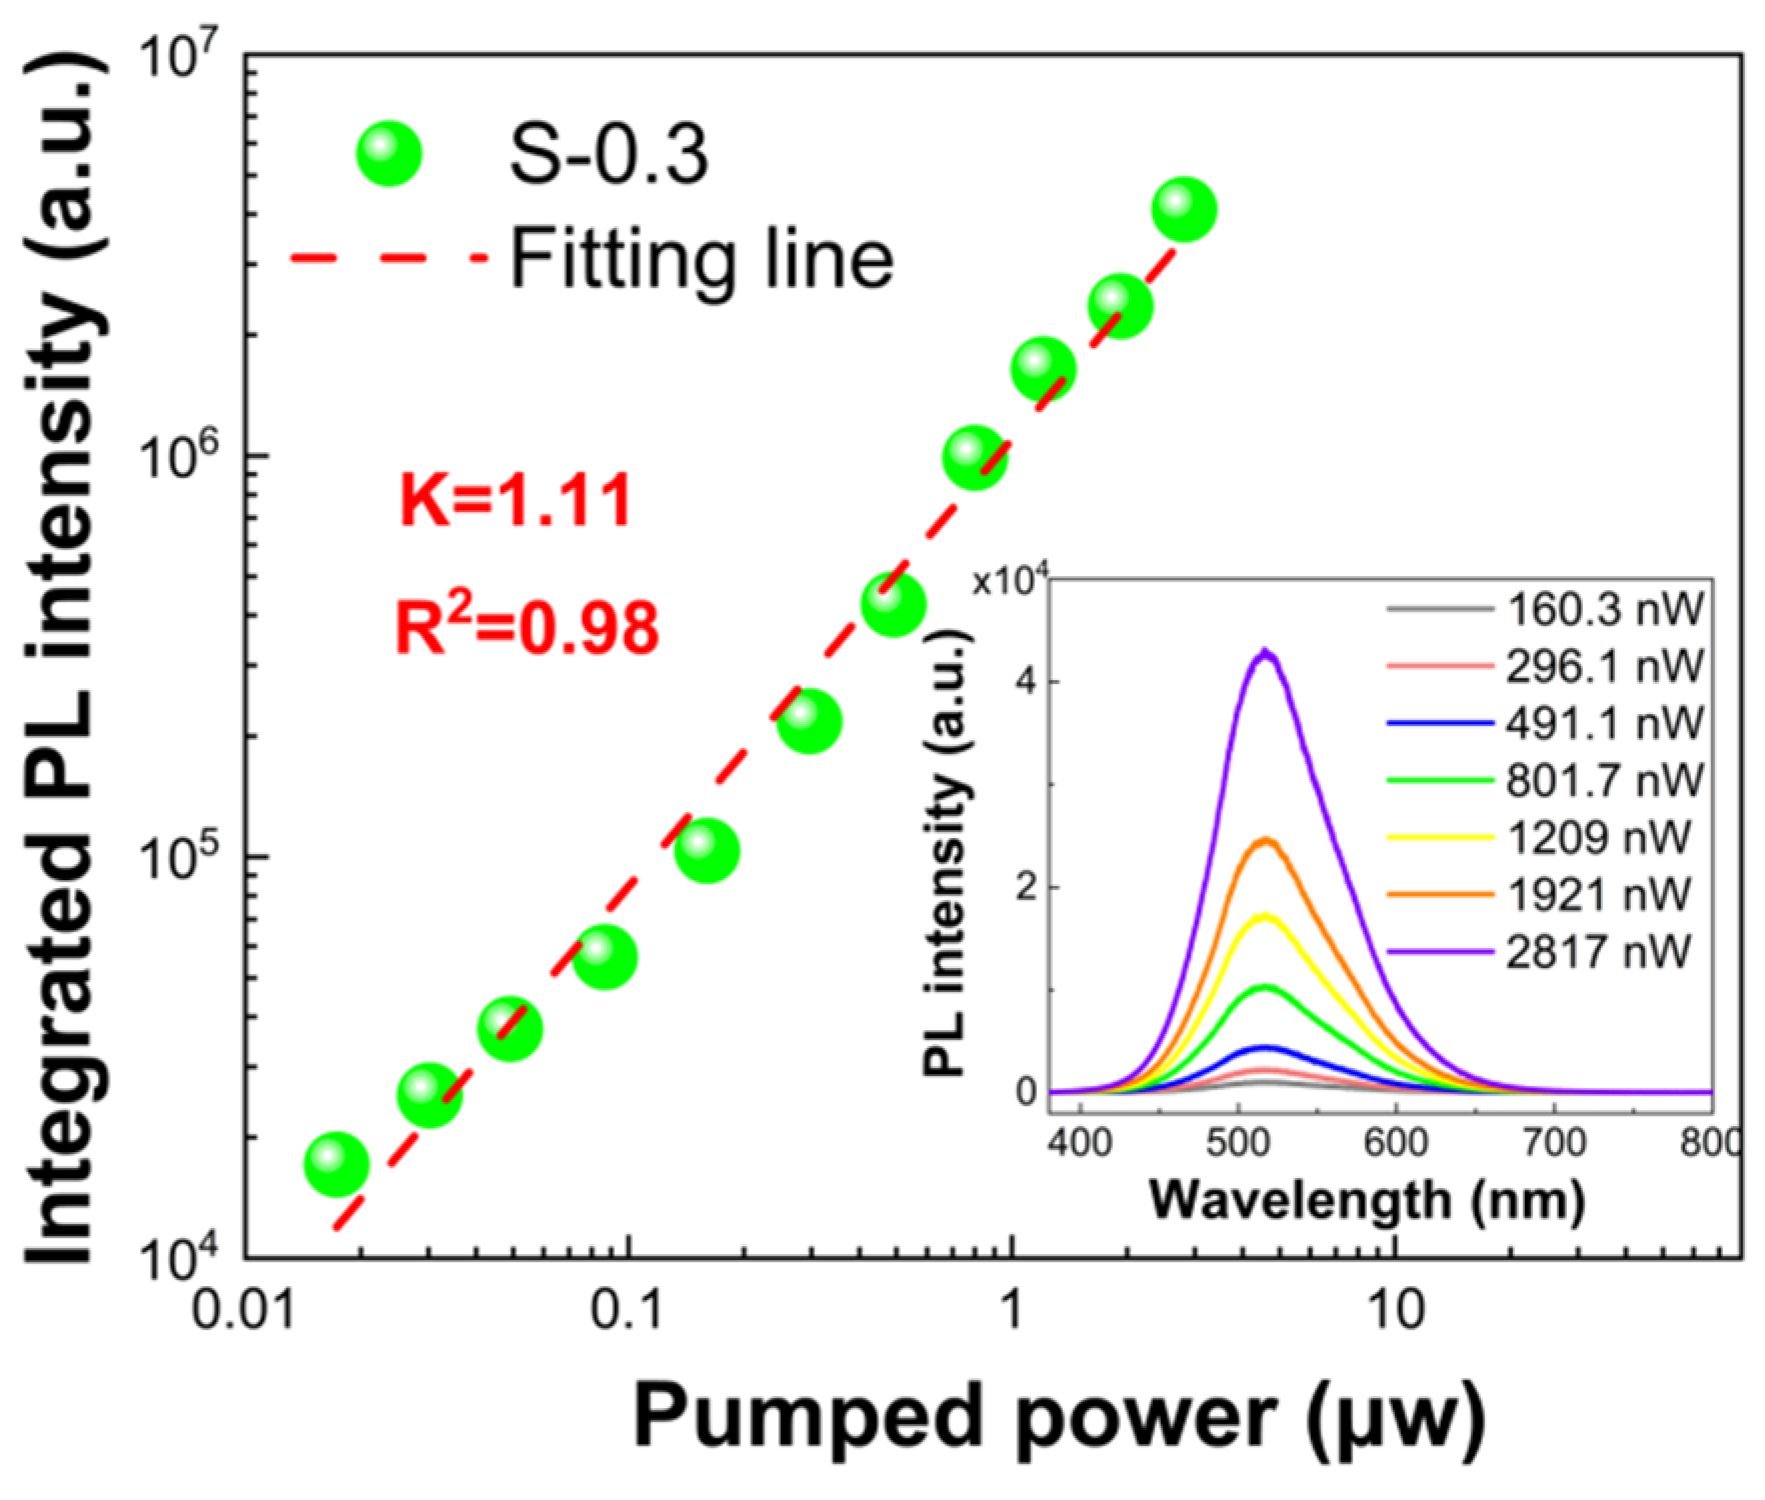
Figure 6 illustrates the relationship between PL intensity and pumping power for the S-0.3 sample. As depicted in the inset, the PL intensity increases consistently as the pumped power rises from 160.3 nW to 2817 nW. Notably, the PL peak position remains constant, unaffected by changes in pumped power. It is well known that the dependence of PL intensity on excitation power can be used to infer the underlying mechanisms of light emission in semiconductors. The PL intensity I can be expressed by the equation [24]:
I = η I 0 k
where I0 represents the pumped power, η is the emission efficiency, and k is an exponent related to the radiative recombination process. By performing a linear fit of ln(I/η) versus ln(I0), we can determine the value of k. As shown in Figure 6, there is a clear linear relationship between the integrated PL intensity and the pumped power in the range of 160.3 to 2817 nW, yielding a k value of 1.11. This suggests that the green emission from the S-0.3 sample can be attributed to self-trapped exciton states [20,24].
Figure 7a shows the PL intensity variation for the S-0.3 sample across a temperature range of 100–300 K. As observed, the PL intensity decreases with the rise in temperature, primarily due to thermal activation causing the detrapping of STEs, leading to a reduction in the radiative recombination rate. The light emission efficiency of STEs is greatly influenced by the exciton-binding energy. According to the Arrhenius equation, the relationship between the integrated PL intensity IPL (T) at different temperatures and the exciton binding energy of STEs can be expressed as [20]:
I P L ( T ) = I P L ( T 0 ) 1 + β e x p ( E b / k B T )
where IPL(T0) represents the integrated PL intensity at 100 K, β is a constant associated with radiative recombination centers’ density, KB denotes the Boltzmann constant, and Eb signifies the exciton binding energy. By fitting the data to Equation (3) of the Arrhenius equation, the exciton binding energy for the S-0.3 sample was determined to be 494 meV, significantly higher than that of the S-0 sample (265 meV) [20]. This indicates that Ce3+ doping can effectively suppress the thermal activation-induced detrapping of STEs in Cs4SnBr6, thereby enhancing efficient emission from STEs.
To further understand the self-trapped exciton states, the impact of electron–phonon coupling on the PL characteristics was investigated. According to Stadler’s theory [25], the full width at half maximum (FWHM) of PL spectra is closely associated with electron–phonon coupling and can be mathematically described as follows:
F W H M ( T ) = 2.36 S h ω c o t h h ω 2 k B T
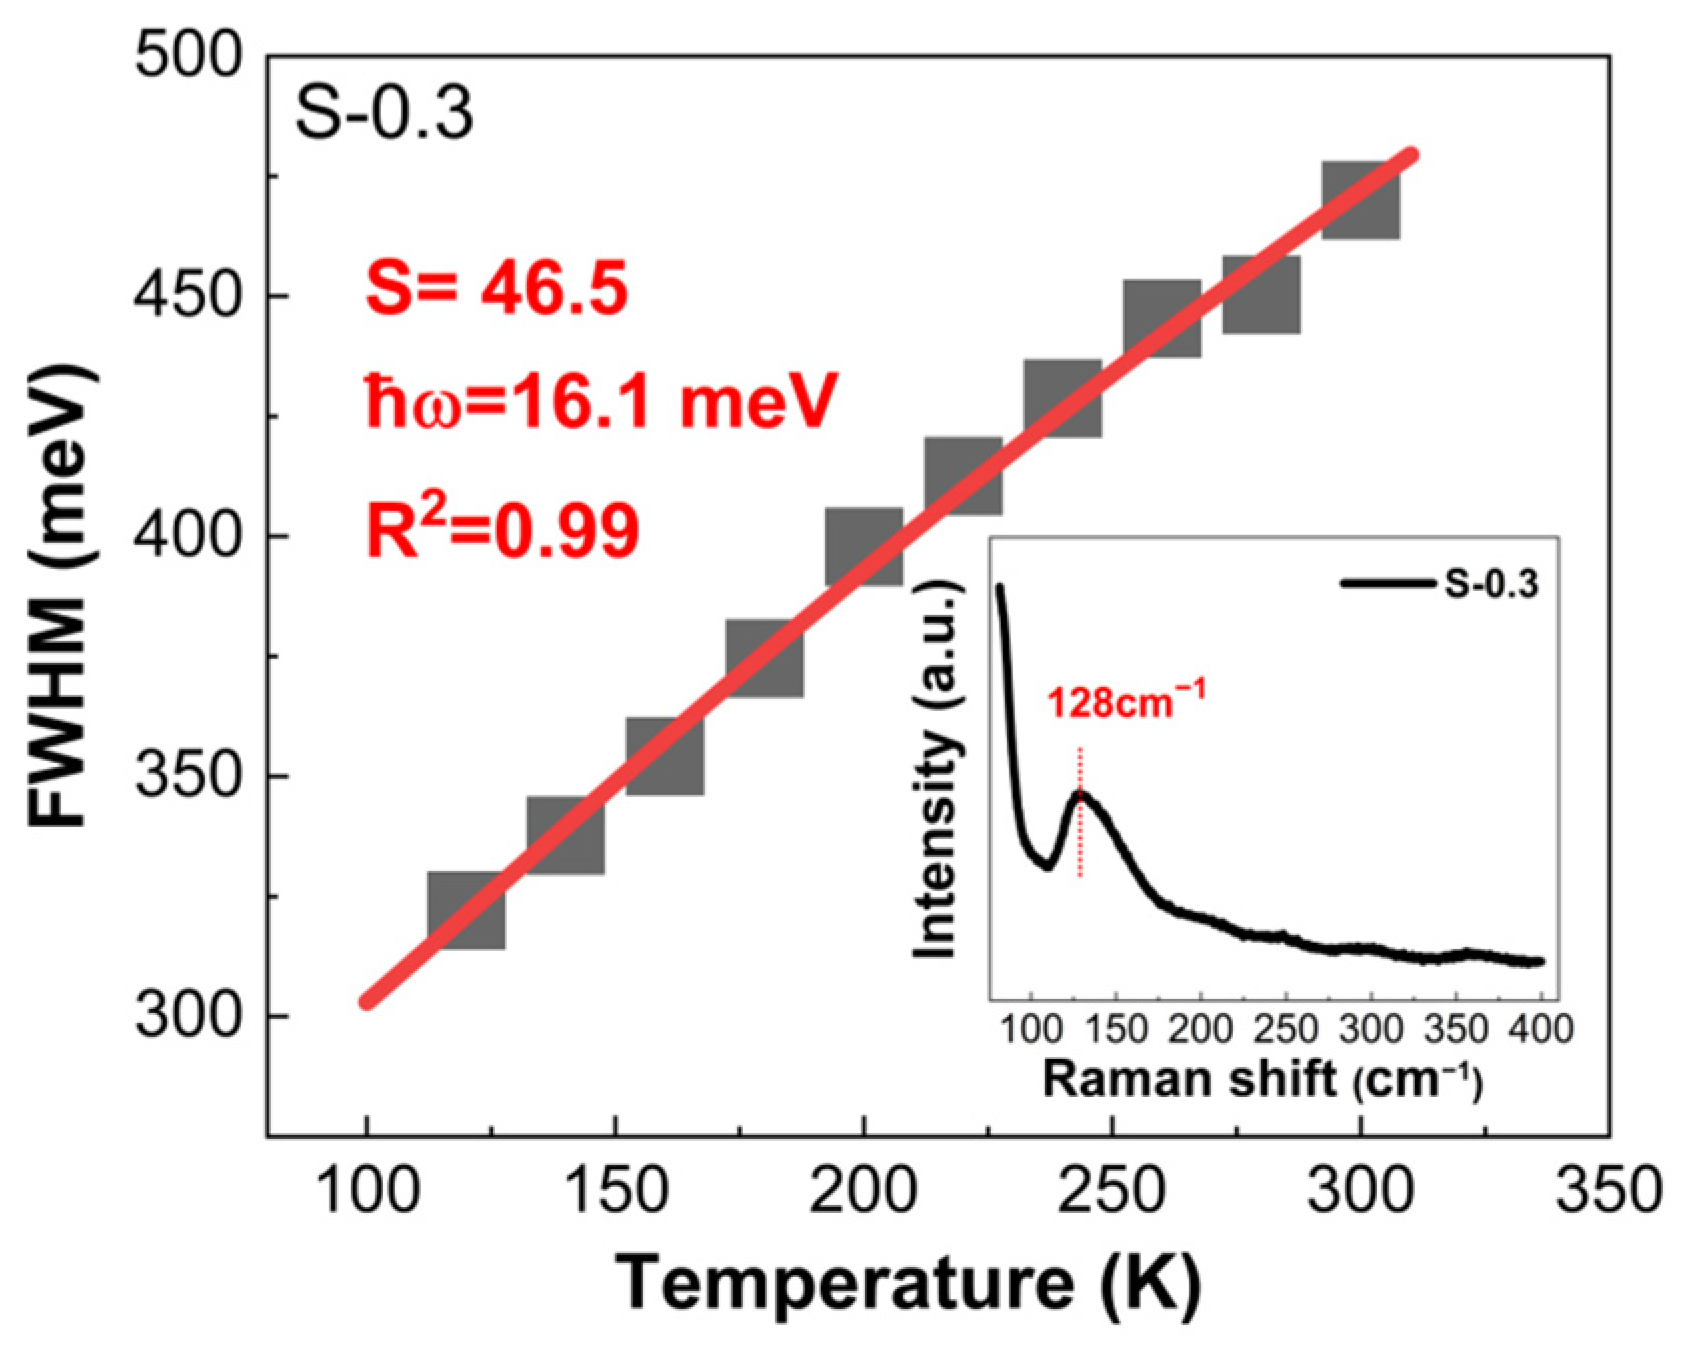
where S represents the Huang–Rhys factor, h ω denotes the optical phonon energy, and KB signifies the Boltzmann constant. The Huang–Rhys factor S is widely employed to characterize the exciton-phonon coupling effect. As shown in Figure 8, the S value for the S-0.3 sample is 46.5, higher than that (41.2) of the undoped sample [20], indicating enhanced electron–phonon coupling in the Ce3+-doped sample. This enhancement facilitates the formation of STEs. From the fit using Equation (4), the optical phonon energy ELO is found to be 17.6 meV (141 cm−1), which closely matches the Sn–Br stretching vibration mode observed around 128 cm−1 in Cs4SnBr6 (as shown in the inset of Figure 8) [26]. This indicates that the phonon modes involved in the electron–phonon coupling correspond to the Sn–Br stretching vibrations. Based on the above analysis and combined with the XRD results, we infer that Ce3+ doping in Cs4SnBr6 zero-dimensional perovskite induces structural distortions in the [SnBr6]4− octahedra. These subtle structural changes enhance the electron–phonon coupling effect and increase the exciton binding energy, which are key factors for the observed enhancement of STE emission in the S-0.3 sample.
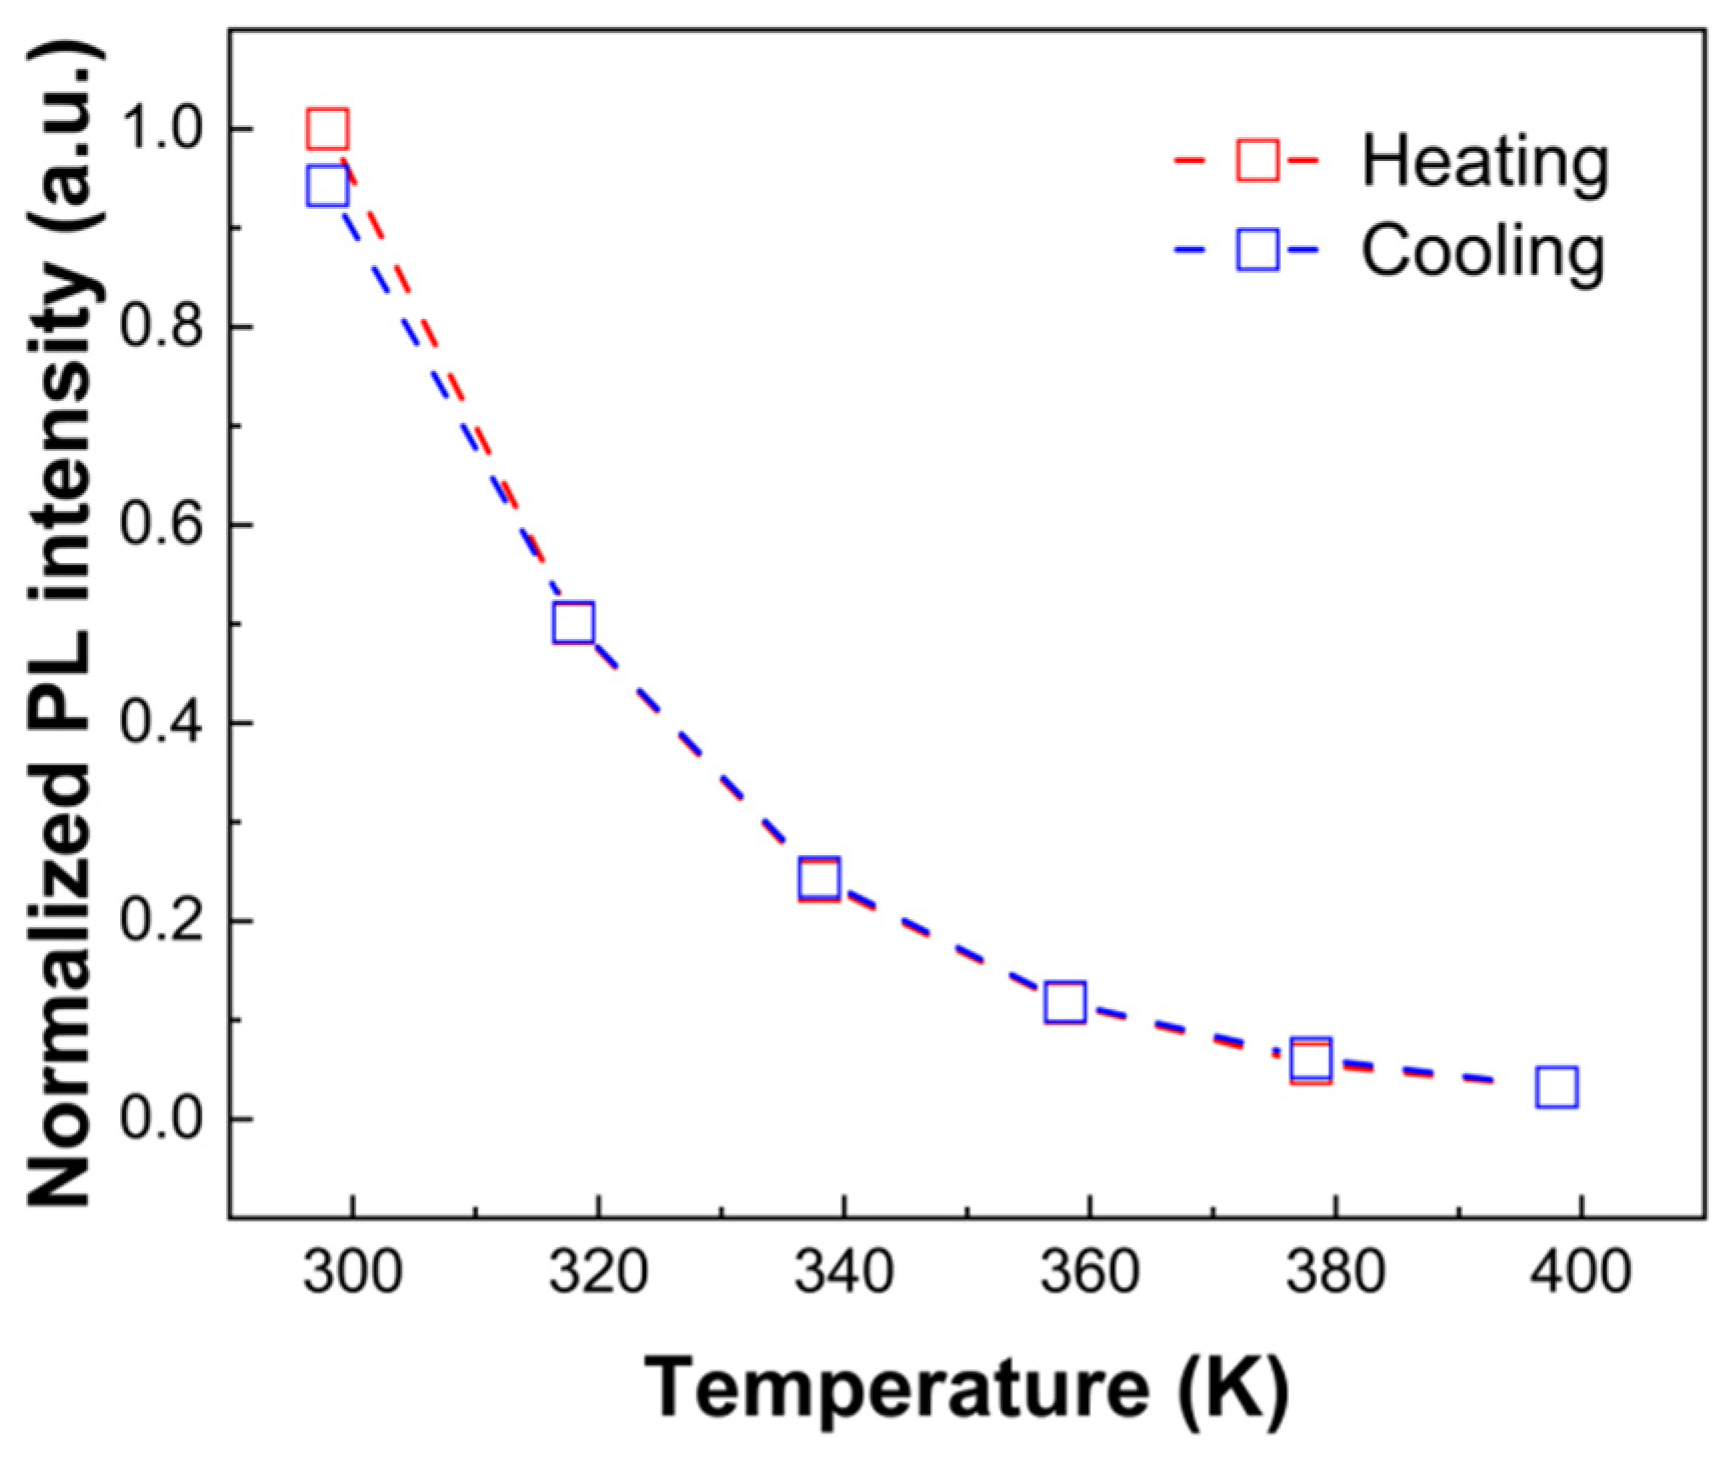
To evaluate the thermal stability of the S-0.3 sample, we monitored the changes in the integrated PL intensity at various temperatures through heating and cooling cycles. As illustrated in Figure 9, the S-0.3 sample exhibits PL thermal quenching as the temperature increases from 298 K to 398 K. Remarkably, upon cooling, the PL intensity nearly recovers to its original state, showing minimal reduction. In stark contrast, the S-0 sample demonstrates a significant decline in PL intensity, exceeding 90%, after undergoing the same thermal cycling [20]. These results clearly indicate that the S-0.3 sample has superior thermal stability compared to the S-0 sample.

4. Conclusions

In summary, Ce3+-doped Cs4SnBr6 zero-dimensional perovskite powders were successfully prepared by utilizing a water-assisted wet ball-milling method. Our study demonstrates that Ce3+ doping significantly enhances the PL efficiency and thermal stability of Cs4SnBr6. The Ce3+-doped samples exhibited a notable increase in light emission intensity from STEs, with an over 150% improvement compared to the undoped sample, achieving a PL QY of approximately 64.7%. Comprehensive analyses, including time-resolved PL, XRD, EDS, and temperature-dependent PL measurements, reveal that the enhanced PL results from the structural distortion of the [SnBr6]4− octahedra induced by Ce3+ doping. This structural alteration strengthens electron–phonon coupling and increases the binding energy of STEs, thereby contributing to improved luminescence and thermal stability. These findings underscore the potential of Ce3+-doped Cs4SnBr6 zero-dimensional tin-based perovskites for applications in optoelectronic devices, paving the way for future research to further optimize these materials for practical applications.

Author Contributions

X.L.: investigation, formal analysis, writing—original draft. H.W.: investigation, formal analysis. J.X.: investigation, formal analysis. Y.H.: investigation J.C.: investigation. J.S.: investigation. H.L.: formal analysis, writing—review and editing. R.H.: writing—review and editing, formal analysis, funding acquisition. All authors have read and agreed to the published version of the manuscript.

Funding

This research was funded by the Project of Guangdong Province Key Discipline Scientific Research Level Improvement (2021ZDJS039) and the Special Fund for Science and Technology Innovation Strategy of Guangdong Province (pdjh2023a0336).

Institutional Review Board Statement

Not applicable.

Informed Consent Statement

Not applicable.

Data Availability Statement

Data underlying the results presented in this paper are not publicly available at this time but may be obtained from the authors upon reasonable request.

Conflicts of Interest

The authors declare no conflicts of interest.

References

  1. Liu, X.K.; Xu, W.; Bai, S.; Jin, Y.; Wang, J.; Friend, R.H.; Gao, F. Metal halide perovskites for light-emitting diodes. Nat. Mater. 2021, 20, 10–21. [Google Scholar] [CrossRef] [PubMed]
  2. Hsu, W.-J.; Pettit, E.C.; Swartwout, R.; Zhitomirsky Kadosh, T.; Srinivasan, S.; Wassweiler, E.L.; Haugstad, G.; Bulović, V.; Holmes, R.J. Efficient Metal-Halide Perovskite Photovoltaic Cells Deposited via Vapor Transport Deposition. Sol. RRL 2024, 8, 2300758. [Google Scholar] [CrossRef]
  3. Wu, S.; Yuan, L.; Chen, G.; Peng, C.; Jiang, Y. All-inorganic Mn2+-doped metal halide perovskite crystals for the late-time detection of X-ray afterglow imaging. Nanoscale 2023, 15, 13628–13634. [Google Scholar] [CrossRef]
  4. Girolami, M.; Matteocci, F.; Pettinato, S.; Serpente, V.; Bolli, E.; Paci, B.; Generosi, A.; Salvatori, S.; Di Carlo, A.; Trucchi, D.M. Metal-halide perovskite submicrometer-thick films for ultra-stable self-powered direct X-ray detectors. Nano-Micro Lett. 2024, 16, 182. [Google Scholar] [CrossRef] [PubMed]
  5. Cho, H.; Jeong, S.H.; Park, M.H.; Kim, Y.H.; Wolf, C.; Lee, C.L.; Heo, J.H.; Sadhanala, A.; Myoung, N.; Yoo, S.; et al. Overcoming the electroluminescence efficiency limitations of perovskite light-emitting diodes. Science 2015, 350, 1222–1225. [Google Scholar] [CrossRef]
  6. Bai, W.; Xuan, T.; Zhao, H.; Dong, H.; Cheng, X.; Wang, L.; He, R.J. Perovskite light-emitting diodes with an external quantum efficiency exceeding 30%. Adv. Mater. 2023, 35, 2302283. [Google Scholar] [CrossRef] [PubMed]
  7. Fan, Q.; Biesold-McGee, G.V.; Ma, J.; Xu, Q.; Pan, S.; Peng, J.; Lin, Z. Lead-free halide perovskite nanocrystals: Crystal structures, synthesis, stabilities, and optical properties. Angew. Chem. Int. Ed. 2020, 59, 1030–1046. [Google Scholar] [CrossRef] [PubMed]
  8. Arfin, H.; Nag, A. Origin of luminescence in Sb3+- and Bi3+-doped Cs2SnCl6 perovskites: Excited state relaxation and spin–orbit coupling. J. Phys. Chem. Lett. 2021, 12, 10002–10008. [Google Scholar] [CrossRef]
  9. Infante, I.; Manna, L. Are there good alternatives to lead halide perovskite nanocrystals? Nano Lett. 2020, 21, 6–9. [Google Scholar] [CrossRef]
  10. Xu, K.; Wei, Q.; Wang, H.; Yao, B.; Zhou, W.; Gao, R.; Chen, H.; Li, H.; Wang, T.; Ning, Z. The 3D-structure-mediated growth of zero-dimensional Cs4SnX6 nanocrystals. Nanoscale 2022, 14, 2248–2255. [Google Scholar] [CrossRef]
  11. Ke, W.; Kanatzidis, M.G. Prospects for low-toxicity lead-free perovskite solar cells. Nat. Commun. 2019, 10, 965. [Google Scholar] [CrossRef] [PubMed]
  12. Liu, Q.; Yin, J.; Zhang, B.B.; Chen, J.K.; Zhou, Y.; Zhang, L.M.; Wang, L.M.; Zhao, Q.; Hou, J.; Shu, J.; et al. Theory-guided synthesis of highly luminescent colloidal cesium tin halide perovskite nanocrystals. J. Am. Chem. Soc. 2021, 143, 5470–5480. [Google Scholar] [CrossRef]
  13. Kang, C.; Rao, H.; Fang, Y.; Zeng, J.; Pan, Z.; Zhong, H. Antioxidative stannous oxalate derived lead-free stable CsSnX3 (X = Cl, Br, and I) perovskite nanocrystals. Angew. Chem. Int. Ed. 2021, 60, 660–665. [Google Scholar] [CrossRef]
  14. Zhang, B.B.; Chen, J.K.; Zhang, C.; Shirahata, N.; Sun, H.T. Mechanistic Insight into the Precursor Chemistry of Cesium Tin Iodide Perovskite Nanocrystals. ACS Mater. Lett. 2023, 5, 1954–1961. [Google Scholar] [CrossRef]
  15. Benin, B.M.; Dirin, D.N.; Morad, V.; Wörle, M.; Yakunin, S.; Rainò, G.; Nazarenko, O.; Fischer, M.; Infante, I.; Kovalenko, M.V. Highly emissive self-trapped excitons in fully inorganic zero-dimensional tin halides. Angew. Chem. Int. Ed. 2018, 57, 11329–11333. [Google Scholar] [CrossRef] [PubMed]
  16. Tan, L.; Wang, W.; Li, Q.; Luo, Z.; Zou, C.; Tang, M.; Zhang, L.; He, J.; Quan, Z. Colloidal syntheses of zero-dimensional Cs4SnX6 (X = Br, I) nanocrystals with high emission efficiencies. Chem. Commun. 2020, 56, 387–390. [Google Scholar] [CrossRef] [PubMed]
  17. Zhang, Q.; Liu, S.; He, M.; Zheng, W.; Wan, Q.; Liu, M.; Liao, X.; Zhan, W.; Yuan, C.; Liu, J.; et al. Stable Lead-Free Tin Halide Perovskite with Operational Stability > 1200 h by Suppressing Tin (II) Oxidation. Angew. Chem. 2022, 134, e202205463. [Google Scholar] [CrossRef]
  18. Ma, Z.; Liu, Z.; Lu, S.; Wang, L.; Feng, X.; Yang, D.; Wang, K.; Xiao, G.; Zhang, L.; Redfern, S.A.; et al. Pressure-induced emission of cesium lead halide perovskite nanocrystals. Nat. Commun. 2018, 9, 4506. [Google Scholar] [CrossRef]
  19. Li, K.; Ye, Y.; Zhang, W.; Zhou, Y.; Zhang, Y.; Lin, S.; Lin, H.; Ruan, J.; Liu, C. Ultra-stable and color-tunable manganese ions doped lead-free cesium zinc halides nanocrystals in glasses for light-emitting applications. Nano Res. 2022, 15, 9368–9376. [Google Scholar] [CrossRef]
  20. Lin, Z.; Wang, A.; Huang, R.; Wu, H.; Song, J.; Lin, Z.; Hou, D.; Zhang, Z.; Guo, Y.; Lan, S. Manipulating the sublattice distortion induced by Mn2+ doping for boosting the emission characteristics of self-trapped excitons in Cs4SnBr6. J. Mater. Chem. C 2023, 11, 5680–5687. [Google Scholar] [CrossRef]
  21. Wu, H.; Lin, Z.; Song, J.; Zhang, Y.; Guo, Y.; Zhang, W.; Huang, R. Boosting the Self-Trapped Exciton Emission in Cs4SnBr6 Zero-Dimensional Perovskite via Rapid Heat Treatment. Nanomaterials 2023, 13, 2259. [Google Scholar] [CrossRef] [PubMed]
  22. Chiara, R.; Ciftci, Y.O.; Queloz, V.I.; Nazeeruddin, M.K.; Grancini, G.; Malavasi, L. Green-emitting lead-free Cs4SnBr6 zero-dimensional perovskite nanocrystals with improved air stability. J. Phys. Chem. Lett. 2020, 11, 618–623. [Google Scholar] [CrossRef] [PubMed]
  23. Lin, K.H.; Liou, S.C.; Chen, W.L.; Wu, C.L.; Lin, G.R.; Chang, Y.M. Tunable and stable UV-NIR photoluminescence from annealed SiOx with Si nanoparticles. Opt. Express 2013, 21, 23416–23424. [Google Scholar] [CrossRef] [PubMed]
  24. Bergman, L.; Chen, X.B.; Morrison, J.L.; Huso, J.; Purdy, A.P. Photoluminescence dynamics in ensembles of wide-band-gap nanocrystallites and powders. J. Appl. Phys. 2004, 96, 675–682. [Google Scholar] [CrossRef]
  25. Stadler, W.; Hofmann, D.M.; Alt, H.C.; Muschik, T.; Meyer, B.K.; Weigel, E.; Müller-Vogt, G.; Salk, M.; Rupp, E.; Benz, K.W. Optical investigations of defects in Cd1−xZnxTe. Phys. Rev. B 1995, 51, 10619. [Google Scholar] [CrossRef]
  26. Kuok, M.H.; Tan, L.S.; Shen, Z.X.; Huan, C.H.; Mok, K.F. A Raman study of RbSnBr3. Solid State Commun. 1996, 97, 497–501. [Google Scholar] [CrossRef]
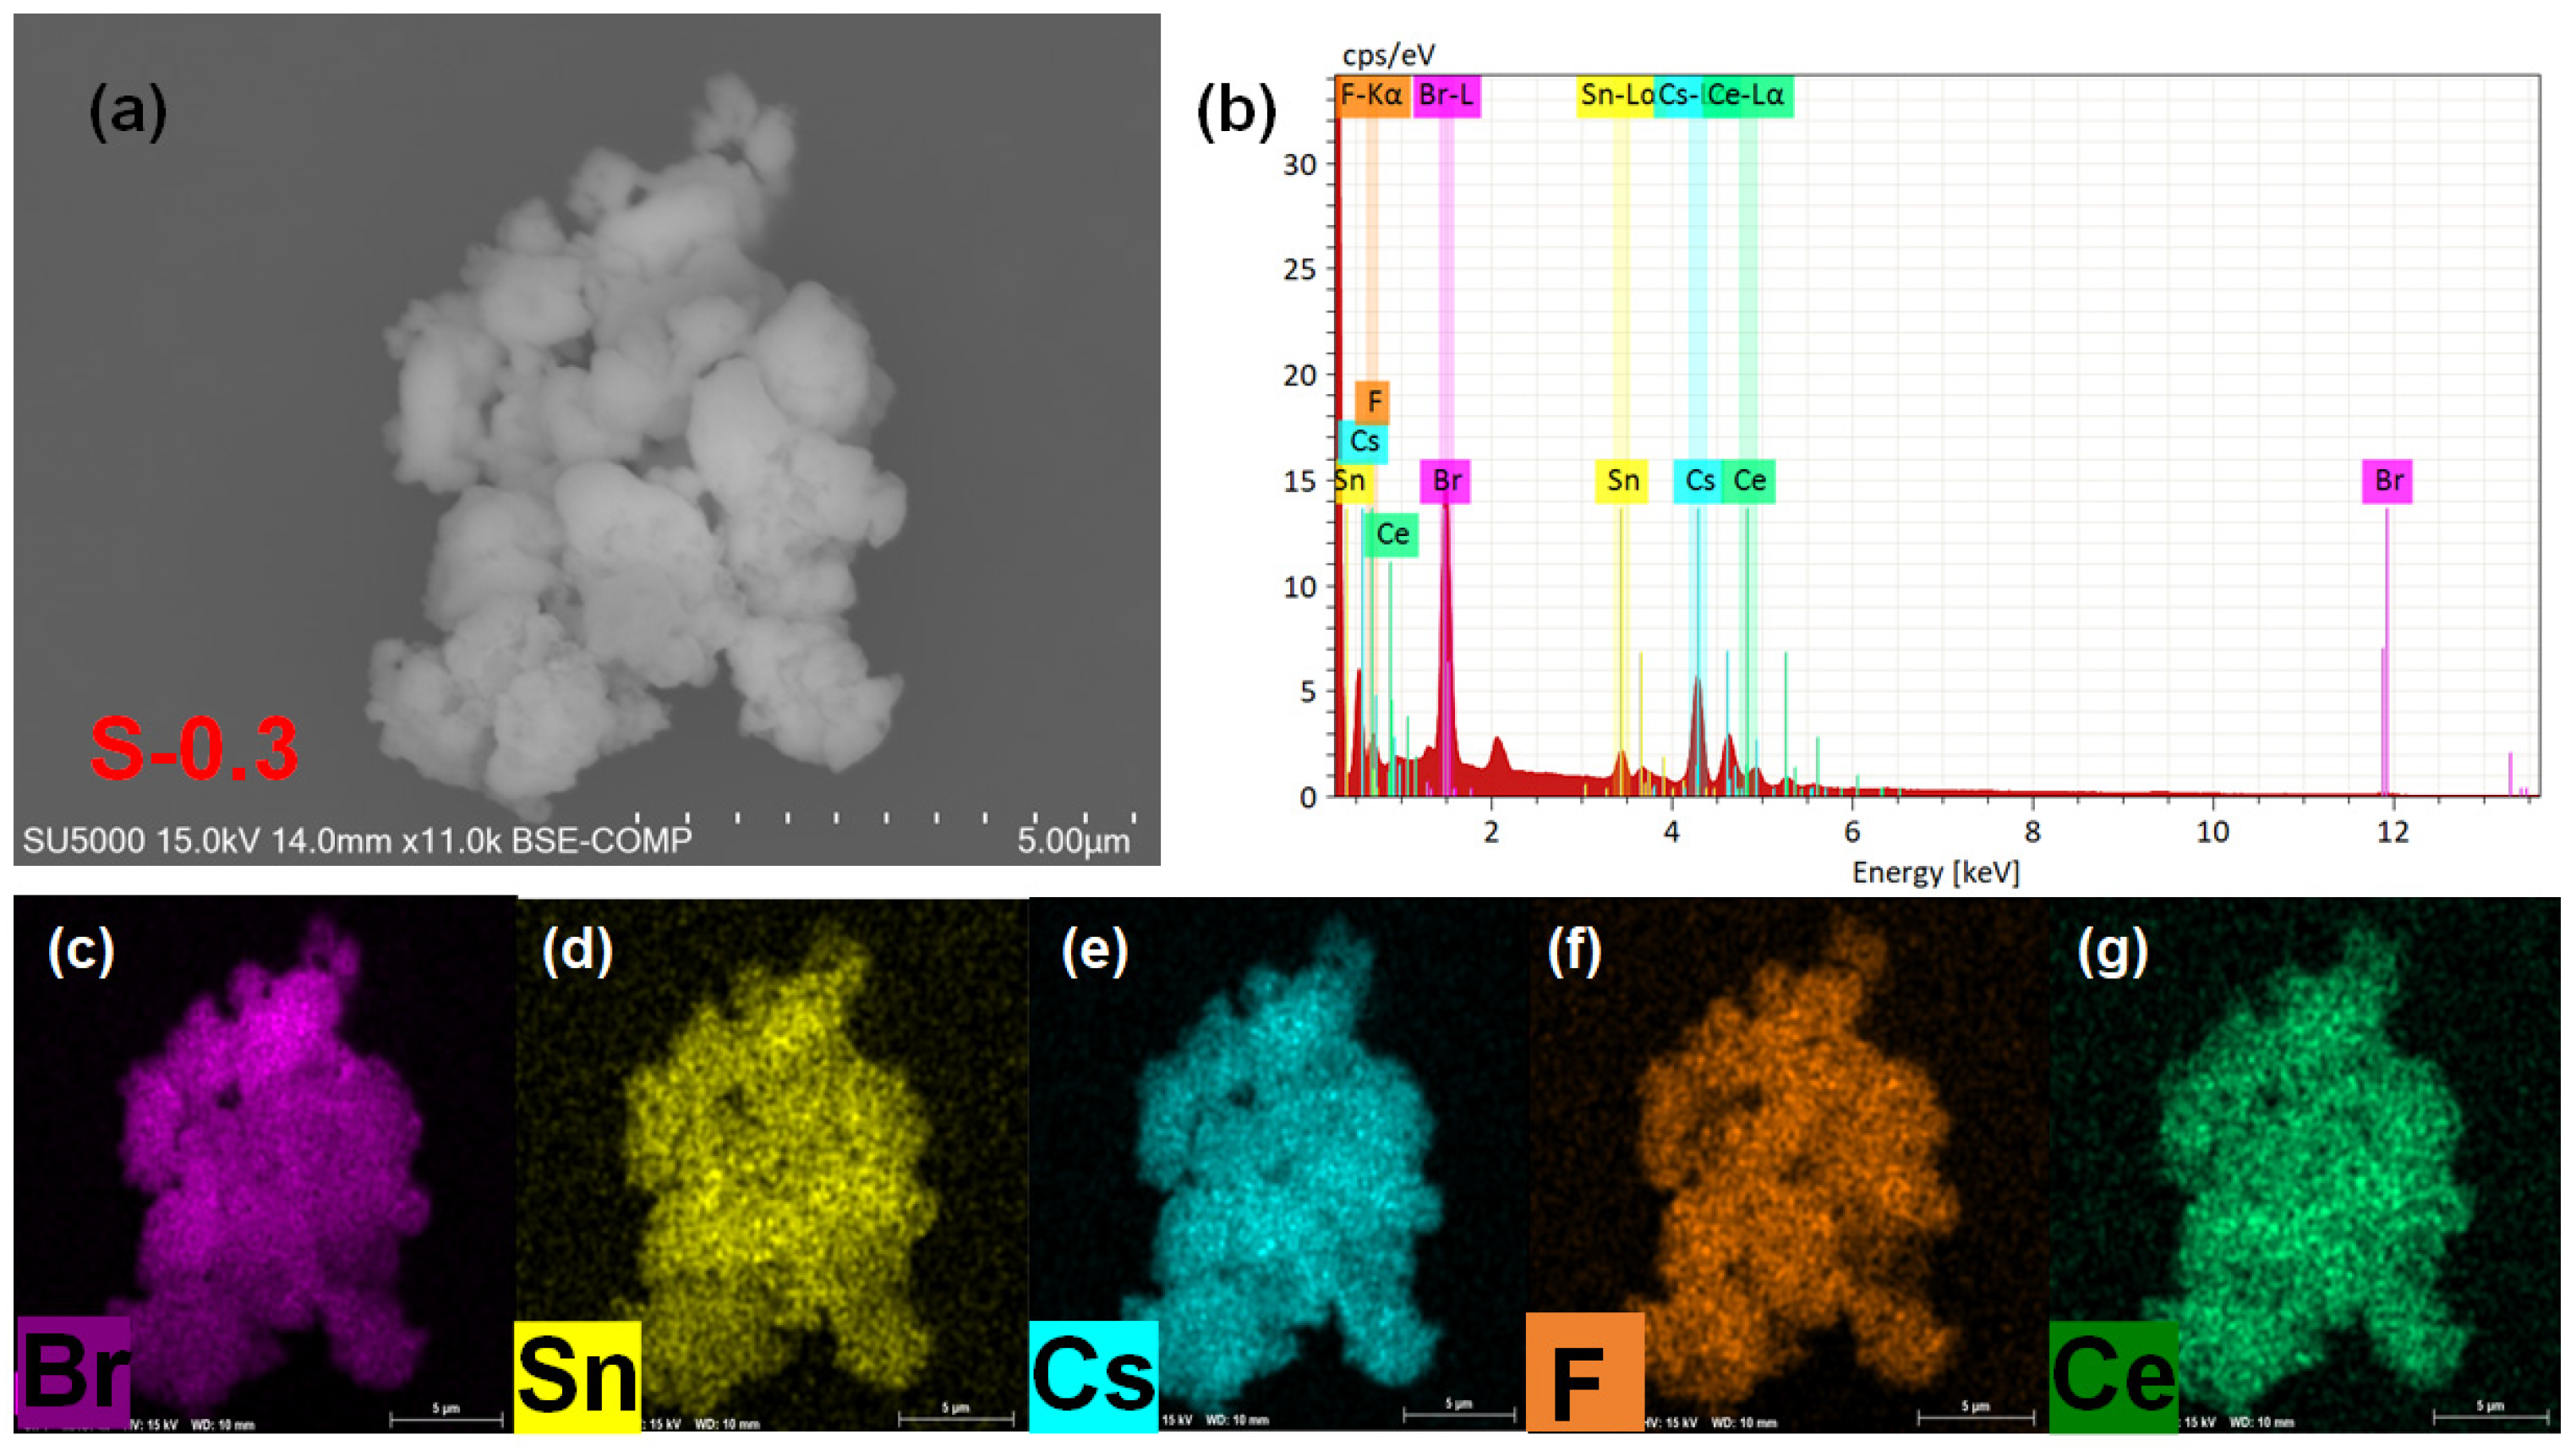
Figure 1. (a) The surface morphology image of the S-0.3 sample. (b) The signal intensity relationships of different elements. (cg) The elemental distribution maps of Br, Sn, Cs, F, and Ce in the S-0.3 sample.
Coatings 14 00945 g001
Figure 2. The Br, Sn, and Ce elemental content in Cs4SnBr6 samples with different Ce3+ doping levels.
Coatings 14 00945 g002
Figure 3. XRD patterns of Cs4SnBr6 powders with various Ce3+ doping levels, respectively.
Coatings 14 00945 g003
Figure 4. (a) PL intensity of Cs4SnBr6 samples with different Ce3+ doping levels. The PL spectra are excited by the 340 nm line from the Xe lamp. (b) PLE intensity of Cs4SnBr6 samples with different Ce3+ doping levels. The PLE spectra are monitored at 525 nm. (c) The PL QY was acquired from the PLE and PL spectra for the Cs4SnBr6 sample 0.3.
Coatings 14 00945 g004
Figure 5. Time-resolved PL decay traces were recorded at 525 nm in Ce3+-doped Cs4SnBr6 perovskites with different doping levels. Each measurement was performed using an excitation wavelength of 375 nm with 70 ps laser pulses.
Coatings 14 00945 g005
Figure 6. Integrated PL intensity as a function of pumped power for the S-0.3 sample. The red dashed line represents the fitting curve, yielding a power–law exponent (K) of 1.11 with a coefficient of determination (R2) of 0.98. The inset shows the PL spectra of the S-0.3 sample under various pumped powers.
Coatings 14 00945 g006
Figure 7. (a) Temperature-dependent PL spectra of the S-0.3 sample. The 3D plot displays PL intensity as a function of wavelength and temperature. The color scale indicates the PL intensity in arbitrary units (a.u.), showing a peak in the lower temperature range. (b) Arrhenius plot of the integrated PL intensity versus inverse temperature (1/T) for the S-0.3 sample. The green dotted line represents the fitting curve, yielding an exciton binding energy Eb of 494 meV with a coefficient of determination R2 of 0.99.
Coatings 14 00945 g007
Figure 8. The FWHM of the PL spectra as a function of temperature for the S-0.3 sample. The red line represents the linear fit of the data, yielding a Huang–Rhys factor (S) of 46.5 and an optical phonon energy (h ω ) of 16.1 meV, with a coefficient of determination (R2) of 0.99. The inset displays the Raman spectrum of the S-0.3 sample.
Coatings 14 00945 g008
Figure 9. Heating and cooling cycle measurements of the S-0.3 sample across various temperatures.
Coatings 14 00945 g009
Disclaimer/Publisher’s Note: The statements, opinions and data contained in all publications are solely those of the individual author(s) and contributor(s) and not of MDPI and/or the editor(s). MDPI and/or the editor(s) disclaim responsibility for any injury to people or property resulting from any ideas, methods, instructions or products referred to in the content.