Article

Study on Characterization of Phase Transition in Continuous Cooling of Carbon Steel Using In Situ Thermovoltage Measurement

1
School of Materials Science and Engineering, Shanghai Institute of Technology, Shanghai 201418, China
2
School of Materials Science and Engineering, Shanghai Jiao Tong University, Shanghai 201306, China
*
Author to whom correspondence should be addressed.
Coatings 2024, 14(8), 980; https://doi.org/10.3390/coatings14080980
Submission received: 21 June 2024 / Revised: 29 July 2024 / Accepted: 29 July 2024 / Published: 3 August 2024
(This article belongs to the Special Issue Advancement in Heat Treatment and Surface Modification for Metals)

Abstract

:
In this paper, a self-designed and enhanced thermovoltage measuring device was built to capture thermovoltage curves of 45 steel during continuous cooling. The phase zones of the thermovoltage curve were interpreted based on the Engel–Brewer electron theory and Fe-Fe3C phase diagram. The results show that the curve was stratified into three homogeneous phase zones and two-phase transition zones as follows: Zone Ι: single-phase austenite (A) zone; Zone III: austenite and ferrite (A+F) homogeneous phase zone; Zone V: ferrite and pearlite (P+F) homogeneous phase zone; Zone II: austenite to ferrite (A-F) phase transition zone; and Zone IV: austenite to pearlite (A-P) phase transition zone. Notably, the deflection point marked the transition temperature, which indicates that the thermovoltage curve can quantitatively characterize phase formation and transformation, as well as the phase transformation process. Furthermore, the sample was quenched at the measured ferrite phase transition temperature. Microstructure observations, electron probe microanalyzer (EPMA) and microhardness measurements corroborated our findings. Specifically, our experiments reveal ferrite precipitation first from the cold end at the phase transition temperature, leading to increased carbon content in adjacent austenite. The results of this study achieved the in situ characterization of bulk transformations during the materials heat treatment process, which expands the author’s research work conducted previously.

1. Introduction

Metallic phase transformation holds immense significance in the realm of materials science and engineering. Through the manipulation of heat treatment processes, the phase transition behavior of metals can be finely controlled, enabling the modulation of their crystal structure and enhancement of material properties, which bears substantial importance for the design and advancement of materials [1,2]. Consequently, research and application of metal phase transitions exert a profound impact on modern industry and scientific endeavors.
Analyzing phase transitions relies on various research methods, including traditional metallographic observation and modern techniques such as high-temperature metallography, X-ray diffraction, differential thermal analysis, and thermal expansion [3,4,5]. Traditional metallography requires observing microstructures after heat treatment, making it impossible to characterize phase transformation online and continuously. High-temperature metallography is only suitable for observing microstructures with significant volume changes between the new phase and the parent phase due to the low resolution of the metallographic microscope [6]. High-temperature X-ray diffraction [7,8] offers insights into phase transitions by analyzing diffraction peaks, yet it requires phase contents exceeding 5% for accuracy; otherwise, it will lead to deviations from actual transition temperatures. Differential thermal analysis [9] detects phase transitions based on latent heat release but struggles with low heat release or slow transformation rates and is also impacted by sample size. Moreover, real-time continuous tracking of the phase transition process cannot be achieved using the above methods. The thermal expansion method [10] is commonly used for the online measurement of phase transitions by detecting volume effects associated with the phase changes. However, it may possess low accuracy when the measured phase changes lack noticeable volume effects, and the phase transition rate is relatively low. Therefore, efforts should be made to determine a characterization method capable of precisely quantifying in situ measurements for phase transition during heat treatment and independent of sample size.
Thermovoltage serves as a crucial physical property of metallic materials, which is highly sensitive to minute alterations in the internal microstructure and composition of the material [11]. According to the Mott–Jones theory [12], variations in thermovoltage are caused by changes in electron density at the Fermi energy level. Specific temperature-induced transformations in material microstructure, such as solid solution decomposition, phase formation and transition, precipitation and dissolution of secondary phases, and modifications in grain size, can change the electron density at the Fermi energy level, which will consequently induce significant shifts in thermovoltage. As a result, thermovoltage measurement is a widely utilized and precise characterization technique for evaluating diverse microstructural changes in materials.
Thermovoltage is sensitive to variations in solid solution elements. R. Borrelly et al. [13] explored the solubility of iron in zirconium under various heat-treatment conditions and iron contents through ambient thermovoltage measurements. Similarly, J.C. Brachet [14] identified a correlation between thermovoltage and the concentration of interstitial atoms, such as carbon and nitrogen, in untransformed austenite within 9Cr-W-V-(Ta) martensitic steels. Also, thermovoltage is sensitive to microstructure changes. Seon Jin Kim et al. [15] investigated zirconium alloys with different aging processes, observing a parallel trend between microhardness changes and thermovoltage alterations. They attributed this to the disappearance of dislocations and defects during aging, leading to increased thermovoltage. Teerapong Samran et al. [16] analyzed ambient thermovoltage in low-alloyed steels with varied heat treatments, correlating crystal structure characterization by XRD with thermovoltage variations. They found that rapid cooling in quenched samples impeded carbon atom diffusion, causing lattice distortions and decreased thermovoltage. Moreover, thermovoltage changes significantly with the formation and transition of phases. Attila Szabó et al. [17] conducted thermovoltage assessments on the Fe80−xNixB20 alloy, observing non-monotonic thermovoltage variations with increasing Ni content due to hidden phase structure transitions when the Ni content reaches 70%. Michel Perez et al. [18] investigated the isothermal tempering process of 100Cr6 (AISI52100) bearing steel, associating dimensional changes with the precipitation of ε-carbides and cement. They quantified precipitate volume fraction by monitoring thermovoltage evolution. I. Radelytskyi et al. [19] scrutinized Ni2MnGa single-crystal martensitic transformation, noting abrupt thermovoltage changes at the martensitic phase transition temperature.
The aforementioned studies on thermovoltage are primarily involved in non-in situ, non-online detection methods conducted on heat-treated specimens at room temperature. By leveraging the measurement principle of thermovoltage, a specialized thermovoltage measurement device was successfully built and applied to obtain in situ thermovoltage–temperature curves during the precisely controlled heat treatment process of 45 steel, enabling the characterization of surface ferrite phase transitions [20]. In this study, the in situ thermovoltage measurement method proposed by our group will be further advanced. By tracking the phase transition process of carbon steel during continuous cooling, in situ thermovoltage–temperature curves and the deflection of thermovoltage around phase transition temperatures can be obtained. The Engel–Brewer electron theory is employed to theoretically interpret the variation patterns observed in each phase region of the thermovoltage curves. This novel method offers a valuable avenue for studying phase transitions in the heat treatment processes of material.

2. Experimental Materials and Methods

In this study, the employed materials were 45 steel, T8 steel, and pure iron, each with a thickness of 2 mm, as detailed in Table 1. Prior to heat treatment, samples measuring 2 mm × 25 mm × 30 mm underwent uniform surface polishing. This critical step aimed to remove surface impurities that might otherwise distort the thermovoltage signal during acquisition.

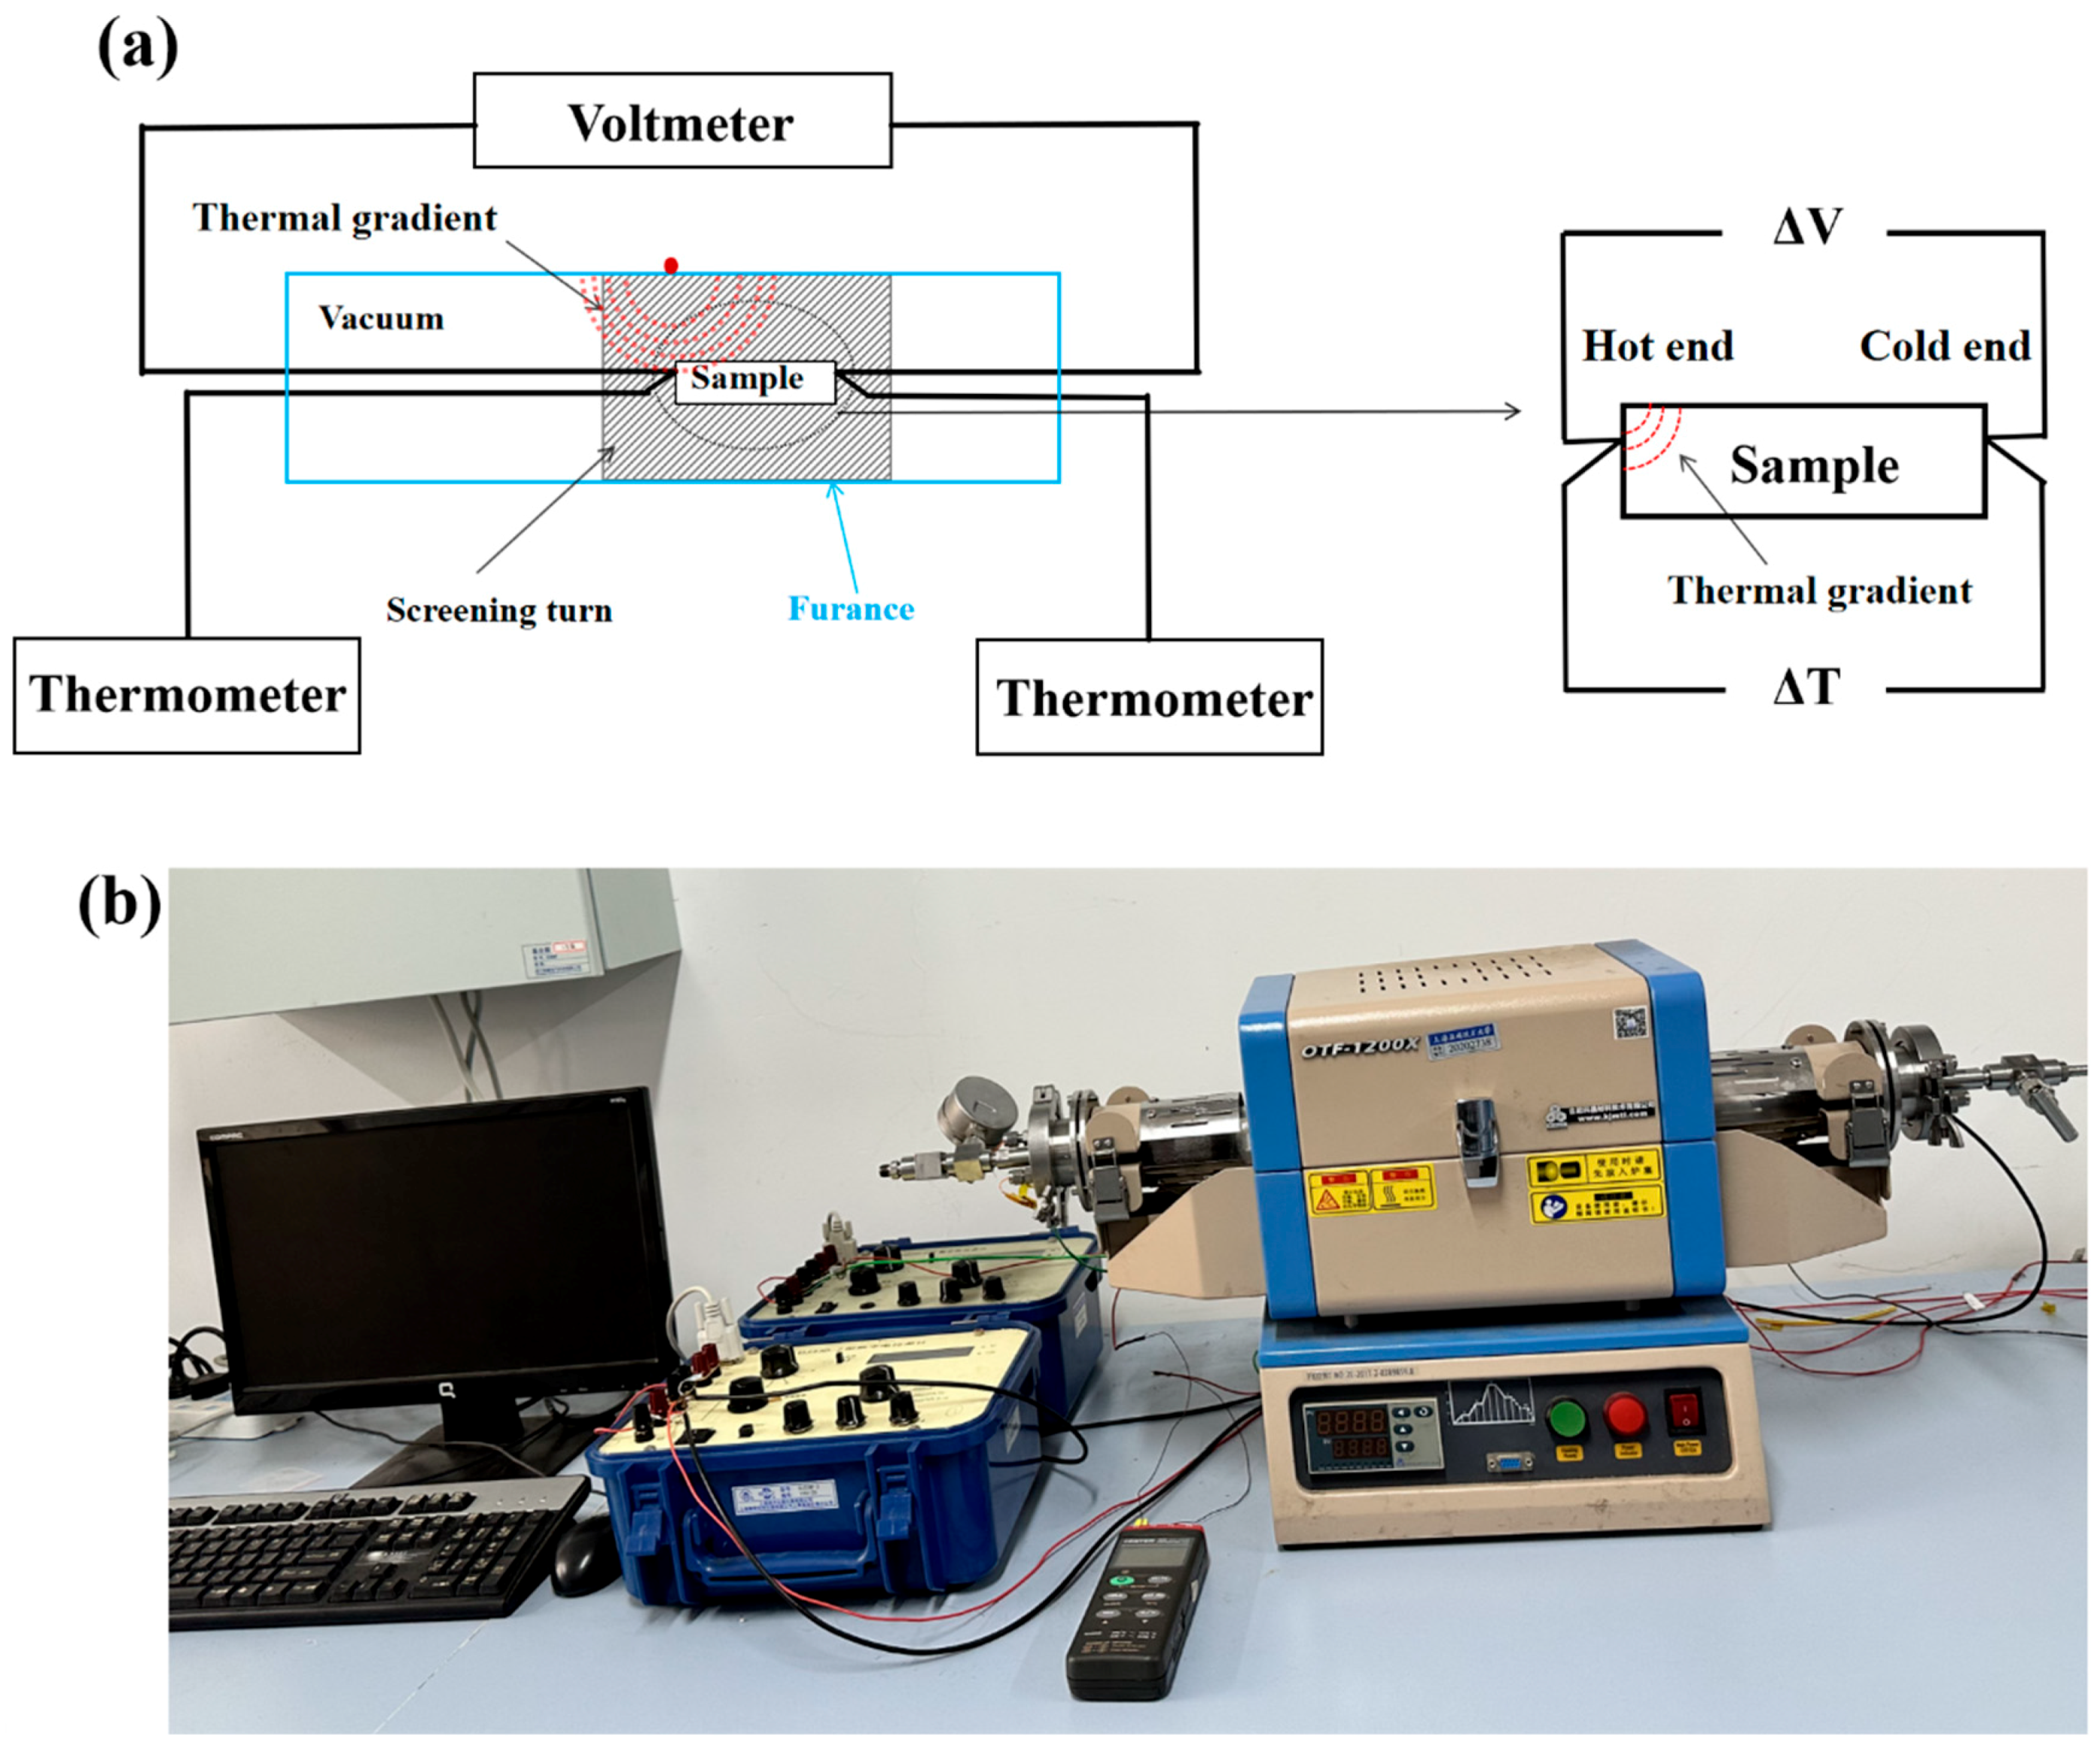
2.1. Principle of Thermovoltage Measurement

The principle underpinning thermovoltage measurement is rooted in the Seebeck effect. This phenomenon arises from a temperature difference ΔT either between two distinct materials or within the ends of a single material, causing an uneven distribution of electrons due to temperature disparity. As a result, a potential difference ΔV emerges at both ends of the material. The Seebeck coefficient S serves to quantify this effect and can be defined as follows:
s = V T
The Seebeck coefficient, symbolized as S, characterizes the material under examination, with ∆T representing the temperature difference and ∆V denoting the electric potential generated in response to this temperature variance. It is crucial to note that the Seebeck coefficient S, computed using Equation (1), is the relative Seebeck coefficient, reflecting the correlation between the material being analyzed and the electrode material [21]. To ascertain the absolute Seebeck coefficient of the material under investigation, Equation (2) must be employed.
s = s * s 0 * = V T
In this paper, S* is the absolute thermovoltage of the material under measurement, and S0* is the absolute thermovoltage of the electrode material. The specific thermovoltage of the copper electrode has been established [22].

2.2. Experimental Methods

Based on the Seebeck effect, this paper constructed an experimental device for in situ thermovoltage measurement. As depicted in Figure 1, two electrodes made of pure copper wires were welded at both ends of the sample being measured. Moreover, to mitigate signal interference, the electrodes were insulated and linked to a voltmeter (resolution of 1 × 10⁻⁶ V) via a small aperture for conducting measurement. To shield the sample from external interferences during potential difference signal acquisition, it was housed within a shielded wire grounded at one end. Two K-type thermocouples to be calibrated were employed, ensuring efficient thermal contact with the copper electrode solder joints at the sample ends. Temperatures at both ends were acquired using a thermometer with an accuracy of ±0.1 °C. During the heat treatment, a hot end and a cold end had a different temperature due to the uneven temperature field in the furnace; then, the temperature difference ΔT produced a potential difference ΔV in the circuit passing through the hot end and the cold end, as shown in Figure 1. The thermometer and voltmeter were connected to the computer for real-time data transmission and processing. Before initiating heat treatment experiments, the samples were situated in a vacuum tube furnace (OTF-1200X, Hefei Kejing Material Technology Co., Ltd., Hefei, China) and subjected to a vacuum pressure of less than 10 Pa using a two-stage rotary vane vacuum pump.
Throughout the phase transition-free cooling process, in situ thermovoltage measurements on single-phase austenitic/ferritic specimens with varying solid solution carbon contents were conducted, including pure iron, 45 steel, and T8 steel. Initially, these specimens underwent heating to 890 °C and a 20 min dwell period. They were then cooled to 790 °C at a rate of 0.02 °C/s before gradually returning to room temperature inside the furnace. Subsequently, in situ thermovoltage of the 45 steel specimens was performed at the continuous cooling. Specifically, the 45 steel specimen underwent heating to 890 °C, a 20 min hold, and subsequent cooling to 650 °C at a rate of 0.02 °C/s, followed by gradual cooling to room temperature within the furnace. For the selection of the 45 steel specimen, prior to cooling down to the identified phase transition temperature via in situ thermovoltage measurement, nitrogen was introduced into the vacuum tube furnace to achieve pressure equilibration with the external environment. Upon reaching the phase transition temperature, the specimen was rapidly extracted and quenched in order to validate the phase transition temperature.
The above quenching 45 steel samples were longitudinally cut, as depicted by the red line in Figure 2. Subsequently, the samples underwent standard metallographic polishing techniques and were etched using a 4% nitric acid alcohol solution. The microstructure of the longitudinal section was examined using both an optical microscope and a scanning electron microscope (SEM) (Sigma-300, Zeiss, Oberkochen, Germany). The carbon distribution across the cold and hot ends of the longitudinal section was determined using an electron probe microscope analyzer (EPMA-1720H, Shimadzu, Kyoto, Japan) with a voltage of 10 kV. Vickers hardness tests were conducted on the cold and hot ends of the specimens using a 420SXV micro Vickers hardness tester. Experimental standards followed metal materials Vickers hardness test methods [23]. The test load was 25 g, with a 5 s holding time. These two experimental results were averaged over multiple measurements at different positions.

3. Experimental Results and Discussion

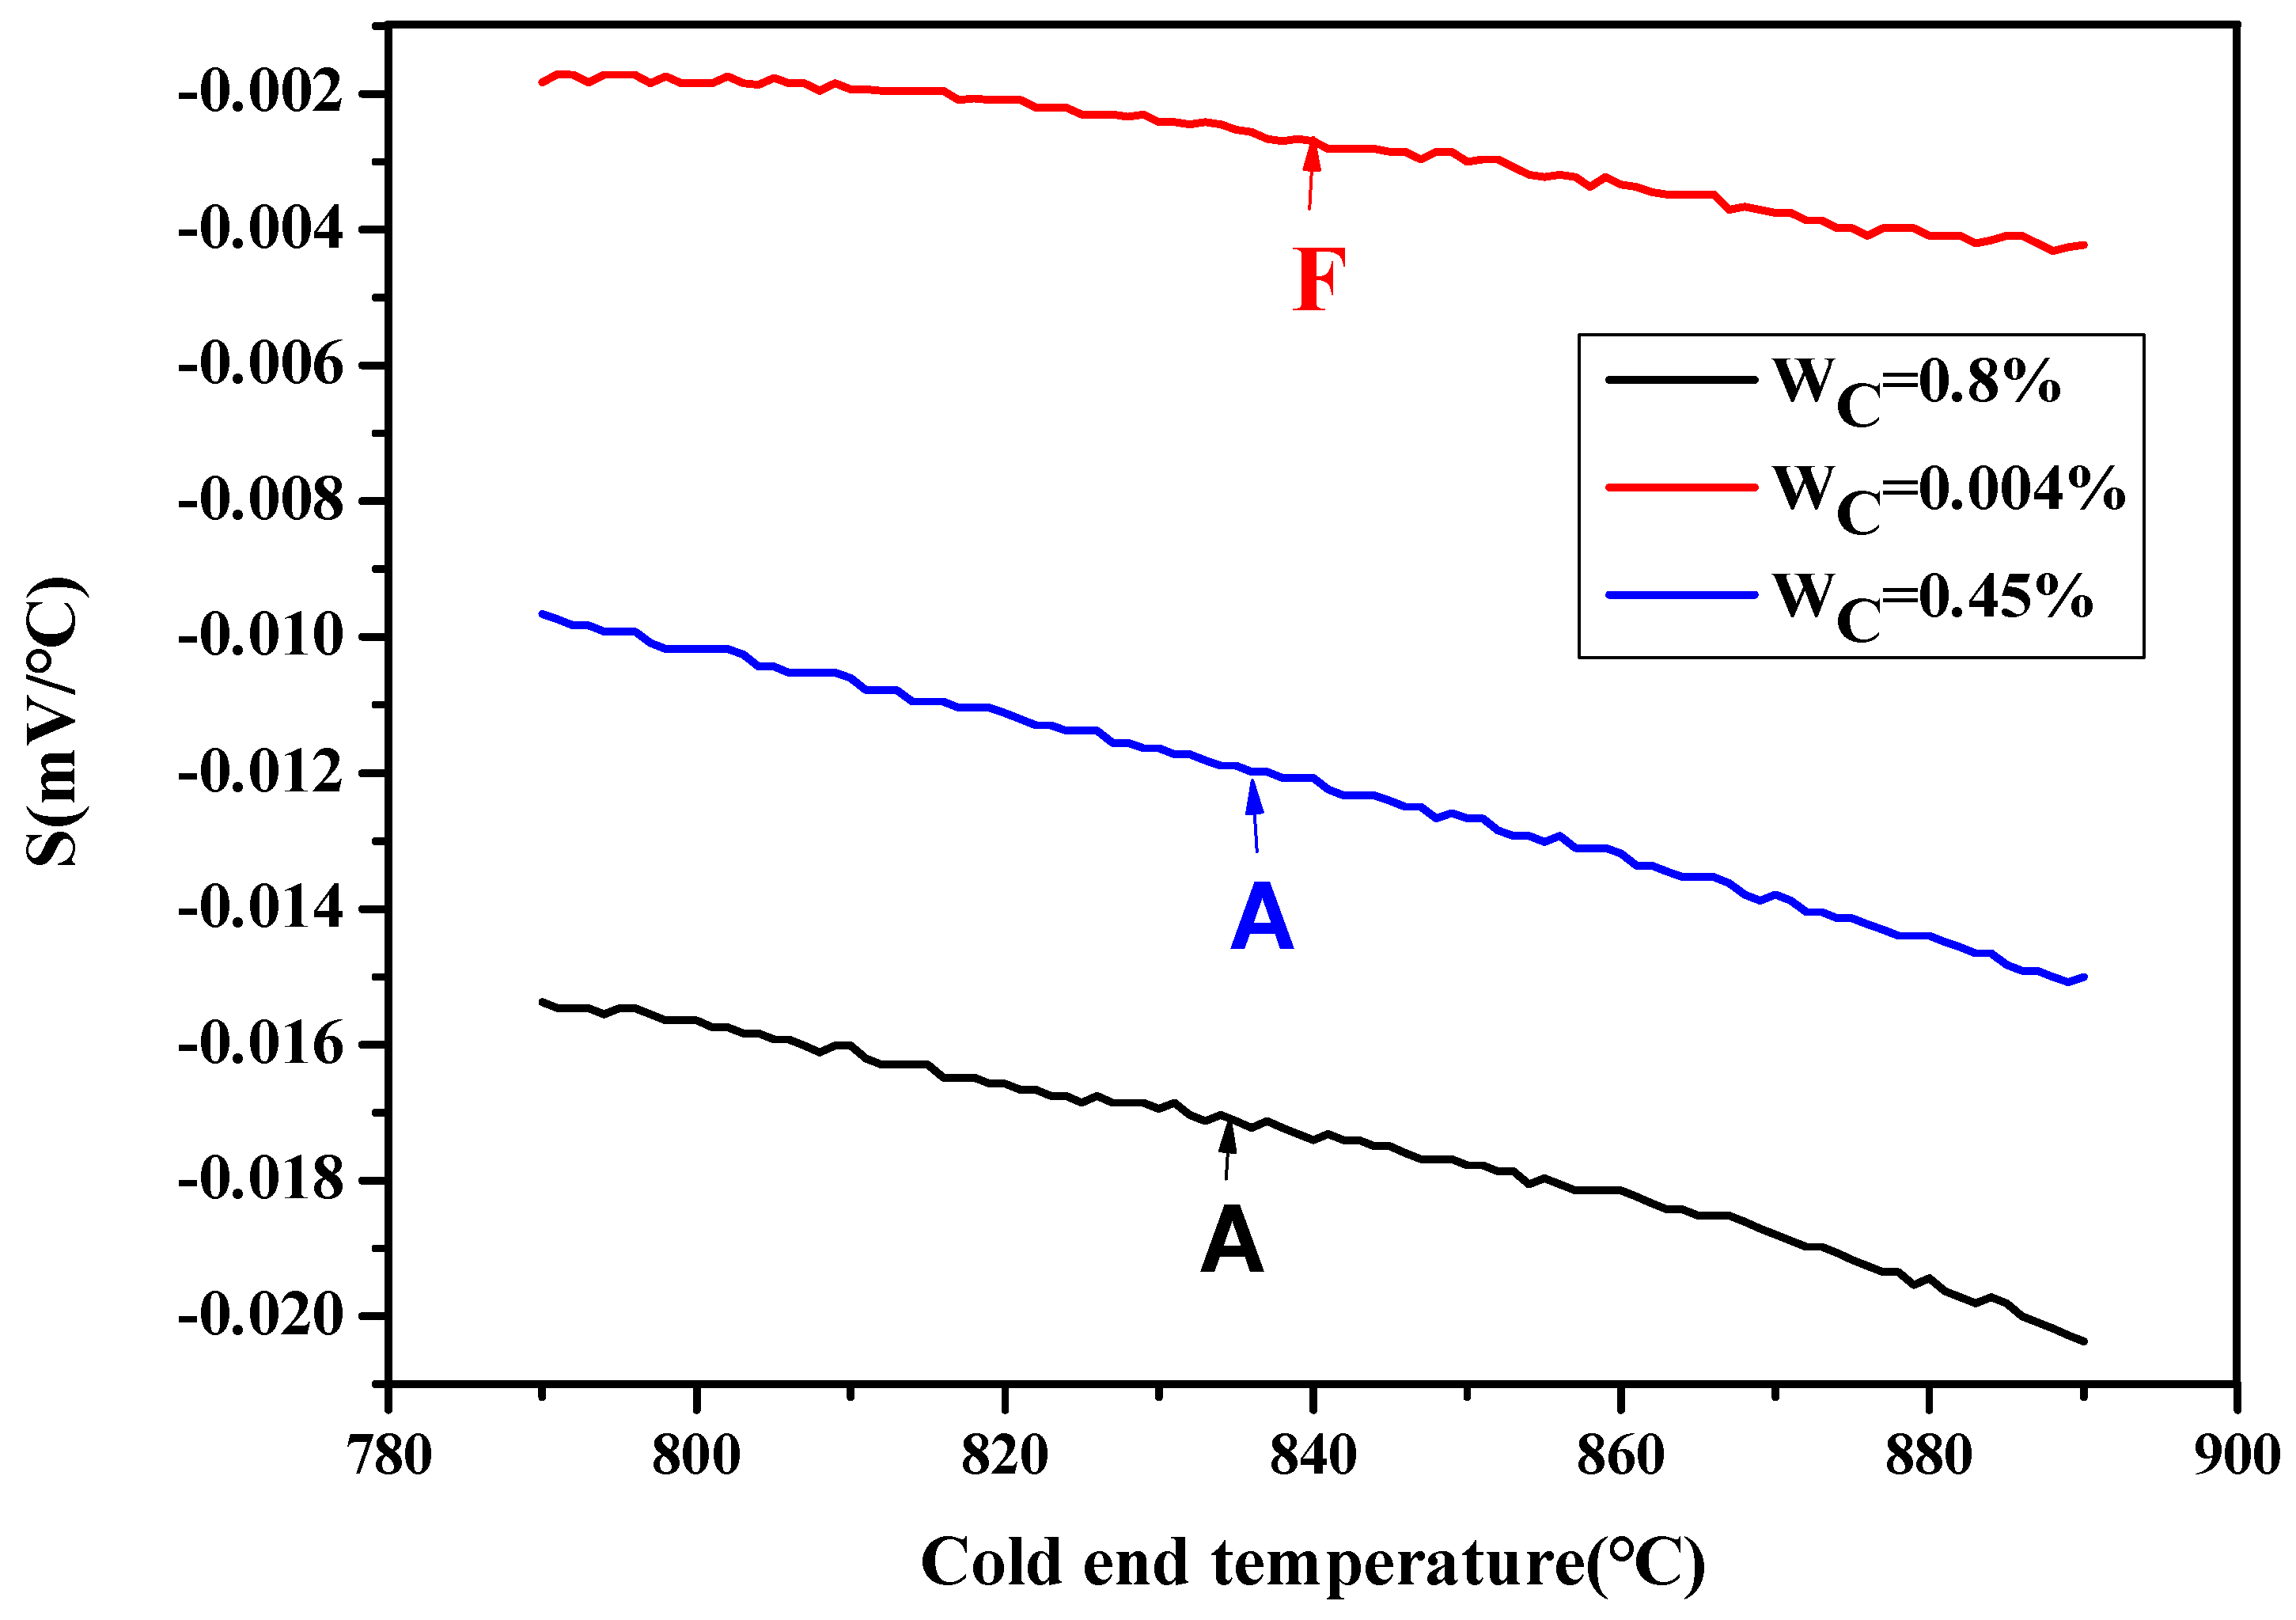
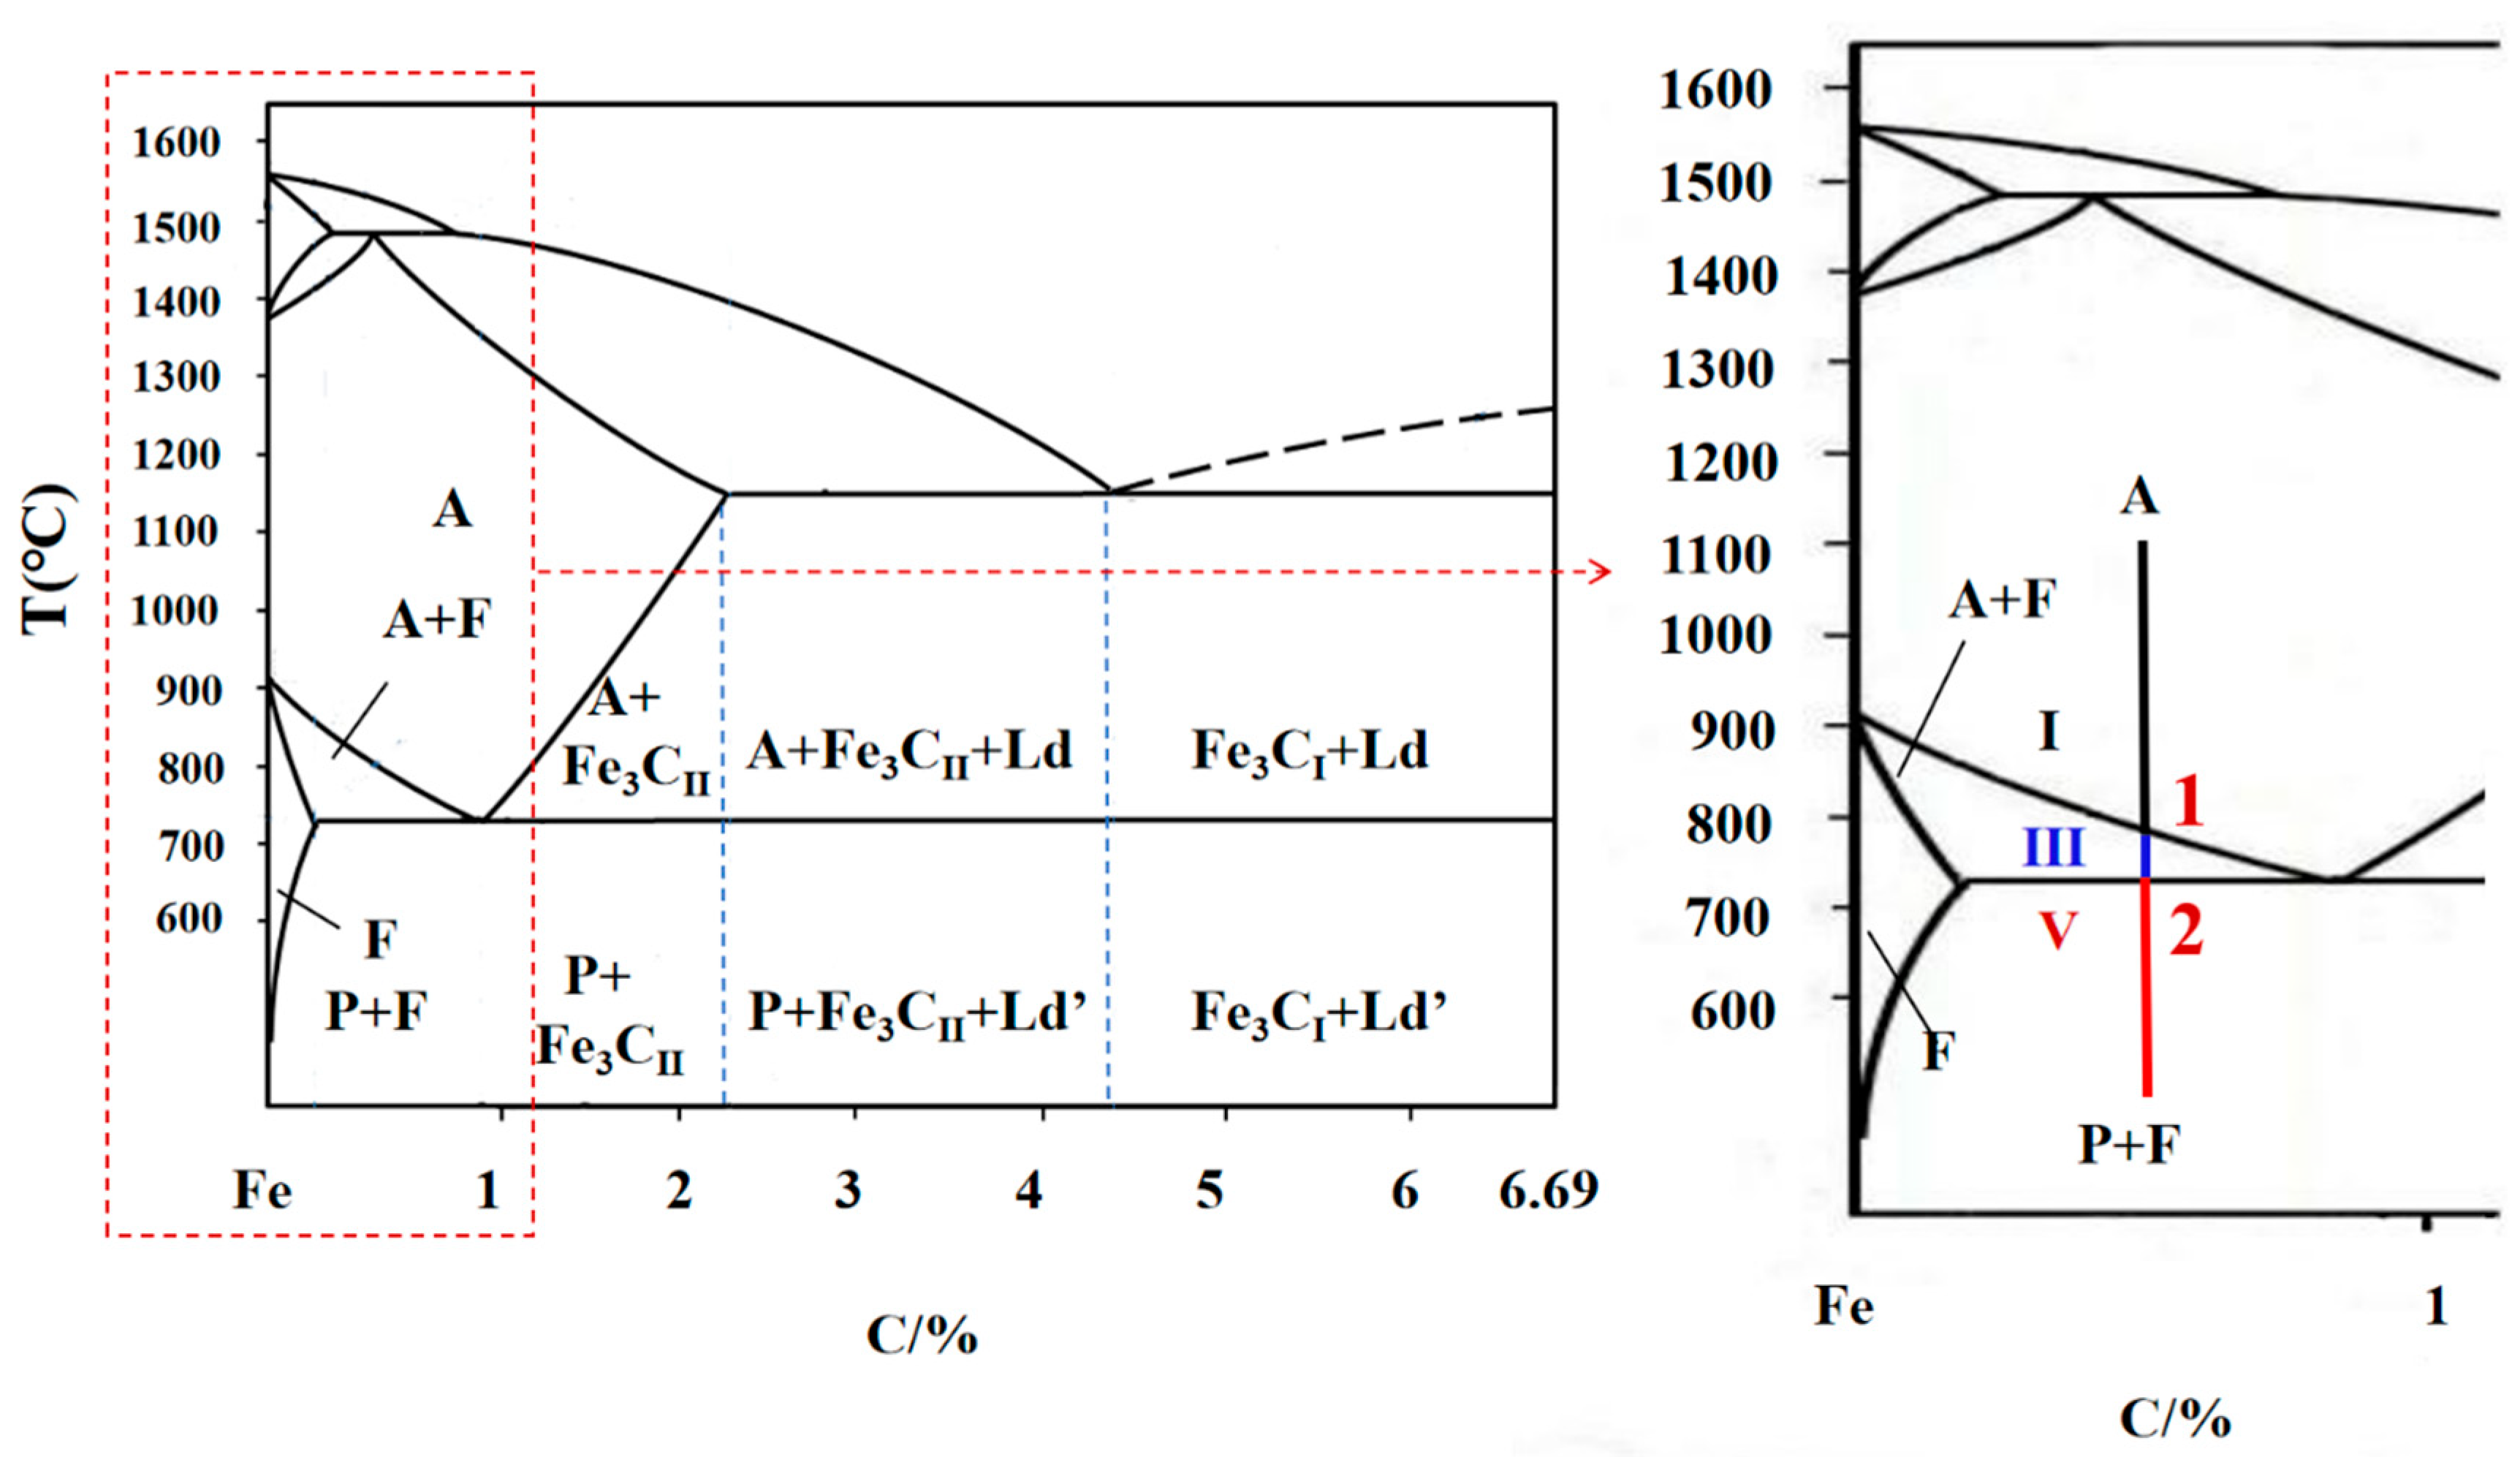
3.1. In Situ Thermovoltage Analysis of Single-Phase Austenite/Ferrite with Different Solid Solution Carbon Contents during Cooling without Transformation

In this section, T8 steel and pure iron were chosen as the specimens for the study of single-phase austenite and ferrite, respectively. The in situ thermovoltage curve of single-phase austenite/ferrite, recorded during cooling without transformation, is illustrated in Figure 3. As observed, the thermovoltage curve is continuous and smooth without inflection, but the thermovoltage values are different for specimens with different solid solution carbon contents. After comparative analysis, it was found that specimens with elevated solid solution carbon content exhibit lower thermovoltage values.
The above results are consistent with the conclusions reported in refs. [24,25,26,27,28]. Sherby et al. [24,25] described martensite formation in quenched steel slats based on the Engel–Brewer electron theory, and they noted that solid-solution carbon in austenite exists in an electrically ionized state, contributing four valence electrons, whereas in ferrite, carbon exists as zero-valence carbon atoms. Caballero et al. [26] studied the thermoelectric properties of martensitic stainless steels, and they noted a decrease in thermovoltage as the carbon content of the austenite increased. Dayal and Darken [27] investigated the effect of direct current on carbon migration in steels, and they determined the average charge of carbon ions in austenitic ranged from +3.5 to +3.7. Additionally, Morinaga et al. [28] affirmed that interstitial carbon carries a positive charge. Therefore, the number of free electrons increases with the increase of solid solution carbon in austenite. Furthermore, according to the principle of thermovoltage measurement, the thermovoltage in metals is caused by the thermal excitation of their free electrons.
According to the Engel–Brewer electronic theory, the electronic structure of atoms varies depending on different crystal structures [29]. In the temperature range of 790~890 °C, single-phase ferrite containing approximately 0% carbon adopts a bcc structure, while single-phase austenite containing 0.45% and 0.8% carbon adopts an fcc structure. Consequently, the difference in thermovoltage between single-phase ferrite and single-phase austenite is pronounced due to the carbon content difference and the crystal structure difference, resulting in a significant disparity in thermovoltage between the two phases.
In summary, the phase transition of carbon steel induced by variations in solid solution carbon content triggers a shift in crystal structure and a corresponding alteration in the electronic state. This phenomenon manifests as inflection points on the thermovoltage curve.

3.2. In Situ Thermovoltage Analyses during Continuous Cooling of 45 Steel

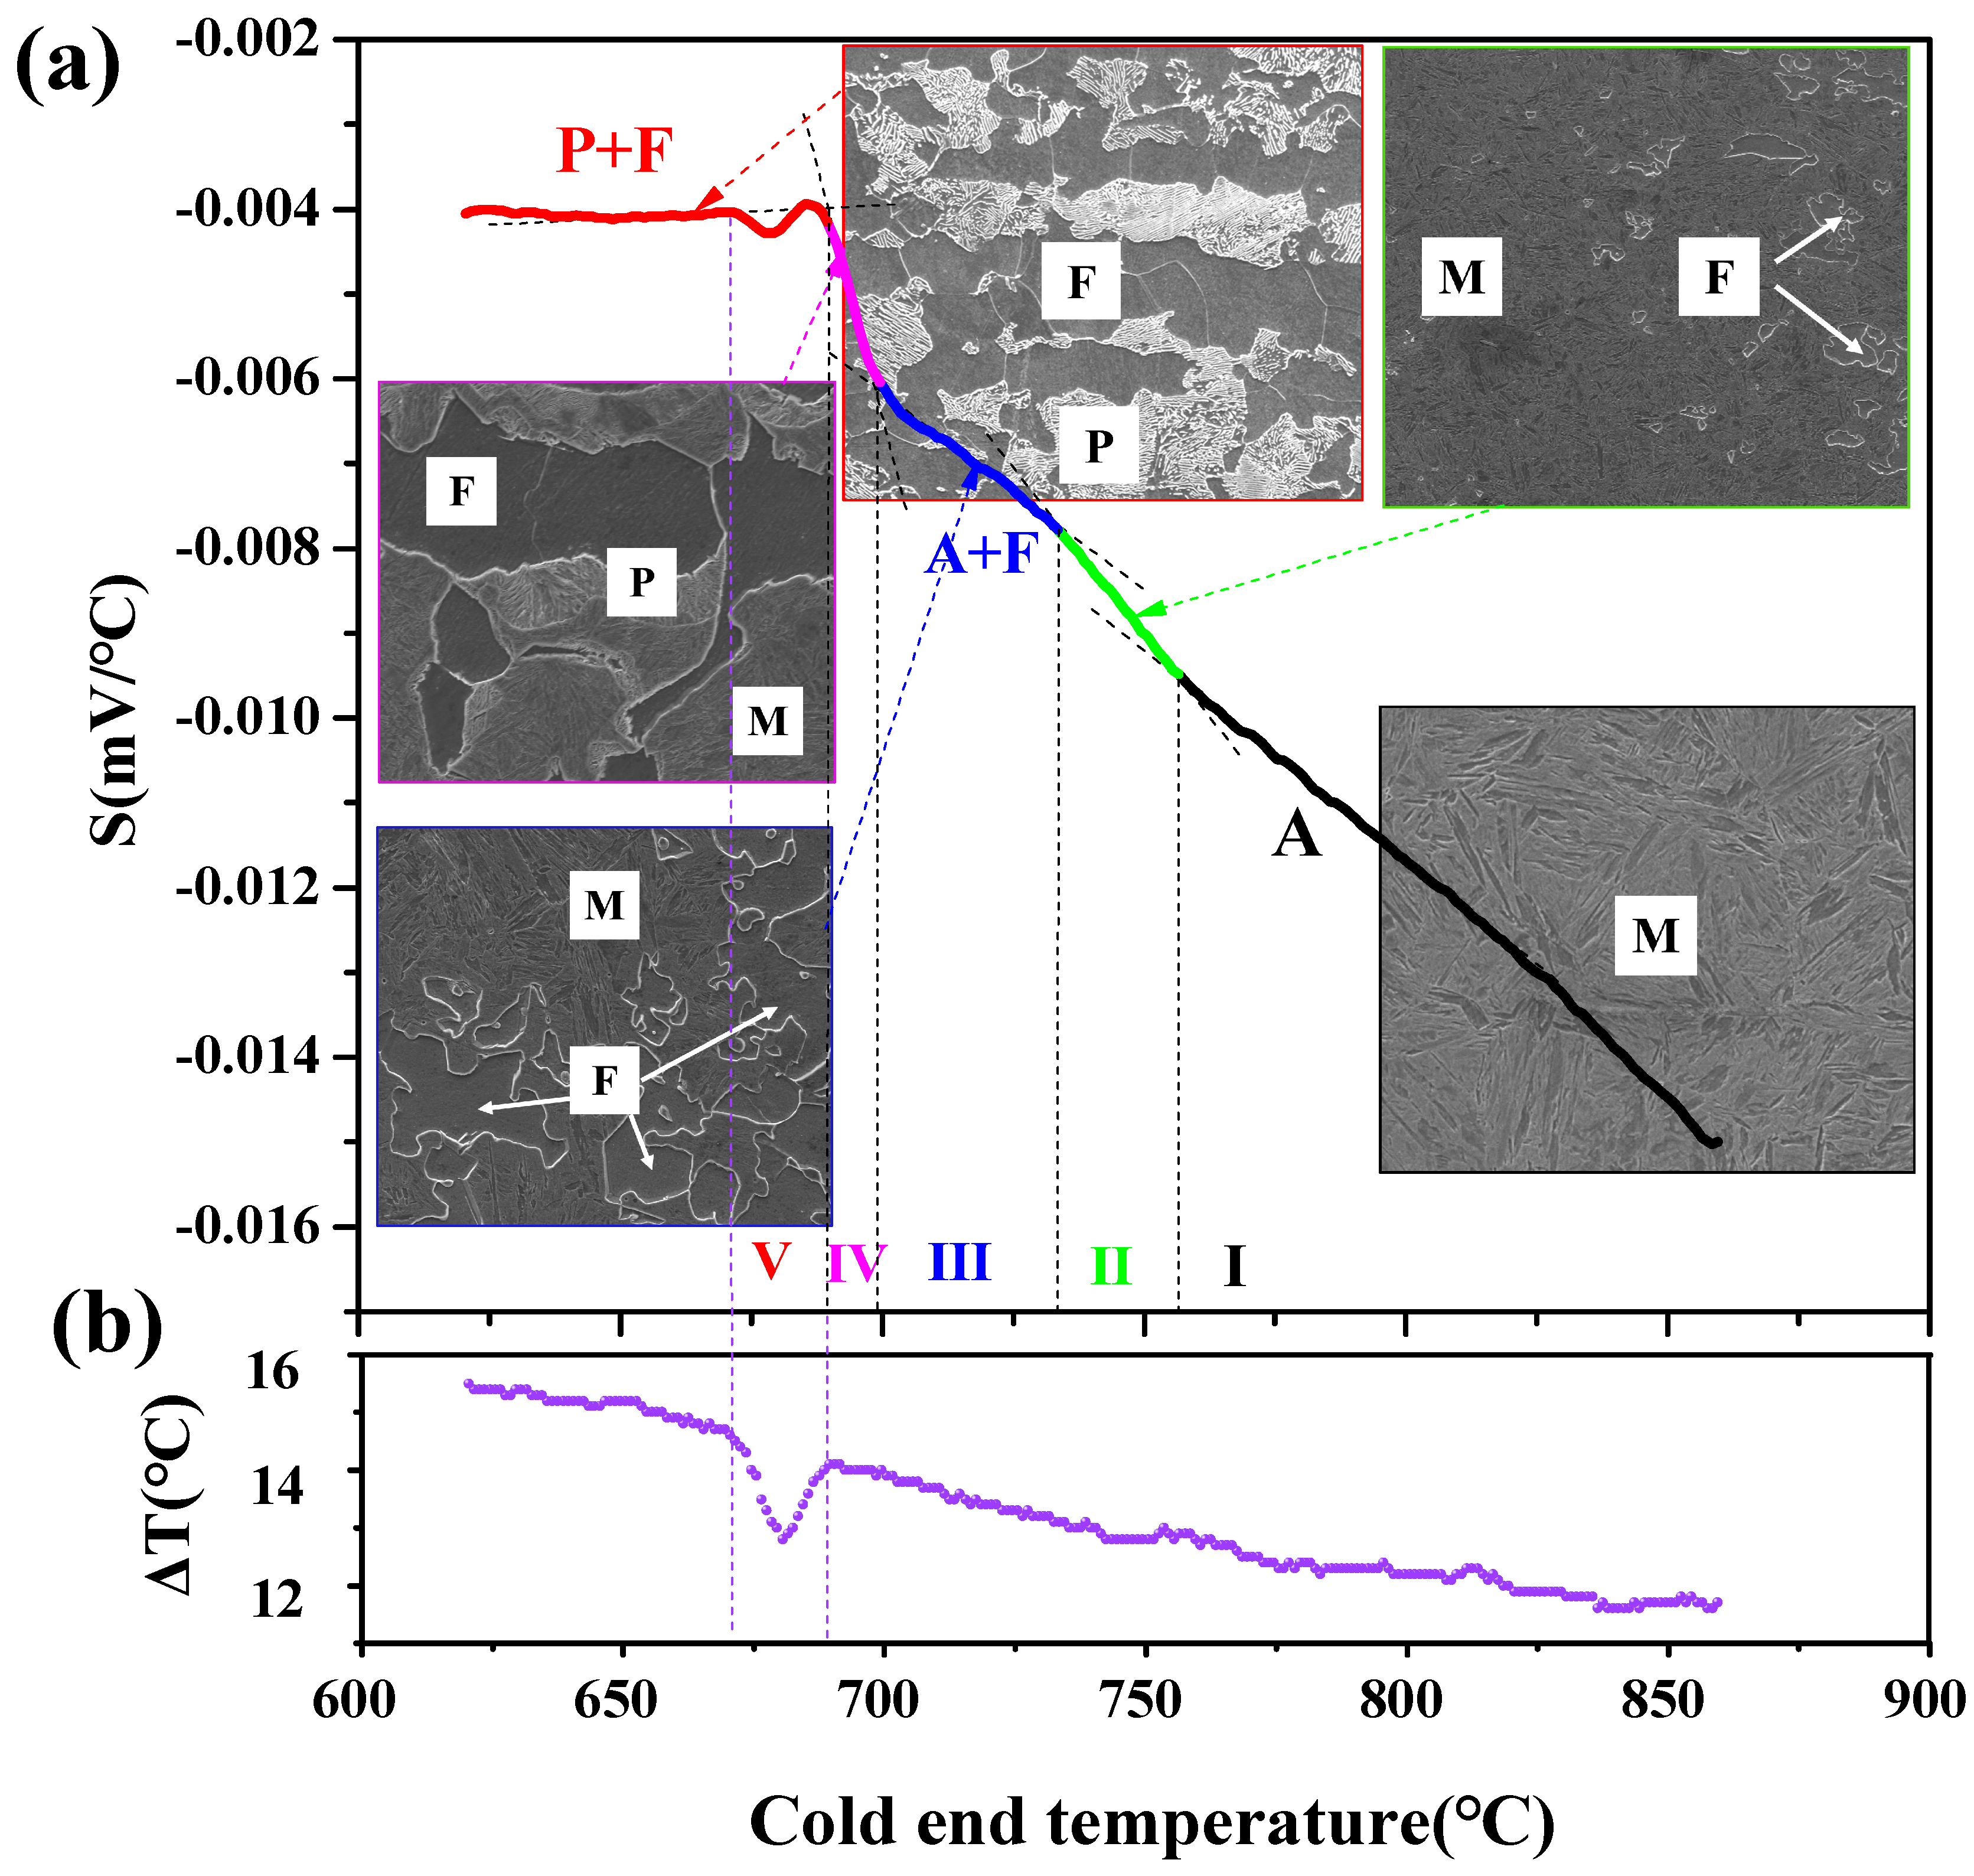
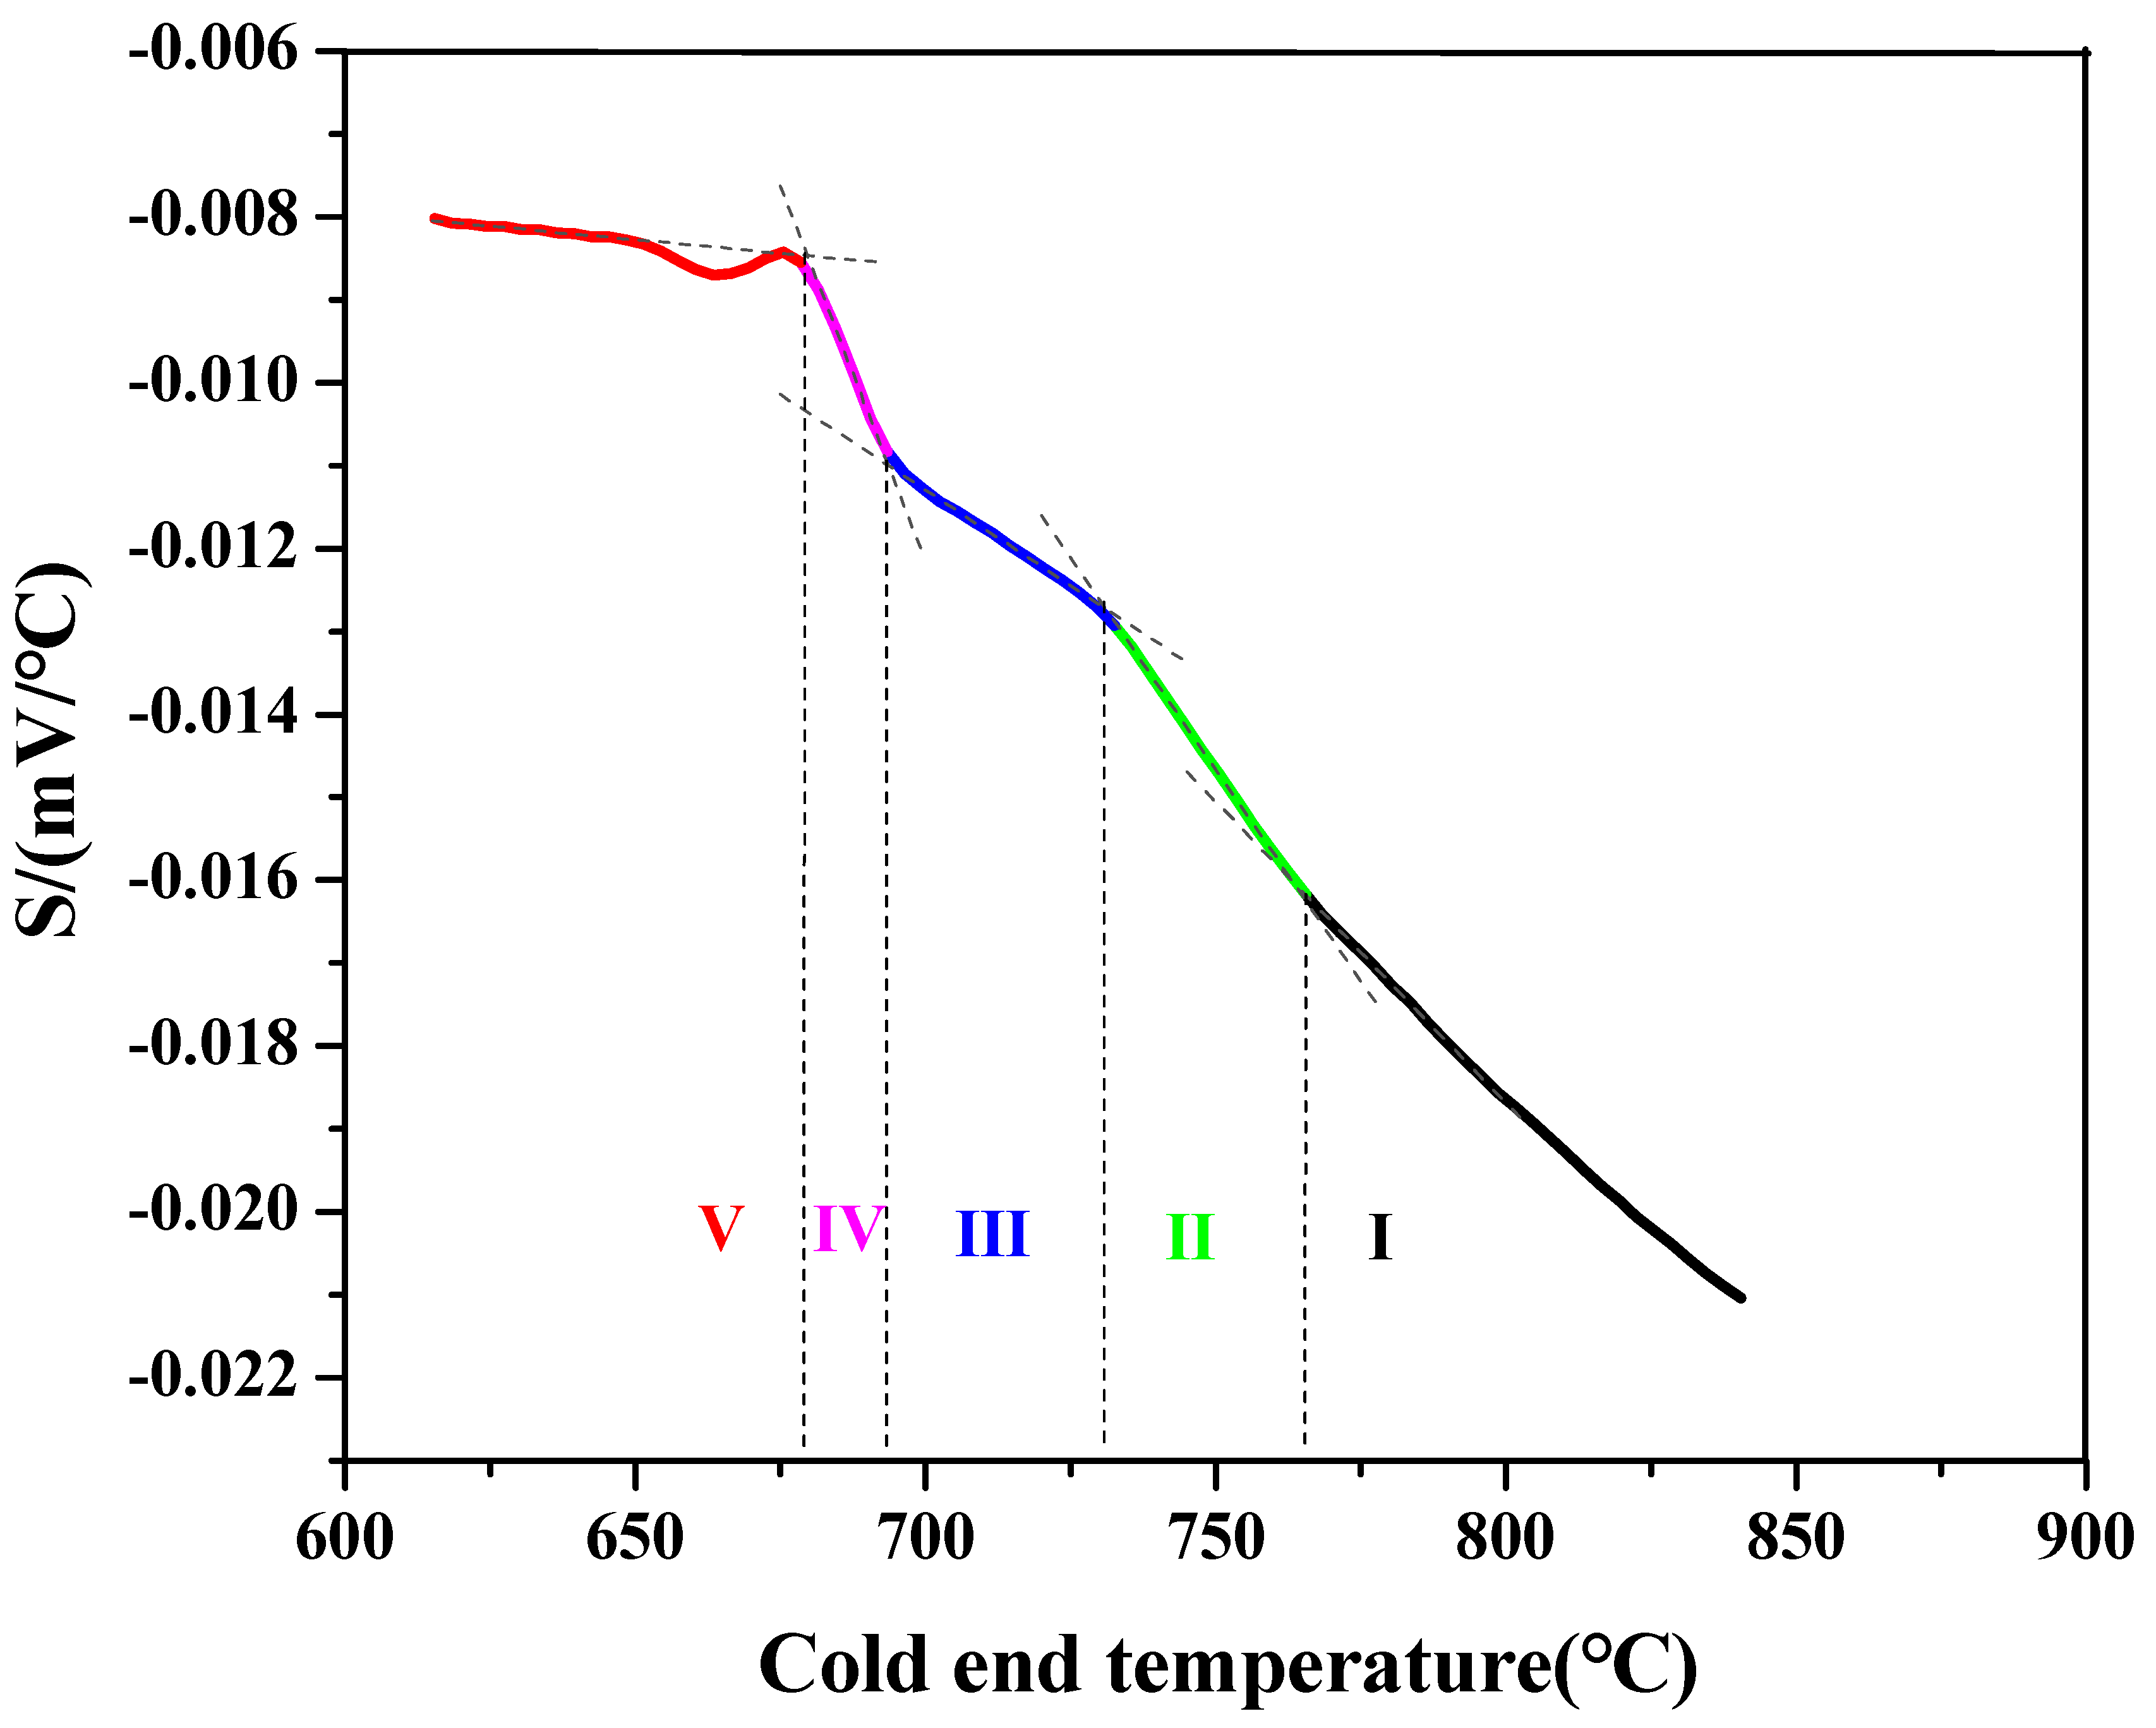
3.2.1. In Situ Thermovoltage Curve and Analyses

The in situ thermovoltage–temperature curve of 45 steel, recorded during continuous cooling at 0.02 °C/s, is illustrated in Figure 4a. This curve was interpreted in conjunction with the Fe-Fe3C phase diagram and the temperature difference curve between the cold and hot ends, which was segmented into zones Ι–V, and the boundary of each phase zone was determined using the extrapolated tangent method. As austenite (A) only exists at high temperatures, it will transform to martensite (M) after quenching, denoted as M in Figure 4a.
(1)
In situ thermovoltage curves and analysis during continuous cooling at 0.02 °C/s
Under the specified experimental conditions, the temperature difference between the hot and cold ends of the specimen remained below 16 °C. Given that the range for the two-phase region on the phase diagram spanned 40–50 °C, it is plausible for both the hot and cold ends of the specimen to concurrently reside within the two-phase region. Furthermore, phase transitions typically introduce distinct inflection points in the thermovoltage curves, manifesting as discontinuities in the first-order derivatives of these curves. Hence, in Figure 4a, the temperature range above 756 °C, identified as Zone I, is indicative of single-phase A across the entire specimen. Conversely, the temperature range below 689 °C, denoted as Zone V, suggests that the specimen is entirely within the (P+F) homogenous phase. Additionally, the temperature ranging from 734 °C to 699 °C corresponds to the (A+F) two-phase voltage, as concluded in Figure 5. Visual differentiation of the three homogenous phase zones thermovoltage curves in Figure 4a is achieved through the use of distinct colors. Specifically, the thermovoltage in the (P+F) region is approximately zero, as represented by a red line, reflecting the predominance of ferrite and minimal influence of cementite. In contrast, the single-phase A region exhibits a negative thermovoltage value, as indicated by a black line, which is attributed to the ionic state of solid-solution carbon in austenite. For the (A+F) region, the thermovoltage value falls between those of A and F, as illustrated with a blue line.
Considering that the specimen possesses a specific length, which establishes a temperature difference between the hot and cold ends not exceeding 16 °C, the other two segments correspond to thermovoltage across the phase regions, which is represented by Zone II and Zone IV in Figure 4a. The detailed analysis of these zones, combined with the Fe-Fe3C phase diagram, will be addressed comprehensively in the subsequent section.
Additionally, Figure 4a clearly illustrates that as the temperature decreases to 690 °C, the thermovoltage curve in zone V exhibits a pronounced downward concavity. This phenomenon can be further understood by analyzing the temperature difference curve between the cold and hot ends, as shown in Figure 4b. At approximately 690 °C, this curve also shows a notable downward concavity, indicative of a reduction in the temperature difference between the two ends. According to the Fe-Fe3C phase diagram, this phenomenon arises from the specimen undergoing (A-P) transformation, releasing the latent heat of phase transition. This release of heat effectively reduces the temperature differential between the hot and cold ends. As a result, there is a corresponding decrease in the thermovoltage, manifesting as the observed concavity in the curve. Therefore, when discussing the characteristics of zone V in the thermovoltage curve, it is advisable to disregard the concavity.
(2)
Further discussion of the thermovoltage curve in the phase transition region
This section thoroughly discusses phase transition zones II and IV for the above continuous cooling process of 45 steel.
Given that the specimen possesses a specific length, which results in a temperature difference, analysis of Figure 5 reveals significant insights. As the specimen cools to the critical temperatures indicated at points 1 and 2, sequential phase transitions occur at the cold end—(A-F) and, subsequently, A-P. However, the hot end remains in the homogeneous A and, subsequently, (A+F). At this time, thermovoltage measurements across these phase regions were conducted. Therefore, the thermovoltage curve showed distinct inflections, as observed in Zone II and Zone IV of Figure 4a.
By building upon the previous discussion, it is observed that the thermovoltage curves corresponding to the three homogeneous phase zones represented by continuous curves without deflection exhibited distinct thermovoltage values. Therefore, these three homogeneous phase zones must be interconnected via the phase transition zones, namely Zones II and IV, to achieve continuity. This differentiation underscores the necessity for these homogeneous phase zones to be interconnected via the phase transition zones, namely Zones II and IV. At these junctions, a notable inflection in the thermovoltage curve occurs, marking the phase transition temperatures. In Figure 4a, the inflection points between Zones I and II and between Zones III and IV correspond to the phase transition temperatures of 756 °C and 699 °C, respectively.
Further analysis reveals that the upward deflection is more pronounced in zone IV compared with zone II. This difference can be attributed to the fact that (A-P) transformation is accompanied by a larger amount of ferrite precipitation, whereas (A-F) transformation involves a smaller amount of ferrite precipitation.
In summary, the in situ thermovoltage measurement technique has proven effective in accurately characterizing the phase transition of 45 steel during continuous cooling. It provides quantitative insights into the formation and transition of phases, as well as the phase transition process and temperature of the material.

3.2.2. Comparative Analysis of In Situ Thermovoltage Curves at Different Cooling Rates

Figure 6 shows the in situ thermovoltage–temperature curve of 45 steel continuously cooled from 890 °C to 650 °C at a cooling rate of 0.05 °C/s under vacuum conditions.
A comparison of Figure 4a reveals that the change patterns of the thermovoltage–temperature curves under the two cooling rates remain consistent, with the entire curve divided into five phase zones. However, the widths of the phase transition zones under the two cooling rates vary. The specific results of the comparative analysis are presented in Table 2, where the widths of the phase transition zones II and IV are represented by their corresponding temperature changes.
As observed in the table, the width of zone II corresponding to (A-F) transformation was larger, while the width of zone IV representing (A-P) transformation wasis smaller. This disparity stems from the nature of these transitions, which are diffusive phase transitions. The width of zones II and IV precisely delineates the progression of these two transformations, respectively. The (A-F) transformation, involving carbon diffusion over longer distances, presents greater difficulty, hence resulting in a significantly wider zone II compared with zone IV. With an increase in cooling rate, (A-F) transformation becomes even more challenging due to reduced diffusion time at higher temperatures. Conversely, (A-P) transformation, where carbon diffusion is relatively easier, is less affected by the cooling rate, leading to minimal change in zone IV width. Consequently, the width ratio of zone II to zone IV increases as the cooling rate rises. These findings highlight how in situ thermovoltage curves elucidate the phase transition process and the influence of the cooling rate on this process.

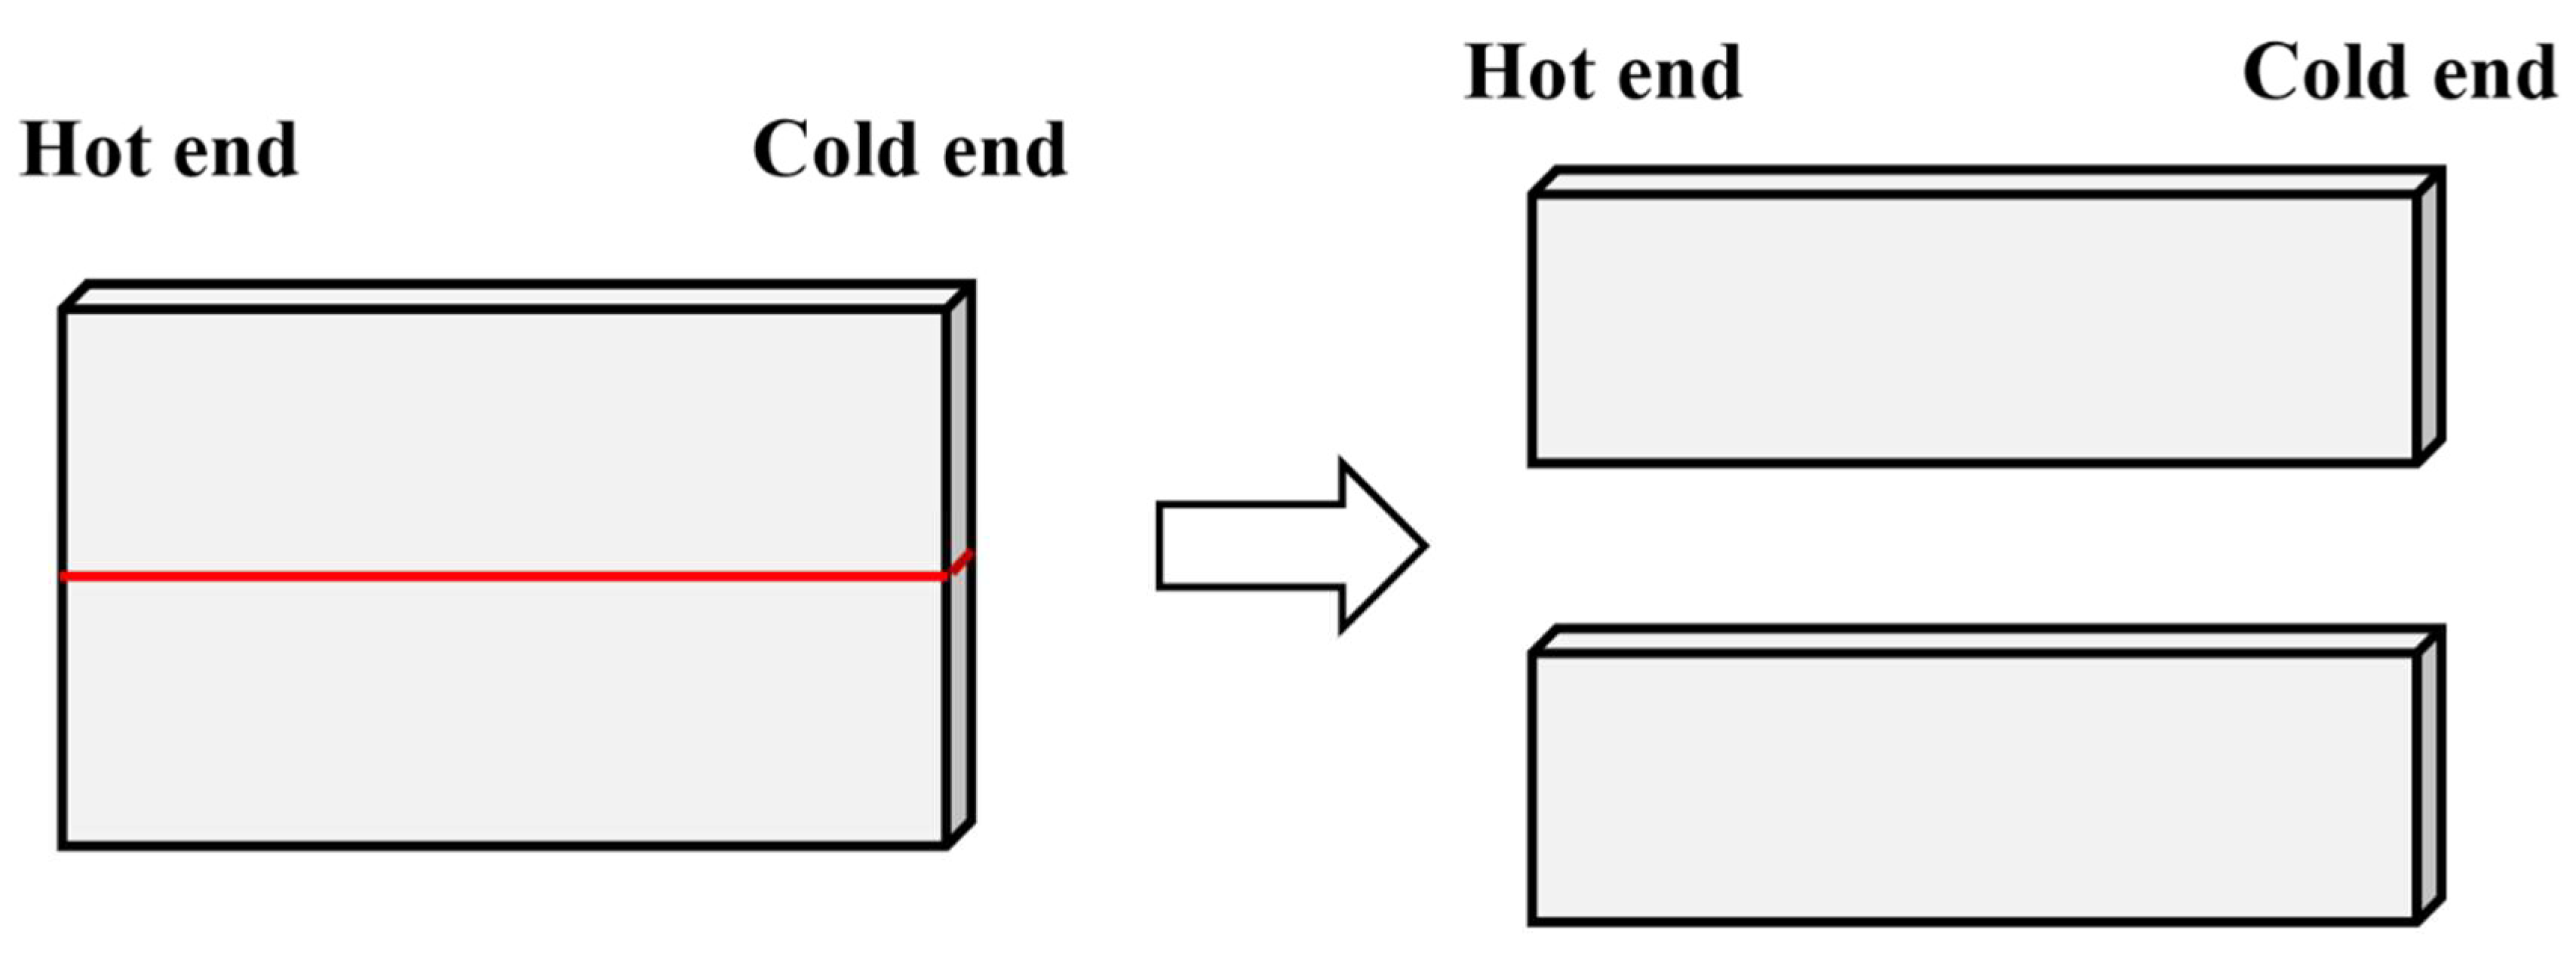
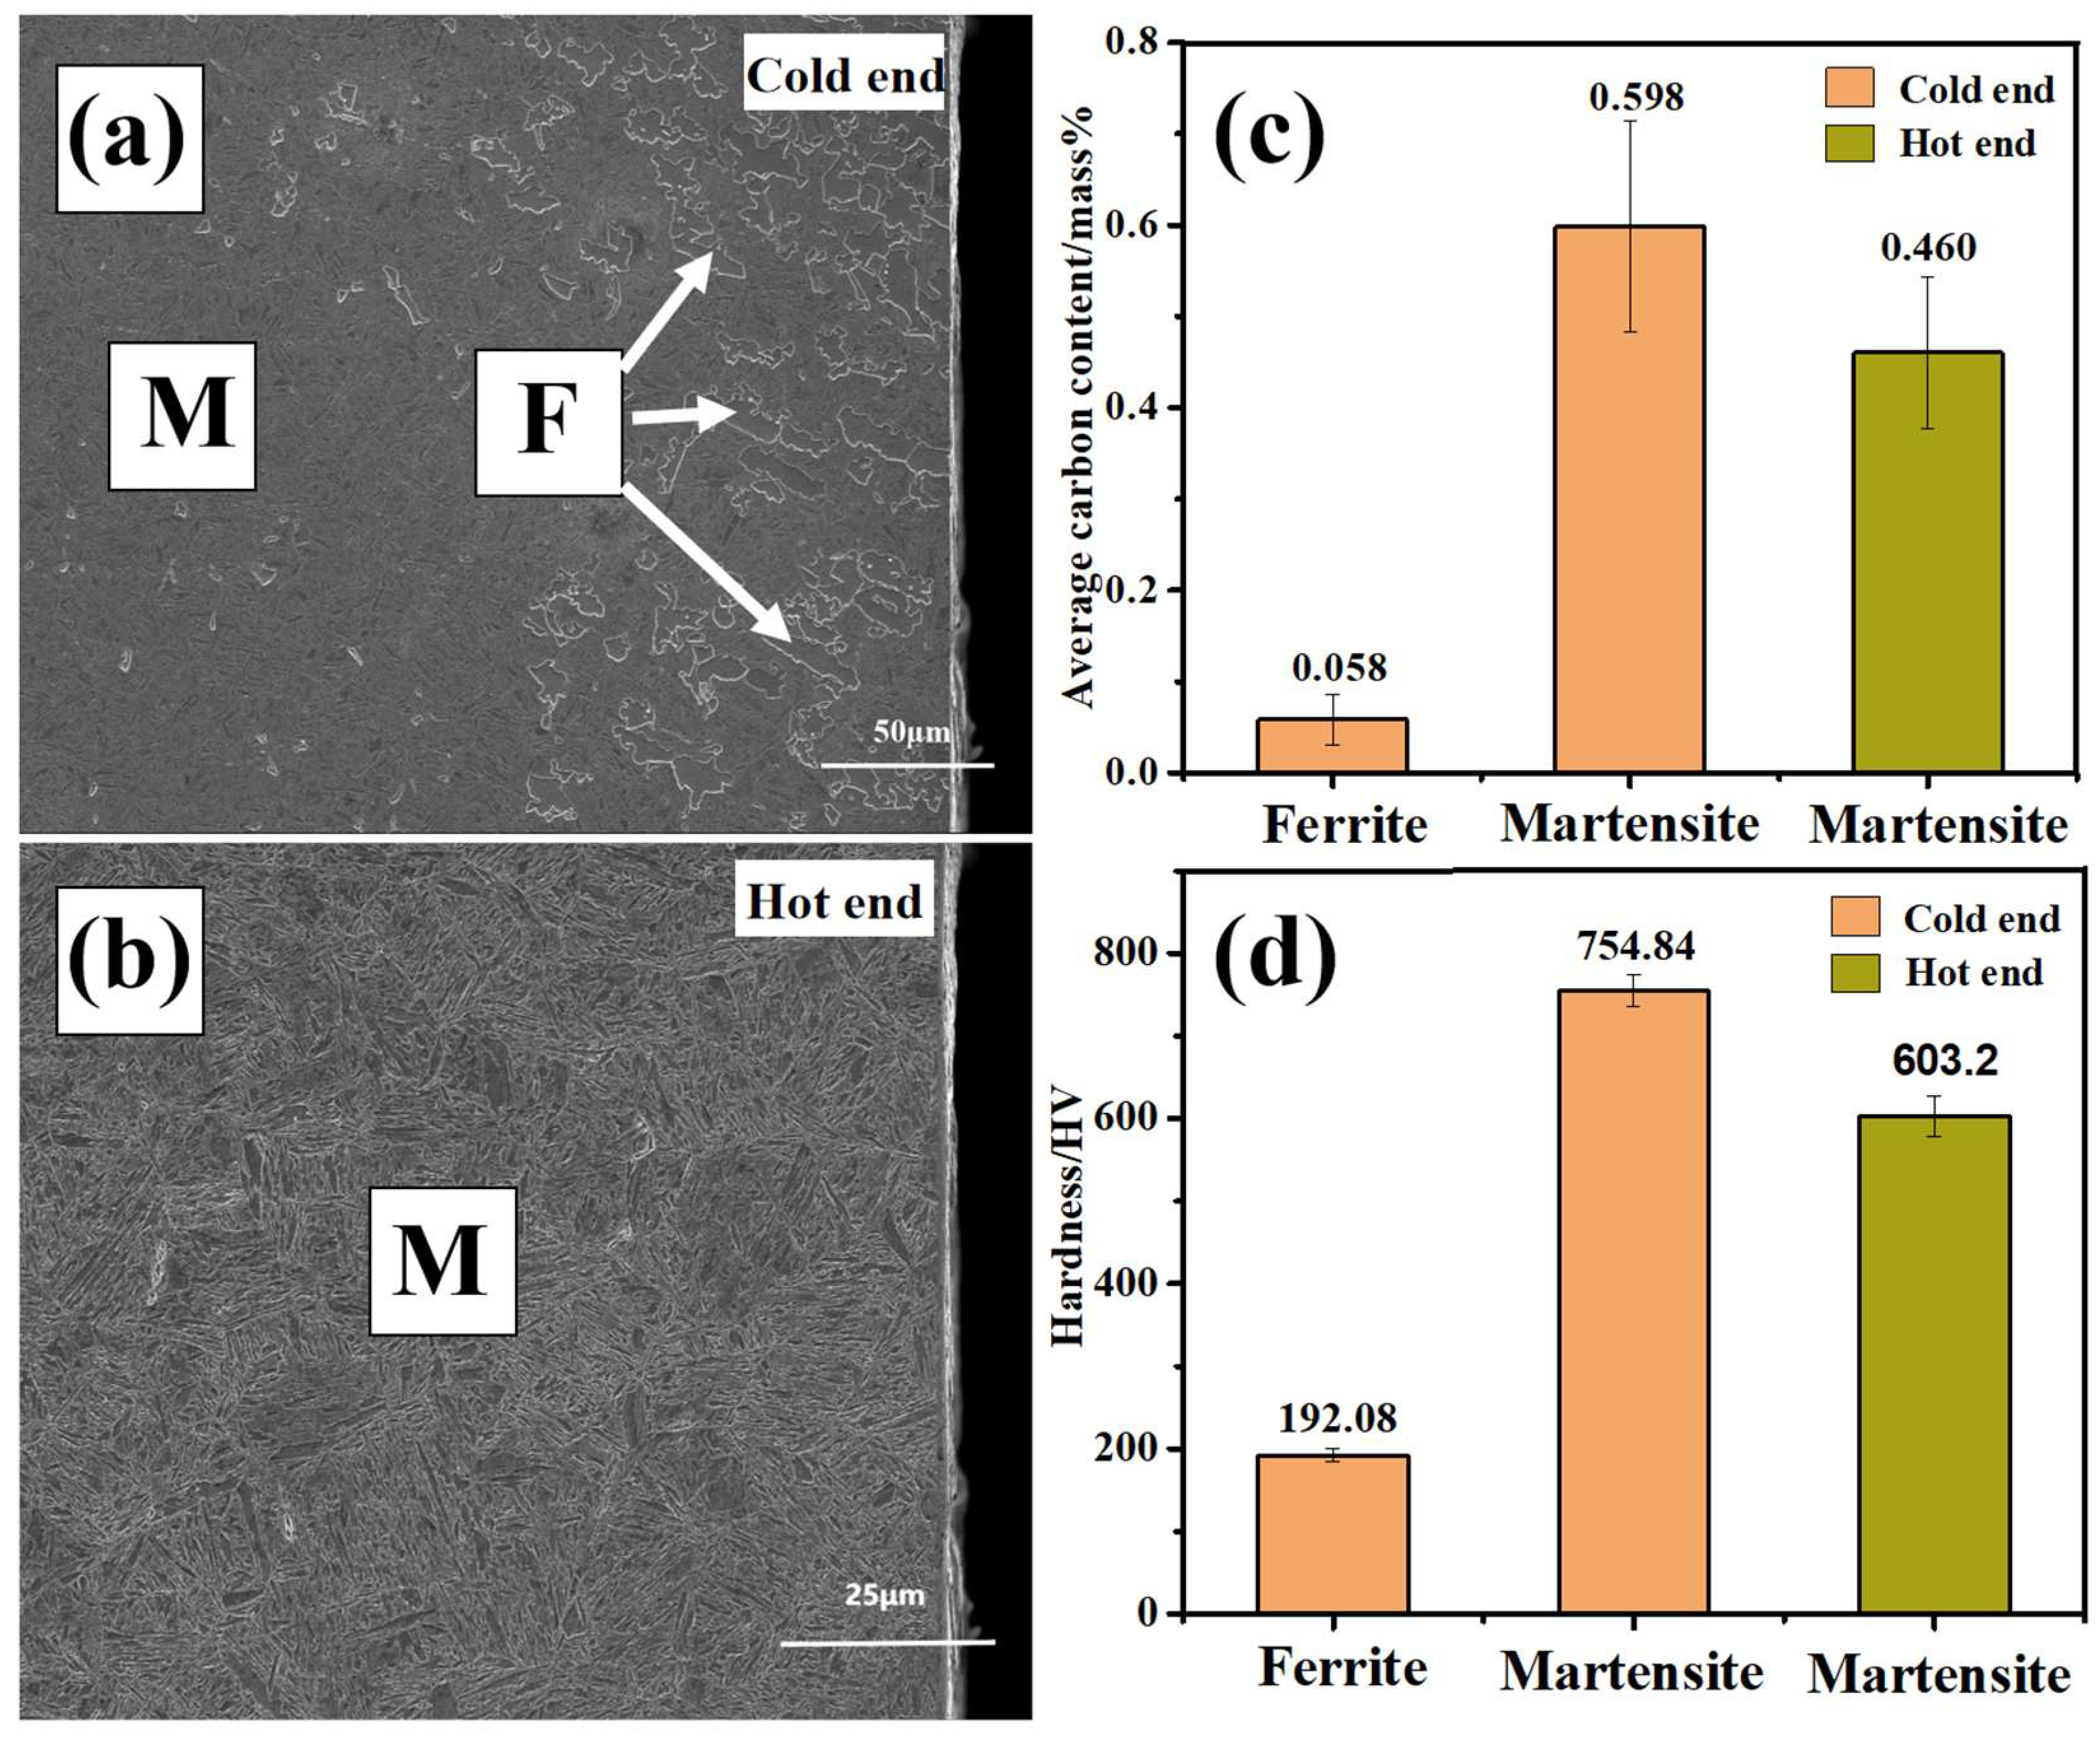
3.3. Analysis of Results of Quenching Experiments at Phase Transition Temperature

Based on the phase transition temperature obtained above, quenching experiments were designed, followed by microstructure observation, EPMA characterization of carbon content (shown in Figure 7c), and microhardness measurements to experimentally validate the phase transition temperature measured by in situ thermovoltage measurement. The results of these experiments are depicted in Figure 7.
As shown in Figure 7a,b, quenching at the phase transition temperature (756 °C) halts the phase transition process of ferrite. At this juncture, the cold end precipitates ferrite as it reaches the phase transformation temperature first, resulting in martensite and ferrite (M+F) after quenching. Meanwhile, the hot end retains austenite, yielding martensite after quenching.
As illustrated in Figure 7c,d, the carbon content of ferrite precipitated at the cold end of 45 steel measured 0.058%, while its neighboring martensite registered a higher carbon content of 0.598%, surpassing the average carbon content of the 45 steel samples. Conversely, the martensite at the hot end exhibited a carbon content of 0.46%. Consequently, the microhardness value of the martensite at the cold end exceeds that at the hot end. This discrepancy arises from the precipitation of ferrite at the cold end, leading to an increase in the carbon content in its neighboring austenite. In contrast, the carbon content of the austenite at the hot end aligns closely with the average carbon content of 45 steel.
The aforementioned series of experimental results unveiled that ferrite initially precipitated from the cold end at the phase transition temperature of 756 °C, resulting in an augmentation of the solid-solution carbon content in its neighboring austenite. Subsequently, as the temperature decreased, ferrite continued to precipitate from the cold end toward the hot end. This microscopic elucidation corroborates the deflection of zone II in the thermovoltage curve at the critical temperature of 756°C and underscores the presence of a certain width in phase transition zone II. These findings underscore the efficacy of the in situ thermovoltage measurement technique in accurately characterizing phase transitions in the heat treatment process of materials.

4. Conclusions

This paper presented an investigation into the in situ thermovoltage of single-phase austenite/ferrite specimens with varying solid-solution carbon contents during phase-transition-free cooling and continuous cooling of 45 steel, applying a self-designed and enhanced measuring device. The obtained data were partitionally discussed and interpreted based on the Engel–Brewer electron theory and Fe-Fe3C phase diagram. The results show that phase transitions triggered by changes in solid solution carbon content correspond to inflections in the thermovoltage curve and that the inflection point corresponds to the phase transition temperature. Thus, the thermovoltage curve, obtained during the continuous cooling of 45 steel, was stratified into three homogeneous phase zones and two-phase transition zones. Then, quenching conducted at the measured ferrite phase transition temperature (756 °C) validates ferrite primarily precipitates from the cold end, which results in elevated solid-solution carbon content in the adjacent austenite. It demonstrates the reliability of the thermovoltage technique as a precise tool for characterizing phase transitions. This study realizes the in situ characterization of bulk phase transformations during the heat treatment process, which expands the research work of the author conducted previously.

Author Contributions

Q.W.: writing—original draft and formal analysis. K.C.: writing—review and editing and supervision. K.L.: supervision and methodology. L.W.: validation and investigation. Y.C.: formal analysis. B.X.: data curation. All authors have read and agreed to the published version of the manuscript.

Funding

This research received no external funding.

Institutional Review Board Statement

Not applicable.

Informed Consent Statement

Not applicable.

Data Availability Statement

The data presented in this study are available on request from the corresponding author. (the data are not publicly available due to involving confidential information).

Acknowledgments

We thank Changzhi Fan and Zanxun Gao for their help with the experimental work.

Conflicts of Interest

The authors declare no conflicts of interest.

References

  1. Yang, W.; Zhou, Y.; Ma, Y.; Liu, K.; Wang, L.; Chen, K. The Ferrite layer on the surface of carbon steel obtained by precisely designed cooling rate heat treatment and its microstructure analysis. Coatings 2022, 12, 541. [Google Scholar] [CrossRef]
  2. Zhang, S.Q.; Jiao, S.H.; Ding, J.H.; Wan, D.; Liu, Z.; Wang, G. Super long-range diffusion of carbon during proeutectoid ferrite transformation. J. Cent. South Univ. 2019, 26, 560–566. [Google Scholar] [CrossRef]
  3. Xu, Z.Y. Phase transition of materials and its applications. J. Shanghai Jiao Tong Univ. 2001, 323–330. [Google Scholar]
  4. Tian, Z.H.; Zhang, X.H.; Tian, Z.G. Application of X-ray diffraction technique in material analysis. Eng. Test. 2009, 49, 40–42. [Google Scholar]
  5. Shi, X.X.; Yan, C.L. Application of Thermal Expansion Instrument in the Study of Steel Materials. Shougang Sci. Technol. 2011, 50–53. [Google Scholar]
  6. He, W.; Du, X.P.; Ma, H.Z.; Hui, X.Y.; Sun, X.F. Determination and analysis of phase transition temperature of TC4 titanium alloy. Phys. Chem. Insp. Phys. Div. 2014, 461–464. [Google Scholar]
  7. Zhang, Y.M.; Tang, Y.L.; Chen, W.Z. Determination of martensitic phase transition temperature in copper-based alloys. Mater. Dev. Appl. 1994, 9, 16–19. [Google Scholar]
  8. Zhen, R. Common measurement methods of phase transition temperature in shape memory alloys. J. Nanjing Eng. Inst. Nat. Sci. Ed. 2006, 4, 27–32. [Google Scholar]
  9. Li, W.J. Application of Differential Thermal Analysis to Metallic Materials. J. Anshan Iron Steel Inst. 1993, 4, 24–27. [Google Scholar]
  10. Qian, H.Z.; Zhang, J.Q.; Cui, L.X. Characterization of thermal expansion of steel in cast state. J. Iron Steel Res. 2011, 23, 44–49. [Google Scholar]
  11. Lasseigne, A.N.; Olson, D.L.; Kleebe, H.J.; Boellinghaus, T. Microstructural assessment of nitrogen-strengthened austenitic stainless-steel welds using thermoelectric power. Metall. Mater. Trans. A 2005, 36, 3031–3039. [Google Scholar] [CrossRef]
  12. Mott, N.F.; Jones, H. The Theory of the Properties of Metals and Alloys; Oxford University Press: Oxford, UK, 1945. [Google Scholar]
  13. Borrelly, R.; Merle, P.; Adami, L. Study of the solubility of iron in zirconium by thermoelectric power measurements. J. Nucl. Mater. 1990, 170, 147–156. [Google Scholar] [CrossRef]
  14. Brachet, J.C. Correlation between thermoelectric power (TEP) and martensite start temperature (Ms) measurements of 9Cr-WV-(Ta) martensitic steels. J. Phys. IV 1995, 5, 339–344. [Google Scholar]
  15. Kim, S.; Hong, H.S.; Oh, Y.M. Study of the thermoelectric power evolution of Zr-based alloys with Nb additions. J. Nucl. Mater. 2002, 306, 194–201. [Google Scholar]
  16. Samran, T.; Termsuksawad, P. An investigation of microstructural change of low alloy steel AISI 4150 by Seebeck coefficient. J. Met. Mater. Miner. 2010, 20, 21–26. [Google Scholar]
  17. Szabó, A.; Lovas, A. The study of transformations in glassy and crystalline alloys using thermoelectric power measurements. Acta Electrotech. Inform. 2010, 10, 71–74. [Google Scholar]
  18. Perez, M.; Sidoroff, C.; Vincent, A.; Esnouf, C. Microstructural evolution of martensitic 100Cr6 bearing steel during tempering: From thermoelectric power measurements to the prediction of dimensional changes. Acta Mater. 2009, 57, 3170–3181. [Google Scholar] [CrossRef]
  19. Radelytskyi, I.; Pękała, M.; Szymczak, R.; Gawryluk, D.J.; Berkowski, M.; Fink-Finowicki, J.; Diduszko, R.; Dyakonov, V.; Szymczak, H. Magnetocaloric effect in Ni2MnGa single crystal in the vicinity of the martensitic phase transition. J. Magn. Magn. Mater. 2017, 430, 16–21. [Google Scholar] [CrossRef]
  20. Zhou, Y.; Wang, Q.; Yang, W.; Liu, K.; Wang, L.; Chen, K. Study on the characterization of surface ferrite transformation in carbon steel using in-situ thermovoltage measurement. Vacuum 2023, 213, 112111. [Google Scholar] [CrossRef]
  21. Gao, M.; Zhang, J.Y.; Rowe, V.H. Temperature Difference Electrical Conversion and Its Application; Ordnance Industry Press: Beijing, China, 1996. [Google Scholar]
  22. Ortiz, N.; Curiel, F.F.; López, V.H.; Ruiz, A. Evaluation of the intergranular corrosion susceptibility of UNS S31803 duplex stainless steel with thermoelectric power measurements. Corros. Sci. 2013, 69, 236–244. [Google Scholar] [CrossRef]
  23. GB/T 4340.1-2009; Metallic Material-Vickers Hardness Test-Part 1: Test Method. China Standard Publishing House: Bjing, China, 2009.
  24. Sherby, O.D.; Wadsworth, J.; Lesuer, D.R.; Syn, C.K. Structure and hardness of martensite in quenched Fe-C steels. Mater. Sci. Forum 2010, 638, 160–167. [Google Scholar] [CrossRef]
  25. Sherby, O.D.; Wadsworth, J.; Lesuer, D.R.; Syn, C.K. Martensite in quenched Fe–C steels and Engel–Brewer electron theory of crystal structures. Mater. Sci. Technol. 2012, 28, 471–480. [Google Scholar] [CrossRef]
  26. Caballero, F.G.; Capdevila, C.; Alvarez, L.F.; de Andres, C.G. Thermoelectric power studies on a martensitic stainless steel. Scr. Mater. 2004, 50, 1061–1066. [Google Scholar] [CrossRef]
  27. Dayal, P.; Darken, L.S. Migration of carbon in steel under the influence of direct current. JOM 1950, 2, 1156–1158. [Google Scholar] [CrossRef]
  28. Morinaga, M.; Yukawa, N.; Adachi, H.; Mura, T. Electronic stability effect on local strain in martensite. J. Phys. F Met. Phys. 1987, 17, 2147. [Google Scholar] [CrossRef]
  29. Chen, J. Relationship between physical properties and atomic structure of precious metals. Strateg. Study Chin. Acad. Eng. 2000, 66–73. [Google Scholar]
Figure 1. The diagram of in situ thermovoltage measurement device. (a) Schematic diagram. (b) Physical diagram.
Coatings 14 00980 g001
Figure 2. Sample cutting diagram.
Coatings 14 00980 g002
Figure 3. In situ thermovoltage–temperature curves of single-phase austenite/ferrite with different solid-solution carbon contents during cooling without transformation.
Coatings 14 00980 g003
Figure 4. The in situ thermovoltage curve and the temperature difference curve of 45 steel under a continuous cooling rate of 0.02 °C/s. (a) Thermovoltage–temperature curve. (b) Temperature difference curve between the cold and hot ends.
Coatings 14 00980 g004
Figure 5. Fe-Fe3C phase diagram.
Coatings 14 00980 g005
Figure 6. Thermovoltage–temperature curve of 45 steel during continuous cooling at 0.05 °C/s.
Coatings 14 00980 g006
Figure 7. Series of experimental results on longitudinal section of 45 steel after quenching at 756 °C. (a) Microstructure at the cold end. (b) Microstructure at the hot end. (c) Average carbon content of different phases at the cold and hot ends. (d) Microhardness of different phases at the cold and hot ends.
Coatings 14 00980 g007
Table 1. Chemical compositions of test steels (wt. %).
SteelsCSiMnPSFe
450.450.180.650.0200.004Bal.
T80.790.170.240.0120.005Bal.
pure iron0.0040.040.150.0090.003Bal.
Table 2. Widths and the width ratio of the phase transition zones II and IV in 45 steel at different cooling speeds.
Cooling Rate (°C/s)Wtidth of Zone II (°C)Width of Zone IV (°C)The Width Ratio of Zone II to Zone IV
0.0222102.20
0.0534142.42
Disclaimer/Publisher’s Note: The statements, opinions and data contained in all publications are solely those of the individual author(s) and contributor(s) and not of MDPI and/or the editor(s). MDPI and/or the editor(s) disclaim responsibility for any injury to people or property resulting from any ideas, methods, instructions or products referred to in the content.

