


Elastoplastic and Electrochemical Characterization of xTiB2 Strengthened Ti Porous Composites for Their Potential Biomedical Applications

 , , , ,
Abstract
1. Introduction
2. Materials and Methods
2.1. Materials Preparation
- ○
- Mixing. The starting powders were mixed in a sealed polyethylene container within a glove chamber. The mixture was subjected to a vacuum and argon flooding process to displace the oxidizing atmosphere of the air. This process was repeated three times. Raw powders were mixed in a turbula (WAB, Muttenz, Switzerland) at a speed of 75 rotations per minute for a period of five hours; the objective was to achieve homogeneous mixtures.
- ○
- Compacting. To compact the previously mixed powders that were poured into a die to be compacted, a polyvinyl alcohol binder was added. Zinc stearate was used as a lubricant on the parts of the die that come into contact with the powder mixture to facilitate compaction and extraction of the green samples. A series of cylindrical green samples measuring 10 mm in height and 12 mm in diameter were obtained by subjecting the powders to a process of compaction with a constant pressure of 442 MPa. The powders were compacted using a Physical Test Solutions model FMCC-200 universal testing machine.
- ○
- Sintering. The consolidation of green compacts was achieved through the application of sintering in a high-vacuum environment (10−6 mbar), into a BREW furnace. Samples were sintered following three steps: first, the NH4HCO3 was eliminated at 100 °C during 8 h; second, the dehydrogenation of TiH2 was performed at 550 and 700 °C for 1 h, respectively; finally, composites were sintered at 1100 °C with a dwell time of 2 h. The cooling of the samples was carried out inside the furnace.
2.2. Material Characterization
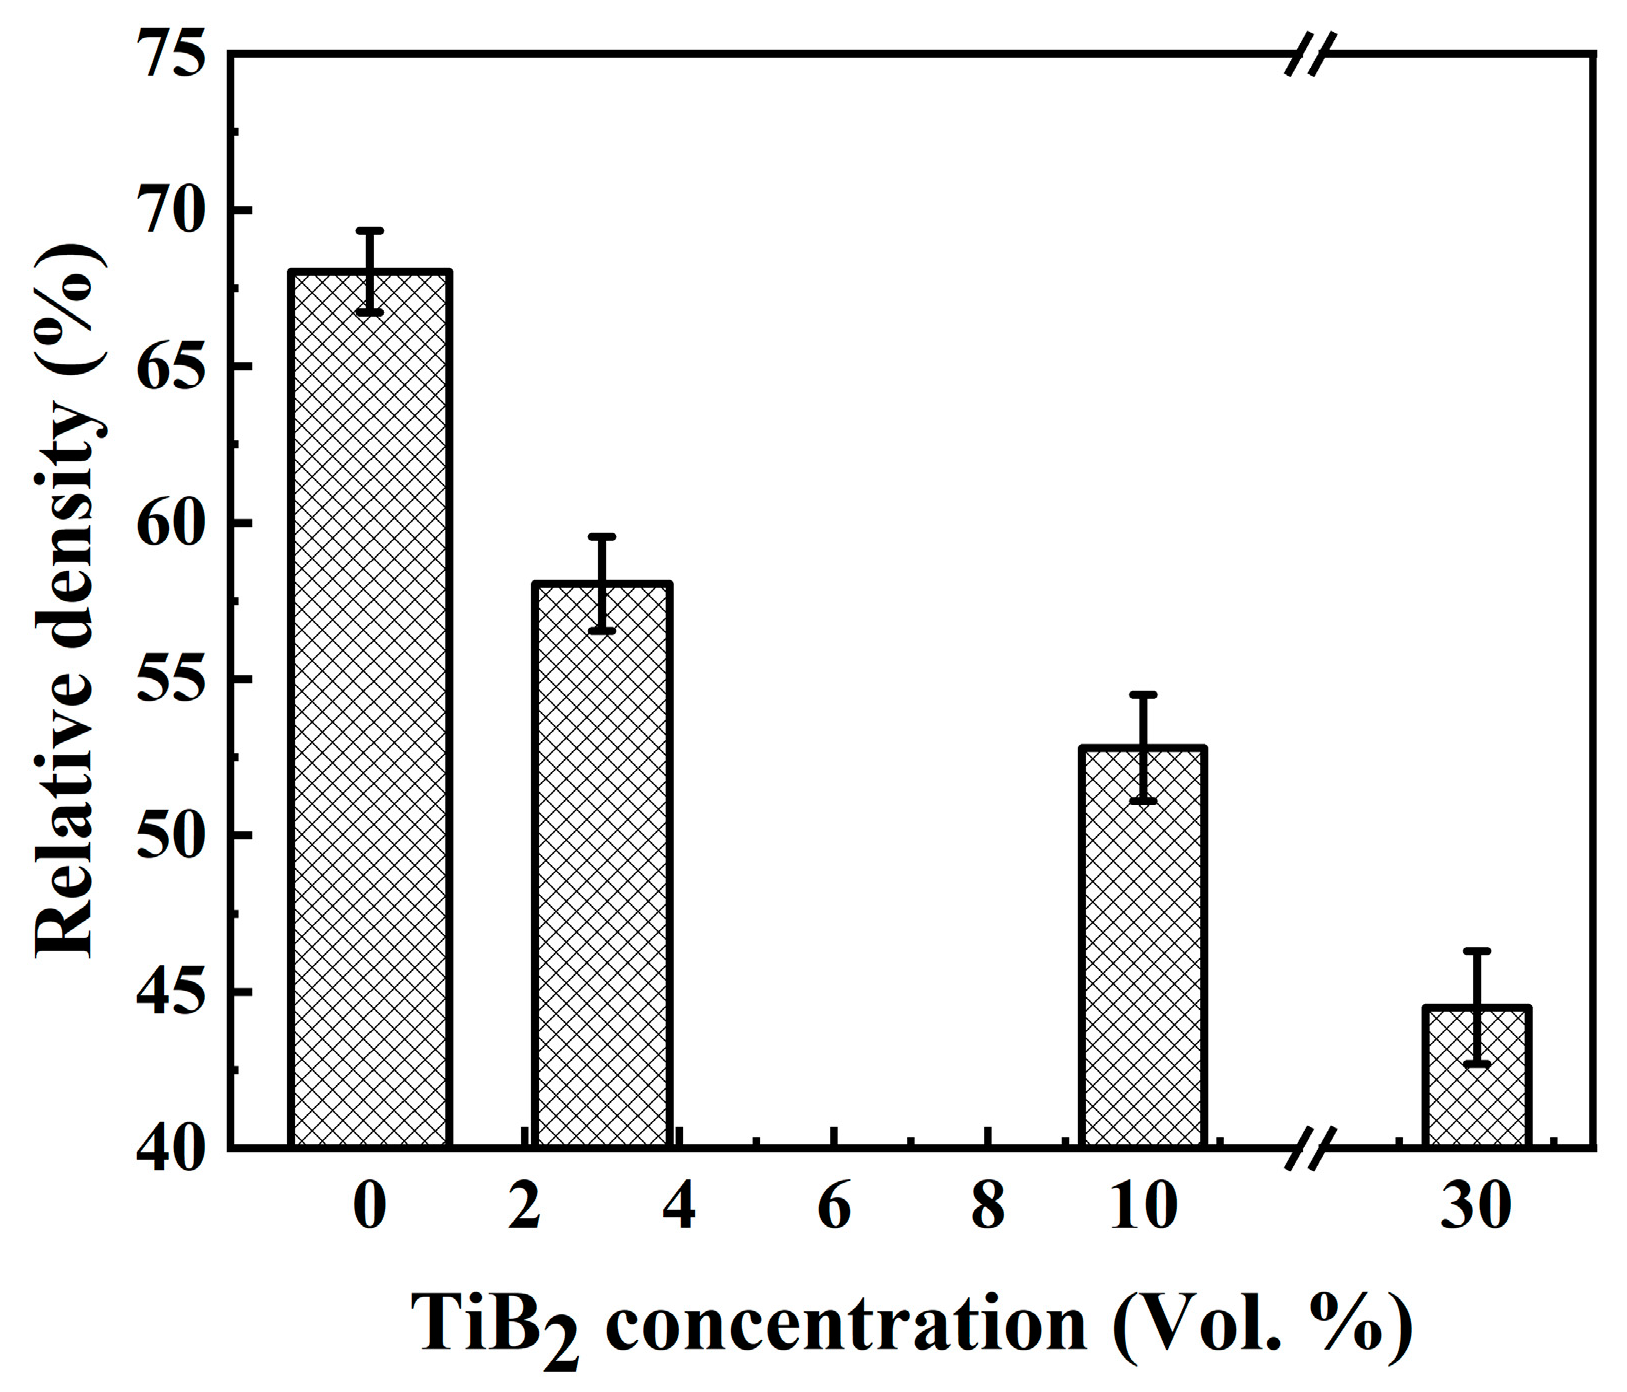
2.3. Relative Density
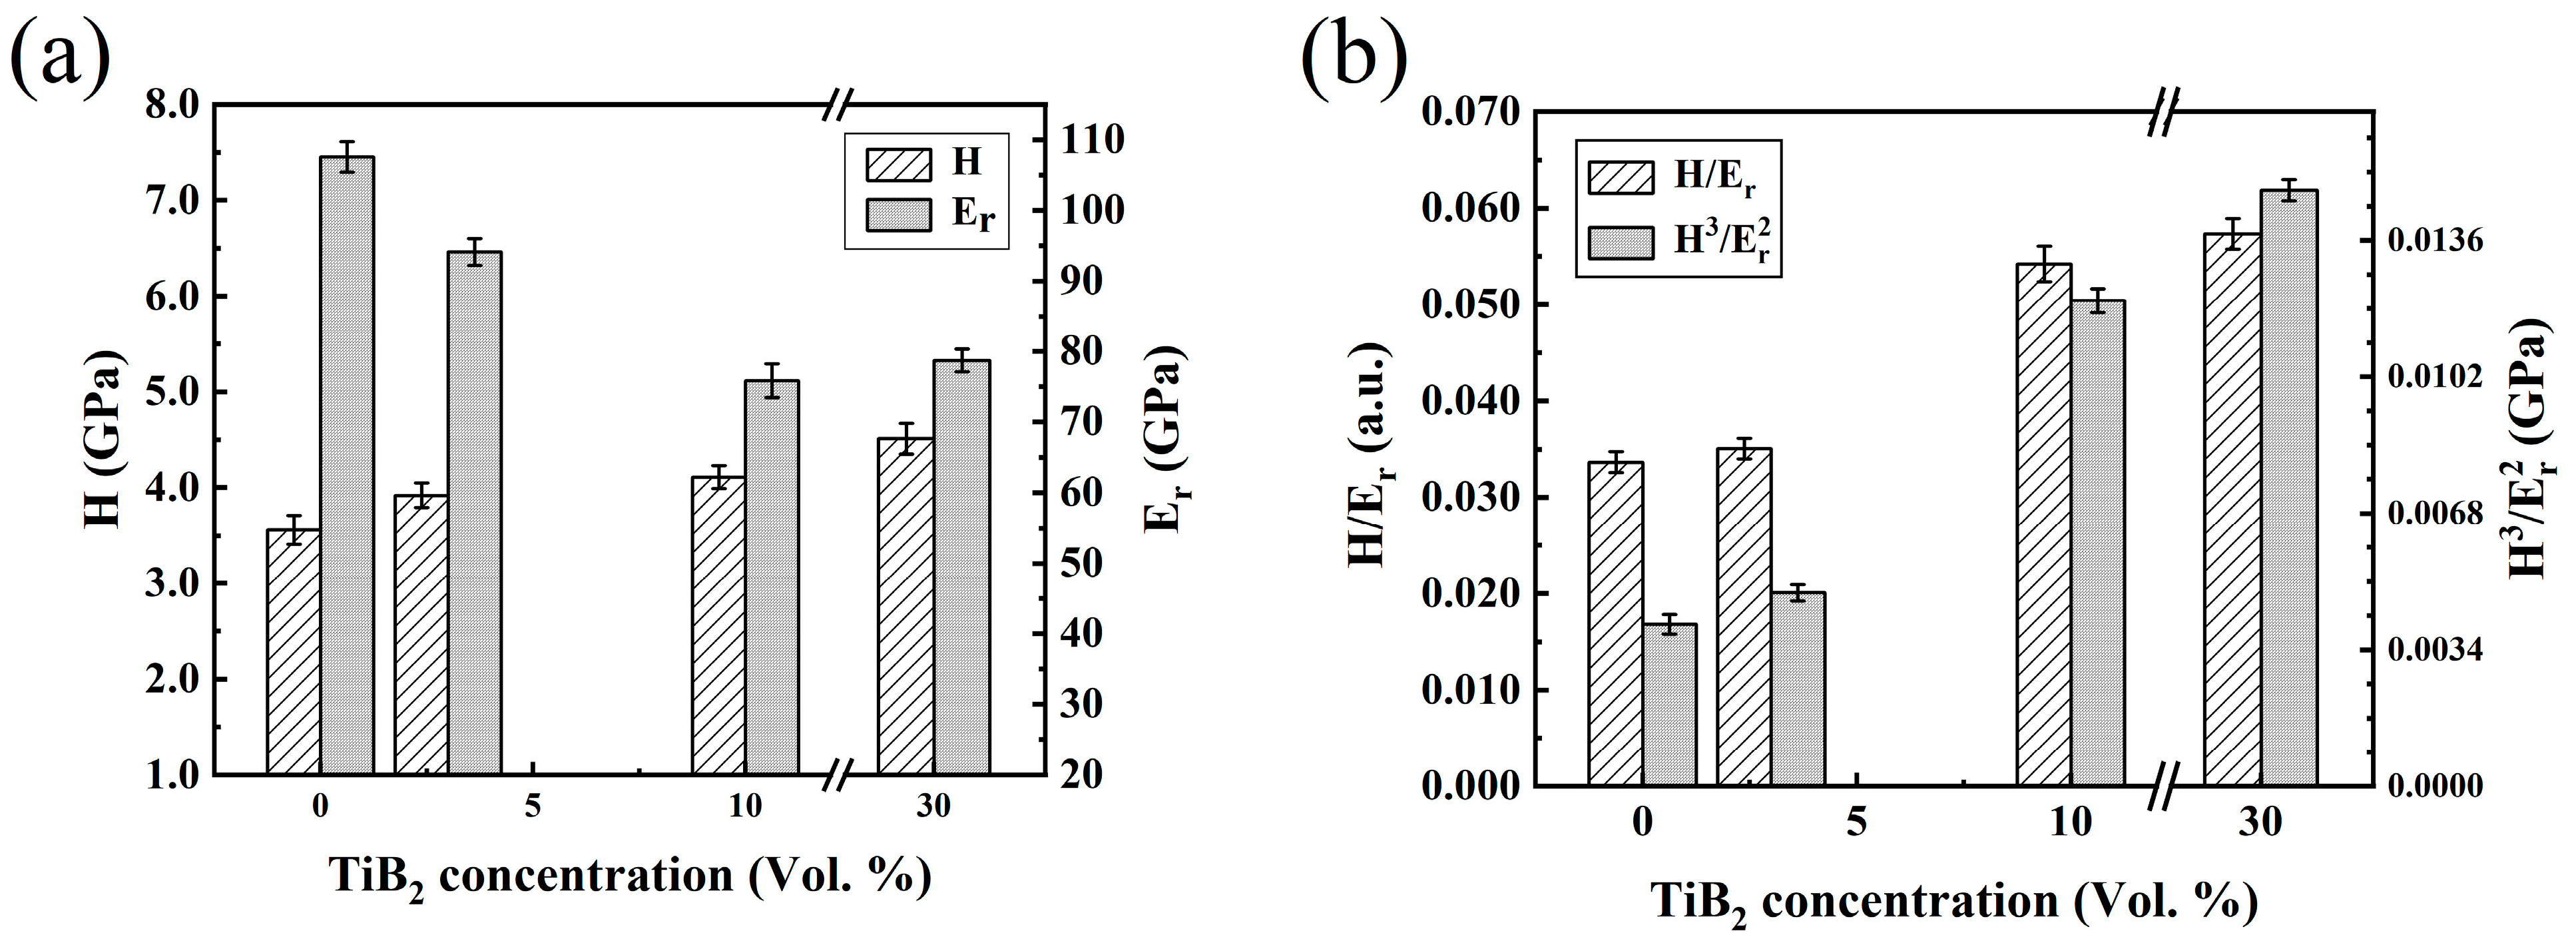
2.4. Nanoindentation Tests
2.5. Electrochemical Assays
3. Results and Discussion
4. Conclusions
Author Contributions
Funding
Institutional Review Board Statement
Informed Consent Statement
Data Availability Statement
Acknowledgments
Conflicts of Interest
References
- Pałka, K.; Pokrowiecki, R. Porous Titanium Implants: A Review. Adv. Eng. Mater. 2018, 20, 1700648. [Google Scholar] [CrossRef]
- Pałka, K.; Pokrowiecki, R.; Krzywicka, M. Porous Titanium Materials and Applications. In Titanium for Consumer Applications; Elsevier: Amsterdam, The Netherlands, 2019; pp. 27–75. [Google Scholar]
- Rodriguez-Contreras, A.; Punset, M.; Calero, J.A.; Gil, F.J.; Ruperez, E.; Manero, J.M. Powder Metallurgy with Space Holder for Porous Titanium Implants: A Review. J. Mater. Sci. Technol. 2021, 76, 129–149. [Google Scholar] [CrossRef]
- Lascano, S.; Arévalo, C.; Montealegre-Melendez, I.; Muñoz, S.; Rodriguez-Ortiz, J.A.; Trueba, P.; Torres, Y. Porous Titanium for Biomedical Applications: Evaluation of the Conventional Powder Metallurgy Frontier and Space-Holder Technique. Appl. Sci. 2019, 9, 982. [Google Scholar] [CrossRef]
- Dercz, G. Structure and Nanoindentation Mechanical Properties of Novel Porous Ti-Ta Material with a Core-Shell Structure Using the Powder Metallurgy Method. Adv. Powder Technol. 2019, 30, 1006–1017. [Google Scholar] [CrossRef]
- Nouri, A.; Hodgson, P.D. Biomimetic Porous Titanium Scaffolds for Orthopedic and Dental Applications; IntechOpen: London, UK, 2010. [Google Scholar]
- Xu, W.; Lu, X.; Zhang, B.; Liu, C.; Lv, S.; Yang, S.; Qu, X. Effects of Porosity on Mechanical Properties and Corrosion Resistances of PM-Fabricated Porous Ti-10Mo Alloy. Metals 2018, 8, 188. [Google Scholar] [CrossRef]
- Annur, D.; Rokhmanto, F.; Thaha, Y.N.; Kartika, I.; Dimyati, A.; Supriadi, S.; Suharnoa, B. Processing and Characterization of Porous Titanium for Orthopedic Implant Prepared by Argon-Atmospheric Sintering and Arc Plasma Sintering. Mater. Res. 2021, 24, e20210122. [Google Scholar] [CrossRef]
- Suárez-Martínez, R.; Pérez-Alvarez, J.; Farías, I.; Bravo-Barcenas, D.; Flores, M.; Chavez, J.; Olmos, L.; Jimenez, O. Ti-TiH2 Matrix Composites Reinforced with TiN by High Vacuum Sintering (HVS) for Biomedical Applications. Mater. Lett. 2020, 277, 128382. [Google Scholar] [CrossRef]
- Peng, Q.; Yang, B.; Friedrich, B. Porous Titanium Parts Fabricated by Sintering of TiH2 and Ti Powder Mixtures. J. Mater. Eng. Perform. 2018, 27, 228–242. [Google Scholar] [CrossRef]
- Ivasishin, O.M.; Anokhin, V.M.; Demidik, A.N.; Savvakin, D.G. Cost-Effective Blended Elemental Powder Metallurgy of Titanium Alloys for Transportation Application. Key Eng. Mater. 2009, 188, 55–62. [Google Scholar] [CrossRef]
- Bravo Barcenas, D.I.; Chávez Aguilar, J.M.; Jiménez Alemán, O.; Olmos Navarrete, L.; Flores Jiménez, M.F.; González Albarrán, M.A.; Farias Velázquez, I.G. Microstructure and Mechanical Properties of Ti-TiH2 Based Matrix Composites Reinforced with xTiB2 Particles Processed by Powder Metallurgy. Coatings 2023, 13, 587. [Google Scholar] [CrossRef]
- Falodun, O.E.; Obadele, B.A.; Oke, S.R.; Okoro, A.M.; Olubambi, P.A. Titanium-Based Matrix Composites Reinforced with Particulate, Microstructure, and Mechanical Properties Using Spark Plasma Sintering Technique: A Review. Int. J. Adv. Manuf. Technol. 2019, 102, 1689–1701. [Google Scholar] [CrossRef]
- Weimer, A.W. (Ed.) Carbide, Nitride and Boride Materials Synthesis and Processing; Springer: Dordrecht, The Netherlands, 1997; ISBN 978-94-010-6521-4. [Google Scholar]
- Attar, H.; Ehtemam-Haghighi, S.; Kent, D.; Okulov, I.V.; Wendrock, H.; Bönisch, M.; Volegov, A.S.; Calin, M.; Eckert, J.; Dargusch, M.S. Nanoindentation and Wear Properties of Ti and Ti-TiB Composite Materials Produced by Selective Laser Melting. Mater. Sci. Eng. A 2017, 688, 20–26. [Google Scholar] [CrossRef]
- Attar, H.; Löber, L.; Funk, A.; Calin, M.; Zhang, L.C.; Prashanth, K.G.; Scudino, S.; Zhang, Y.S.; Eckert, J. Mechanical Behavior of Porous Commercially Pure Ti and Ti-TiB Composite Materials Manufactured by Selective Laser Melting. Mater. Sci. Eng. A 2015, 625, 350–356. [Google Scholar] [CrossRef]
- Dabrowski, B.; Kaminski, J.; Swieszkowski, W.; Kurzydlowski, K.J. Porous Titanium Scaffolds for Biomedical Applications: Corrosion Resistance and Structure Investigation. Mater. Sci. Forum 2011, 674, 41–46. [Google Scholar] [CrossRef]
- ASTM E3-11; Standard Guide for Preparation of Metallographic Specimens. ASTM International: West Conshohocken, PA, USA, 2017. [CrossRef]
- ASTM E407-07; Standard Practice for Microetching Metals and Alloys. ASTM International: West Conshohocken, PA, USA, 2015. [CrossRef]
- Rabadia, C.D.; Liu, Y.J.; Jawed, S.F.; Wang, L.; Li, Y.H.; Zhang, X.H.; Sercombe, T.B.; Sun, H.; Zhang, L.C. Improved Deformation Behavior in Ti-Zr-Fe-Mn Alloys Comprising the C14 Type Laves and β Phases. Mater. Des. 2018, 160, 1059–1070. [Google Scholar] [CrossRef]
- Sang, P.; Chen, L.Y.; Zhao, C.; Wang, Z.X.; Wang, H.; Lu, S.; Song, D.; Xu, J.H.; Zhang, L.C. Particle Size-Dependent Microstructure, Hardness and Electrochemical Corrosion Behavior of Atmospheric Plasma Sprayed Nicrbsi Coatings. Metals 2019, 9, 1342. [Google Scholar] [CrossRef]
- ASTM E2546-15; Standard Practice for Instrumented Indentation Testing. ASTM International: West Conshohocken, PA, USA, 2023. [CrossRef]
- Oliver, W.C.; Pharr, G.M. Measurement of Hardness and Elastic Modulus by Instrumented Indentation: Advances in Understanding and Refinements to Methodology. J. Mater. Res. 2004, 19, 3–20. [Google Scholar] [CrossRef]
- Kokubo, T.; Takadama, H. How Useful Is SBF in Predicting in Vivo Bone Bioactivity? Biomaterials 2006, 27, 2907–2915. [Google Scholar] [CrossRef]
- ASTM G3-89; Standard Practice for Conventions Applicable to Electrochemical Measurements in Corrosion Testing. ASTM International: West Conshohocken, PA, USA, 2004.
- Yang, L. Techniques for Corrosion Monitoring; Woodhead Publishing: Sawston, UK, 2008; ISBN 9781845691783. [Google Scholar]
- Predel, B. B-Ti (Boron-Titanium). In B-Ba–C-Zr; Madelung, O., Ed.; Springer: Berlin/Heidelberg, Germany, 1992; pp. 1–3. [Google Scholar]
- Ebrahimi, A.; Esfahani, H.; Fattah-alhosseini, A.; Imantalab, O. In-Vitro Electrochemical Study of TiB/TiB2 Composite Coating on Titanium in Ringer’s Solution. J. Alloys Compd. 2018, 765, 826–834. [Google Scholar] [CrossRef]
- Ehtemam-Haghighi, S.; Cao, G.; Zhang, L.C. Nanoindentation Study of Mechanical Properties of Ti Based Alloys with Fe and Ta Additions. J. Alloys Compd. 2017, 692, 892–897. [Google Scholar] [CrossRef]
- Alves, A.C.; Wenger, F.; Ponthiaux, P.; Celis, J.P.; Pinto, A.M.; Rocha, L.A.; Fernandes, J.C.S. Corrosion Mechanisms in Titanium Oxide-Based Films Produced by Anodic Treatment. Electrochim. Acta 2017, 234, 16–27. [Google Scholar] [CrossRef]
- Bertoli, I.R.; Filgueira, M.; Ferreira, L.M.; de Sousa, L.L.; Mariano, N.A.; Ramos, A.S.; Nunes, C.A.; Santos, C.d.; Ramos, E.C.T. Microstructure and Corrosion Behavior in SBF Medium of Spark Plasma Sintered Ti-XZr-20Si-10B (x = 5, 7, 10, 15, 20 at.-%) Alloys. J. Alloys Compd. 2019, 797, 1157–1162. [Google Scholar] [CrossRef]


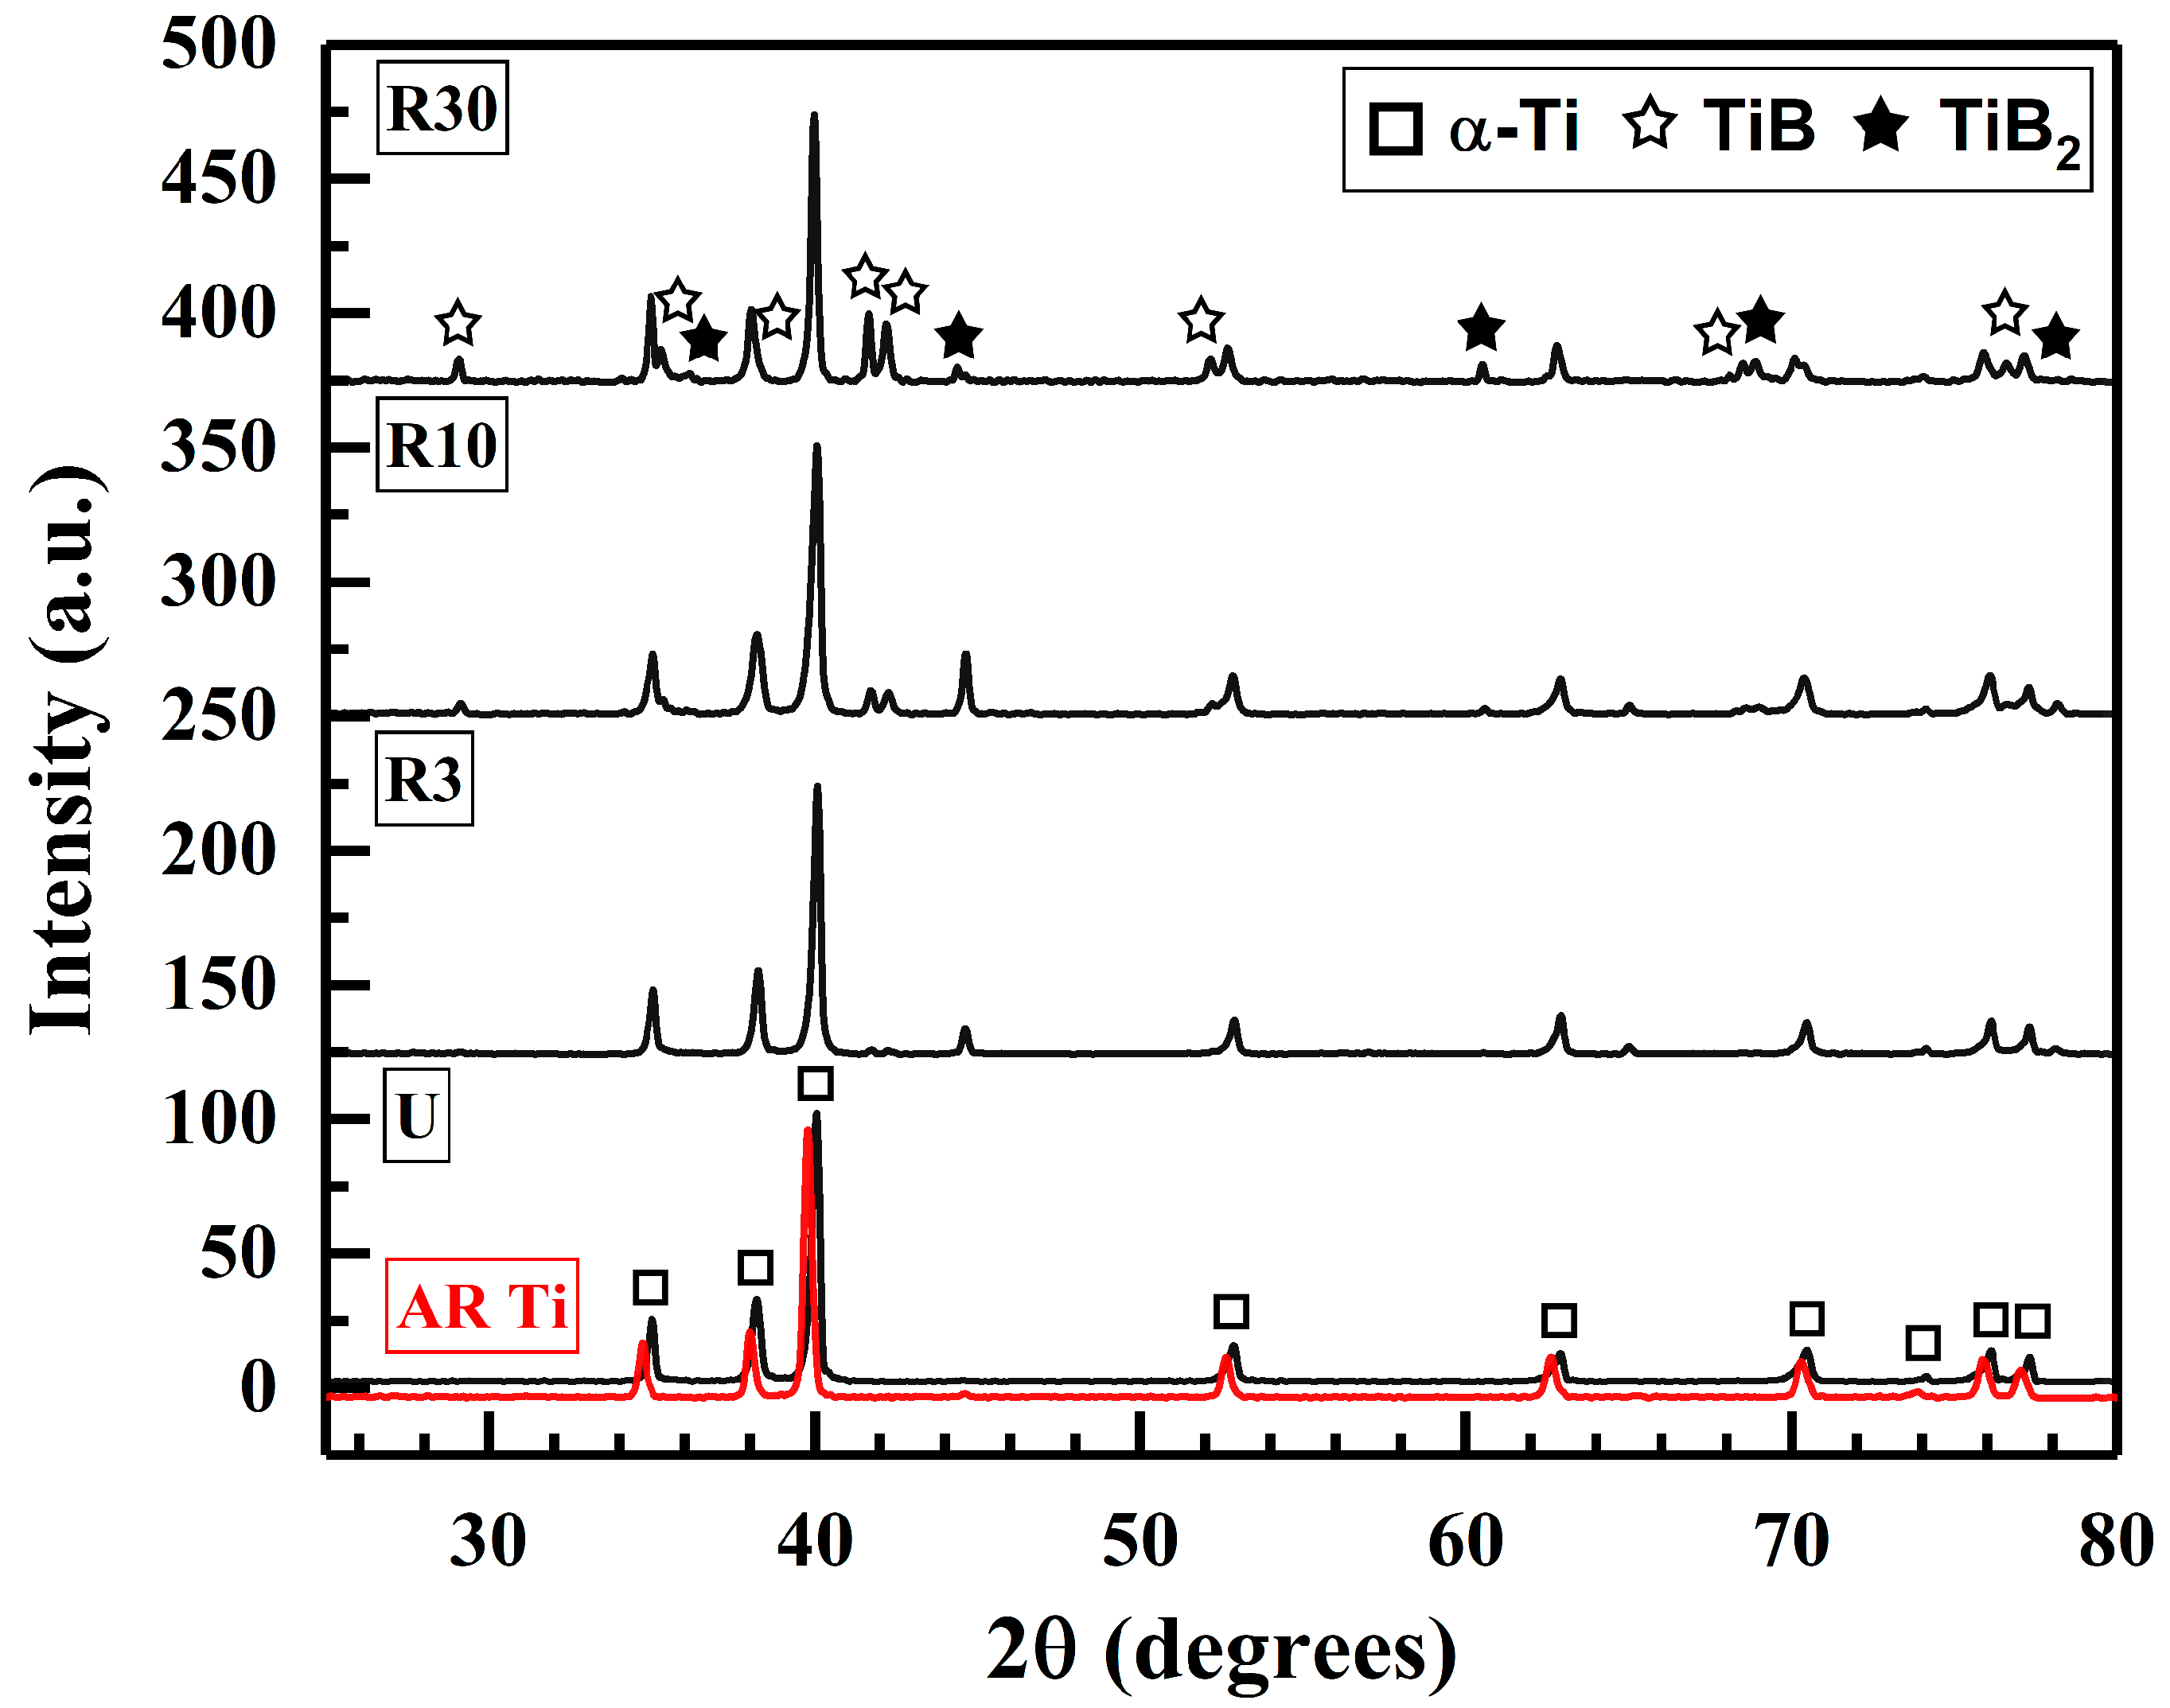
| Sample | α-Ti | TiB | TiB2 |
|---|---|---|---|
| U | 100 ±1.35 | - | - |
| R3 | 93.74 ±2.30 | 2 ±0.33 | 4.26 ±0.43 |
| R10 | 87.83 ±2 | 6.27 ±1 | 5.9 ±0.85 |
| R30 | 74.37 ±1.80 | 19.73 ±1.53 | 5.85 ±1.69 |
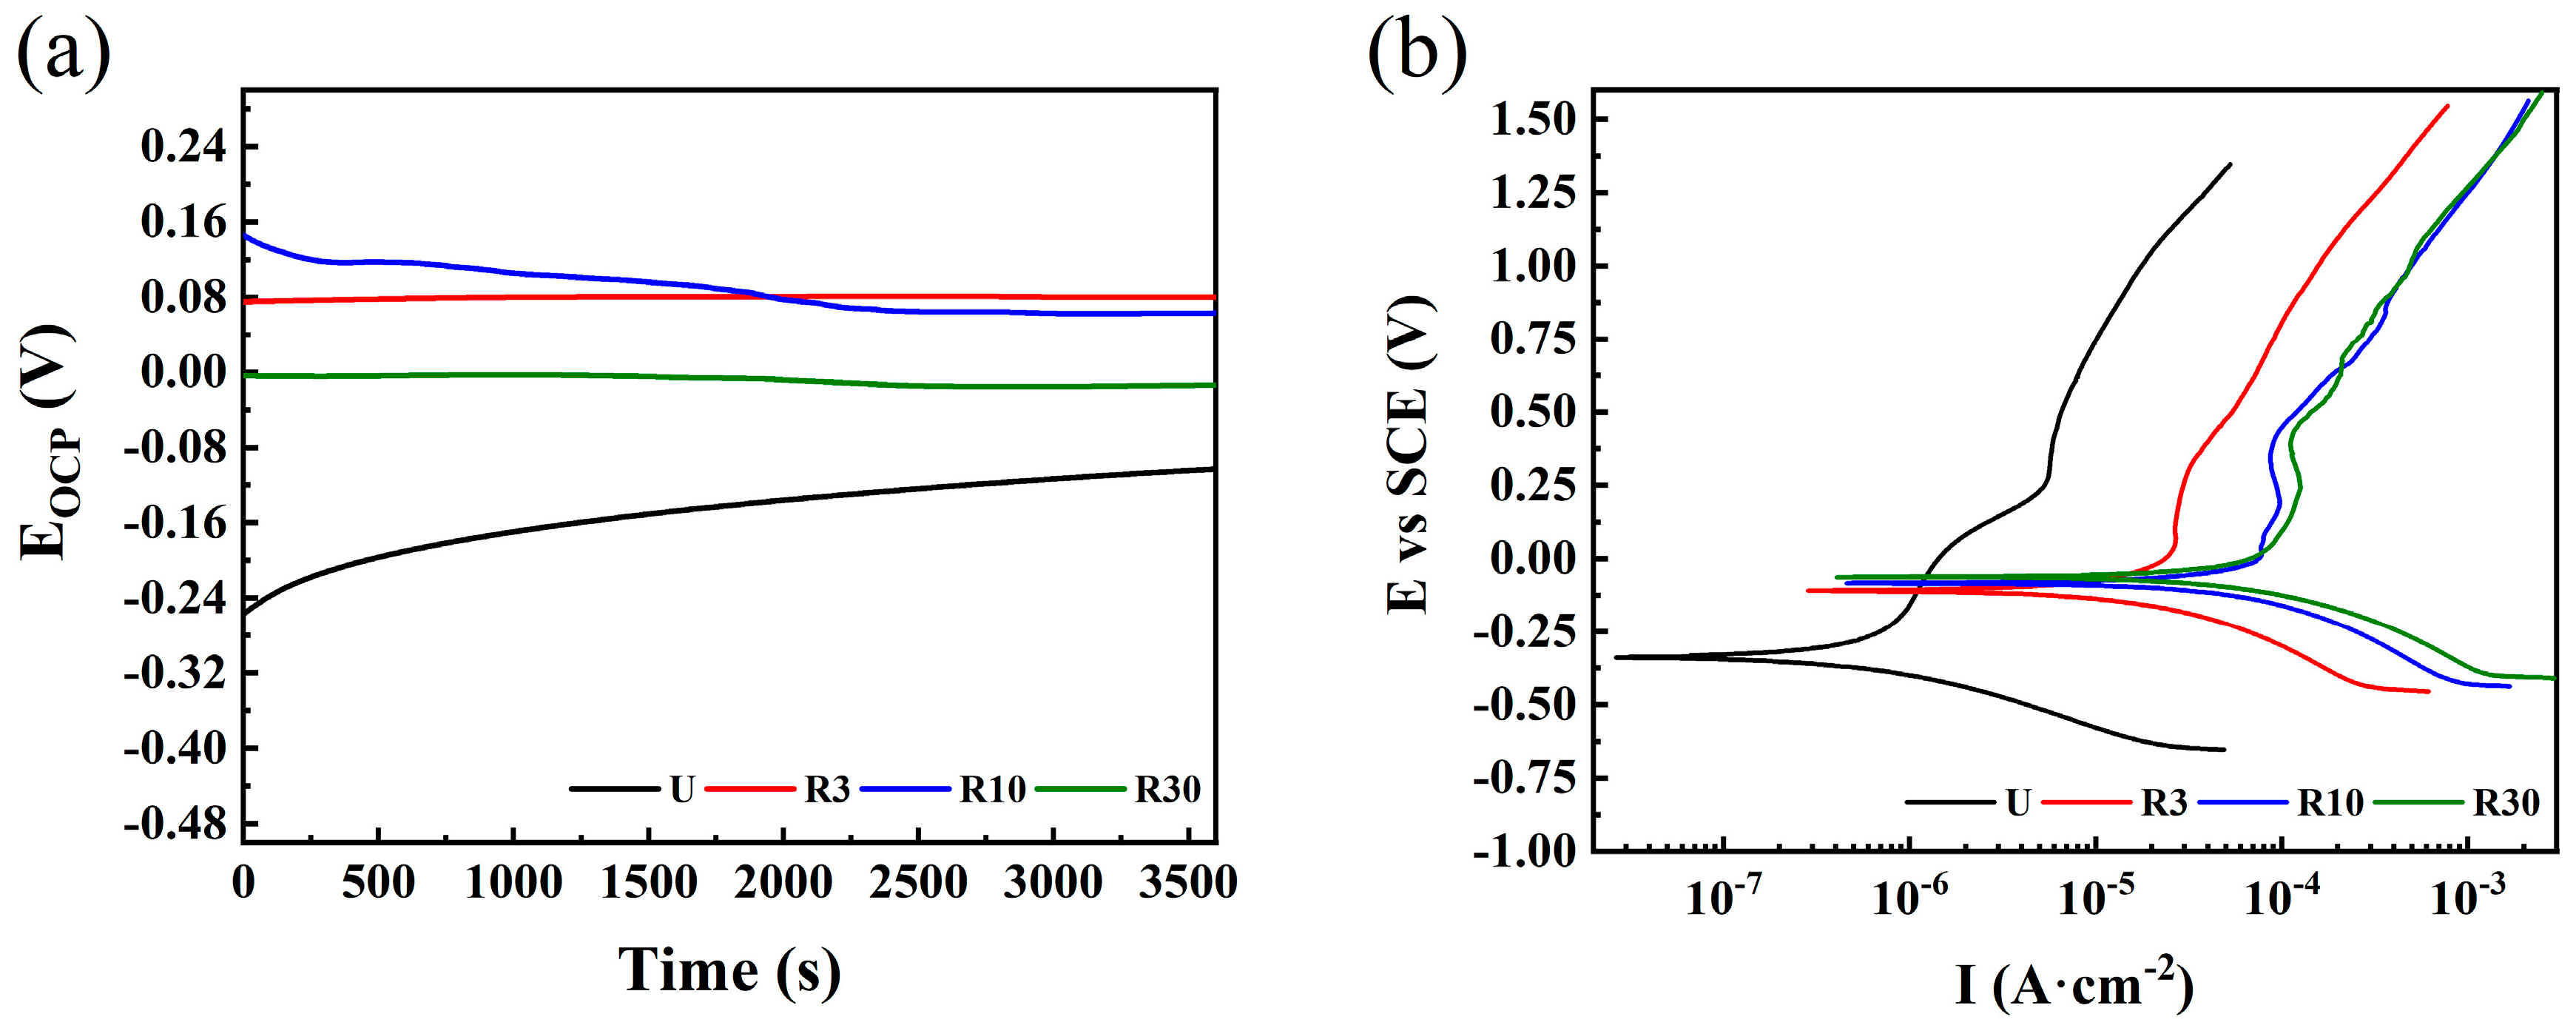
| Sample | RP (kΩ) | Jcorr (µA·cm−2) | Ecorr (mV/SCE) | ba (mV/Decade) | bc (mV/Decade) | CR (mm/Y) × 10−3 |
|---|---|---|---|---|---|---|
| U | 83.43 ±7.18 | 0.161 ±0.013 | −347.61 ±7.83 | 63.17 ±0.93 | 52.37 ±7.65 | 1.25 ±0.15 |
| R3 | 5.55 ±0.83 | 2.44 ±0.04 | −128.58 ±8.64 | 74.91 ±2.95 | 55.32 ±3.60 | 29.26 ±1.79 |
| R10 | 1.26 ±0.19 | 14.48 ±2.42 | −80.83 ±3.50 | 67.09 ±6.45 | 55.70 ±4.43 | 185.82 ±6.93 |
| R30 | 0.79 ±0.07 | 17.07 ±1.41 | −84.66 ±2.39 | 65.97 ±7.04 | 69.37 ±5.80 | 240.84 ±19.82 |
| Sample | Rs (kΩ·cm2) | Rp (kΩ·cm2) | Rsip (kΩ·cm2) | RSop (kΩ·cm2) | CPE (nF·cm−2) | n | CPE1/2wp (nF·cm−2) | n | CPEwp (nF·cm−2) | n |
|---|---|---|---|---|---|---|---|---|---|---|
| U | 8.52 ±0.40 | 4.03 ±0.07 | -- | -- | 0.169 ±0.003 | 0.602 ±0.01 | -- | -- | -- | -- |
| R3 | 3.19 ±0.22 | 18.78 ±2.02 | 1.52 ±0.14 | 0.014 ±0.0006 | 3.870 ±0.063 | 0.110 ±0.006 | 1.790 ±0.05 | 0.564 ±0.04 | 0.098 ±0.003 | 0.766 ±0.025 |
| R10 | 2.87 ±0.04 | 36.88 ±4.62 | 2.47 ±0.17 | 0.049 ±0.003 | 13.590 ±0.044 | 0.662 ±0.031 | 6.493 ±0.06 | 0.552 ±0.05 | 0.107 ±0.001 | 0.815 ±0.026 |
| R30 | 2.70 ±0.27 | 43.76 ±1.59 | 1.85 ±0.25 | 0.037 ±0.003 | 27.361 ±0.156 | 0.942 ±0.044 | 9.414 ±0.05 | 0.623 ±0.03 | 0.533 ±0.002 | 0.875 ±0.019 |
Disclaimer/Publisher’s Note: The statements, opinions and data contained in all publications are solely those of the individual author(s) and contributor(s) and not of MDPI and/or the editor(s). MDPI and/or the editor(s) disclaim responsibility for any injury to people or property resulting from any ideas, methods, instructions or products referred to in the content. |
© 2024 by the authors. Licensee MDPI, Basel, Switzerland. This article is an open access article distributed under the terms and conditions of the Creative Commons Attribution (CC BY) license (https://creativecommons.org/licenses/by/4.0/).
Share and Cite
Bravo-Bárcenas, D.I.; Suárez-Martínez, R.; Pérez-Alvarez, J.; Jiménez-Alemán, O.; Farias-Velazquez, I.G.; Gonzaléz-Albarrán, M.A.; Chávez, J. Elastoplastic and Electrochemical Characterization of xTiB2 Strengthened Ti Porous Composites for Their Potential Biomedical Applications. Coatings 2024, 14, 991. https://doi.org/10.3390/coatings14080991
Bravo-Bárcenas DI, Suárez-Martínez R, Pérez-Alvarez J, Jiménez-Alemán O, Farias-Velazquez IG, Gonzaléz-Albarrán MA, Chávez J. Elastoplastic and Electrochemical Characterization of xTiB2 Strengthened Ti Porous Composites for Their Potential Biomedical Applications. Coatings. 2024; 14(8):991. https://doi.org/10.3390/coatings14080991
Chicago/Turabian StyleBravo-Bárcenas, David Israel, Reynier Suárez-Martínez, Jonatan Pérez-Alvarez, Omar Jiménez-Alemán, Iván Gerardo Farias-Velazquez, Marco Aurelio Gonzaléz-Albarrán, and Jorge Chávez. 2024. "Elastoplastic and Electrochemical Characterization of xTiB2 Strengthened Ti Porous Composites for Their Potential Biomedical Applications" Coatings 14, no. 8: 991. https://doi.org/10.3390/coatings14080991
APA StyleBravo-Bárcenas, D. I., Suárez-Martínez, R., Pérez-Alvarez, J., Jiménez-Alemán, O., Farias-Velazquez, I. G., Gonzaléz-Albarrán, M. A., & Chávez, J. (2024). Elastoplastic and Electrochemical Characterization of xTiB2 Strengthened Ti Porous Composites for Their Potential Biomedical Applications. Coatings, 14(8), 991. https://doi.org/10.3390/coatings14080991