Abstract
The relationships between microstructure, dissolution, and mechanical properties of a soluble Al-Mg-Ga-In-Sn alloy are investigated in the present study. The findings demonstrate that the influence of low-melting-point elements on the dissolution of aluminum alloys can be attributed to the formation of secondary phases composed of Mg2Sn and In3Sn at grain boundaries and their participation in the Al–water reaction. After annealing, the secondary phases at grain boundaries transform from point-like and block-like discontinuous particles to strip-like continuous intergranular phases which envelop the Al matrix, resulting in a 29.8% reduction in the volume. These transformations increase the total contact area of the Al–water interface, amplifying the corrosion current of the annealed alloy to more than 30 times that of the as-cast alloy, thereby accelerating the dissolution rate. Unlike magnesium–lithium alloys, the soluble Al-Mg-Ga-In-Sn alloy exhibits a balanced strength, ductility, and dissolution rate, which presents it as a cost-effective, lightweight, structurally and functionally integrated material for the realm of petroleum exploration.
1. Introduction
Soluble materials, which can rapidly dissolve and degrade harmlessly under specific conditions, have been extensively investigated in recent years [1,2,3,4]. In the field of oil extraction, hydraulic fracturing and other process technologies are commonly employed. During the exploration process, various critical underground components such as fracturing balls, ball sockets, and bridge plugs necessitate removal upon completion of their designated functions. For instance, incorporating soluble materials in the fabrication of fracturing tools enables automatic dissolution following underground operations, thereby enhancing the efficiency of oil and gas exploration while concurrently reducing construction costs [5].
The downhole tools fabricated from such soluble materials must possess adequate mechanical properties and controllable dissolution, while also being capable of adapting to diverse service environments characterized by varying pH and temperature combinations. Among these materials, aluminum alloy stands out as the preferred choice due to its high strength, controllable dissolution, and cost effectiveness. The formation of a soluble aluminum alloy involves the addition of low-melting-point metals, such as Ga, In, and Sn elements, to suppress the formation of a dense oxide film on the aluminum surface. This facilitates a direct hydrolysis reaction between the aluminum surface and water [6,7,8,9,10,11,12]. The dissolution rate of this material is influenced by various factors, including corrosive media, temperature, concentration, etc. With the rapid advancement of industrial technology, the application potential of such materials in the field of petroleum exploration is increasing [13]. Current research and tool manufacturing efforts for soluble aluminum alloy materials aim to achieve higher strength at the expense of plasticity while still meeting dissolution performance requirements. The soluble bridge plugs utilized in oilfield development possess intricate geometries and demand moderate material performance. They must exhibit exceptional ductility while ensuring sufficient strength to meet the workpiece requirements [14,15]. However, the economical 5 series aluminum alloy exhibits good ductility, but it is not soluble. Soluble bridge plugs made of Mg-Li alloy are cost-prohibitive. The soluble Al-Ga-In-Sn alloy used for hydrogen production is unsuitable for complex part fabrication due to its poor plasticity. Consequently, the pursuit of economic soluble aluminum alloys with superior plasticity has emerged as a current research focus.
Liu et al. [16] have proposed that the incorporation of 0.5% Mg into a Al-Ga-In-Sn aluminum alloy yields optimal hydrogen production performance. The addition of Mg to Al alloy facilitates grain size refinement, thereby enhancing strength and hardness. Consequently, this study introduced a specific amount of Mg, Ga, In, and Sn elements into Al and designated it as the “soluble Al-Mg-Ga-In-Sn alloy” for further investigation.
Heat treatment can modify the elemental composition distribution within alloy grains, as well as the microstructure, morphology, and distribution of the secondary phase at grain boundaries. The Al-Mg-Ga-In-Sn alloy contains various grain boundary phases formed by Mg, Ga, In, Sn. Based on the phase diagrams of Mg-Ga, Mg-In, and Mg-Sn, it can be observed that with the exception of Mg2Sn, the compounds formed by combining Mg with Ga and In all have melting points below 500 °C. By applying appropriate heat treatment at a specific temperature range, it is possible to induce melting of the grain boundary phases of Mg with Ga and In. Consequently, this may lead to alterations in both composition and morphology of both grains and grain boundary phases [17]. Such changes in composition and microstructure can significantly impact the material dissolution performance as well as electrochemical properties [18,19,20]. Therefore, investigating annealing heat treatment for modifying microstructure and composition becomes imperative for enhancing the soluble Al-Mg-Ga-In-Sn alloy.
To achieve this goal, the present study fabricated a soluble Al-Mg-Ga-In-Sn alloy and controlled the annealing heat treatment to obtain various microstructures of the alloy. Subsequently, dissolution tests, electrochemical performance comparison tests, and mechanical tensile tests were conducted, and the correlation between microstructure changes and dissolution rate was studied. The objective was to elucidate how microstructure control affects dissolution rate in order to develop economically soluble aluminum alloys with balanced mechanical properties.
2. Materials and Experimental Procedures
2.1. Preparation of the Samples
Using industrial-grade pure Al (99.99 wt.%), pure Mg (99.99 wt.%), pure Ga (99.99 wt.%), pure In (99.99 wt.%), and pure Sn (99.99 wt.%) as raw materials, each material was granulated and weighed according to the weight percentage ratio (Mg 0.6%, Ga 0.5%, In 0.5%, Sn 0.5%, the rest is Al) for alloy composition design purposes. The aluminum was melted first in a graphite crucible under argon gas protection until the molten liquid reached a temperature range of 730–750 °C, after which Mg, Ga, In, and Sn particles were added to facilitate their melting into the aluminum liquid. During melting, the air pressure was equal to atmospheric pressure [21].
An argon rod was utilized for thorough agitation, and the heating process lasted for 0.5 h to achieve complete alloy element fusion and obtain a homogeneously composed melt. Subsequently, the melt was allowed to stand at a temperature of 750 ± 5 °C for a duration of 10 min in order to degas. The molten alloy was promptly transferred into a preheated graphite mold (preheated to 200 °C). After pouring for 15 min, when solidification occurred, the alloy was extracted from the mold and naturally cooled in ambient air until reaching room temperature. The resulting material corresponded to a soluble aluminum alloy, with its composition designated as Al-Mg-Ga-In-Sn.
The prepared samples and 5050 commercial aluminum alloy specimens were processed into various dimensions using wire cutting for subsequent testing as specimens. Annealing heat treatment was conducted on a portion of the soluble Al-Mg-Ga-In-Sn alloy specimen by maintaining it at a temperature of 450 °C/490 °C for a duration of 2.5 h, followed by air cooling to room temperature. The specimens were labeled with different conditions, namely, the as-cast, the annealed (insulated at 450 °C for 2.5 h, insulated at 490 °C for 2.5 h), and the 5050 commercial alloy.
Preparation of metallographic specimens involved embedding samples measuring 6 mm × 6 mm × 6 mm, followed by sequential polishing using SiC sandpaper with varying particle sizes (180–2000 mesh) and silica polishing solution. The polished samples did not undergo corrosion treatment. Subsequently, the microstructure of the alloy was examined using a scanning electron microscope (SEM) JSM-6390A (JEOL Ltd., Tokyo, Japan), while energy dispersive spectroscopy (EDS) ZEISS SUPRA 55 (Carl Zeiss, Oberkochen, Germany) and an X-ray diffractometer XRD-6000 (SGLC Co., Ltd., Kyoto, Japan) were employed to analyze the composition of the alloy phase. The accelerating voltage was 10 kV during the SEM and EDS measurements, and the radiation source was Cu Kα with a wavelength of 0.154 nm during the XRD measurements.
2.2. Experimental Investigation on Dissolution Performance
The dissolution performance test was conducted using the weight loss method, with 3% alkali (NaOH) and salt (KCl) solutions as the dissolution media. Initially, different solutions were prepared according to the requirements and transferred to several 500 mL beakers. Subsequently, the beakers were heated in a water bath until it reached a temperature of 93 °C and the temperature was then kept constant. The experimental samples, with sizes of Φ10 mm × 15 mm, were placed in their respective solutions, while labeling them accordingly. Timing was initiated and any changes occurring in both the sample and solution were observed. At specified intervals, the sample was removed from its solution, its surface thoroughly cleaned, weighed using an electronic balance, and these aforementioned steps were repeated accordingly while collecting data throughout the process. Finally, all the collected experimental data were substituted into Equation (1) to calculate the dissolution rate [22].
In the equation, P represents the percentage of material dissolution rate, MO denotes the mass (g) of the original sample, and MR signifies the mass (g) of the residual sample after dissolution. Data were acquired on the dissolution rates and a plot was generated for subsequent analysis.
2.3. Experiments on Electrochemical Performance
The surface of the 6 mm × 6 mm × 6 mm sample was polished gradually using sandpaper ranging from 400 to 2000 grit. Subsequently, a P-1 metallographic polishing machine was employed to eliminate scratches. The sample was cleaned with anhydrous ethanol for future use. Finally, the sample was sealed with resin and its working surface (6 mm2) exposed for subsequent testing.
The PARSTAT 2273 electrochemical workstation electrode system developed by AMETEK Group in the United States was utilized for the experiment. The sample served as the working electrode (WE), a platinum sheet (Pt) acted as the auxiliary electrode (CE), and a saturated calomel electrode functioned as the reference electrode (RE). The corrosive solution (3% NaOH or 3% KCl) was utilized at ambient temperature. The sample underwent polarization curve testing and impedance spectrum testing. Specific parameters were set as follows: (1) Open circuit potential: Measurement time lasted for 1200 s until corrosion current density reached a stable state. (2) Polarization curve: Scanning point range spanned from −1.5 V to −0.5 V relative to open circuit potential, with a scanning rate of 1 mV/s. (3) Impedance spectroscopy (EIS): Similar preparation steps were taken as those for polarization curve testing, conducted within a frequency range of 100 KHz to 0.01 KHz, while maintaining an AC sine signal disturbance amplitude of 5 mV.
2.4. Experimental Investigation of Mechanical Tensile Properties
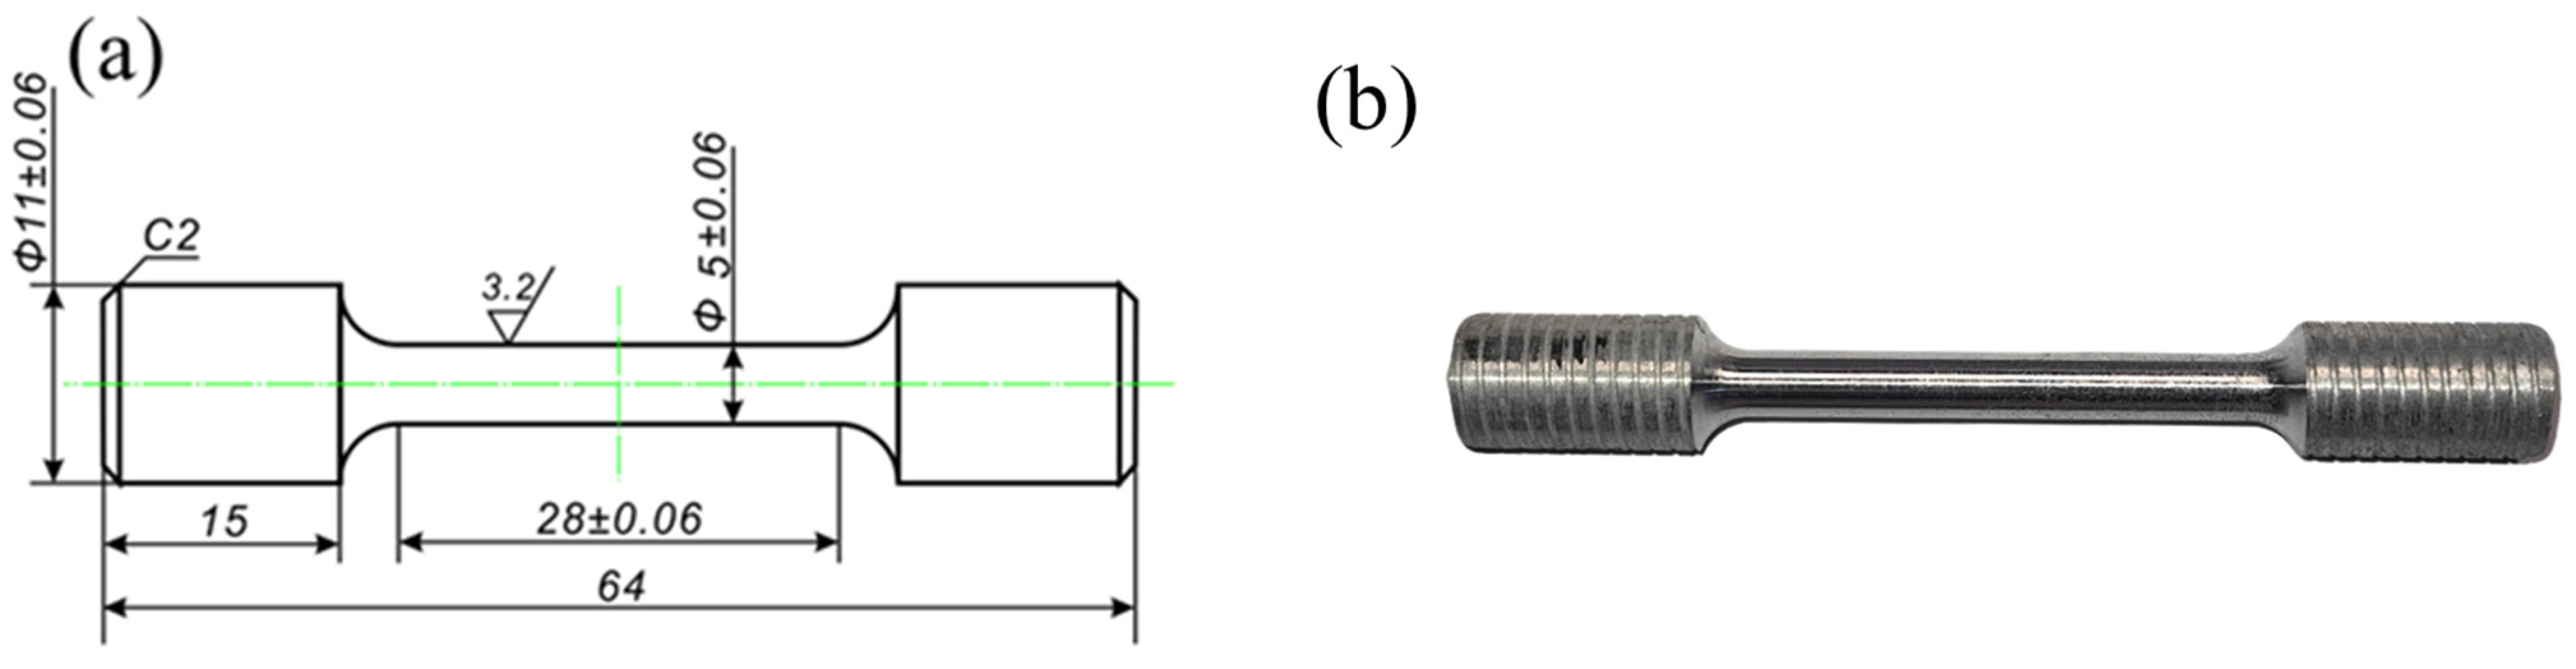
The tensile mechanical properties of the designed soluble aluminum alloy material were experimentally evaluated at room temperature. Initially, samples were obtained from the casting using an electric discharge CNC wire cutting machine DK7725E (ZHCF CNC Technology Co., Ltd., Suzhou, China). Subsequently, the extracted samples were meticulously processed into dumbbell-shaped tensile test specimens using precision CNC machine tools as depicted in Figure 1a.
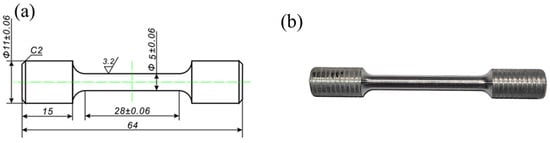
Figure 1.
Tensile test specimen: (a) Technical drawing, (b) photographic documentation of the sample.
The finished product of the specimens is illustrated in Figure 1b. Before conducting the experiment, the tensile specimen was polished using sandpaper with grit sizes ranging from 400 to 1200 in order to eliminate surface oxides and minimize the influence of processing defects on the experimental data. Tensile tests were performed on a universal tensile testing machine MTS-810 (MTS Systems Co., Eden Prairie, Minnesota, USA) at a constant rate of 10−3 mm/s. To ensure data accuracy, three samples were prepared for each alloy state and measured under identical experimental conditions, with the middle curve selected for comparison.
3. Empirical Findings and Analytical Examination
3.1. Characterization of Microstructure and Phase Composition
3.1.1. Microstructure and Phase Composition in the As-Cast State
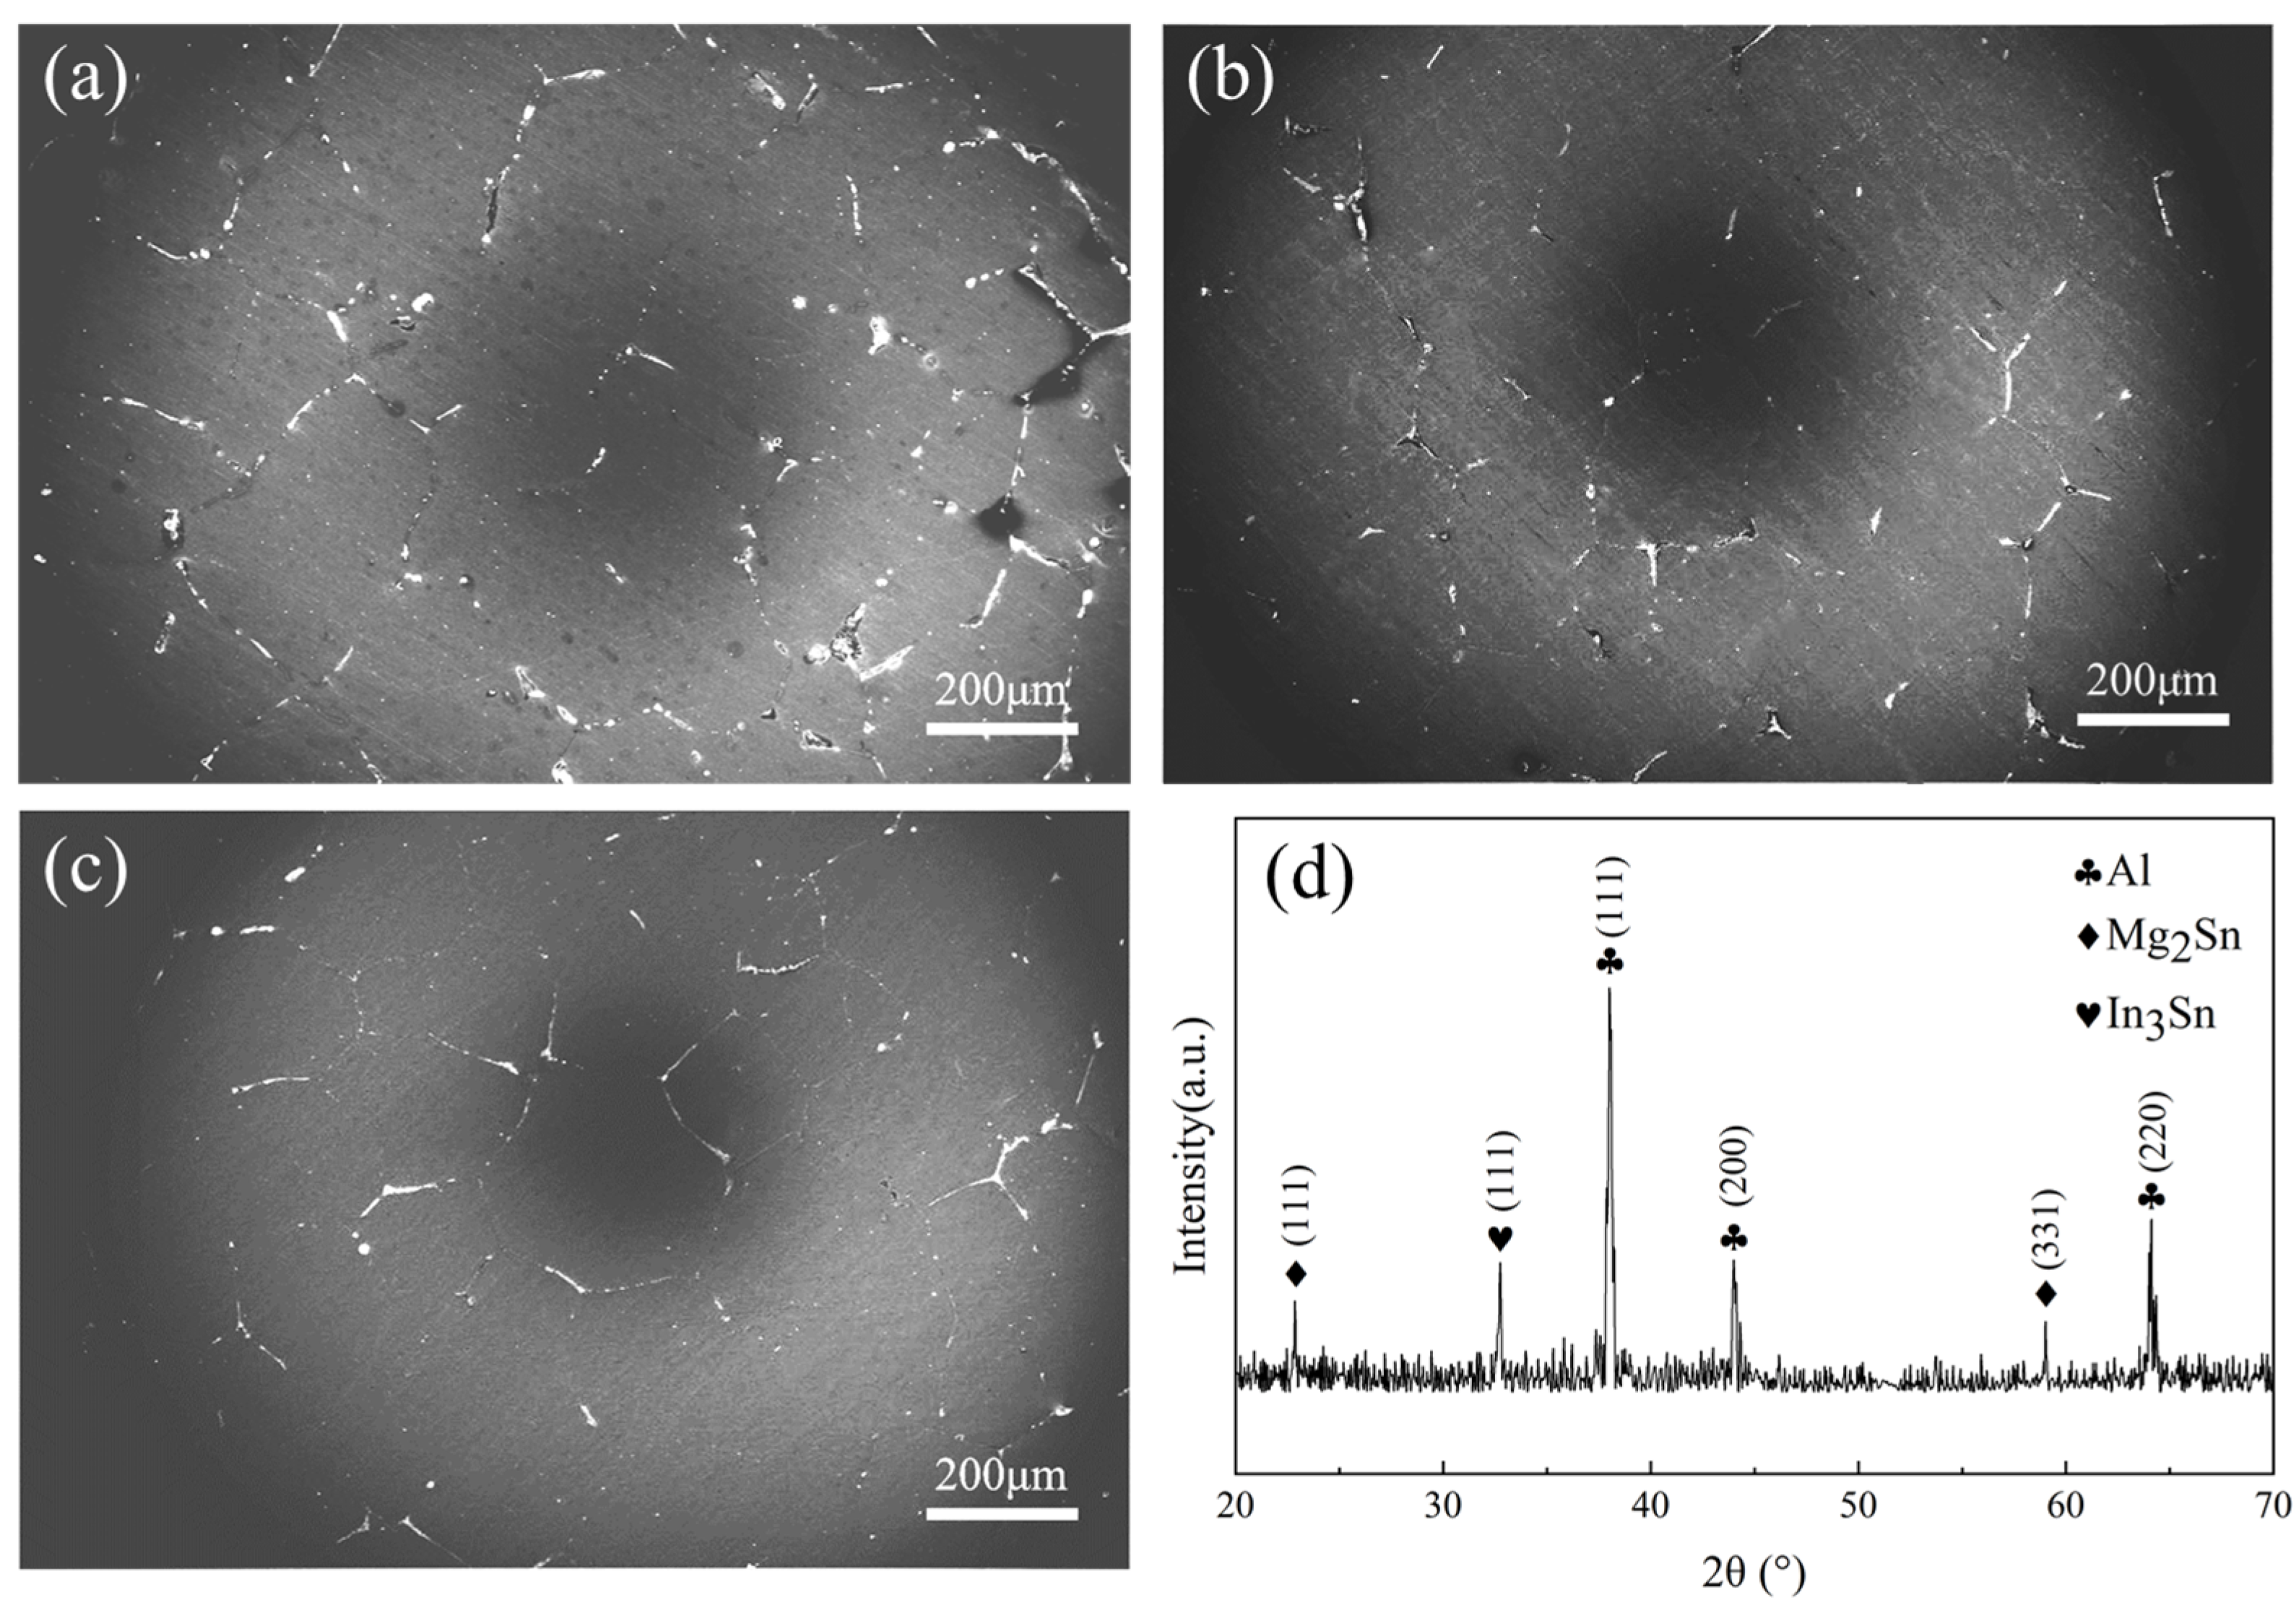
The grain size range of the as-cast Al-Mg-Ga-In-Sn alloy, as depicted in Figure 2, is observed to be between 150 and 400 μm with equiaxed Al grains. Microscopic examination reveals a significant presence of dispersed gray-white or gray-black second-phase distribution within the microstructure, primarily appearing in point-like and block-like discontinuous particles, along with a smaller fraction exhibiting a strip-like continuous phase. These second-phase particles are predominantly concentrated at grain boundaries, displaying noticeable segregation and demonstrating distinct intermittent dispersion patterns.
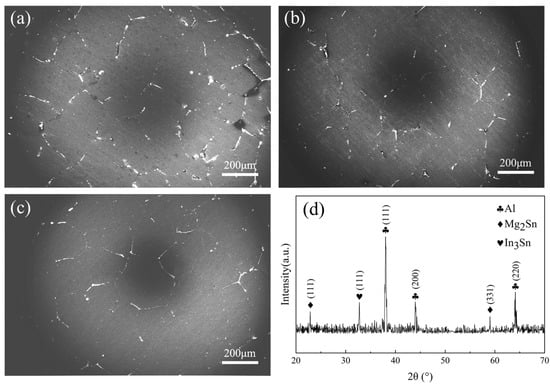
Figure 2.
SEM images of grain boundaries and secondary phase with corresponding XRD spectrum of soluble Al-Mg-Ga-In-Sn alloy: (a) SEM image of the as-cast grains, (b) SEM image of the grains after 2.5 h of insulation at 450 °C, (c) SEM image of the grains after 2.5 h of insulation at 490 °C, (d) XRD spectrum.
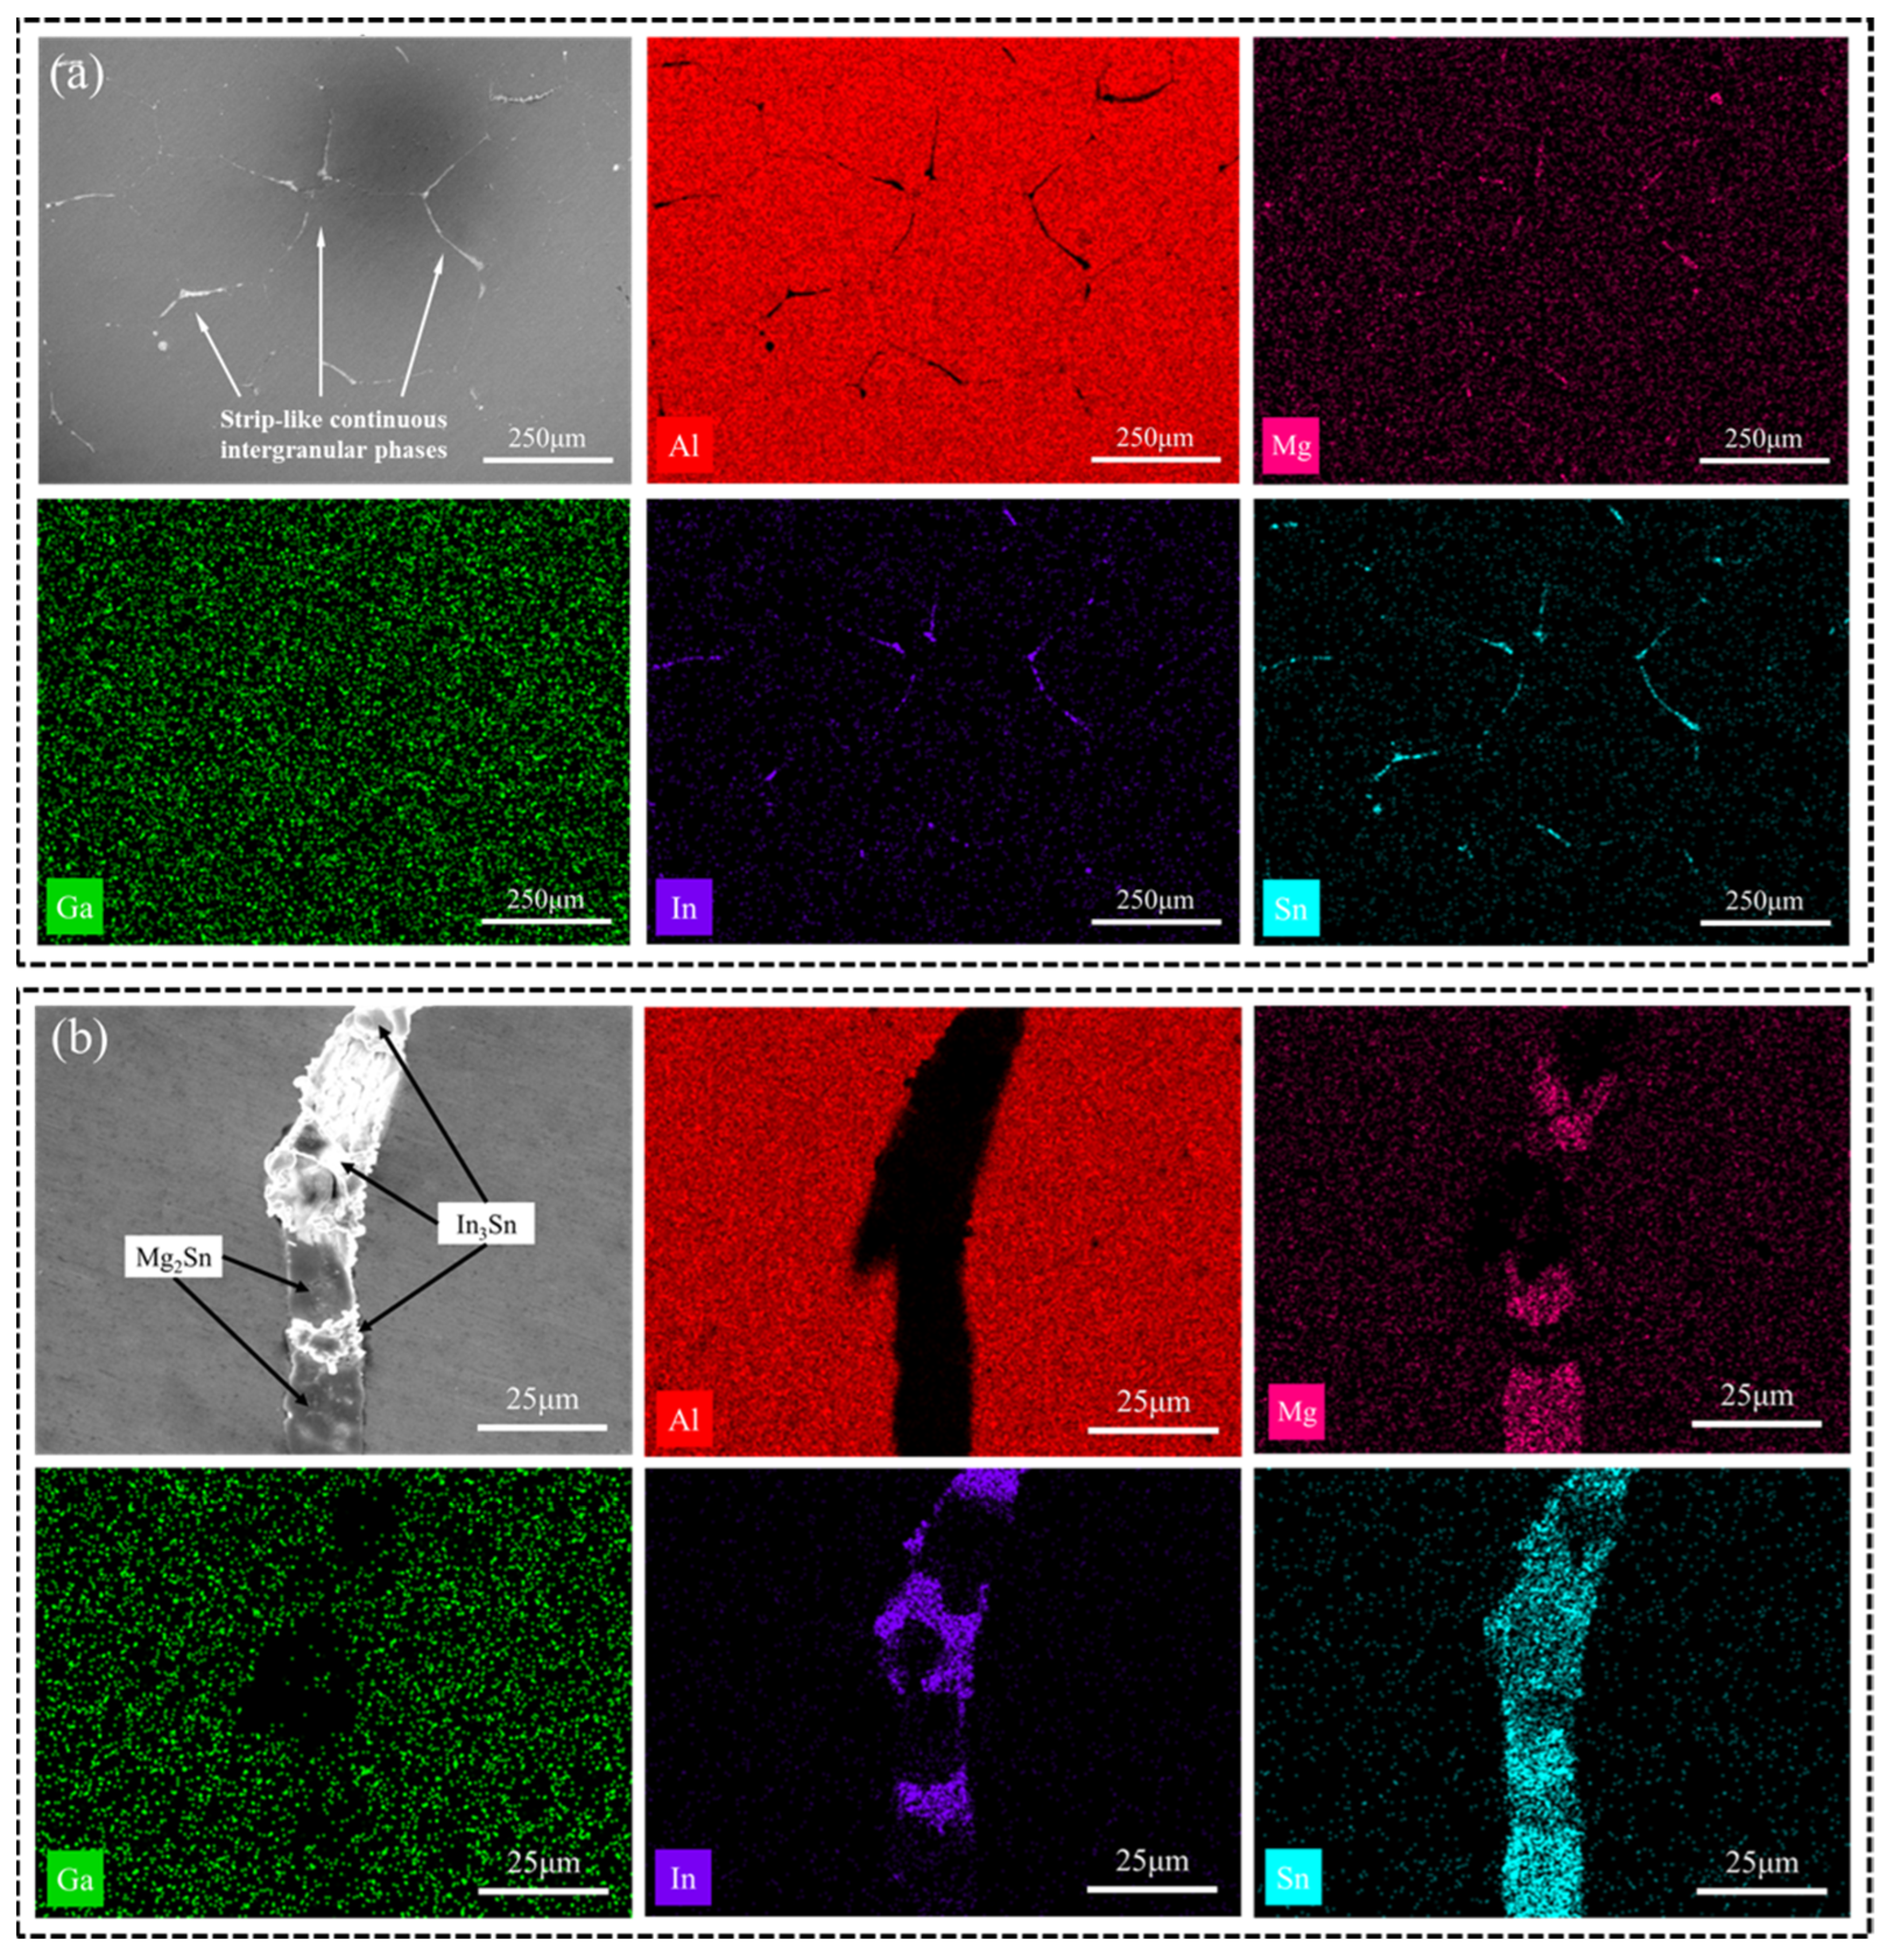
The as-cast microstructure was subjected to EDS scanning, resulting in the generation of Figure 3a and Table 1. They reveal that Ga is uniformly distributed throughout the alloy and also present at the positions occupied by In and Sn. The secondary phase observed at grain boundaries primarily consists of Mg, In, and Sn. While Mg exhibits overall uniform distribution, localized aggregation phenomena are observed, leading to the formation of compounds with other low-melting-point elements (Ga, In, and Sn) [23].
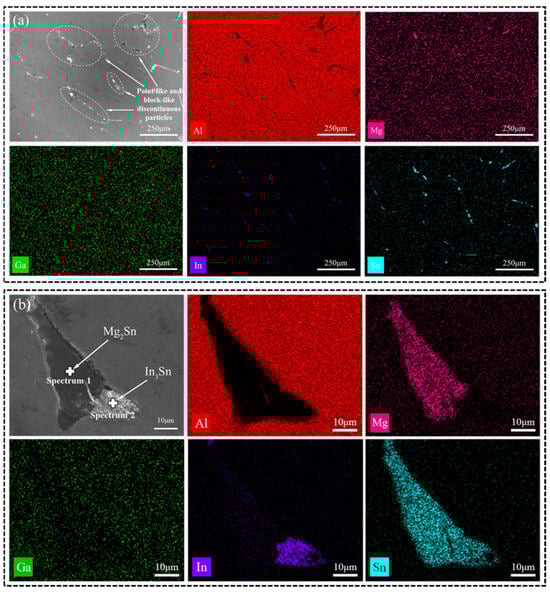
Figure 3.
(a) SEM images and EDS mappings (Al, Mg, Ga, In, Sn) of the as-cast alloy; (b) enlarged image of (a).

Table 1.
Composition of soluble Al-Mg-Ga-In-Sn alloy analyzed by EDS.
Based on the XRD image in Figure 2d, it is evident that the primary phase of the soluble Al-Mg-Ga-In-Sn alloy is the Al (Ga, Mg) solid-solution phase, along with Mg2Sn and In3Sn phases. An EDS image of a large precipitate is depicted in Figure 3b. According to the atomic ratios of various elements obtained by EDS point scanning in Table 2, it can be determined that Mg and Sn are the predominant constituents in the gray-black phase above, present at a ratio of 2:1. Therefore, this precipitate phase can be inferred to be Mg2Sn. Similarly, In and Sn are found to be major elements in the gray-white phase at a ratio of 3:1, suggesting that this precipitate phase corresponds to In3Sn. It should be noted that Al-Mg-Ga-In-Sn alloys typically contain Mg2Sn compounds which exhibit semi-continuous distribution along grain boundaries [7,24]. Interestingly, our study reveals an association between the Mg2Sn and In3Sn phases.
Table 2.
Mole fraction of various elements at positions 1 and 2 in Figure 3b (at%).
When incorporating Mg, Ga, In, and Sn into the melting process of Al, the solubility of Ga in the aluminum alloy is high, primarily resulting in the formation of an Al (Ga) solid solution. Both In and Sn possess low melting points with a close ratio, exhibiting miscibility in any proportion while having low solubility in aluminum alloy. Initially present as small liquid droplets, upon encountering each other, a low-melting-point In-Sn alloy was formed. After undergoing high-temperature melting, some Mg was incorporated into the Al matrix while some dispersed at grain boundaries and came into contact with the In-Sn alloy. This led to a reaction with Sn to form a stable compound known as Mg2Sn. Due to the limited presence of Mg at the grain boundaries, only a portion of surrounding Sn was consumed by this reaction; however, it reduced the proportion of Sn within nearby In-Sn alloys, facilitating easier formation of In3Sn compounds.
The above analysis indicates the presence of diverse alloy phase combinations in the soluble Al-Mg-Ga-In-Sn alloy, with Mg2Sn and In3Sn phases predominantly observed at grain boundaries.
3.1.2. Effect of Heat Treatment on the Microstructure and Morphology
The distribution of the secondary phase in Figure 2a appears disordered. EDS images in Figure 4a exhibit similar patterns for the Mg, Sn, and In elements of the annealed Al-Mg-Ga-In-Sn alloy, transitioning from a block-like or point-like morphology in the as-cast alloy to a strip-like morphology along grain boundaries in the annealed alloy. Figure 4b illustrates an EDS image revealing typical phases present in the annealed alloy; notably, an alternating distribution is observed for the Mg2Sn and In3Sn phases. This suggests that during annealing there was re-melting of low-melting-point phases accompanied by complete diffusion of various atoms.
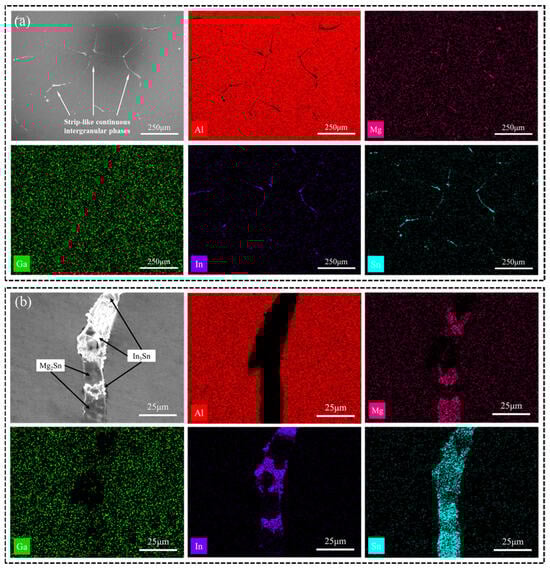
Figure 4.
(a) SEM images and EDS mappings (Al, Mg, Ga, In, Sn) of the annealed alloy; (b) enlarged image of (a).
Using the ImageJ (version 1.54g) image processing software, the microstructures of the as-cast and the annealed alloys were simply estimated. Three typical positions were selected from the 60× magnification SEM image, and the area was the same as those in Figure 2a–c. The approximately parallel boundary edge of each grain was found from the vertical direction, and the two obvious points on them were connected with a straight line. The left or right angle deviation of each line is limited to less than 30°, and the length of the line represents the estimated grain size. The sizes of all grains in the image were measured, and the statistical average size with a standard deviation was calculated. A grayscale threshold for the boundary edge was determined, and the proportion of the area above the grayscale threshold in the total area was calculated as an estimate of the proportion of non-matrix area. The average grain size, standard deviation, and the proportion of non-matrix area are shown in Table 3.
Table 3.
Simple estimation of metallographic images.
In Table 3, it shows that, in comparison to the as-cast alloy, the average grain size exhibited a reduction of 24 μm and 27 μm after annealing at temperatures of 450 °C and 490 °C for a duration of 2.5 h, respectively. The non-matrix area decreased to approximately 70.2% following annealing at 450 °C, and further declined to 56.8% after annealing at 490 °C.
This suggests that Mg2Al3, MgGa, and MgIn compounds can be melted efficiently when annealed at 450 °C [17]; the solubility of Mg in Al alloy increases, leading to reabsorption of Mg elements by the Al matrix. This process leads to disappearance of certain pores generated during casting and a reduction in grain boundary volume along with rearrangement. Recrystallization or segregation is caused by compounds that are encapsulated inside the grains during annealing, but the new grains do not have enough time to grow, resulting in a decrease in average grain size.
Therefore, annealing above 450 °C led to a decrease in average grain size. The volume of the non-matrix area decreased by 29.8%, and the secondary phases of Mg2Sn and In3Sn were alternately distributed, showing a strip-like structure. Increasing the annealing temperature to 490 °C led to little change in average grain size, and the morphology and distribution were no different from those at 450 °C, the volume of the non-matrix region was reduced by 43.2%, and the Mg element was more fully absorbed by the Al matrix.
3.2. Performance of Dissolution
3.2.1. Analysis of Dissolution Performance in Various Corrosive Media
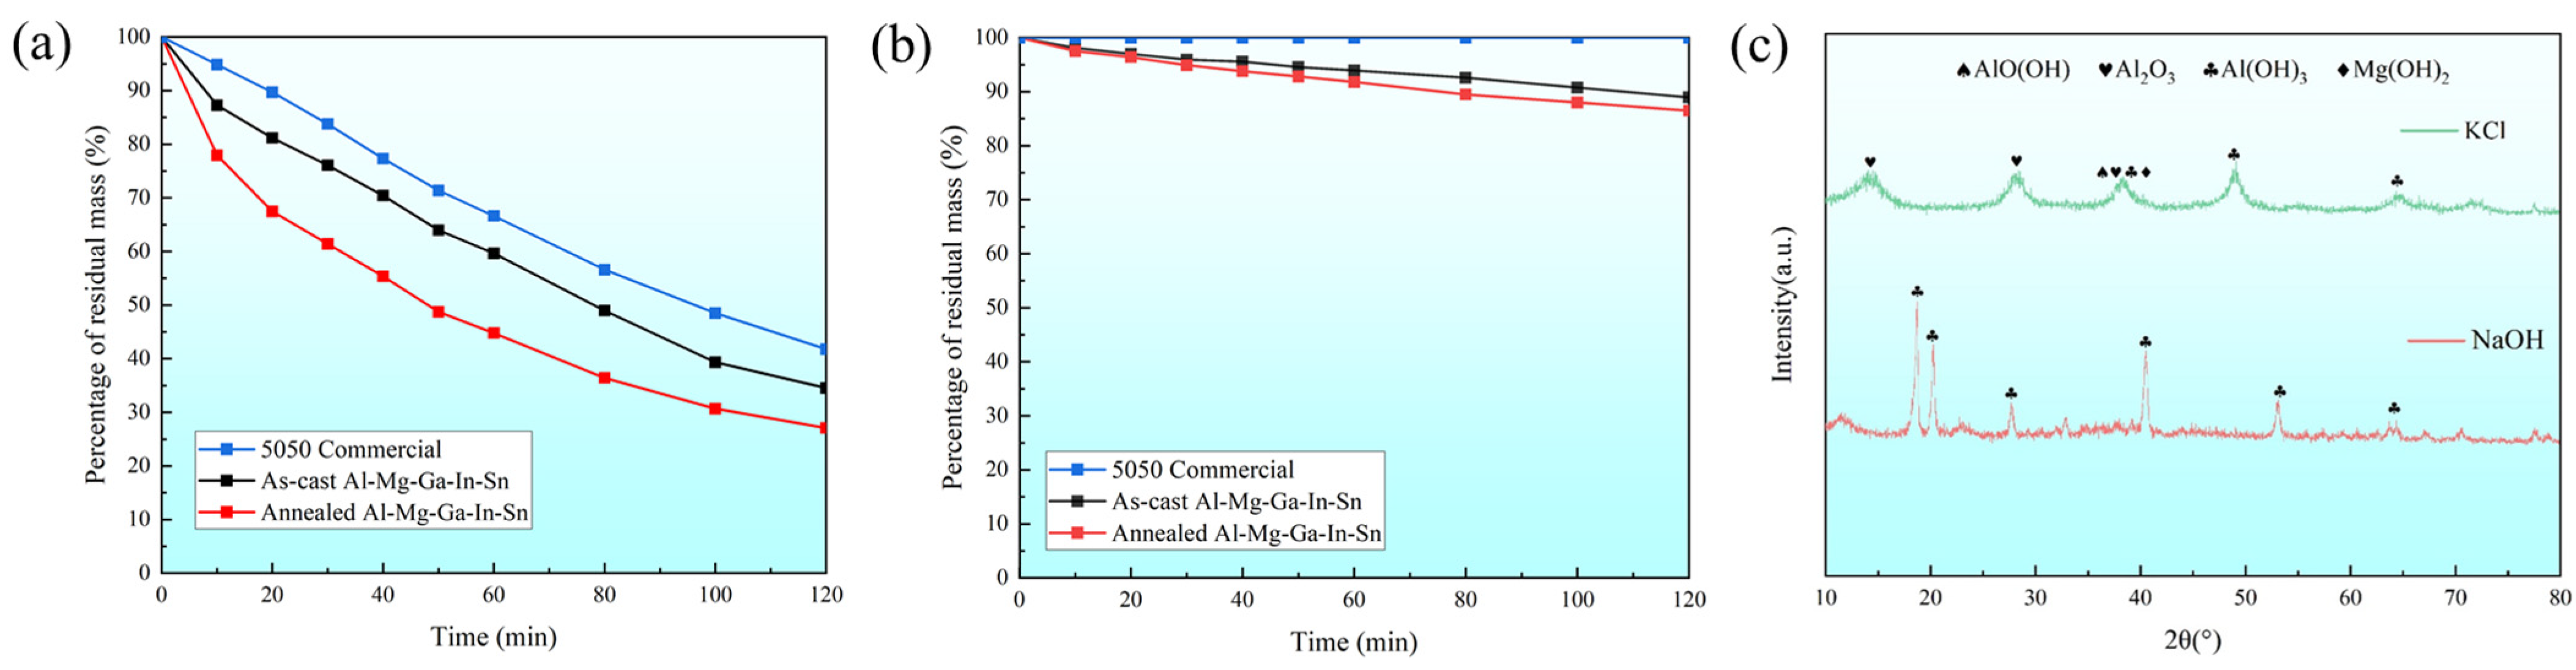
This study investigates the differences in dissolution rates of soluble Al-Mg-Ga-In-Sn alloy in various corrosive media compared to the control group, which utilized 5050 commercial aluminum alloy. Specifically, we examine the dissimilarities between the as-cast and the typical annealed (490 °C for 2.5 h) Al-Mg-Ga-In-Sn alloy. Figure 5a illustrates the relationship between residual mass percentage and time in a 3% NaOH medium at 93 °C, while Figure 5b depicts the corresponding curve in a 3% KCl medium at 93 °C.
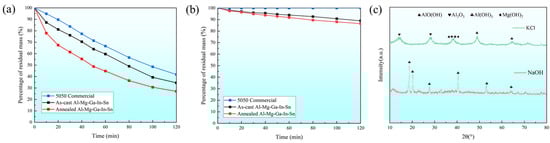
Figure 5.
Dissolution curves and XRD images: (a) 3% NaOH medium at 93 °C; (b) 3% KCl medium at 93 °C. (c) XRD images of dissolved products in two solutions.
By comparison, it can be observed that the residual mass percentage of the alloy is influenced by factors such as material composition, heat treatment state of the alloy, and test duration. The dissolution behavior of the alloy follows a specific pattern: over time, aluminum alloy exhibits a more rapid dissolution rate in alkaline solutions compared to saline solutions. Moreover, regardless of the different solutions, the dissolution rate of different alloys displays a similar order: the annealed Al-Mg-Ga-In-Sn alloy demonstrates the most rapid dissolution rate followed by the as-cast, while 5050 commercial aluminum alloy exhibits the slowest dissolution rate.
3.2.2. Analysis of Dissolved Products
Further analysis was conducted on the products obtained from the as-cast dissolution experiment on the Al-Mg-Ga-In-Sn alloy. Figure 5c presents the X-ray diffraction pattern of the dissolution products, revealing that the phase composition after dissolution in a 3% NaOH medium at 93 °C predominantly consisted of Al(OH)3 with a minor presence of Mg(OH)₂ and Al₂O3 phases. Moreover, when dissolved in a 3% KCl medium at 93 °C, not only did the aforementioned microstructural phases emerge but also a novel AlO(OH) phase formed, thereby confirming the occurrence of an Al–water reaction.
There is a disparity in the dissolution rate between the 5050 commercial aluminum alloy and soluble Al-Mg-Ga-In-Sn alloy due to (1) in a 3% KCl solution environment, the limited availability of OH− ions restricts the reactivity of the 5050 commercial aluminum alloy, resulting in negligible dissolution; however, the presence of the Al–water reaction enables significant dissolution for the soluble Al-Mg-Ga-In-Sn alloy. (2) In a 3% NaOH solution environment, while the spontaneously formed aluminum oxide film on the surface of the 5050 commercial aluminum alloy can chemically react with sufficient OH−, it does not generate hydrogen gas. The soluble Al-Mg-Ga-In-Sn alloy can directly undergo the Al–water reaction, while the aluminum oxide film can chemically react with NaOH, both of which result in simultaneous consumption of aluminum, leading to an accelerated dissolution rate.
3.3. Electrochemical Performance
3.3.1. Experimental Investigation of Open Circuit Potential
The open circuit potential at room temperature was investigated, with the as-cast and typical annealed states (490 °C, 2.5 h) serving as experimental groups alongside a control group of 5050 commercial aluminum alloy. The obtained results are presented in Table 4. Under a 3% NaOH solution, the open circuit potential of the annealed Al-Mg-Ga-In-Sn alloy was recorded as −1.610 V, while the as-cast counterpart exhibited a potential of −1.613 V; additionally, the 5050 commercial aluminum alloy displayed a potential of −1.537 V. Under a 3% KCl medium, the open circuit potential of the annealed Al-Mg-Ga-In-Sn alloy was measured at −1.480 V, whereas the as-cast sample showed a potential of −1.490 V; notably, the commercial alloy demonstrated a value of −0.818 V.
Table 4.
Open circuit potential of the three aluminum alloy samples.
The data analysis reveals that the open circuit potential of the 5050 commercial aluminum alloy is significantly more positive. Moreover, the open circuit potential of the annealed Al-Mg-Ga-In-Sn alloy is essentially equivalent to that of the as-cast alloy, with a slightly more positive value observed in the annealed state. This can be attributed to the fact that annealing heat treatment promotes increased solubility of active elements within the matrix while reducing their presence on the surface, thereby resulting in a more positive open circuit potential for the annealed Al-Mg-Ga-In-Sn alloy compared to its as-cast counterpart.
3.3.2. The Polarization Curve of Dynamic Potential
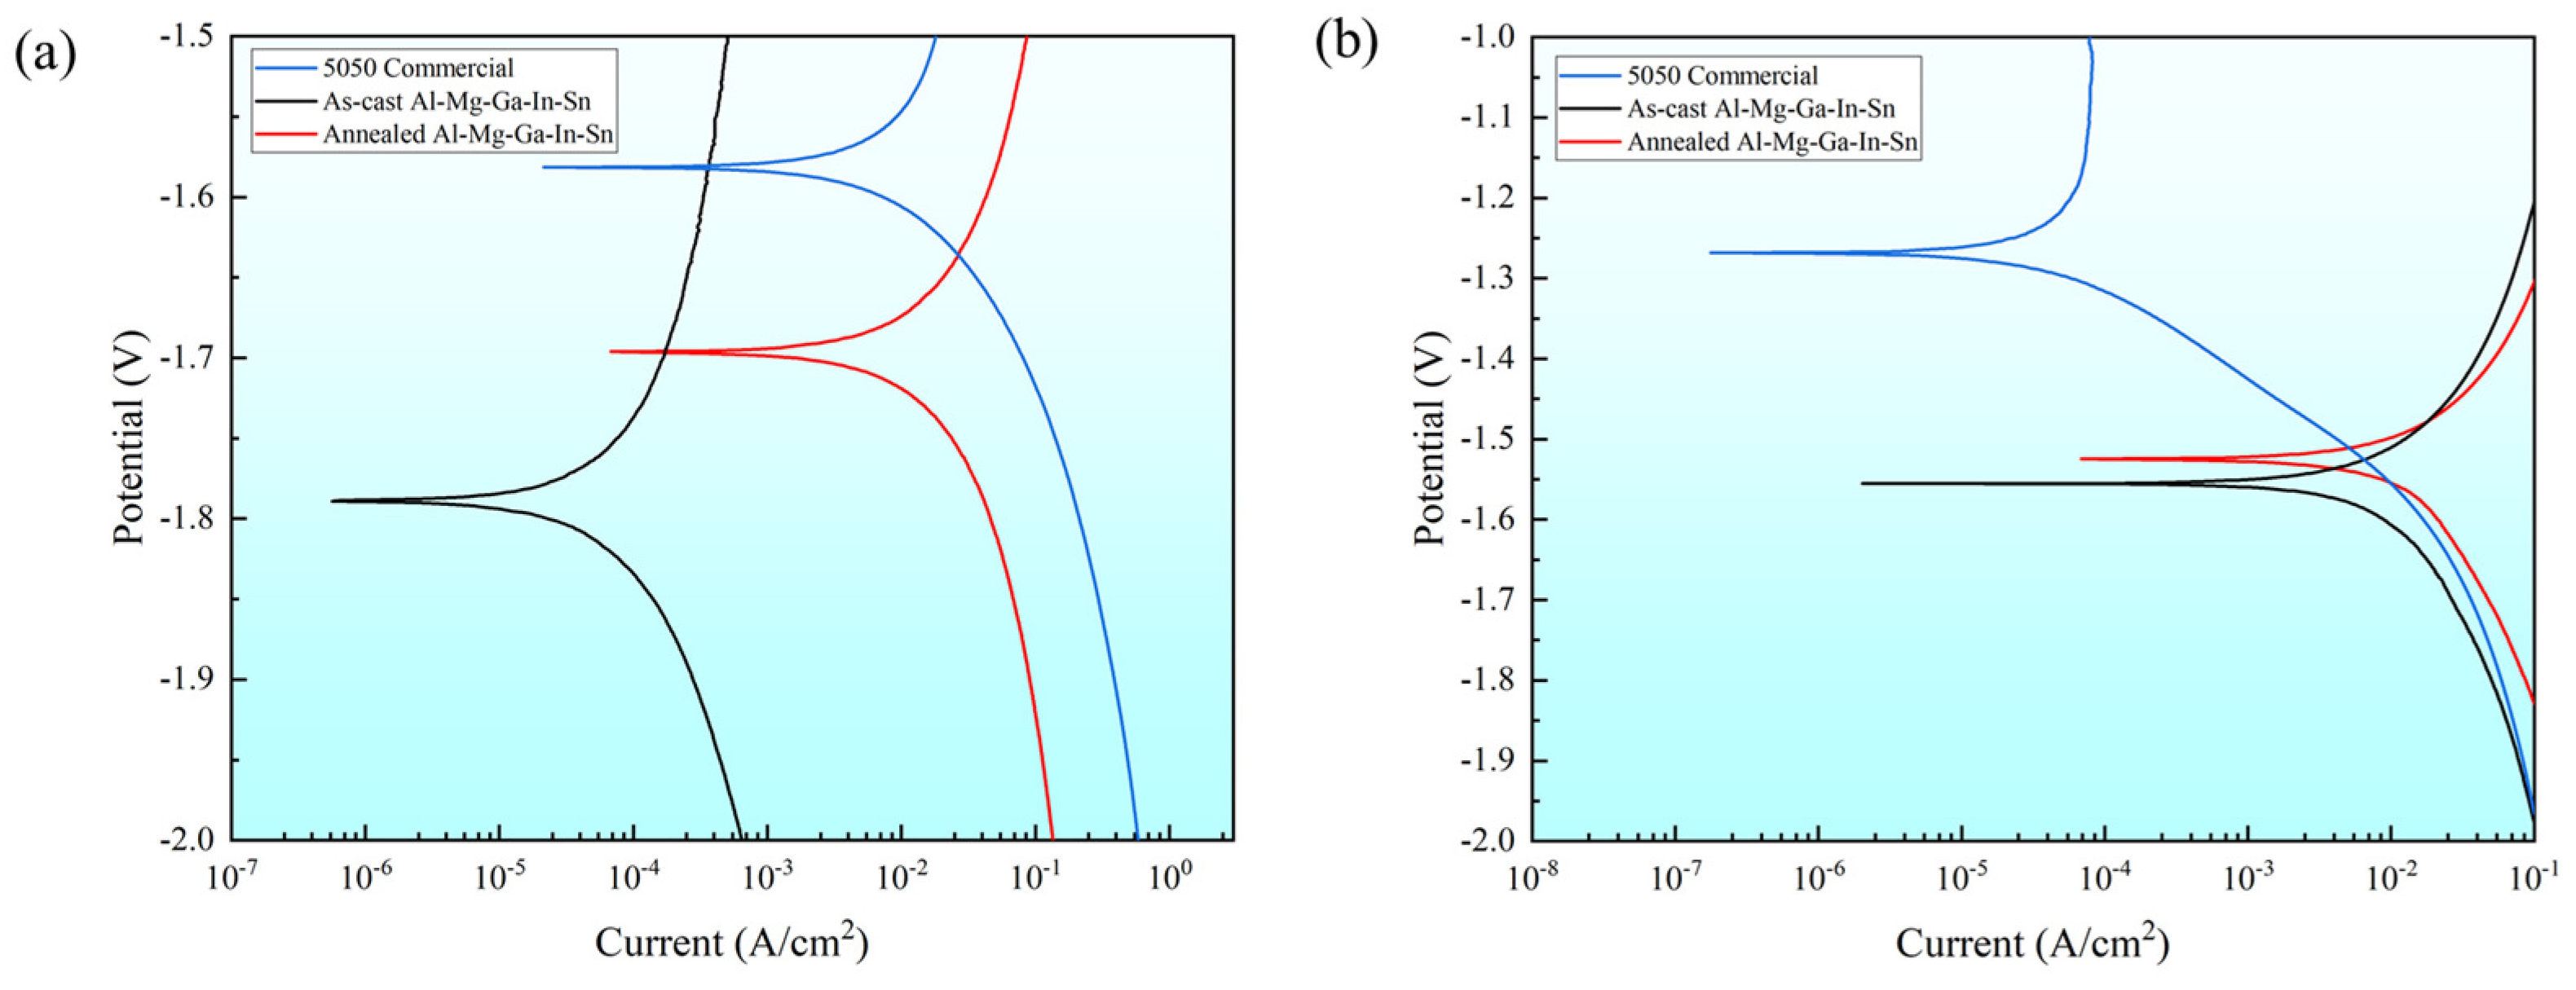
The polarization curves of the as-cast and typical annealed state (490 °C, 2.5 h) were investigated, along with the 5050 commercial aluminum alloy as the control group. Figure 6 illustrates the polarization curves of these three samples in two different solution environments, while Table 5 presents the corresponding numerical fitting results.
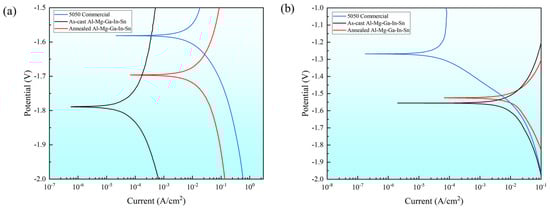
Figure 6.
Polarization curve in solution environment: (a) 3% NaOH solution; (b) 3% KCl solution.
Table 5.
Curve-fitting results of dynamic potential polarization curves.
Comparison of the corrosion potentials revealed that in a 3% KCl solution environment the corrosion potential ranking order of the three samples was as follows: the as-cast Al-Mg-Ga-In-Sn alloy exhibited the most negative potential at −1.56 V, followed by the annealed alloy at −1.53 V, and the 5050 commercial alloy displayed −1.27 V. Similarly, in a 3% NaOH solution environment, the same ranking order was observed. Therefore, it can be concluded that the corrosion potential of the 5050 commercial alloy is higher than that of the annealed Al-Mg-Ga-In-Sn alloy, while the annealed alloy exhibits a higher potential compared to the as-cast alloy.
Comparison of corrosion currents: In a 3% KCl solution environment, the corrosion currents of the three samples ranked as follows: the annealed Al-Mg-Ga-In-Sn alloy exhibited the largest corrosion current at 6.80 × 10⁻⁵ A·cm2, followed by the as-cast at 2.01 × 10⁻⁶ A·cm2, and finally, the least corrosion current was observed in 5050 commercial at 1.77 × 10⁻⁷ A·cm2. There exists an order of magnitude difference among these three values. In a 3% NaOH solution environment, it was found that the largest current was obtained for the annealed sample at 6.75 × 10⁻⁵ A·cm2, followed by the commercial sample at 2.14 × 10⁻⁵ A·cm2, while the as-cast sample showed the lowest value at 5.66 × 10⁻⁷ A·cm2. These results indicate that in both solution environments, the annealed condition leads to large corrosion current.
Comparison of solution environments: The corrosion potential of the three samples is higher in an alkaline solution environment compared to a saline solution environment, and this trend is evident. However, no consistent correlation between the corrosion current and the solution environment was observed. Specifically, the corrosion current of 5050 commercial alloy in a 3% KCl solution environment was only one percent of that in a 3% NaOH solution environment, indicating significant susceptibility to changes in the surrounding medium. Conversely, the corrosion current behavior of the soluble Al-Mg-Ga-In-Sn alloy did not follow a similar pattern as that of the 5050 commercial alloy; even the as-cast alloy exhibited larger corrosion currents in saline solutions than in alkaline solutions.
The corrosion current was determined by the ratio of the difference in corrosion potential and the total resistance in an electrochemical equivalent circuit. Both a more negative corrosion potential (Ecorr) and a larger corrosion current (Icorr) correspond to a more rapid metal dissolution rate. In both solution environments, the dissolution behavior of the soluble Al-Mg-Ga-In-Sn alloy surpasses that of the 5050 commercial alloy; Further analysis reveals that the corrosion potential of the annealed Al-Mg-Ga-In-Sn alloy is slightly positive, while its corrosion current is 34 times larger than that of the as-cast counterpart. It can be inferred that microstructural changes induced by annealing significantly amplify the corrosion current and make the annealed alloy exhibit the rapidest dissolution rate.
3.3.3. Electrochemical Impedance Spectroscopy
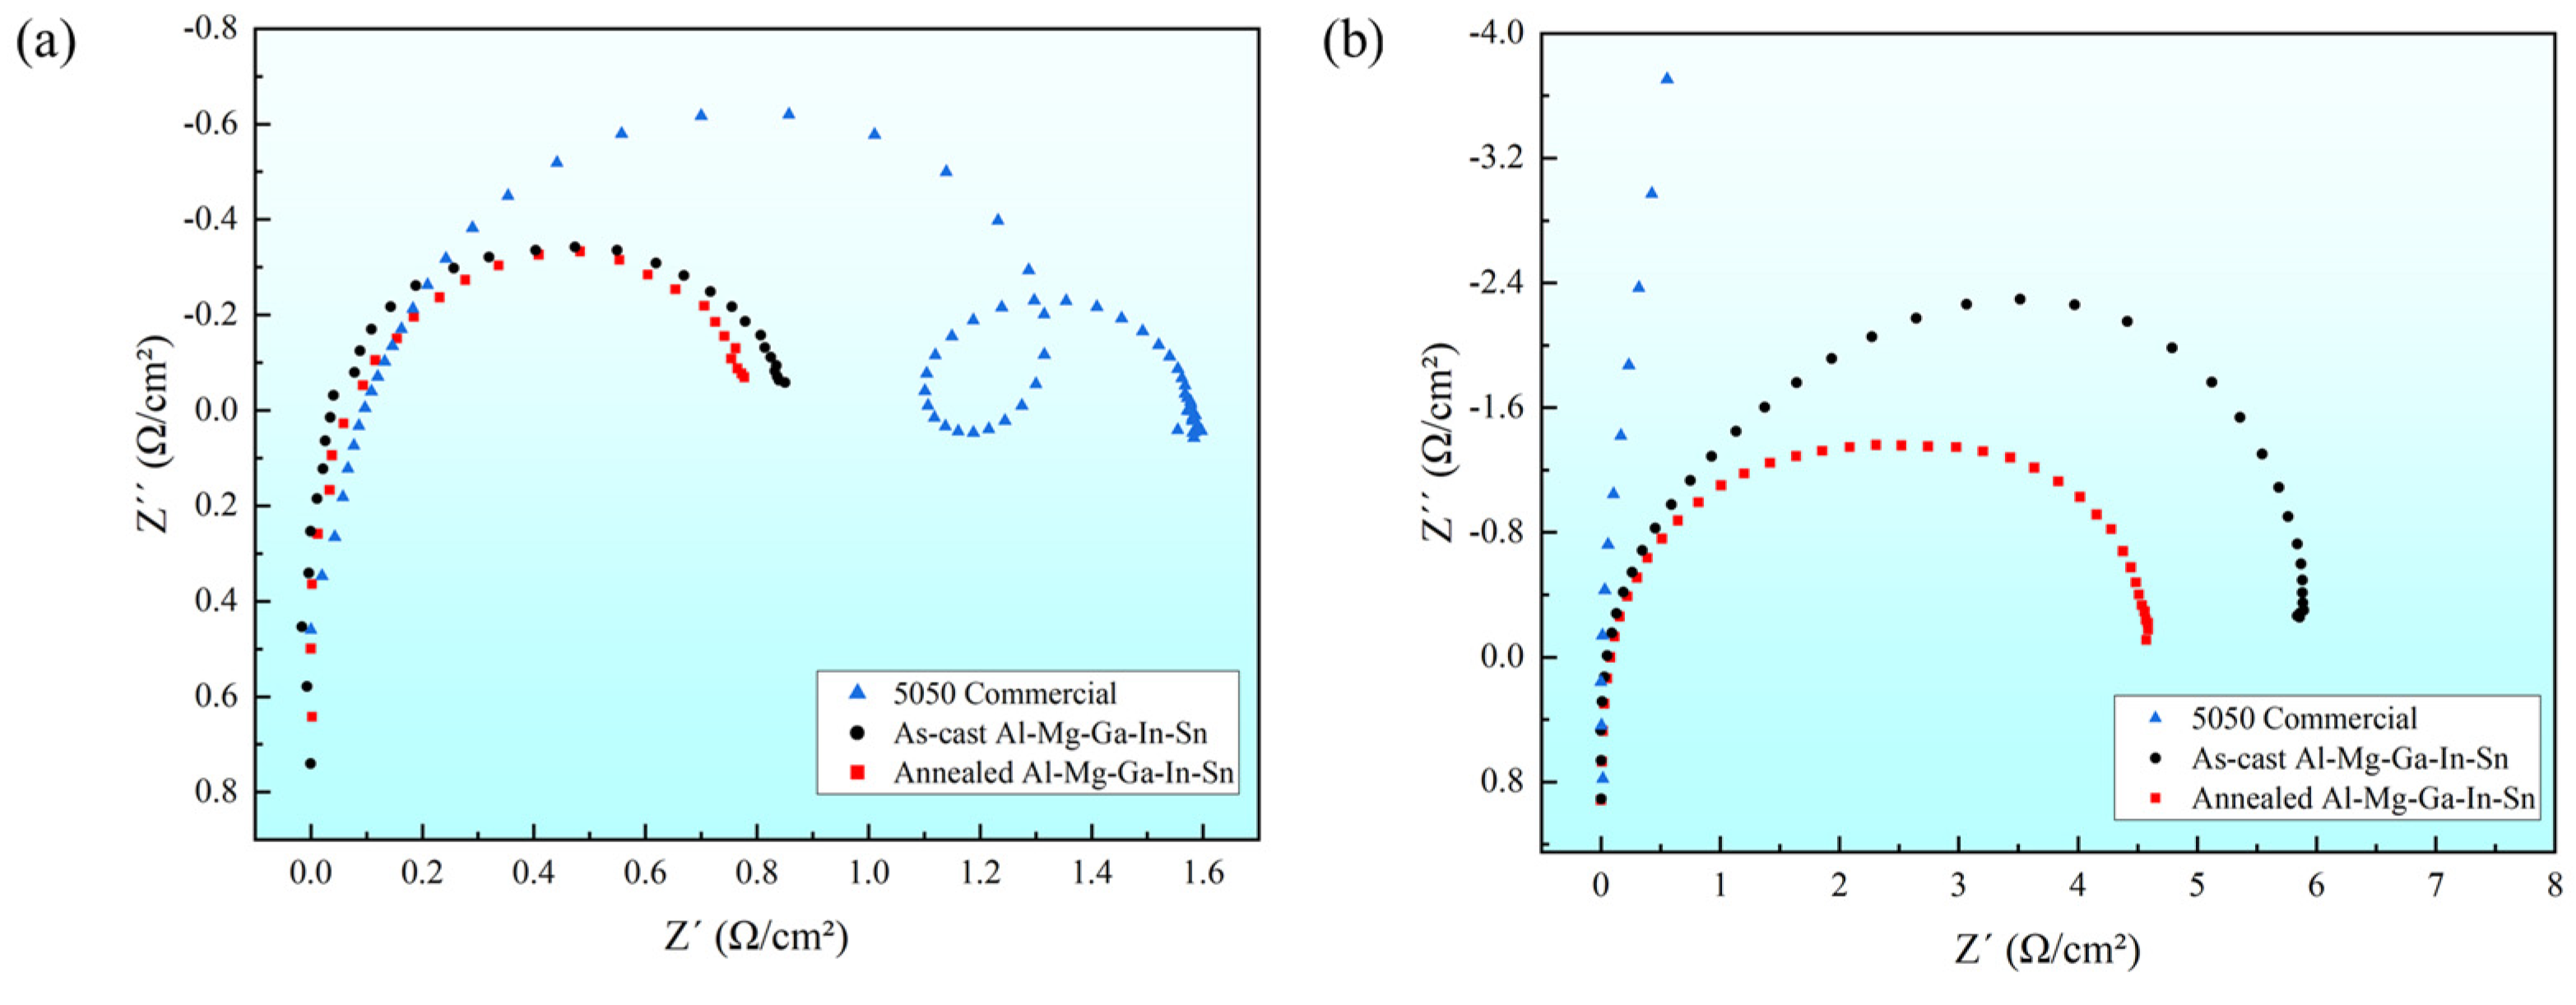
The curve radius of electrochemical impedance spectroscopy represents the interface resistance (Re) between the electrolyte and electrode. A larger radius indicates a higher impedance, implying a slower rate of electrochemical reaction on the material surface. In this study, we investigated the electrochemical impedance spectra in two solution environments: 5050 commercial alloy, and the as-cast and typical annealed state (490 °C, 2.5 h) Al-Mg-Ga-In-Sn alloys, as illustrated in Figure 7.
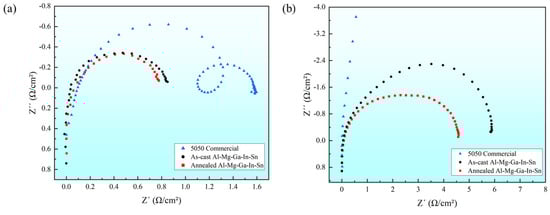
Figure 7.
Electrochemical impedance spectroscopy: (a) 3% NaOH solution; (b) 3% KCl solution.
It is evident that in a 3% NaOH solution environment, the radius and impedance of the 5050 commercial alloys are significantly larger, while those of the annealed and as-cast Al-Mg-Ga-In-Sn alloys are relatively smaller and similar. In a 3% KCl solution environment, the radius and impedance of the 5050 commercial alloys exhibit an increased magnitude, whereas those of the soluble Al-Mg-Ga-In-Sn alloys demonstrate small values. This observation aligns with the corrosion potential test results obtained from the polarization curves, further indicating the superior dissolution performance of the soluble Al-Mg-Ga-In-Sn alloy compared to its commercial counterpart.
According to the principles of electrochemistry, the state of the oxide layer on the sample’s surface has an impact on the electrochemical impedance under identical solution concentrations. In a 3% KCl solution environment, the presence of an aluminum oxide film on the 5050 commercial alloy electrode (sample) impedes electrochemical reactions, resulting in increased impedance and reduced corrosion current. Furthermore, it is evident that in a 3% KCl solution environment, the impedance of the annealed Al-Mg-Ga-In-Sn alloy is significantly lower than that of the as-cast alloy, indicating a substantial reduction in hindrance caused by the aluminum oxide film.
3.4. The Testing of Mechanical Performance
After conducting tensile testing, the stress–strain curves of the soluble Al-Mg-Ga-In-Sn alloy were obtained; representative curves were selected and are depicted in Figure 8. The as-cast Al-Mg-Ga-In-Sn alloy exhibited a tensile strength of 142.34 MPa and an elongation of 19.86%. Relatively, the annealed alloy demonstrated a higher tensile strength of 151.76 MPa along with an increased elongation of 26.43%. These results clearly indicate a significant enhancement in both tensile strength and ductility following the annealing process. The key to the design of new soluble aluminum alloys lies in their controllable dissolution performance and excellent mechanical properties under complex working conditions. The tensile strength requirement for the 5050 commercial aluminum alloy is a minimum of 160 MPa, with an elongation at break of at least 15%. In comparison, the soluble Al-Mg-Ga-In-Sn alloy in this study exhibits high ductility and overall satisfactory performance. Additionally, it possesses dissolution characteristics that are absent in 5050 commercial aluminum alloys.
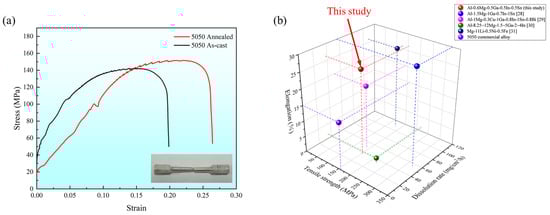
Figure 8.
(a) Stress–strain curve of soluble Al-Mg-Ga-In-Sn alloy; (b) 3D comparison chart of elongation, dissolution rate, and tensile strength.
Comparison with other soluble alloys: Table 6 shows the performance data of soluble alloys obtained by the melting-casting method. It can be seen that the properties of this study’s alloy are comparable to other alloys. For example, the tensile strength of Mg9Li1Sn alloy is 126.08 MPa and the elongation is 23.92% [25]. The tensile strength of Al-1.5Mg-0.1Ga-0.7In-0.6Sn alloy is 130 MPa and the elongation is 25%–30% [26]. When the Mg content of the alloys increased significantly (>5%), the tensile strength increased, but the ductility decreased significantly. The economy of the soluble Al-Mg-Ga-In-Sn alloy in this study is better when the performance requirements are met.
Table 6.
Comparison of properties of soluble alloys.
4. Discussion
4.1. Effect of Annealing Treatment on Microstructure Morphology
The annealing heat treatment induces a transformation in the secondary phase of the soluble Al-Mg-Ga-In-Sn alloy, transitioning it from point-like and block-like discontinuous particles in the as-cast state to a strip-like continuous intergranular phase which envelops the Al matrix in the annealed state. Simultaneously, it promotes solubility of the secondary phase and volume reduction of non-matrix regions while refining the grains. Different annealing temperatures may influence the volume of non-matrix regions but have minimal impact on distribution.
4.2. The Impact of the Distribution and Morphology of Second Phase on Electrochemical Performance
A potential difference exists between the alloy phase, compounds, and other second phases and the Al matrix, resulting in the formation of a micro-corrosion primary cell (microcell) that accelerates dissolution [5,23]. In comparison to Al-Ga-In-Sn quaternary alloys, the soluble Al-Mg-Ga-In-Sn alloy contains the Mg element. At grain boundaries, some magnesium compounds (mainly Mg2Sn) exhibit a more negative electrode potential than the matrix [32], enabling the formation of a corrosion couple with an Al matrix as the cathode and a second phase as the anode.
The melting and diffusion of active elements during annealing lead to an increase in matrix potential and potential difference between the secondary-phase anode and Al matrix. Additionally, the strip-like distribution of the secondary phase along grain boundaries increases its contact area with the Al matrix, resulting in more microcells and electrochemical reaction points between individual grains and the secondary phase. This leads to a more rapid damage rate to the overall oxide film during reaction.
4.3. The Impact of the Distribution and Morphology of Second Phase on Dissolution Performance
Due to the presence of Ga, the continuity and density of the inert aluminum oxide film on the aluminum surface are diminished, thereby facilitating the solubility of Al atoms into the GIS eutectic phase and their subsequent reaction with water [33]. The exothermic nature of these reactions allows for their theoretical spontaneous occurrence.
2Al + 4H2O → 2AlO(OH) + 3H2
2Al + 6H2O → 2Al(OH)3 + 3H2
During electrochemical reactions, the Mg2Sn anode undergoes dissolution and exothermic reaction with water, resulting in the generation of Mg(OH)2 and H2 while precipitating the Sn element. The alternating distribution of Mg2Sn and In3Sn leads to continuous deposition of the precipitated Sn element onto nearby aluminum, thereby expanding the area of the secondary phase. This chemical reaction and physical change facilitate enhanced destruction of aluminum oxide films during the early dissolution stage, leading to reduced impedance between grain boundaries and the matrix in the equivalent circuit, ultimately increasing the corrosion current.
As previously mentioned, the Al–water reaction and electrochemical reaction initially occur at the grain boundary in the secondary-phase position. The disruption of the aluminum oxide film enhances the continuity of these reactions, leading to a reduction in intergranular bonding strength. Simultaneously, the liberation of H2 from these reactions induces compression and expansion between grains, facilitating detachment of reaction products and loosening as well as separation of grains.
The secondary phase of the as-cast Al-Mg-Ga-In-Sn alloy is observed to be distributed in point-like and block-like discontinuous particles present at grain boundaries, as depicted in Figure 9a. It forms microcells with the Al matrix. Due to the dispersion of the secondary phase, there remains a fraction of unoccupied grain boundary area resulting in a limited number of microcells. Upon reaction, complete disconnection between adjacent grains is not achieved; instead, several or more grains combine to form larger grain units. Only when the Al–water reaction progresses significantly do these large grain units separate and detach from the overall structure.
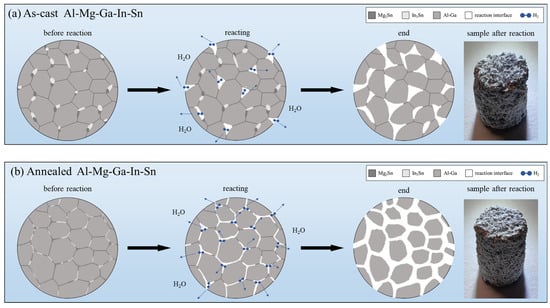
Figure 9.
Schematic representation of grain transformations in dissolution testing: (a) as-cast (b) annealed.
The microstructure of the annealed alloy undergoes changes, as depicted in Figure 9b, forming a strip-like continuous intergranular phase which envelops the Al matrix. This results in an increased contact area between the secondary phase and the Al matrix, leading to a higher number of microcells. Consequently, the electrochemical reaction progresses rapidly along the grain boundaries due to their larger interface for the Al–water reaction, thereby rendering the grain units more susceptible to loosening and detachment and ultimately resulting in an accelerated overall dissolution rate.
The dissolution rate of the soluble Al-Mg-Ga-In-Sn alloy is closely correlated with the distribution and morphology of the secondary phase, as revealed by analysis. Upon the establishment of a continuous distribution of the secondary phase along grain boundaries, an increased number of microcells are formed, thereby accelerating the overall electrochemical reaction rate. This phenomenon leads to an increased total interface area for Al–water reaction and facilitates rapid grain separation during the reaction process.
4.4. The Impact of the Distribution and Morphology of Second Phase on Mechanical Properties
After annealing, the average grain size of the soluble Al-Mg-Ga-In-Sn alloy decreases. Additionally, heat treatment results in a more uniform distribution of the secondary phase, eliminating internal stresses caused by casting. As a result, a material with enhanced mechanical properties is achieved. Compared to other soluble aluminum alloys, the annealed soluble Al-Mg-Ga-In-Sn alloy demonstrates a relatively balanced combination of strength and ductility that meets the material processing performance requirements for downhole tool manufacturing.
5. Conclusions
In the Al-Mg-Ga-In-Sn alloy, the secondary phase primarily consists of Mg2Sn and In3Sn. After annealing at 450 °C, the average grain size decreases due to the splits of large grains, and the secondary-phase volume decreases by 29.8% due to the re-melting of Mg elements. The Mg2Sn and In3Sn exhibit an alternating distribution pattern, transforming from point-like and block-like discontinuous particles in the as-cast state to a strip-like continuous intergranular phase which envelops the Al grains.
In both alkaline and salt solution environments, the dissolution rate transitions from rapid to low in the annealed state, the as-cast state, and in 5050 commercial alloy. Due to the chemical reaction between alumina film and OH−, the dissolution rate of the annealed alloy is the fastest in alkaline solution.
Annealing increases the number of microcells between the Mg2Sn anode and the Al matrix, leading to faster electrochemical reactions. The Sn released from the reactions destroys the aluminum oxide film, resulting in a rapid increase in the total contact area of the Al–water interface, which amplifies the corrosion current of the annealed alloy to more than 30 times that of the as-cast alloy. The main reason for accelerating the dissolution rate is the amplification of the corrosion current rather than potential.
The annealed alloy shows a tensile strength of 151.76 MPa and an impressive fracture elongation of 26.43%. The improved mechanical properties are caused by changes in the microstructure during heat treatment. It has great potential to replace the cost-prohibitive Mg-Li alloy used in the expandable sealing components in the realm of the petroleum industry.
Author Contributions
Conceptualization, B.Z. and K.Z.; methodology, B.Z. and K.Z.; software, B.Z.; validation, B.Z., Y.M., P.W., P.L., Y.G. and H.Z.; formal analysis, B.Z.; investigation, B.Z., P.W. and P.L.; resources, J.L.; data curation, B.Z.; writing—original draft preparation, B.Z.; writing—review and editing, B.Z., K.Z. and J.L.; visualization, B.Z. and K.Z.; supervision, K.Z.; project administration, K.Z. and J.L.; All authors have read and agreed to the published version of the manuscript.
Funding
This research gratefully acknowledges the support of the College Students’ Innovative Entrepreneurial Training Plan Program (No. S202310705075), Xi’an Science and Technology Plan Project (Program No. 21ZDJSGG-QCY2-0007). Xi’an Science and Technology Plan Project (Program No. 24XGFW0073).
Institutional Review Board Statement
Not applicable.
Informed Consent Statement
Not applicable.
Data Availability Statement
The original contributions presented in the study are included in the article, further inquiries can be directed to the corresponding authors.
Conflicts of Interest
The authors declare no conflicts of interest.
References
- Wilson, A. Controlled-electrolytic-metallics completion devices combine strength with dissolution. J. Pet. Technol. 2013, 65, 145–148. [Google Scholar] [CrossRef]
- Geng, Z.W.; Xiao, D.H.; Chen, L. Microstructure, mechanical properties, and corrosion behavior of degradable Mg-Al-Cu-Zn-Gd alloys. J. Alloys Compd. 2016, 686, 145–152. [Google Scholar] [CrossRef]
- Zheng, C.; Liu, Y.; Wang, H.; Qin, J.; Chen, C.; Zhang, S. Dissolvable fracturing tool based on a controlled electrolytic method. J. Pet. Sci. Eng. 2017, 153, 81–87. [Google Scholar] [CrossRef]
- Yang, J.; Wang, J.S.; Yin, J.L.; Han, Z.H. Microstructure and properties of soluble alloy used for fracturing separation tools. Mater. Mech. Eng. 2017, 41, 32–35. [Google Scholar] [CrossRef]
- Zhai, Z.G.; Sun, Y.N.; Meng, A.C.; Xu, Y.F. Study on hydrolysis mechanism and properties of aluminum alloy soluble fracturing ball. Hot Work. Technol. 2023. [Google Scholar] [CrossRef]
- Hui, W.; Sun, L.; Zhou, Y.; Gao, Y.; Zhai, W.; Dong, H.; Liu, Y.; Gao, Q.; Peng, J. Effect of Mg–Ga alloy intermetallic compounds on the properties of soluble aluminum alloy. Intermetallics 2022, 144, 107501. [Google Scholar] [CrossRef]
- Du, B.; He, T.; Liu, G.; Chen, W.; Wang, Y.; Wang, W.; Chen, D. Al-water reactivity of Al-Mg-Ga-In-Sn alloys used for hydraulic fracturing tools. Int. J. Hydrog. Energy 2018, 15, 7201–7215. [Google Scholar] [CrossRef]
- Kumar, D.; Muthukumar, K. An overview on activation of aluminum-water reaction for enhanced hydrogen production. J. Alloys Compd. 2020, 835, 155189. [Google Scholar] [CrossRef]
- Liu, J.L.; Shao, Z.F.; Zhang, X.B. Development of a high-strength soluble aluminum alloy and its application in oil pressure cracking. Chem. Tech. Fuels Oil 2019, 6, 818–823. [Google Scholar] [CrossRef]
- Wang, W.; Chen, D.M.; Yang, K. Investigation on microstructure and hydrogen generation performance of Al-rich alloys. Int. J. Hydrog. Energy 2010, 35, 12011–12019. [Google Scholar] [CrossRef]
- Wang, W.; Zhao, X.M.; Chen, D.M.; Yang, K. Insight into the reactivity of Al-Ga-In-Sn alloy with water. Int. J. Hydrogen Energy 2012, 37, 2187–2194. [Google Scholar] [CrossRef]
- Wang, W.; Chen, W.; Zhao, X.M.; Chen, D.M.; Yang, K. Effect of composition on the reactivity of Al-rich alloys with water. Int. J. Hydrog. Energy 2012, 37, 18672–18678. [Google Scholar] [CrossRef]
- Li, E.H.; He, Z.; Sun, L.; Dong, H.; Zhai, W.Y. Analysis of Chinese patent of dissolvable aluminium alloy material used for downhole fracturing tools. Pet. Tubul. Goods Instrum. 2022, 8, 14–17. [Google Scholar]
- Liu, T.; Mu, G.H.; Song, J.; Cheng, S.N.; Liu, X.F.; Feng, B.; Jiang, M. Development and application of all-metal soluble bridge plug. Well Logging Technol. 2020, 44, 634–638. [Google Scholar]
- Lv, F.L. New soluble composite materials fracturing downhole tools used underground at home and abroad. Pet. Ind. Technol. 2015, 22, 135–136. [Google Scholar]
- Liu, N.; Chen, Z. Effect of Mg addition on hydrolysis hydrogen production of Al-Ga-In-Sn alloy. Trans. Mater. Heat Treat. 2022, 43, 19–26. [Google Scholar]
- Du, B.D.; Liu, J.; Wang, X.; Wang, W.; Chen, D. Effect of heat treatment on microstructure and Al-water reactivity of Al-Mg-Ga-In-Sn alloys. Chin. J. Mater. Res. 2021, 35, 25–35. [Google Scholar]
- Flamini, D.O.; Saidman, S.B. Electrochemical behaviour of Al-Zn-Ga and Al-In-Ga alloys in chloride media. Mater. Chem. Phys. 2012, 136, 103–111. [Google Scholar] [CrossRef]
- Moghanni-Bavil-Olyaei, H.; Arjomandi, J.; Hosseini, M. Effects of gallium and lead on the electrochemical behavior of Al-Mg-Sn-Ga-Pb as anode of high rate discharge battery. J. Alloy. Compd. 2017, 695, 2637–2644. [Google Scholar] [CrossRef]
- Baldwin, K.R.; Bates, R.I.; Arnell, R.D.; Smith, C.J.E. Aluminium-magnesium alloys as corrosion resistant coatings for steel. Corros. Sci. 1996, 38, 155–170. [Google Scholar] [CrossRef]
- Pogrebnjak, A.D.; Yakushchenko, I.V.; Sobol’, O.V.; Beresnev, V.M.; Kupchishin, A.I.; Bondar, O.V.; Lisovenko, M.A.; Amekura, H.; Kono, K.; Takeda, Y. Influence of Residual Pressure and Ion Implantation on the Structure, Elemental Composition, and Properties of (TiZrAlYNb)N Nitrides. Tech. Phys. 2015, 60, 1176–1183. [Google Scholar]
- Zhang, X.; Song, X.J.; Shi, H.X. Study and discussion on solubility of aluminum hydroxide in hydrochloric acid. Yunnan Metall. 2021, 50, 71–75. [Google Scholar]
- He, T.; Chen, W.; Wang, W.; Du, S.; Deng, S. Microstructure and hydrogen production of the rapidly solidified AI-Mg-Ga-In-Sn alloy. J. Alloys Compd. 2020, 827, 154290. [Google Scholar] [CrossRef]
- Yang, B.; Zhu, J.; Jiang, T.; Gou, Y.; Hou, X.; Pan, B. Effect of heat treatment on Al-Mg-Ga-In-Sn alloy for hydrogen generation through hydrolysis reaction. Int. J. Hydrog. Energy 2017, 42, 24393–24403. [Google Scholar] [CrossRef]
- Liu, X.H.; Yao, W.; Xiao, Y. Microstructure and mechanical properties of Mg-(9,11)Li-1 Snalloy. Foundry 2015, 64, 723–727. [Google Scholar]
- Guo, H.P.; Ma, N.; Zhu, J.F.; Chang, K.; Ji, S.Y.; Zhang, K.; Qin, Y. A High-Temperature Soluble Aluminum Alloy, Preparation Method and Application. CN114717456A, 8 July 2022. [Google Scholar]
- Ma, N.; Chang, K.; Zhu, J.F.; Guo, H.P.; Ji, S.Y.; Zhang, K.; Qin, Y. A High Ductility Soluble Aluminum Alloy, Preparation Method and Application. CN114686734A, 1 July 2022. [Google Scholar]
- Ma, Z.Q.; Ma, W. A High Ductility Soluble Aluminum Alloy, Preparation Method and Application. CN116005046B, 21 November 2023. [Google Scholar]
- Wang, X.; Xu, J.H.; Tim, D.; Yang, X.W.; Xu, D.K.; Wang, F.S.; Lin, Z.C.; Liu, Y.; Sang, Y.; Song, Y.; et al. A Soluble Aluminum Alloy. CN115637357A, 24 January 2023. [Google Scholar]
- Chai, D.L.; Fan, J.; Wang, R.; Han, J.Q. A High Ductility, Soluble Magnesium Lithium Alloy Material and Preparation Method. CN113355570A, 7 September 2021. [Google Scholar]
- Chen, X.L.; Yang, B.; Gu, Y.C.; Sun, Y.H.; Ren, J.; Song, G.S.; Wang, J.Q.; Chen, J.X. Research progress in strengthening of ultralight body-centered cubic(BCC) structured Mg-Li alloys. Spec. Cast. Nonferrous Alloys 2024, 44, 457–464. [Google Scholar]
- Wang, N.G.; Wang, R.C.; Peng, C.Q.; Feng, Y.; Zhang, C.; Zhang, J.P. Influence of alloying elements on electrochemical behavior and microstructure of Al anode materials. J. Cent. South Univ. (Sci. Technol.) 2010, 41, 495–499. [Google Scholar]
- Wang, F.Q.; Wang, H.H.; Jian, W.A.N.G.; Jia, L.U.; Ping, L.U.O.; Chang, Y.; Dong, S.J. Effects of low melting point metals (Ga, In, Sn) on hydrolysis properties of aluminum alloys. Trans. Nonferrous Met. Soc. China 2016, 26, 152–159. [Google Scholar] [CrossRef]


Disclaimer/Publisher’s Note: The statements, opinions and data contained in all publications are solely those of the individual author(s) and contributor(s) and not of MDPI and/or the editor(s). MDPI and/or the editor(s) disclaim responsibility for any injury to people or property resulting from any ideas, methods, instructions or products referred to in the content. |
© 2024 by the authors. Licensee MDPI, Basel, Switzerland. This article is an open access article distributed under the terms and conditions of the Creative Commons Attribution (CC BY) license (https://creativecommons.org/licenses/by/4.0/).