Article

The Etching Behaviour and Fluorine-Based-Plasma Resistance of YOF Coatings Deposited by Atmospheric Plasma Spraying

1
School of Materials Science and Engineering, Shanghai University, 333 Nanchen Road, Shanghai 200444, China
2
Shanghai Huali Integrated Circuit Corporation, 6 Liangteng Road, Pudong New Area, Shanghai 201314, China
3
Chongqing Genori Technology Co., Ltd., No.66, Sendi Avenue, Xipeng Town, Jiulongpo District, Chongqing 401326, China
4
Shanghai Collaborative Innovation Center of Intelligent Sensing Chip Technology, Shanghai 201800, China
5
Zhejiang Institute of Advanced Materials, Shanghai University, Jiashan 314113, China
*
Author to whom correspondence should be addressed.
Coatings 2024, 14(9), 1091; https://doi.org/10.3390/coatings14091091
Submission received: 2 July 2024 / Revised: 29 July 2024 / Accepted: 15 August 2024 / Published: 26 August 2024
(This article belongs to the Section Plasma Coatings, Surfaces & Interfaces)

Abstract

:
There is a high demand for plasma-resistant coatings that prevent the corrosion of the internal ceramic components of plasma etching equipment, thereby reducing particle contamination and process drift. Yttrium oxyfluoride (YOF) coatings were prepared using atmospheric plasma spraying (APS) with commercially available YOF/YF3 powder mixtures; namely YOF 3%, YOF 6%, and YOF 9%. The etching behaviour of YOF and yttrium oxide (Y2O3) coatings was investigated using an inductively coupled plasma consisting of NF3/He. X-ray photoelectron spectroscopy (XPS) showed that the YOF 6% coating had the thickest fluorinated layer. The scanning electron microscope (SEM) examination revealed that the YOF 6% coating showed exceptional resistance to erosion and generated a reduced quantity of contaminated particles in comparison to Y2O3. Consequently, it is more suitable as a protective material for the inner wall of reactors. The YOF coatings exhibit excellent stability and high resistance to erosion, indicating their appropriateness for use in the semiconductor industry.

1. Introduction

Plasma is utilised in several key semiconductor production processes, including etching and deposition. The frequency and length of plasma operations have grown in recent years due to advancements in manufacturing technologies. The internal components of the manufacturing equipment are extensively corroded by plasma etching, which uses a mixed gas containing fluorine gas. The fine particles (contamination particles) produced by this corrosion lead to defects in silicon substrates [1,2,3,4,5,6,7]. Furthermore, the reproducibility of etching from wafer to wafer in plasma etching techniques has emerged as a critical problem. Process drift, characterised by variations in etching speeds, uniformity, and selectivity, has been found to be produced by the fluorination of the inner chamber wall surfaces following fluorine plasma exposure [8,9,10].
Plasma-resistant coatings that prevent plasma corrosion of the inner ceramic components are necessary to reduce particle contamination and process drift. Yttrium oxide (Y2O3) is commonly used as a plasma-facing wall-coating material due to its high resistance to plasma and its lower etching rate compared to aluminum oxide (Al2O3) [11,12,13]. However, Y2O3 degrades when exposed to corrosive gases such as fluorine-based gases (CF4, C4F8, SF6, and NF3), which disassemble the Y-O bond structure. Consequently, researchers are currently working on developing compounds that possess superior anti-plasma capabilities compared to Y2O3 [14,15,16]. Yttrium oxyfluoride (YOF) is garnering attention as a new plasma-resistant material with the potential to replace Y2O3 [17,18,19,20,21,22]. YOF is a product produced when Y2O3 reacts with fluorine plasma, and it is more chemically stable compared to Y2O3. The enthalpy of formation energy for the metal–oxygen bonding of YOF is −392 kJ mol−1, which is lower than the value of −318 kJ mol−1 for Y2O3 [23,24,25,26,27]. Hence, there is ongoing research focused on the synthesis and efficient coating of YOF.
In this study, we employed APS (atmospheric plasma spraying) using commercially available powders as raw materials to fabricate YOF coatings. The synthesised coatings underwent exposure to a highly reactive fluorine plasma (NF3), and the changes in their surfaces were examined to assess their effectiveness as protective coating materials for chamber walls. X-ray photoelectron spectroscopy was conducted to examine the elemental and chemical composition changes on the surfaces of the coatings following fluorination and to verify the chemical stability of both samples. Additionally, the etching characteristics of Y2O3 and YOF coatings were examined using fluorine-based plasma etching conditions. The erosion mechanism of yttrium-based materials is analysed in relation to surface fluorination based on the obtained results.

2. Materials and Methods

Commercially purchased YOF/YF3 powder mixtures (Nippon Yttrium Co., Ltd., Omuta, Japan) with different YOF content (represented by oxygen wt% of 3%, 6%, and 9%), referred to as YOF 3%, YOF 6% and YOF 9%, and Y2O3 powder (Shin-Etsu Chemical Co., Ltd., Tokyo, Japan) was used as a feedstock coating material. Coatings of the YOF and Y2O3 powders were deposited on Al substrates with dimensions of 3 mm × 5 cm × 5 cm using atmospheric plasma spraying (APS) with a plasma spray system. A Lam Research Co. (Fremont, CA, USA) Kiyo EX inductively coupled plasma (ICP) etcher using NF3 and He gases as its plasma sources was employed for the plasma etching durability assessment. The etching chamber received NF3 and He gases at flow rates of 200 standard cubic centimeters per minute (sccm) and 500 sccm, respectively, while maintaining a constant pressure of 15 mTorr. The TCP radio frequency (RF) power and bias RF voltage were set to 1540 W and 330 V, respectively. The plasma exposure for coated substrates lasted 170 h, and the detailed processing parameters are provided in Table 1. X-ray diffraction (XRD, Ultima-IV) investigation was performed using Cu-Kα (λ = 1.5418 A ˚ ) radiation in the scanning range of 10–80° (2θ) and a scanning rate of 4°/min. Field emission scanning electron microscopy (FESEM, S-4300SE, Hitachi, Tokyo, Japan) was utilised to examine the cross-sectional and surface morphologies as well as the microstructures of coated and etched specimens using NF3 plasma. An Xplore 30 EDS detector (Oxford Instruments, Abingdon-on-Thames, UK) was used, and the Oxford software (AZtecOne 6.0 SP2) was employed for quantification. A Mitutoyo Surftest SJ-310 was used to measure the surface roughness of the sample. The porosity was obtained by processing the color distribution of the SEM image through software (Granularity, Version 1.0.2-release). The microstructure of the cross-section of the coating was characterised via TEM (F200S, Thermoscientific Talos, Waltham, MA, USA). X-ray photoelectron spectroscopy (K-Alpha, Thermo Scientific, Waltham, MA, USA) was operated using a monochromatic Al-Kα X-ray source at a passing energy of 50 eV with a spot size of 450 μm. The subsurface elemental compositions were evaluated utilising depth profiling (Ar+ ions) on the etched surface for 300 s at 30 s intervals.

3. Results and Discussion

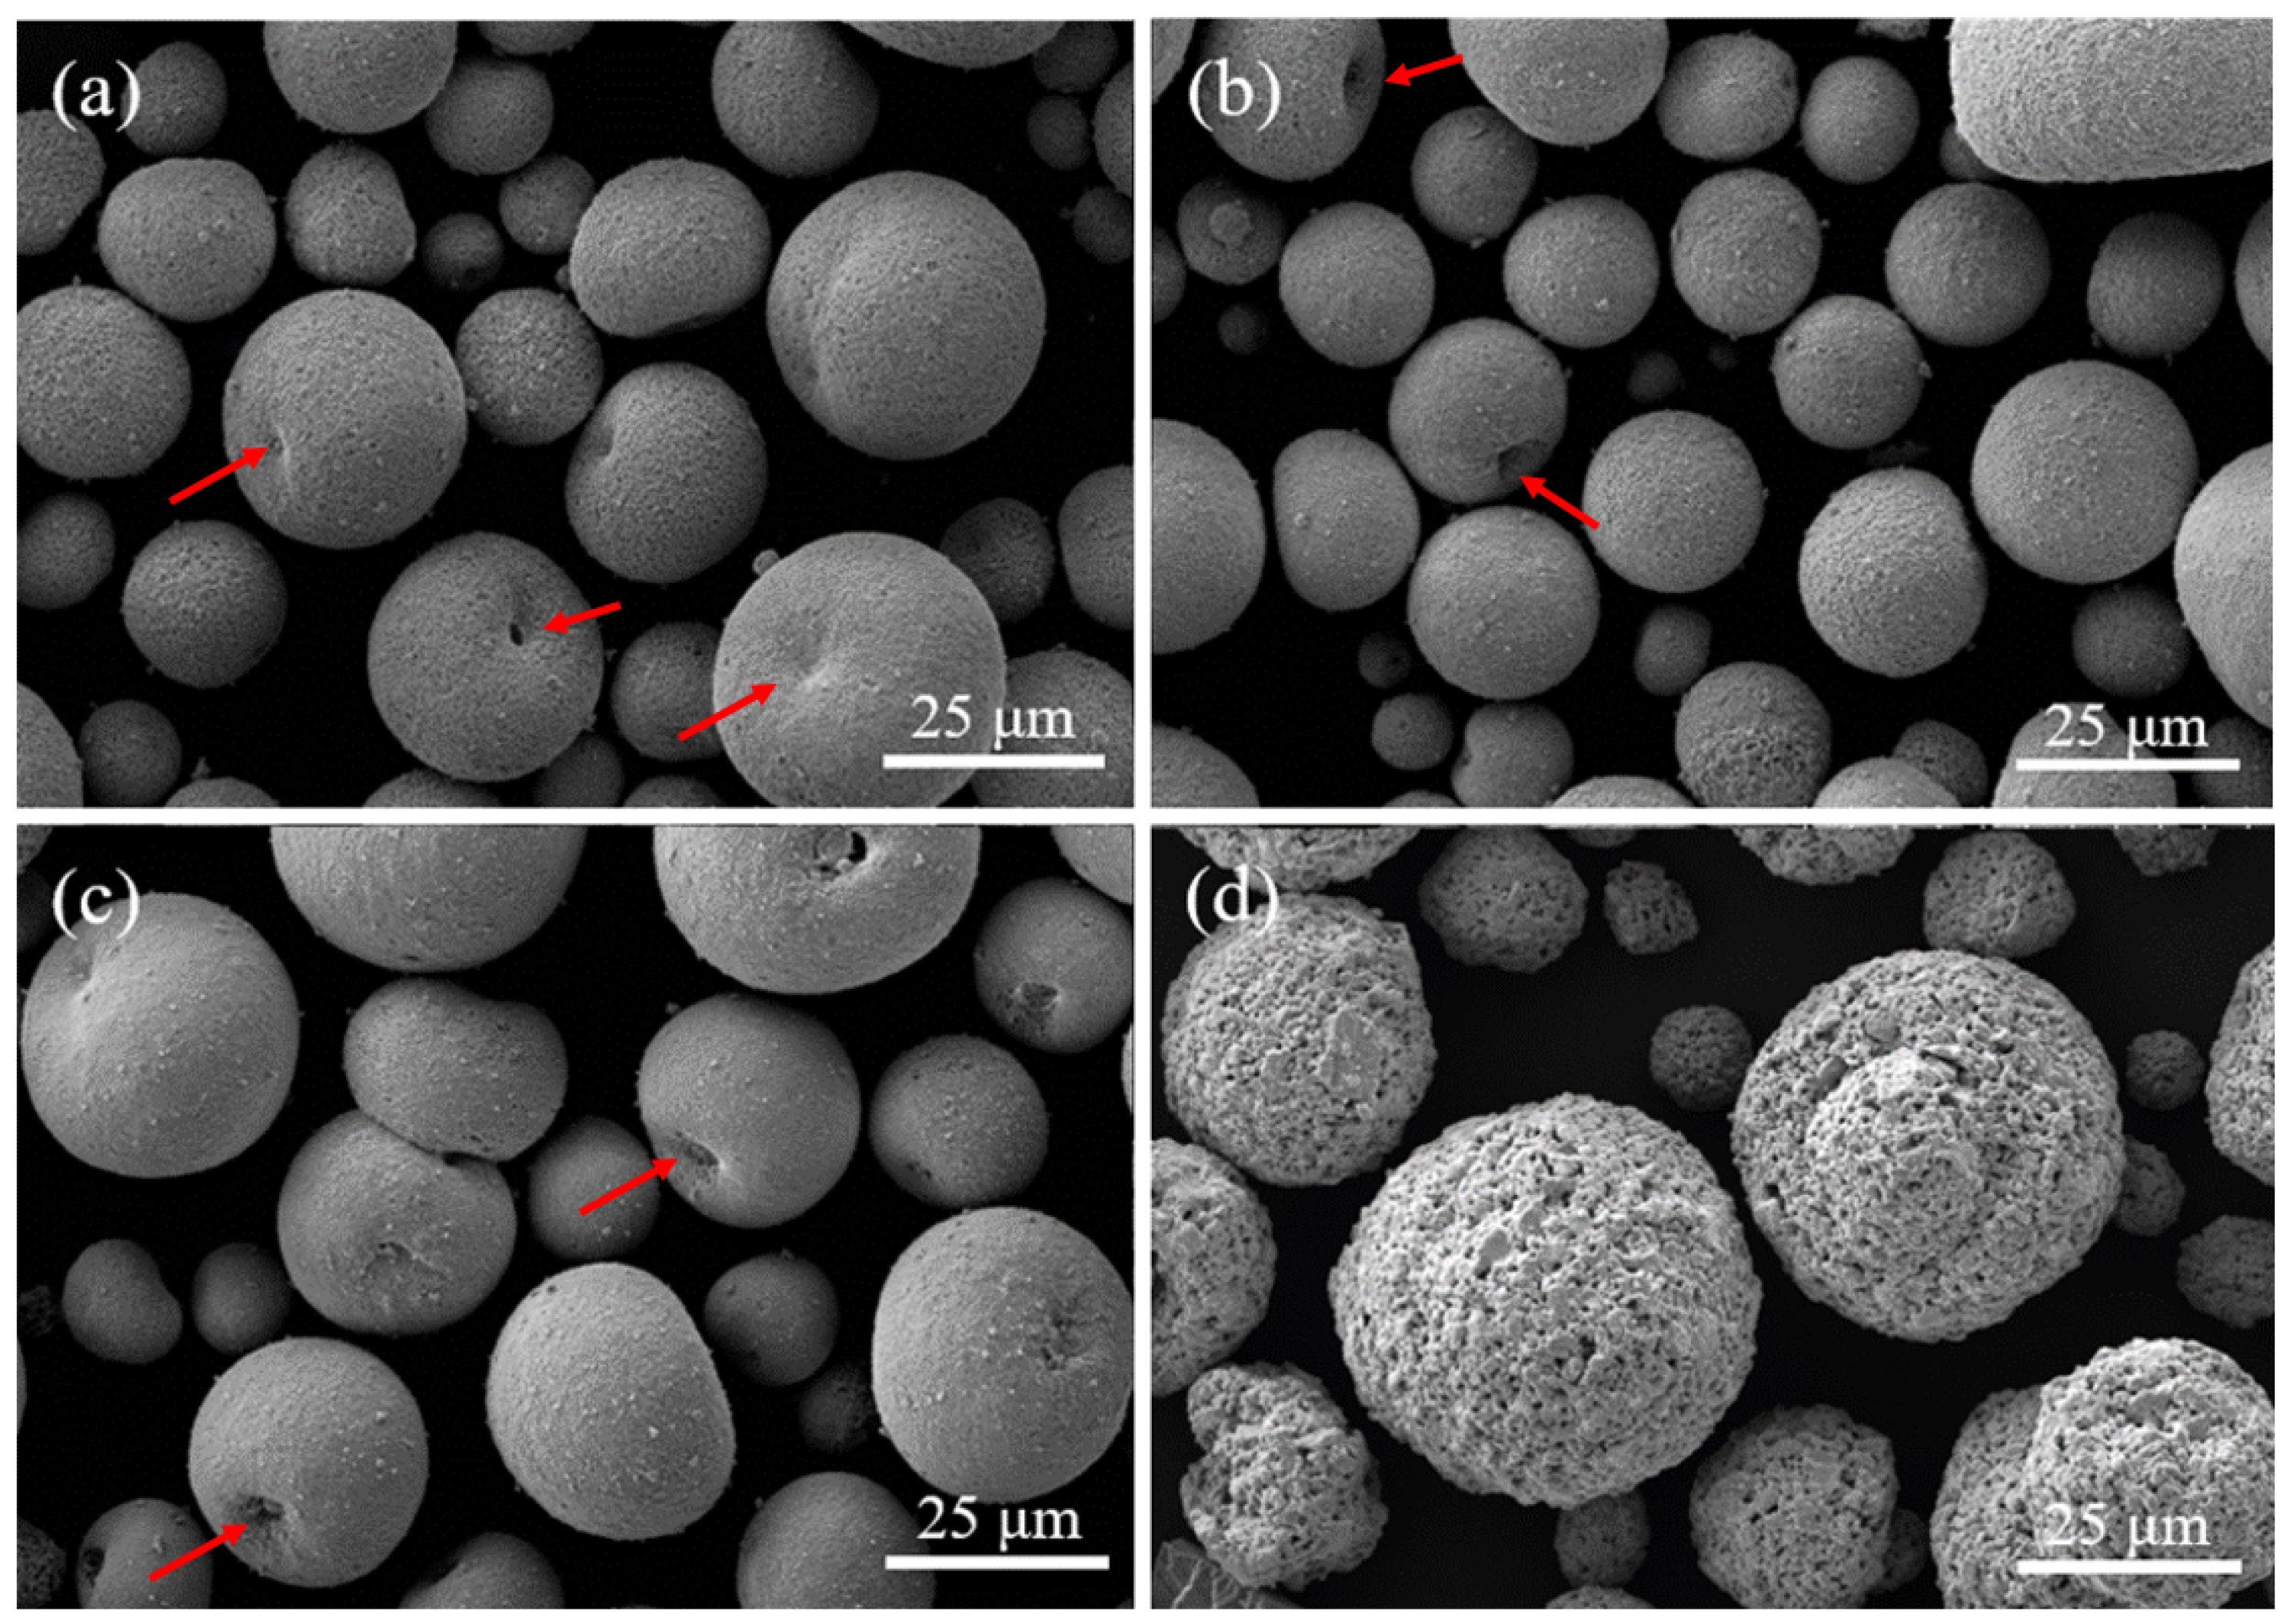
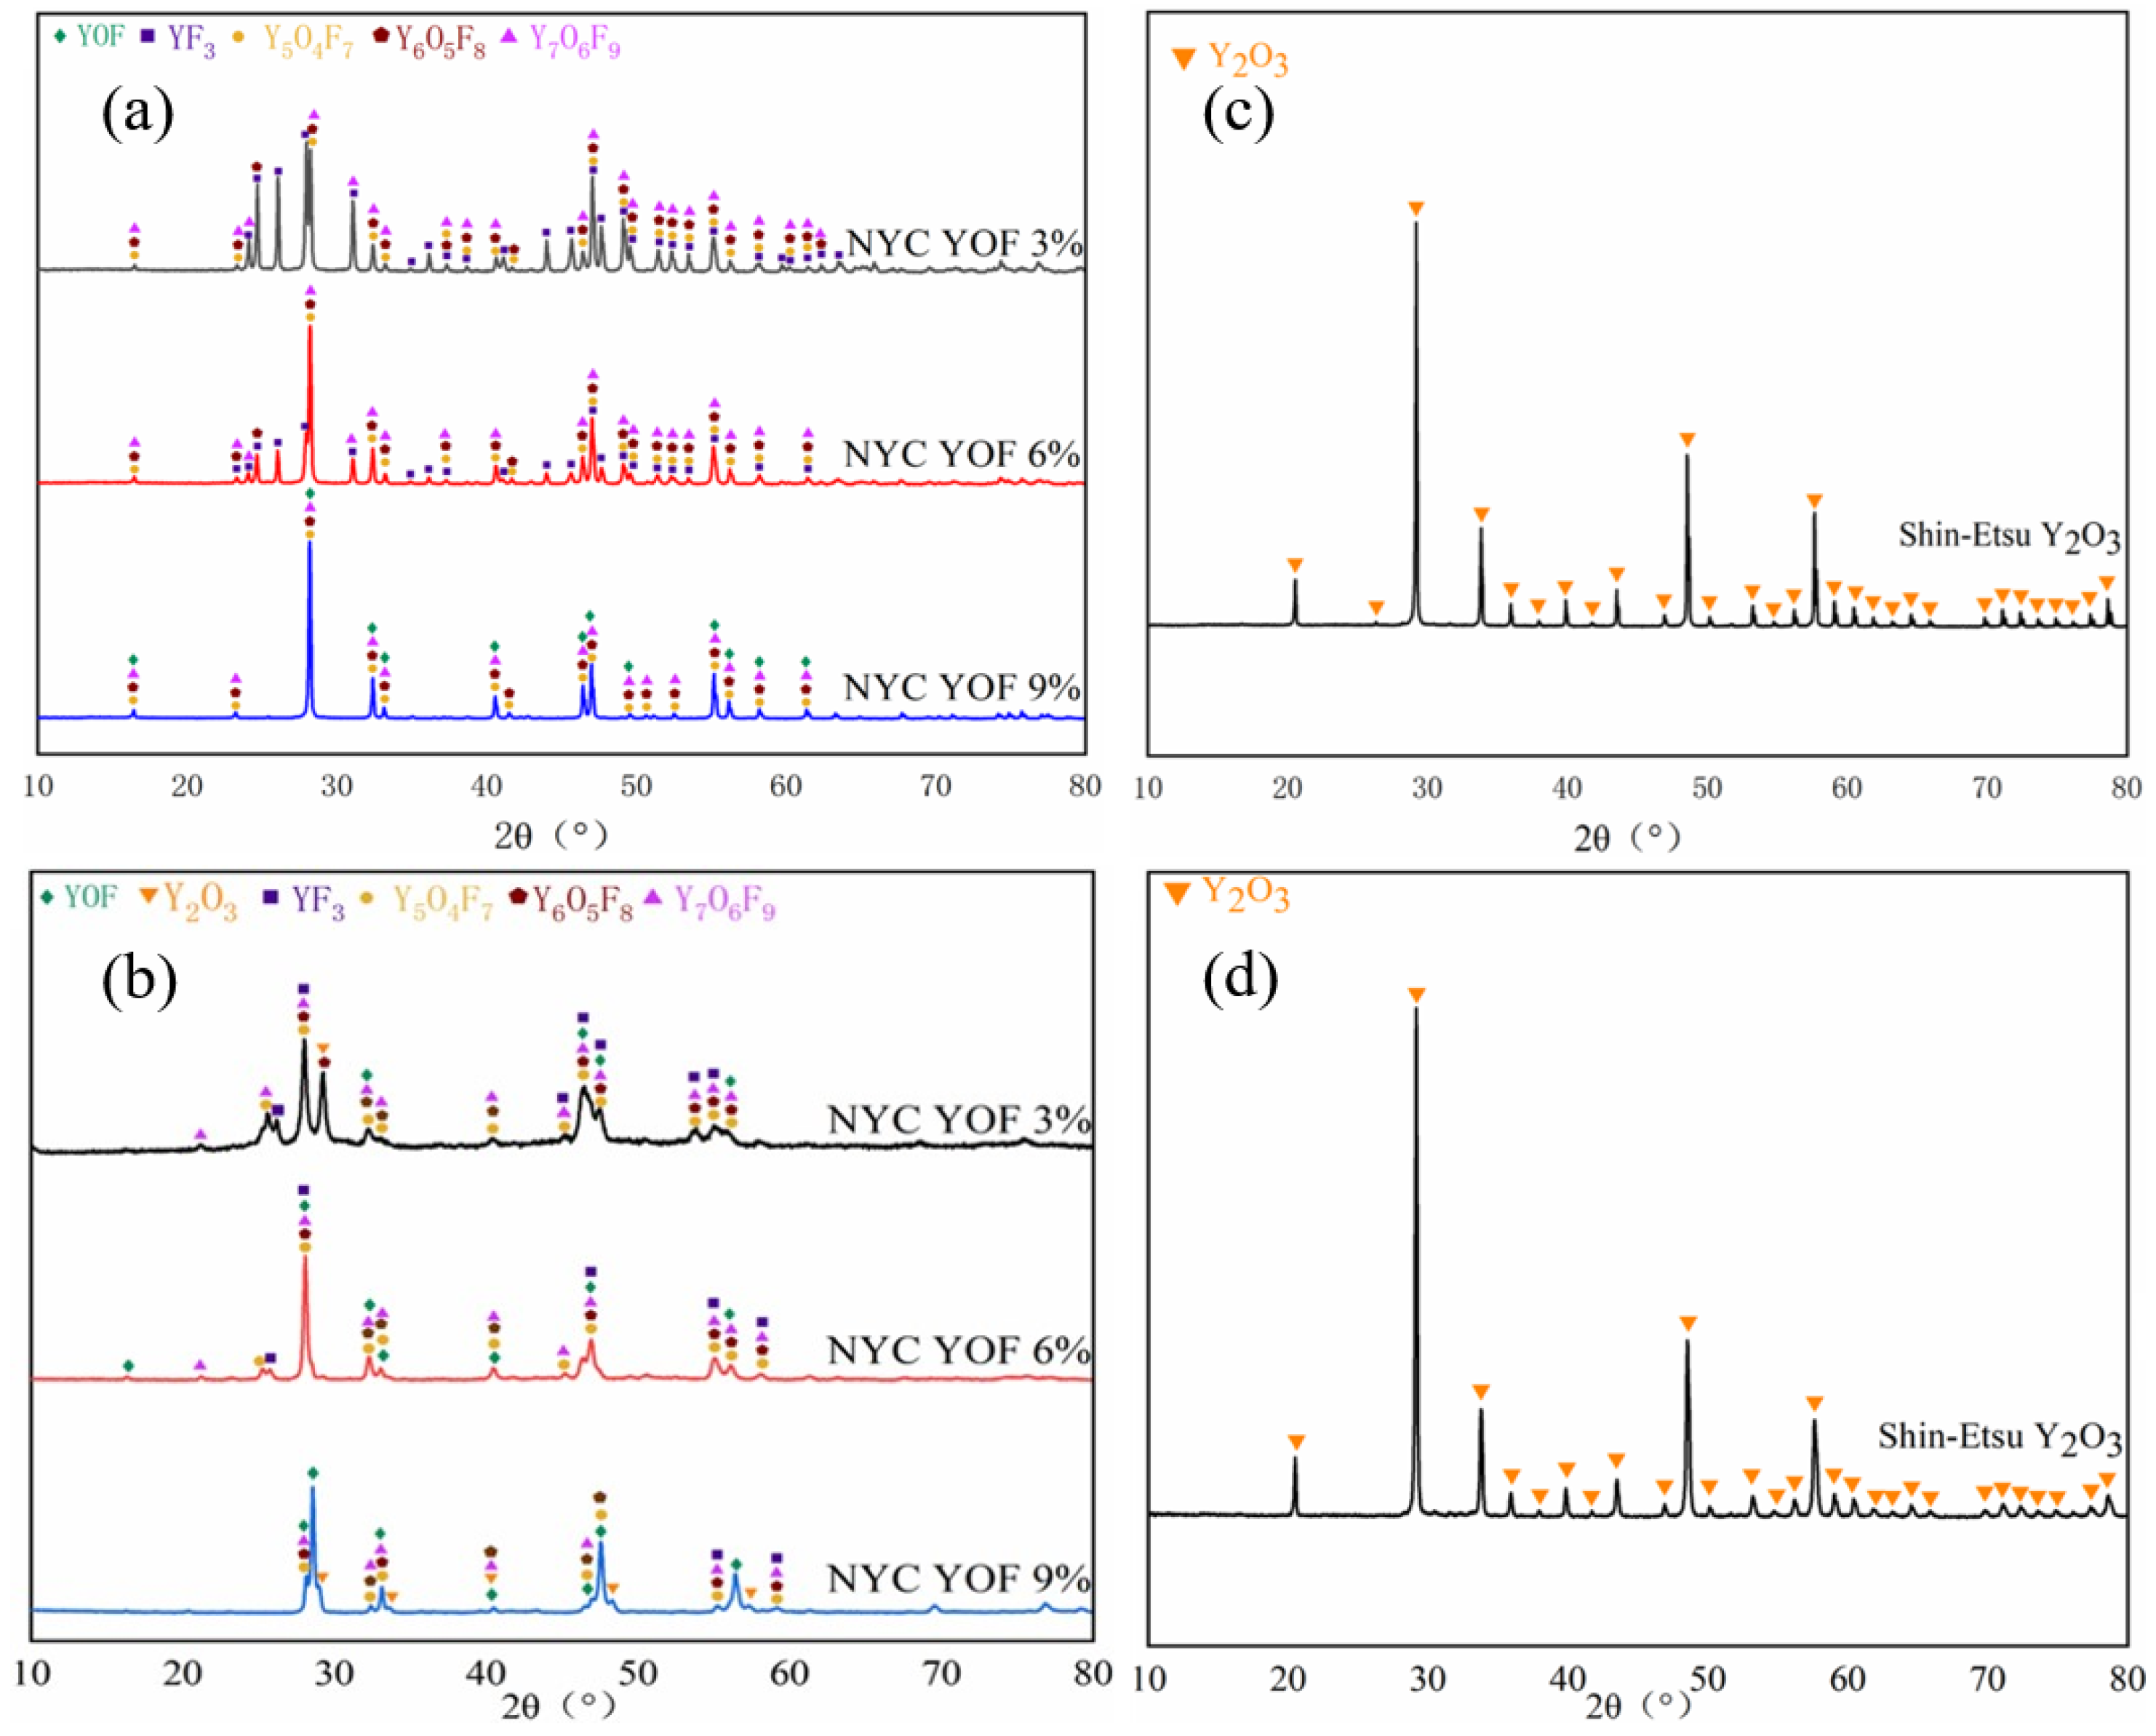
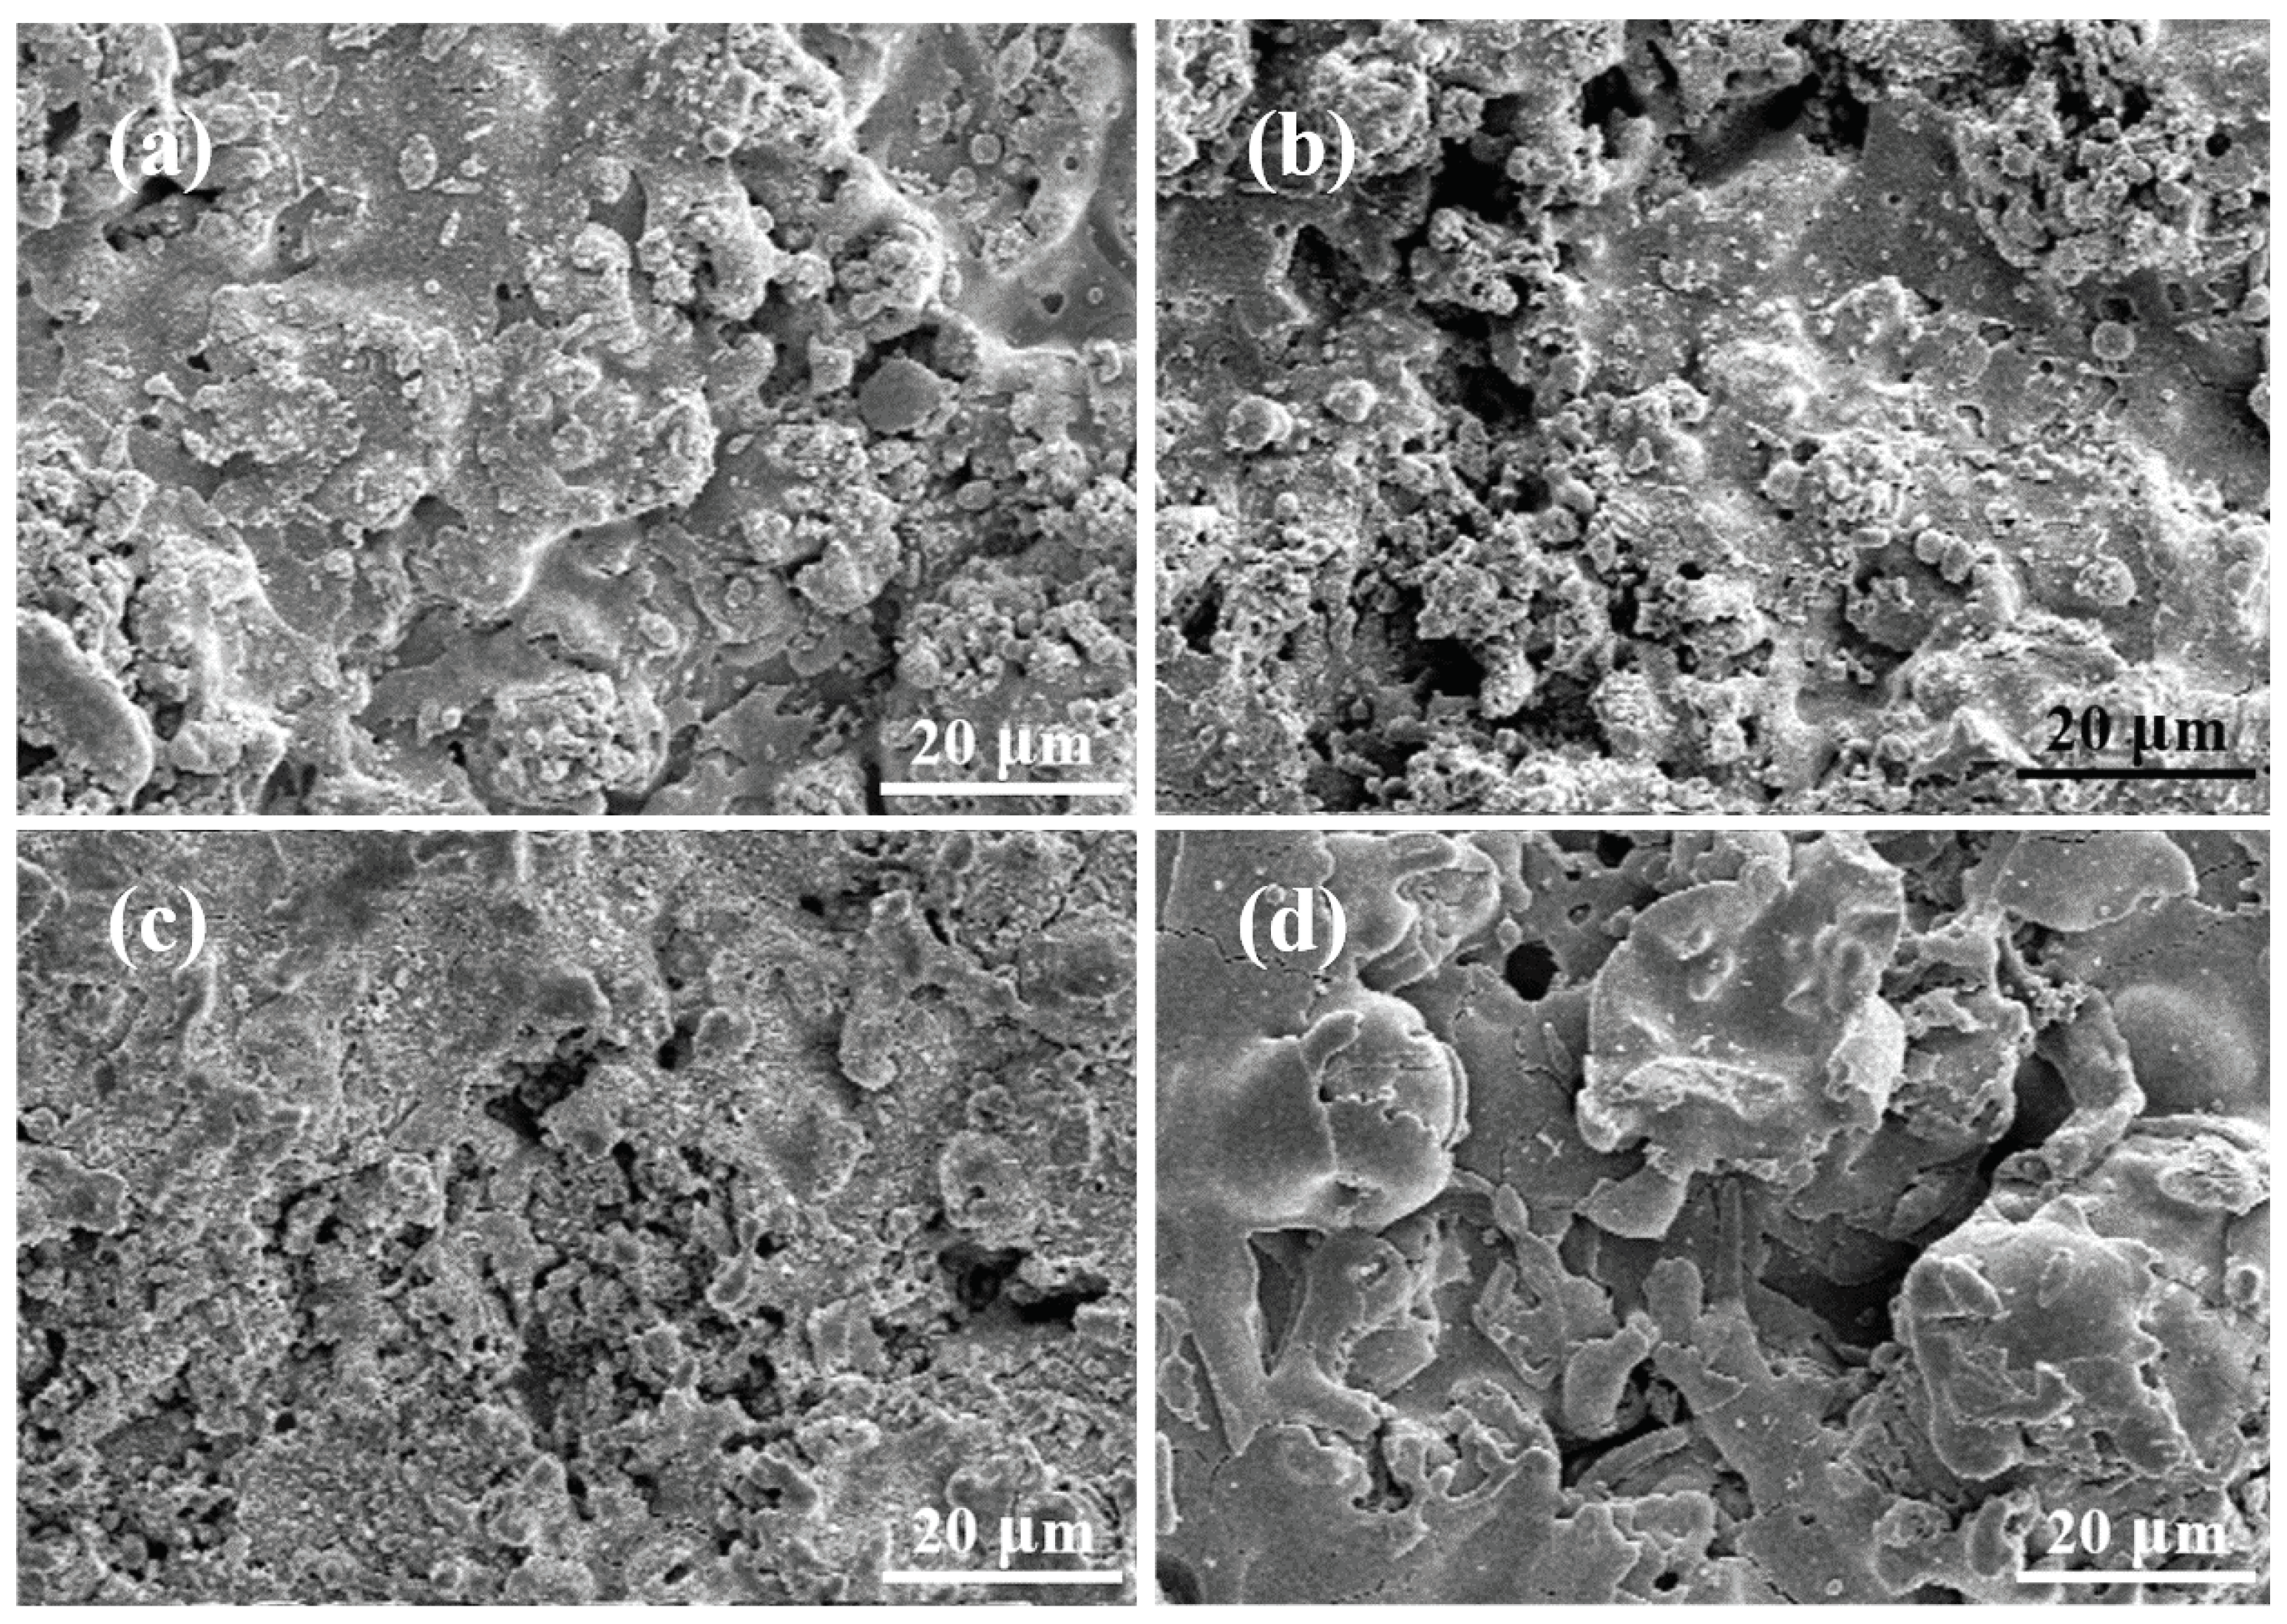
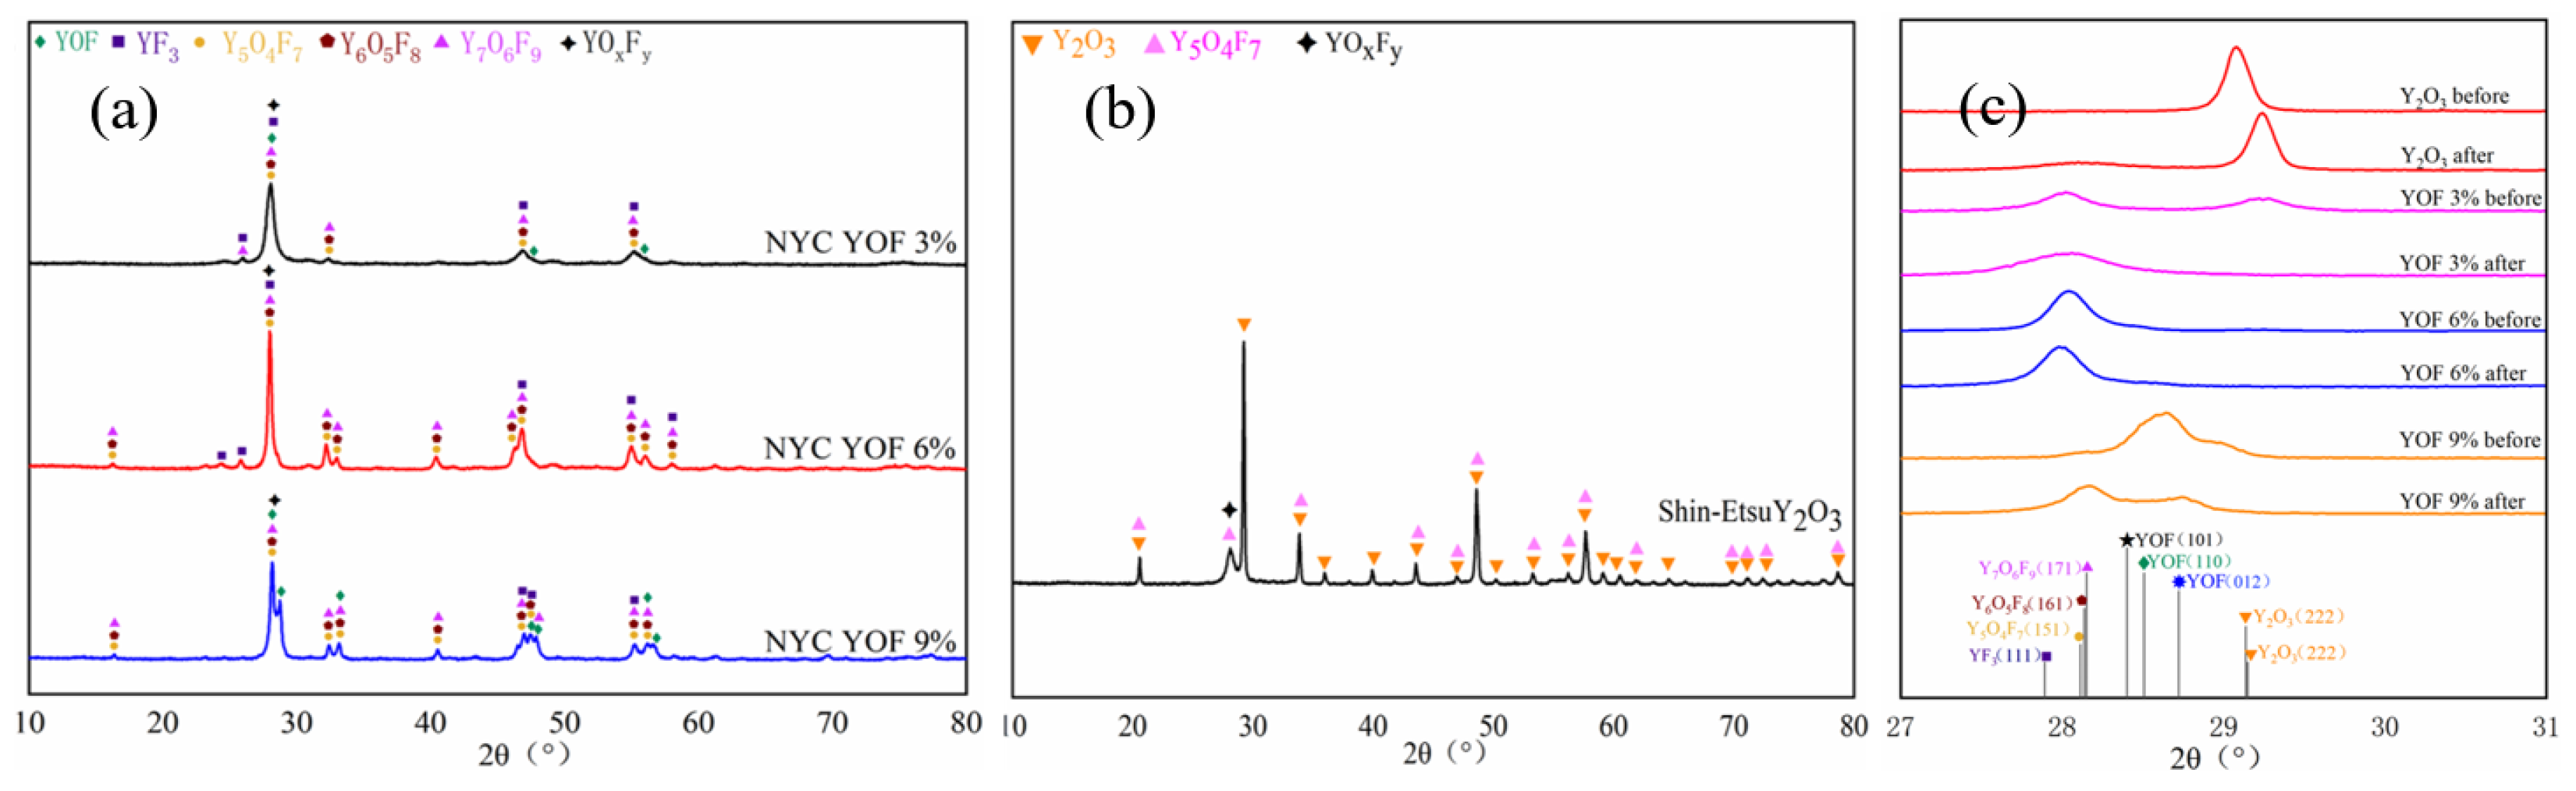
3.1. Characterisation of YOF and Y2O3 Powders, as Well as Atmospheric Plasma Spray Coatings

The scanning electron microscope image of the synthesised YOF and Y2O3 powders used as spraying materials in APS coatings is shown in Figure 1. The centrifugal spray granulation of the ceramic slurry was carried out to form a spherical morphology. It is evident that all of the powder feedstocks consist of clustered primary particles with a spherical shape, which guarantees excellent flowability. Furthermore, the YOF powder samples exhibited spherical structures with a somewhat dented shape, as indicated by the red arrows in Figure 1a–c. The average particle size of YOF 3%, YOF 6%, YOF 9%, and Y2O3 powders determined using a particle size analyser were 20.50 μm, 22.38 μm, 22.18 μm, and 32.36 μm, respectively. Particle size is a crucial physical property in the manufacturing process of powder coatings, significantly influencing the spray performance of the finished coating. Powders with a spherical shape, narrow particle size distribution, and low angle of repose generally exhibit good flowability. The angles of repose for YOF 3%, YOF 6%, YOF 9%, and Y2O3 powders were determined to be 34.72°, 31.47°, 30.71°, and 34.47°, respectively. Therefore, the synthesised YOF powders indicated good flow properties compared to Y2O3 powders [28].
The XRD analysis results for YOF and Y2O3 powders are displayed in Figure 2a,b. These results are consistent with standard data for YOF (JCPDS no. 71-2100), Y2O3 (JCPDS no. 41-1105), and YF3 (JCPDS no. 74-0911). Various YOFs, including Y5O4F7, Y6O5F8, and Y7O6F9, form the YOF powders. The incomplete reaction led to the detection of the YF3 peak in all YOF powders, but its low content allowed it to be disregarded. On the other hand, the Y2O3 powders only contain Y2O3, as shown in Figure 2. Figure 2c,d present the XRD patterns of the YOF and Y2O3 coatings prepared through APS. Both the Y2O3 powder and Y2O3 coating display cubic phases, as indicated by JCPDS 71-0099. Nevertheless, there was a disparity in the crystallinity level between the Y2O3 powder and Y2O3 film. This can be attributed to the significant heat energy released by the plasma jet during the APS coating process. Upon quick cooling of the molten Y2O3 powder, the process of crystal nucleation was reduced, leading to the occurrence of local amorphisation. Figure 2a,b depict the crystalline structure of trigonal YOF and cubic Y2O3, respectively. The rhombus-shaped peaks correspond to the crystalline structure of trigonal YOF, while the reverse triangle-shaped peaks correspond to the crystalline phases of cubic Y2O3. While cubic and monoclinic Y2O3 are undesired phases, their creation was inevitable to some degree. It can be attributed to the following possible chemical reactions during thermal spraying:
12 Y F 3 + 10 H 2 + 5 O 2 2 Y 6 O 5 F 8 + 20 H F
2 Y 5 O 4 F 7 + 2 H 2 + O 2 10 Y O F + 4 H F
4 Y O F + 2 H 2 + O 2 2 Y 2 O 3 + 4 H F
The YOF 3% powder mixture had the largest YF3/YOF ratio, suggesting that it was most likely to cause the reaction in Equation (1), resulting in the production of the most Y6O5F8. All powder mixtures initially contained Y5O4F7, but Equation (2)’s reaction might also occur, leading to the presence of YOF in YOF 3% and YOF 6%. The Y2O3 present in the YOF 3% and YOF 9% coatings was probably caused by YOF, which was either already in the powder mixture or formed during the APS reaction shown in Equation (3). However, as shown in Figure 2b, the crystal structure in the Y2O3 coating was more predictable and consistent with that of the initial powder. The deposited coating contains just Y2O3.
Figure 3 shows surface images of Y2O3 and YOF coatings deposited via the APS process. The surface morphology depicted in Figure 3 has a microstructure characterised by its smooth and rough regions. The smooth areas consist of splats that are created through the dispersion of molten particles. The rough regions are created by particles that have not been fully melted. As shown in Figure 3, the Y2O3 coating had a rougher surface compared with the YOF coatings. The surface roughness of YOF 3%, YOF 6%, YOF 9%, and Y2O3 coatings was 5.706 μm, 4.245 μm, 4.605 μm, and 7.178 μm, respectively. This difference can be attributed to the particle sizes of the powders. During APS, the larger particles are more susceptible to incomplete melting, and the non-melted particles will collide with the substrate, fracture, and form weak coatings with more defects and higher roughness. The porosities were 1.5%, 1.3%, 2.0%, and 2.5%, respectively, which correlates with the roughness data.

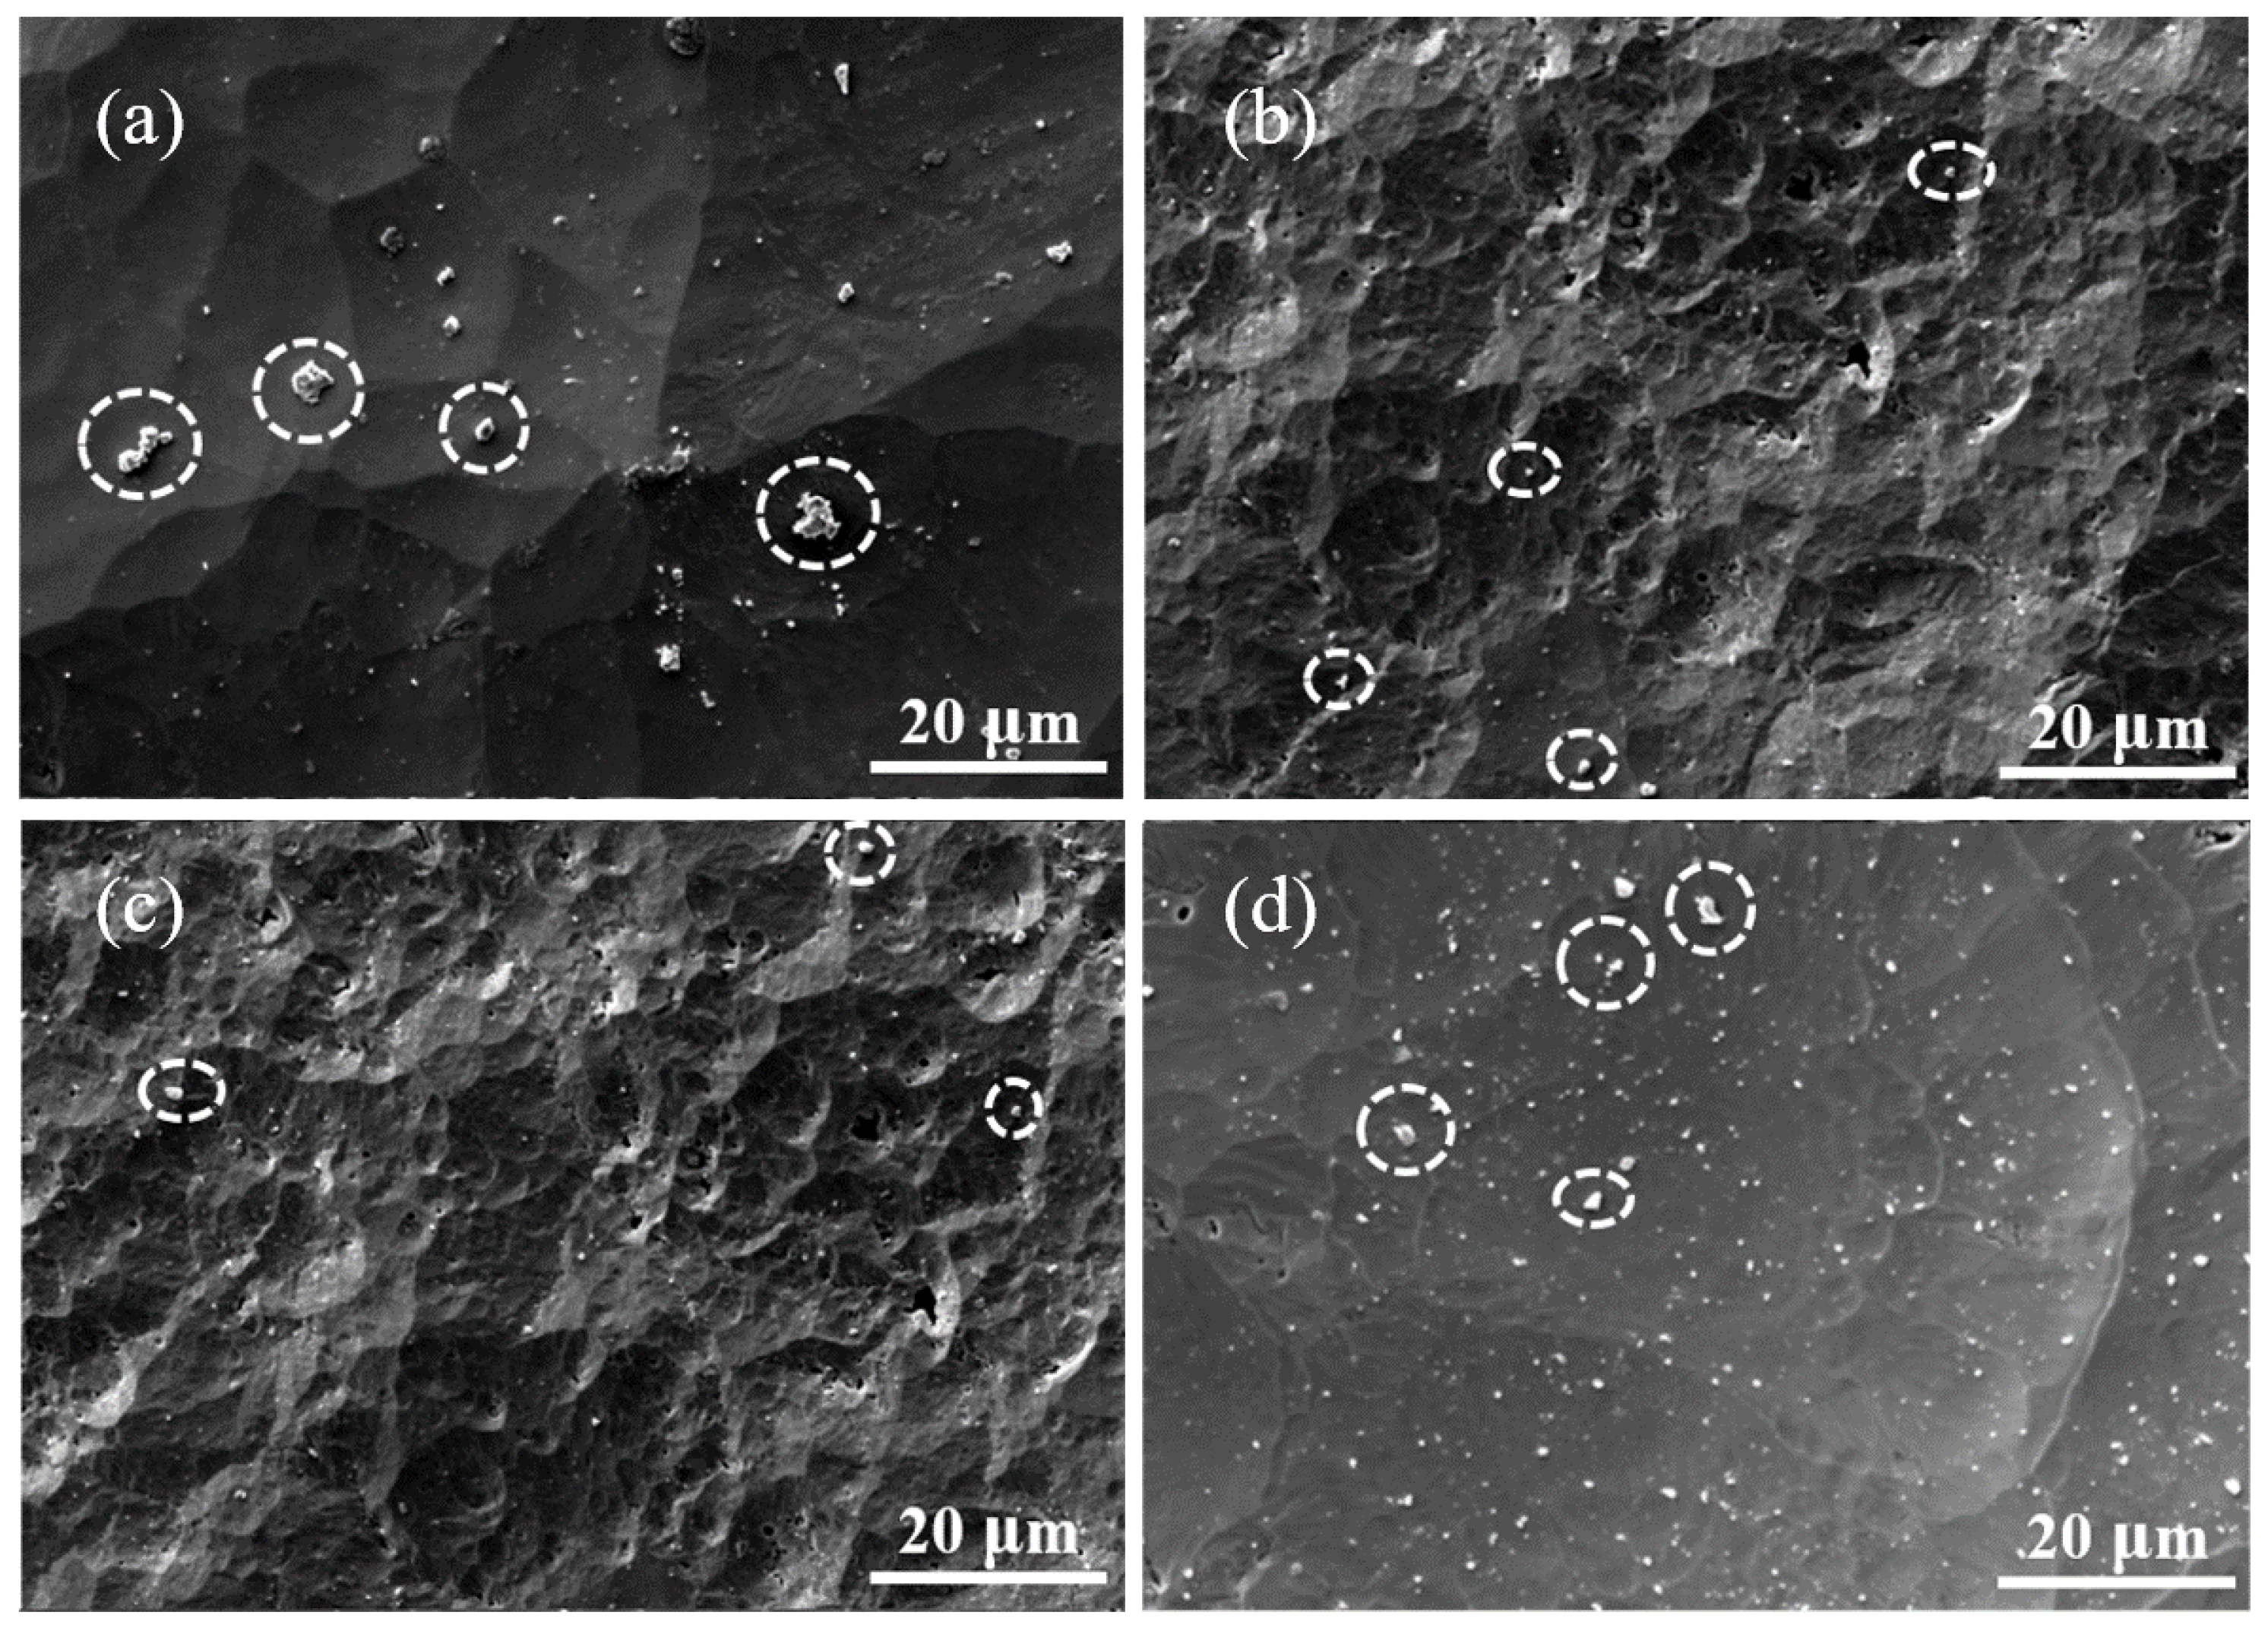
3.2. NF3 Plasma Etching Behaviour

As shown in Figure 4, the plasma attack likely eroded and eliminated the morphological features of the Y2O3 coating, resulting in a significantly smoother surface that almost appeared polished. In contrast, despite appearing to be eroded, the YOF coatings retained rough surfaces with complex morphological features, and the surfaces of the YOF 6% coating and YOF 9% coating were especially rough. Furthermore, the surfaces of all the coatings revealed contamination particles, as indicated by the dashed circles. Due to their significantly larger sizes and smoother surfaces, the particles on the YOF 3% and Y2O3 coatings could easily fall off and contaminate the etching chamber.
The fluorine content of the coatings before and after dry etching was evidently different. The YOF 3% powder mixture, consisting of the most YF3 and the fewest YOFs, resulted in the highest relative fluorine percentage and the lowest relative oxygen percentage in the coating. On the other hand, the YOF 9% powder mixture, consisting of the least YF3 and the most YOFs, resulted in the lowest relative fluorine percentage and the highest relative oxygen percentage in the coating. The YOF 3%, YOF 6%, and YOF 9% coatings had fluorine concentrations of 47.1, 45.1, and 46.3 atomic % after the NF3 plasma etching, respectively. Elevated concentrations of fluorine were present in the vicinity of the boundary or valley in the Y2O3 sample. The fluorine content increased as a result of the formation of a layer containing fluorine. Table 2 lists the relative atomic percentages of the Y, O, and F elements in each coating.
As shown in Figure 5a,b, there are noticeable differences between the coating spectra before and after plasma exposure. YOF and Y2O3, which were present in the spectra of YOF 6% and YOF 9% coatings before plasma exposure, were absent from the spectra after plasma exposure. However, after plasma exposure, the intensity of the Y2O3 peak in the Y2O3 coating’s spectrum decreased, leading to the discovery of tiny Y5O4F7 peaks. Furthermore, non-stoichiometric YOxFy was discovered in all coatings. These alterations suggest that in an NF3-rich environment, materials that are not fluorine-saturated, such as Y2O3, YOF, Y6O5F8, and Y7O6F9, can react with the NF3 plasma to produce YOFs with increased fluorine concentration and non-stoichiometric YOxFy. The YOxFy layer causes stress through expansion and has a low bonding strength. As a result, it is more prone to etching and can produce contaminant particles.
An additional examination of the coatings’ principal peaks following plasma exposure was carried out, as indicated by Figure 5c. Fluorine atoms changed the stoichiometric composition of Y2O3, causing the primary Y2O3 peak of the Y2O3 coating to shift towards a higher 2θ after plasma treatment. After plasma exposure, the original Y2O3 peaks in the YOF 3% and YOF 9% coatings vanished, and the YOF 9% coating’s peak moved its position towards the lower 2θ. On the other hand, the YOF 6% coating’s spectrum did not change and only slightly drifted towards the lower 2θ. The peak positions of YOFs with larger fluorine concentrations are found at lower 2θ, as shown by Figure 5c. Therefore, the shift of the peaks towards lower 2θ means that Y2O3 and other YOFs will react with NF3 plasma in an NF3 plasma environment to make YOFs that have higher fluorine concentrations [29,30]. Furthermore, it can be deduced that the YOF 6% coating exhibited superior chemical stability as its spectra changed the least.
The XPS results of Y2O3 and YOF etched surfaces following NF3 plasma treatment are displayed in Figure 6. The deconvolution of the XPS spectrum after the plasma etching process clearly indicates fluorination. Figure 2a displays the XPS spectra of Y2O3, which have Y-O peaks positioned at 155.1 and 157.1 eV. As shown in Figure 6d, the peak undergoes a shift towards higher energy and exhibits two additional peaks located at 157.5 and 159.1 eV, which have been shown to correspond to the Y-F bond. The difference in binding energy between Y-O and Y-F bonds is caused by a difference in electronegativity between oxygen and fluorine, as previously reported [31,32]. The presence of the YOxFy layer on the surface of the Y2O3 coating has been verified based on the observed chemical shift.
However, the YOF coatings depicted in Figure 6a–c exhibited little fluctuations in both peak position and composition after the plasma treatment. The crystalline structure of Y2O3 and YOF plasma-etched surfaces was examined using X-ray diffraction (XRD), as seen in Figure 3. The plasma-etched, Y2O3-coated sample showed the primary phase of cubic Y2O3 and minor phases of orthorhombic YOFs (Y5O4F7, Y6O5F8, and Y7O6F9). The XRD results reveal that the Y2O3 plasma-etched sample contained many contamination particles in the form of various YOxFy phases. In Figure 3, the plasma-etched YOF sample reveals prominent tetragonal YOF peaks, as well as rhombohedral YOF peaks and the presence of orthorhombic Y5O4F7, which is identical to the YOF-coated sample prior to plasma etching. Indeed, the YOF plasma-etched sample contained a large number of orthorhombic Y5O4F7 peaks, as well as a higher intensity of all of the peaks stated. Y2O3 underwent a reaction with the NF3 plasma, resulting in the formation of YOxFy as a contaminant. Nevertheless, YOF generated YOxFy without any significant chemical changes.
Figure 7 shows the XPS depth profiles of compositions as a function of the Ar+ sputtering time from the surface of the YOF 3%, YOF 6%, YOF 9%, and Y2O3 samples after exposure to Ar plasma for 600 s. The percentages of F atoms in the YOF 3%, YOF 6%, YOF 9%, and Y2O3 coatings exhibited an initial sharp increase, reaching maximum values of 49.5%, 43.2%, 42.9%, and 44.8% after 40, 80, 60, and 30 s of sputtering, respectively. The percentages of F atoms started to decrease from the maximum value to the original composition with sputtering time and eventually stabilised at approximately 34.6%, 36.2%, 31.3%, and 17.8%, respectively. The significant increase in the atomic percentage of fluorine indicates that the NF3 plasma fluorinated all of the coatings. The Y2O3 and YOF coatings underwent a chemical reaction with NF3 to produce YOxFy and YOF compounds with increased fluorine contents. The decrease in fluorine content indicates that there was a significant quantity of Y2O3 and unsaturated YOFs in the lower layers of these coatings. Furthermore, subjecting these coatings to prolonged exposure to fluorine-based plasma may result in the generation and release of additional contaminated particles.
In addition, the Y2O3 coating surface exhibited a significant reduction in fluorine concentration compared to the YOF coating surfaces (Figure 5), suggesting that the fluorination layer of the YOF coatings was considerably thicker than that of the Y2O3 coating. The fluorination layer, which has a higher concentration of fluorine on the surface, helps to resist erosion from fluorine-based plasma and does not easily vaporise due to its chemical stability during the etching process [23]. The YOF 6% coating has the longest fluorination time and highest final fluorine content, exceeding other coatings in terms of both the thickness of the fluorination layer and the saturation of fluorine. It can be concluded that the YOF 6% coating exhibits remarkable durability in a plasma environment with fluorine and efficiently inhibits the formation of contaminating particles.
Figure 8a,b show cross-sectional TEM images of the as-deposited YOF 6% and Y2O3 film after surface irradiation by NF3 plasma, respectively. Figure 8c,d show the TEM-EDS mapping results of the as-deposited YOF 6% and Y2O3 film after surface irradiation by NF3 plasma, respectively. The insets display the selected area electron diffraction (SAED) patterns of the two coating samples, revealing their crystallographic correlations. The regularly ordered diffraction rings in the SAED patterns show that both coatings have a polycrystalline structure, which is consistent with the XRD results. In the insets of Figure 8a,b, the diffraction rings derive from the (012) and (110) crystal facets, consistent with the rhombohedral phase of the YOFs structure, which is consistent with references [23,28]. The TEM image show that there are three layers; namely, the YOxFy layer (highlighted by the red rectangles), the fluorinated layer with high fluorine content, and the unaltered layer with insignificant fluorine presence. Figure 8a,b demonstrate that the NF3 plasma can penetrate and interact with the coatings. This interaction leads to the creation of YOFs with a greater fluorine content and the generation of contaminating YOxFy compounds. Figure 8a,c demonstrate that the YOF 6% coating has a consistent microstructure in its cross-section. The fluorine concentration gradually rises and reaches a stable level at a depth of approximately 4 microns. There is no discernible boundary between the fluorinated layer and the unaffected layer. In contrast, Figure 8b,d show that the Y2O3 coating has a clear separation at a depth of about 2.5 microns between the fluorinated layer and the Y2O3 layer below it. The TEM picture and the XPS depth profiling results both show that the YOF 6% coating had abundant fluorine, with a much thicker layer. With prolonged exposure, YOF 6% can provide better protection against NF3 plasma.

4. Conclusions

The NF3 plasma etching behaviour of Y2O3 and YOF coatings was examined by utilising the atmospheric plasma spraying (APS) technique, and a detailed comparison of the microstructure, macroscopic properties, and chemical stability of the Y2O3 and YOF coatings is provided. When the Y2O3 coating was exposed to NF3 plasma, the surface of the Y2O3 reacted with fluorine radicals, forming particles and producing YOxFy as contamination. However, due to the presence of fluorine as a component element in YOF, no notable alterations were observed during plasma etching. These findings reveal that the YOF coating outperformed Y2O3 in terms of resistance to fluorine-based plasma exposure, making it far more suitable for use as a protective material for the inner walls of reactors that use fluorine-based gases.

Supplementary Materials

The following supporting information can be downloaded at: https://www.mdpi.com/article/10.3390/coatings14091091/s1, Figure S1. EDS maps before and after NF3 plasma etching. Table S1. The EDS results of Y, O, and F elements in the coatings before and after plasma exposure. Table S2. Standard errors for all peaks of the XPS spectra. Figure S2. Peak positions of the XPS spectra of (a) YOF 3%, (b) YOF 6%, (c) YOF 9% and (d) Y2O3 surface before exposure to the NF3 plasma. Figure S3. Peak positions of the XPS spectra of (a) YOF 3%, (b) YOF 6%, (c) YOF 9% and (d) Y2O3 surface before exposure to the NF3 plasma.

Author Contributions

Conceptualization, Z.T.; Methodology, Y.W. (Yuwei Wang); Validation, K.A.; Formal analysis, Y.W. (Yuwei Wang), J.X. and Y.W. (Yuxuan Wei); Investigation, K.A. and J.X.; Resources, H.C. and Y.W. (Yuxuan Wei); Data curation, H.M. and H.C.; Writing—original draft, Z.T.; Writing—review & editing, L.W.; Supervision, Y.S.; Project administration, L.W.; Funding acquisition, L.W. All authors have read and agreed to the published version of the manuscript.

Funding

This research was funded by National Key R & D Program of China (No. 2023YFA1608703).

Institutional Review Board Statement

Not applicable.

Informed Consent Statement

Not applicable.

Data Availability Statement

Data are contained within the article and Supplementary Materials.

Conflicts of Interest

Authors Zaifeng Tang, Yuwei Wang, Kaiqu Ang, Jin Xu and Hua Meng were employed by the company Shanghai Huali Integrated Circuit Corporation. Authors Hongli Chen and Yuxuan Wei were employed by the company Chongqing Genori Technology Co., Ltd. The remaining authors declare that the research was conducted in the absence of any commercial or financial relationships that could be construed as a potential conflict of interest.

References

  1. Moriya, T.; Murakami, T.; Nakayama, H.; Nagaike, H.; Sugawara, E.; Kobayashi, Y.; Shimada, M.; Okuyama, K. Reduction of particle contamination in an actual plasma etching process. In Proceedings of the IEEE International Symposium on Semiconductor Manufacturing, San Jose, CA, USA, 13–15 September 2005; pp. 229–232. [Google Scholar]
  2. So, J.; Kim, M.; Kwon, H.; Maeng, S.; Choi, E.; Chung, C.W.; Yun, J.Y. Investigation of contamination particles generation and surface chemical reactions on Al2O3, Y2O3, and YF3 coatings in F-based plasma. Appl. Surf. Sci. 2023, 629, 157367. [Google Scholar] [CrossRef]
  3. Lee, C.G.; Kanarik, K.J.; Gottscho, R.A. The grand challenges of plasma etching: A manufacturing perspective. J. Phys. D Appl. Phys. 2014, 47, 273001. [Google Scholar] [CrossRef]
  4. Huo, D.; Zheng, Y.; Sun, X.; Li, X.; Liu, S. Preparation of transparent Y2O3 ceramic by slip casting and vacuum sintering. J. Rare Earths 2012, 30, 57–62. [Google Scholar] [CrossRef]
  5. Ku, C.M.; Cheng, S. Factor design for the oxide etching process to reduce edge particle contamination in capacitively coupled plasma etching equipment. Appl. Sci. 2022, 12, 5684. [Google Scholar] [CrossRef]
  6. Kitamura, J.; Ibe, H.; Yuasa, F.; Mizuno, H. Plasma sprayed coatings of high-purity ceramics for semiconductor and flat-panel-display production equipment. J. Therm. Spray Technol. 2008, 17, 878–886. [Google Scholar] [CrossRef]
  7. Hussein, M.A.; Turkot, R.B. Particle control in dielectric etch chamber. IEEE Trans. Semicond. Manuf. 2006, 19, 146–155. [Google Scholar] [CrossRef]
  8. Lee, H.K.; Baek, K.H.; Shin, K. Resolving critical dimension drift over time in plasma etching through virtual metrology based wafer-to-wafer control. Jpn. J. Appl. Phys. 2017, 56, 066502. [Google Scholar] [CrossRef]
  9. Xu, S.; Sun, Z.; Qian, X.; Holland, J.; Podlesnik, D. Characteristics and mechanism of etch process sensitivity to chamber surface condition. J. Vac. Sci. Technol. B 2001, 19, 166–171. [Google Scholar] [CrossRef]
  10. Cunge, G.; Joubert, O.; Sadeghi, N. Enhancement of the recombination rate of Br atoms by CF4 addition and resist etching in HBr/Cl2/O2 plasmas. J. Appl. Phys. 2003, 94, 6285–6290. [Google Scholar] [CrossRef]
  11. Schaepkens, M.; Bosch, R.C.M.; Standaert, T.E.F.M.; Oehrlein, G.S.; Cook, J.M. Influence of reactor wall conditions on etch processes in inductively coupled fluorocarbon plasmas. J. Vac. Sci. Technol. A 1998, 16, 2099–2107. [Google Scholar] [CrossRef]
  12. Tanikawa, T.; Shinohara, S. Plasma performance in very large helicon device. Thin Solid Films 2006, 506, 559–563. [Google Scholar] [CrossRef]
  13. Fukumoto, H.; Fujikake, I.; Takao, Y.; Eriguchi, K.; Ono, K. Plasma chemical behaviour of reactants and reaction products during inductively coupled CF4 plasma etching of SiO2. Plasma Sources Sci. Technol. 2009, 18, 045027. [Google Scholar] [CrossRef]
  14. Zhao, D.; Wang, C.; Chen, Y.; Wang, Y. Phase composition, structural, and plasma erosion properties of ceramic coating prepared by suspension plasma spraying. Int. J. Appl. Ceram. Technol. 2018, 15, 1388–1396. [Google Scholar] [CrossRef]
  15. Lee, J.; Lee, S.; Han, H.N.; Kim, W.; Hwang, N.M. Yttrium oxyfluoride coatings deposited by suspension plasma spraying using coaxial feeding. Coatings 2020, 10, 481. [Google Scholar] [CrossRef]
  16. Cao, Y.C.; Zhao, L.; Luo, J.; Wang, K.; Zhang, B.P.; Yokota, H.; Ito, Y.; Li, J.F. Plasma etching behavior of Y2O3 ceramics: Comparative study with Al2O3. Appl. Surf. Sci. 2016, 366, 304–309. [Google Scholar] [CrossRef]
  17. Tsunoura, T.; Yoshida, K.; Yano, T.; Kishi, Y. Fabrication, characterization, and fluorine-plasma exposure behavior of dense yttrium oxyfluoride ceramics. Jpn. J. Appl. Phys. 2017, 56, 06HC02. [Google Scholar] [CrossRef]
  18. Lin, T.K.; Wuu, D.S.; Huang, S.Y.; Wang, W.K. Preparation and Characterization of Sprayed-Yttrium Oxyfluoride Corrosion Protective Coating for Plasma Process Chambers. Coatings 2018, 8, 373. [Google Scholar] [CrossRef]
  19. Shiba, Y.; Teramoto, A.; Goto, T.; Kishi, Y.; Shirai, Y.; Sugawa, S. Stable yttrium oxyfluoride used in plasma process chamber. J. Vac. Sci. Technol. A 2017, 35, 021405. [Google Scholar] [CrossRef]
  20. Ma, T.; List, T.; Donnelly, V.M.P. Comparisons of NF3 plasma-cleaned Y2O3, YOF, and YF3 chamber coatings during silicon etching in Cl2 plasmas. J. Vac. Sci. Technol. A 2018, 36, 031305. [Google Scholar] [CrossRef]
  21. Tahara, R.; Tsunoura, T.; Yoshida, K.; Yano, T.; Kishi, Y. Fabrication of dense yttrium oxyfluoride ceramics by hot pressing and their mechanical, thermal, and electrical properties. Jpn. J. Appl. Phys. 2018, 57, 06JF04. [Google Scholar] [CrossRef]
  22. Miyashita, K.; Tsunoura, T.; Yoshida, K.; Yano, T.; Kishi, Y. Fluorine and oxygen plasma exposure behavior of yttrium oxyfluoride ceramics. Jpn. J. Appl. Phys. 2019, 58, SEEC01. [Google Scholar] [CrossRef]
  23. Lin, T.K.; Wang, W.K.; Huang, S.Y.; Tasi, C.T.; Wuu, D.S. Comparison of erosion behavior and particle contamination in mass-production CF4/O2 plasma chambers using Y2O3 and YF3 protective coatings. Nanomaterials 2017, 7, 183. [Google Scholar] [CrossRef] [PubMed]
  24. Lee, S.; Lee, J.; Kim, W.; Hwang, N. Plasma Etching Behavior of YOF Coating Deposited by Suspension Plasma Spraying in Inductively Coupled CHF3/Ar Plasma. Coatings 2020, 10, 1023. [Google Scholar] [CrossRef]
  25. Lee, S.; Lee, J.; Hwang, N.M. Yttrium Oxyfluoride Coating Deposited with a Y5O4F7/YF3 Suspension by Suspension Plasma Spraying Under Atmospheric Pressure. J. Therm. Spray Technol. 2022, 31, 1–13. [Google Scholar] [CrossRef]
  26. Kim, C.; Kim, M.J.; Cho, H.; Park, T.E.; Yun, Y.H. Fabrication and plasma resistance of Y2O3 ceramics. Ceram. Int. 2015, 10, 12757–12762. [Google Scholar] [CrossRef]
  27. Ashizawa, H.; Yoshida, K. Plasma-resistance evaluation of yttrium oxyfluoride coating prepared by aerosol deposition method. Int. J. Appl. Ceram. Technol. 2022, 19, 375–382. [Google Scholar] [CrossRef]
  28. Kim, D.M.; Oh, Y.S.; Kim, S.; Kim, H.T.; Lim, D.S.; Lee, S.M. The erosion behaviors of Y2O3 and YF3 coatings under fluorocarbon plasma. Thin Solid Films 2011, 519, 6698–6702. [Google Scholar] [CrossRef]
  29. Khan, S.; Han, J.S.; Lee, S.Y.; Cho, S.H. Flame-synthesized Y2O3: Tb3 nanocrystals as spectral converting materials. J. Nanoparticle Res. 2018, 20, 241. [Google Scholar] [CrossRef]
  30. Khan, S.; Park, B.I.; Han, J.S.; Lee, S.Y.; Cho, S.H. Flame synthesized Y2O3: Tb3–Yb3 phosphors as spectral convertors for solar cells. Res. Chem. Intermed. 2018, 44, 4619–4632. [Google Scholar] [CrossRef]
  31. Kim, D.M.; Lee, S.H.; Alexander, W.B.; Kim, K.B.; Oh, Y.S.; Lee, S.M. X-ray photoelectron spectroscopy study on the interaction of yttrium–aluminum oxide with fluorine-based plasma. J. Am. Ceram. Soc. 2011, 94, 3455–3459. [Google Scholar] [CrossRef]
  32. Xia, J.; Liang, W.; Miao, Q.; Depla, D. The effect of energy and momentum transfer during magnetron sputter deposition of yttrium oxide thin films. Appl. Surf. Sci. 2018, 439, 545–551. [Google Scholar] [CrossRef]
Figure 1. SEM images of (a) YOF 3%, (b) YOF 6%, (c) YOF 9%, and (d) Y2O3 powders.
Coatings 14 01091 g001
Figure 2. XRD patterns of (a) YOF powder, (b) YOF coating film, (c) Y2O3 powder, and (d) Y2O3 coating film.
Coatings 14 01091 g002
Figure 3. Surface and cross-sectional SEM images of (a) YOF 3% coating, (b) YOF 6% coating, (c) YOF 9% coating, and (d) Y2O3 coating.
Coatings 14 01091 g003
Figure 4. Surface SEM images of (a) YOF 3% coating, (b) YOF 6% coating, (c) YOF 9% coating, and (d) Y2O3 coating after exposure to the NF3 plasma.
Coatings 14 01091 g004
Figure 5. XRD patterns of (a) YOF coating after plasma exposure, (b) Y2O3 coating plasma exposure, and (c) detailed analysis on the major peaks of the coatings after plasma exposure.
Coatings 14 01091 g005
Figure 6. Peak positions of the XPS spectra of (a) YOF 3%, (b) YOF 6%, (c) YOF 9%, and (d) Y2O3 surface after exposure to the NF3 plasma.
Coatings 14 01091 g006
Figure 7. Variations in chemical compositions measured with XPS with the Ar sputtering time for (a) YOF 3% coating, (b) YOF 6% coating, (c) YOF 9% coating, and (d) Y2O3 coating after exposure to NF3/Ar plasma for 600 s.
Coatings 14 01091 g007
Figure 8. TEM cross-sectional images of the (a) YOF 6% and the (b) Y2O3 coating and the TEM-EDS mappings of the (c) YOF 6% and the (d) Y2O3 coating.
Coatings 14 01091 g008
Table 1. Plasma etching parameters.
Pressure (mTorr)TCP RF Power (W)Bias RF Voltage (V)Etching Time (s)NF3 Flow Rate (sccm)He Flow Rate (sccm)
151540330300200500
Table 2. The relative atomic percentages of Y, O, and F elements in the coatings before and after plasma exposure (data were obtained via EDS quantification).
Atomic Percentage (%)Y2O3 YOF 3% YOF 6% YOF 9%
Pre-EtchingPost-EtchingPre-EtchingPost-EtchingPre-EtchingPost-EtchingPre-EtchingPost-Etching
Y43.434.729.537.132.036.938.538.1
O53.525.412.315.518.017.634.315.1
F038.457.247.149.645.126.446.3
Disclaimer/Publisher’s Note: The statements, opinions and data contained in all publications are solely those of the individual author(s) and contributor(s) and not of MDPI and/or the editor(s). MDPI and/or the editor(s) disclaim responsibility for any injury to people or property resulting from any ideas, methods, instructions or products referred to in the content.

