Article

The Relationship between the Fresh Sludge Ceramsite Concrete’s Fluidity and the Sludge Ceramsite’s Dispersion

1
School of Civil Engineering and Geographical Environment, Ningbo University, Ningbo 315000, China
2
School of Civil Transportation Engineering, Ningbo University of Technology, Ningbo 315211, China
3
Road & Bridge International Co., Ltd., Beijing 100084, China
4
Ningbo Yonghuan Yuan Environmental Protection Engineering Technology Co., Ltd., Ningbo 315000, China
5
Ningbo Roaby Technology Industrial Group Co., Ltd., Ningbo 315800, China
*
Authors to whom correspondence should be addressed.
Coatings 2024, 14(9), 1095; https://doi.org/10.3390/coatings14091095
Submission received: 30 July 2024 / Revised: 21 August 2024 / Accepted: 24 August 2024 / Published: 29 August 2024
(This article belongs to the Special Issue Surface Engineering and Mechanical Properties of Building Materials)

Abstract

:
Sludge ceramsite (SC) can be utilized as a lightweight aggregate in concrete, especially in external wall materials, due to the increasing volume of polluted sludge, which contributes to water system deterioration and poses greater threats to human health. The influence of the fresh mortar’s slump flow on the dispersion of ceramsite was studied. The ultrasonic sound velocity, capillary water absorption rate, compressive strength, and coefficient of variation (CV) were measured in this study. Thermogravimetric (TG) analysis, ultra depth-of-field microscope scanning, X-ray diffraction (XRD), scanning electron microscopy (SEM), and energy dispersive spectrometry (EDS) were used to analyze the performance mechanism of the ceramsite concrete. The results indicated that adding SC could reduce the fluidity of the fresh concrete, with a reduction by rates of up to 2.04%. The addition of WRA could improve the fluidity by rates of up to 60.77%. The relationship between the ultrasonic sound speed and the increasing fluidity could be deduced as a negative correlation. The water absorption was negatively correlated with the compressive strength. The concrete with a slump flow of 12.35 and 12.5 cm reached the maximum compressive strength, which had the lowest water absorption, and demonstrated internal homogeneity. The optimum slump flow was 12.35 and 12.5 cm. With the slump flow of 12.5 cm, the corresponding CV was the lowest, showing the optimum SC’s dispersion. Through TG, XRD, and SEM analyses, it was verified that the addition of 0.6% WRA promoted the hydration of cement. In addition, SC increased the hydration products.

1. Introduction

Due to industrial discharges, the amounts of industrial pollutants and contaminated river sludge are increasing [1,2]. In the whole world, the annual municipal sludge production has been expected to reach 100 million tons by 2024 [3,4]. Sludge accumulation in rivers severely affects the entire water system [5]. It can be used as a raw material to produce industrial ceramsite [6,7]. In this way, it can provide a solution to the problem of waste disposal and also offer economic benefits, achieving low-cost resource utilization of sludge [8]. Through technological innovation and market development, the production of sludge ceramsite (SC) has great economic potential [9].
SC can serve as lightweight aggregate in concrete, offering benefits such as reduced self-weight, low thermal conductivity, good hard film properties, and convenient construction [10,11]. It can be widely used in roof slopes, thermal insulation layers, non-load-bearing wall sound insulation, and so on [12]. It should be mentioned that this ceramsite is different from lightweight expanded clay aggregate (LECA). LECA is usually made by high-temperature roasting and swelling, while the production process for sludge ceramsite includes raw material pretreatment, batching, molding, pre-burning, roasting, cooling, screening and other steps [13]. Compared with LECA, it has a denser structure and more active properties [14].
At home and abroad, scholars have performed a lot of experiments on the preparation and performance of ceramsite concrete using waste materials such as sludge, paper and waste gangue. Xie et al. [15] used papermaking sludge to prepare expanded ceramsite and invented a green self-insulation wall block with ceramsite. The wall block shows a thermal conductivity of 0.39 W/(M2·K). Wang et al. [16] found that when the gangue ceramsite was used as coarse aggregate with a 40% substitution rate, the compressive strength could be up to 50.8 MPa, which was only 1.7 MPa lower than ordinary concrete [17,18]. A study by Li et al. [19] reported that the lightweight ceramsite concrete made from paper sludge could enhance the compressive strength by 53%. The cement hydration products can enter the interior of ceramsite, which promotes the close combination of ceramsite and cementitious materials [20].
At present, the use of ceramsite concrete still faces several challenges. Firstly, the density difference between ceramsite and cement mortar causes the ceramsite to float, resulting in the separation of the mortar layers [21]. Secondly, during the mixing process, the ceramsite absorbs water, causing a decrease in the slump flow [22]. Ultimately, it affects the bearing capacity, fluidity, and durability [23]. Bu et al. [24] found that with the increase in the rubber ceramsite content, the compressive strength of rubber ceramsite concrete increased first and then decreased. The water absorption was negatively correlated with the compressive strength. To solve this problem, Wang et al. [25] discovered that the segregation degree of sludge ceramsite, which was crushed, coated with ash, and pre-wetted for 1.0–2.0 h before pouring, could be reduced to approximately 2%. Wang et al. [26,27] showed that the coefficient of variation could be used to characterize the dispersion of the internal filler. This has certain reference significance for our research on the dispersion of sludge ceramsite. Although there has been some research on sludge ceramsite, the corresponding mechanism of fresh mixed ceramsite concrete mortar has not been reported. In particular, the dispersion of sludge ceramsite at different slump flows has not been investigated.
This study aims to evaluate the influence of the water-reducing agent (WRA) content (0%~1.2% by the mass of cement) and SC content (10% and 20% by the total mass of all materials) on the fluidity of ceramsite concrete. In this paper, the influence of fluidity on ultrasonic velocity, capillary water absorption, and compressive strength was studied. The ceramsite dispersion was characterized by the coefficient of variation (CV). Moreover, thermogravimetric (TG), ultra depth-of-field microscope scanning, X-ray diffraction (XRD), scanning electron microscopy (SEM), and energy dispersive spectrometry (EDS) were used to reveal the mechanism of performance change. This study provides a new approach to the treatment of fresh SC concrete.

2. Experimental

2.1. Raw Materials

Ordinary Portland cement (OPC) was used in this study. The initial setting time and the final setting time of the Portland cement were 155 min and 305 min, respectively, with a specific surface area lower than 350 m2/kg. In addition, quartz sand (particles with a size range of 0.35 mm to 0.59 mm) and an efficient WRA (polyarboxylic acid system, brown microemulsion solution, water reduction rate of 40%) were prepared in this study. Ceramsite, a material produced by Anhui Taotianxia Environmental Protection Technology Co., Ltd., Huainan, China, was used. The length radius was 5–10 mm. The apparent density was 620 kg/m3, with a 24 h water absorption of 18.1%. Table 1 shows the chemical composition of the raw materials. The appearance of SC is shown in Figure 1.

2.2. Specimen Preparation

The water–cement ratio of 0.4 was maintained, and the total mass of the medium sand and SC remained unchanged. Ten groups of ceramsite concrete were manufactured with the proportions shown in Table 2.
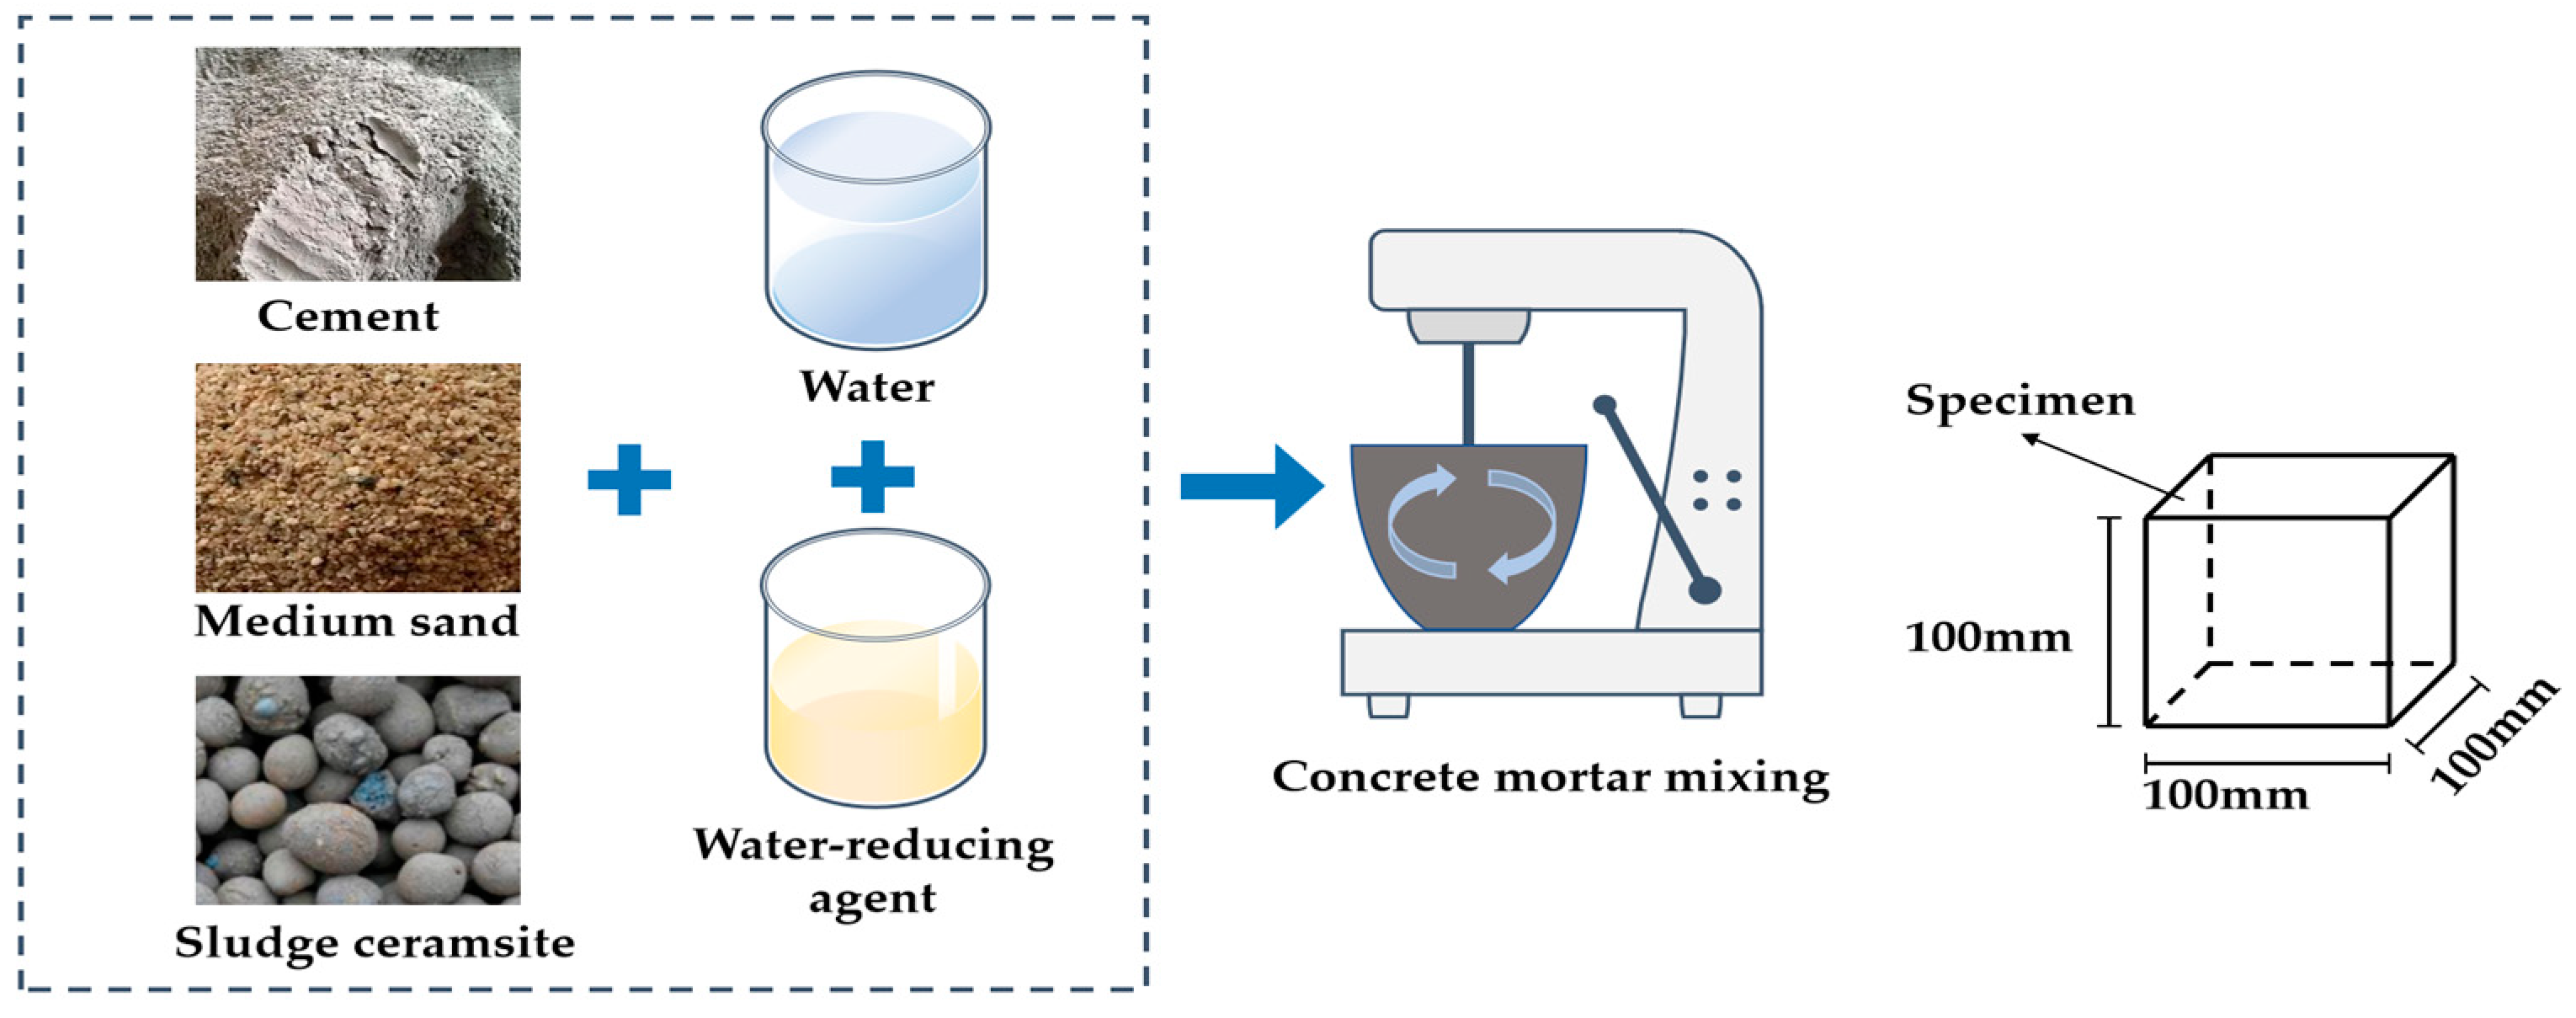
The preparation of each specimen was in accordance with the JGJ/T 12-2019 and GB/T 17431.2-2010 [28,29]. Firstly, the cement, quartz sand and SC were poured into the UJZ-15 mortar mixer. After dry mixing for 30 s and stirring evenly, the solution of the WRA and water was slowly poured and mixed. Once the materials had been stirred for 480 s, the mixing pot was removed from the turntable. Then, some of the fresh mortar was removed to be used for the slump flow test. The remaining fresh concrete was poured into the mold to form 6 specimens with dimensions of 100 mm × 100 mm × 100 mm. After 24 h, when the specimens had reached a certain strength, the specimens were removed from the molds. Then, all the specimens were placed in the standard curing environment (temperature of 20 °C ± 2 °C, humidity of more than 95%). The specimens were maintained for 28 d. The procedure for the preparation is shown in Figure 2.

2.3. Measurement Methods

2.3.1. Slump Flow Test

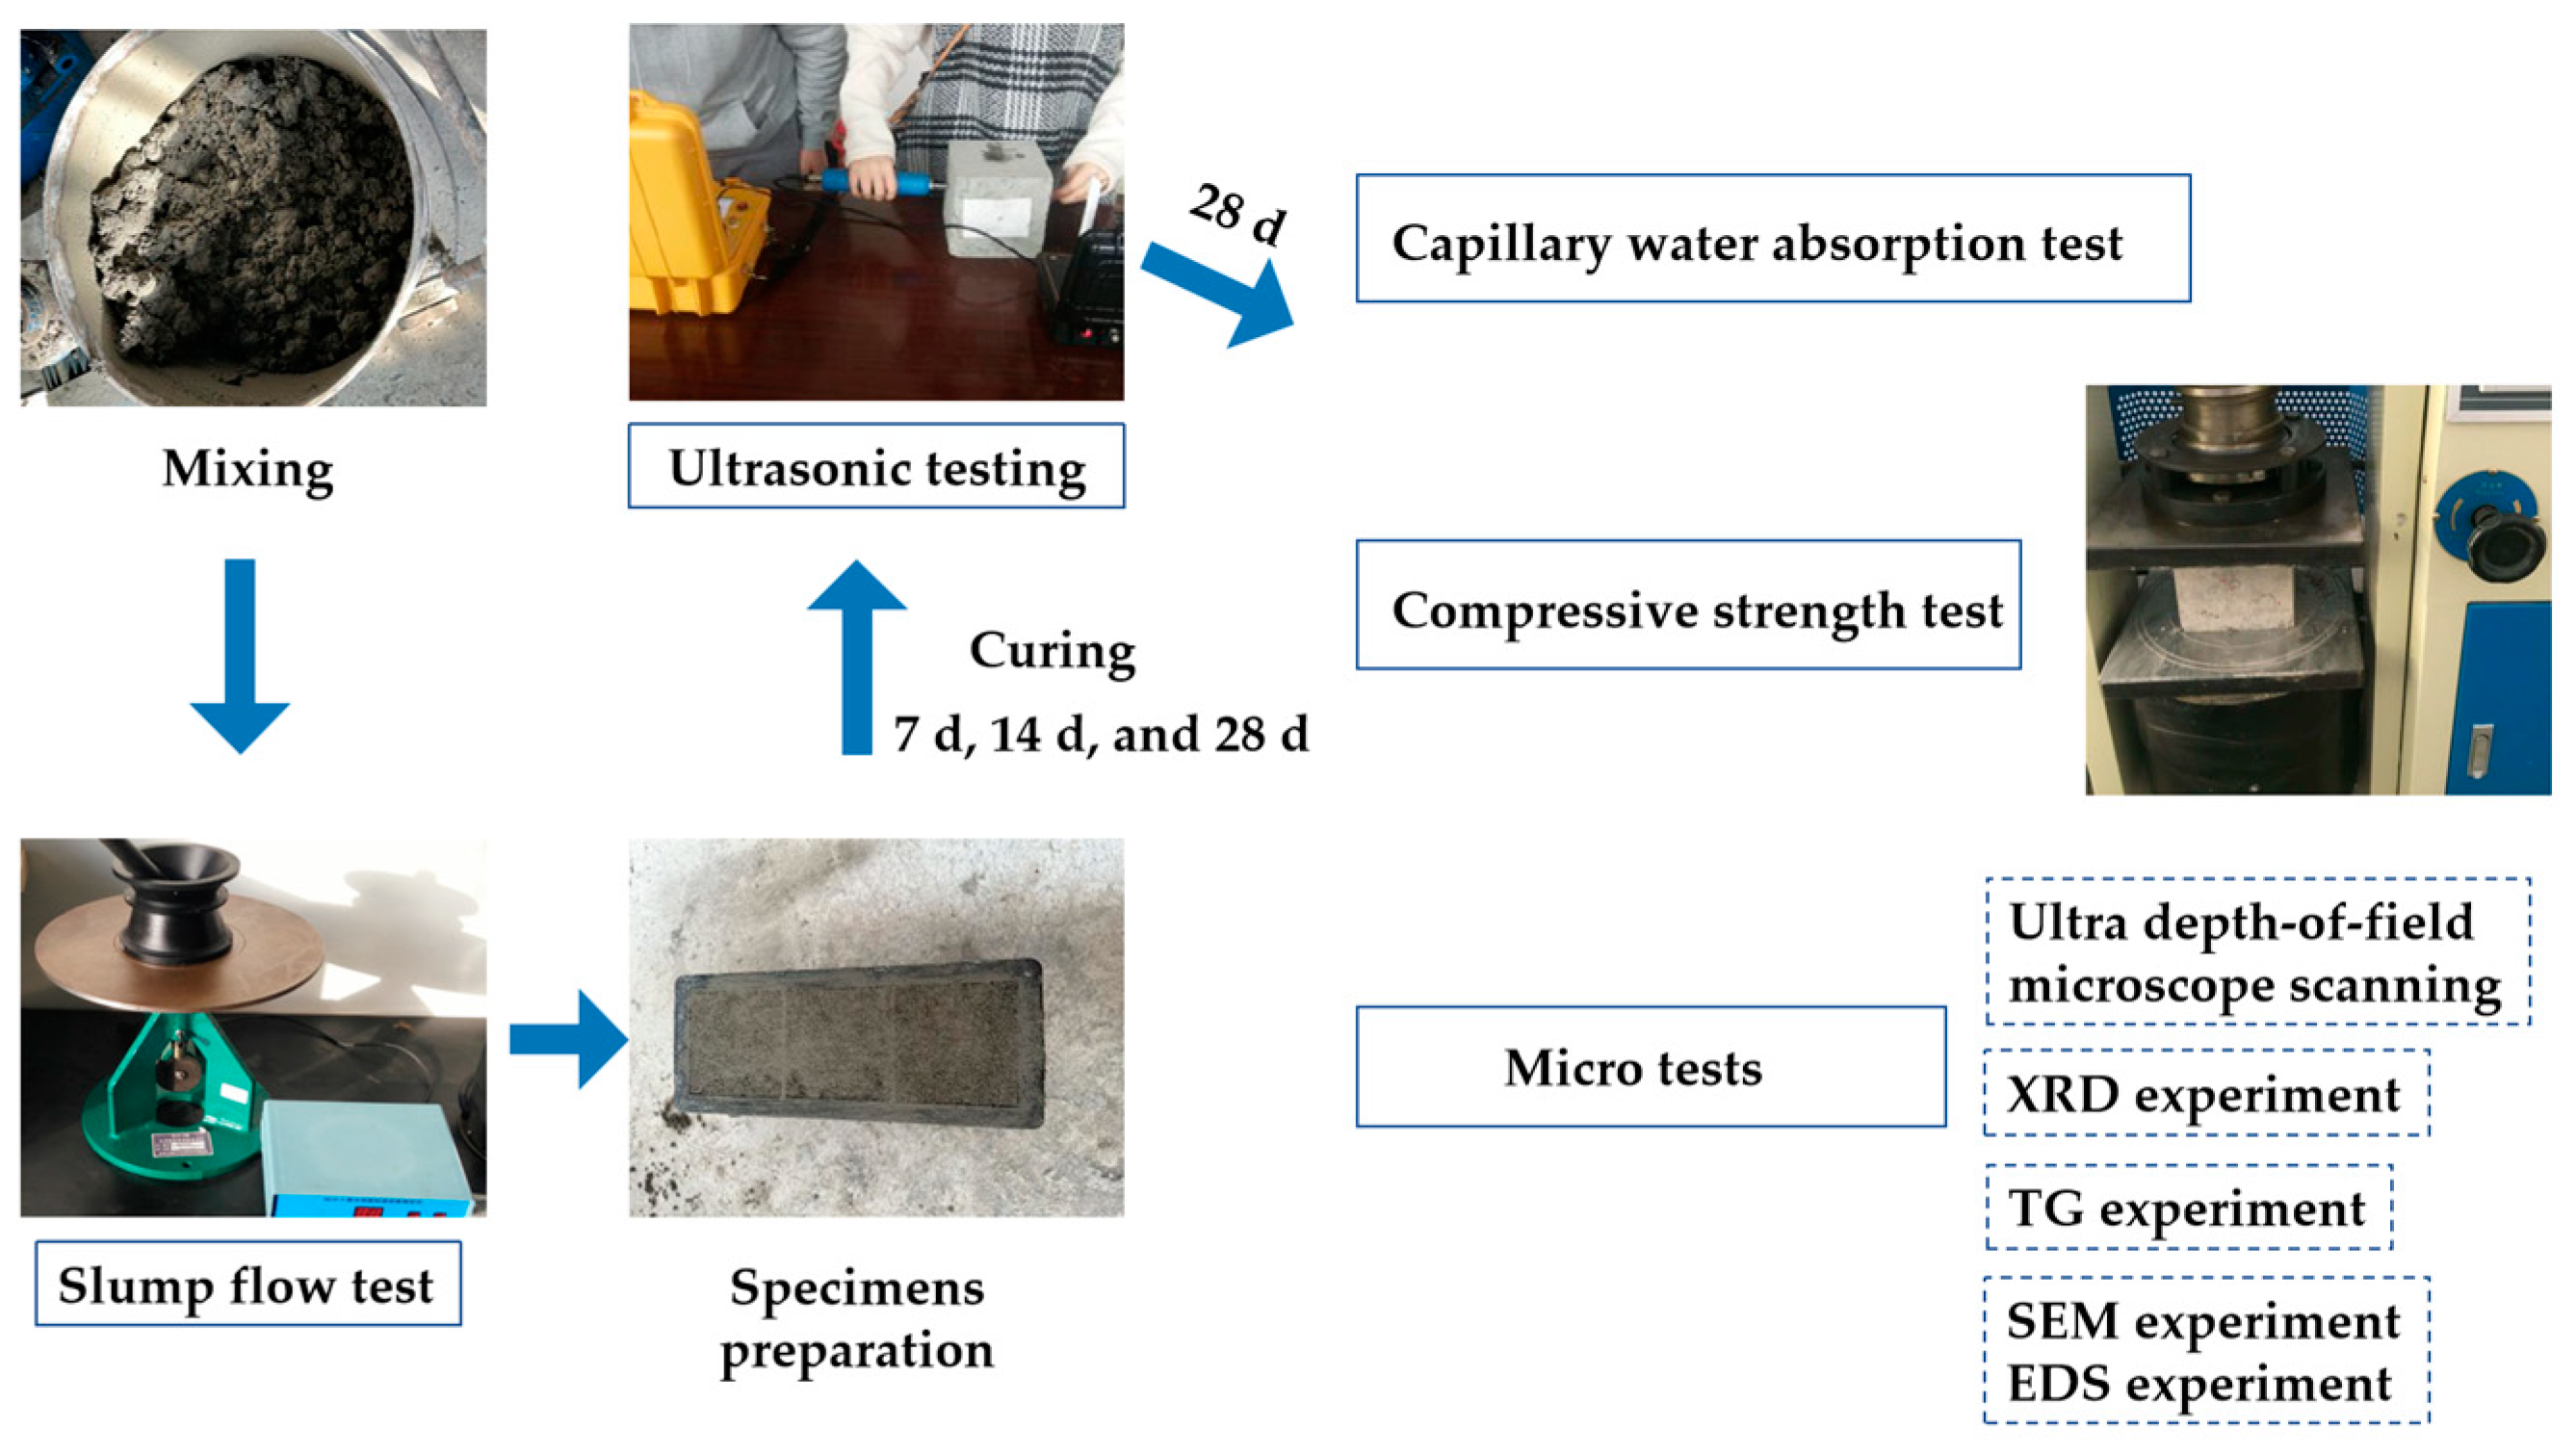
The slump flow test was in accordance with the GB/T 2419-2005 method for the flow determination of cement mortar [30]. Take out part of the fresh concrete and pour it into the test mold in the center of the jump table until basically level with the mold opening. Start the instrument immediately after removing the mold. Stop the instrument after jumping the table 25 times. Use a ruler to measure the maximum vertical diameter of the bottom surface of the concrete and calculate the arithmetic average of the two vertical diameters as the slump flow of the group. The 10 groups of specimens were tested according to the above experimental steps 6 times.

2.3.2. Ultrasonic Testing

The ultrasonic testing was carried out using the ZBL-U5100 ultrasonic testing instrument provided by Times Shuangjie Instrument Technology Co., Ltd., Tianjin, China. It was conducted after curing the samples for 7 days, 14 days, and 28 days. For the specific experimental methods, refer to the article written by Chen Bo and Ghani Razaqpur [31]. Since the speed of propagation of ultrasonic velocity in the solid phase is greater than that in the liquid and gas phases, concrete with higher ultrasonic velocity will have fewer cracks. In this experiment, there were 6 blocks in each group and 2 test points were sampled. The average value and coefficient of variation were taken in the final analysis.

2.3.3. Capillary Water Absorption Test

The methods for the capillary water absorption test referred to the article by Zhang C. et al. [32]. In this paper, only the water absorption at the bottom of the block was tested. Put the test block in the high-temperature drying oven. When the block is completely dry, first measure the length at the bottom of the block and calculate the area at the bottom of the block. Then, use epoxy resin glue from the bottom of the test block to 3–4 cm up the top (AB glue was mainly used in this paper) without a space. Then, weigh the mass of the sample. The depth of the water should not exceed 3–4 cm. Put the bottom of the test block down into the water, and remove the test block every two minutes and weigh the test block. When the quality of the block remains unchanged, the test of the particular test block can be ended. Six samples in each group were tested. The average value and coefficient of variation were taken in the final analysis.

2.3.4. Compressive Strength Test

After the completion of all the experiments above, the compressive strength test could commence [33]. The measuring process followed the Chinese standard GBJ 81–85 [34]. The strength measured from the 6 specimens in each group was eventually averaged for the final analysis.

2.3.5. Experiments on Microscopic Properties

The specimens were dried in an electric constant temperature blast-drying oven at (60 ± 5) °C for 24 h until they reached a constant weight. Each specimen was taken out and cooled in an indoor environment at (20 ± 5) °C. Then, the samples were subjected to microscopic mechanism tests. The TG-209F3 produced by the company NETZSCH, Bavaria, Germany was used in the TG analysis experiment. The samples were finely ground through a 0.1 mm sieve. Then, 100 mg was weighed on a thermal balance. The heating speed was controlled through a heating device, and the sensor monitored the weight changes of the sample in real time. The temperature ranged from 30 °C to 900 °C, with a heating rate of 10 °C/min and a nitrogen gas flow rate of 150 mL/min. By recording the sample quality with the temperature changes through a data collection and processing system, a graph of the relationship between the sample quality and the temperature changes could be obtained, and its characteristics could be analyzed. The Olympus DSX-500 provided by Shimai Technology Co., Ltd., Wuxi, China was used for the ultra depth-of-field microscope scanning experiment. To obtain a flat and undamaged sample surface, the sample of the cross-section was polished. The sample was placed under the microscope to observe and analyze the microstructure, surface texture, and distribution of the sludge particles. The samples were pulverized and used for XRD. It was carried out using a D8 Discover X-ray diffractometer from Brooke, Berlin, Germany. The scanning method was continuous slow scanning, with a working voltage of 40 kV, a current of 40 mA, a scanning speed of 0.6°/min, and a scanning range of 5° to 90°. After the experiment was completed, the XRD patterns were obtained. The crystal phase, crystal structure, and other information about its existence could be determined by this analysis. For the SEM-EDS experiment, a sample of a flat, rice-sized portion from inside the concrete was taken, and a layer of gold-plated film was sprayed on the surface before scanning. The sample was then placed in a vacuum environment for observation. In this experiment, a Nova Nano SEM scanning electron microscope, produced by FEI, Hillsboro, OR, USA, was used to observe the microstructure, with a resolution of 3.5 nm, an acceleration voltage of 500–30,000 V, a magnification of 18–30,000, a sample stage diameter of 30 mm, and a Brooke Quantum EDS spectrometer manufactured by Brooke, Berlin, Germany was used for elemental analysis in the micro range. The experimental procedure is shown in Figure 3.

3. Results and Discussion

3.1. Slump Flow Test Results

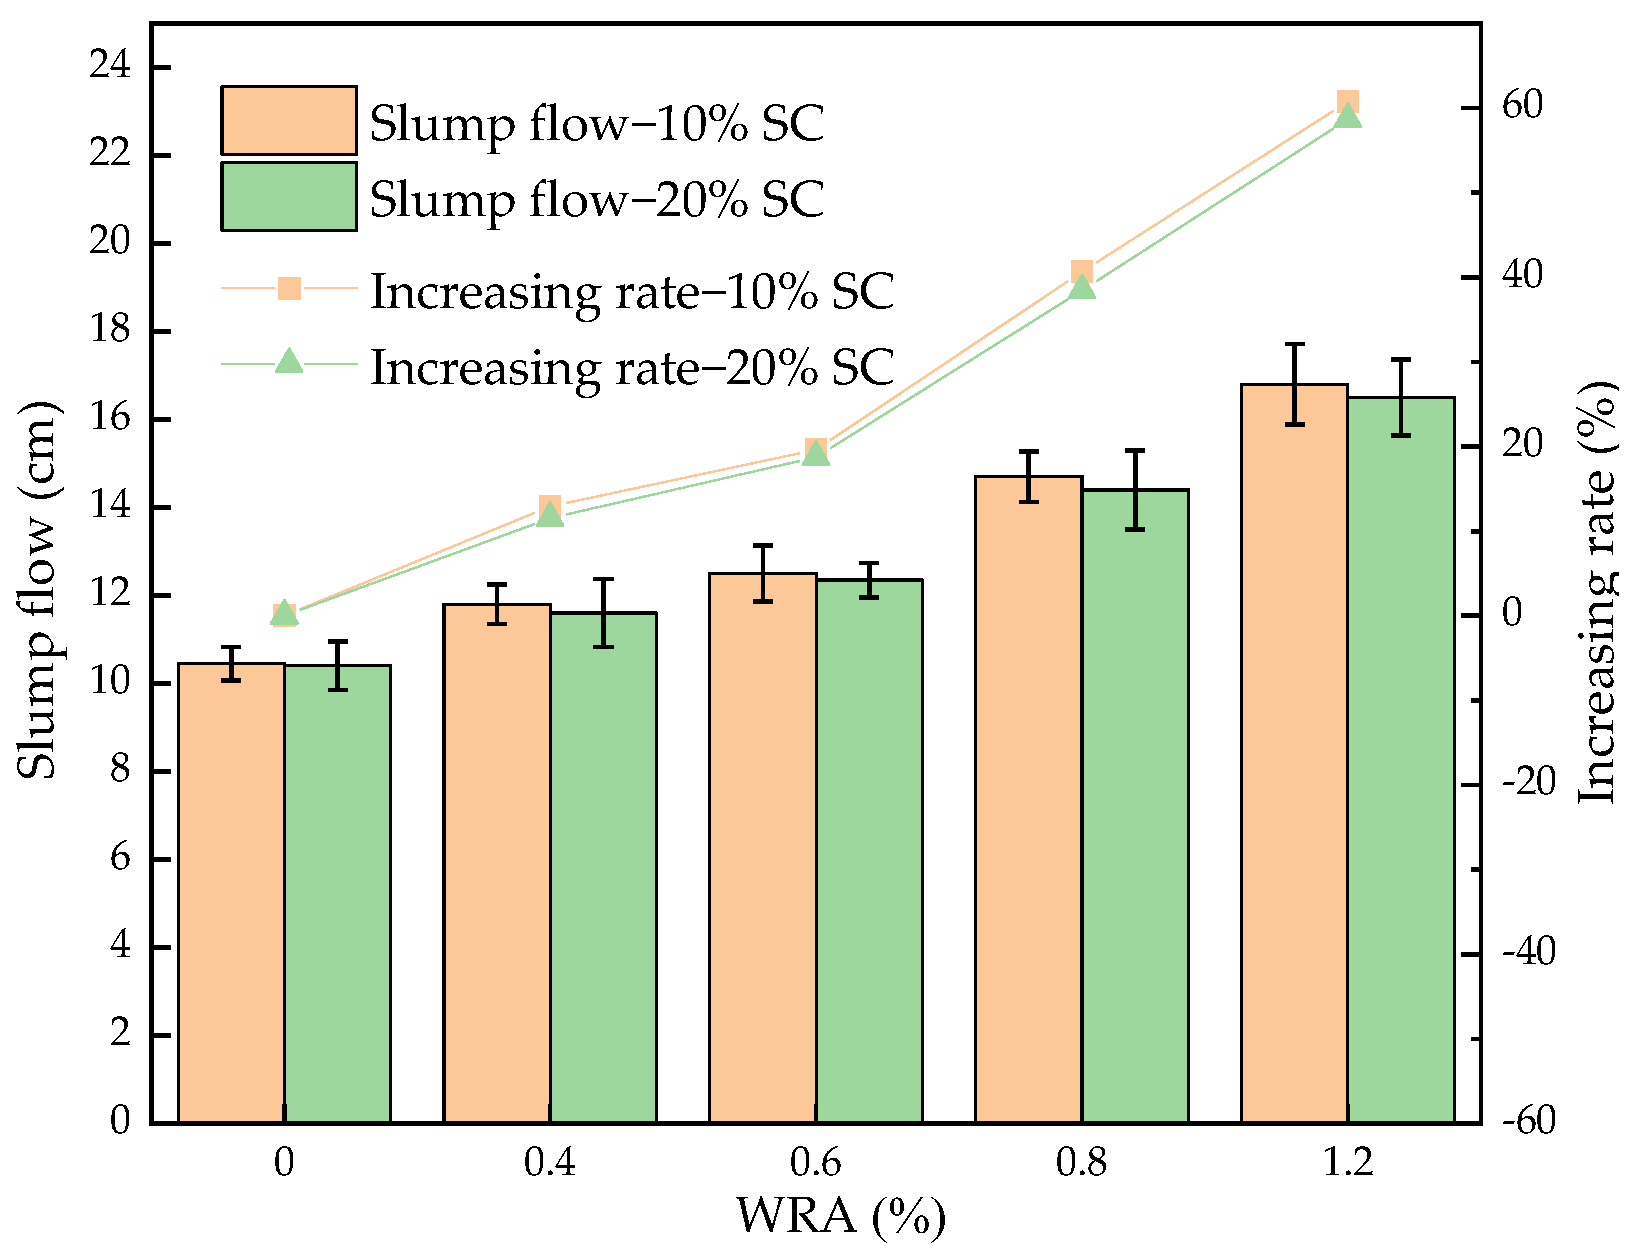
Figure 4 shows the slump flow of the fresh concrete with different WRA and different SC content. Figure 4 demonstrates that as the WRA content increased from 0% to 1.2%, the slump flow of the mortar exhibited an upward trend. The increasing rate of the slump flow with 10% SC varied from 0% to 60.77%. This was attributed to WRA’s ability to enhance the fluidity of the cement mixture [35]. However, the slump flow with a larger content of SC was relatively small, with a reduction by rates of up to 2.04%, indicating that increased SC particles lead to higher water absorption and reduced fluidity. Therefore, both the SC and WRA content affect the slump flow, although WRA has a more pronounced effect compared to SC.

3.2. Ultrasonic Testing Results

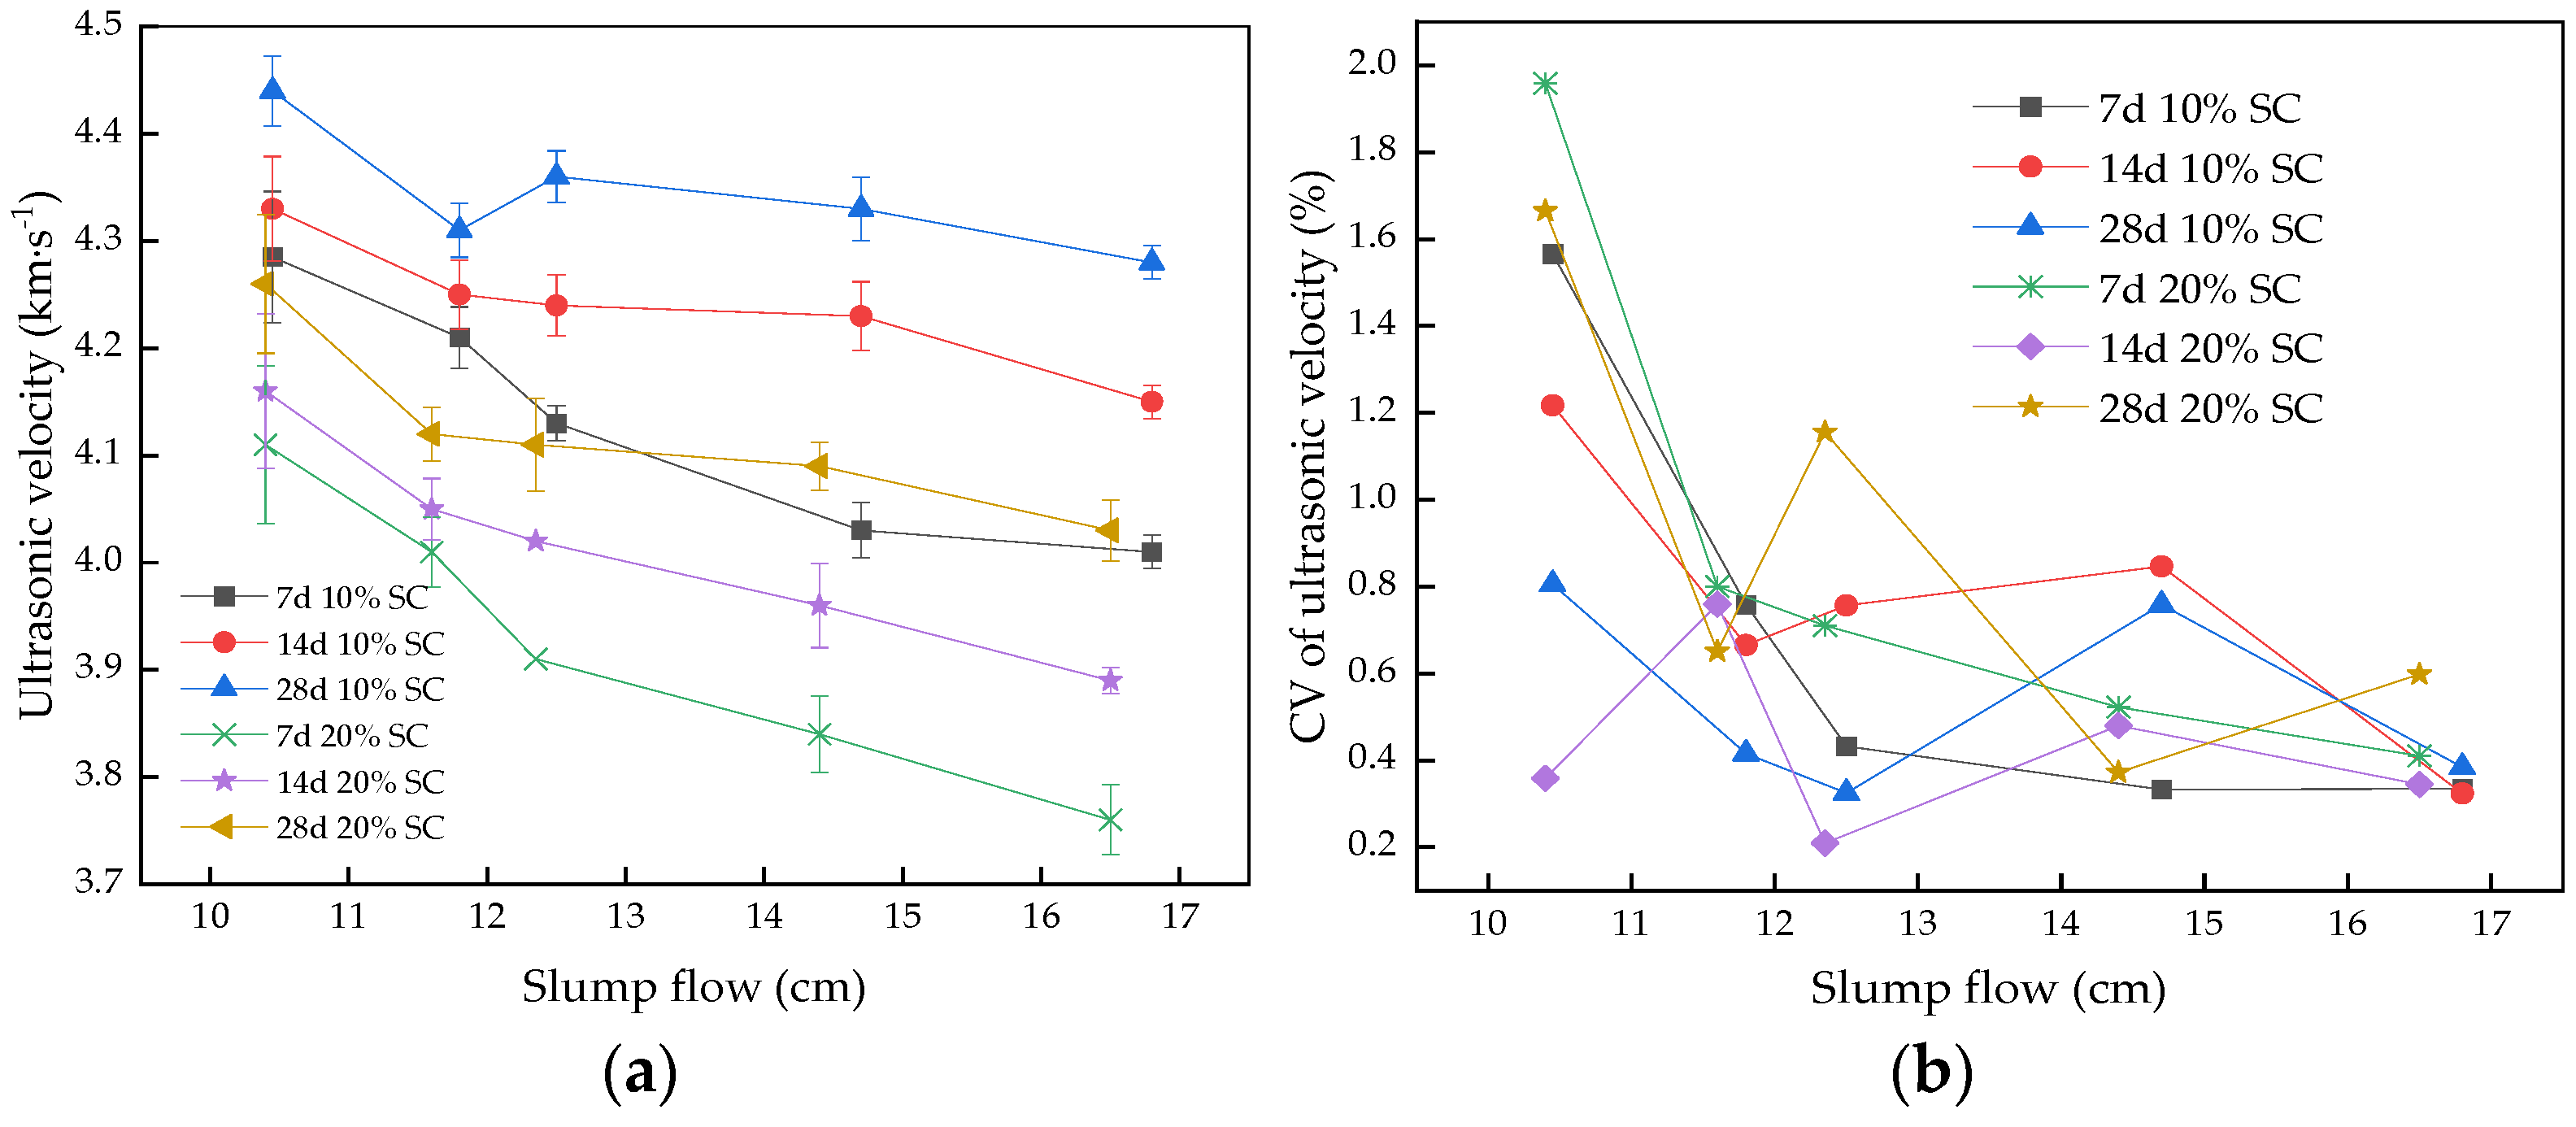
Figure 5a illustrates the correlation between the slump flow and the ultrasonic velocity. With increased fluidity, the ultrasonic sound speed of the hardened specimens decreased by 4.1~8.5%, indicating a deteriorated distribution of SC particles and increased porosity. Moreover, as shown in Figure 5a, the height of the curves shows that the ultrasonic velocity in each group increased continuously with age. It can be observed that the ultrasonic velocity curve of the groups with 10% SC was always above the curve with 20% SC, indicating that the internal compactness decreased with the increasing addition of SC. The ultrasonic velocity in some groups with lower WRA was higher than in other groups, indicating that excessive WRA can negatively impact concrete [36,37]. Figure 5b displays the coefficient of variation (CV) in the slump flow. A smaller CV indicated a positive effect on the concrete dispersion. The lowest CV was observed at a slump flow of 12.35 cm, indicating an optimal dispersion.

3.3. Capillary Water Absorption Test Results

Figure 6 shows the capillary water absorption of the different slump flows with the soaking time. Table 3 presents the fitting results for the soaking time (T) and water absorption (W). Initially, all the groups exhibited rapid increases, followed by stabilization. The rapid water absorption rate was due to the dry block, facilitating water absorption into the voids. As depicted in Figure 6, C9 and C10 with 1.2% WRA reached a maximum water absorption of 0.11%, indicating that the dispersion was the lowest [38]. This could be attributed to several factors. Firstly, the excessive WRA content may lead to overly fluid fresh concrete, causing bleeding in the poured test block. Additionally, the lower density of ceramsite compared to fresh mortar, after thinning, may result in segregation within fresh concrete [39,40]. The lowest final water absorption of C5 and C6 confirms the relatively symmetrical concrete interiors, with slump flows of 12.35 cm and 12.5 cm. It can be concluded that WRA can improve the condition of fresh concrete within a certain range, but exceeding that range results in adverse effects.

3.4. Compressive Strength Test Results

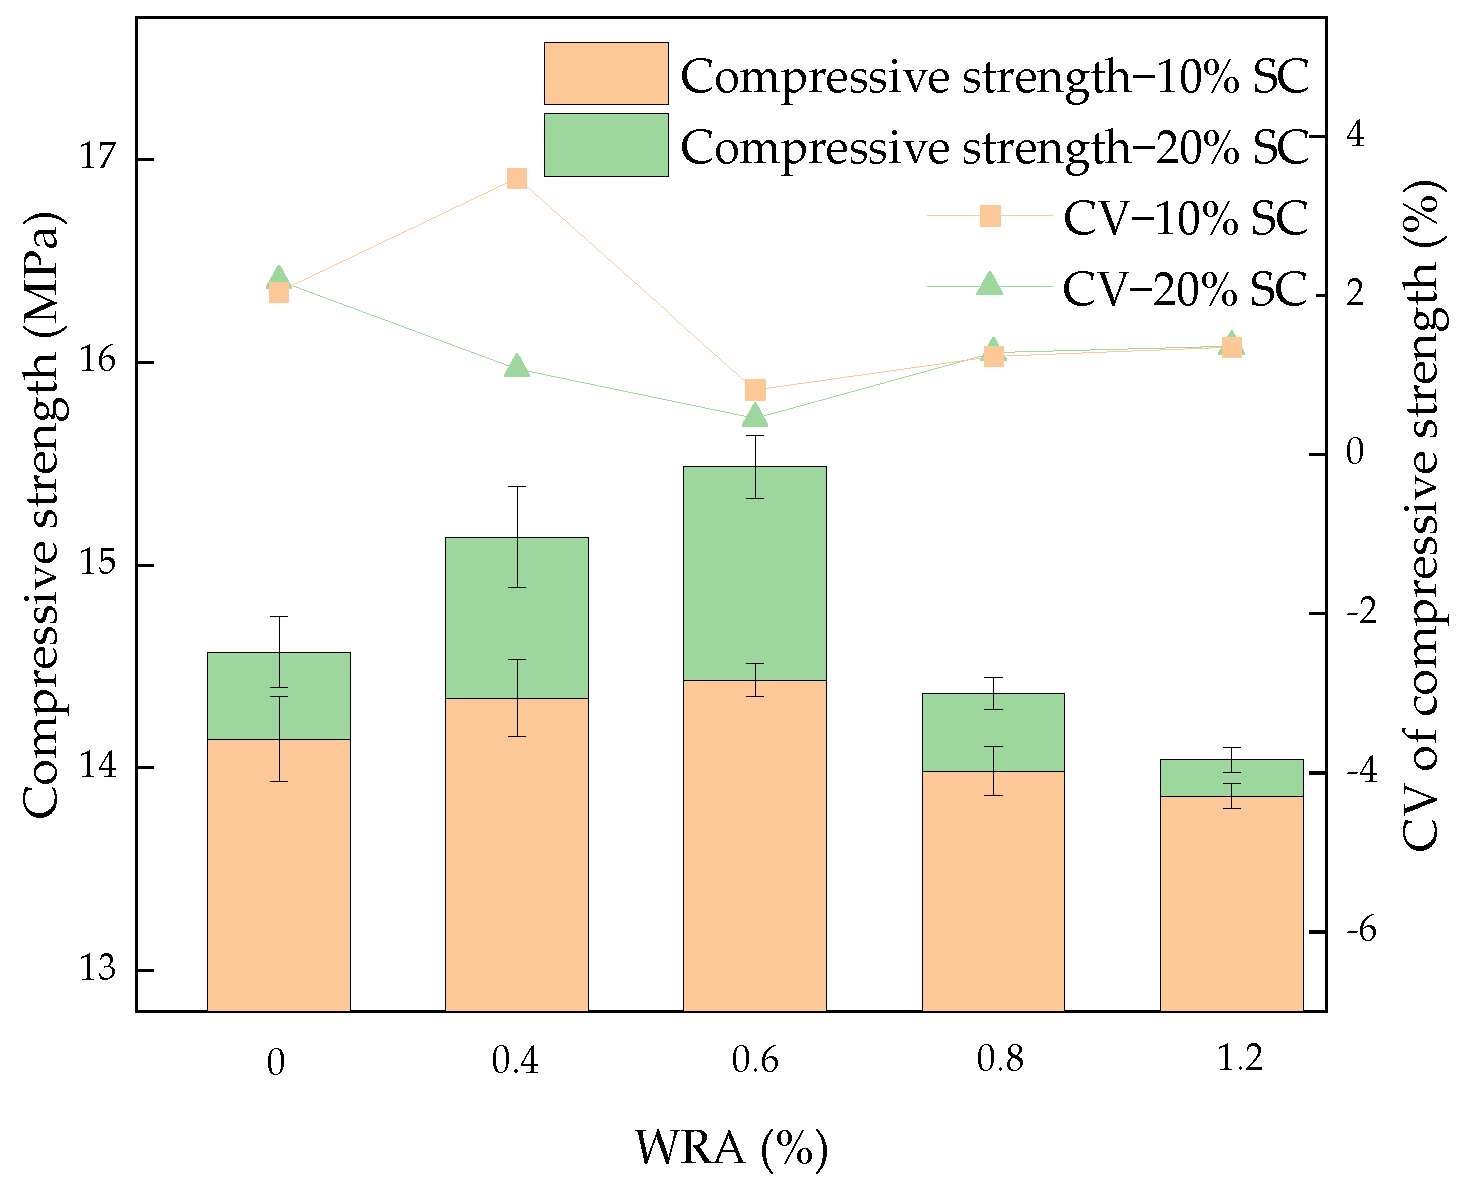
Figure 7 shows the compressive strength variation with the different SC and WRA. In Figure 7, the increase in fluidity caused the compressive strength of the concrete to first increase and then decrease. At a slump flow of 12.5 cm, the specimen achieved a maximum compressive strength of 15.51 MPa. The compressive strength of the concrete with the same WRA increased as the content of SC ranged from 10% to 20%. This was attributed to the porous nature of SC, enabling it to absorb free water in the concrete, thereby reducing the water–cement ratio and enhancing the strength [41,42,43]. The addition of WRA can enhance concrete’s compressive strength within a specific range. However, exceeding this range can lead to bleeding and other adverse conditions, thereby affecting the concrete strength [44]. To summarize, it was found that when the slump flow was 16.5 cm and 16.8 cm, the concrete had high water absorption and low compressive strength, showing poor concrete properties. By contrast, when the flow degree was around 12.5 cm, the water absorption was low, along with high compressive strength. The relationship between water absorption and compressive strength could be deduced as a negative correlation. As can be seen from the figure, the ultrasonic velocity was not necessarily related to the other two parameters. The CV was lower for slump flows of 12.5 cm and 12.45 cm. This indicates the good dispersion of concrete with 0.6% WRA. The CV with a 11.6 cm slump flow was the highest, indicating the poor dispersion of concrete with 20% SC and 0.4% WRA.

3.5. Interpretation of TG Curves

To quantify the hydration degree of the concrete under different fluidity, TG/DTG tests were carried out at a temperature ranging from 30 °C to 900 °C. Figure 8 shows the TG and DTG curves of the concrete. Based on the DTG curves, the mass loss of the sample can be mainly divided into three steps [45]. The first heat absorption peak (70–400 °C) was caused by the decomposition of C-S-H, AFt, etc.; the second heat absorption peak (400–500 °C) was caused by the dehydration reaction of calcium hydroxide (CH); and the third heat absorption peak (500–800 °C) was caused by the decomposition of calcium carbonate (CaCO3) [46]. Figure 8a presents the differences between the concrete with 10% SC and 20% SC when the addition of WRA was 0%. The decomposition of organic matter occurred before the decomposition of CH. It could be seen that the organic matter of 20% SC was higher than 10% SC. The decomposition content of CH in 20% SC was less than 10% SC, which may be because the organic matter in SC prevented the formation of CH. As shown in Figure 8b–e, the total mass loss increased and then decreased with the increase in fluidity. When the addition of WRA was 0.6%, the mass loss was the largest, indicating the highest hydration degree.

3.6. Ultra Depth-of-Field Microscope Results

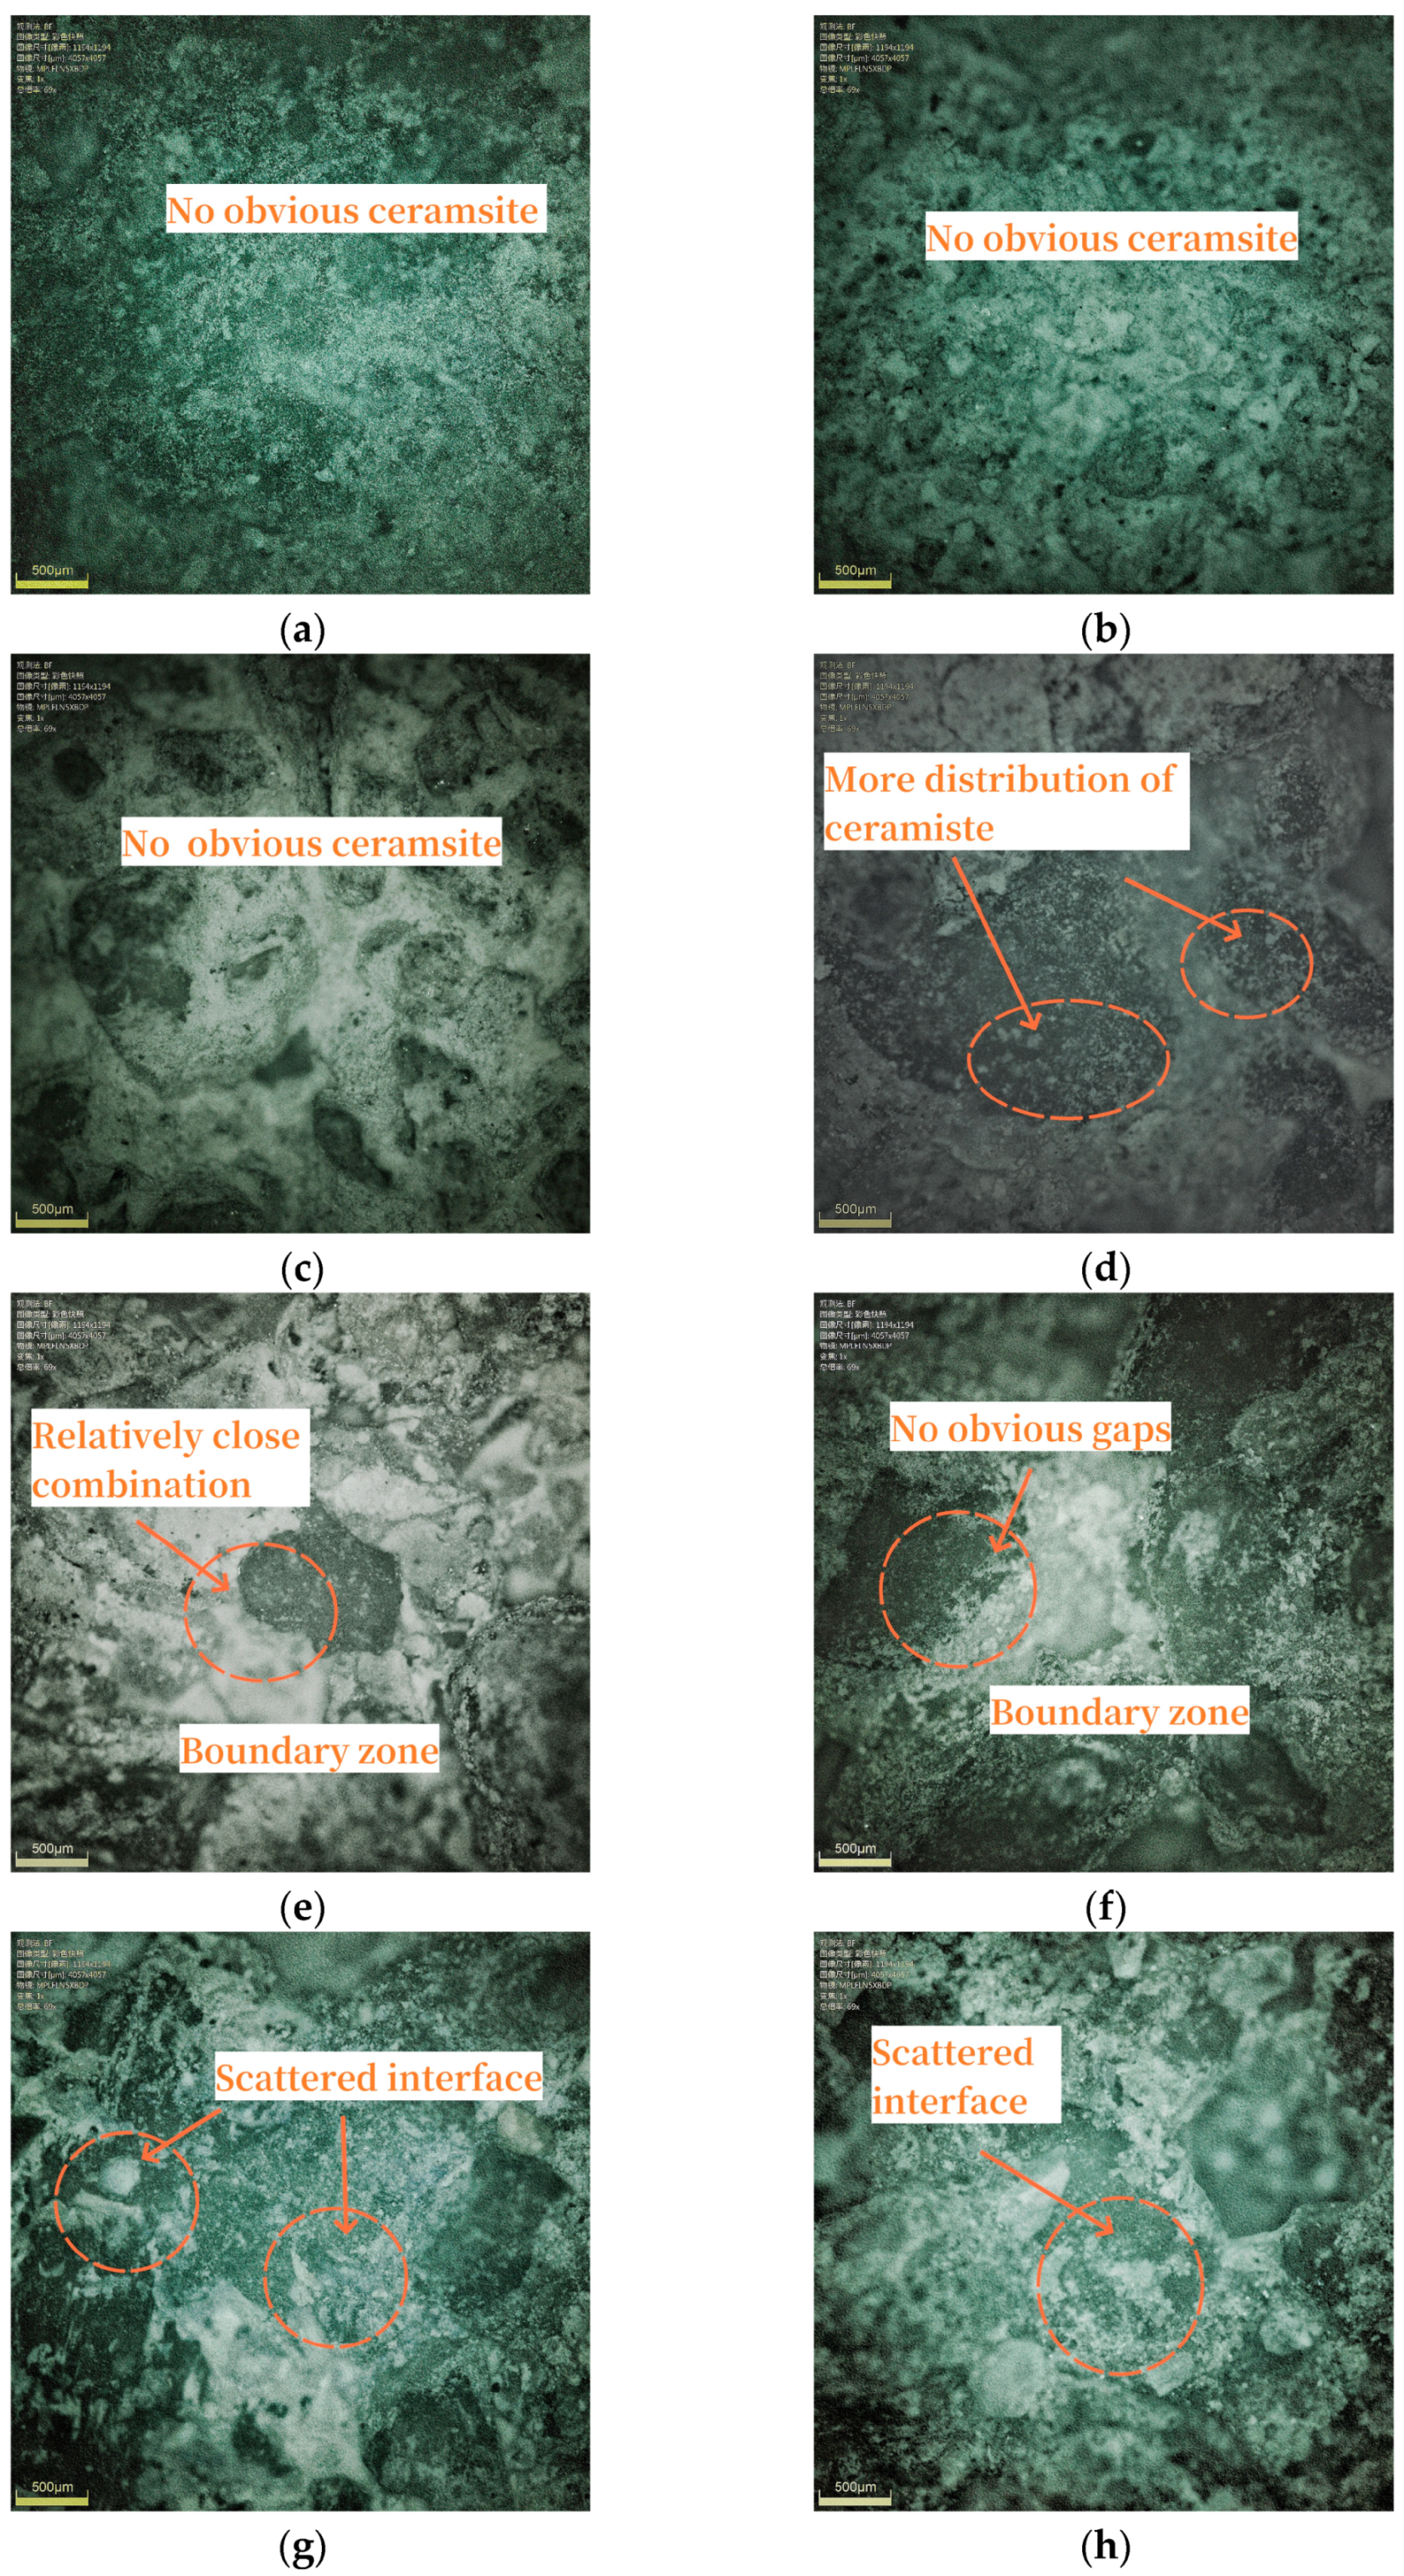
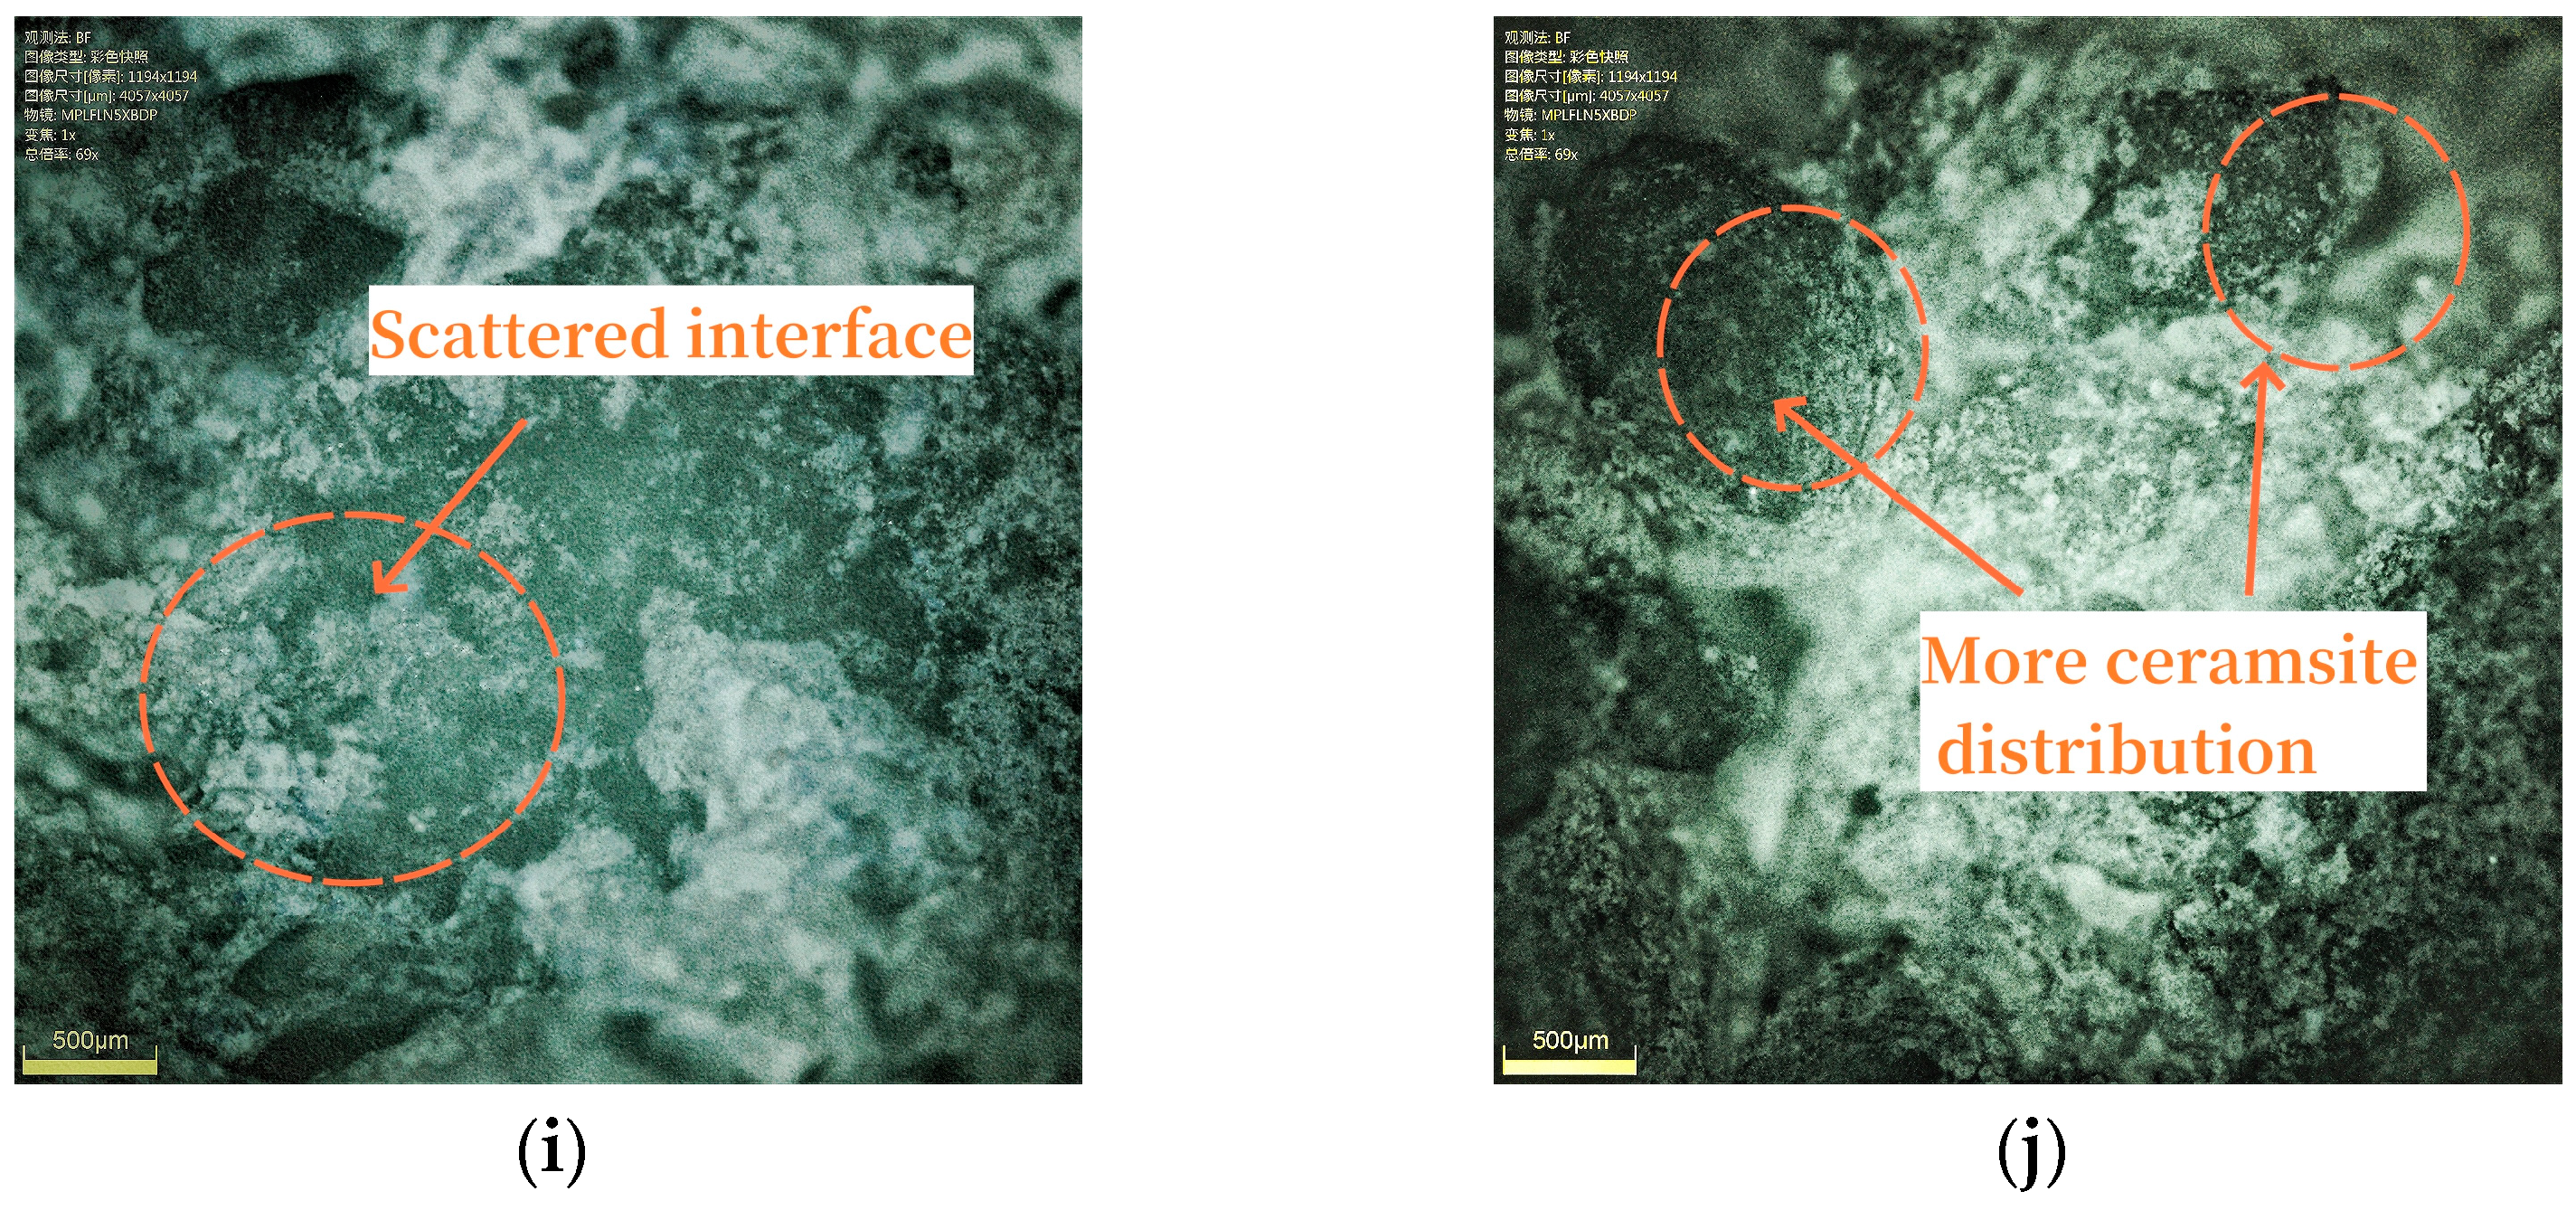
The concrete was scanned in section. The results are shown in Figure 9. Due to the instrument, the figures in the upper left corner were displayed in Chinese. It can be seen that the dispersion of ceramsite changed from uniform to dispersed with the increase in fluidity. The samples with 0% WRA cannot show obvious ceramsite. With the increasing addition of SC, there was an area distribution of ceramsite and the interface could be seen more easily. When the addition of WRA was 0.6%, it can be seen that the ceramsite and other materials were relatively bonded, with no obvious gaps. In contrast, the distribution of ceramsite in the 0.8% and 1.2% WRA samples was more dispersed. The concrete surface was relatively uneven [47]. In particular, as can be seen in Figure 9j, the addition of WRA was prone to the stratification of aggregate and hydration products.

3.7. XRD Analysis

Figure 10 shows XRD images of the specimens. From Figure 10, the diffraction peaks of CH and SiO2 mainly appeared, in addition to the presence of calcium feldspar (anorthite -CaAl2Si2O8) and hydration products such as calcium silicate hydrate (C-S-H). In the 10% and 20% SC concrete, the SiO2 diffraction peaks of the samples with WRA of 0.6% and 0.8% were lower, indicating that more SiO2 was involved in the hydration-hardening reaction to change the crystalline form. However, the sample of 1.2% WRA had greater SiO2 content, which was because more water caused by segregation could not react completely. Furthermore, the SiO2 reduced with the increasing addition of SC in the hydration reaction, indicating that the participation of the components was enhanced [48]. In the 20% SC concrete, the samples with 0.4% and 0.8% WRA had a higher calcium feldspar peak intensity. The presence of this crystalline state could provide some mechanical strength to the SC, resulting in higher compressive strength.

3.8. SEM-EDS Analysis

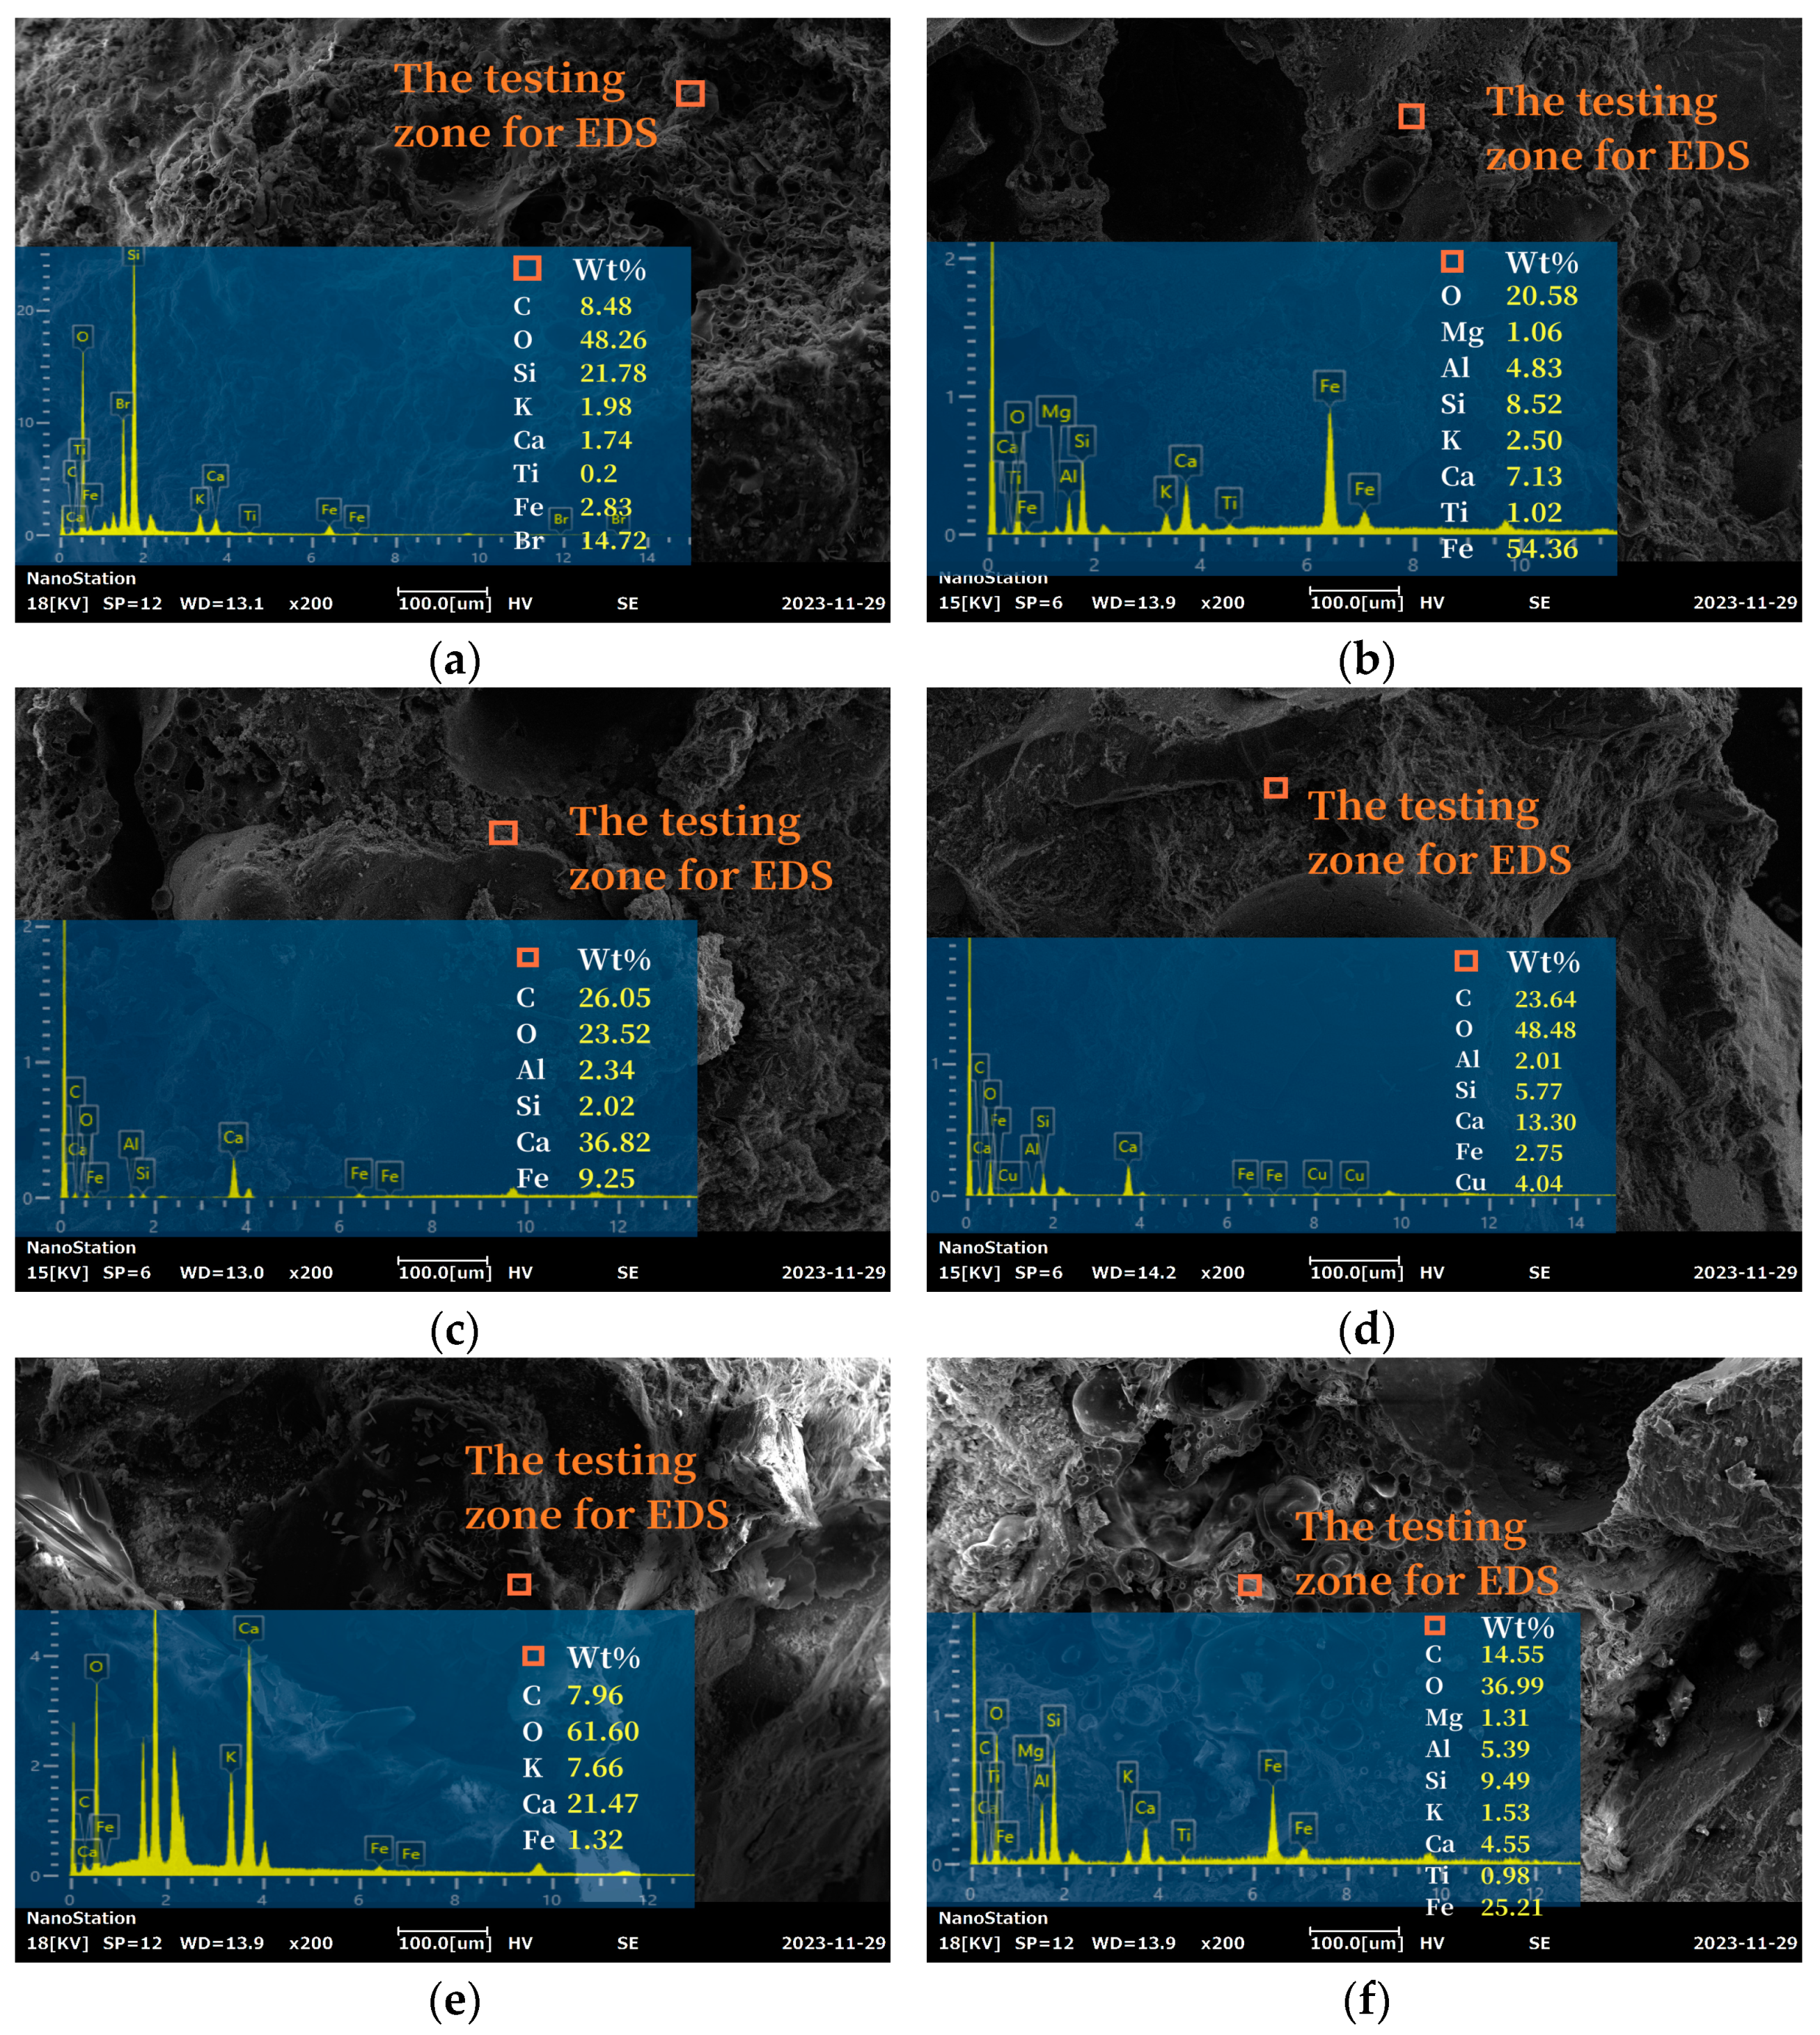
SEM images of each group are shown in Figure 11. Table 4 shows the element distribution obtained by EDS. The interfacial transition zone (ITZ) was the primary focus of this study. As observed in these images, the amount of calcium hydroxide (CH) first decreased and then increased with the increasing fluidity. Concurrently, as the amount of SC increased, the quantity of hydration products also increased. The ITZ of the sample with the addition of 10% SC and 0% WRA exhibited a greater number of particles and more pronounced pores. The concrete interface appeared rougher, with a reduced presence of nearby hydration products. In the samples with the addition of 20% SC and 0% WRA, distinct macropores were observed. Near the ITZ, the distribution of the hydration products was uneven. Additionally, more obvious clustered products were observed in the ITZ of the samples with 0.4% WRA. In the ITZ of samples with the addition of 10% SC and 0.6% WRA, the C-S-H gel was more tightly wrapped, forming a more continuous bond [49]. In the samples with the addition of 20% SC and 0.6% WRA, a higher number of flocculent products were observed in the left region, along with dense hydration products and increased densification in the ITZ [50,51]. This finding reinforced the notion that the concrete with 0.6% WRA exhibited a superior internal structure. The ITZ of the samples with the addition of 0.8% WRA and 1.2% WRA showed an interior with no obvious hydration products. Particularly in C9, there was a small amount of flocculent products generated, and the overall connection was not tight enough. Similarly, it was verified that the concrete strength was lower at this WRA content.
Table 5 shows the Ca/Si ratio obtained by EDS. The Ca/Si ratios of C1, C5, C6 and C7 were relatively low. This may be due to the SiO2 in the aggregate. The low Ca/Si ratio of the C-S-H gels was beneficial for the gels and concrete, because the average length of the silicate chain of C-S-H gels increased with the low Ca/Si ratio, the degree of polymerization increased, and the performance was better.

4. Conclusions

In this study, the influence of fluidity on ultrasonic velocity, capillary water absorption, and compressive strength was studied. The ceramsite dispersion was characterized by CV. The optimum slump flow was 12.35 and 12.5 cm, which was also verified by microscopic tests. The conclusions are as follows:
(1)
The addition of WRA improved the fluidity. Conversely, the addition of SC reduced the fluidity. WRA caused a much greater change in the concrete fluidity.
(2)
The relationship between the ultrasonic sound speed and the increasing fluidity could be deduced as a negative correlation. The addition of SC increased the internal defects and compressive strength. The water absorption was negatively correlated with the compressive strength. The concrete with a slump flow of 12.35 and 12.5 cm reaching the maximum compressive strength, which had the lowest water absorption, demonstrated internal homogeneity.
(3)
By analyzing of the ultrasonic velocity’s CV and the compressive strength’s CV, the fresh cement concrete with a slump flow of 12.5 cm shows the lowest CV, indicating the optimum SC dispersion. The optimum slump flow was 12.35 and 12.5 cm. That is the concrete with 0.6% WRA. The TG analysis revealed that the addition of 0.6% WRA promoted the hydration of cement. Combined with the XRD and SEM results, the amount of calcium hydroxide (CH) was the least with the concrete of 0.6% WRA addition. Furthermore, the organic substances in SC increased the hydration products. These phenomena indicated that a more homogeneous dispersion of SC and better concrete properties were obtained at a slump flow of 12.35 and 12.5 cm, which can be used in the future.

Author Contributions

Conceptualization, B.X. and B.C.; methodology, Y.Y.; software, Y.Y.; validation, B.X. and Z.C.; formal analysis, Y.Y.; investigation, Y.Y. and H.W.; resources, B.C.; data curation, H.W.; writing—original draft preparation, Y.Y.; writing—review and editing, Y.Y., X.P., Z.C. and H.W.; visualization, Y.Y. and H.W.; supervision, Z.C., X.P. and H.W.; project administration, B.X., X.P. and H.W.; funding acquisition, H.W. and X.P. All authors have read and agreed to the published version of the manuscript.

Funding

This research was supported by Zhejiang Provincial Natural Science Foundation of China (No. LY22E080005, NO. LY24E080010).

Institutional Review Board Statement

Not applicable.

Informed Consent Statement

Not applicable.

Data Availability Statement

The data used to support the findings of this study are available on request.

Conflicts of Interest

Author Bing Xiao was employed by Road & Bridge International Co., Ltd., Author Bingling Cheng was employed by Ningbo Yonghuan Yuan Environmental Protection Engineering Technology Co., Ltd. Author Xi Peng was employed by Ningbo Roaby Technology Industrial Group Co., Ltd. The remaining authors declare that the research was conducted in the absence of any commercial or financial relationships that could be construed as a potential conflict of interest.

References

  1. Bandieira, M.; Zat, T.; Schuster, S.L.; Justen, L.H.; Weide, H.; Rodríguez, E.D. Water treatment sludge in the production of red-ceramic bricks: Effects on the physico-mechanical properties. Mater. Struct. 2021, 54, 168. [Google Scholar] [CrossRef]
  2. Schumacher, K.; Samannshausen, N.; Pritzel, C.; Trettin, R. Lightweight aggregate concrete with an open structure and a porous matrix with an improved ratio of compressive strength to dry density. Constr. Build. Mater. 2020, 264, 120167. [Google Scholar] [CrossRef]
  3. Alderete, N.M.; Joseph, A.M.; Heede, P.V.D.; Matthys, S.; Belie, N.D. Effective and sustainable use of municipal solid waste incineration bottom ash in concrete regarding strength and durability. Resour. Conserv. Recycl. 2021, 167, 105356. [Google Scholar] [CrossRef]
  4. Yang, Z.; Ji, R.; Liu, L.; Wang, X.; Zhang, Z. Recycling of municipal solid waste incineration by-product for cement composites preparation. Constr. Build. Mater. 2018, 162, 794–801. [Google Scholar] [CrossRef]
  5. Wang, H.; Xu, J.; Sheng, L. Preparation of ceramsite from municipal sludge and its application in water treatment: A review. J. Environ. Manag. 2021, 287, 11237. [Google Scholar] [CrossRef] [PubMed]
  6. Lim, Y.C.; Shih, Y.-J.; Tsai, K.-C.; Yang, W.-D.; Chen, C.-W.; Dong, C.-D. Recycling dredged harbor sediment to construction materials by sintering with steel slag and waste glass: Characteristics, alkali-silica reactivity and metals stability. J. Environ. Manag. 2020, 270, 110869. [Google Scholar] [CrossRef] [PubMed]
  7. Kuandykova, A.; Taimasov, B.; Potapova, E.; Sarsenbaev, B.; Kolesnikov, A.; Begentayev, M.; Kuldeyev, E.; Dauletiyarov, M.; Zhanikulov, N.; Amiraliyev, B. Production of Composite Cement Clinker Based on Industrial Waste. J. Compos. Sci. 2024, 8, 257. [Google Scholar] [CrossRef]
  8. Hu, K.; Zhang, Z.; Zhou, Q.; Fang, Y.; Li, W.; Zhang, W.; Zhang, W.; Fan, S. Experimental study on the preparation of lightweight ceramsite with engineering muck. New Build. Mater. 2022, 49, 6–9. [Google Scholar]
  9. Zeng, Y.; Zhou, X.; Tang, A. Shear performance of fibers-reinforced lightweight aggregate concrete produced with industrial waste ceramsite-lytag after freeze-thaw action. J. Clean. Prod. 2021, 328, 129626. [Google Scholar] [CrossRef]
  10. Zhu, H.; Xiao, Y.; Li, X.; Wang, Y.; Wen, S. Study on Flexural Strength of Interface between Full Lightweight Ceramsite Concrete and Ordinary Concrete. Coatings 2023, 13, 1383. [Google Scholar] [CrossRef]
  11. Vishwajith, A.G.H.; Mahanama, K.R.R.; Wijesinghe, L.P.R.J. Investigation on the effective disposal of sludge from a water treatment plant. Water Pract. Technol. 2023, 18, 130–139. [Google Scholar] [CrossRef]
  12. Jia, G.; Wang, Y.; Yang, F.; Ma, Z. Preparation of CFB fly ash/sewage sludge ceramsite and the morphological transformation and release properties of sulfur. Constr. Build. Mater. 2023, 373, 130864. [Google Scholar] [CrossRef]
  13. Rashad, A. Lightweight expanded clay aggregate as a building material–An overview. Constr. Build. Mater. 2018, 170, 757–775. [Google Scholar] [CrossRef]
  14. Wang, J.; Wang, S.; Wang, H.; He, Z. Influence of Ceramsite with Assembly Unit of Sludge and Excavated Soil on the Properties of Cement Concrete. Materials 2022, 15, 3164. [Google Scholar] [CrossRef]
  15. Xie, J.; Liu, J.; Liu, F.; Wang, J.; Huang, P. Investigation of a new lightweight green concrete containing sludge ceramsite and recycled fine aggregates. J. Clean. Prod. 2019, 235, 1240–1254. [Google Scholar] [CrossRef]
  16. Wang, C.-Q.; Duan, D.-Y.; Huang, D.-M.; Chen, Q.; Tu, M.-J.; Wu, K.; Wang, D. Lightweight ceramsite made of recycled waste coal gangue & municipal sludge: Particular heavy metals, physical performance and human health. J. Clean. Prod. 2022, 376, 134309. [Google Scholar]
  17. Khazaleh, M.A.; Kumar, P.K.; Mohamed, M.; Kandasamy, A. Influence of coarse coal gangue aggregates on properties of structural concrete with nano silica. Mater. Today Proc. 2023, 72, 2089–2095. [Google Scholar] [CrossRef]
  18. Luo, Z.; Guo, J.; Liu, X.; Mu, Y.; Zhang, M.; Zhang, M. Preparation of ceramsite from lead-zinc tailings and coal gangue: Physical properties and solidification of heavy metals. Constr. Build. Mater. 2023, 368, 130426. [Google Scholar] [CrossRef]
  19. Li, J.; Gao, G. Preparation of ceramsite concrete from paper mill sludge and its application ingreen self-insulation wall material. New Build. Mater. 2021, 48, 154. [Google Scholar]
  20. Fan, L.; Zhang, Z.; Yu, Y.; Li, P.; Cosgrove, T. Effect of elevated curing temperature on ceramsite concrete performance. Constr. Build. Mater. 2017, 153, 423–429. [Google Scholar] [CrossRef]
  21. Bu, C.; Yang, H.; Liu, L.; Zhu, D.; Sun, Y.; Yu, L.; Ouyang, Y.; Cao, X.; Wei, Q. Quantification of Ceramsite Granules in Lightweight Concrete Panels through an Image Analysis Technique. Materials 2022, 15, 1603. [Google Scholar] [CrossRef] [PubMed]
  22. Yakovlev, G.; Saidova, Z.; Gordina, A.; Kuzmina, N.; Ginchitskaya, Y.; Knyazeva, S.; Elrefai, A. Application of ceramsite dust as an active pozzolan additive in the cement-based compositions. IOP Conf. Ser. Mater. Sci. Eng. 2021, 1203, 032022. [Google Scholar] [CrossRef]
  23. Wei, H.; Song, B.; Huan, Q.; Song, C.; Wang, S.; Song, M. Preparation of iron tailings-based porous ceramsite and its application to lead adsorption: Characteristic and mechanism. Sep. Purif. Technol. 2024, 342, 126839. [Google Scholar] [CrossRef]
  24. Bu, C.; Zhu, D.; Liu, L.; Lu, X.; Sun, Y.; Yan, Z.; Yu, L.; Wei, Q. A Study on the Mechanical Properties and Microcosmic Mechanism of Basalt Fiber Modified Rubber Ceramsite Concrete. Buildings 2022, 12, 103. [Google Scholar] [CrossRef]
  25. Wang, P.; Zhang, J.; Duan, K. Experimental Study on Influencing Factors of the Separation of Silt Ceramsite Concrete. J. Jinling Inst. Technol. 2019, 35, 47–51. [Google Scholar]
  26. Wang, H.; Gao, X.; Wang, R. The influence of rheological parameters of cement paste on the dispersion of carbon nanofibers and self-sensing performance. Constr. Build. Mater. 2017, 134, 673–683. [Google Scholar] [CrossRef]
  27. Wang, Z.; Gao, J.; Ai, T.; Jiang, W.; Zhao, P. Quantitative evaluation of carbon fiber dispersion in cement based composites. Constr. Build. Mater. 2014, 68, 26–30. [Google Scholar] [CrossRef]
  28. JGJ/T 12-2019; Technical Standard for Application of Lightweight Aggregate Concrele. Ministry of Housing and Urban-Rural Development of the People’s Republic of China: Beijing, China, 2019.
  29. GB/T 17431.2-2010; Lightweight Aggregates and Its Test Methods-Part 2: Test Methods for Lightweight Aggregates. The State Bureau of Quality and Technical Supervision: Beijing, China, 2010.
  30. GB/T 2419-2005; Test Method for Fluidity of Cement Mortar. The State Bureau of Quality and Technical Supervision: Beijing, China, 2005.
  31. Chen, B.; Razaqpur, A.G. Effect of air-entrainment and phase transition on chloride diffusion in partially frozen concrete. Cold Reg. Sci. Technol. 2022, 196, 103513. [Google Scholar] [CrossRef]
  32. Zhang, C.; Zhang, S.; Yu, J.; Kong, X. Water absorption behavior of hydrophobized concrete using silane emulsion as admixture. Cem. Concr. Res. 2022, 154, 106738. [Google Scholar] [CrossRef]
  33. Amer, I.; Abdelkhalik, A.; Mayhoub, O.A.; Kohail, M. Development of sustainable slag-based geopolymer concrete using different types of chemical admixtures. Int. J. Concr. Struct. Mater. 2024, 18, 27. [Google Scholar] [CrossRef]
  34. GBJ81-85; Test Method for Mechanical Properties of Ordinary Concrete. National Standards of people’s Republic of China: Beijing, China, 1986.
  35. Nahhab, A.H.; Ketab, A.K. Influence of content and maximum size of light expanded clay aggregate on the fresh, strength, and durability properties of self-compacting lightweight concrete reinforced with micro steel fibers. Constr. Build. Mater. 2020, 233, 117922. [Google Scholar] [CrossRef]
  36. Xu, F.; Chang, R.; Zhang, D.; Liang, Z.; Wang, K.; Wang, H. Improvement of CO2-cured sludge ceramsite on the mechanical performances and corrosion resistance of cement concrete. Materials 2022, 15, 5758. [Google Scholar] [CrossRef] [PubMed]
  37. Peng, X.; Shi, F.; Yang, J.; Yang, Q.; Wang, H.; Zhang, J. Modification of construction waste derived recycled aggregate via CO2 curing to enhance corrosive freeze-thaw durability of concrete. J. Clean. Prod. 2023, 405, 137016. [Google Scholar] [CrossRef]
  38. Zhuang, Y.Z.; Chen, C.Y.; Ji, T. Effect of shale ceramsite type on the tensile creep of lightweight aggregate concrete-sciencedirect. Constr. Build. Mater. 2013, 46, 13–18. [Google Scholar] [CrossRef]
  39. Tong, L.; Ji, J.; Yang, J.; Qian, X.; Li, X.; Wang, H.; Zhou, S.; Wu, Y.; Zhao, Y.; Yuan, X. Sludge-based ceramsite for environmental remediation and architecture ingredients. J. Clean. Prod. 2024, 448, 141556. [Google Scholar] [CrossRef]
  40. Zang, J.; Pan, C.; Hu, Y.; Qu, S.; Li, M.E. Preparation of Ceramsite Using Dehydrated Silt Soil and Its Performance on Compressive Strength of Ceramsite Concrete Block. Sustainability 2023, 15, 9134. [Google Scholar] [CrossRef]
  41. Reza, S.M.; Mohammad, M.; Mohammad, A.H. Impact of fine lightweight aggregates and coal waste on structural lightweight concrete: Experimental study and gene expression programming. Structures 2024, 63, 106397. [Google Scholar]
  42. Paul, A.; Murgadas, S.; Delpiano, J.; Moreno-Casas, P.A.; Walczak, M.; Lopez, M. The role of moisture transport mechanisms on the performance of lightweight aggregates in internal curing. Constr. Build. Mater. 2021, 268, 121191. [Google Scholar] [CrossRef]
  43. Hasan, M.; Saidi, T.; Afifuddin, M. Mechanical properties and absorption of lightweight concrete using lightweight aggregate from diatomaceous earth. Constr. Build. Mater. 2021, 277, 122324. [Google Scholar] [CrossRef]
  44. Alghrairi, N.; Aziz, F.N.A.; Rashid, S.A.; Mohamed, M.Z.B.; Ibrahim, A.M. Impact of nano-silica on the mechanical properties of lightweight concrete. Earth Environ. Sci. 2024, 1369, 012033. [Google Scholar] [CrossRef]
  45. Ma, C.; Bao, S.; Zhang, Y.; Luo, Y.; Gui, Y.; Ren, Y. Preparation of non-sintered sewage sludge based ceramsite by alkali-thermal activation and hydration mechanism. Ceram. Int. 2022, 48, 31606–31613. [Google Scholar] [CrossRef]
  46. Yue, D.; Yue, Q.; Gao, B. Preparation and bloating mechanism of porous ultra-lightweight ceramsite by dehydrated sewage sludge and Yellow River sediments. J. Wuhan Univ. Technol.-Mater. Sci. Ed. 2014, 29, 1129–1135. [Google Scholar] [CrossRef]
  47. Liu, L.; Yang, J.; She, Y.; Lv, S.; Yang, Z.; Hu, P. Thermal and mechanical properties of coal gasification slag based foam concrete. Environ. Sci. Pollut. Res. Int. 2023, 30, 49905–49916. [Google Scholar] [CrossRef] [PubMed]
  48. Shi, Y.; Guo, W.; Jia, Y.; Xue, C.; Qiu, Y.; Zhao, Q. Preparation of non-sintered lightweight aggregate ceramsite based on red mud-carbide slag-fly ash: Strength and curing method optimization. J. Clean. Prod. 2022, 372, 133788. [Google Scholar] [CrossRef]
  49. Guan, H.; Yu, J.; Kibugenza, A.S.U.; Sun, Q. Preparation of coal gangue ceramsite high-strength concrete and investigation of its physico-mechanical properties. Sci. Rep. 2022, 12, 16369. [Google Scholar] [CrossRef]
  50. Zhang, G.Z.; Liu, C.; Cheng, P.F.; Li, Z.; Han, Y.; Wang, X.Y. Enhancing the Interfacial Compatibility and Self-Healing Performance of Microbial Mortars by Nano-SiO2-Modified Basalt Fibers. Cem. Compos. Struct. 2024, 152, 105650. [Google Scholar]
  51. Zhang, Q.; Xu, Y.; Zhang, H.; Gu, X.; Ni, S.; Xu, Y.; Liu, R. Preparation and performance influencing factors of sludge-based non-sintering ceramsite foam concrete block. Constr. Build. Mater. 2024, 426, 136240. [Google Scholar] [CrossRef]
Figure 1. Appearance of the SC.
Coatings 14 01095 g001
Figure 2. The procedure for the preparation.
Coatings 14 01095 g002
Figure 3. The experimental procedure.
Coatings 14 01095 g003
Figure 4. Slump flow of SC fresh concrete.
Coatings 14 01095 g004
Figure 5. Curves of the relation between the ultrasonic velocity and the slump flow, as well as the relation between CV of ultrasonic velocity and slump flow: (a) ultrasonic velocity; and (b) CV of the ultrasonic velocity.
Coatings 14 01095 g005
Figure 6. The change in water absorption with the soaking time.
Coatings 14 01095 g006
Figure 7. The relation between the compressive strength and the slump flow, as well as the relation between the CV of compressive strength and the slump flow.
Coatings 14 01095 g007
Figure 8. TG analysis curves: (a) TG curve of 0% WRA; (b) TG curve of 10% SC; (c) DTG curve of 10% SC; (d) TG curve of 20% SC; and (e) DTG curve of 20% SC.
Coatings 14 01095 g008
Figure 9. Ultra depth-of-field microscope scanning of specimens: (a) 10% SC 0% WRA; (b) 20% SC 0% WRA; (c) 10% SC 0.4% WRA; (d) 20% SC 0.4% WRA; (e) 10% SC 0.6% WRA; (f) 20% SC 0.6% WRA; (g) 10% SC 0.8% WRA; (h) 20% SC 0.8% WRA; (i) 10% SC 1.2% WRA; and (j) 20% SC 1.2% WRA.
Coatings 14 01095 g009aCoatings 14 01095 g009b
Figure 10. X-ray diffraction patterns of the specimens: (a) concrete with 10% SC; and (b) concrete with 20% SC.
Coatings 14 01095 g010
Figure 11. SEM-EDS micrographs of the specimens: (a) 10% SC 0% WRA; (b) 20% SC 0% WRA; (c) 10% SC 0.4% WRA; (d) 20% SC 0.4% WRA; (e) 10% SC 0.6% WRA; (f) 20% SC 0.6% WRA; (g) 10% SC 0.8% WRA; (h) 20% SC 0.8% WRA; (i) 10% SC 1.2% WRA; and (j) 20% SC 1.2% WRA.
Coatings 14 01095 g011aCoatings 14 01095 g011b
Table 1. Chemical composition of the raw materials (%).
TypesChemical Composition (%)
SiO2Al2O3Fe2O3MgOCaOSO3R2OLoss (%)
OPC21.185.193.843.9162.512.900.471.55
Medium sand99.660.12--0.11-0.11-
SC54.9920.5514.263.422.83.98-23.6
Table 2. Mix proportions of ceramsite concrete per one cubic meter (kg).
GroupWaterCementMedium SandSCWRA
C11443607921440.00
C21443606482880.00
C31443607921441.44
C41443606482881.44
C51443607921442.16
C61443606482882.16
C71443607921442.88
C81443606482882.88
C91443607921444.32
C101443606482884.32
Table 3. The fitting results of the soaking time in water (T) and water absorption (W).
EquationTypesaxckR2
W = a/(1 + e(−k(Txc)))C10.0602.200.300.99
C20.0583.350.360.99
C30.0714.020.450.99
C40.0923.960.400.99
C50.0583.880.410.99
C60.0584.010.400.99
C70.0623.570.400.99
C80.0683.760.370.99
C90.114.390.370.99
C100.114.490.370.99
Table 4. The element distribution obtained by EDS (%).
GroupCOSiKCa
C18.4848.2621.781.981.74
C2-20.588.522.507.13
C326.0523.522.02-36.82
C423.6448.485.77-13.30
C57.9661.60-7.6621.47
C614.5536.999.491.534.55
C78.8446.1218.862.171.37
C817.984.221.181.933.93
C98.7646.539.470.1923.88
C1040.987.620.99-0.75
Table 5. The Ca/Si ratio obtained by EDS (%).
GroupC1C2C3C4C5C6C7C8C9C10
Ca/Si ratio0.080.8418.232.3100.470.073.332.520.76
Disclaimer/Publisher’s Note: The statements, opinions and data contained in all publications are solely those of the individual author(s) and contributor(s) and not of MDPI and/or the editor(s). MDPI and/or the editor(s) disclaim responsibility for any injury to people or property resulting from any ideas, methods, instructions or products referred to in the content.