
The Relationship between the Fresh Sludge Ceramsite Concrete’s Fluidity and the Sludge Ceramsite’s Dispersion


Abstract
:1. Introduction
2. Experimental
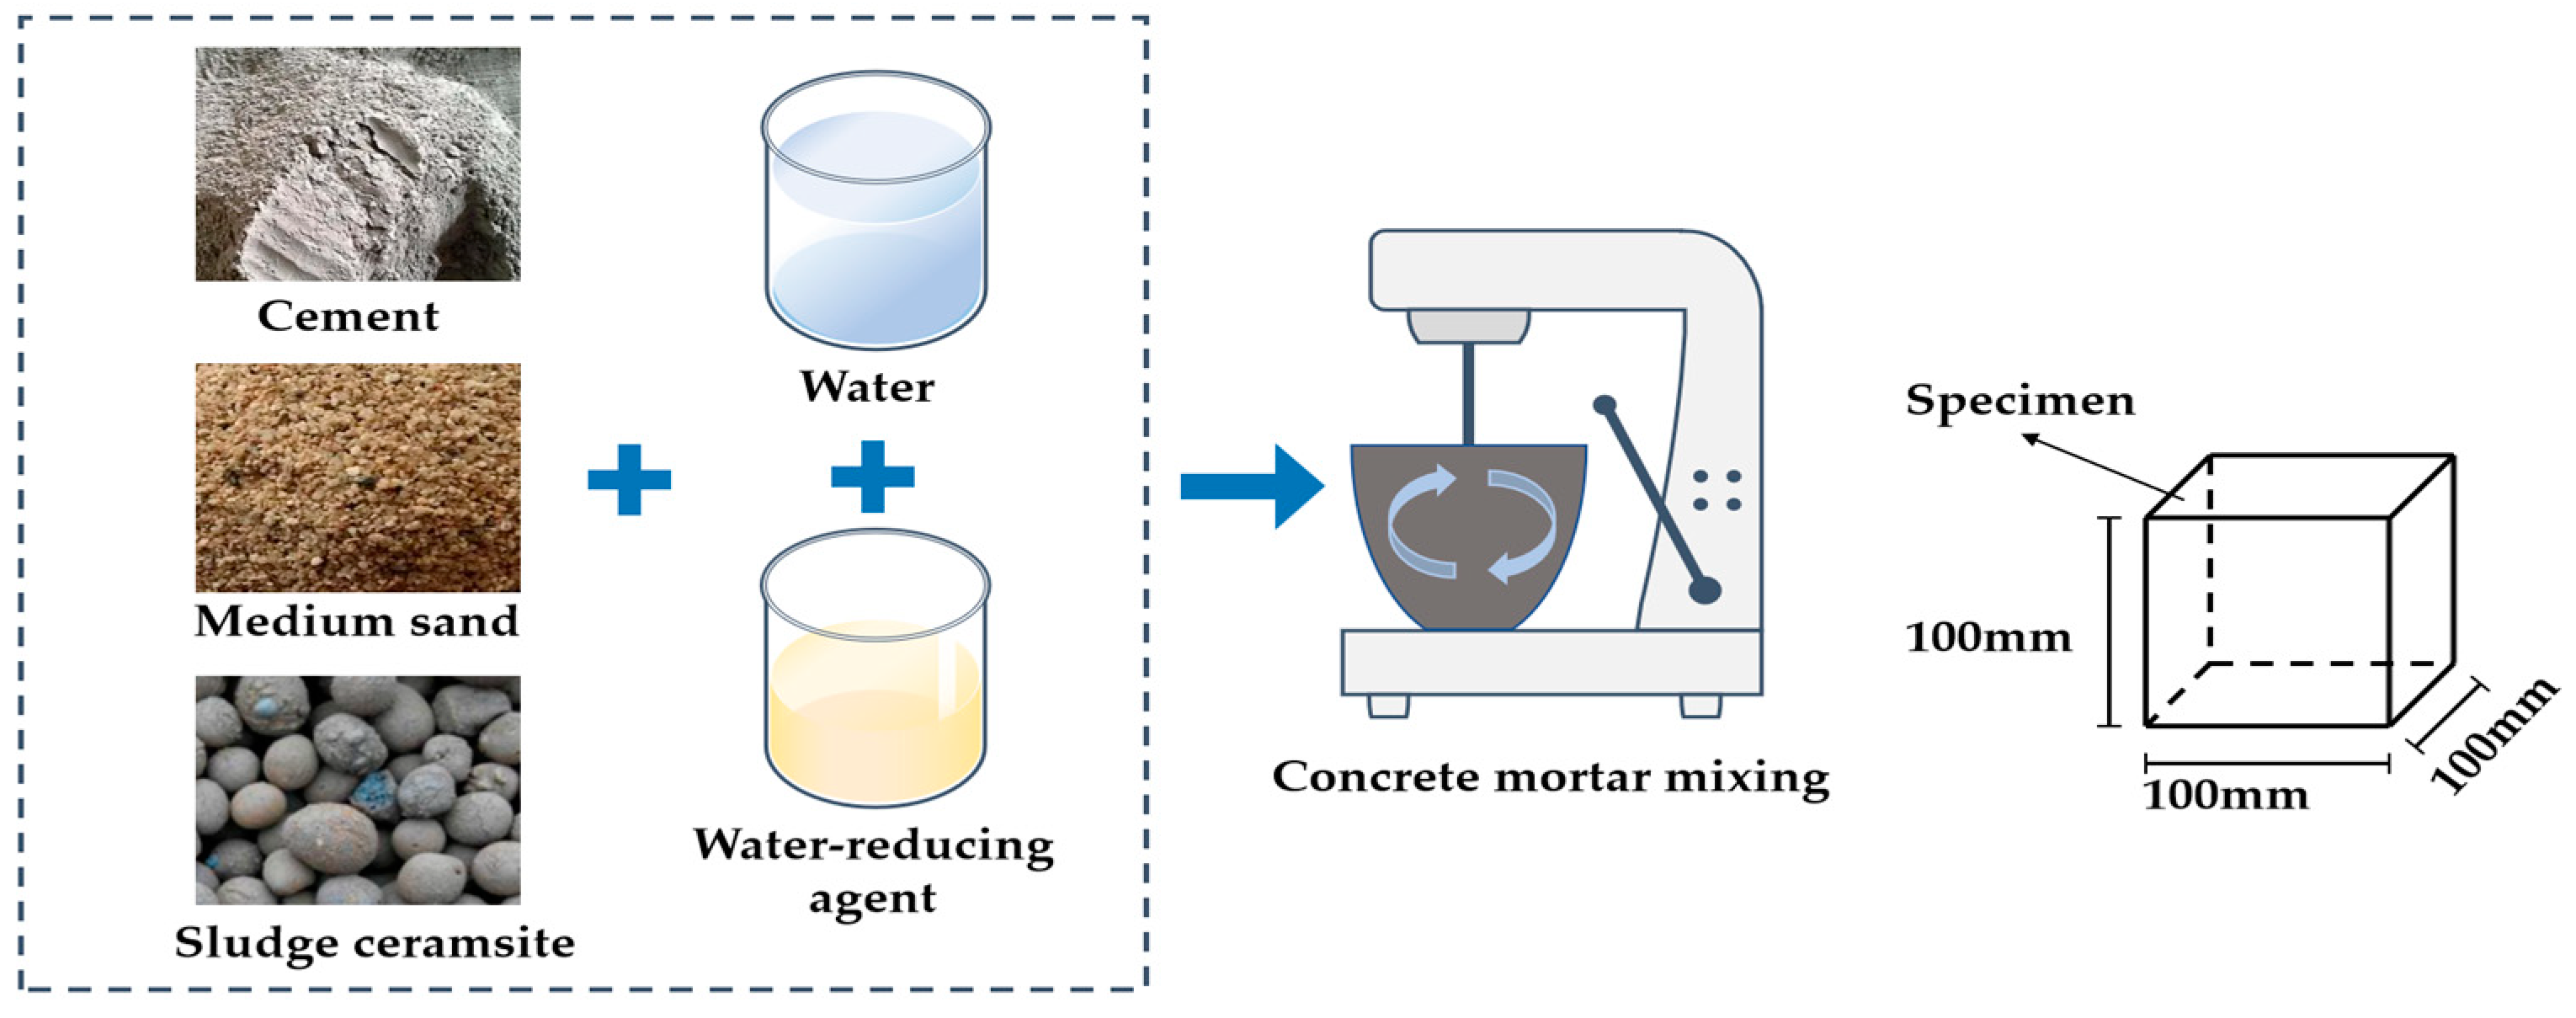
2.1. Raw Materials
2.2. Specimen Preparation
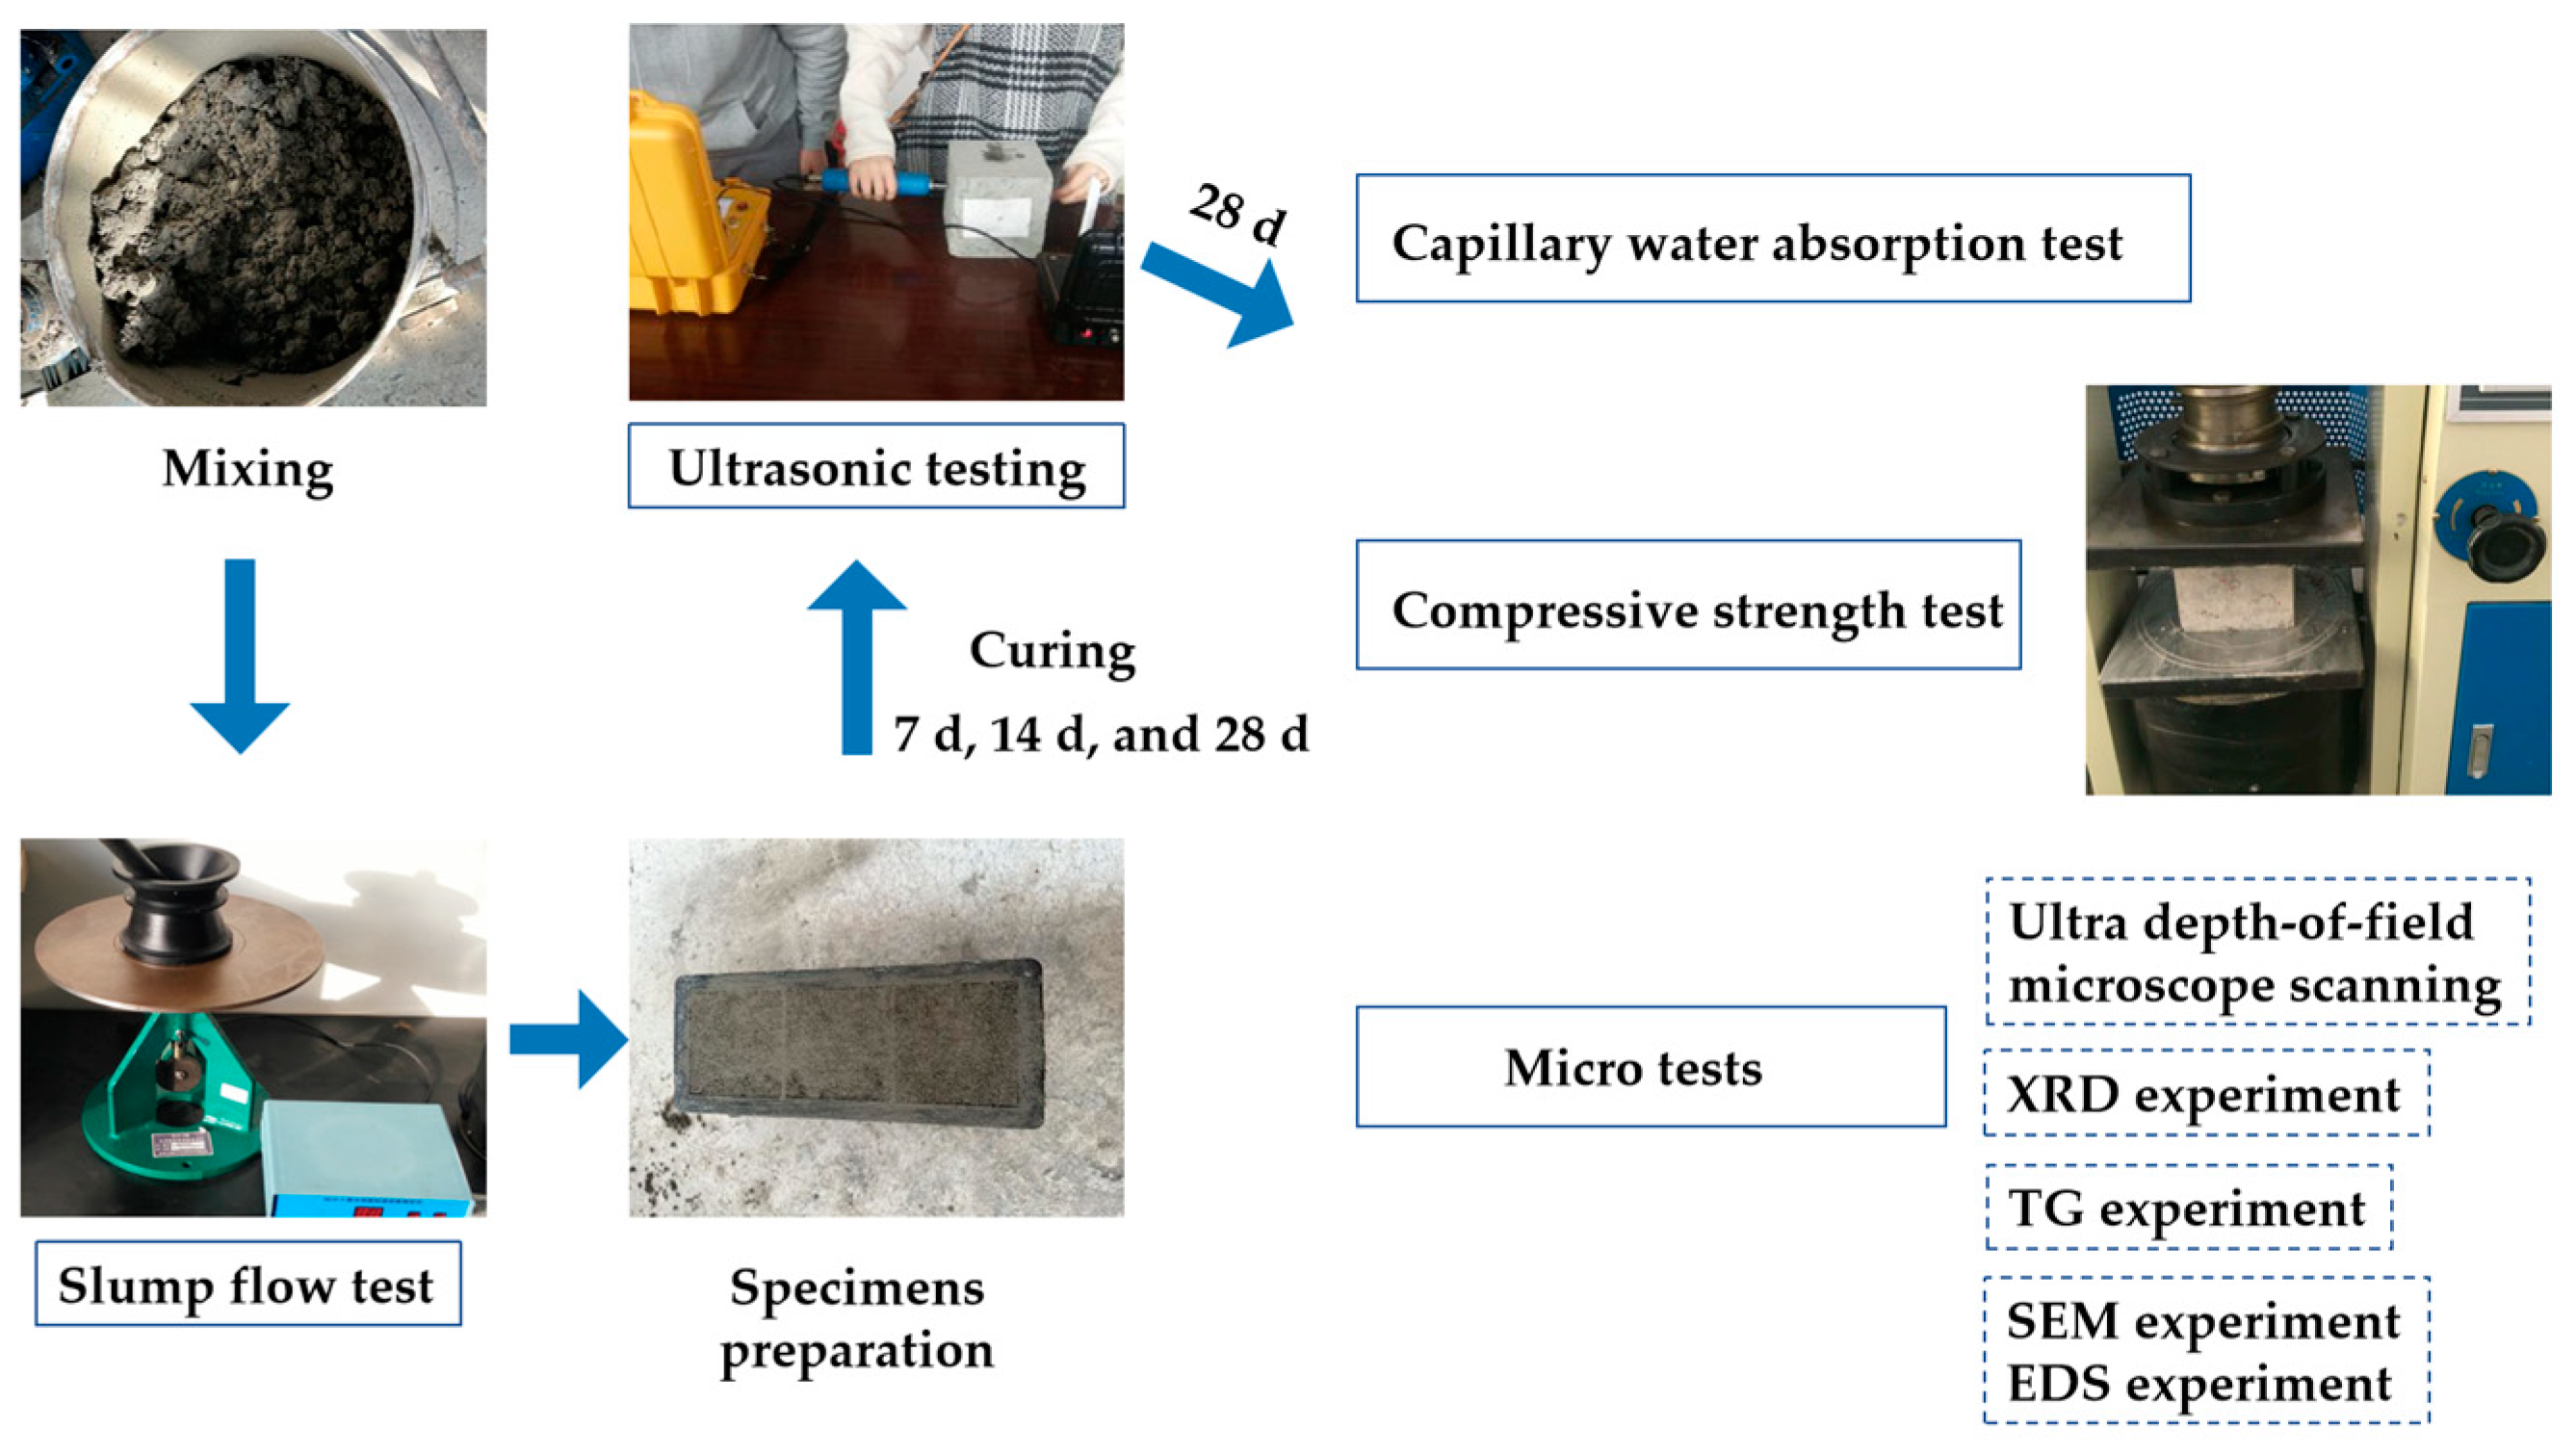
2.3. Measurement Methods
2.3.1. Slump Flow Test
2.3.2. Ultrasonic Testing
2.3.3. Capillary Water Absorption Test
2.3.4. Compressive Strength Test
2.3.5. Experiments on Microscopic Properties
3. Results and Discussion
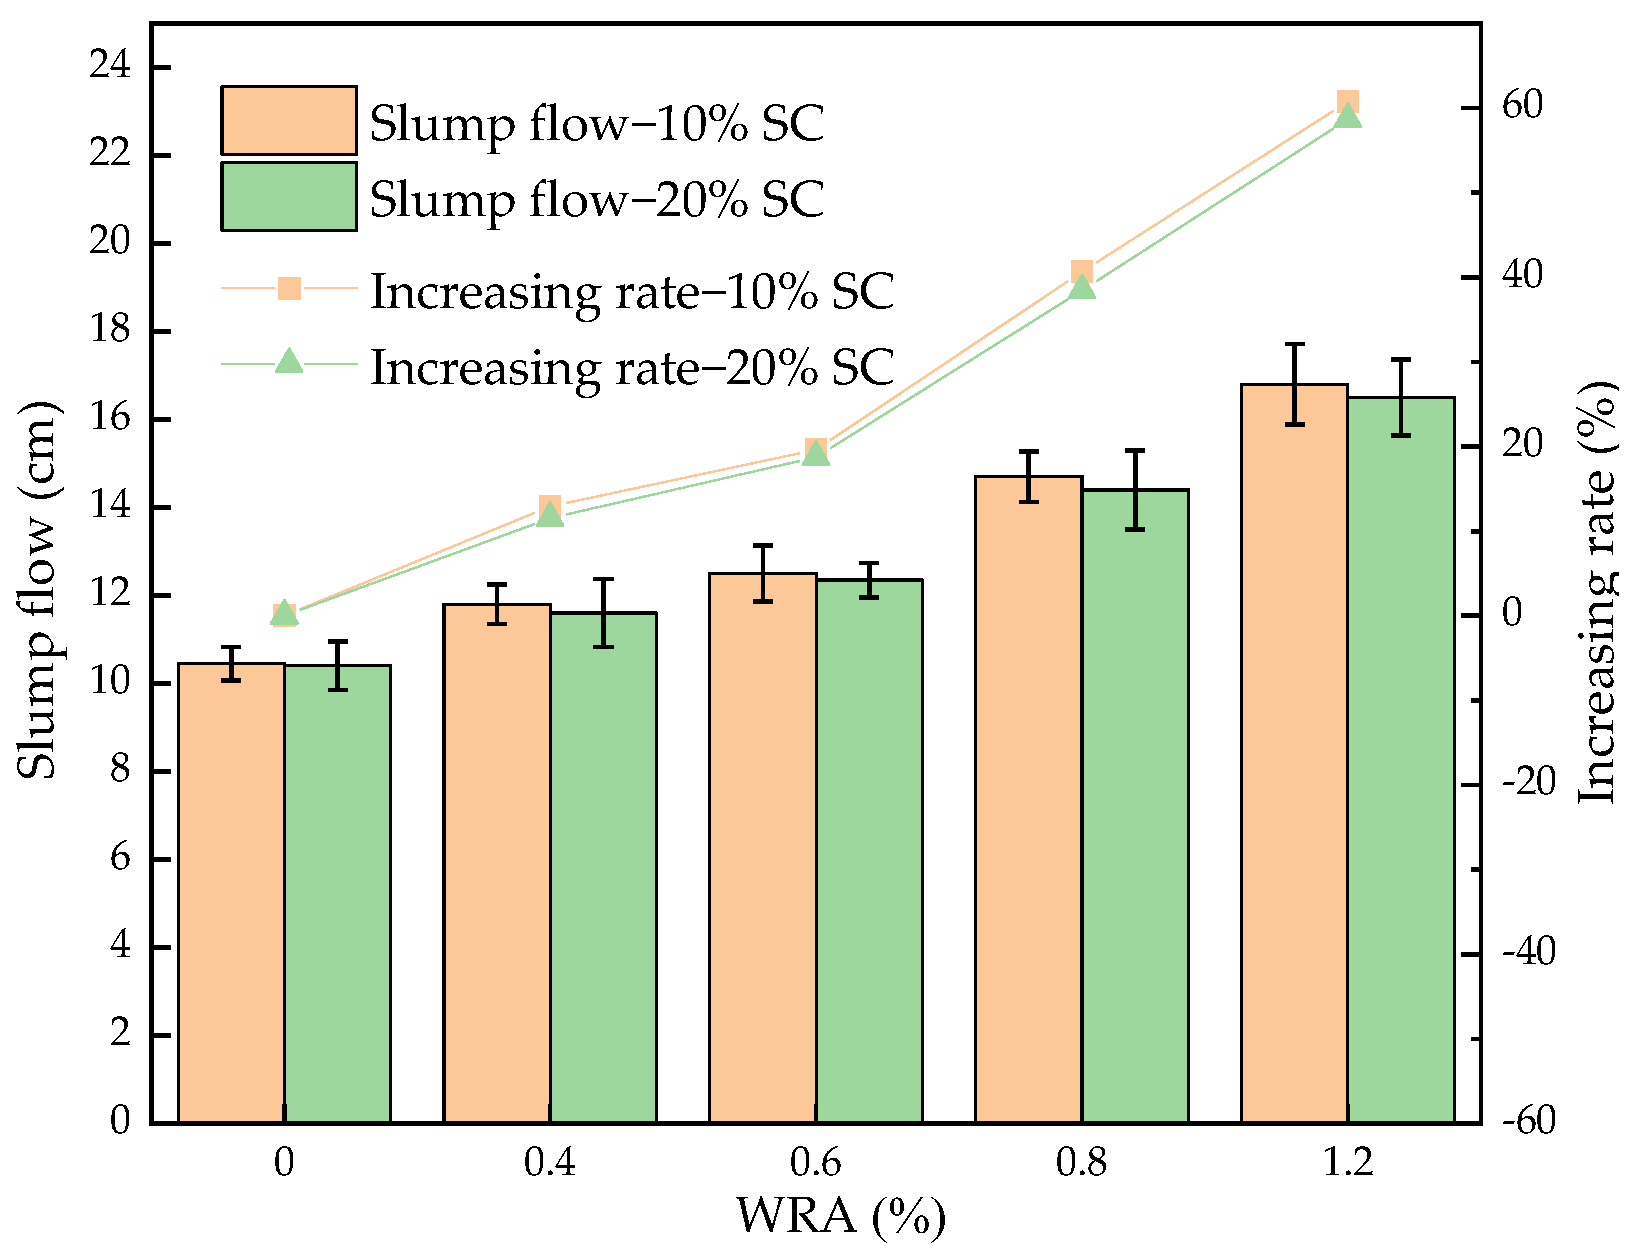
3.1. Slump Flow Test Results
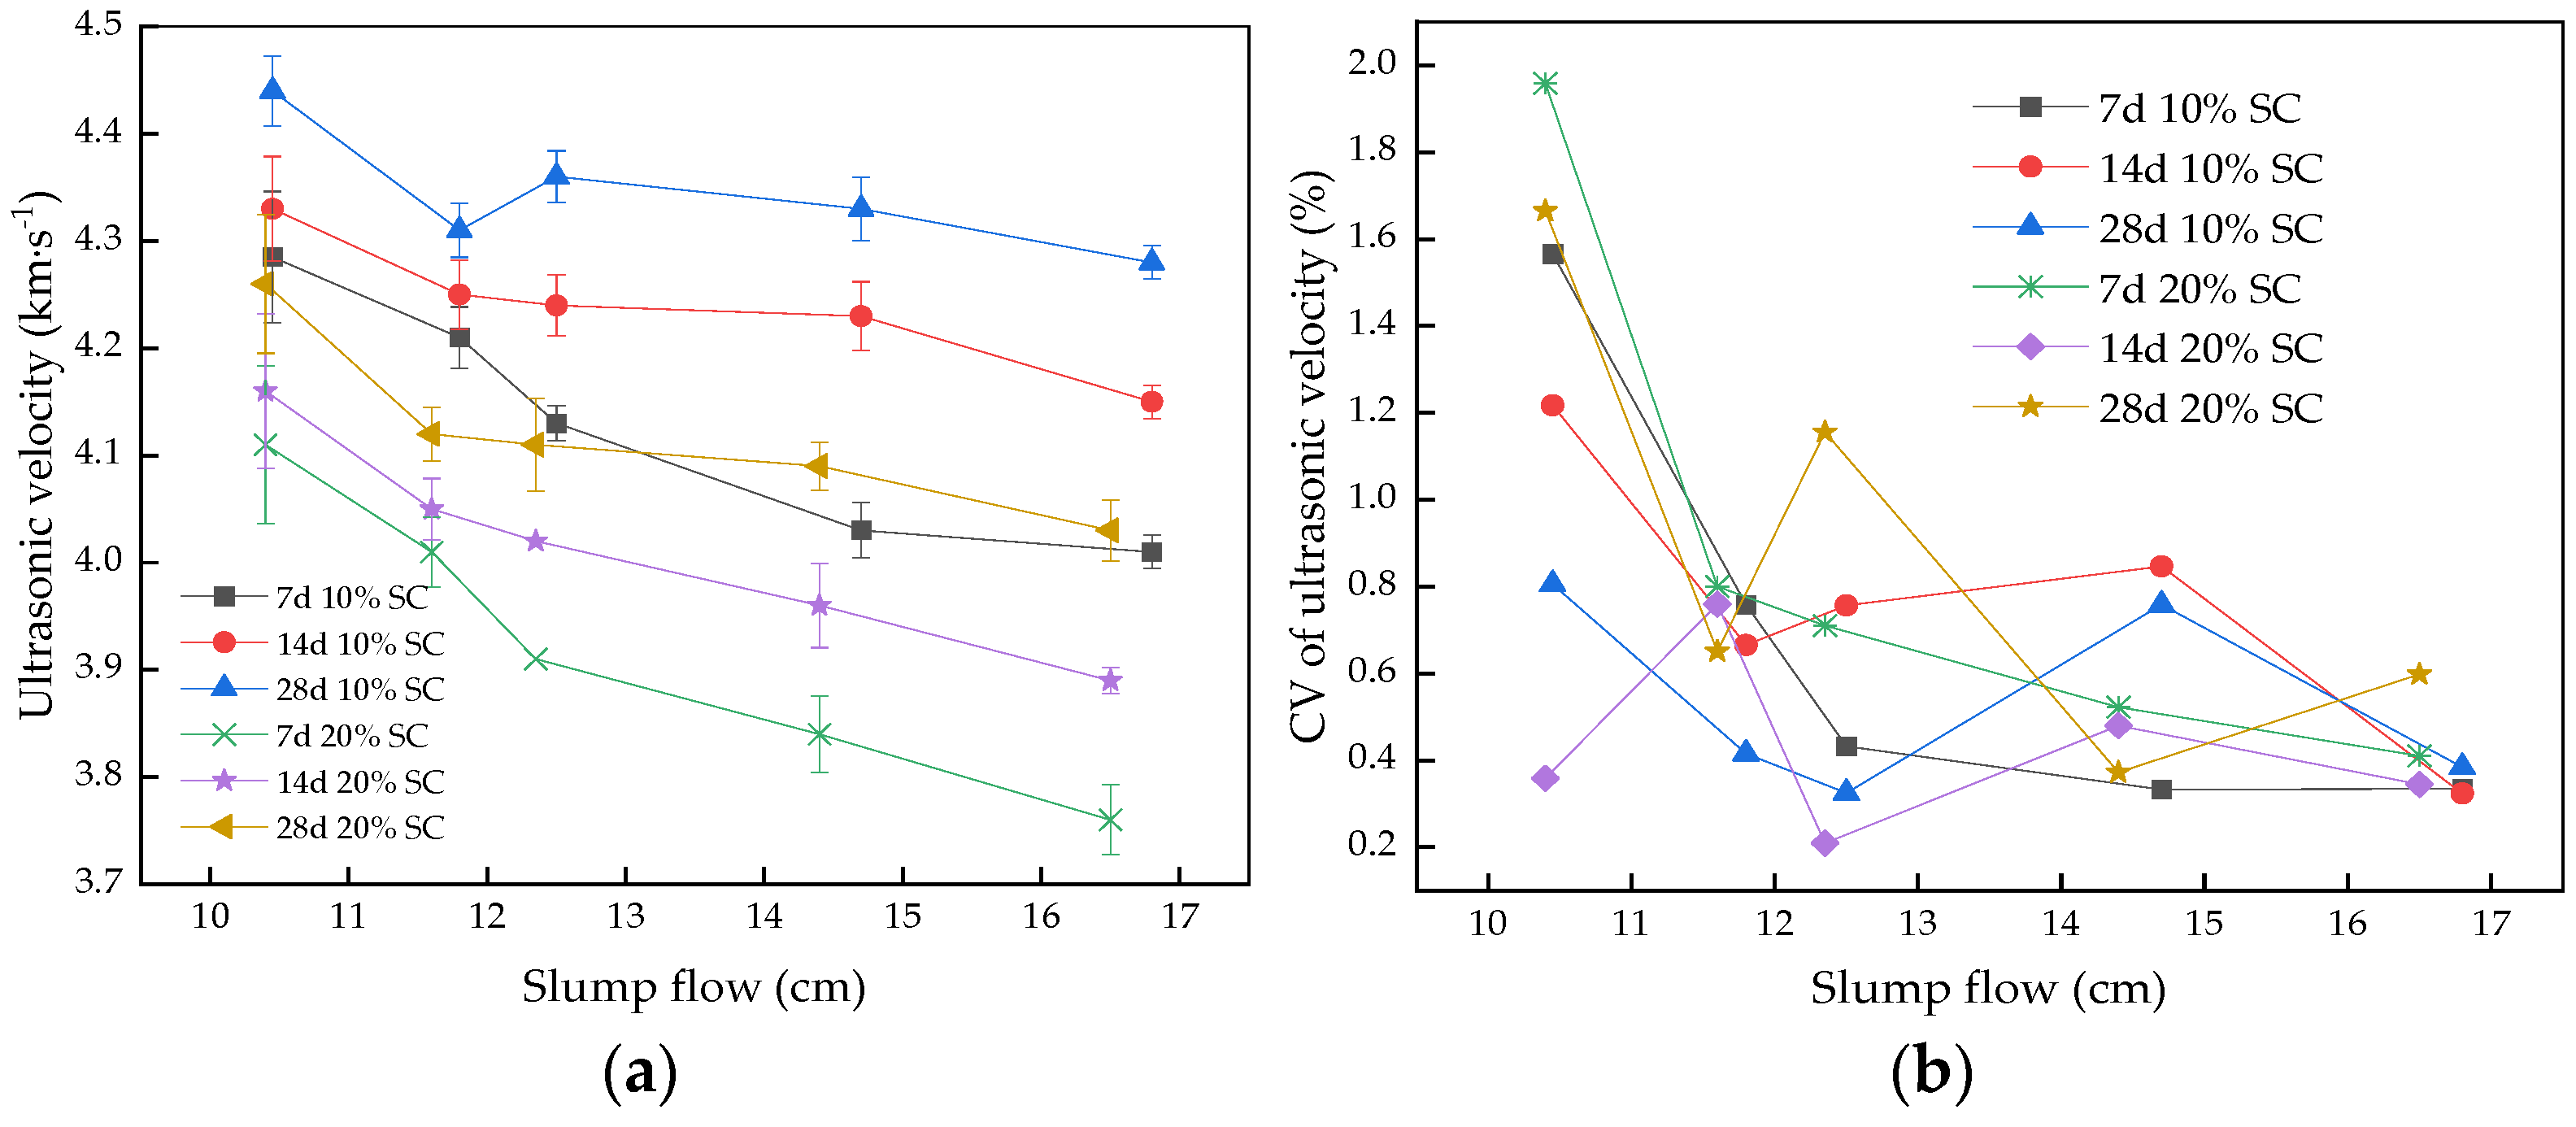
3.2. Ultrasonic Testing Results
3.3. Capillary Water Absorption Test Results
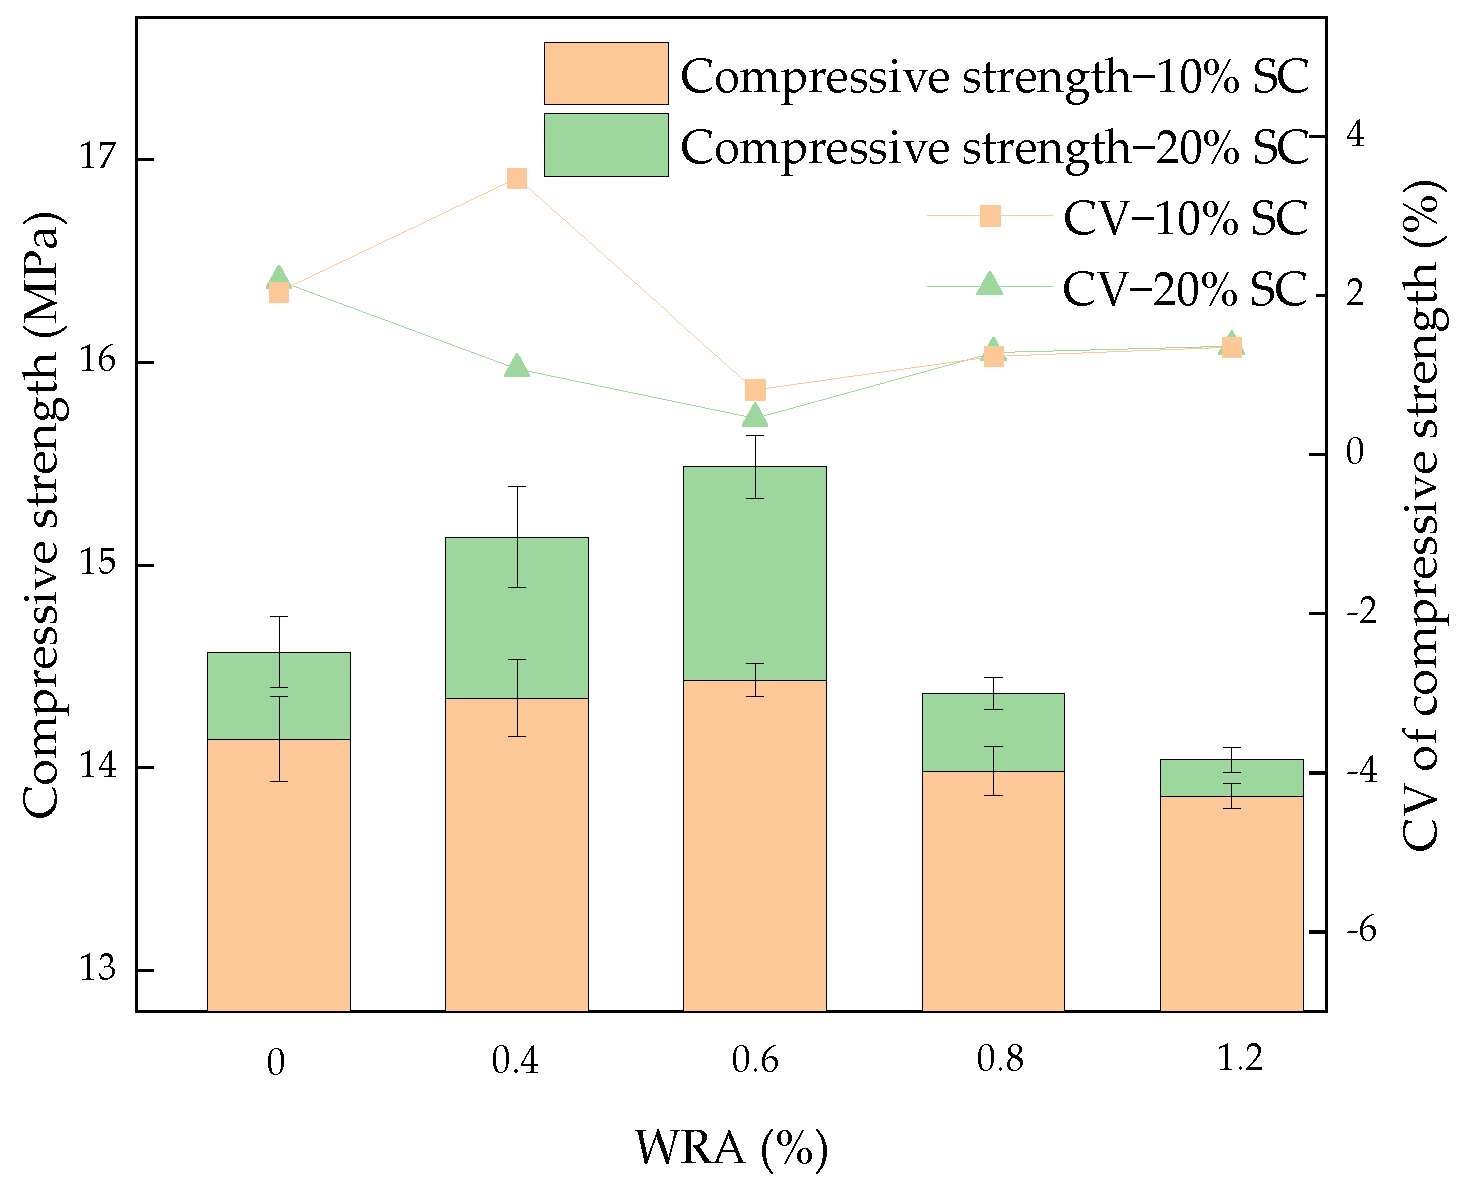
3.4. Compressive Strength Test Results
3.5. Interpretation of TG Curves
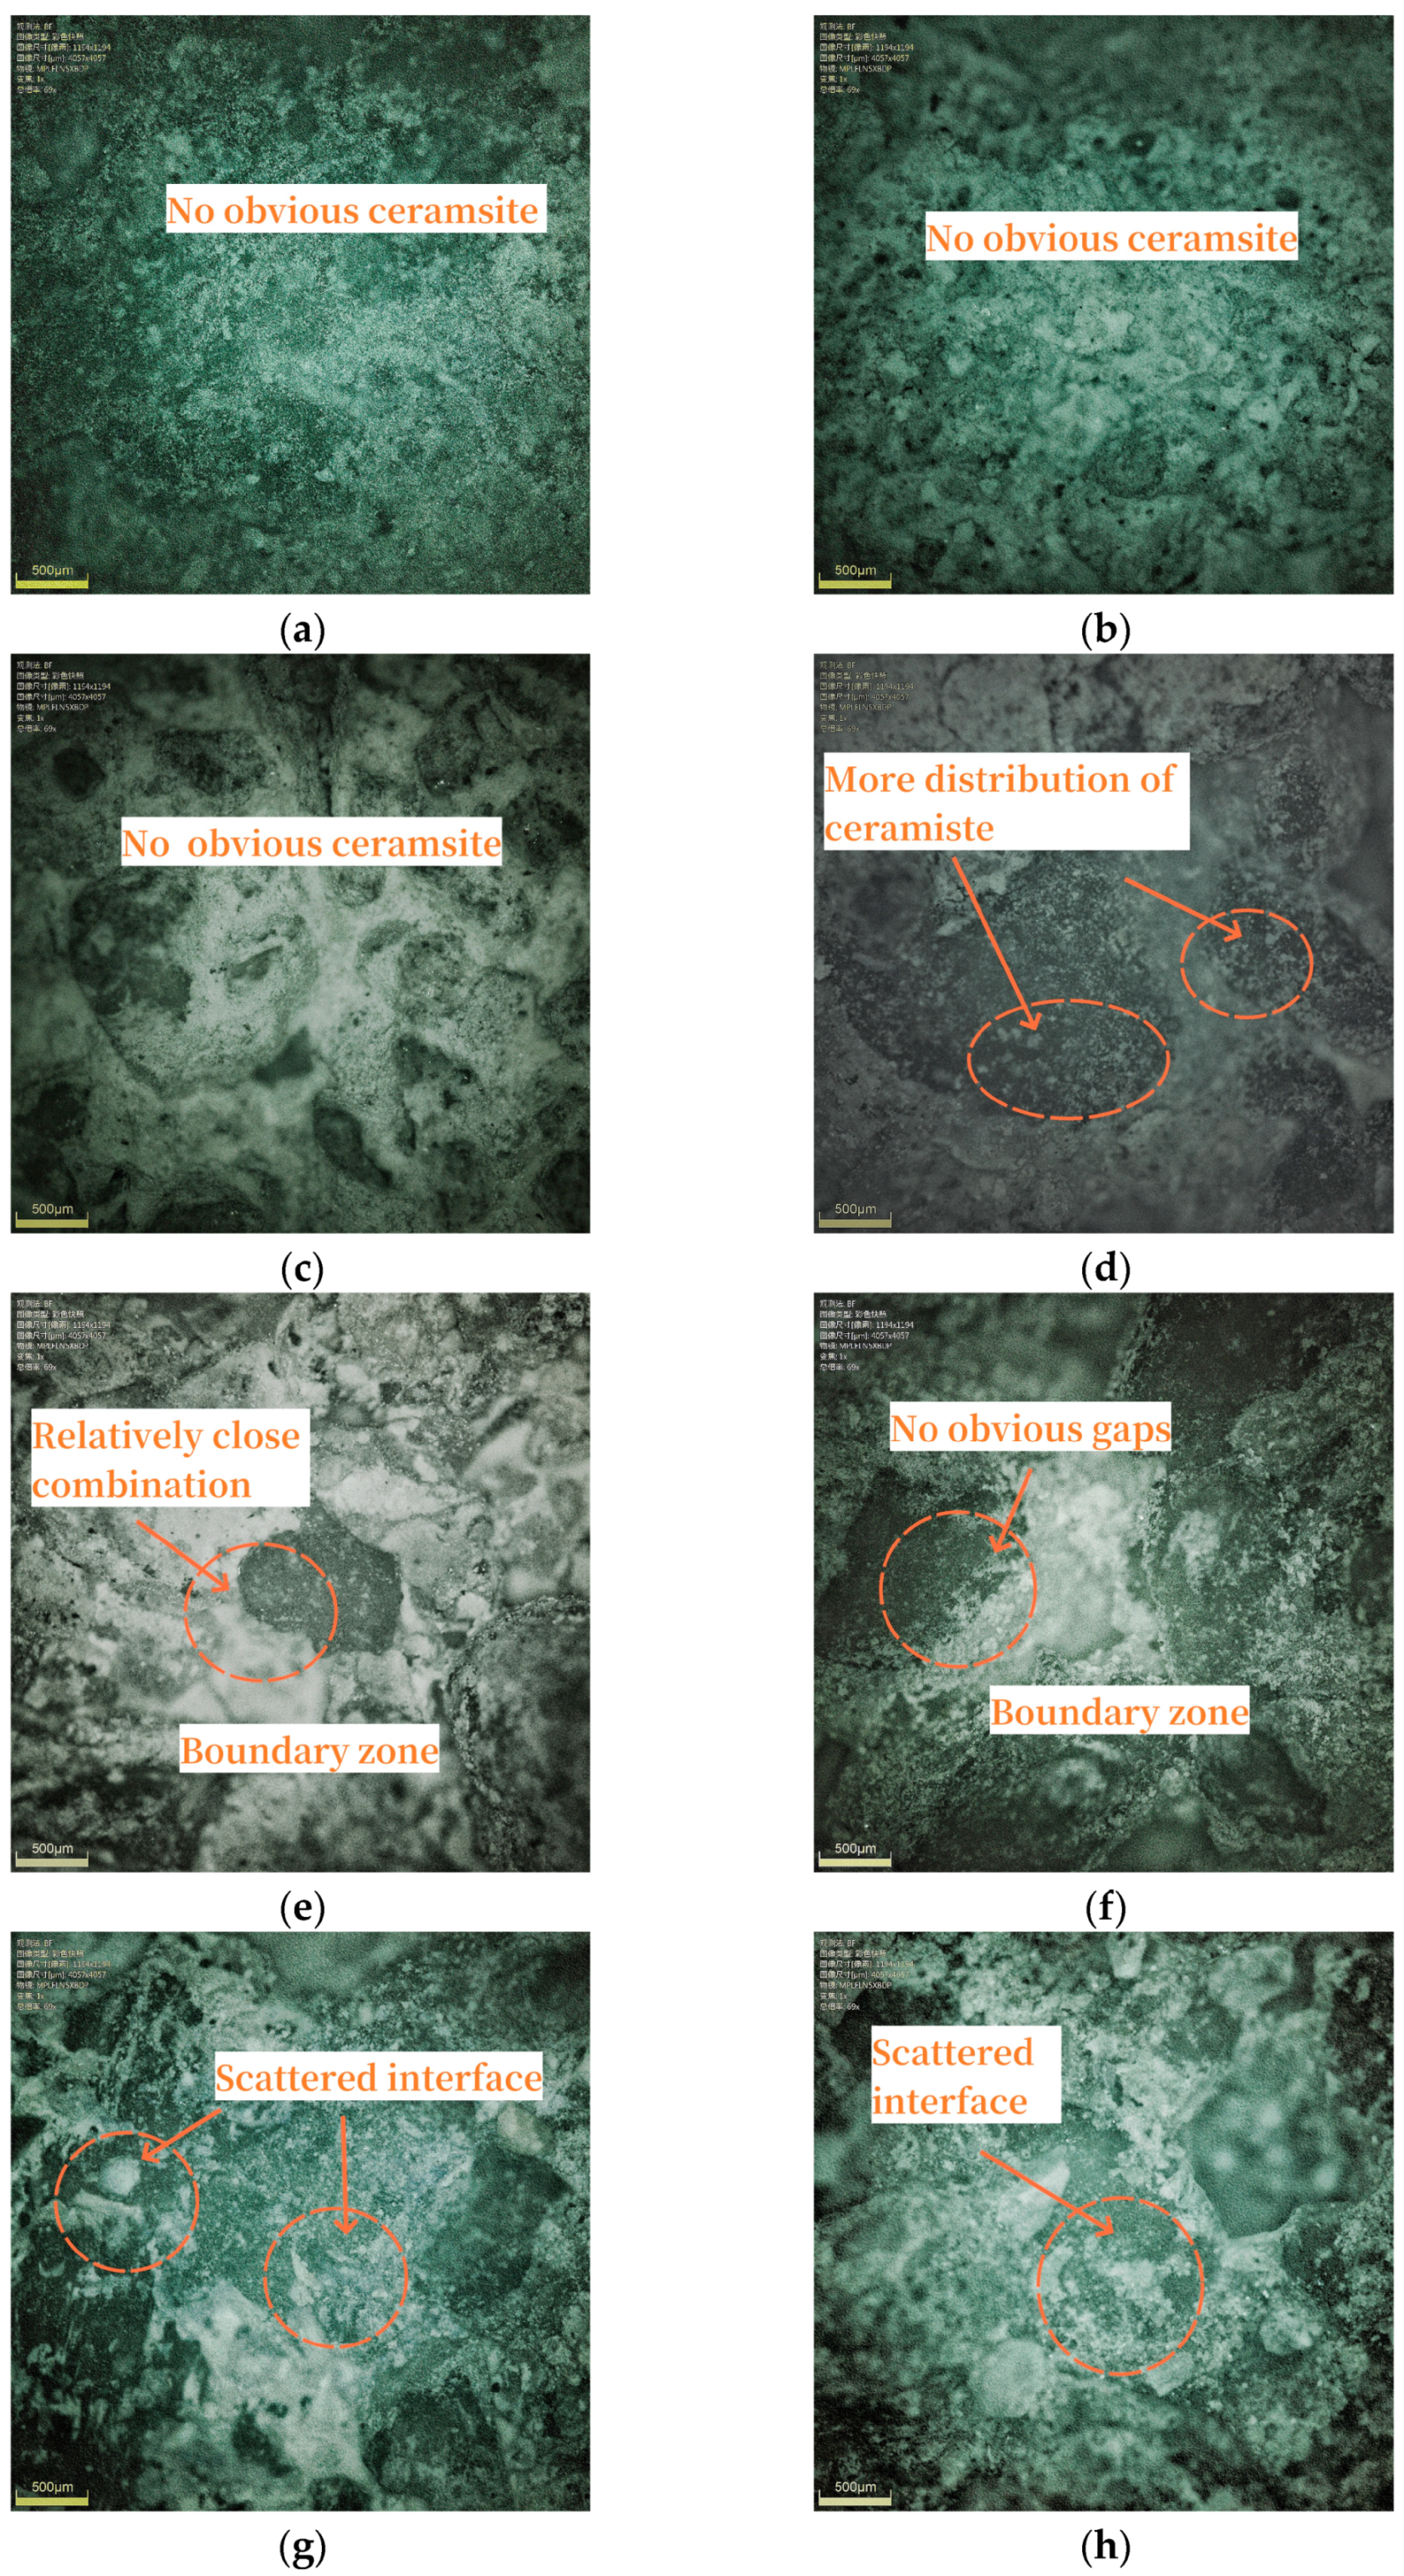
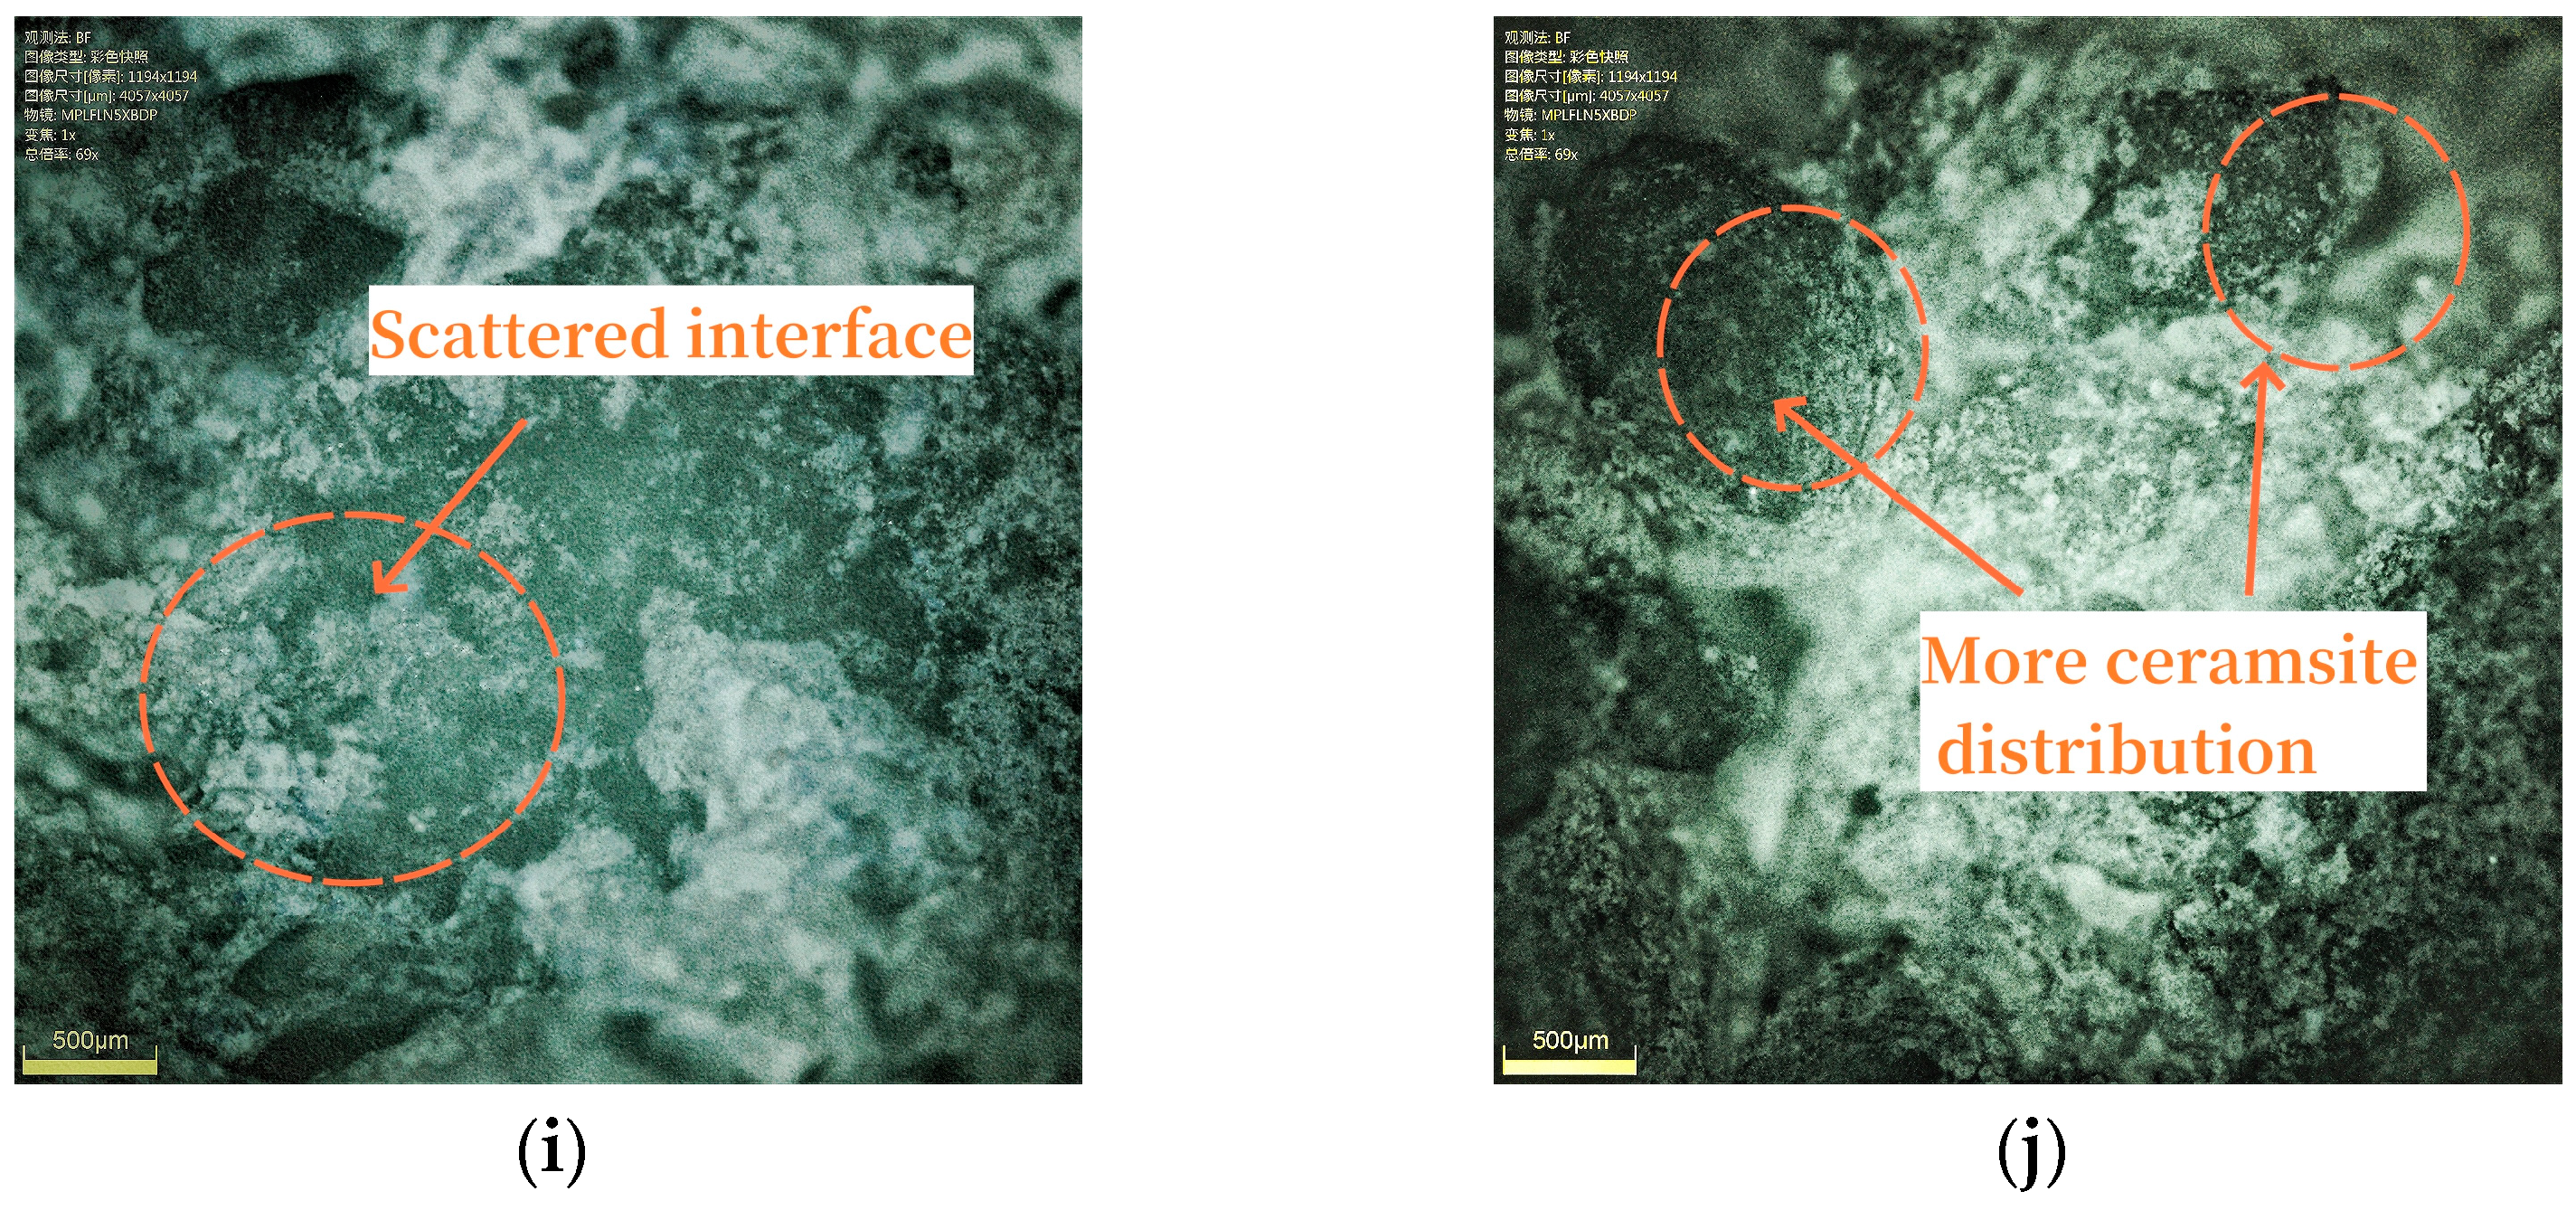
3.6. Ultra Depth-of-Field Microscope Results
3.7. XRD Analysis
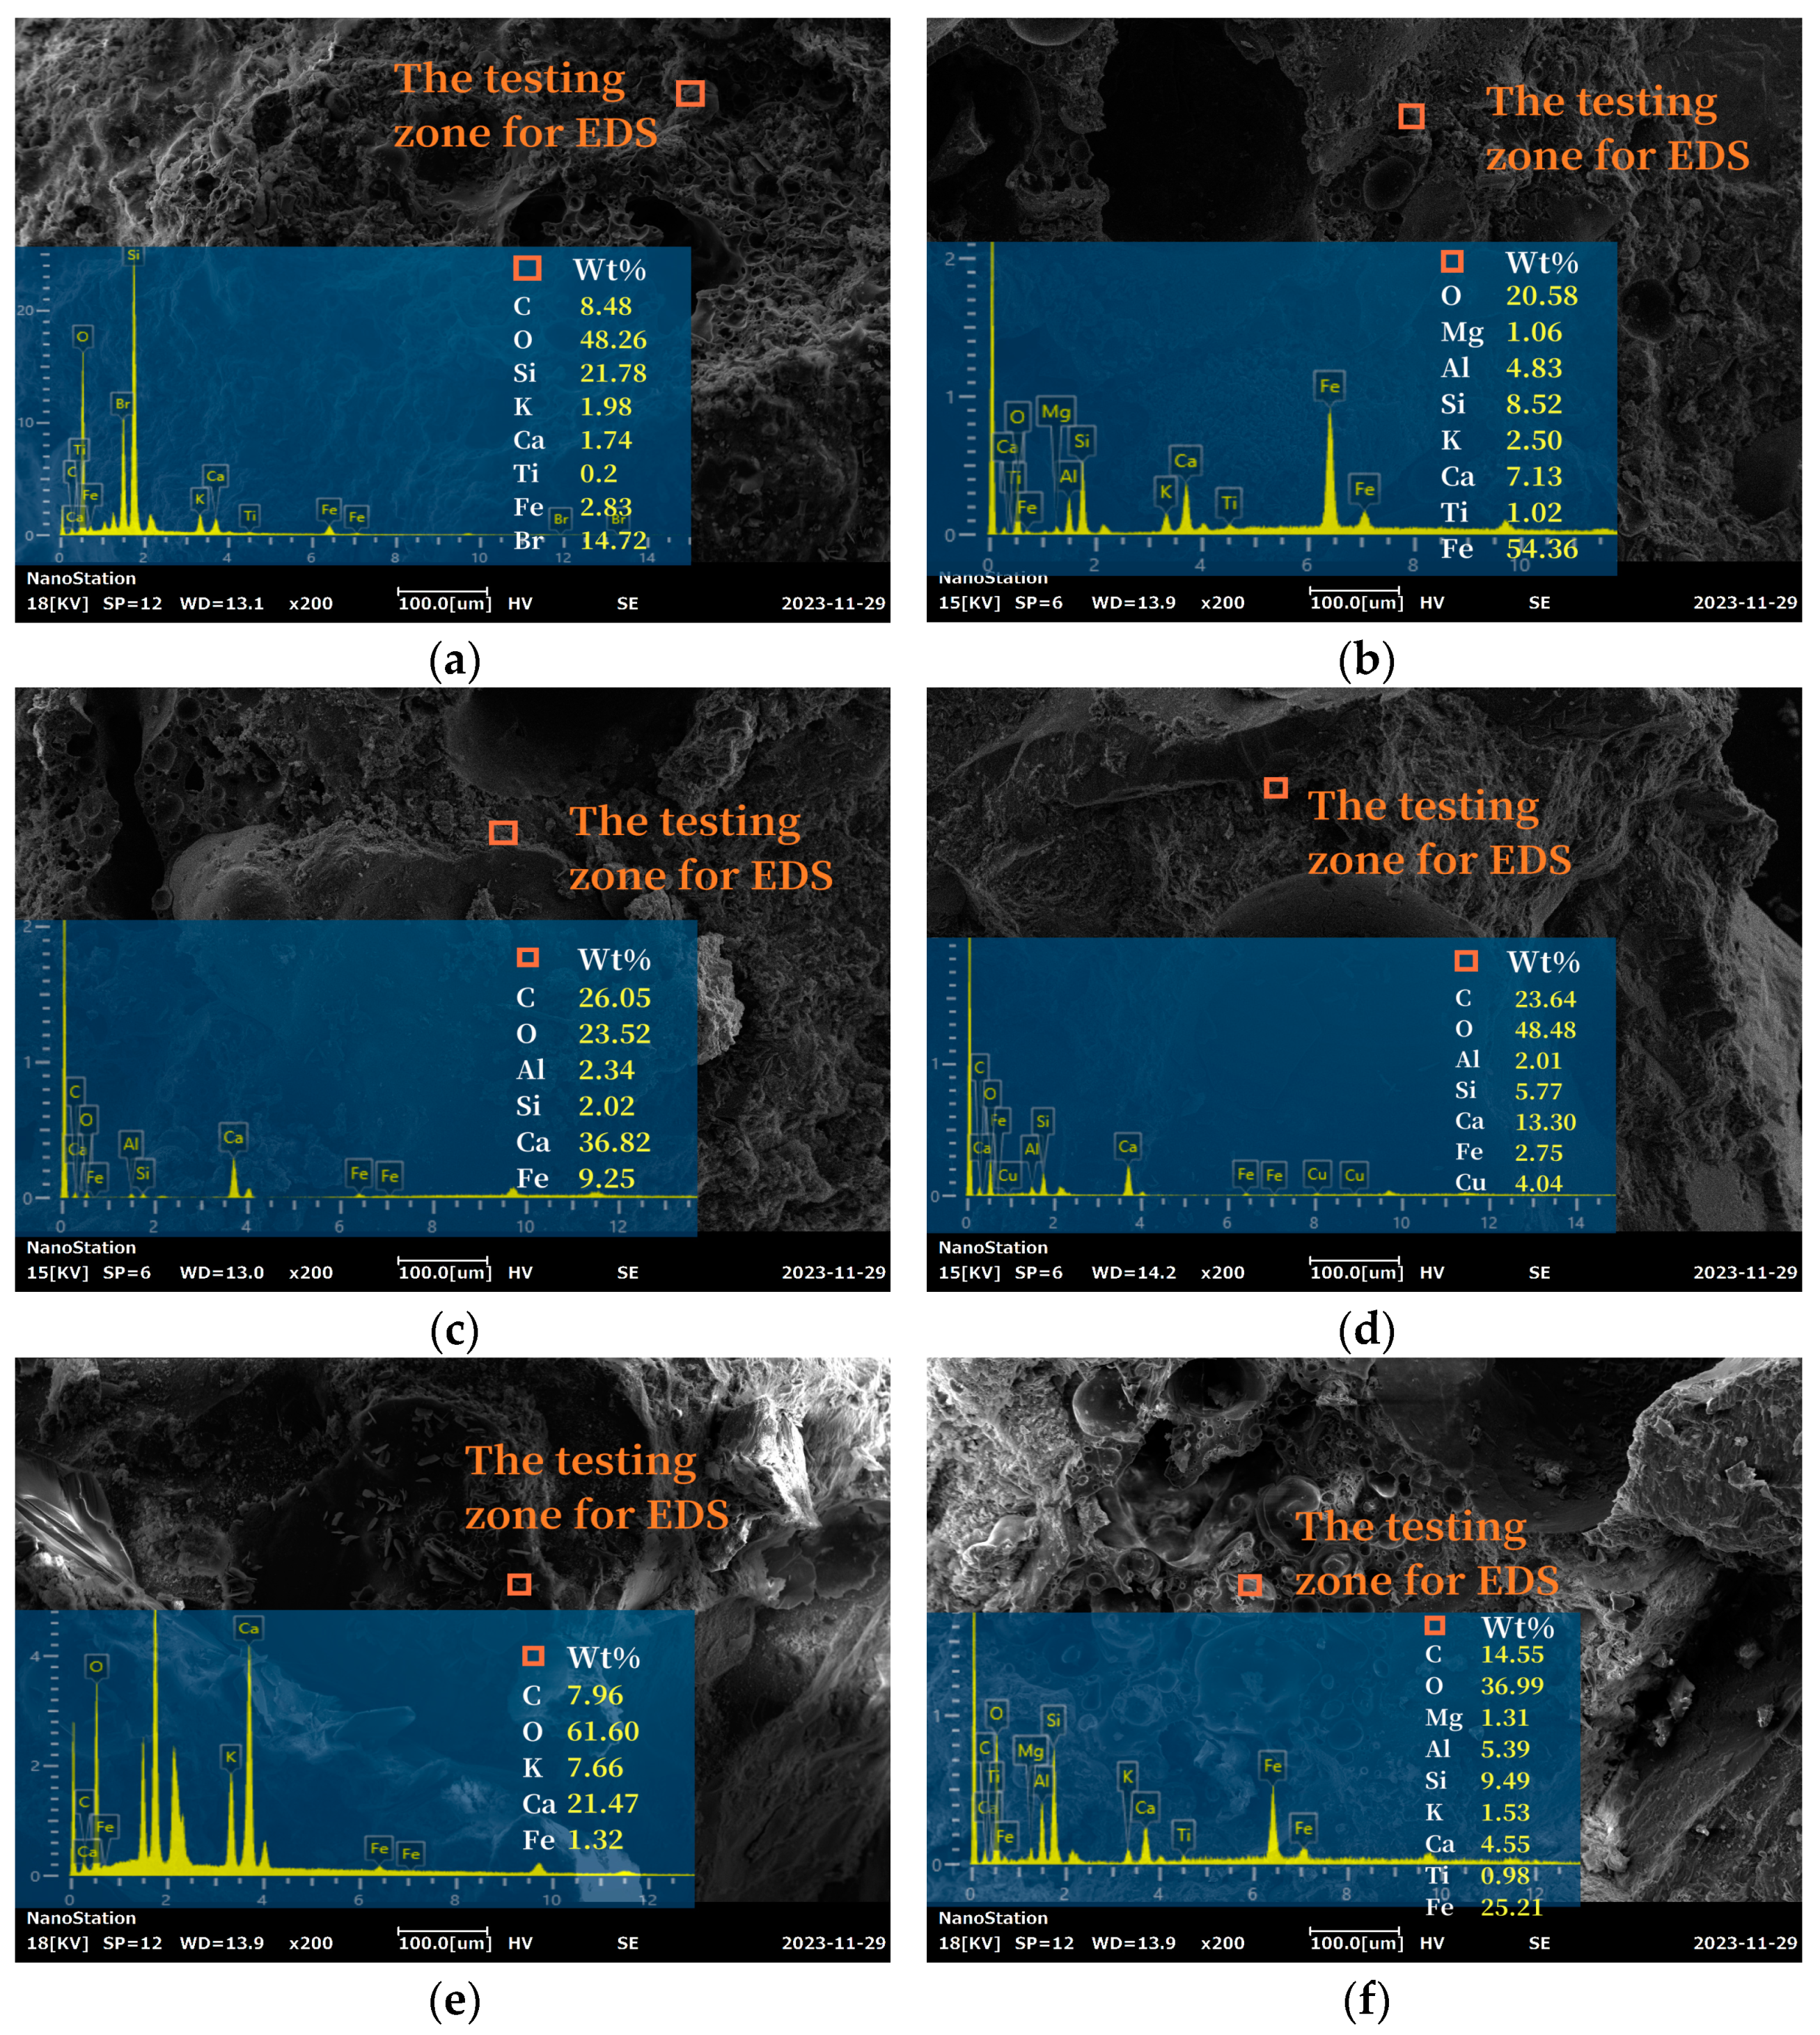
3.8. SEM-EDS Analysis
4. Conclusions
- (1)
- The addition of WRA improved the fluidity. Conversely, the addition of SC reduced the fluidity. WRA caused a much greater change in the concrete fluidity.
- (2)
- The relationship between the ultrasonic sound speed and the increasing fluidity could be deduced as a negative correlation. The addition of SC increased the internal defects and compressive strength. The water absorption was negatively correlated with the compressive strength. The concrete with a slump flow of 12.35 and 12.5 cm reaching the maximum compressive strength, which had the lowest water absorption, demonstrated internal homogeneity.
- (3)
- By analyzing of the ultrasonic velocity’s CV and the compressive strength’s CV, the fresh cement concrete with a slump flow of 12.5 cm shows the lowest CV, indicating the optimum SC dispersion. The optimum slump flow was 12.35 and 12.5 cm. That is the concrete with 0.6% WRA. The TG analysis revealed that the addition of 0.6% WRA promoted the hydration of cement. Combined with the XRD and SEM results, the amount of calcium hydroxide (CH) was the least with the concrete of 0.6% WRA addition. Furthermore, the organic substances in SC increased the hydration products. These phenomena indicated that a more homogeneous dispersion of SC and better concrete properties were obtained at a slump flow of 12.35 and 12.5 cm, which can be used in the future.
Author Contributions
Funding
Institutional Review Board Statement
Informed Consent Statement
Data Availability Statement
Conflicts of Interest
References
- Bandieira, M.; Zat, T.; Schuster, S.L.; Justen, L.H.; Weide, H.; Rodríguez, E.D. Water treatment sludge in the production of red-ceramic bricks: Effects on the physico-mechanical properties. Mater. Struct. 2021, 54, 168. [Google Scholar] [CrossRef]
- Schumacher, K.; Samannshausen, N.; Pritzel, C.; Trettin, R. Lightweight aggregate concrete with an open structure and a porous matrix with an improved ratio of compressive strength to dry density. Constr. Build. Mater. 2020, 264, 120167. [Google Scholar] [CrossRef]
- Alderete, N.M.; Joseph, A.M.; Heede, P.V.D.; Matthys, S.; Belie, N.D. Effective and sustainable use of municipal solid waste incineration bottom ash in concrete regarding strength and durability. Resour. Conserv. Recycl. 2021, 167, 105356. [Google Scholar] [CrossRef]
- Yang, Z.; Ji, R.; Liu, L.; Wang, X.; Zhang, Z. Recycling of municipal solid waste incineration by-product for cement composites preparation. Constr. Build. Mater. 2018, 162, 794–801. [Google Scholar] [CrossRef]
- Wang, H.; Xu, J.; Sheng, L. Preparation of ceramsite from municipal sludge and its application in water treatment: A review. J. Environ. Manag. 2021, 287, 11237. [Google Scholar] [CrossRef] [PubMed]
- Lim, Y.C.; Shih, Y.-J.; Tsai, K.-C.; Yang, W.-D.; Chen, C.-W.; Dong, C.-D. Recycling dredged harbor sediment to construction materials by sintering with steel slag and waste glass: Characteristics, alkali-silica reactivity and metals stability. J. Environ. Manag. 2020, 270, 110869. [Google Scholar] [CrossRef] [PubMed]
- Kuandykova, A.; Taimasov, B.; Potapova, E.; Sarsenbaev, B.; Kolesnikov, A.; Begentayev, M.; Kuldeyev, E.; Dauletiyarov, M.; Zhanikulov, N.; Amiraliyev, B. Production of Composite Cement Clinker Based on Industrial Waste. J. Compos. Sci. 2024, 8, 257. [Google Scholar] [CrossRef]
- Hu, K.; Zhang, Z.; Zhou, Q.; Fang, Y.; Li, W.; Zhang, W.; Zhang, W.; Fan, S. Experimental study on the preparation of lightweight ceramsite with engineering muck. New Build. Mater. 2022, 49, 6–9. [Google Scholar]
- Zeng, Y.; Zhou, X.; Tang, A. Shear performance of fibers-reinforced lightweight aggregate concrete produced with industrial waste ceramsite-lytag after freeze-thaw action. J. Clean. Prod. 2021, 328, 129626. [Google Scholar] [CrossRef]
- Zhu, H.; Xiao, Y.; Li, X.; Wang, Y.; Wen, S. Study on Flexural Strength of Interface between Full Lightweight Ceramsite Concrete and Ordinary Concrete. Coatings 2023, 13, 1383. [Google Scholar] [CrossRef]
- Vishwajith, A.G.H.; Mahanama, K.R.R.; Wijesinghe, L.P.R.J. Investigation on the effective disposal of sludge from a water treatment plant. Water Pract. Technol. 2023, 18, 130–139. [Google Scholar] [CrossRef]
- Jia, G.; Wang, Y.; Yang, F.; Ma, Z. Preparation of CFB fly ash/sewage sludge ceramsite and the morphological transformation and release properties of sulfur. Constr. Build. Mater. 2023, 373, 130864. [Google Scholar] [CrossRef]
- Rashad, A. Lightweight expanded clay aggregate as a building material–An overview. Constr. Build. Mater. 2018, 170, 757–775. [Google Scholar] [CrossRef]
- Wang, J.; Wang, S.; Wang, H.; He, Z. Influence of Ceramsite with Assembly Unit of Sludge and Excavated Soil on the Properties of Cement Concrete. Materials 2022, 15, 3164. [Google Scholar] [CrossRef]
- Xie, J.; Liu, J.; Liu, F.; Wang, J.; Huang, P. Investigation of a new lightweight green concrete containing sludge ceramsite and recycled fine aggregates. J. Clean. Prod. 2019, 235, 1240–1254. [Google Scholar] [CrossRef]
- Wang, C.-Q.; Duan, D.-Y.; Huang, D.-M.; Chen, Q.; Tu, M.-J.; Wu, K.; Wang, D. Lightweight ceramsite made of recycled waste coal gangue & municipal sludge: Particular heavy metals, physical performance and human health. J. Clean. Prod. 2022, 376, 134309. [Google Scholar]
- Khazaleh, M.A.; Kumar, P.K.; Mohamed, M.; Kandasamy, A. Influence of coarse coal gangue aggregates on properties of structural concrete with nano silica. Mater. Today Proc. 2023, 72, 2089–2095. [Google Scholar] [CrossRef]
- Luo, Z.; Guo, J.; Liu, X.; Mu, Y.; Zhang, M.; Zhang, M. Preparation of ceramsite from lead-zinc tailings and coal gangue: Physical properties and solidification of heavy metals. Constr. Build. Mater. 2023, 368, 130426. [Google Scholar] [CrossRef]
- Li, J.; Gao, G. Preparation of ceramsite concrete from paper mill sludge and its application ingreen self-insulation wall material. New Build. Mater. 2021, 48, 154. [Google Scholar]
- Fan, L.; Zhang, Z.; Yu, Y.; Li, P.; Cosgrove, T. Effect of elevated curing temperature on ceramsite concrete performance. Constr. Build. Mater. 2017, 153, 423–429. [Google Scholar] [CrossRef]
- Bu, C.; Yang, H.; Liu, L.; Zhu, D.; Sun, Y.; Yu, L.; Ouyang, Y.; Cao, X.; Wei, Q. Quantification of Ceramsite Granules in Lightweight Concrete Panels through an Image Analysis Technique. Materials 2022, 15, 1603. [Google Scholar] [CrossRef] [PubMed]
- Yakovlev, G.; Saidova, Z.; Gordina, A.; Kuzmina, N.; Ginchitskaya, Y.; Knyazeva, S.; Elrefai, A. Application of ceramsite dust as an active pozzolan additive in the cement-based compositions. IOP Conf. Ser. Mater. Sci. Eng. 2021, 1203, 032022. [Google Scholar] [CrossRef]
- Wei, H.; Song, B.; Huan, Q.; Song, C.; Wang, S.; Song, M. Preparation of iron tailings-based porous ceramsite and its application to lead adsorption: Characteristic and mechanism. Sep. Purif. Technol. 2024, 342, 126839. [Google Scholar] [CrossRef]
- Bu, C.; Zhu, D.; Liu, L.; Lu, X.; Sun, Y.; Yan, Z.; Yu, L.; Wei, Q. A Study on the Mechanical Properties and Microcosmic Mechanism of Basalt Fiber Modified Rubber Ceramsite Concrete. Buildings 2022, 12, 103. [Google Scholar] [CrossRef]
- Wang, P.; Zhang, J.; Duan, K. Experimental Study on Influencing Factors of the Separation of Silt Ceramsite Concrete. J. Jinling Inst. Technol. 2019, 35, 47–51. [Google Scholar]
- Wang, H.; Gao, X.; Wang, R. The influence of rheological parameters of cement paste on the dispersion of carbon nanofibers and self-sensing performance. Constr. Build. Mater. 2017, 134, 673–683. [Google Scholar] [CrossRef]
- Wang, Z.; Gao, J.; Ai, T.; Jiang, W.; Zhao, P. Quantitative evaluation of carbon fiber dispersion in cement based composites. Constr. Build. Mater. 2014, 68, 26–30. [Google Scholar] [CrossRef]
- JGJ/T 12-2019; Technical Standard for Application of Lightweight Aggregate Concrele. Ministry of Housing and Urban-Rural Development of the People’s Republic of China: Beijing, China, 2019.
- GB/T 17431.2-2010; Lightweight Aggregates and Its Test Methods-Part 2: Test Methods for Lightweight Aggregates. The State Bureau of Quality and Technical Supervision: Beijing, China, 2010.
- GB/T 2419-2005; Test Method for Fluidity of Cement Mortar. The State Bureau of Quality and Technical Supervision: Beijing, China, 2005.
- Chen, B.; Razaqpur, A.G. Effect of air-entrainment and phase transition on chloride diffusion in partially frozen concrete. Cold Reg. Sci. Technol. 2022, 196, 103513. [Google Scholar] [CrossRef]
- Zhang, C.; Zhang, S.; Yu, J.; Kong, X. Water absorption behavior of hydrophobized concrete using silane emulsion as admixture. Cem. Concr. Res. 2022, 154, 106738. [Google Scholar] [CrossRef]
- Amer, I.; Abdelkhalik, A.; Mayhoub, O.A.; Kohail, M. Development of sustainable slag-based geopolymer concrete using different types of chemical admixtures. Int. J. Concr. Struct. Mater. 2024, 18, 27. [Google Scholar] [CrossRef]
- GBJ81-85; Test Method for Mechanical Properties of Ordinary Concrete. National Standards of people’s Republic of China: Beijing, China, 1986.
- Nahhab, A.H.; Ketab, A.K. Influence of content and maximum size of light expanded clay aggregate on the fresh, strength, and durability properties of self-compacting lightweight concrete reinforced with micro steel fibers. Constr. Build. Mater. 2020, 233, 117922. [Google Scholar] [CrossRef]
- Xu, F.; Chang, R.; Zhang, D.; Liang, Z.; Wang, K.; Wang, H. Improvement of CO2-cured sludge ceramsite on the mechanical performances and corrosion resistance of cement concrete. Materials 2022, 15, 5758. [Google Scholar] [CrossRef] [PubMed]
- Peng, X.; Shi, F.; Yang, J.; Yang, Q.; Wang, H.; Zhang, J. Modification of construction waste derived recycled aggregate via CO2 curing to enhance corrosive freeze-thaw durability of concrete. J. Clean. Prod. 2023, 405, 137016. [Google Scholar] [CrossRef]
- Zhuang, Y.Z.; Chen, C.Y.; Ji, T. Effect of shale ceramsite type on the tensile creep of lightweight aggregate concrete-sciencedirect. Constr. Build. Mater. 2013, 46, 13–18. [Google Scholar] [CrossRef]
- Tong, L.; Ji, J.; Yang, J.; Qian, X.; Li, X.; Wang, H.; Zhou, S.; Wu, Y.; Zhao, Y.; Yuan, X. Sludge-based ceramsite for environmental remediation and architecture ingredients. J. Clean. Prod. 2024, 448, 141556. [Google Scholar] [CrossRef]
- Zang, J.; Pan, C.; Hu, Y.; Qu, S.; Li, M.E. Preparation of Ceramsite Using Dehydrated Silt Soil and Its Performance on Compressive Strength of Ceramsite Concrete Block. Sustainability 2023, 15, 9134. [Google Scholar] [CrossRef]
- Reza, S.M.; Mohammad, M.; Mohammad, A.H. Impact of fine lightweight aggregates and coal waste on structural lightweight concrete: Experimental study and gene expression programming. Structures 2024, 63, 106397. [Google Scholar]
- Paul, A.; Murgadas, S.; Delpiano, J.; Moreno-Casas, P.A.; Walczak, M.; Lopez, M. The role of moisture transport mechanisms on the performance of lightweight aggregates in internal curing. Constr. Build. Mater. 2021, 268, 121191. [Google Scholar] [CrossRef]
- Hasan, M.; Saidi, T.; Afifuddin, M. Mechanical properties and absorption of lightweight concrete using lightweight aggregate from diatomaceous earth. Constr. Build. Mater. 2021, 277, 122324. [Google Scholar] [CrossRef]
- Alghrairi, N.; Aziz, F.N.A.; Rashid, S.A.; Mohamed, M.Z.B.; Ibrahim, A.M. Impact of nano-silica on the mechanical properties of lightweight concrete. Earth Environ. Sci. 2024, 1369, 012033. [Google Scholar] [CrossRef]
- Ma, C.; Bao, S.; Zhang, Y.; Luo, Y.; Gui, Y.; Ren, Y. Preparation of non-sintered sewage sludge based ceramsite by alkali-thermal activation and hydration mechanism. Ceram. Int. 2022, 48, 31606–31613. [Google Scholar] [CrossRef]
- Yue, D.; Yue, Q.; Gao, B. Preparation and bloating mechanism of porous ultra-lightweight ceramsite by dehydrated sewage sludge and Yellow River sediments. J. Wuhan Univ. Technol.-Mater. Sci. Ed. 2014, 29, 1129–1135. [Google Scholar] [CrossRef]
- Liu, L.; Yang, J.; She, Y.; Lv, S.; Yang, Z.; Hu, P. Thermal and mechanical properties of coal gasification slag based foam concrete. Environ. Sci. Pollut. Res. Int. 2023, 30, 49905–49916. [Google Scholar] [CrossRef] [PubMed]
- Shi, Y.; Guo, W.; Jia, Y.; Xue, C.; Qiu, Y.; Zhao, Q. Preparation of non-sintered lightweight aggregate ceramsite based on red mud-carbide slag-fly ash: Strength and curing method optimization. J. Clean. Prod. 2022, 372, 133788. [Google Scholar] [CrossRef]
- Guan, H.; Yu, J.; Kibugenza, A.S.U.; Sun, Q. Preparation of coal gangue ceramsite high-strength concrete and investigation of its physico-mechanical properties. Sci. Rep. 2022, 12, 16369. [Google Scholar] [CrossRef]
- Zhang, G.Z.; Liu, C.; Cheng, P.F.; Li, Z.; Han, Y.; Wang, X.Y. Enhancing the Interfacial Compatibility and Self-Healing Performance of Microbial Mortars by Nano-SiO2-Modified Basalt Fibers. Cem. Compos. Struct. 2024, 152, 105650. [Google Scholar]
- Zhang, Q.; Xu, Y.; Zhang, H.; Gu, X.; Ni, S.; Xu, Y.; Liu, R. Preparation and performance influencing factors of sludge-based non-sintering ceramsite foam concrete block. Constr. Build. Mater. 2024, 426, 136240. [Google Scholar] [CrossRef]


| Types | Chemical Composition (%) | |||||||
|---|---|---|---|---|---|---|---|---|
| SiO2 | Al2O3 | Fe2O3 | MgO | CaO | SO3 | R2O | Loss (%) | |
| OPC | 21.18 | 5.19 | 3.84 | 3.91 | 62.51 | 2.90 | 0.47 | 1.55 |
| Medium sand | 99.66 | 0.12 | - | - | 0.11 | - | 0.11 | - |
| SC | 54.99 | 20.55 | 14.26 | 3.42 | 2.8 | 3.98 | - | 23.6 |
| Group | Water | Cement | Medium Sand | SC | WRA |
|---|---|---|---|---|---|
| C1 | 144 | 360 | 792 | 144 | 0.00 |
| C2 | 144 | 360 | 648 | 288 | 0.00 |
| C3 | 144 | 360 | 792 | 144 | 1.44 |
| C4 | 144 | 360 | 648 | 288 | 1.44 |
| C5 | 144 | 360 | 792 | 144 | 2.16 |
| C6 | 144 | 360 | 648 | 288 | 2.16 |
| C7 | 144 | 360 | 792 | 144 | 2.88 |
| C8 | 144 | 360 | 648 | 288 | 2.88 |
| C9 | 144 | 360 | 792 | 144 | 4.32 |
| C10 | 144 | 360 | 648 | 288 | 4.32 |
| Equation | Types | a | xc | k | R2 |
|---|---|---|---|---|---|
| W = a/(1 + e(−k(T−xc))) | C1 | 0.060 | 2.20 | 0.30 | 0.99 |
| C2 | 0.058 | 3.35 | 0.36 | 0.99 | |
| C3 | 0.071 | 4.02 | 0.45 | 0.99 | |
| C4 | 0.092 | 3.96 | 0.40 | 0.99 | |
| C5 | 0.058 | 3.88 | 0.41 | 0.99 | |
| C6 | 0.058 | 4.01 | 0.40 | 0.99 | |
| C7 | 0.062 | 3.57 | 0.40 | 0.99 | |
| C8 | 0.068 | 3.76 | 0.37 | 0.99 | |
| C9 | 0.11 | 4.39 | 0.37 | 0.99 | |
| C10 | 0.11 | 4.49 | 0.37 | 0.99 |
| Group | C | O | Si | K | Ca |
|---|---|---|---|---|---|
| C1 | 8.48 | 48.26 | 21.78 | 1.98 | 1.74 |
| C2 | - | 20.58 | 8.52 | 2.50 | 7.13 |
| C3 | 26.05 | 23.52 | 2.02 | - | 36.82 |
| C4 | 23.64 | 48.48 | 5.77 | - | 13.30 |
| C5 | 7.96 | 61.60 | - | 7.66 | 21.47 |
| C6 | 14.55 | 36.99 | 9.49 | 1.53 | 4.55 |
| C7 | 8.84 | 46.12 | 18.86 | 2.17 | 1.37 |
| C8 | 17.98 | 4.22 | 1.18 | 1.93 | 3.93 |
| C9 | 8.76 | 46.53 | 9.47 | 0.19 | 23.88 |
| C10 | 40.98 | 7.62 | 0.99 | - | 0.75 |
| Group | C1 | C2 | C3 | C4 | C5 | C6 | C7 | C8 | C9 | C10 |
|---|---|---|---|---|---|---|---|---|---|---|
| Ca/Si ratio | 0.08 | 0.84 | 18.23 | 2.31 | 0 | 0.47 | 0.07 | 3.33 | 2.52 | 0.76 |
Disclaimer/Publisher’s Note: The statements, opinions and data contained in all publications are solely those of the individual author(s) and contributor(s) and not of MDPI and/or the editor(s). MDPI and/or the editor(s) disclaim responsibility for any injury to people or property resulting from any ideas, methods, instructions or products referred to in the content. |
© 2024 by the authors. Licensee MDPI, Basel, Switzerland. This article is an open access article distributed under the terms and conditions of the Creative Commons Attribution (CC BY) license (https://creativecommons.org/licenses/by/4.0/).
Share and Cite
Yu, Y.; Xiao, B.; Cao, Z.; Cheng, B.; Peng, X.; Wang, H. The Relationship between the Fresh Sludge Ceramsite Concrete’s Fluidity and the Sludge Ceramsite’s Dispersion. Coatings 2024, 14, 1095. https://doi.org/10.3390/coatings14091095
Yu Y, Xiao B, Cao Z, Cheng B, Peng X, Wang H. The Relationship between the Fresh Sludge Ceramsite Concrete’s Fluidity and the Sludge Ceramsite’s Dispersion. Coatings. 2024; 14(9):1095. https://doi.org/10.3390/coatings14091095
Chicago/Turabian StyleYu, Yehan, Bing Xiao, Zihao Cao, Bingling Cheng, Xi Peng, and Hui Wang. 2024. "The Relationship between the Fresh Sludge Ceramsite Concrete’s Fluidity and the Sludge Ceramsite’s Dispersion" Coatings 14, no. 9: 1095. https://doi.org/10.3390/coatings14091095