Article

The Influence of Surface Nanocrystallization of TA2 Titanium Alloy on Its Corrosion Resistance

1
National Center for Materials Service Safety, University of Science and Technology Beijing, Beijing 100083, China
2
High Voltage Department, State Key Laboratory of Power Grid Environmental Protection, China Electric Power Research Institute, Wuhan 430074, China
3
Innovation Group of Marine Engineering Materials and Corrosion Control, Southern Marine Science and Engineering Guangdong Laboratory, Zhuhai 519080, China
*
Author to whom correspondence should be addressed.
Coatings 2024, 14(9), 1114; https://doi.org/10.3390/coatings14091114
Submission received: 19 July 2024 / Revised: 15 August 2024 / Accepted: 22 August 2024 / Published: 2 September 2024

Abstract

:
In this study, the surface nano treatment of TA2 titanium alloy was realized by means of surface mechanical wear treatment. The microstructure and electrochemical properties of the nanocrystalline layer were investigated by SEM, TEM, Electrochemical Impedance Spectroscopy, and Potentiodynamic Polarization, while the nucleation mechanism of the passivation film was discussed. The results indicate that the original coarse grains on the sample’s surface are transformed into randomly oriented nanocrystals by surface mechanical attrition treatment (SMAT). The corrosion current density of the surface nanocrystallized TA2 titanium alloy (9.2 nA·cm−2) experienced a reduction of two orders of magnitude compared to untreated TA2 titanium alloy (134.5 nA·cm−2) in 3.5 wt.% NaCl solution. The SMAT methods accelerates nucleation mechanism transitioning to continuous nucleation.

1. Introduction

Titanium and its alloys are extensively utilized in marine engineering due to their exceptional properties, including corrosion resistance and high specific strength [1]. Titanium and titanium alloys are widely used in nuclear submarines, deep-sea submersibles, and atomic ice breakers [2]. In many cases, titanium components used in ships come into contact with adjacent structural parts or large amounts of sediment in seawater, such as propellers, seawater pumps, motion-pair components, and seawater sprinklers. There are serious friction and wear problems during use, which greatly shorten the service life of titanium and titanium alloys [3]. Nonetheless, their low hardness and inadequate wear resistance during service cannot be disregarded.
Gurrappa et al. [4,5] conducted a study on the corrosion behavior of TC4 and IMI-834 alloys under simulated acidic, marine, and industrial environmental conditions. It was observed that at elevated temperatures in marine and industrial settings, the surface of IMI-834 was susceptible to pitting and crevice corrosion. Codaro et al. [6] noted the high friction coefficient and poor wear resistance of titanium and its alloys, suggesting the potential occurrence of materials failure due to thermal bonding during rubbing [7]. Wang et al. [8] revealed that in simulated deep-sea environments, plastic deformation on the TC4 surface could induce crack nucleation beneath the surface, serving as crack initiation sites. Furthermore, the accumulation of plastic deformation was found to expedite crack growth and propagation. The poor wear resistance of titanium materials is mainly caused by two factors: (1) Low work hardening rate and plastic shear resistance; and (2) The oxide film formed by the temperature rise (flash temperature) during the friction process is relatively fragile and easily falls off during the friction process. Hence, there is a significant focus on enhancing the wear and corrosion resistance of titanium and its alloys [9]. To improve the performance of titanium and titanium alloys, researchers at home and abroad have proposed many methods including surface nanocrystallization (SN) [9], laser surface modification, ion implantation, micro-arc oxidation, physical vapor deposition, chemical vapor deposition, double glow plasma technology, sol-gel method, etc., to modify the surface of titanium and titanium alloys [10].
SN involves the formation of a nano-layer on a material’s surface using physical or chemical methods, while maintaining its original coarse-grained state and chemical composition [11,12]. The primary aim is to enhance the surface structure of the material, thereby improving its surface performance [13]. There are two main ways to achieve surface self-nanocrystallization: One is to mechanically treat the surface of the material; the second is the non-equilibrium heating method, which is mainly studied in this article using the surface mechanical attrition treatment (SMAT) method.
Zhang Conghui et al. [14] prepared nanocrystalline on the surface of industrial pure titanium by high-energy shot peening technology. It was found that as the distance between the sample surface and the steel ball increased, the degree of grain refinement and the increase in surface hardness gradually decreased. Yang C [15] explored the influence of changes in shot size and time on the nanocrystallization process of magnesium metal surface during surface mechanical attrition treatment. As the size of the projectile and the grinding treatment time increases, the nanolayer of the sample thickens and the size of the nanocrystalline particles decreases. Zhao Y et al. [16] conducted surface nanocrystallization treatment on the surface of Al-Cu-Mg alloy through surface mechanical multiple grinding technology. Results showed that the crystal grains in the surface layer were refined after multiple treatments, with an average size of about 800 nm and a maximum microhardness (HV) of 185, an increase of 18%. The yield strength reached 475 MPa, an increase of 22%. SMAT achieves SN by inducing strong plastic deformation on the material’s surface through repeated application of external loads, resulting in the formation of submicron or sub-nano level crystals [17,18,19,20,21]. Continuous stress loading raises the surface temperature, prompting recrystallization of microstructures with high deformation energy storage into nanocrystals [11]. As the depth increases, the strain and strain rate of the material’s surface stress field decrease, resulting in a gradient in the metal’s surface after SN, where grain size gradually increases with distance from the treated surface [22]. The formation of a nanolayer significantly alters the surface properties of metal materials. Lu K et al. [23,24] assert that SN enhances the wear resistance and fatigue properties of metals. Maleki E et al. [25] found that the 316L sample with surface nanostructures showed considerable improvement in mechanical properties and fatigue performance. High-energy secondary shot peening elevated the fatigue strength of TA2 titanium alloy by 34% [26,27], while secondary refining shot peening reduced nano surface roughness, leading to a 52.3% increase in fatigue strength [28].
To enhance the corrosion resistance, wear resistance, and other crucial service properties of titanium alloy, the SN process was implemented on industrial pure titanium TA2. Surface mechanical grinding treatment technology was employed to modify the surface of the TA2 titanium alloy. The impact of this treatment on the microstructure of the TA2 surface was investigated, and the mechanism behind grain refinement was elucidated. Furthermore, the electrochemical corrosion behavior of the surface nanocrystalline layer was analyzed, delving into the nucleation mechanism of the passive film and examining its influence on the passive film growth process.

2. Materials and Characterization

The material utilized in this study was the annealed TA2 titanium alloy sourced from Baoji Titanium Industry Co., Ltd., Baoji, China. The detailed composition was determined using X-ray fluorescence (XRF, S2 PUM, BRUKE, Billerica, MA, USA). The composition results are presented in Table 1. It is noteworthy that the impurity content does not exceed 0.4 wt.%.

2.1. SN Experiment

The TA2 sample, which measures 80 mm × 80 mm × 3 mm, was polished using SiC sandpaper at 200 #, 600 #, 1000 #, and 1500 #, and then with 0.5 μm polishing paste. This was followed by ultrasonic cleaning in an acetone solution for 20 min and subsequent drying. Then the samples were loaded into the surface nanocrystallization testing machine (SNC-1, JINGGEJINGGONG, Chengdu, China) for SMAT. The zirconia ceramic balls with a diameter of 5 mm were utilized in conjunction with a sample tank made of glass fiber-reinforced plastic. The ceramic balls were placed at the bottom of the vacuum sample tank, covering approximately 2/3 to 3/4 of the bottom surface. The TA2 sample was securely fixed at the top of the container, maintaining a distance of 25 mm between the top and bottom surfaces. The machine’s vibration frequency was set at 50 Hz, the vacuum degree of the working vessel was set at ≤5 Pa, and the total processing time was 60 min, ensuring the surface of the sample achieved nanocrystallization. Throughout the procedure, the sample chamber was maintained in a vacuum state to prevent external contamination. Additionally, a custom glass fiber-reinforced numerical material sample tank was installed inside the surface nanocrystallization tester to minimize Fe element contamination.

2.2. Characterization

The phase analysis of the sample was conducted using an X-ray diffractometer (XRD, Smart Lab, RIGAKU, Akishima-shi, Japan) equipped with a Kα radiation source and a Cu target. The operational parameters were set to a working voltage of 45 kV and a current of 200 mA. Scanning parameters included a step size of 0.01° and a scanning speed of 8°/min, covering a scanning range from 20° to 80°. The interface morphology was examined using a metallurgical microscope (OM, OLS4000, OLYMPUS, Shinjuku-ku, Japan). Before observation, the sample underwent stepwise polishing with sandpaper up to 2000 #, followed by polishing with a 0.5 μm SiO2 polishing solution and etching with an etchant (HF:HNO3 = 1:1) to reveal the grain boundary. Surface and cross-sectional morphology analysis of the mechanically ground titanium alloy sample was performed using a scanning electron microscope (SEM, Auriga, ZEISS, Oberkochen, Germany) equipped with an energy-dispersive X-ray spectrometer (EDS, QUANTAX FlatQUAD, BRUKE, Billerica, MA, USA). The nanoscale morphology was observed by high resolution transmission electron microscopy (TEM, JEM-2010, JEOL, Ibaraki, Japan). Electrochemical tests were carried out using an electrochemical workstation (Reference 600, GAMRY, Los Angeles, CA, USA) in a 3.5 wt.% NaCl solution. A three-electrode system was employed with the sample as the working electrode, a platinum sheet (20 × 20 mm) as the counter electrode, and a saturated calomel electrode as the reference electrode. The measurements included open circuit potential (OCP), potentiodynamic polarization curve, constant potential polarization, and electrochemical impedance spectroscopy (EIS). Before measurement, the open-circuit potential was recorded for 1800 s to ensure sample stability in the solution. For the potentiodynamic tests, parameters were set to a scan speed of 0.5 mV/s, scanning from −0.5 V (vs. OCP) to 2 V (vs. SCE). A constant potential polarization at 6 V (vs. SCE) was applied to cathodically polarize the sample for 10 min at −1.0 V (vs. SCE) before data acquisition to remove the oxide film formed on the sample in the air. A sinusoidal voltage signal with an amplitude of ±5 mV and a frequency measurement range of 100 kHz to 0.01 Hz served as the input disturbance signal for the potentiodynamic polarization test. Data analysis was performed using ZSimpwin 3.5 software, and the best-fit equivalent circuit was selected for data fitting. To ensure the consistency of data, three groups of parallel samples were set for all electrochemical tests.

3. Result and Discussion

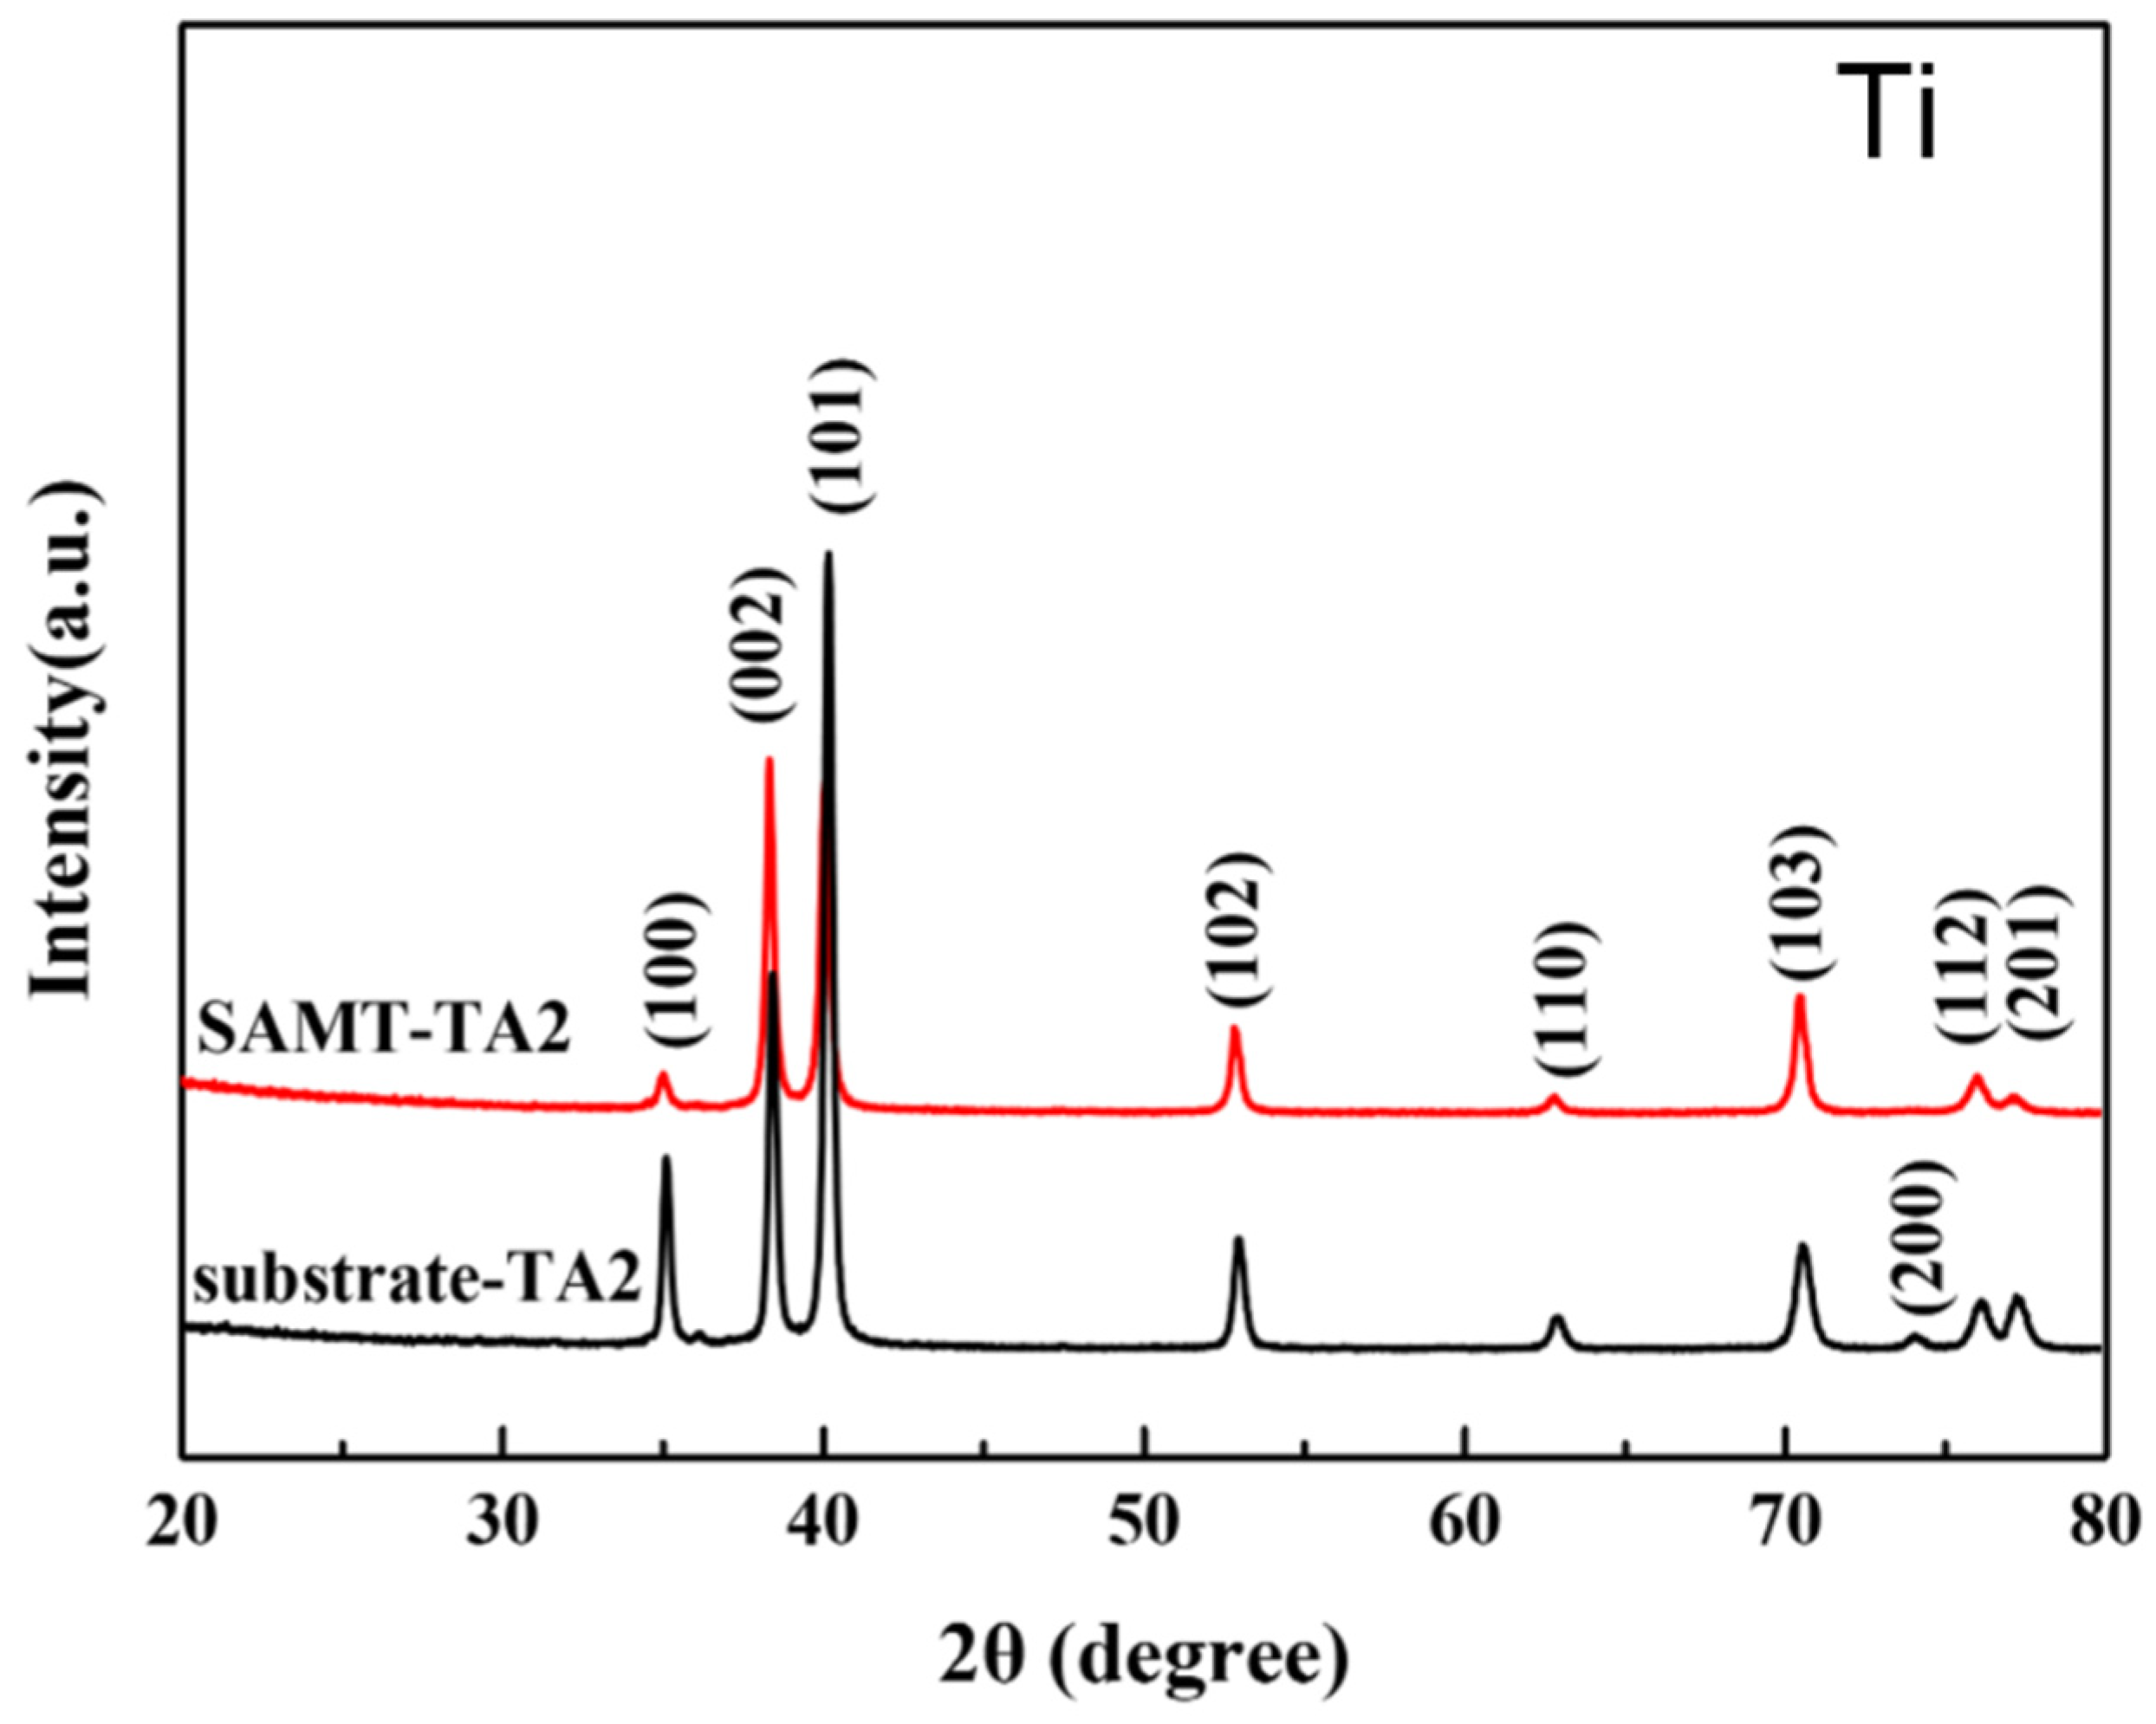
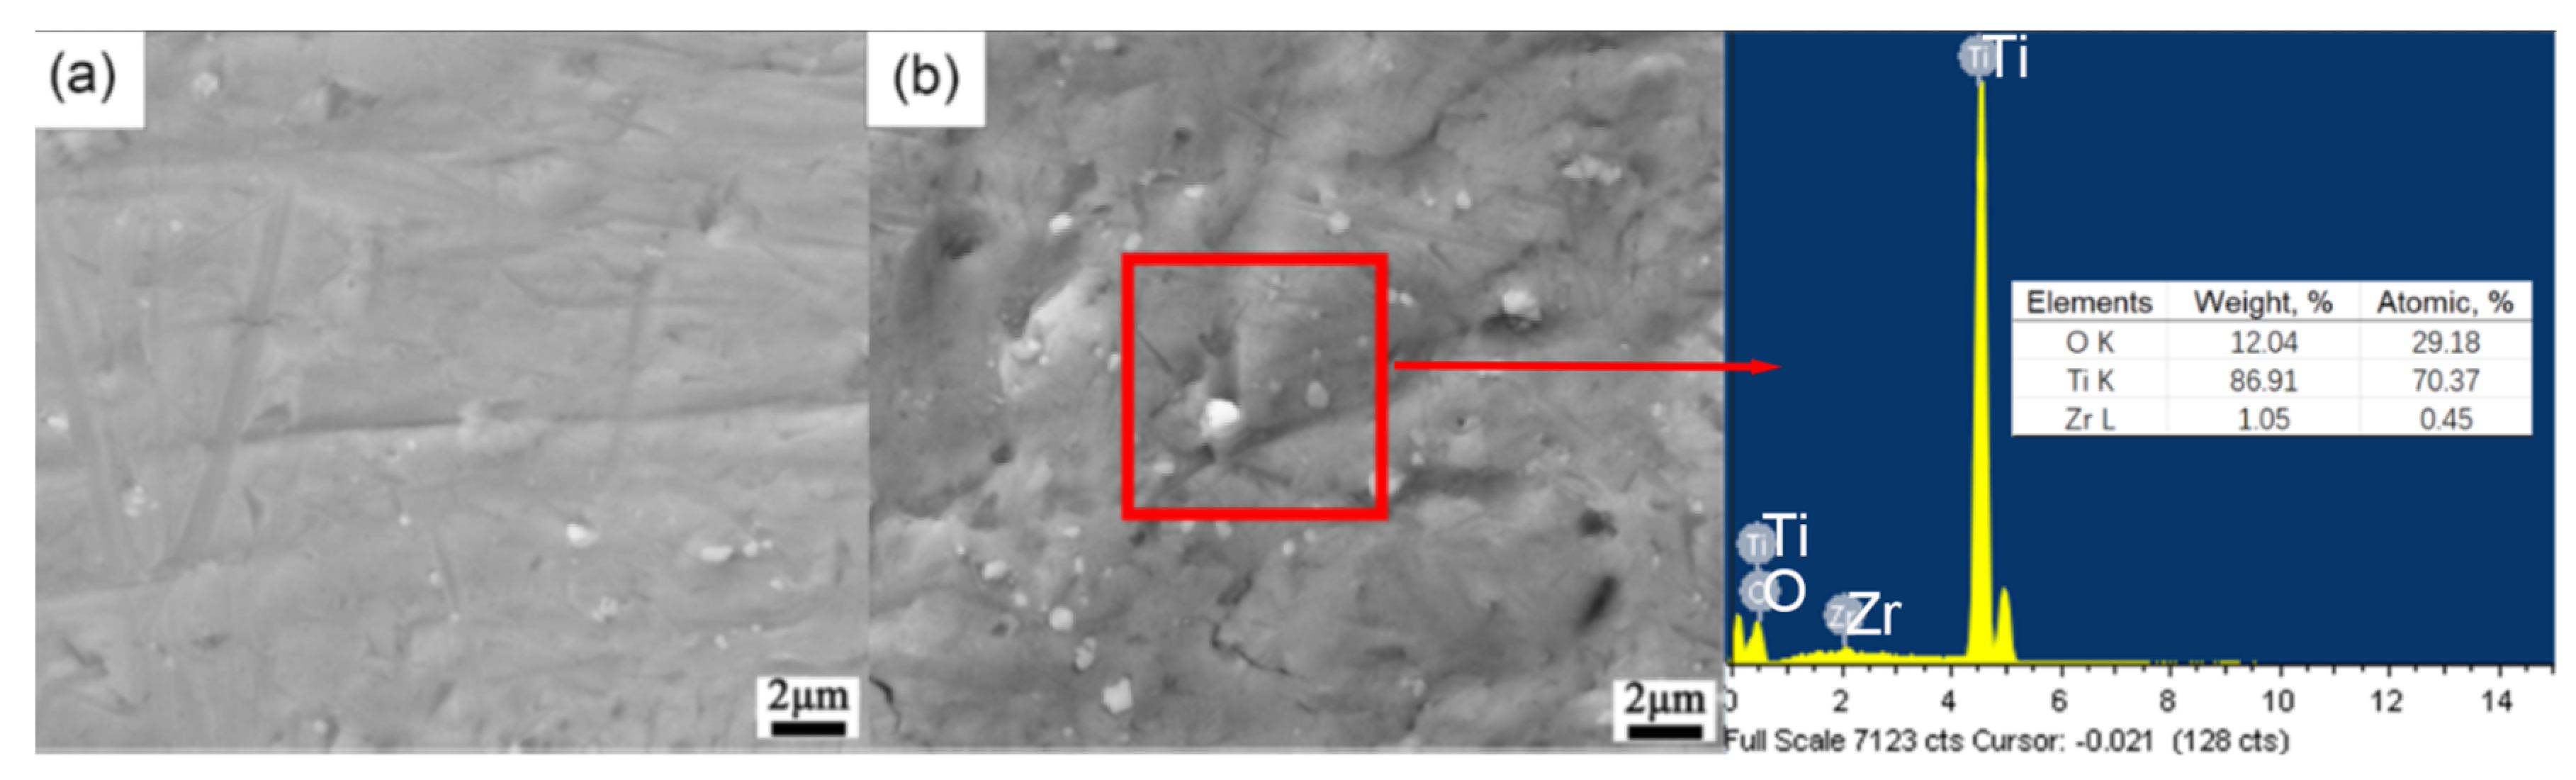
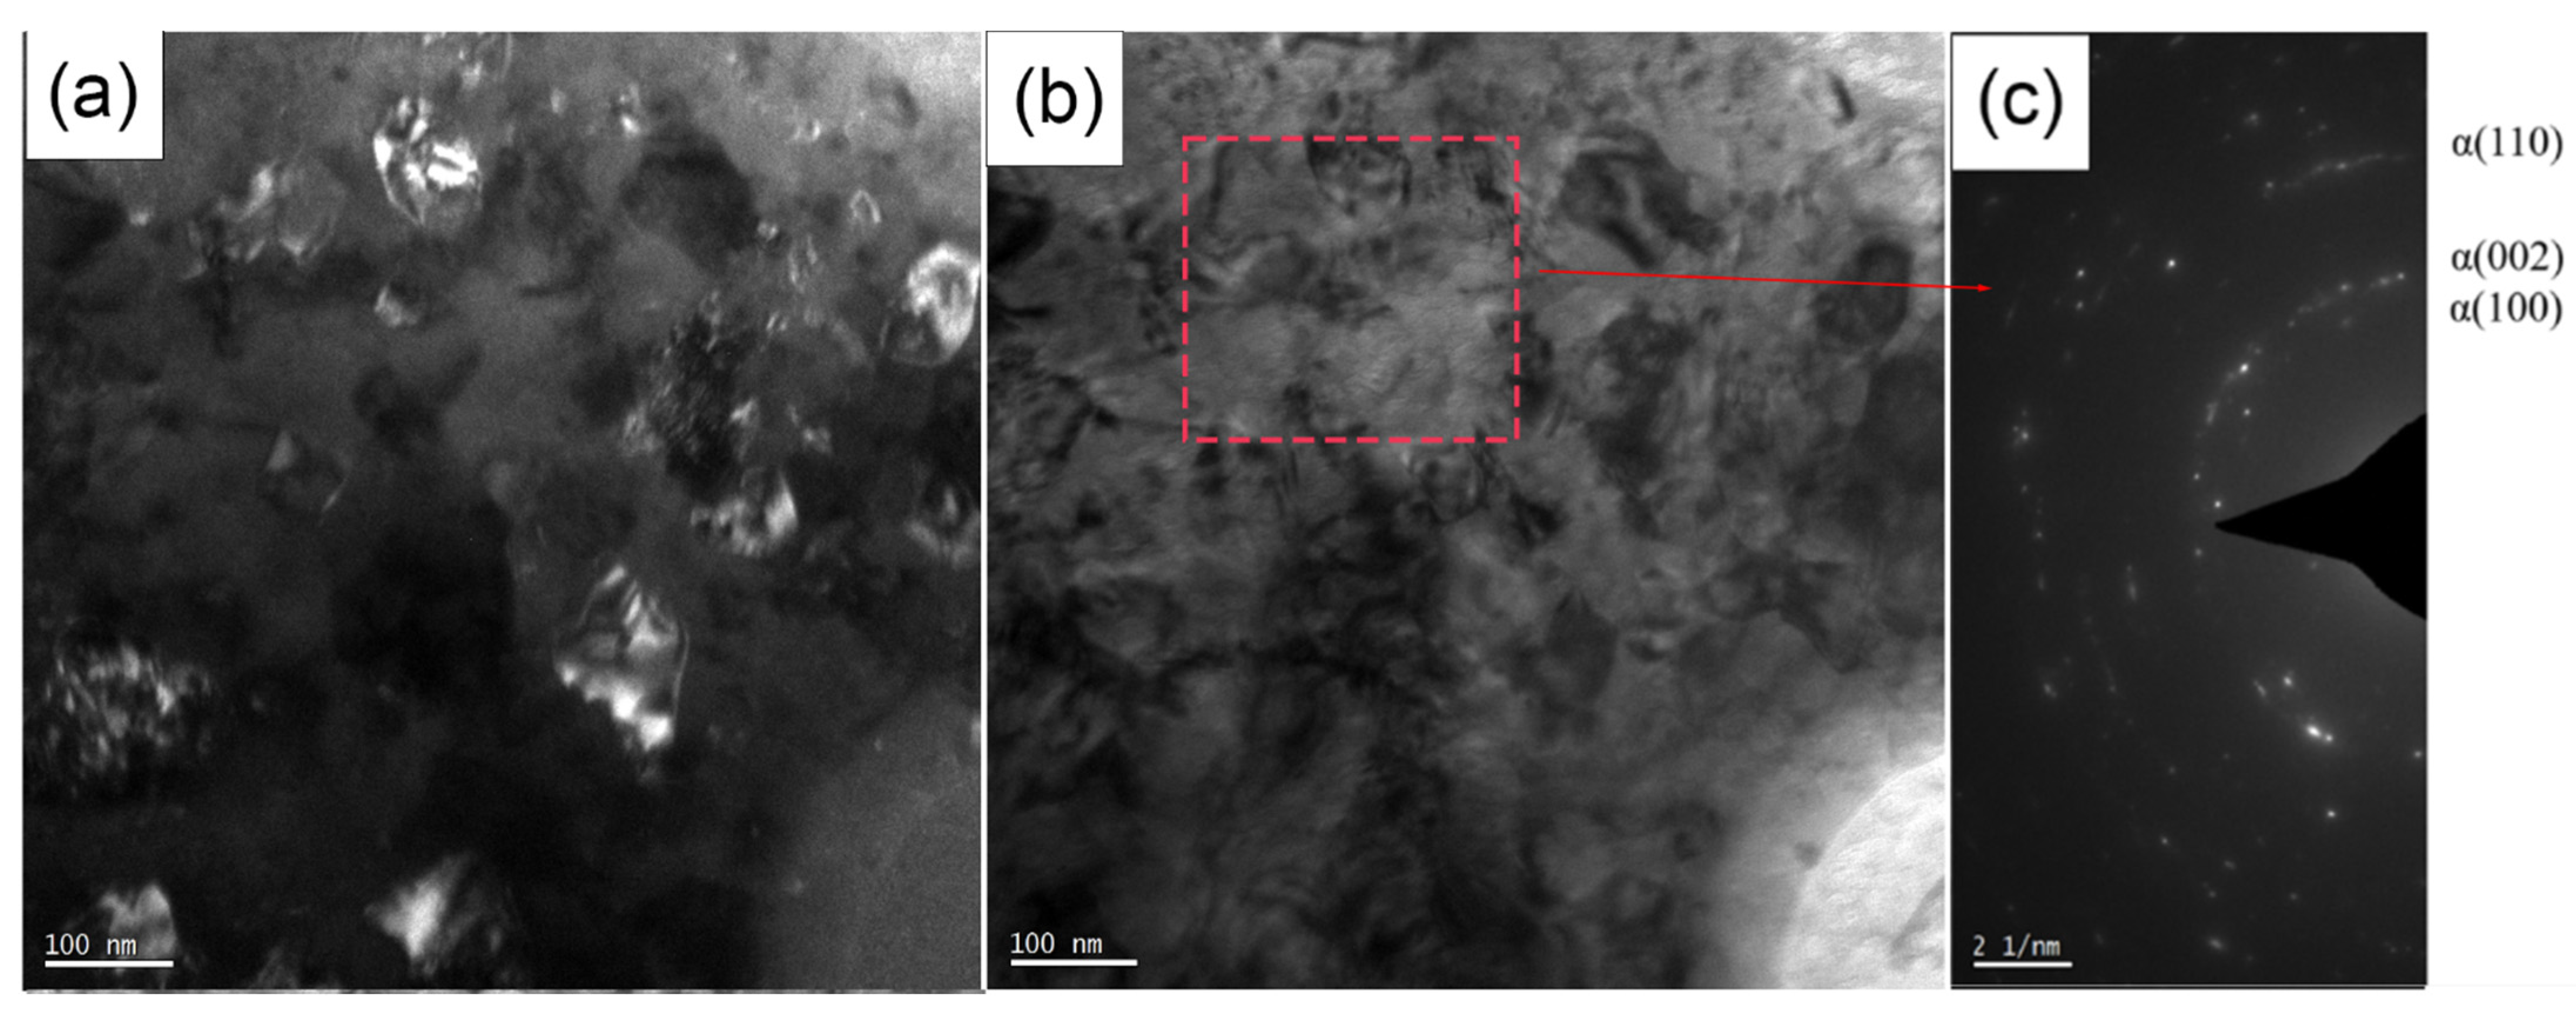
3.1. Characterization of Microstructure of TA2 by SMAT

Comparative observation was conducted on sections of TA2 and TA2 treated with SMAT through OM, and the metallographic structure is shown in Figure 1. From these figures, it is observed that the TA2 substrate exhibits a single α phase, with a grain size of approximately 25 μm. In contrast, the surface of SMAT-TA2 reveals three distinct regions: 40 μm deep surface nanolayer, a 100 μm deep twin lamellae layer, and a 40 μm deep stress affected layer. Arrows indicate three structures with different orientations in twin lamellae layer. The influence layer from SMAT, which extends 180 μm deep, demonstrates a simplified structure compared to the TA2 substrate.
To observe the change of surface phase structure after SMAT treatment, XRD analysis was carried out on TA2 and SMAT-TA2, as shown in Figure 2. Compared to the TA2, all peaks of SMAT-TA2 exhibit varying degrees of broadening, indicating refinement of the surface grains in the TA2 substrate after mechanical grinding. The average grain size is approximately 38.2 nm within a depth of about 10 μm from the surface, as determined using Scherrer’s formula [29]. From the microstructure of the SMAT-TA2 section, it can be seen that the mechanism of mechanical grinding and nanocrystallization of the TA2 surface is similar to the movement mechanism of classical dislocation twins.
The surface morphology of TA2 and SMAT-TA2 were observed by SEM, results as shown in Figure 3. Compared with the results before and after SN treatment, it can be found that the surface after SN treatment is rougher, and the average roughness is 1.25 μm. Larger deformation pits, grooves, and white fine particles appeared on the surface after SN treatment. Energy spectrum analysis of white particles showed that these white fine particles remained on the surface of the sample during the ceramic ball striking process.
Figure 4 presents TEM images of the surface of SMAT-TA2. Upon comparing the bright and dark field images, it is evident that fine nanocrystals of various sizes, all less than 100 nm, are present. The corresponding electron diffraction pattern in Figure 4c displays a continuous ring, indicating that the topmost grains of TA2 have been refined into nanocrystals with random crystallographic orientation following 1 h of surface mechanical grinding treatment. Analyzing the formation mechanism of these nanocrystals in conjunction with the metallographic structure and morphology observed in Figure 1, it is discernible that TA2 consists of a single α phase with a closely arranged hexagonal structure and limited slip systems, making slipping difficult. Under the accumulation of energy from mechanical grinding treatment, the α phase initially twins along specific orientations, forming twin sheets distributed parallelly within a single grain. As energy accumulates further, numerous dislocation tangles and dislocation walls emerge within the twin lamellae, subdividing the coarse grains into sub-unit cells. Over time, these defects such as dislocation walls, dislocation entanglements, and twin bands detach from their original positions, continuously dividing the grains, ultimately resulting in the formation of nanocrystals on the sample’s surface [26].

3.2. Electrochemical Behavior of TA2/SMAT-TA2

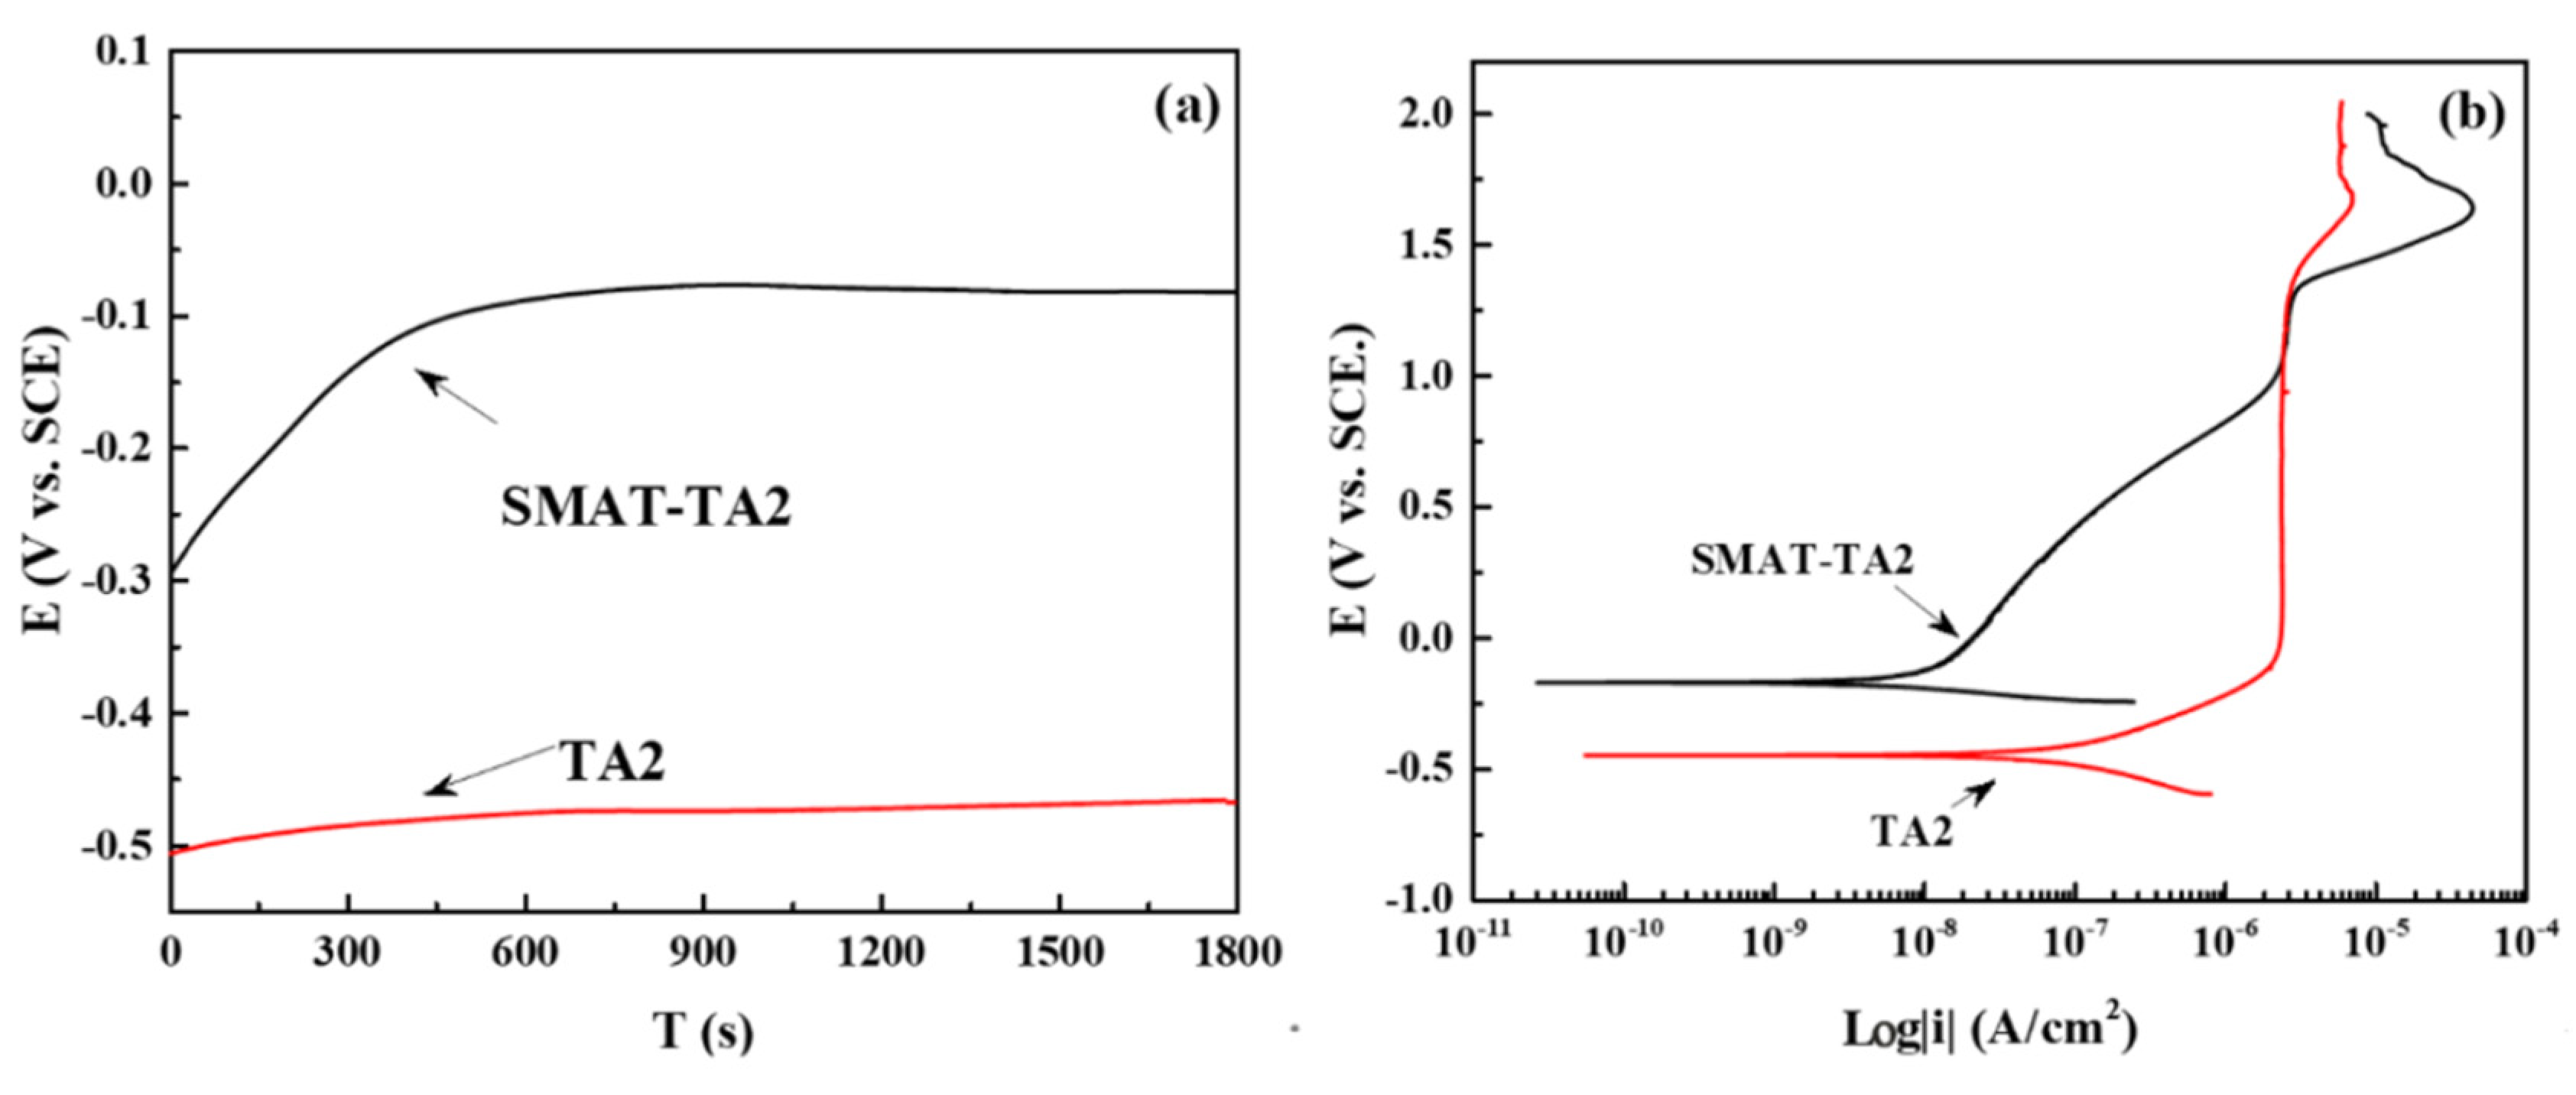
3.2.1. OCP and Polarization Curve
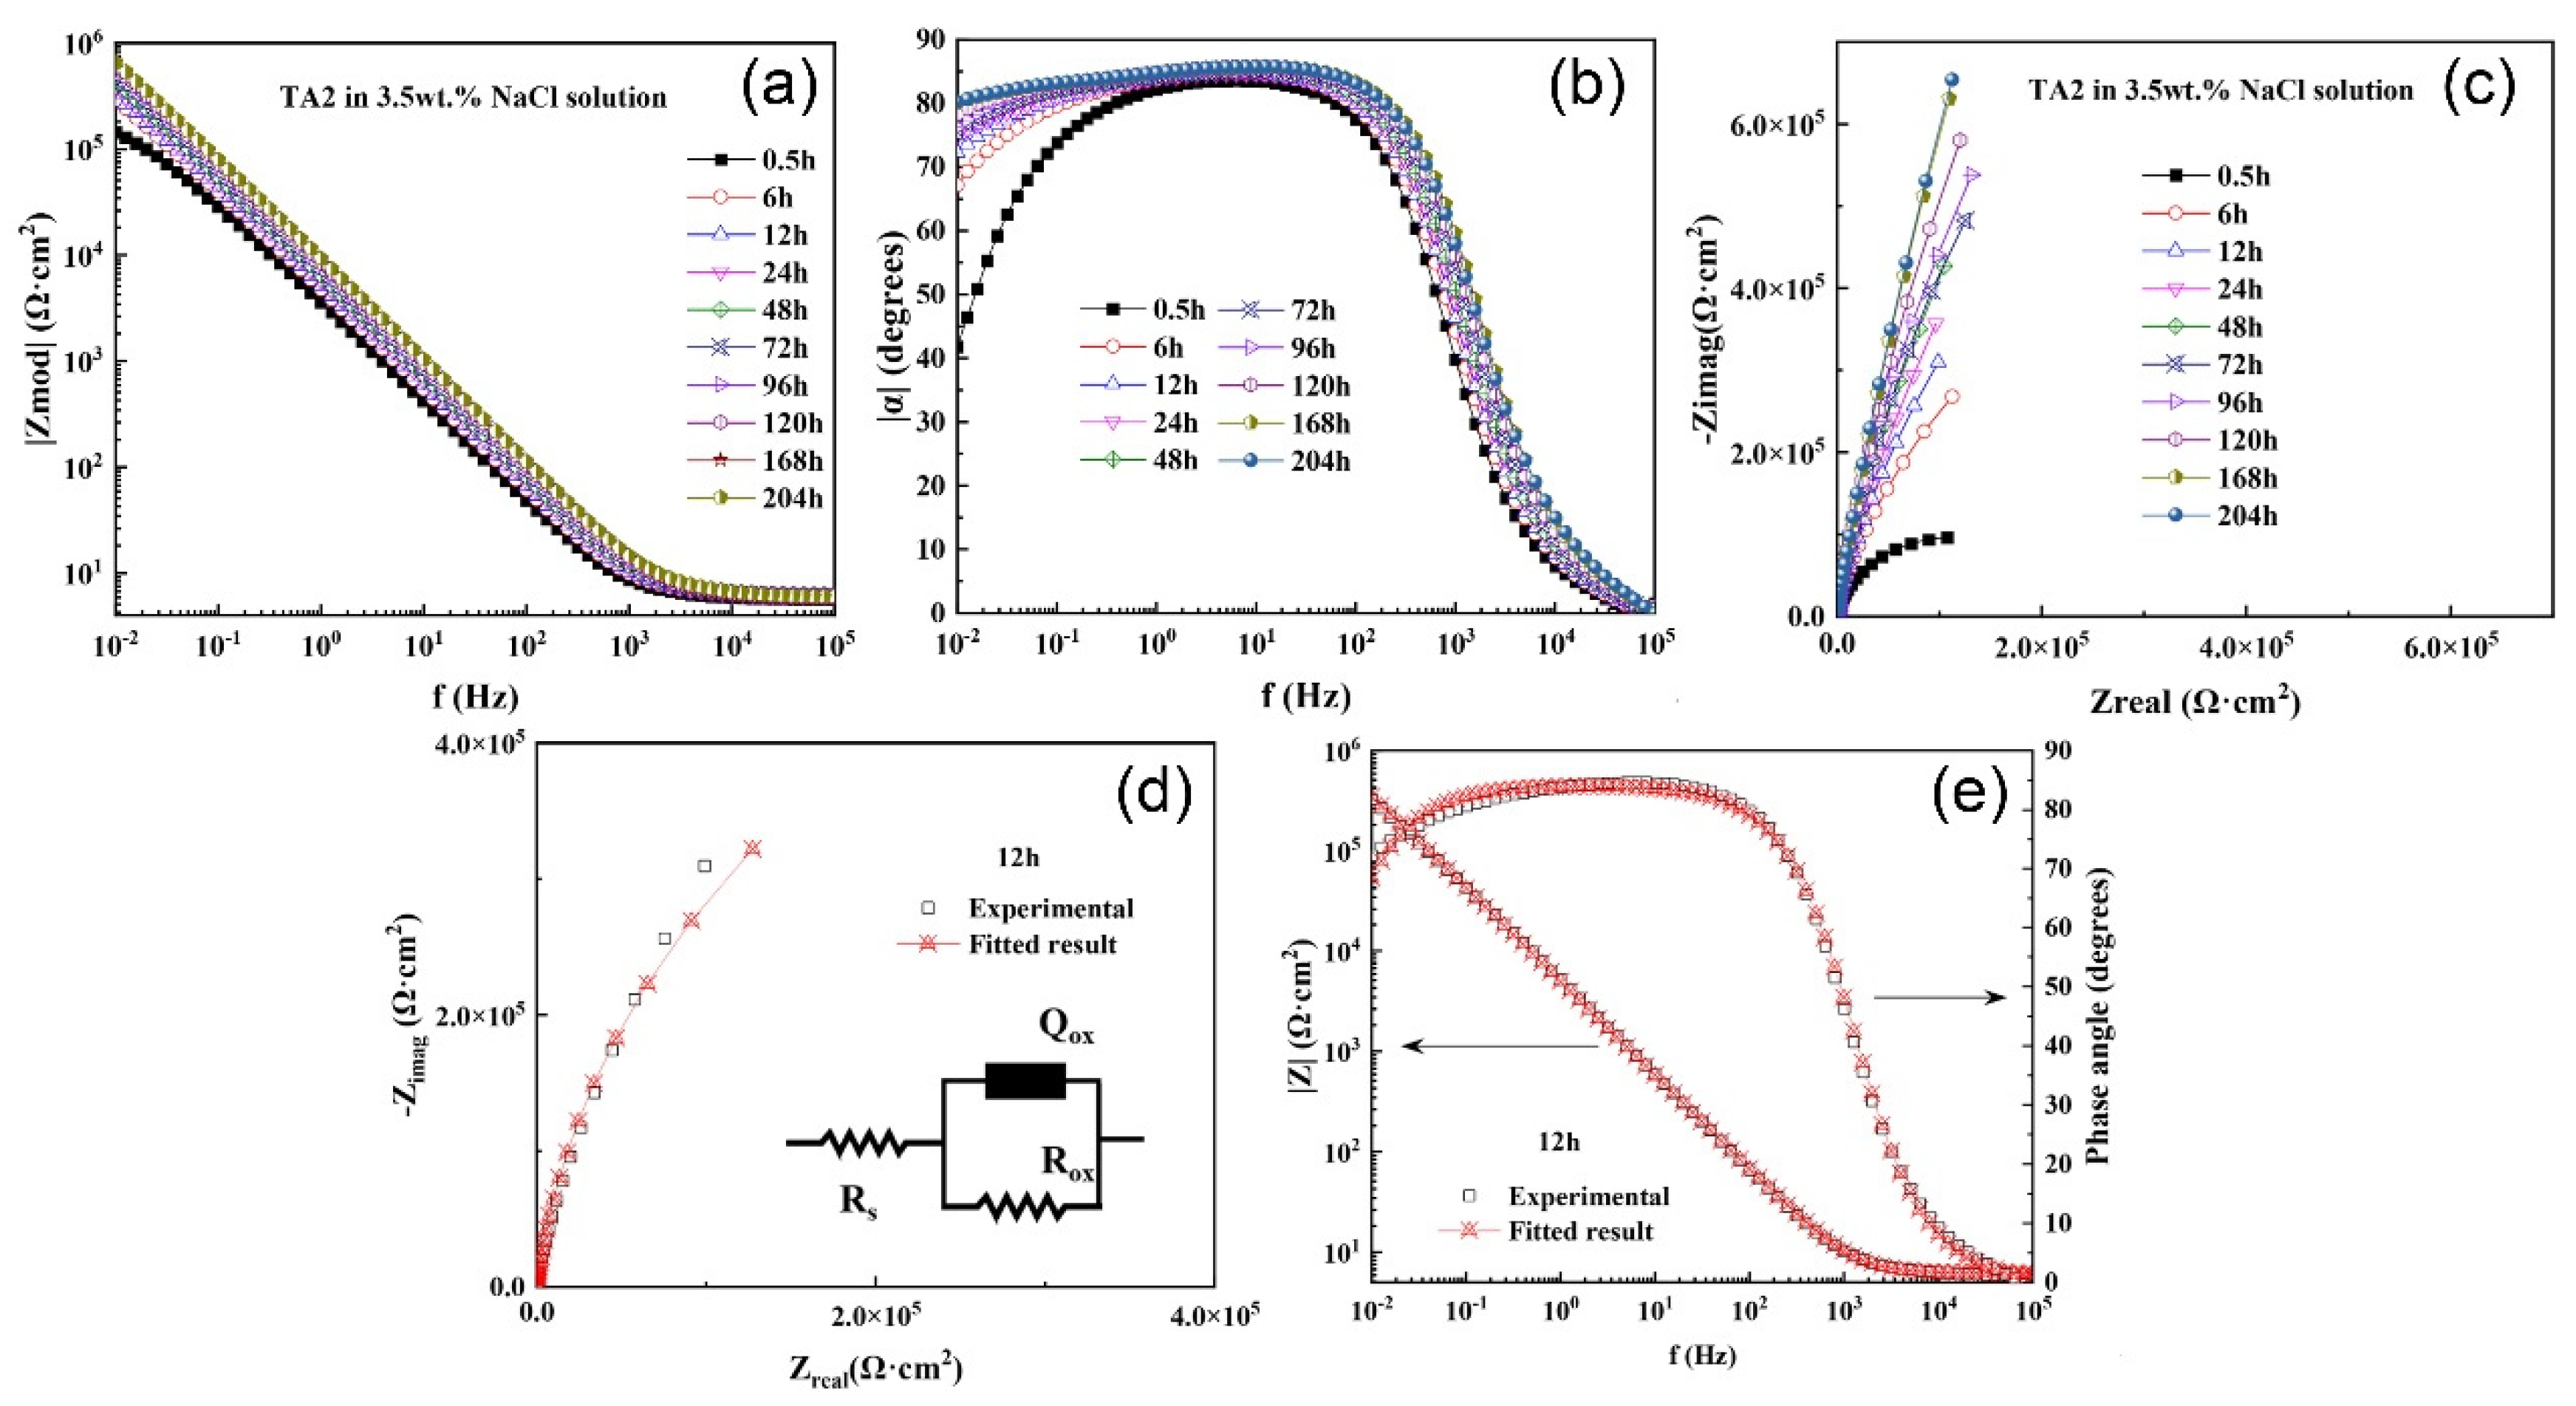
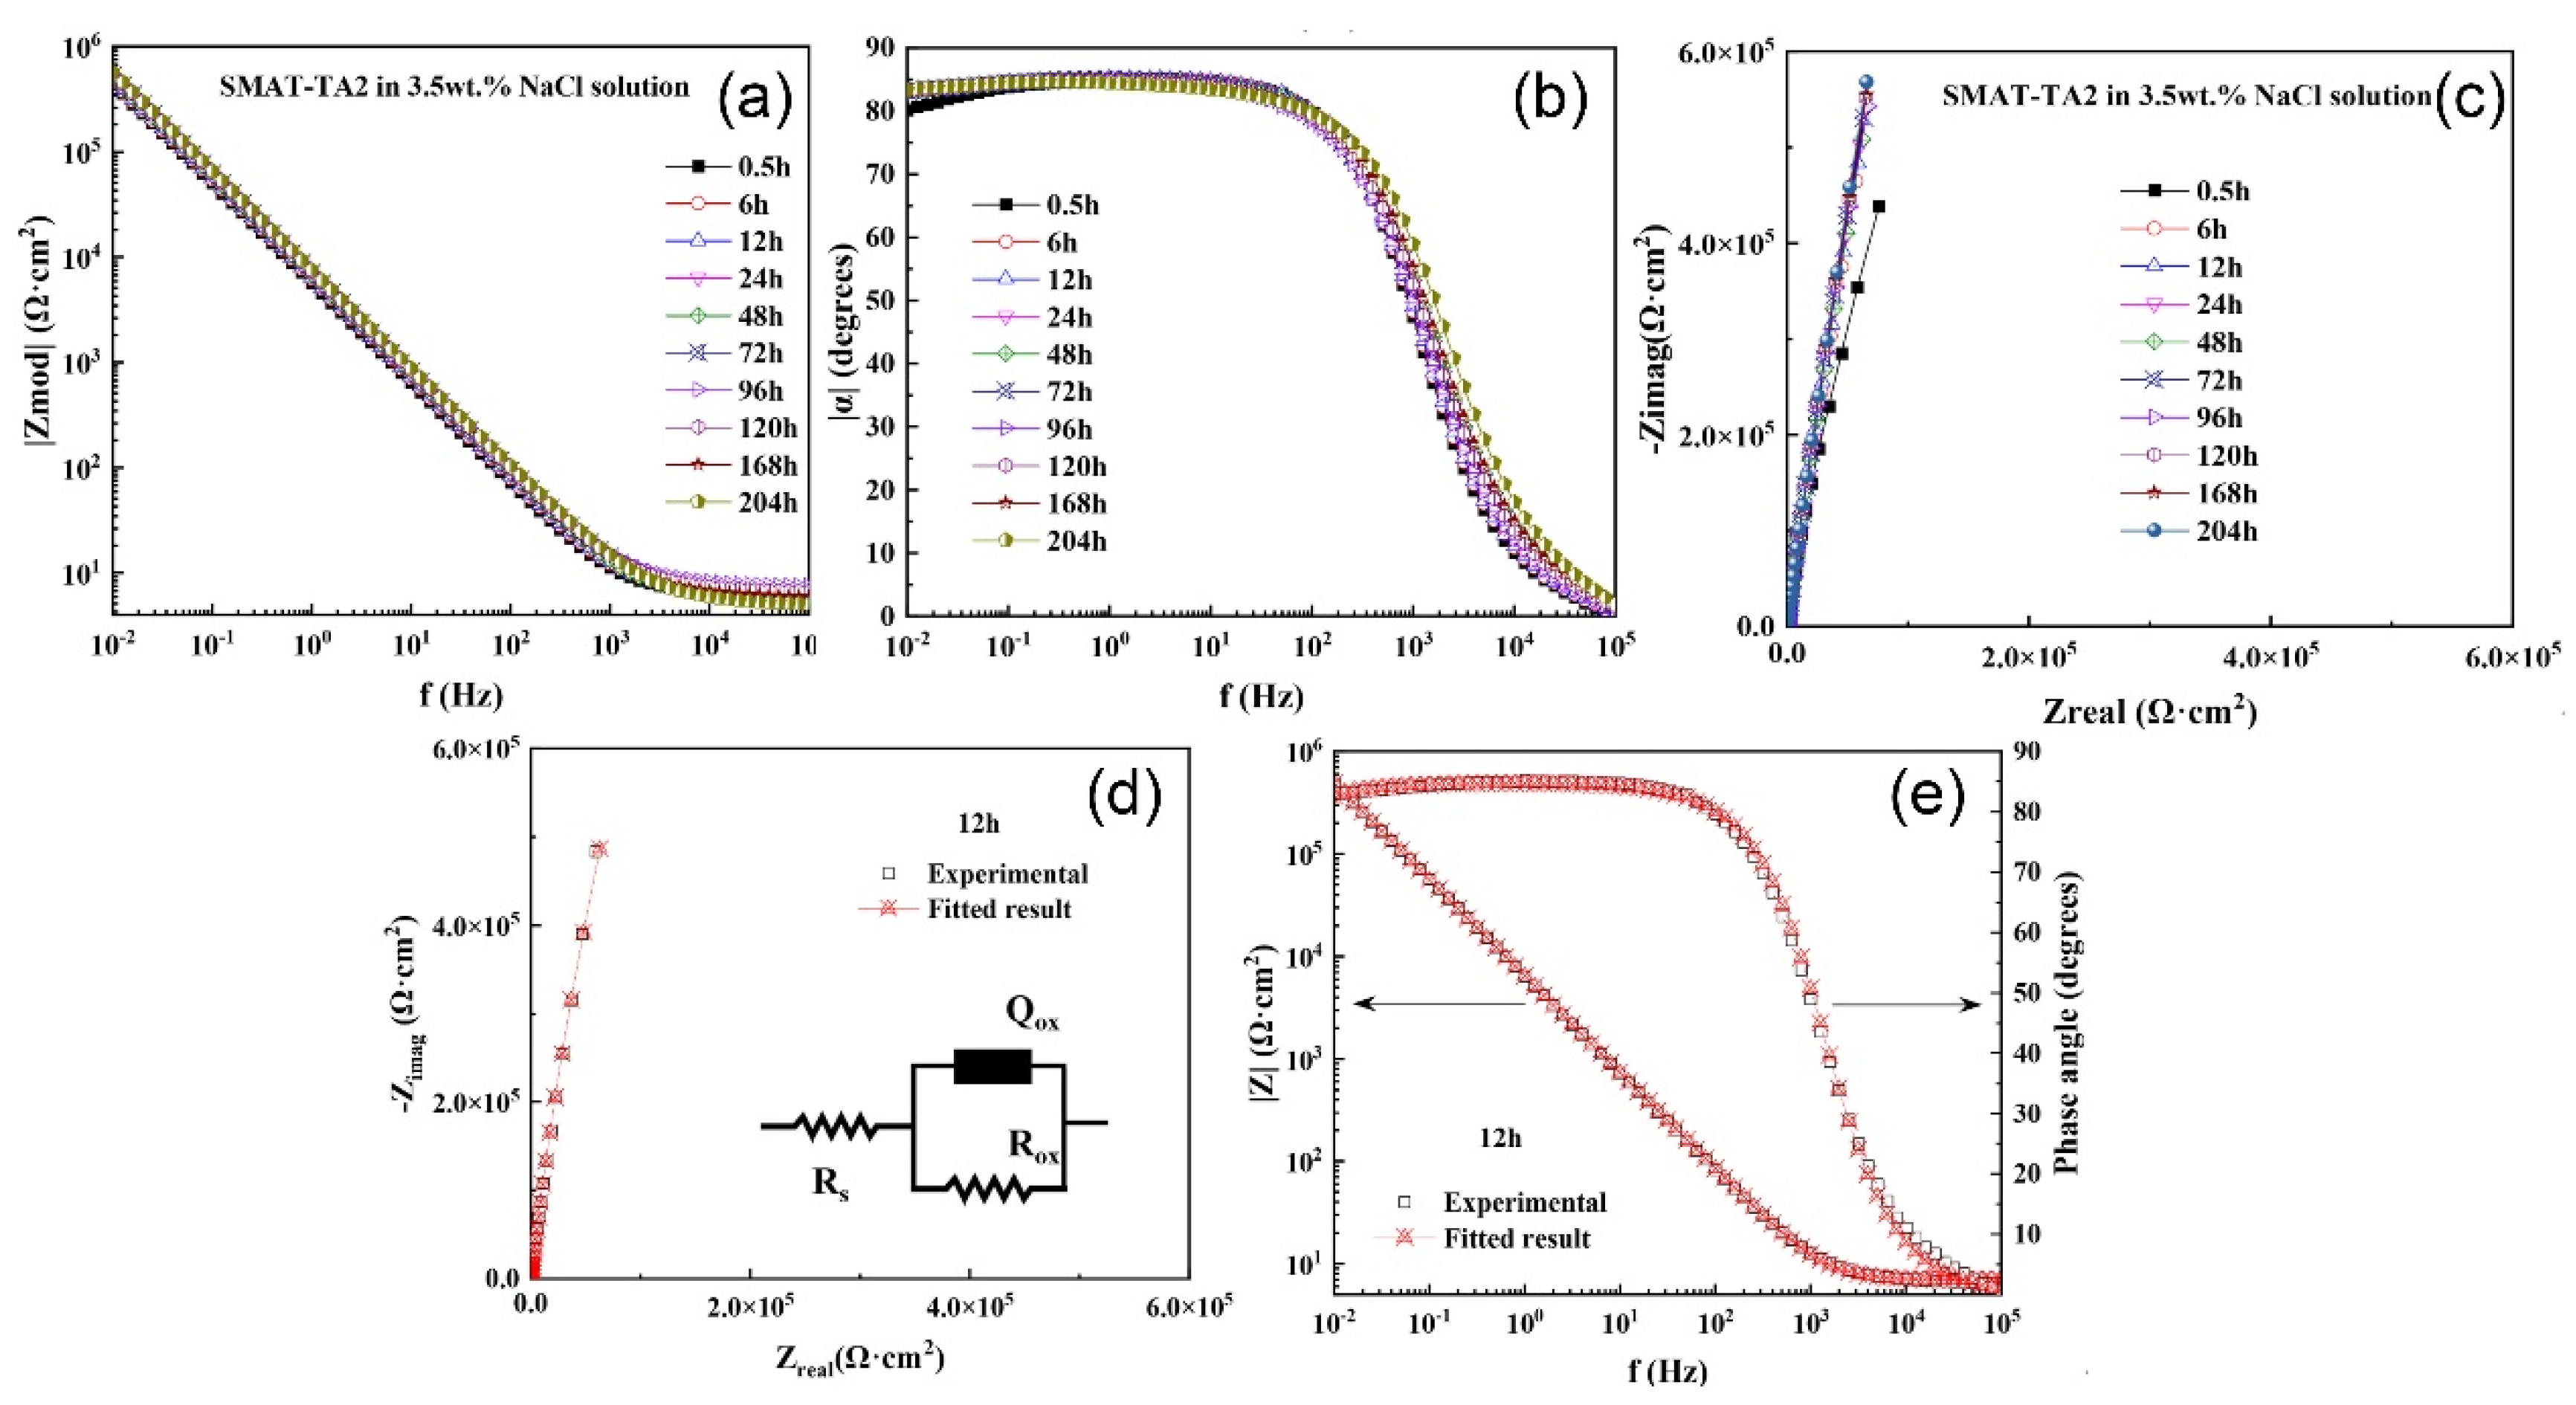
In Figure 5a, the change in open circuit potential (OCP) with time is depicted for SMAT-TA2 and TA2 in a 3.5 wt.% NaCl solution. TA2 reaches a stable value relatively quickly, while the OCP of SMAT-TA2 takes longer to stabilize. Notably, SMAT-TA2 exhibits a higher OCP value of −100 mV (vs. SCE), compared to −470 mV (vs. SCE) for TA2 in Table 2. Figure 5b presents polarization curves measured in 3.5 wt.% NaCl solution for SMAT-TA2 and TA2. To ensure the stability of open circuit potential, it is necessary to soak for 30 min before the polarization test. According to the spectra of the polarization curve, the self-corrosion potential of TA2 after mechanical grinding treatment increased to −177 mV (vs. SCE) (TA2 was −454 mV vs. SCE), and the self-corrosion current density decreased to 9.19 nA·cm−2 (TA2 was 134.5 nA·cm−2), reducing by 92.64%, representing about two orders of magnitude. The polarization curve of SMAT-TA2 exhibits passivation, and a slight tilt is observed, indicating a gradual increase in anode current density with increasing potential. This may be attributed to insufficient vacuum in the TA2 sample bin during the SMAT process, leading to the oxidation of titanium oxide TiOx (x < 2) on the sample surface. During polarization in the solution, Tix+ is transformed into more stable Ti4+, resulting in a gradual increase in anode current density. However, even in this potential region, SMAT-TA2 still demonstrated low current density compared to TA2 under the same potential, indicating significantly improved corrosion resistance of TA2 after surface mechanical grinding.

3.2.2. EIS

Figure 6 presents Bode and Nyquist plots of electrochemical impedance data for TA2 in a 3.5 wt.% NaCl solution, along with fitting results of electrochemical impedance spectra after 12 h of immersion. The data reveal that the impedance modulus of TA2 in the low-frequency band progressively increases with immersion time, indicating a gradual thickening of the passive film on the surface. As depicted in Figure 5b, the phase angle curve exhibits a time constant in the low-frequency band throughout the immersion process. The phase angle in the low-frequency band steadily rises with increasing immersion time, suggesting an augmentation in the capacitive response of the passive film, indicative of its densification over time. The impedance Nyquist diagram in Figure 6c initially displays a single prominent capacitive reactance arc, whose radius gradually enlarges with prolonged immersion time. This observation further underscores the gradual thickening and stabilization of the passivation film on the TA2 surface during immersion. To fit the electrochemical impedance spectrum of TA2, the R (QR) equivalent circuit shown in Figure 6d is utilized, with fitting results demonstrating good agreement with experimental data, as depicted in Figure 6e. The fitting outcomes, listed in Table 3, reveal a gradual decrease in the Qox value of the passivated film from 5.241 × 10⁻⁵ cm2snΩ at initial immersion to 1.934 × 10⁻⁵ cm2snΩ after 204 h of soaking. Concurrently, the resistance Rox of the passivated film steadily increases with immersion time, rising from 2.053 × 10⁵ Ω·cm2 at initial immersion to 5.604 × 10⁶ Ω·cm2 after 204 h of soaking, indicative of a progressive thickening of the TA2 surface passivation film during the immersion process.
Figure 7 illustrates Bode and Nyquist plots of electrochemical impedance data for SMAT-TA2 in a 3.5 wt.% NaCl solution, along with fitting results of electrochemical impedance spectra after 12 h of immersion. The data reveal that the impedance modulus of SMAT-TA2 in the low-frequency band exhibits a slight increase with prolonged immersion time. This suggests that the passive film of SMAT-TA2 rapidly thickens to a stable state within 0.5 h of immersion, with a subsequent gradual increase in passive film thickness over time. In Figure 7b, the low-frequency band displays a time constant, with the phase angle of the low-frequency band showing a slight increase as immersion time progresses, indicative of densification of the passive film over time. The impedance Nyquist diagram in Figure 7c initially features a single prominent capacitive reactance arc, whose radius gradually enlarges with extended immersion time, reaching a stable stage by 6 h. This observation indicates that SMAT-TA2 can swiftly form a dense and stable passive film on the surface in solution. To fit the electrochemical impedance data of SMAT-TA2, the equivalent circuit R (QR) shown in Figure 7d is employed, yielding fitting results in good agreement with experimental data, as depicted in Figure 7e. The fitting outcomes, listed in Table 4, reveal a gradual decrease in Qox, representing the capacitance characteristics of the passive film, and a concurrent increase in Rox, representing the impedance characteristics of the passive film, consistent with the aforementioned analysis. After 0.5 h of immersion in solution, the passive film impedance of SMAT-TA2 reaches 4.198 × 10⁶ Ω·cm2, close to the data of TA2 substrate after 204 h of soaking. With prolonged soaking time, the passive film resistance continues to increase, reaching 5.805 × 10⁷ Ω·cm2 after 204 h, significantly greater than that of TA2, 5.604 × 10⁶ Ω·cm2. This indicates that the passive film formed by SMAT-TA2 in solution is thicker and denser.

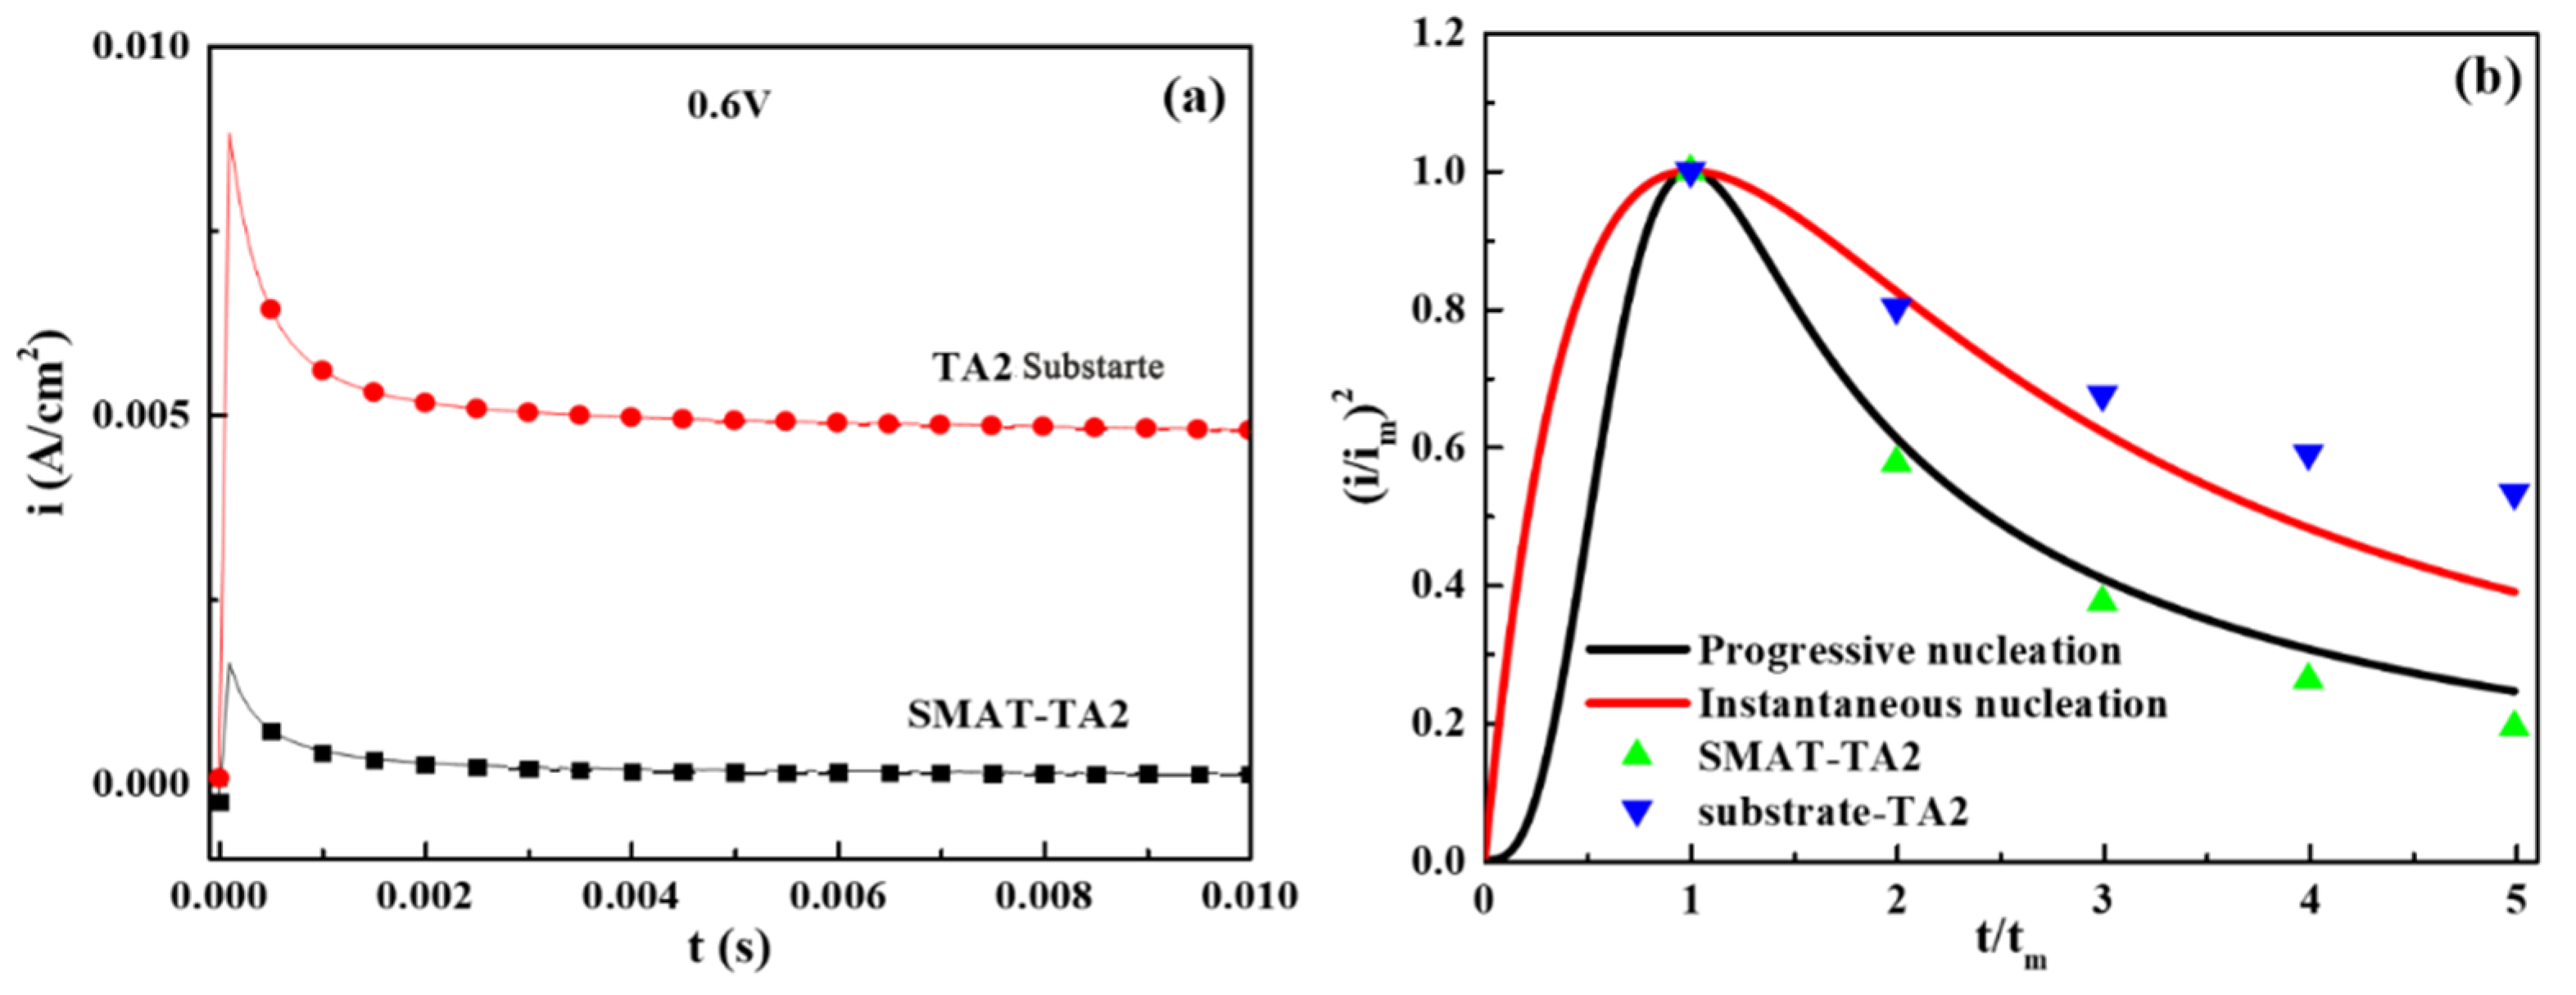
3.3. Nucleation Behavior of TA2/SMAT-TA2

In Figure 8a, the current density variation with time is presented for SMAT-TA2 and TA2 substrate samples in 3.5 wt.% NaCl solution. It is observed that the current density experiences an initial sudden increase due to the sample’s response to the applied voltage, followed by a gradual decrease attributed to the nucleation of the passive film. This trend mirrors the timing current data observed for TC4 before and after mechanical grinding. Figure 8b provides a comparison between the calculated results based on the nucleation formula and the standard model. The theoretical model for electrochemical nucleation developed by Scharifker and Hills was selected to analyze the experimental current–time transients. In this theory, the nucleation process is categorized into two models: progressive or instantaneous, with the corresponding mathematical formulas outlined [30]:
Progressive   nucleation : i 2 i m 2 = 1.2254 t / t m { 1 exp [ 2.3367 ( t t m ) 2 ] } 2
Instantaneous   nucleation : i 2 i m 2 = 1.9542 t / t m { 1 exp [ 1.2564 ( t t m ) ] } 2
where im and tm are current density and time, respectively, and the corresponding data are peak coordinates. According to the above theory, the analysis of experimental data is shown in Figure 5, indicating that the SMAT changed the nucleation mode of TA2 in 3.5 wt.% NaCl solution from instantaneous nucleation to continuous nucleation.
It can be found that the sudden voltage loading at the beginning stage leads to a sudden increase in current density, which is the response of the sample surface to the applied voltage. Then, the current density decreases, which is caused by the gradual nucleation of the passivation film under the passivation potential of the sample. SN changed TA2 at 3.5 wt.%. The nucleation mode in NaCl solution changed from instantaneous nucleation model to continuous nucleation model.

4. Conclusions

This article explores SN via SMAT to enhance the wear and corrosion resistance of TA2 titanium alloy. While titanium alloys are valued in marine engineering for their corrosion resistance and strength, they suffer from low hardness and poor wear resistance. SMAT transforms the coarse grains on TA2 into nanocrystals, improving surface properties. SMAT-TA2 showed self-corrosion potential decreased to 9.2 nA·cm−2, open circuit potential increased to −177 mv, and indicated enhanced corrosion resistance of TA2. Additionally, the nucleation mechanism during corrosion shifted from instantaneous to continuous, promoting a thicker passive film. Overall, SN via SMAT significantly enhances TA2 titanium alloy’s surface performance, making it more suitable for demanding marine engineering applications.

Author Contributions

Z.L.: Writing—original draft, Visualization, Formal analysis, and Investigation. Y.W.: Visualization, Formal analysis, and Review & editing. J.Z.: Visualization and Formal analysis. Y.G.: Writing—original draft, Investigation, and Formal analysis. L.W.: Methodology, Review & editing, Visualization, and Formal analysis. All authors have read and agreed to the published version of the manuscript.

Funding

This work was supported by the National Natural Science Foundation of China (Grant No. U21B2053), and the Innovation Group Project of Southern Marine Science and Engineering Guangdong Laboratory (Zhuhai) (No. 311021013).

Institutional Review Board Statement

Not applicable.

Informed Consent Statement

Not applicable.

Data Availability Statement

The raw/processed data required to reproduce these findings cannot be shared at this time as the data form part of an ongoing study.

Conflicts of Interest

The authors declare that they have no known competing financial interests or personal relationships that could have appeared to influence the work reported in this paper.

References

  1. Han, X.; Ma, J.; Tian, A.; Wang, Y.; Li, Y.; Dong, B.; Tong, X.; Ma, X. Surface modification techniques of titanium and titanium alloys for biomedical orthopaedics applications: A review. Colloids Surf. B Biointerfaces 2023, 227, 113339. [Google Scholar] [CrossRef]
  2. Li, L.; Sun, L.; Li, M. Diffusion bonding of dissimilar titanium alloys via surface nanocrystallization treatment. J. Mater. Res. Technol. 2022, 17, 1274–1288. [Google Scholar] [CrossRef]
  3. Al-Samarai, R.A.; Al-Douri, Y. Friction and Wear in Metals; Springer: Berlin/Heidelberg, Germany, 2024. [Google Scholar]
  4. Gurrappa, I. Characterization of titanium alloy Ti-6Al-4V for chemical, marine and industrial applications. Mater. Charact. 2003, 51, 131–139. [Google Scholar] [CrossRef]
  5. Gurrappa, I.; Reddy, D.V. Characterisation of titanium alloy, IMI-834 for corrosion resistance under different environmental conditions. J. Alloys Compd. 2005, 390, 270–274. [Google Scholar] [CrossRef]
  6. Codaro, E.N.; Nakazato, R.Z.; Horovistiz, A.L.; Ribeiro, L.M.; Ribeiro, R.B.; Hein, L.D. An image analysis study of pit formation on Ti-6Al-4V. Mater. Sci. Eng. A 2003, 341, 202–210. [Google Scholar] [CrossRef]
  7. Wang, H.Y.; Chen, K.M.; Xu, X.J.; Zhang, X.F.; Liu, G.L. Wear Failure and Surface wear Treatment Technology of Titanium Alloy Ti-6Al-4V. Light Met. 2005, 5, 54–58. [Google Scholar]
  8. Wang, J.; Chen, J.; Chen, B.; Yan, F.; Xue, Q. Wear behaviors and wear mechanisms of several alloys under simulated deep-sea environment covering seawater hydrostatic pressure. Tribol. Int. 2012, 56, 38–46. [Google Scholar] [CrossRef]
  9. Zhang, L.; Chen, L.; Wang, L. Surface modification of titanium and titanium alloys: Technologies, developments, and future interests. Adv. Eng. Mater. 2020, 22, 1901258. [Google Scholar] [CrossRef]
  10. Moeinfar, K.; Khodabakhshi, F.; Kashani-Bozorg, S.; Mohammadi, M.; Gerlich, A. A review on metallurgical aspects of laser additive manufacturing (LAM): Stainless steels, nickel superalloys, and titanium alloys. J. Mater. Res. Technol. 2022, 16, 1029–1068. [Google Scholar] [CrossRef]
  11. Morshed-Behbahani, K.; Zakerin, N. A review on the role of surface nanocrystallization in corrosion of stainless steel. J. Mater. Res. Technol. 2022, 19, 1120–1147. [Google Scholar] [CrossRef]
  12. Zhang, H.; Shen, K.; Lan, J.; Xu, S.; Chen, H.; Fu, A.; Lin, J.; Cao, H.; Zheng, G. Surface nanocrystallization and biomedical performance of Ti-Ta laminated composite processed by surface mechanical grinding treatment. Appl. Surf. Sci. 2023, 623, 157051. [Google Scholar] [CrossRef]
  13. Song, X.; Lu, M.; Wang, H.; Wang, X.C.; Sun, F.H. Fracture mechanics of microcrystalline/nanocrystalline composited multilayer chemical vapor deposition self-standing diamond films. Ceram. Int. 2022, 48, 21868–21878. [Google Scholar] [CrossRef]
  14. Zhang, C.; Liu, Y.; Lan, X. Microstructure and Properties of Surface High-energy Shot Peening Nanocrystallization on TC4 Titanium Alloy. Hot Work. Technol. 2006, 35, 5–7. [Google Scholar]
  15. Yang, C. Effects of Surface Mechanical Attrition Treatment on Surface Nanocrystallization Process of HCP Structural Metal Magnesium. Hot Work. Technol. 2018, 47, 156–158. [Google Scholar]
  16. Zhao, Y.; Wang, T. Surface Micronano Crystal-lization of 2024 Alloy Induced by Machinery Multi-Grinding. Spec. Cast. Nonferrous Alloys 2018, 38, 813–815. [Google Scholar]
  17. Pacquentin, W.; Caron, N.; Oltra, R. Effect of microstructure and chemical composition on localized corrosion resistance of a AISI 304L stainless steel after nanopulsed-laser surface melting. Appl. Surf. Sci. 2015, 356, 561–573. [Google Scholar] [CrossRef]
  18. Sun, Q.; Cao, F.; Wang, S. Nanoscale corrosion investigation of surface nanocrystallized 7150 Al alloy in 3.5 wt% NaCl solution by using FIB-TEM techniques. Corros. Sci. 2022, 195, 110021. [Google Scholar] [CrossRef]
  19. Zhao, W.; Li, C.; Lin, T.; Gao, J.; Si, X.; Qi, J.; Dai, X.; Cao, J. Low-temperature diffusion bonding of Ti6Al4V alloy via nanocrystallization and hydrogenation surface treatment. J. Mater. Res. Technol. 2023, 24, 7599–7613. [Google Scholar] [CrossRef]
  20. Pramod, K.; Mahobia, G.; Chattopadhyay, K. Surface nanocrystallization of β-titanium alloy by ultrasonic shot peening. Mater. Today Proc. 2020, 28, 486–490. [Google Scholar]
  21. Chen, G.; Chu, T.; Cui, Y.; Wu, Y.; Liu, X.; Lin, Q. Effect of surface nanocrystallization on high-cycle fatigue behavior of Ti–2Al–2.5 Zr alloy tube. Int. J. Fatigue 2022, 158, 106735. [Google Scholar] [CrossRef]
  22. Olugbade Olumide, T.; Lu, J. Literature review on the mechanical properties of materials after surface mechanical attrition treatment (SMAT). Nano Mater. Sci. 2020, 2, 3–31. [Google Scholar] [CrossRef]
  23. Lu, K.; Lu, J. Nanostructured surface layer on metallic materials induced by surface mechanical attrition treatment. Mater. Sci. Eng. A 2004, 375, 38–45. [Google Scholar] [CrossRef]
  24. Lu, K. Surface nanocrystallization (SNC) of metallic materials-presentation of the concept behind a new approach. J. Mater. Sci. Technol. 1999, 15, 193–197. [Google Scholar]
  25. Maleki, E.; Maleki, N.; Fattahi, A.; Unal, O.; Guagliano, M.; Bagherifard, S. Mechanical characterization and interfacial enzymatic activity of AISI 316L stainless steel after surface nanocrystallization. Surf. Coat. Technol. 2021, 405, 126729. [Google Scholar] [CrossRef]
  26. Wang, Z.; Wang, X.; Huang, H.; Gan, J.; Yang, Y.; He, J.; Shi, M. Effect of high-energy shot peening on surface nanocrystallization and integrity of AISI 4140 Steel: A Numerical and Experimental Investigation. J. Mater. Eng. Perform. 2021, 30, 5579–5592. [Google Scholar] [CrossRef]
  27. Yang, J.; Wang, S.; Wen, A. Effect of High Energy shot peening surface nano on fatigue properties of industrial pure titanium. In Proceedings of the 6th International Conference on Transportation, Chongqing, China, 24 September 2006; Volume 2. [Google Scholar]
  28. Yang, L.; Liu, X. Analysis of Surface roughness of pure Titanium after nano-sized high-energy shot peening. Heavy Ind. Lift. Technol. 2007, 1, 4–6. [Google Scholar]
  29. Ortiz, A.L.; Shaw, L. X-ray diffraction analysis of a severely plastically deformed aluminum alloy. Acta Mater. 2004, 52, 2185–2197. [Google Scholar] [CrossRef]
  30. Hills, G.J.; Peter, L.M.; Scharifker, B.R.; Pereira, M.D. The nucleation and growth of two-dimensional anodic films under galvanostatic conditions. J. Electroanal. Chem. Interfacial Electrochem. 1981, 124, 247–262. [Google Scholar] [CrossRef]
Figure 1. Metallographic structure of cross-sectional of (a) metallurgical microscope of TA2 substrate; (b) Metallographic structure of SMAT-TA2 section.
Coatings 14 01114 g001
Figure 2. The XRD patterns of TA2 and SMAT-TA2.
Coatings 14 01114 g002
Figure 3. Surface morphology of (a) TA2; (b) MAT-TA2.
Coatings 14 01114 g003
Figure 4. Transmission electron micrograph of SMAT-TA2 surface layer (a) Bright-field image; (b) Dark field image; (c) Diffraction ring of the corresponding region.
Coatings 14 01114 g004
Figure 5. The curve of (a) OCP with immersion time in; (b) Polarization curve of SMAT-TA2 and TA2 at 3.5 wt.% NaCl solution.
Coatings 14 01114 g005
Figure 6. TA2 Electrochemical impedance data in 3.5 wt.% NaCl solution: (a,b) Bode diagram; (c) Nyquist diagram; (d) Nyquist diagram (immersed 12 h); (e) Bode diagram (immersed 12 h).
Coatings 14 01114 g006
Figure 7. SMAT-TA2 electrochemical impedance data in 3.5 wt.% NaCl solution: (a,b) Bode diagram; (c) Nyquist diagram; (d) Nyquist diagram (immersed 12 h); (e) Bode diagram (immersed 12 h).
Coatings 14 01114 g007
Figure 8. (a) The time-dependent curve of current density of SMAT-TA2 and TA2 in 3.5 wt.% NaCl; (b) (i/im)2 − t/tm nucleation mechanism data chart at 0.6 V.
Coatings 14 01114 g008
Table 1. The content of TA2 Titanium Alloy.
ElementFeCNHOthersTi
Content (wt.%)0.030.01<0.010.001<0.4999.45
Table 2. Linear fitting data of SMAT-TA2 and TA2.
SpecimenEcorr (mV vs. SCE)icorr (nA·cm−2)
TA2−454.0134.5
SMAT-TA2−177.09.2
Table 3. TA2 EIS fitting data in 3.5 wt.% NaCl solution.
Immersion Time (h)Rs (Ω·cm2)Qox
(10−5 cm2snΩ)
noxRox
(105 Ω·cm2)
0.55.8115.2410.92642.053
66.1483.9030.93568.285
126.1563.5940.935512.650
246.1373.2200.936217.320
486.3602.8060.941723.620
726.1992.4940.944425.030
966.1202.2810.946329.620
1206.4082.1660.946139.060
1685.8252.0160.947851.990
2046.3141.9430.947156.040
Table 4. SMAT-TA2 EIS fitting data in 3.5 wt.% NaCl solution.
Immersion Time (h)Rs (Ω·cm2)Qox
(10−5 cm2snΩ)
noxRox
(105 Ω·cm2)
0.56.5243.0590.945641.98
66.8562.8590.9423117.2
126.9622.7490.9417132.5
246.6762.6610.9403176.1
486.0792.6230.9357282.1
726.9142.5250.9358417.1
967.9712.4610.9337617.1
1207.0002.4000.9350525.5
1687.0012.3900.9343550.7
2047.5062.1600.9378580.5
Disclaimer/Publisher’s Note: The statements, opinions and data contained in all publications are solely those of the individual author(s) and contributor(s) and not of MDPI and/or the editor(s). MDPI and/or the editor(s) disclaim responsibility for any injury to people or property resulting from any ideas, methods, instructions or products referred to in the content.

