Article

Fatty Imidazolines as a Green Corrosion Inhibitor of Bronze Exposed to Acid Rain

by
Ian Didiere Vázquez-Aguirre
1,2,
Alvaro Torres-Islas
2,*,
Edna Vázquez-Vélez
1,*,
Horacio Martínez
1,
Adrián del Pozo-Mares
3 and
Ave María Cotero-Villegas
2
1
Instituto de Ciencias Físicas, Universidad Nacional Autónoma del Estado de México, Av. Universidad s/n, Col. Chamilpa, Cuernavaca 62210, Morelos, Mexico
2
Facultad de Ciencias Químicas e Ingeniería, Universidad Autónoma del Estado de Morelos, Av. Universidad No. 4, Col. Chamilpa, Cuernavaca 62209, Morelos, Mexico
3
Instituto de Investigación en Metalurgia y Materiales, Universidad Michoacana de San Nicolás de Hidalgo, Avenida Francisco J. Mujica s/n, Edificio U, Ciudad Universitaria, Morelia 58030, Michoacán, Mexico
*
Authors to whom correspondence should be addressed.
Coatings 2024, 14(9), 1152; https://doi.org/10.3390/coatings14091152
Submission received: 25 July 2024 / Revised: 2 September 2024 / Accepted: 5 September 2024 / Published: 7 September 2024
(This article belongs to the Special Issue Corrosion and Corrosion Prevention in Extreme Environments)

Abstract

:
Acid rain is one of the primary corrosive agents on bronze exposed to the atmosphere. Bronze naturally forms a layer of oxides on its surface called patina, protecting it from corrosion. However, when exposed to acid rain, this layer dissolves, making it necessary to use a corrosion inhibitor or stabilize the patina. This study investigated fatty imidazolines derived from agro-industrial waste bran as a corrosion inhibitor of SAE-62 bronze in simulated acid rain (pH of 4.16 ± 0.1). Electrochemical impedance spectroscopy (EIS) and potentiodynamic polarization curve (PC) measurements were used to evaluate corrosion inhibition efficiency, which was 90% for an inhibitor concentration of 50 ppm. The EIS measurements showed that the fatty imidazolines formed a protective film that stabilized the patina on the bronze surface to a certain extent by hindering the charge transfer process. SEM–EDS analyzed the morphology and composition of the protective oxide layer. The results were complemented by Raman spectroscopy and XRD analysis, indicating cuprite, tenorite, cassiterite, and covellite in the patina layer formed on the bronze surface. The SEM analysis showed that the protective coating on the bronze surface was homogeneous using a 50-ppm inhibitor concentration. The XRD analysis suggested the presence of an organic complex that stabilizes the corrosion products formed on the bronze surface.

Graphical Abstract

1. Introduction

The growing development of modern industry involves burning fossil fuels as an energy source, which generates environmental pollution that affects the environment. Sulfur dioxide (SO2) and nitrogen oxides (NOx) are pollutants emitted into the atmosphere, carried by wind and air currents. SO2 and NOx react with water, oxygen, and other chemicals to form sulfuric and nitric acids, which mix with water to form acid rain. Nevertheless, acid rain is a wet and dry deposition of mainly large amounts of nitric and sulfuric acids on a pH scale ≤ 5.6. Acid rain causes ecological effects due to the acidification of the soil, streams, lakes, and bodies of water that damage trees, plants, and animals, mainly aquatic [1]. Nature is not the only area damaged by acid rain; it also damages buildings and monuments made of stones (such as marble and limestone) and metals (such as bronze) [2]. Acid rain is recognized worldwide as a significant air pollution problem due to its corrosive effects on materials and altered ecosystems [3]. Although SO2 emissions have decreased substantially in developed countries thanks to international efforts, they are an essential issue in developing countries [4,5]. In Mexico, acid rain is a research topic in several regions of the country [6], mainly where air pollution levels are critical, such as in the metropolitan area of Mexico City [7].
Furthermore, the city center has over 1400 monuments and sculptures and has been declared a World Cultural Heritage Site by UNESCO for 36 years [8]; therefore, protecting and preserving cultural heritage artifacts for future generations is essential. In that context, bronze protection is more necessary when it is exposed to acid rain; art sculptures, bells, and all copper-based alloys suffer an acceleration of corrosion phenomena on their surfaces [9,10]. SAE 62 bronze is mainly a Cu-Sn alloy, which is widely used in architectural structures exposed to the atmosphere due to its excellent properties, such as hardness, toughness, and high corrosion resistance. On the bronze surface, a passivation layer, called the “patina”, forms a protective coating against the corrosive effects of the environment in which it is located. Despite its high corrosion resistance, bronze is vulnerable to acid rain in the presence of CO2, NH3, S−2, and Cl ions because it undergoes a pitting corrosion process. Therefore, numerous investigations have focused on inhibiting its corrosion in aqueous media with chlorides, where forming protective films of Cu oxide or hydroxide is challenging [11,12].
Standard protection methods for bronze sculptures are waxes and varnishes that preserve the appearance of their surface. However, waxes are susceptible to dissolving on the surface in sunlight, and varnishes tend to crack and disintegrate. Currently, benzotriazole (BTA) inhibitors and their derivatives are a conventional way to protect copper and its alloys against corrosion. However, benzotriazole (BTA) inhibitors in acrylic varnishes such as Incralac are toxic and harmful to the environment [13,14]. Therefore, in recent decades, research has been carried out with environmentally friendly corrosion inhibitors, organic compounds that include imidazole and thiazole derivatives, drugs, aliphatic diamines, amino acids, plant extracts, and natural products that are effective against bronze corrosion [15,16,17,18].
Organic molecules with heteroatoms (N, O, S) in their molecular structure have been shown to form bonds with Cu. For example, imidazole efficiently covers the surface of bronze [18]. The molecular structure of a surfactant-type corrosion inhibitor comprises a polar head with heteroatoms that adsorb on the metal surface through a chemisorption mechanism, forming a protective film [19,20,21,22]. In addition, they contain in their structure a hydrophobic tail of C10-C18 hydrocarbon with unsaturation in their chains that contributes to improved efficiency due to the interaction between the “π” orbital of the double bond and the vacant “d” orbital of the metal [20]. Imidazoline or amide-type surfactants synthesized from fatty acids have been evaluated against steel corrosion, mainly in mild corrosion, showing efficiencies of 99% at low concentrations (ten ppm) [12,19,20,21,22]. However, to our knowledge, fatty imidazolines have not been studied to protect bronze against acid rain. For this reason, in this study, an imidazoline-type corrosion inhibitor derived from fatty acids contained in residual rice bran oil was synthesized and evaluated on bronze and simulated acid rain at the ion concentrations reported for Mexico City [5].
Our objective in this study was to evaluate fatty imidazolines in the corrosion of bronze due to exposure to acid rain. PC measurements were used to evaluate corrosion inhibition efficiency, which was 90% for an inhibitor concentration of 50 ppm. Unexpectedly, the results showed that the fatty imidazoline adsorption was through a physisorption mechanism. However, the fatty imidazoline complexation on the bronze surface was detected by XRD analysis; then, the organometallic complex was formed with copper on the surface; this complex interacted with the formed charged ions (Cl, NO3, SO42−) on the adsorbed bronze surface to stabilize the patina layer. In addition, Raman and XRD spectroscopy analyzed the oxide type formed on the bronze surface, and SEM determined their morphology.

2. Materials and Methods

2.1. Testing Material

The bronze used in this study was purchased from “La Paloma” Metals Company S.A. de C.V. (Cuernavaca, Mor., Mexico), type SAE-62, the chemical composition of which is shown in Table 1. Bronze specimens of 0.5 cm2 (1 cm × 0.5 cm) were cut and ground with 120 and 600 grit. Subsequently, they were washed with ethyl alcohol and acetone using an ultrasonic bath for 15 min and dried at 40 °C for 24 h. Finally, on the back side of the sample, a screw was attached, and then it was encapsulated with epoxy resin for electrochemical measurement.

2.2. Synthesis of Fatty Imidazolines (2-(2-Alkyl-4,5-dihydro-1H-imidazoline-1-yl) Ethanol

The imidazoline-type inhibitor was synthesized with some modifications to what was reported by Dorantes et al. [19]. First, the oil extraction was carried out from rice bran obtained from the ARMOSA rice farm in Morelos, Mexico. The byproduct of polishing the husked rice was collected and dried at 70 °C for 24 h. The dried rice bran was placed in a Soxhlet system, using hexane as a solvent at different mass–volume ratios and times of reflux. The solvent was then removed by rotary evaporation, and the oil obtained was placed in a ball flask, and 3 moles of aminoethylethanolamine (AEEA) were added to carry out the direct aminolysis of the triglyceride, a reaction like the one we previously reported [24]. After two hours of stirring at 140 °C, complete oil consumption was observed by thin layer chromatography (TLC, hexane-AcOEt 9:1) to obtain the fatty acid amides. The system was then placed at a reduced pressure of 70 mmHg, maintaining a temperature of 140 °C. The progress of the reaction was monitored by TLC (CH2Cl2-MeOH 8:2). After 4 h of reaction, no significant improvement was observed in the cyclization to form the imidazoline ring, so the reaction was considered complete. Both oil and fatty imidazolines were analyzed by Raman spectroscopy using a Brucker Senterra II from Ettlingen, Germany. A laser with a wavelength of 785 nm, a power of 100 mW, and an acquisition time of 3000 ms was used in a range of 400 to 4000 cm−1. The inhibitor was solubilized in isopropanol and injected in the medium of acid rain.

2.3. Electrochemical Tests

The SAE 62 bronze was exposed to the simulated acid rain of Mexico City by preparing a solution with the chemical composition shown in Table 2, using water ultrapure of conductivity of 0.002 µScm−1 (25 °C). All the chemical reagents (CaCl2.H2O, MgSO4.7H2O, NH4NO3, and KCl) were analytical grades acquired from Merck company (Darmstadt, Germany). The pH of the prepared solution was 5.82 ± 0.1, with a conductivity of 0.554 µScm−1 (25 °C). Afterward, it was prepped to 4.16 ± 0.1 with a 1M solution of HCl. A conventional three-electrode glass cell was used for the electrochemical evaluation, using a reference electrode of Ag/AgCl, a working electrode (bronze), and a graphite counter electrode. The performance of the corrosion inhibitor was evaluated using two electrochemical techniques, electrochemical impedance spectroscopy (EIS) and polarization curves (PC), and all the tests were conducted at room temperature using an ACM Instruments potentiostat, GillAC model from Cumbria, United Kingdom. Before the experiment, the working electrode was left to start a steady state-free corrosion potential value (~2 h) [12]. The EIS measurements were performed by applying a sinusoidal amplitude of 10 mV in a frequency range of 0.01 to 10,000 Hz for 24 h with 60 data points, corresponding to 10 points per decade. After EIS measurements, PC scanning was performed at a scan rate of 60 mVmin−1 and in a potential range of −600 mV to +300 mV with respect to the Ecorr [11]. The inhibitor concentrations evaluated were 0, 10, 25, 50, and 100 ppm, in a volume of 40 mL for each electrochemical test. The corrosion velocity (Vcorr) was determined by Equation (1).
V corr = i c o r r × K × E w ρ × A
icorr is the corrosion current density in µAcm−2, K is a constant that converts the current density into corrosion rate, EW is the material weight, ρ is material density (gcm−3), and A is the area (cm2). Finally, the Z View software, version 3.0a (Scribner, NE, USA) obtained impedance parameters fitting experimental data to equivalent circuits.

2.4. Analysis of Oxides on the Surface

The chemical analysis of the oxidation compounds on the bronze surface after acid rain exposure was accomplished using Raman and X-ray diffraction (XRD) spectroscopy. Raman spectroscopy was performed using a SENTERRA II Raman (Bruker, Billerica, MA, USA) coupled to an Olympus microscope (20× objective) from Ettlingen, Germany. A laser with a wavelength of 785 nm, a power of 100 mW, and an acquisition time of 10,000 ms was used in a range of 400 to 4000 cm−1. Each spectrum was normalized, and the baseline was corrected.
XRD was performed in a Rigaku Miniflex DMAX 2200 X-ray diffractometer (Austin, TX, USA). The sample was subjected to Cu-Kα radiation (1.54 Å) with a graphite monochromator in the 2θ range of 5–80 using a grazing beam at an angle of one degree. The morphological analysis of the corroded surface was carried out using a scanning microscope (SEM) JEOL JSM-7600F (Peabody, MA, USA) in 15 kV voltage and a vacuum 9.6 × 10⁻⁵ Pa. The bronze microstructure was analyzed in an optical microscope with a 20× objective, previously with a chemical attack on the surface with 50% HNO3.

2.5. Analysis of Surface Wettability

The wettability of the SAE 62 bronze specimens at 0 ppm and 50 ppm of inhibitor was evaluated using the sessile or lying drop technique by triplicate with a volume of 7 µL of distilled. The images were recorded using a “MicroView 1000X” digital microscope Rotek Technology Co., Shenzhen, China, and the contact angle values were obtained from the geometric analysis of the droplet images using the “Image J 1.53” software from the National Institutes of Health, New York, NY, USA.

3. Results and Discussion

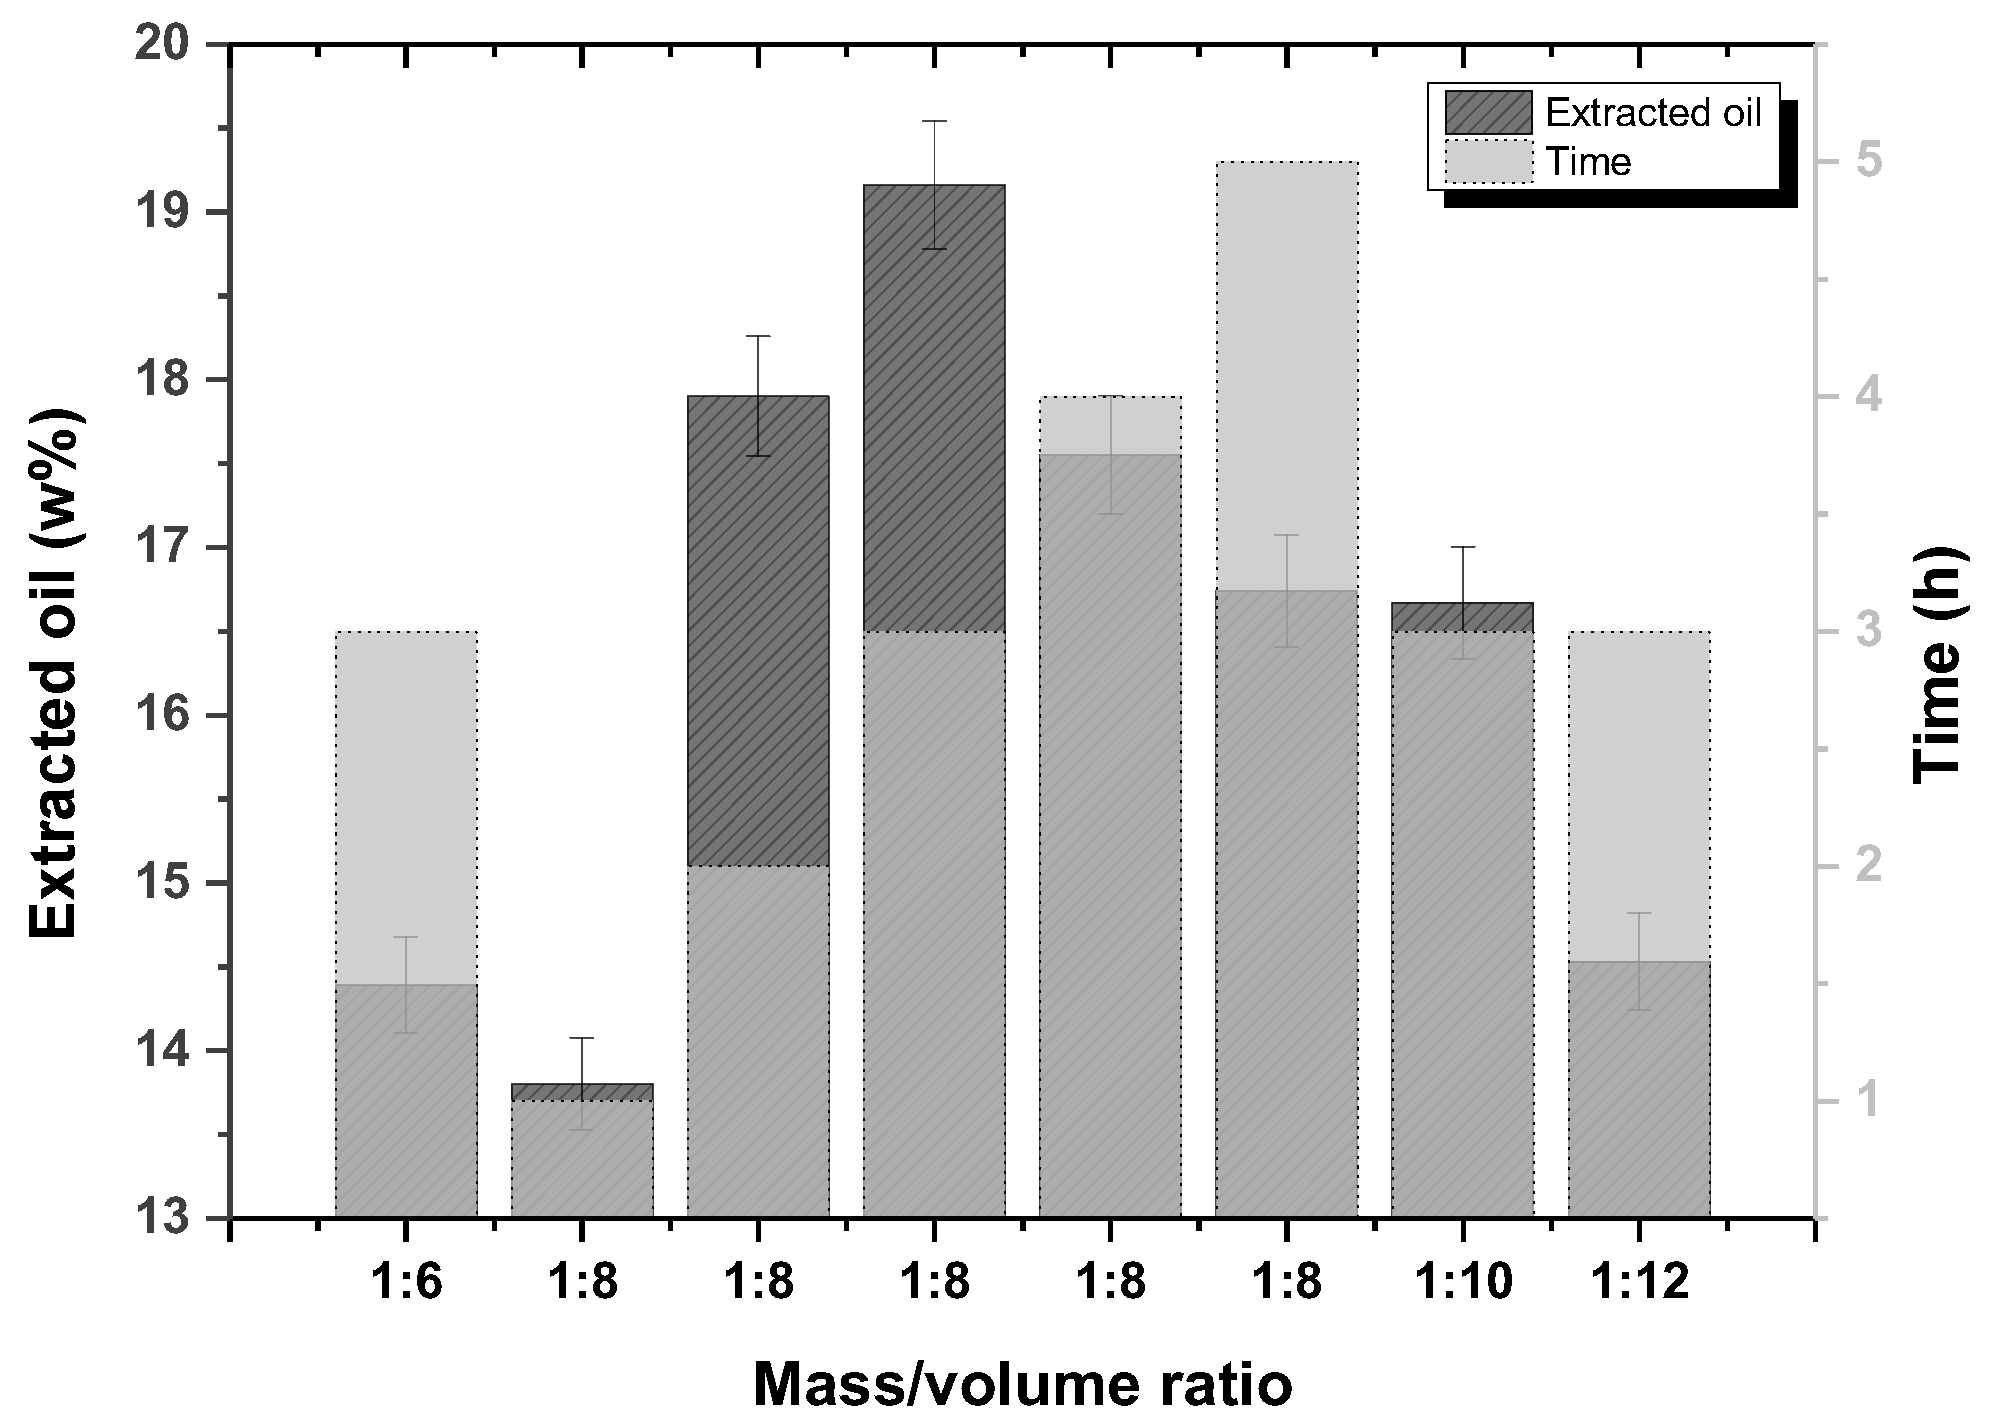
3.1. Oil Extraction from Rice Bran

The (average) yields of oil extraction from rice bran under different conditions of solvent volume and time are shown in Figure 1. The best conditions found were an m/v ratio of 1:8 with a reflux time of 3 h to perform 19.16%, as reported [24]. Increasing the solvent volume in a m/v ratio of 1:10 and 1:12 decreased the yields to 16.67% and 14.53%, respectively. An increase in the extraction time from 4 h and 5 h for an m/v ratio of 1:8 also did not improve the yields, which were 17.55% and 16.74%, respectively. A decrease in the solvent volume at a mass/volume ratio of 1:6 gave a yield of 14.39%.

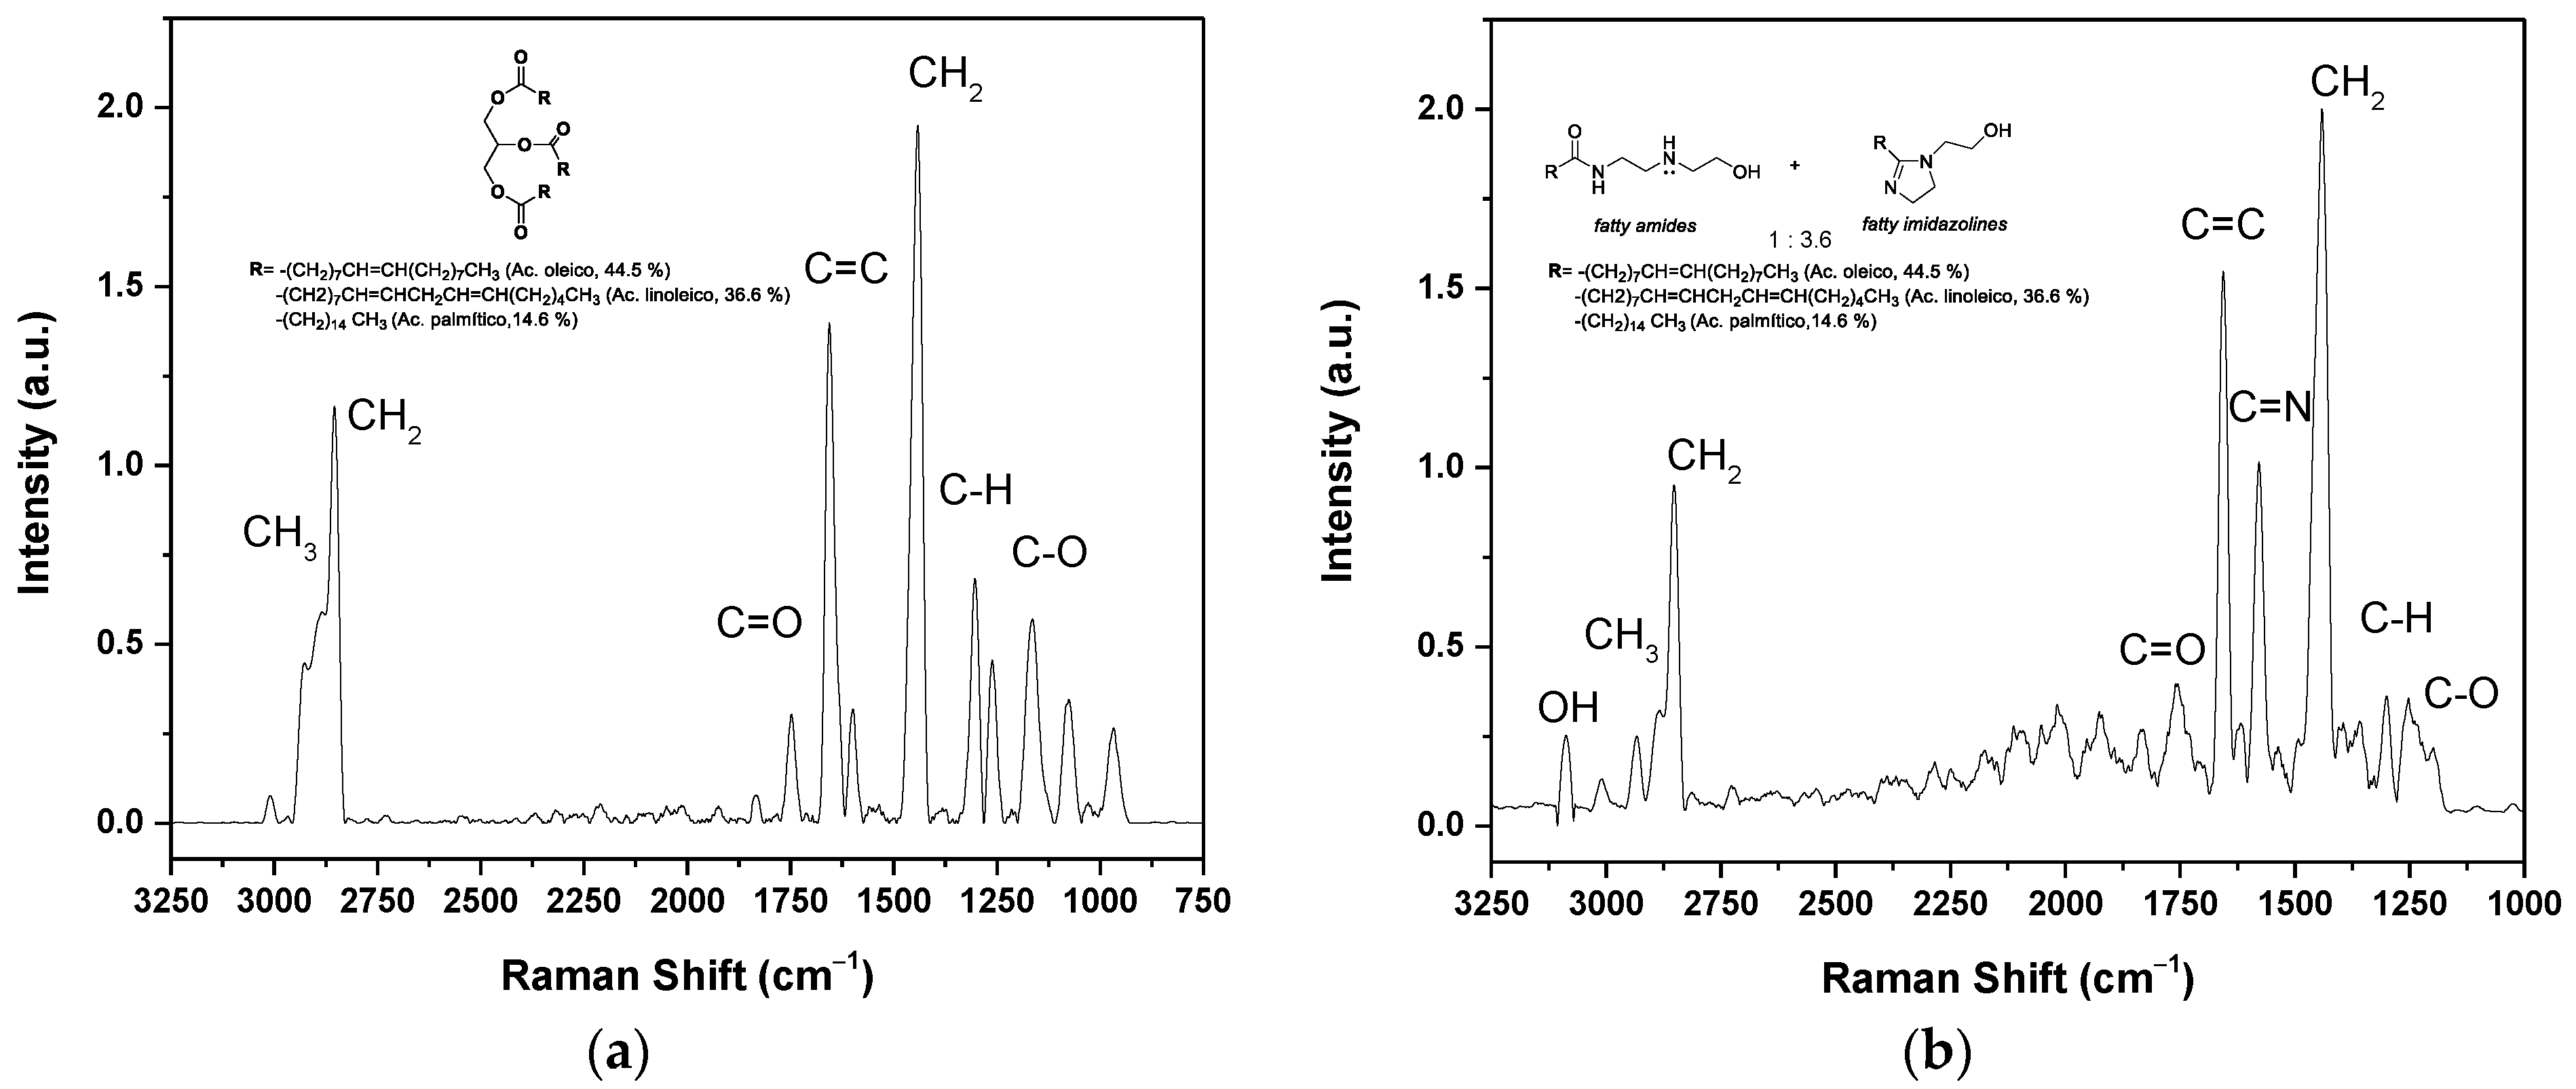
3.2. Chemical Analysis of the Oil and Green Corrosion Inhibitor

The chemical characterization of the oil and the corrosion inhibitor was carried out using Raman Micro-spectroscopy. Figure 2a shows the spectrum of oil extracted from rice bran, where at 1759 cm−1, the mode of the symmetric C=O stretching of the ester functional group of the triglyceride appears. The bands located at 2905 cm−1 and 2845 cm−1 correspond to the asymmetric and symmetric stretching of the C-H bonds of the -CH3 and -CH2 groups, respectively. The deformation vibration mode of these groups can be seen at 1432 cm−1. The band at 1660 cm−1 corresponds to the symmetrical vibrational stretching of the -C=C bond of the alkyl chain unsaturation present in fatty acids. Finally, the characteristic signal of the vibrational stretching of the -C-O-C bond is 1200 cm−1 [25].
The corrosion inhibitor was synthesized from the aminolysis of the oil to obtain fatty amides that subsequently cyclized to fatty imidazolines. The fatty amides were obtained in quantitative yield, but the cyclization was not 100%. The Raman spectrum of the mixture of imidazolines and amides is presented in Figure 2b, obtaining a ratio of 3.6:1, respectively, based on the intensities of the peaks (C=N-C=O). In the spectrum, a band is observed at 3093 cm−1, corresponding to the symmetric vibration of the -O-H bond. The band at 1659 cm−1 corresponds to the carbonyl (C=O) of the amide group, and the signal at 1575 cm−1 to the symmetric stretching of the C=N bond of the imidazoline ring. The vibration bands of the C–H bond of the CH2 and CH3 groups are present in the range of 2800 to 2900 cm−1, and the deformation band of CH2 at 1438 cm−1. The band at 1300 cm−1 corresponds to the C–H bond and at 1250 cm−1 to the C–O bond. The literature does not report Raman spectroscopy analysis of the oil and fatty imidazoline. However, it coincides with the FTIR spectra reported for this type of compound [19]. The difference is in the intensities of the peaks. FTIR is based on the change in the dipole moment that generates the spectral band, so the bands of the OH and C=O groups are more intense. Unlike Raman spectroscopy, it is based on the polarizability of molecules. The signal from the alkyl chains and the C=C signal is more intense due to the content of unsaturation in the alkyl chains, as it has been reported that the oil derived from rice bran contains 47% oleic (monounsaturated); 33% linoleic and linolenic (polyunsaturated); and 20% stearic and palmitic (saturated) [24].

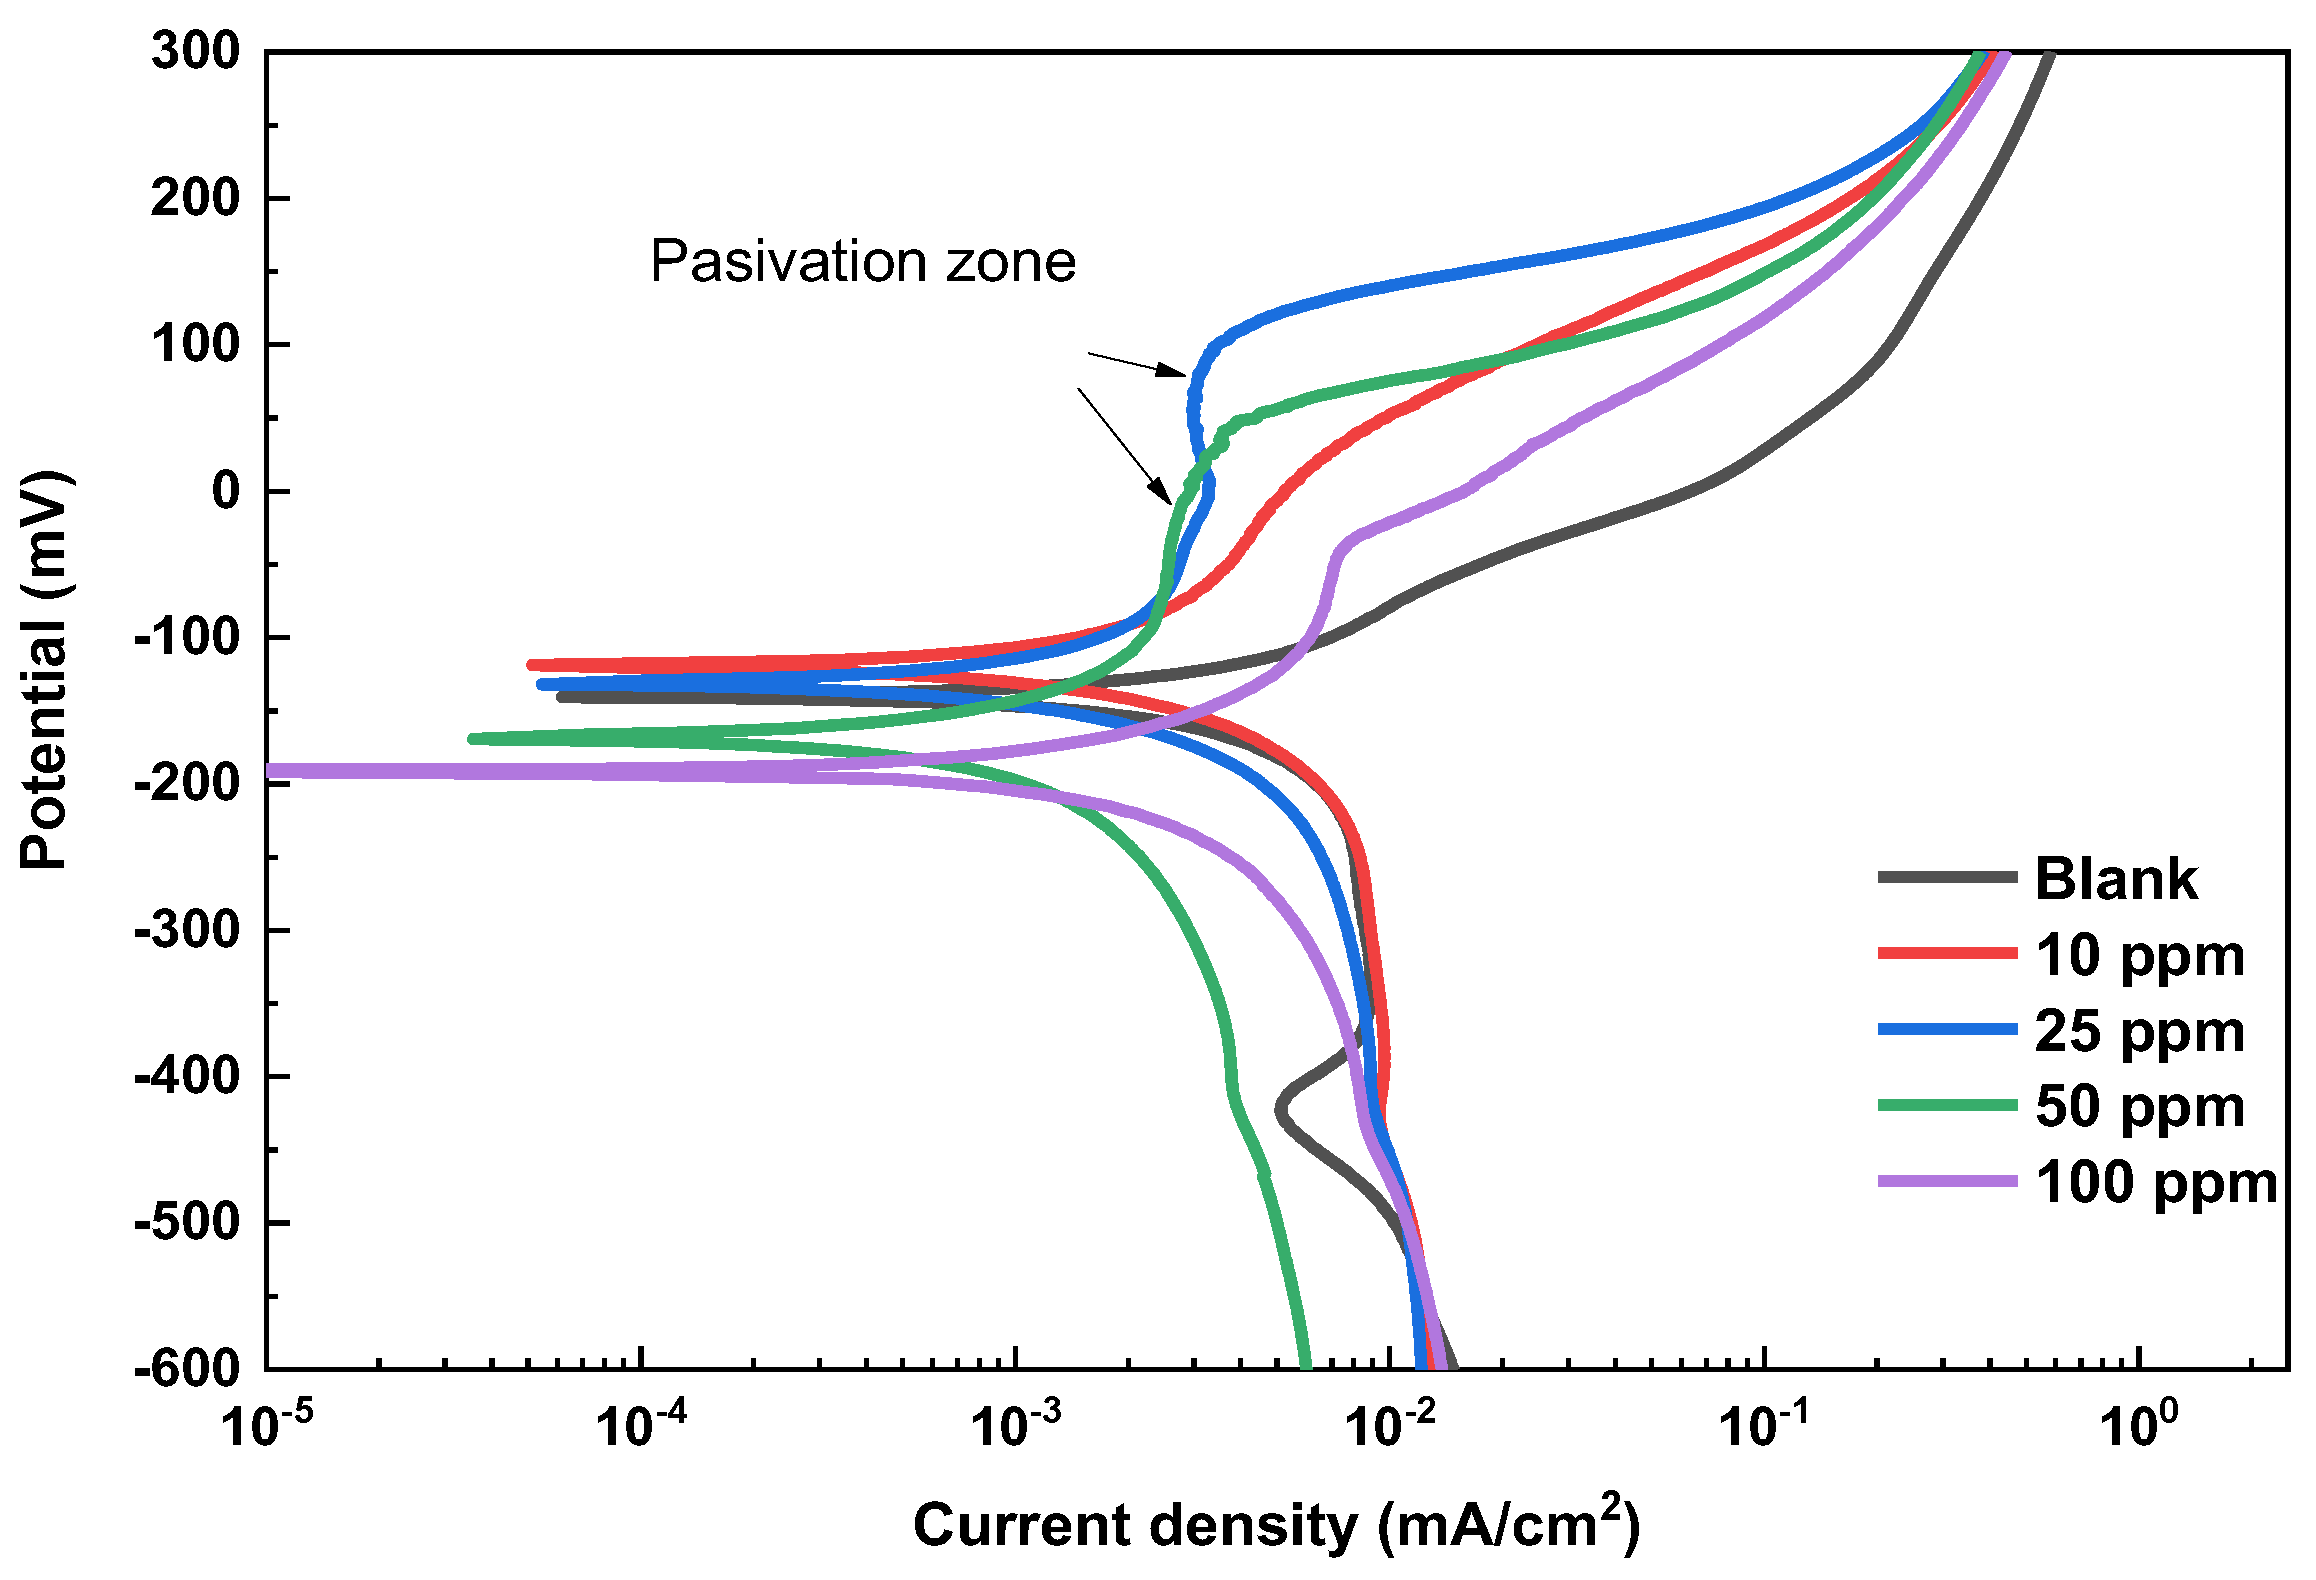
3.3. Polarization Curves

Polarization curves (PC) for bronze in acid rain solution at different fatty imidazoline concentrations are given in Figure 3. The PC was plotted by the Tafel extrapolation method to determine the corrosion potential Ecorr, the anodic and cathodic Tafel coefficients βc and βa, the corrosion current density icorr, and the inhibiting efficiency presented in Table 3. Active behavior is observed in the PC without a passivation zone at 0 ppm inhibitor. The behavior of the anodic branch suggests that the bronze undergoes a continuous dissolution process once a potential of 311 mV is reached. The slowing down of the anodic current density is attributed to partially forming a protective layer of cuprite (Cu2O) on the bronze surface. However, anodic bronze dissolution leads to an increase in the current density [12,13,14,15,16].
The Ecorr values do not show a clear trend toward more noble values with the addition of the inhibitor. This may be due to the formation of non-homogeneous inhibitor films at higher concentrations, which could affect the potential distribution on the metal surface. Also, the increase in the anodic slope with 10 ppm of inhibitor indicates effective initial protection, but at higher concentrations, intermolecular interactions could lead to less effective adsorption or the formation of aggregates, reducing coverage and, therefore, protection. At 100 ppm, the adsorbed inhibitor molecules overlap, and electrostatic repulsion forces are produced between them. This leads to their desorption at specific sites on the metal, deprotecting it and creating corrosion. Subsequently, the inhibitor molecules can adsorb at these deprotected sites, increasing the adsorption density of the inhibitor, which leads to an intramolecular interaction between the hydrocarbon chains of the inhibitor, causing its desorption [26]. It has been reported that the hydrocarbon chains of many adsorbed ions leave the surface and aggregate to form hemimicelles, causing a decrease in the effective area covered by the inhibitor molecule [27].
In summary, the inhibitor adsorbed on the metal surface promotes a decrease in corrosion potential values by blocking active sites. This adsorption and the consequent reduction in corrosion potential are related to changes in the energy barriers for activating cathodic and anodic reactions [28]. However, a non-uniform distribution of the inhibitor, whether due to low or high concentration, can lead to the formation of unprotected sites, thereby increasing the corrosion current density (icorr). In the anodic region, the current remains constant in the passivation zone [15], mainly at a concentration of 50 ppm of the inhibitor. Based on the literature, an inhibitor is said to be of anodic type if the free potential shifts more than 85 mV and of mixed type when the potential shift is less than 85 mV [16]. In this study, the maximum potential shift was 50 mV; therefore, imidazoline acts as a mixed-type inhibitor. In another study, Simonović et al. studied 5-chlorobenzotriazole at 120 ppm in an acid rain solution for bronze protection, achieving an efficiency of 91.2% [29]. In this study, fatty imidazolines reached an efficiency of 90% using 50 ppm. It is essential to highlight that although BTA has demonstrated higher inhibition efficiencies, its use involves higher concentrations in ppm [29,30] and raises concerns about its toxicity. Furthermore, the patina coating on bronze is stable over time when fatty imidazolines are used in acid rain. Vcorr for bronze using 50 ppm of inhibitor decreases more than 10 times (0.004 mm/year) compared to the Vcorr of the blank (0.044 mm/year).

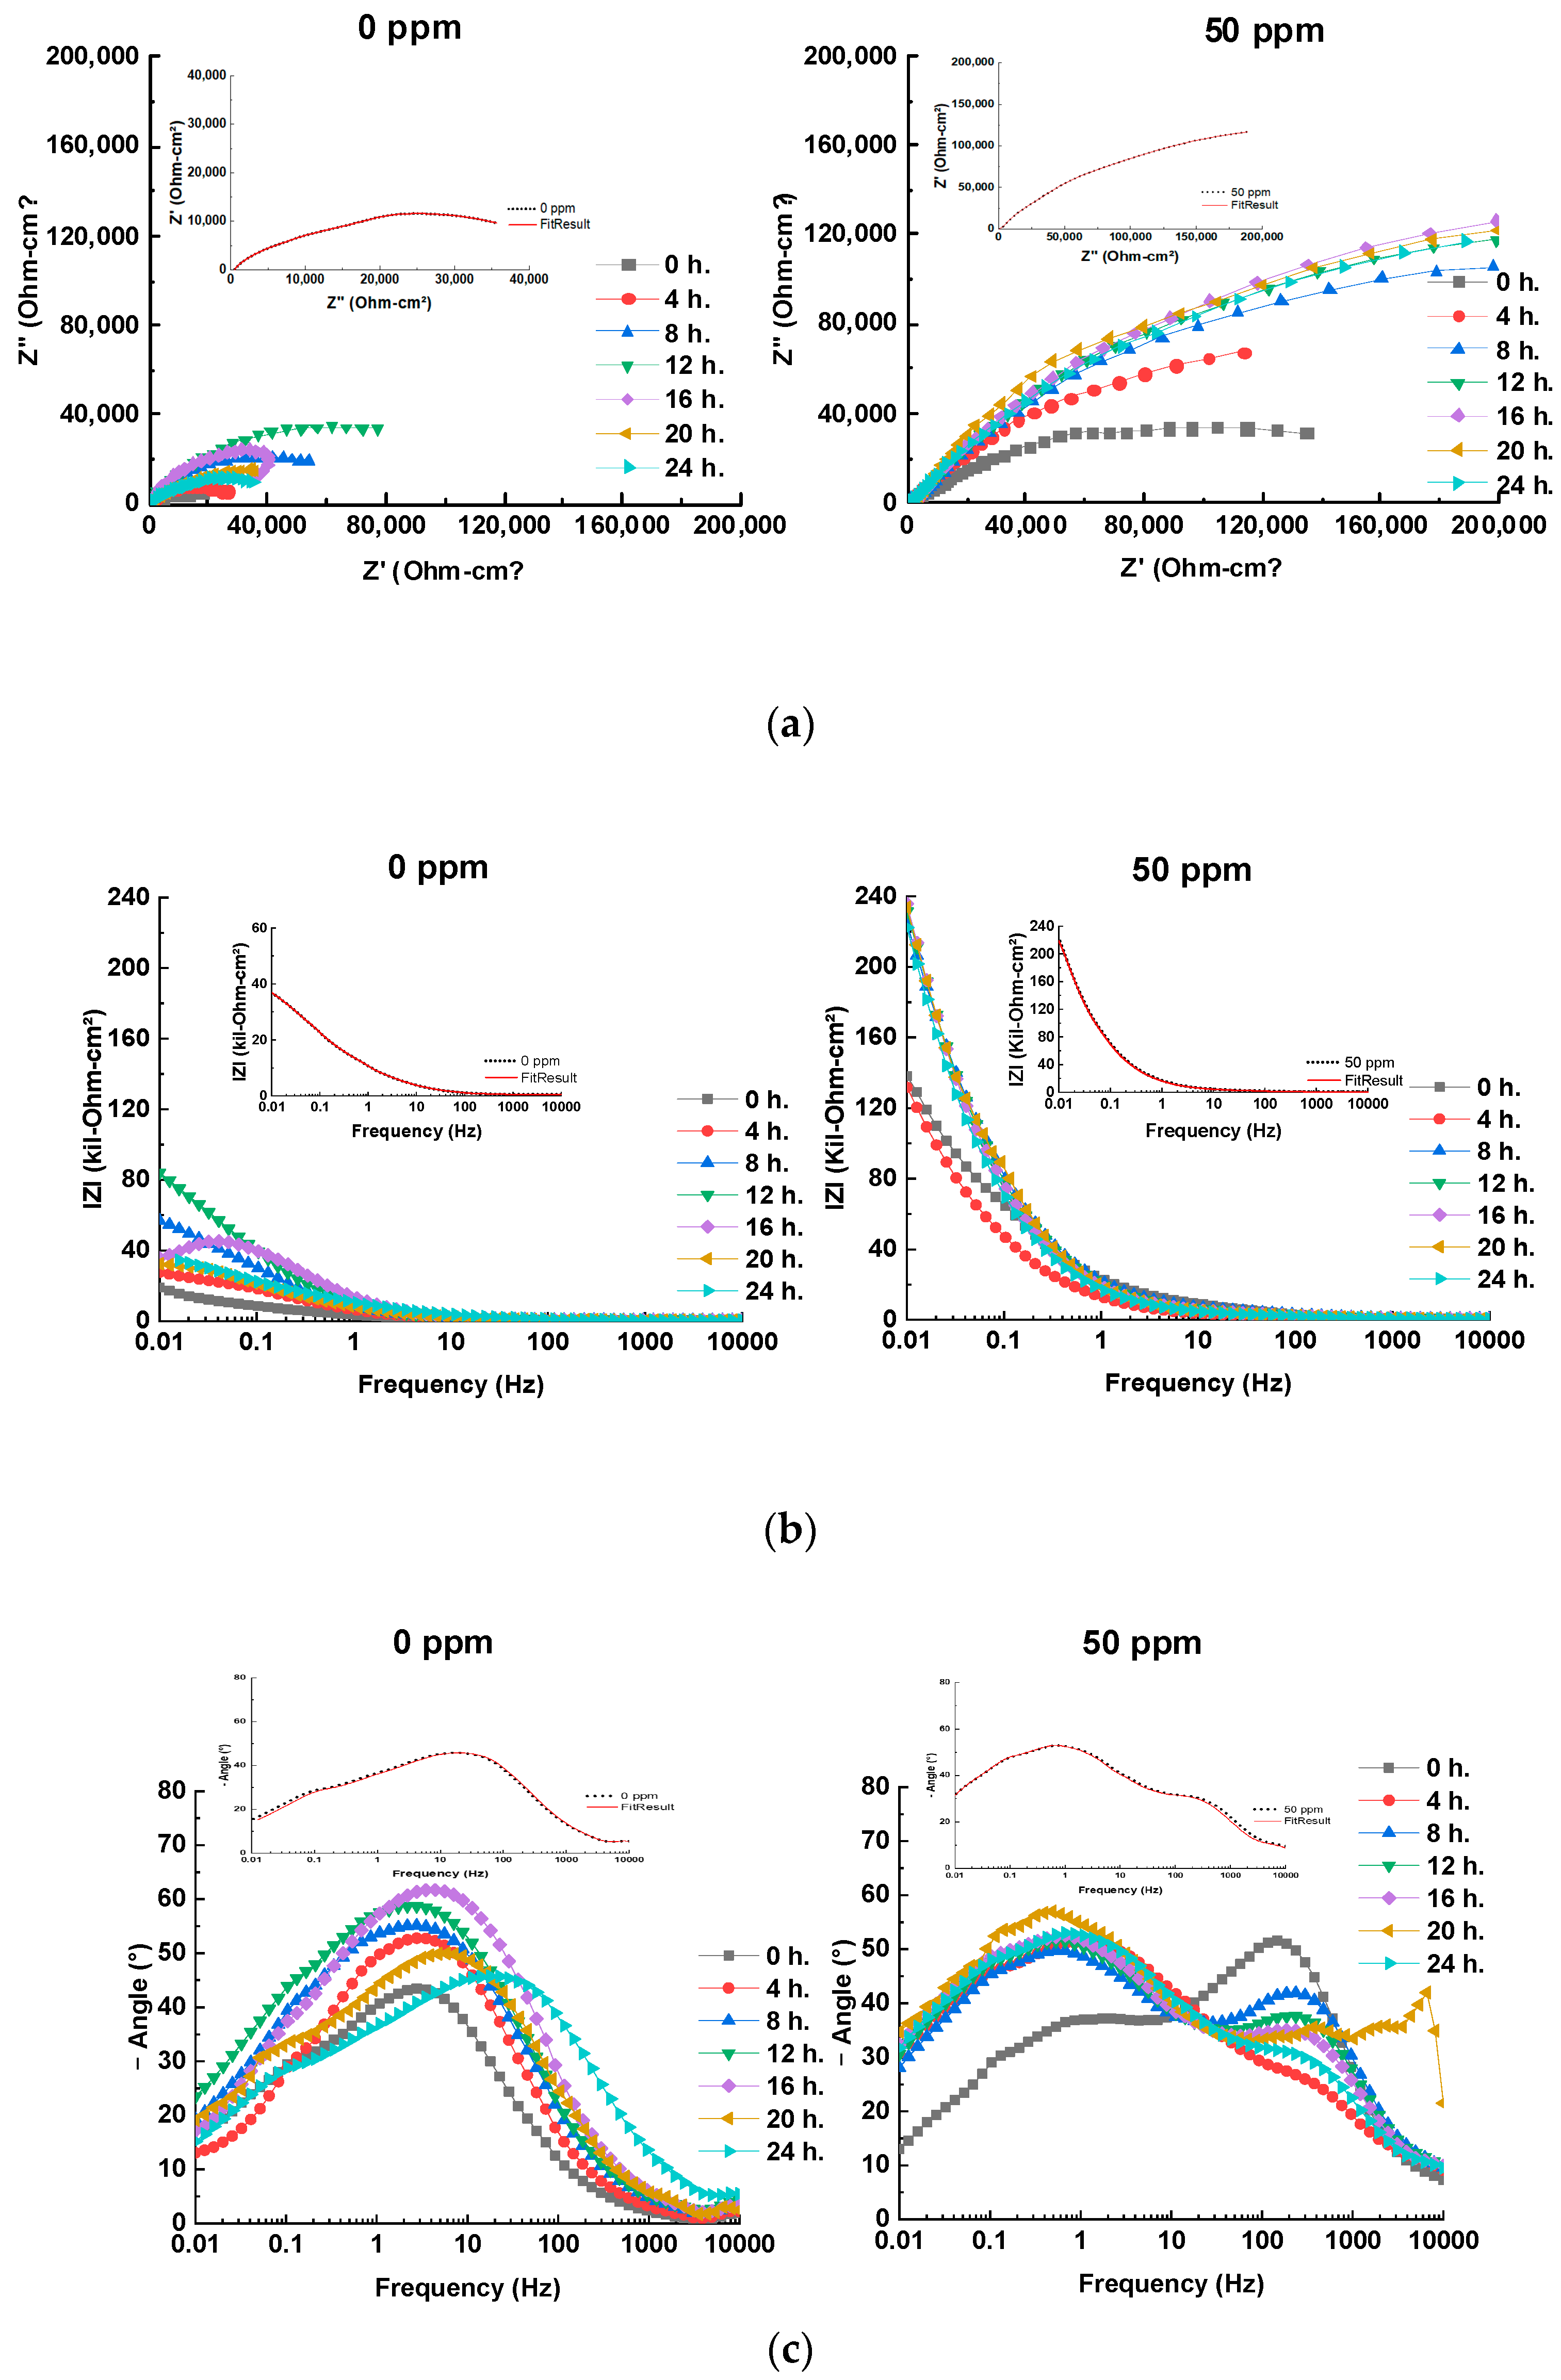
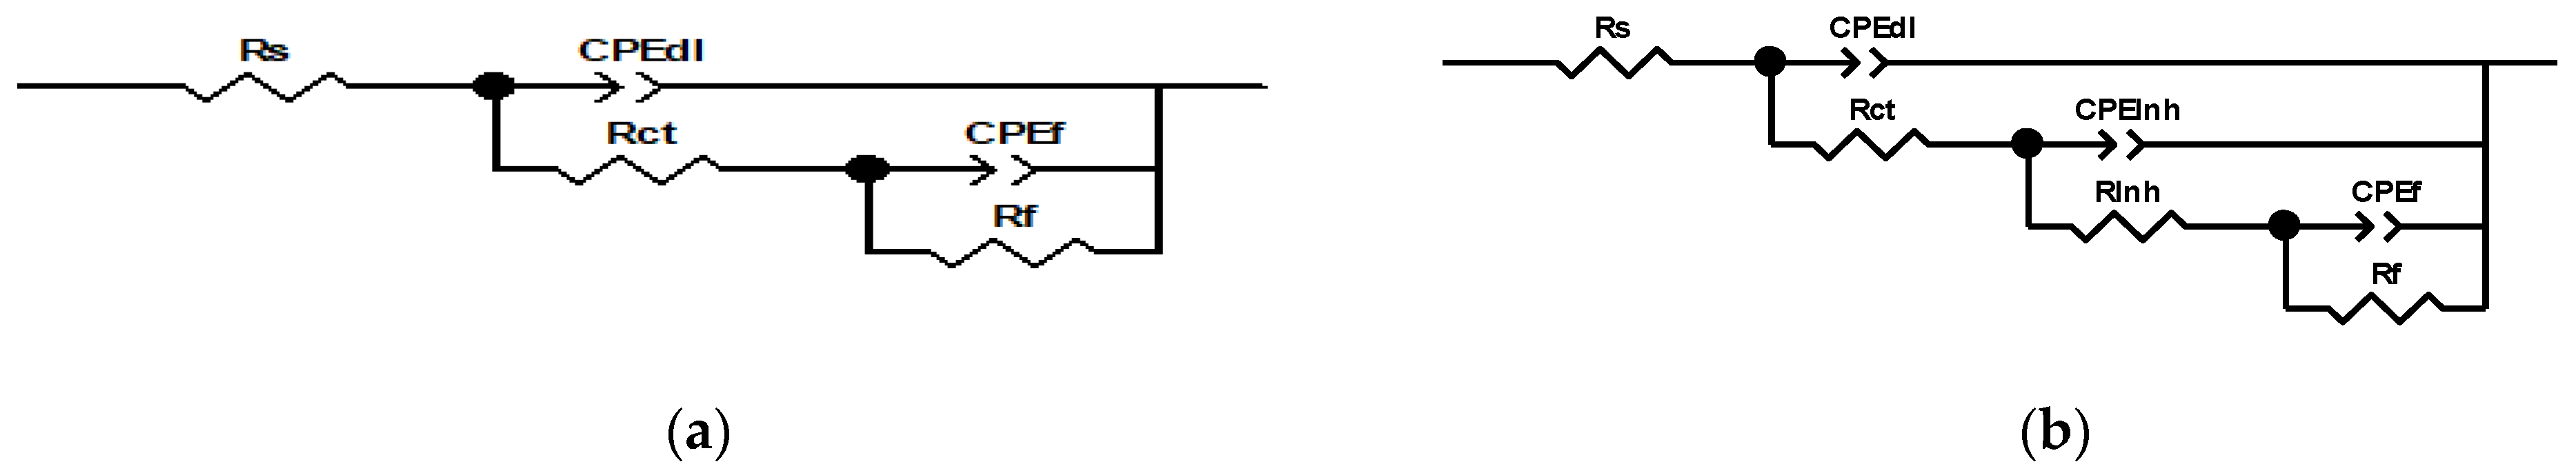
3.4. EIS Results and Equivalent Circuit Models

The analysis of the electrochemical impedance spectroscopy (EIS) results, including Nyquist, Bode, and phase angle plots (Figure 4), offers a comprehensive understanding of the corrosion inhibition behavior of bronze across varying inhibitor concentrations. The EIS plots are enhanced with fitting lines to better illustrate the data trends. Additionally, integrating these results with equivalent electrical circuits (EECs) (Figure 5) provides deeper insights into the underlying corrosion mechanisms and the overall effectiveness of the inhibitors.
The Nyquist plots (Figure 4a) reveal that the capacitive semicircles, which represent the charge transfer resistance (Rct), change with the addition of the inhibitor. At 0 ppm of inhibitor, the semicircles are depressed, indicating a corrosion process primarily controlled by charge transfer, which aligns with observations for copper alloys in acidic solutions [15]. The addition of the inhibitor, particularly at 50 ppm, significantly increases the diameter of the semicircles. This increase suggests an enhanced charge transfer resistance due to the formation of a protective patina layer and the adsorption of the inhibitor on the metal surface [15,16]. This behavior is corroborated by the Bode plots (Figure 4b), where the |Z| modulus rises with the inhibitor concentration, peaking at 50 ppm, reflecting substantial inhibitory efficiency [15,20].
In the absence of the inhibitor, after 16 h of immersion, the Nyquist plots exhibit inductive behavior due to a sudden change in the corrosion current density, leading to a decrease in the charge transfer resistance. This phenomenon, attributed to the adsorption/desorption of corrosion products [31], is not observed with the inhibitor present. For concentrations up to 24 h of immersion, 50 ppm of inhibitor demonstrates the largest semicircle diameter, indicating optimal coverage. In contrast, lower inhibitor concentrations result in insufficient surface coverage, allowing electrolyte diffusion towards the metal and leaving unprotected areas [12,13,14,15,16,17,18,19,20,21,22,23,24,25,26,27,28].
The Bode and phase angle plots (Figure 4b,c) further support these observations. The |Z| modulus increases with the inhibitor concentration, reaching its highest level at 50 ppm, indicating effective inhibition. The presence of an RC time constant at high frequencies suggests that both resistance and capacitance influence the system’s response, which is indicative of changes in the protective layer’s characteristics. The negative slope observed after 16 h at 0 ppm confirms that the patina layer has dissolved, allowing ions to re-contact the metal, which decreases the resistance and increases the current. The addition of the inhibitor introduces two slopes in the |Z| module, corresponding to time constants related to the high-frequency response of the inhibitor and the capacitive response of SAE 62 bronze, which contributes to a reduced corrosion rate [15,20].
The phase angle plot shows inductive behavior as time progresses, which is attributed to the adsorption of species on the bronze surface. The concentration of 50 ppm demonstrates the highest inhibition efficiency, forming a protective layer that increases the phase angle from 26° to 52° over 24 h. The time constant observed between intermediate and low frequencies (0.01–10 Hz) increases from 35° to 56°, associated with forming cuprite [21]. At 0 ppm, the phase angle decreases after 16 h, reflecting a more significant charge transfer than 50 ppm, where the protective film stabilizes the patina and reduces the charge transfer [15,20].
The equivalent circuit models were selected based on their ability to accurately represent the impedance data and describe the corrosion behavior of bronze under various conditions, as shown in Figure 5. The models considered include components for solution resistance (Rs), charge transfer resistance (Rct), double-layer capacitance (CPEdl), inhibitor resistance (Rinh), and surface layer capacitance (CPEf), among others, as shown in Table 4. The choice of model was guided by its fit to the experimental data and its capacity to capture the nuances of corrosion and inhibition processes observed in the Nyquist and Bode plots, which is observed in χ2 (with a high value of 2.55 × 10⁻³).
Upon exposure to the corrosive medium with 0 ppm inhibitor, bronze exhibits lower values of Rf and Rct compared to 50 ppm, which is indicative of a reduced charge transfer resistance due to the dissolution of the oxide layer. Rs increases with the inhibitor concentration, peaking at 50 ppm before slightly decreasing at 100 ppm, suggesting the formation of a protective film that reduces the ionic conductivity. The capacitance of the electrochemical double layer (CPEdl) decreases with the inhibitor concentration, reflecting the formation of a more compact protective layer. Rct reaches its highest value at 50 ppm, signifying an effective protective layer. However, at 100 ppm, Rct decreases, possibly indicating reduced inhibitor effectiveness. Rinh increases significantly with the inhibitor concentration, highlighting the inhibitor’s role in forming a robust protective barrier, although a slight decrease at 100 ppm suggests potential instability. The capacitance of the surface layer (CPEf) and resistance of the corrosion products (Rf) also show notable changes, with maximum values at 50 ppm, underscoring effective protection, but decreasing at 100 ppm, suggesting possible deterioration of the protective layer at higher concentrations.
In conclusion, the data indicate that the inhibitor achieves its highest effectiveness at an intermediate concentration of 50 ppm, where there is an optimal balance between the formation and stability of the protective barrier and the corrosion products. At higher concentrations, the inhibitor effectiveness may be compromised due to the potential saturation or destabilization of the protective layer.
Table 5 shows the electrochemical parameters of the EIS data fitting for 0 ppm and 50 ppm inhibitor concentration over time (0–24 h). At 0 ppm, an increase in Rs and Rct is observed over time (up to 16 h), reflecting increased corrosion resistance. With the addition of a 50-ppm inhibitor, a significant improvement in corrosion resistance is noted over time up to 16 h. The inhibition resistance (RInh) also increases, reaching the highest value in this period (240,916 Ω×cm2), indicating increased inhibitor effectiveness in forming a protective film on the metal surface. At 20 and 24 h, a decrease in the resistance is observed. These results reflect that the inhibitor provides increasing protection during the exposure time, evidenced by the increase in resistances and the reduction in the capacitance of the double layer (CPEdl), suggesting the formation of a more stable and effective inhibitory film.

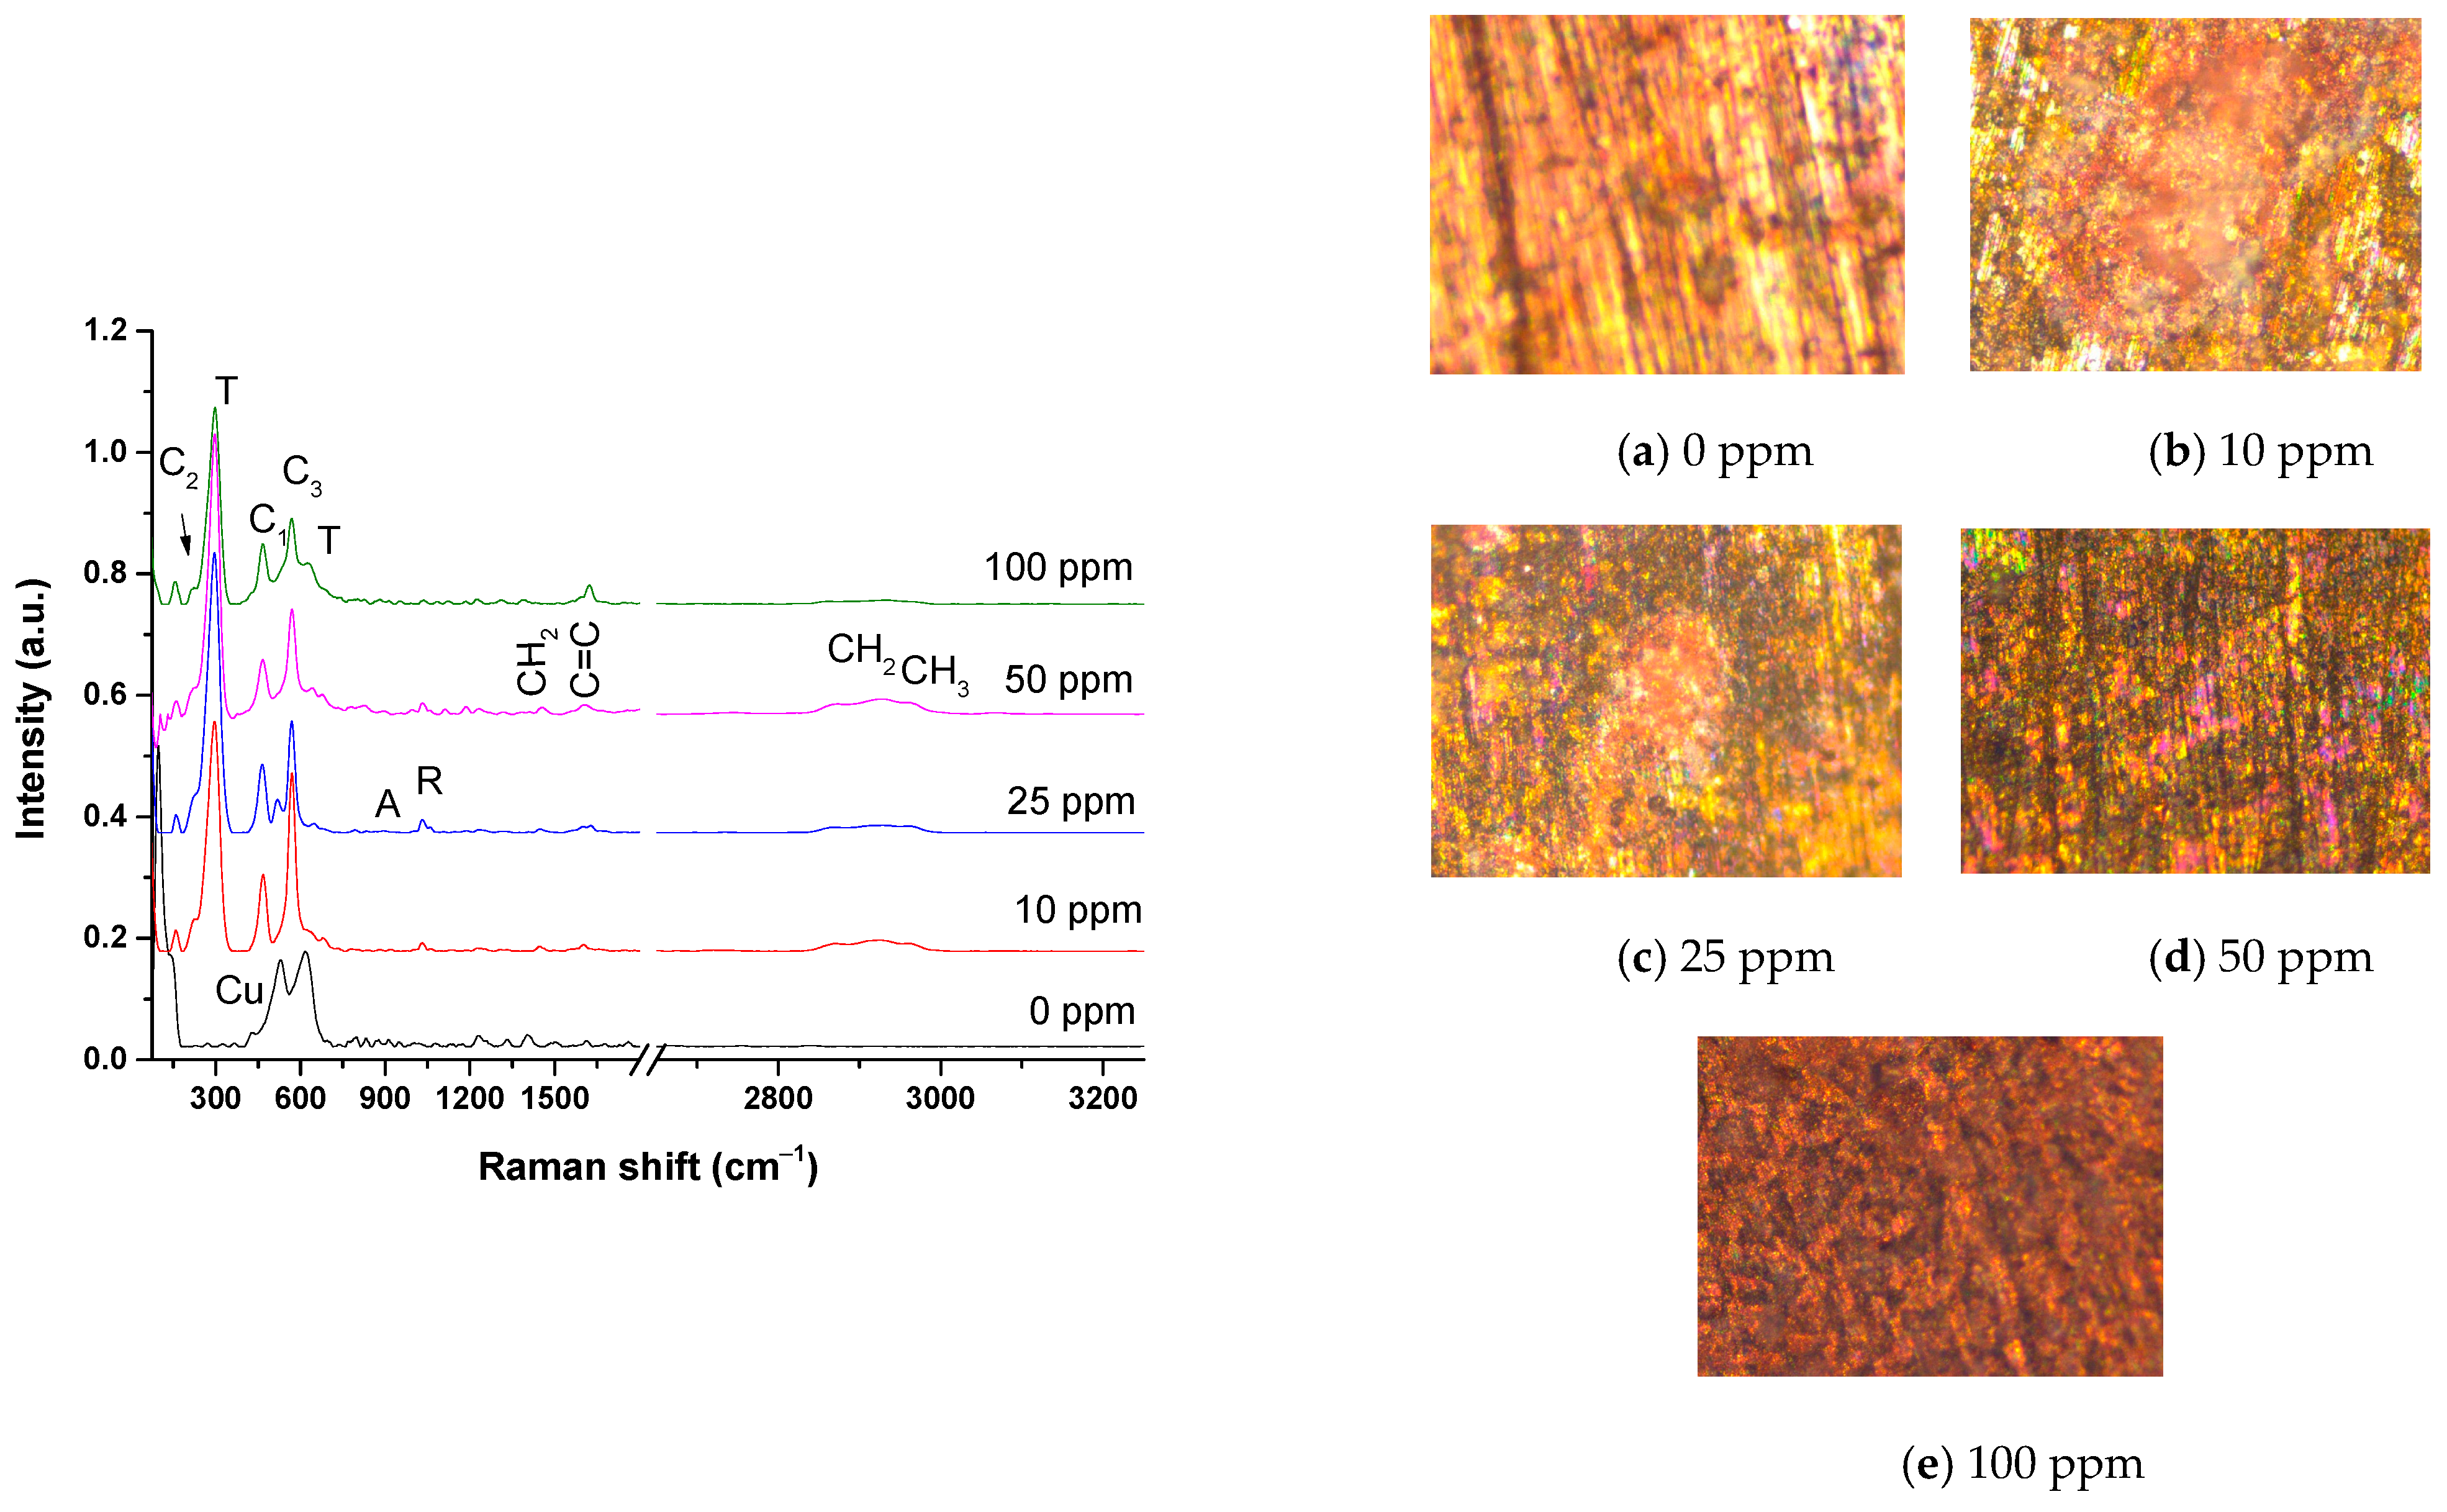
3.5. Scanning Electron Microscopy

Figure 6 shows the SEM–EDS micrographs of the bronze exposed to acid rain at different inhibitor concentrations after 24 h. Figure 6a shows the micrograph at 0 ppm, where the dissolution of the passive copper oxide layer in acid rain is observed. In bronze alloys, Cu and Zn ions are selectively dissolved due to the decuprification and dezincification processes of bronze. On the contrary, Sn tends to form the patina layer (insoluble in some media) that stabilizes it through passivation [32]. In this study, the PC results showed the dissolution of the bronze without forming a stable passive layer. E. Bernardi et al. report an average surface depth loss of ~13 µm, with an increase in roughness, as seen in Figure 6a [33]. The EDS analysis showed mainly the presence of copper (62%), followed by zinc (3%) and tin (1.6%), but very little oxygen content (3.8%), probably in the form of SnO2.
The patina formation on the bronze surface is observed by introducing 10 ppm of the inhibitor (Figure 6b) into the acid rain medium. However, this passive layer does not achieve surface homogeneity, leaving areas exposed to the medium where pitting corrosion is observed. Cubic crystals are observed in the morphology of corrosion products due to cuprous oxide [34]. The EDS analysis mainly shows copper (51.6%), chloride (15%), zinc (2.5%), and oxygen (2.8%), indicating a low formation of cuprite (Cu2O) and the formation of CuCl and copper-zinc (Cu3Zn) [32]. The low presence of SnO2 is also observed.
At an inhibitor concentration of 25 ppm (see Figure 6c), a more significant amount of corrosion products stabilized by the inhibitor is observed on the surface, but with a non-homogeneous distribution. This patina formation enhances the efficiency of inhibiting corrosion. The morphology surface shows nanocrystals in certain regions corresponding to cassiterite (SnO2) and/or hydroxide, which was corroborated by Raman spectroscopy [33]. The corrosion layer inhomogeneity could be related to the bronze microstructure [35]; dendrites are observed where areas preferably with tin products are in high relief, and oxides containing Cu are in low relief. The EDS analysis mainly shows zinc (20%), copper (11.8%), chloride (11.8%), and oxygen (5%). In the SEM–EDS image, copper oxide is found in low relief; however, according to the W % of the elements, CuCl is mainly found. Dendrite crystals in high relief correspond to the presence of SnO2, which is observed accompanied by zinc crystals, probably as a product of the dezincification processes of bronze [32]. Additionally, lead oxide is also observed.
The 50-ppm micrograph (Figure 6d) shows a patina layer formed on the bronze surface in a more homogeneous and granular form, stabilizing by inhibitor. Furthermore, the surface morphology maintains the microstructure relationship at the metal–patina interface. The EDS analysis of the oxide layer shows mainly copper (44%), 15% chlorine, and 1.2% sulfur, indicating the formation of CuCl and CuS in low relief and little cuprite. In high relief, it is mainly found by SnO2, included with by Sn-Zn. Therefore, the high copper content is due to the formation of an imidazoline complex on the surface of the bronze. At a concentration of 100 ppm, a thin layer of patina, also composed of Cu20, CuCl, CuS, and SnO2, is formed (Figure 6e). However, areas with microcracks are observed due to the leaching of the oxide layer formed that is not stabilized by the inhibitor. In certain areas, the inhibitor does not adhere to the metal surface due to the adsorption-desorption by intermolecular interactions due to the high concentration of the inhibitor, as observed in electrochemical impedance and potentiodynamic polarization. These results agree with the highest inhibition efficiency found at 50 ppm, indicating that the inhibitor stabilizes the protective oxide layer at this concentration, providing adequate protection of bronze against acid rain.

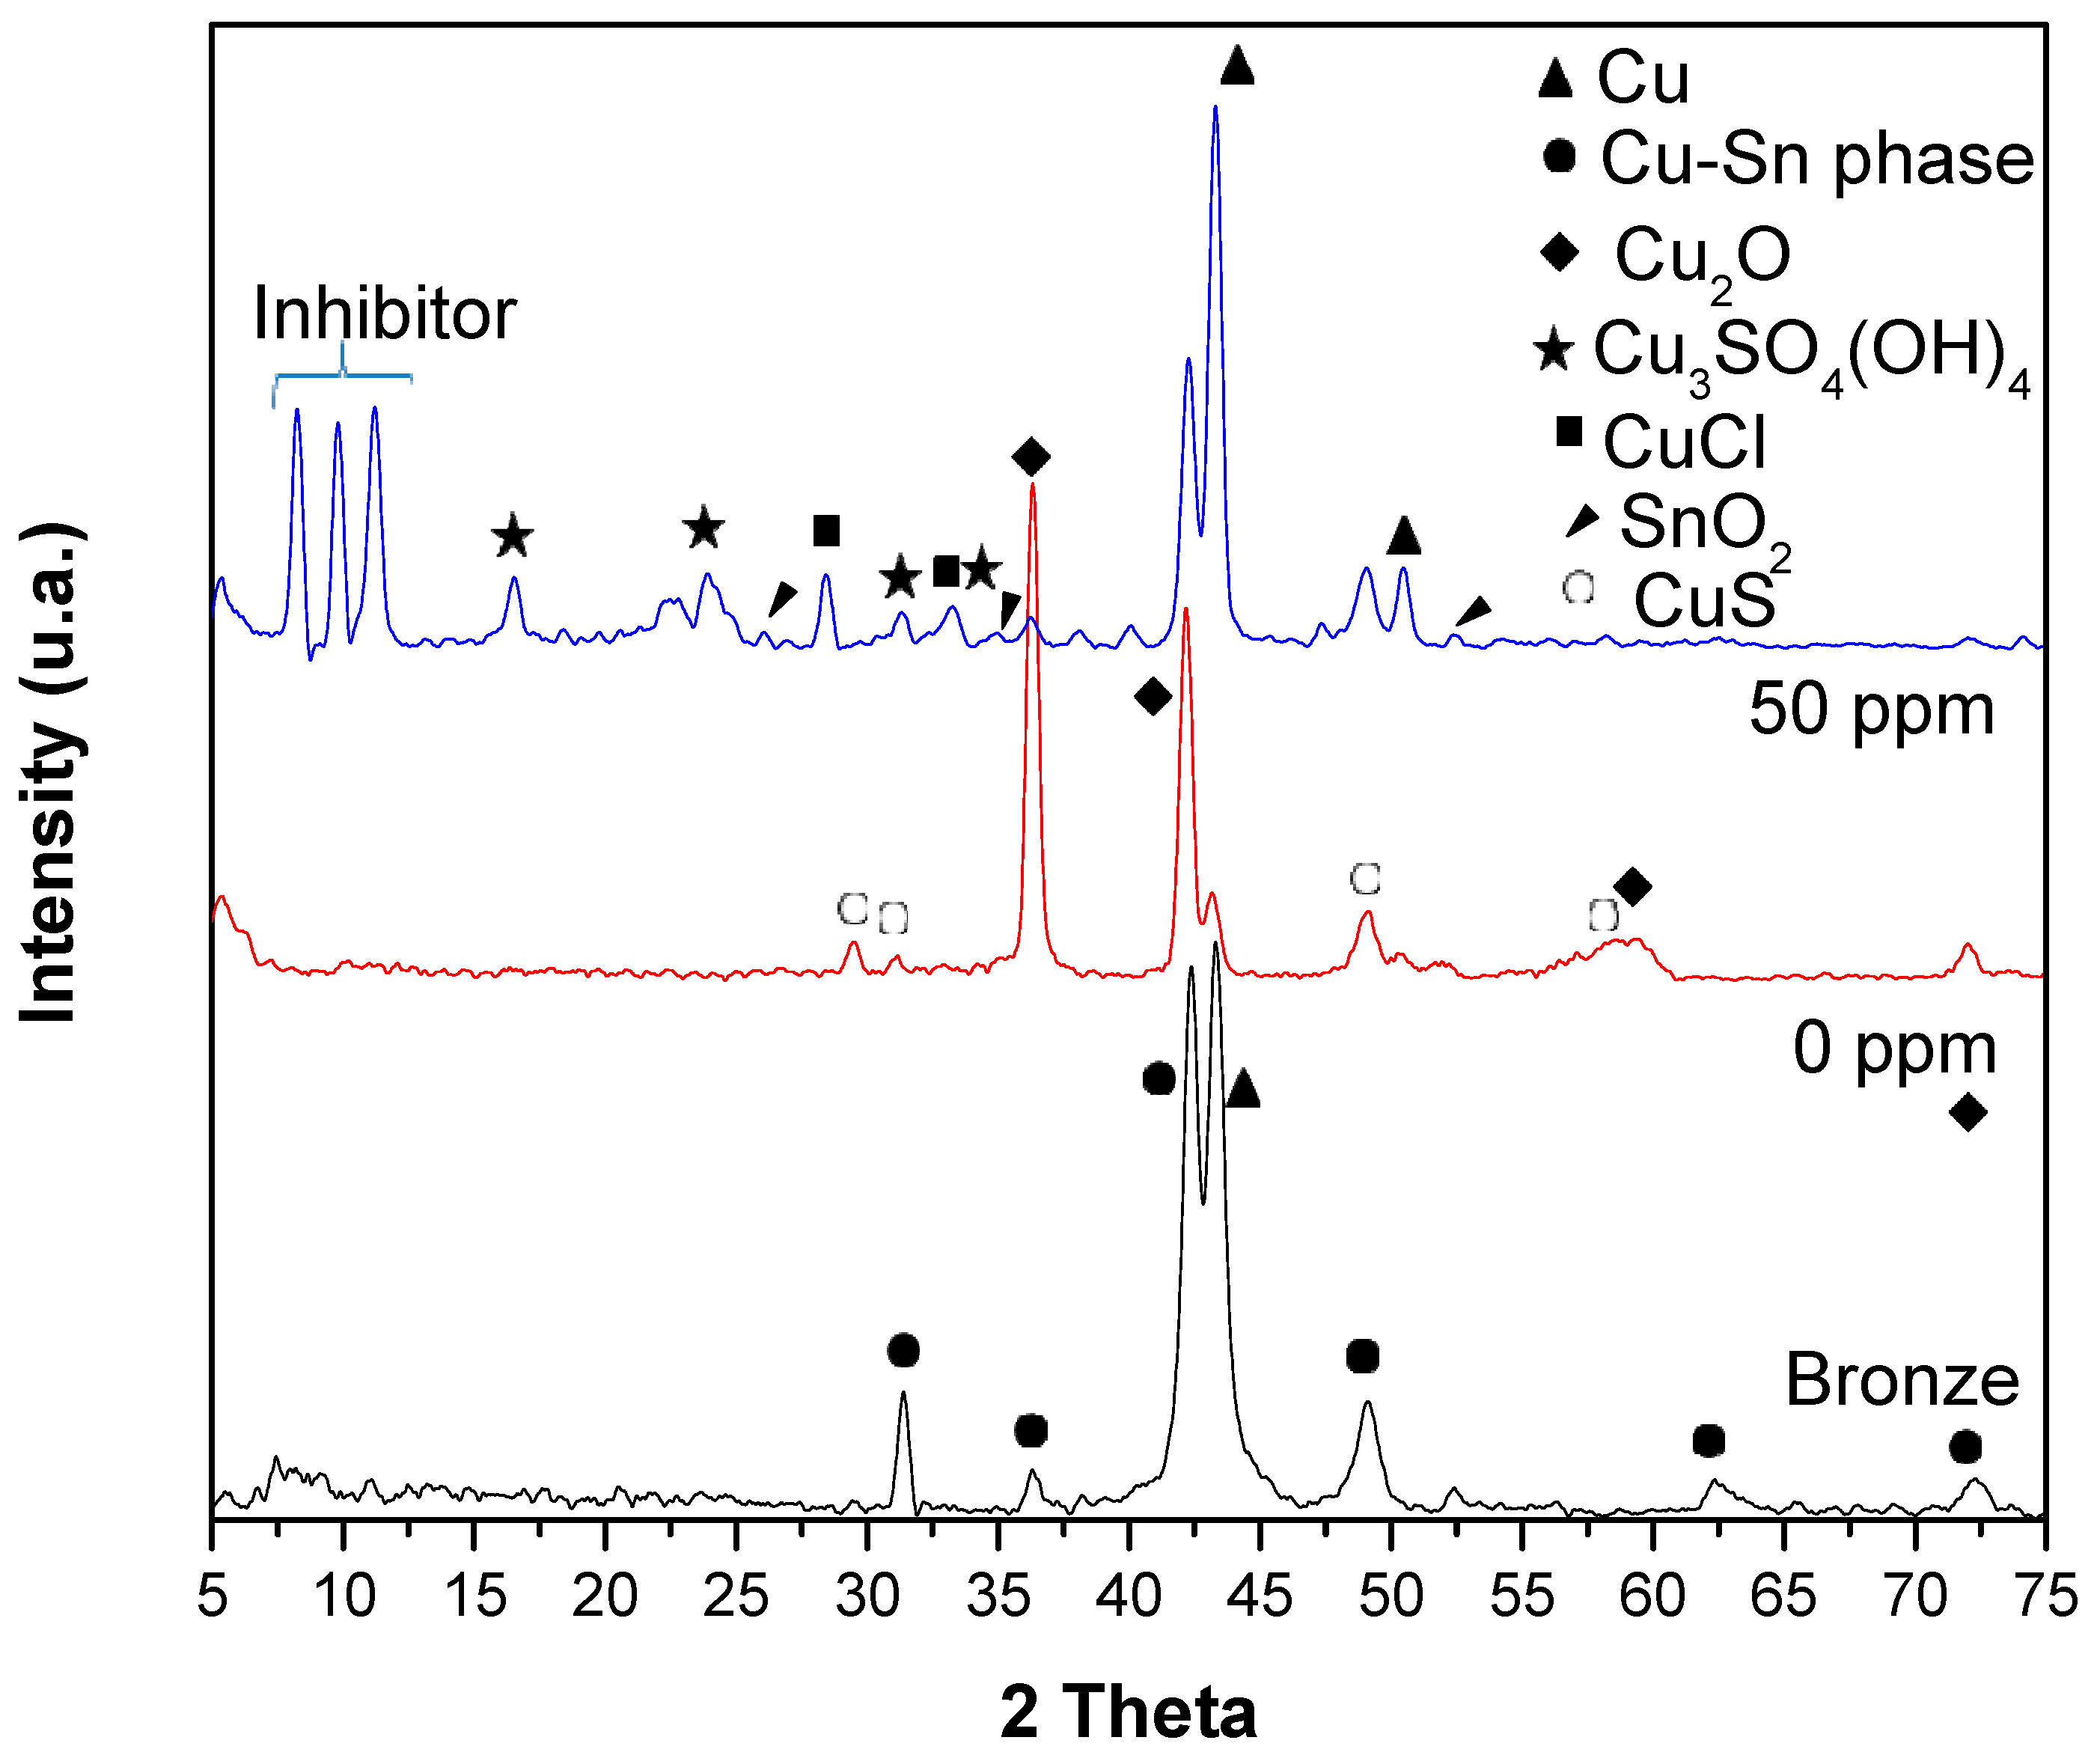
3.6. XRD and Raman Spectroscopy Analysis

XRD analyzed the oxides formed on the surface of the bronze after exposure to acid rain (24 h). Figure 7 shows the diffractograms of the bronze before and after its exposure to acid rain with 0 and 50 ppm of the inhibitor. In the diffractogram of the bronze, the composition of the bronze described in Table 1 is observed, composed mainly of Cu (90%) and Sn (10%). The peaks of the Cu at 43° and 50.4° of 2θ, and δ-Cu-Sn phase diffraction patterns are shown at 2θ: 43°, 49°, 62° and 72° [36]. The natural mechanism of bronze corrosion is the formation of patina; this layer is mainly formed by cuprite (Cu2O) and cassiterite (SnO2) and protects the bronze from corrosion [36]. In the X-ray diffraction spectrum of bronze at 0 ppm, the formation of the cuprite (Cu2O) phase is mainly presented. Cuprite is a high-symmetry cubic crystal [37], and its diffraction patterns are observed at 2 Theta (°): 36.5°, 42°, 60°, and 72° [38]. Cuprite is insoluble in water and slightly soluble in acid, so its crystal deposition is not well observed in SEM–EDS. However, the SnO2 phase is slightly detected on the bronze surface in the DRX analysis by the copper diffusion through the SnO2 film [39]. The diffraction pattern in the inhibitor presence at 50 ppm shows diffraction peaks at 10 2θ, forming a cuprous complex—presumably, copper fatty imidazoline, which aligns with the SEM-EDS analysis result. Imidazole derivatives have been reported to form a Cu (Imi)2 complex on the surface of copper and its alloys [28,39]. In this study, the Cu–fatty imidazoline complex formation is probably induced by the presence of Cu(I) due to the oxidation to Cu++, where vacant cations (VCu+) are formed on the oxide surface, Cu+ cations migrate from the metal/oxide interface to the oxide surface [40]. In the same diffractogram, XRD has a limited detection of nantokite CuCl, which SEM–EDS observes well. Covellite CuS, antlerite Cu3SO4(OH)4, and very slight SnO2 are also observed [37].
The oxides formed on the bronze surface after exposure to acid rain at different inhibitor concentrations were analyzed by Raman spectroscopy (Figure 8). The Raman spectrum at a concentration of 0 ppm shows mainly the Cu lattice band at 100 cm−1 and two broad bands at 533 and 619 cm−1, corresponding to the passive layer on pure copper [37]. Cuprite (Cu2O) formation is usually observed in acid rain, presenting a strong band at 218 cm−1 [33,41]. However, cuprite is not observed in Raman due to the bronze dissolution in the medium at 0 ppm, as seen in the optical micrograph in Figure 8a and the PC result. On the contrary, cuprite crystals were more sensitive to detection by XRD analysis after exposure to acid rain on bronze. The growth of rose-type crystals is observed in optical micrographs of bronze exposed to acid rain using 10 to 50 ppm of inhibitor (Figure 8b–d), composed of a heterogeneous layer of cuprite/tenorite called a “noble patina”, which is not particular to an environment but is frequently found in archaeological bronzes as a product of atmospheric oxidation [41,42]. A remarkable similarity can be observed in the Raman spectra related to these micrographs (Figure 8b–e), which showed the presence of tenorite (CuO) oxidation product of Cu2O in the air [31]. A strong band for CuO is observed at 296 cm−1, other weak vibrational modes at 345 cm−1 and 630 cm−1, and a feeble band in the spectral range 1110–1232 cm−1 [41,42,43]. Cuprite is slightly observed in the 10–50 ppm spectrum. Tenorite is characterized by the brown patina, observed mainly in the micrograph and the spectrum at 100 ppm. The formation of covellite (CuS) is shown in the 10–100 ppm spectra in the vibrational mode at 468 cm−1, which is visually observed as dark indigo blue in the 50-ppm micrograph (Figure 8d) [41,42].
The XRD analysis showed the presence of copper sulfate and nantokite CuCl. Studies report the stability of specific copper hydroxy sulfate minerals under different pH conditions. Brochantite Cu4(OH)6SO4 is not stable at acid rain pH (<4), but antlerite (Cu3(OH)4 SO4) was observed by XRD [37]. In the Raman spectra, the symmetric stretching mode of SO42− at 972 cm−1 is slightly observed [41,42,43]. Nantokite CuCl is not observed in Raman spectra because it exhibits thermal degradation in Raman detection (785 nm laser), which makes its measurement difficult [43]. The simultaneous presence of green, pink, and mixed areas is observed in the 25–50 ppm micrographs (Figure 8b–d). The greenish patina is due to the nantokite CuCl, the antlerite Cu3(OH)4SO4, and the probable rouaite (Cu2(NO3) (slight band at 1035 cm−1) (OH)3) [38,39]. Studies report the relationship between size and spectral changes in nanocrystalline SnO2 [23]. Reducing the particle size shifts the Raman band, resulting in a single broadband at ~580 cm−1. Sharygin and Vovk [44] suggest that the band at ~580 cm−1 is not only due to surface modes but also to tin oxyhydroxide. Then, the SnO2 nanocrystals signal appears at 576 cm−1 in the Raman spectra, probably corresponding to tin oxide and/or hydroxide nanocrystals [33,44,45]. Finally, the bands of the organic inhibitor appear mainly in the 10–50 ppm spectra. The symmetric C–H stretching bands of the alkyl chains of the surfactant-type inhibitor are slightly observed at 2927 cm−1, at 1614 cm−1, the C=C stretching band of alky chain unsaturation, and the methylene band of the alkyl chains at 1452 cm−1.

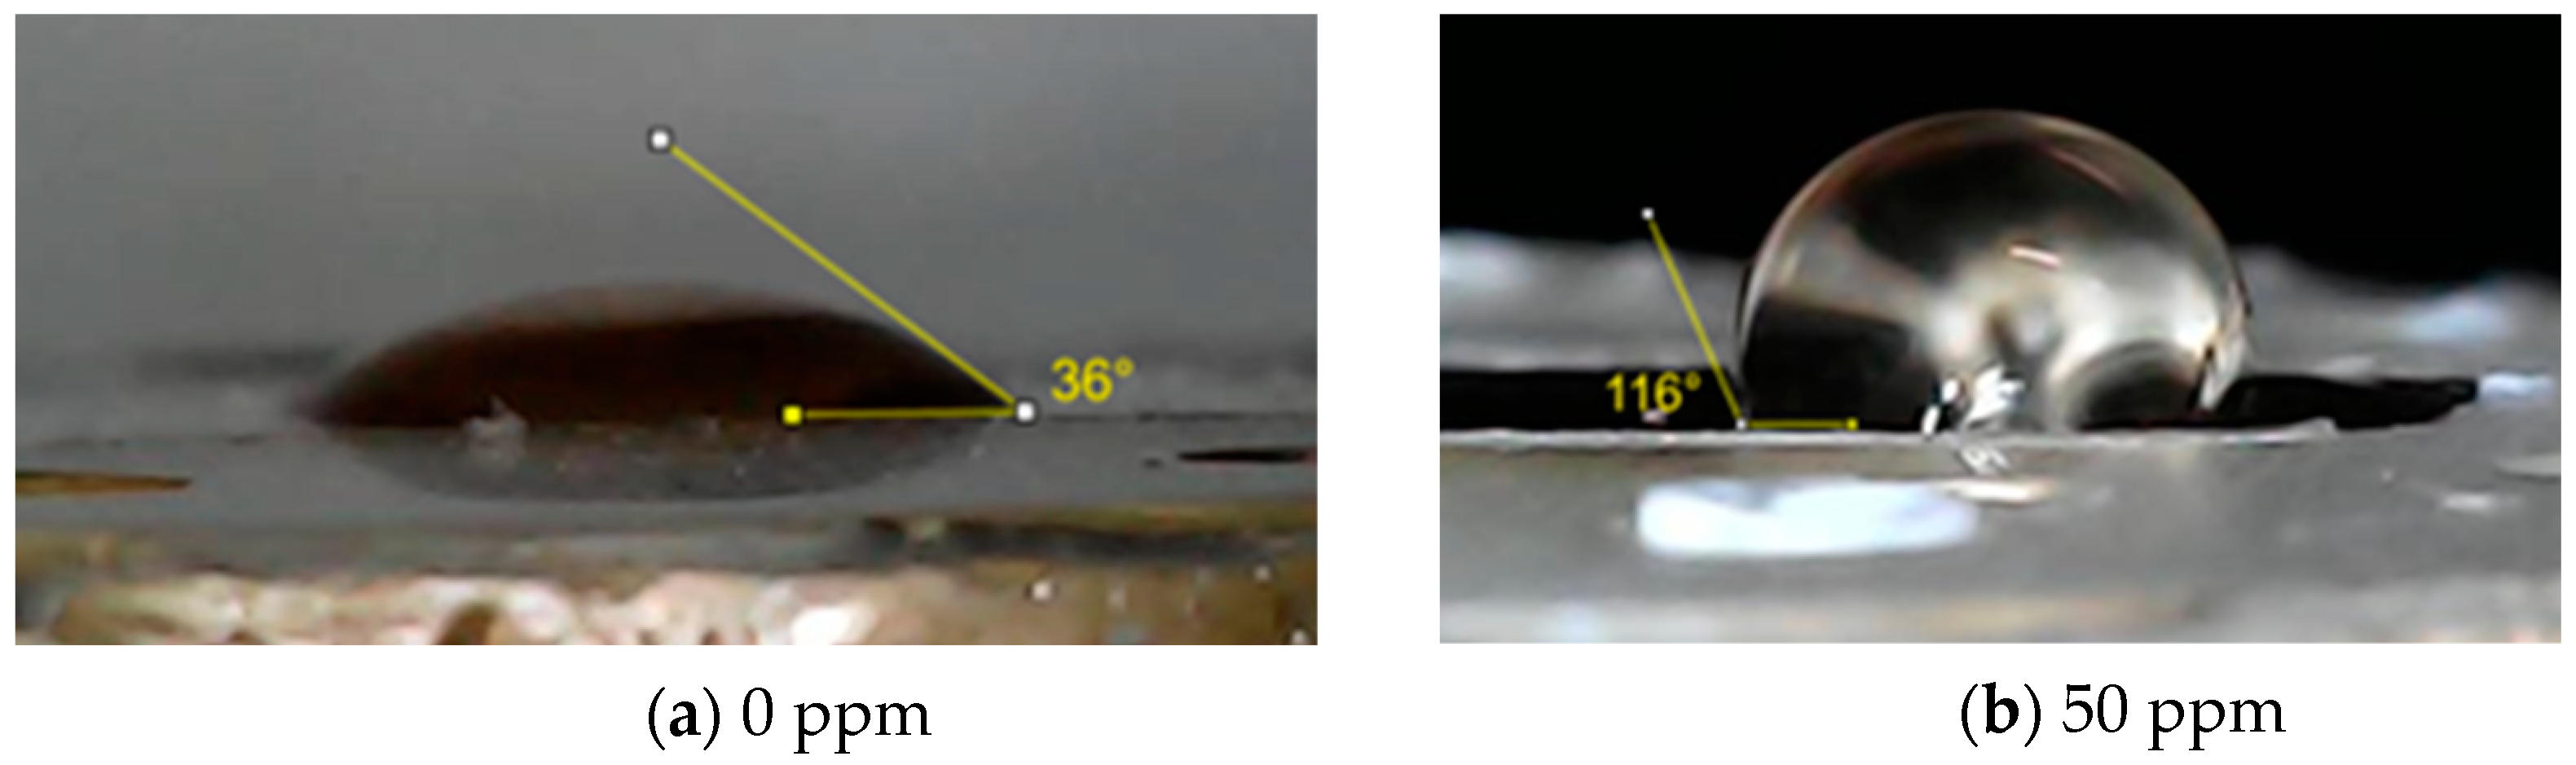
3.7. Surface Wettability

In Figure 9, the contact angle of the bronze surface is shown at 0 ppm and 50 ppm of inhibitor after 24 h of exposure to acid rain. The contact angle recorded for the specimen at 0 ppm concentration was 36° ± 2, while for the 50-ppm concentration the contact angle increased significantly to 116° ± 1. This increase in the contact angle confirms the surface hydrophobicity by forming a Cu (Imi)2 complex that stabilizes the corrosion products using 50 ppm of the inhibitor. The surfactant-type inhibitor is adsorbed on the bronze surface through non-shared electron pairs of a heteroatom (N), and the unsaturation of the alkyl chain by the interaction between the π electrons and the d orbitals of the metal forming a hydrophobic layer that prevents the penetration of the medium into the surface [22]. A fatty imidazoline complex with copper ions Cu+ is subsequently formed during the formation of cuprite. This result may have significant implications for the industry, where the durability and resistance of bronze are crucial for the maintenance and longevity of structures and components.

3.8. Adsorption Isotherm

The adsorption mechanism of the protective layer on the bronze surface was investigated to determine whether it involves physisorption or chemisorption. The adsorption isotherm model was obtained by fitting the corrosion inhibition measurements and the degree of inhibitor surface coverage (θ) into the various adsorption isotherms models (Langmuir, Tempkin, and Frendlich); the model that best fit the experimental data was the Freundlich model, with a correlation coefficient of R2 = 0.99 (Figure 10). This model suggests that the adsorption process is heterogeneous, with varying affinities of binding sites on the metal surface for the inhibitor molecules [22]. The inhibitor adsorption forms an insoluble complex stabilizing the oxide layer, acting as a protective barrier against the corrosive medium.
The Freundlich adsorption isotherm expressed in linear form as [46]:
l o g q e = l o g K f + 1 n l o g C e
where:
  • qe is the amount of inhibitor adsorbed per unit mass of the adsorbent (mg/g or mmol/g).
  • Ce is the equilibrium concentration of the inhibitor in the solution (mg/L or mmol/L).
  • Kf is the Freundlich constant related to the adsorption capacity.
  • 1/n is the Freundlich exponent that indicates the intensity of adsorption.
In this form, the plot of log qe versus log Ce yields a straight line, where the slope corresponds to 1/n, and the intercept gives log Kf. A slope 1/n less than 1 indicates favorable adsorption on the surface, which aligns with the findings of this study.
The nature of the adsorption mechanism is closely linked to the value of the standard free energy of adsorption (ΔGads). According to established criteria, if ΔGads is equal to or greater than −20 kJ/mol, the process is attributed to physisorption, indicating an electrostatic interaction between the organic molecules of the inhibitor and the metal surface. Conversely, if ΔGads is significantly more negative, around or below −40 kJ/mol, it would suggest chemisorption, characterized by the formation of covalent bonds between the inhibitor molecules and the metal surface. The ΔGads presented in Equation (3) was used to investigate the feasibility and nature of the adsorption [47].
ΔGads = RT ln(55:5 Kads)
Kads is the adsorption equilibrium constant obtained from the isotherm, and 55.5 is the molar concentration of water in the solution. In this study, the experimental ΔGads value was −3.25 kJ/mol, indicating spontaneous adsorption onto the metal surface by the physisorption process. Here, charged ions (Cl, NO3, SO4) adsorbed onto the bronze surface could easily interact with the organic complex adsorbed through electrostatic interactions.

4. Conclusions

This study synthesized a corrosion inhibitor derived from the oil in rice bran (waste from polished white rice) as a green surfactant-type corrosion inhibitor to protect SAE-62 bronze in a simulated acid rain solution.
The electrochemical evaluation determined an efficiency of inhibiting corrosion by 90% at an inhibitor concentration of 50 ppm. Fatty imidazolines behaved as a mixed-type inhibitor. The inhibition efficiency is due to the formation of the protective film on the bronze surface of the copper–fatty imidazoline complex, which was observed by XRD and Raman spectroscopy. The fatty imidazoline is adsorbed by the interaction of the π orbitals of the unsaturation in the alkyl chains with the d orbitals on the bronze surface, the head polar binding through heteroatom with the Cu (I) formed on the bronze surface by copper oxidation. Furthermore, the stable formation of the organometallic complex stabilizes the corrosion products formed on the bronze surface by electrostatic interaction, forming a non-homogeneous protective layer, which follows a Freundlich-type adsorption isotherm in a physisorption adsorption mechanism.
The morphology of the different oxides formed on the bronze surface using the inhibitor at different concentrations was analyzed by SEM. In the micrographs of 50 ppm, a patina formed on the bronze’s surface was deposited per the bronze’s microstructure, indicating a stable protective layer. This observation coincides with the highest inhibition efficiency found at 50 ppm, indicating that the inhibitor stabilizes the protective oxide layer at this concentration to protect the bronze against acid rain adequately. The principal oxides formed on the surface of the bronze when exposed to acid rain corrosion were analyzed by XRD and Raman spectroscopy. Cuprite was the main product observed in XRD without an inhibitor. Tenorite was the main compound observed in Raman spectroscopy for the different inhibitor concentrations due to cuprite oxidation upon contact with air. Cassiterite and covellite nanocrystals were also detected on the surface of the bronze, as well as a small formation of antlerite, nantokite, and rouaite.

Author Contributions

Conceptualization, A.T.-I., A.M.C.-V. and E.V.-V.; methodology, I.D.V.-A. and E.V.-V.; software, I.D.V.-A. and A.d.P.-M.; validation, H.M., A.T.-I. and E.V.-V.; formal analysis, E.V.-V. and A.M.C.-V.; investigation, I.D.V.-A. and E.V.-V.; resources, H.M.; data curation, E.V.-V. and A.d.P.-M.; writing—original draft preparation, I.D.V.-A.; writing—review and editing, E.V.-V. and A.T.-I.; visualization, E.V.-V. and A.T.-I.; supervision, H.M.; project administration, H.M.; funding acquisition, H.M. All authors have read and agreed to the published version of the manuscript.

Funding

This research received no external funding.

Institutional Review Board Statement

Not applicable.

Informed Consent Statement

Not applicable.

Data Availability Statement

Data is contained within the article.

Acknowledgments

The authors would like to thank María Luisa Ramón García from the Institute of Renewable Energies, UNAM, for supporting the X-ray diffraction analysis. Thanks also go to Osvaldo Flores-Cedillo, Fermín Castillo-Mejía, Juana Romero, and Hector H. Hinojosa-Galvan from ICF, UNAM, for their academic and technical support. I. D. Vázquez-Aguirre wishes to thank CONACHYT for his scholarship, number 888970.

Conflicts of Interest

The authors declare no conflicts of interest.

References

  1. Shi, Z.; Zhang, J.; Xiao, Z.; Lu, T.; Ren, X.; Wei, H. Effects of acid rain on plant growth: A meta-analysis. J. Environ. Manag. 2021, 297, 113213. [Google Scholar] [CrossRef] [PubMed]
  2. Lund, L.S. Acid Rain. In Introduction to Chemistry; LibreTexts, Ed.; California State University: Long Beach, CA, USA, 2024; pp. 724–727. [Google Scholar]
  3. Lal, N. Effects of acid rain on plant growth and development. e-J. Sci. Technol. 2016, 11, 85–101. [Google Scholar]
  4. Van Roy, W.; Van Roozendael, B.; Vigin, L.; Van Nieuwenhove, A.; Scheldeman, K.; Merveille, J.-B.; Weigelt, A.; Mellqvist, J.; Van Vliet, J.; van Dinther, D.; et al. International maritime regulation decreases sulfur dioxide but increases nitrogen oxide emissions in the North and Baltic Sea. Commun. Earth Environ. 2023, 4, 391. [Google Scholar] [CrossRef]
  5. Lin, J.; Zhou, C.; Chen, L.; Huang, G.; Lamarque, J.-F.; Nie, J.; Yang, J.; Hu, K.; Liu, P.; Wang, J.; et al. Sulfur emissions from consumption by developed and developing countries produce comparable climate impacts. Nat. Geosci. 2022, 15, 184–189. [Google Scholar] [CrossRef]
  6. Sosa-Echeverría, R.; Bravo-Álvarez, H.; Alarcón-Jiménez, A.L.; Torres-Barrera, M.D.C.; Jaimes-Palomera, M.; Sánchez-Álvarez, P.; Granados-Hernández, E. Acid rain in a Mexican site on the coast of the Gulf of Mexico. Atmosphere 2018, 31, 317–330. [Google Scholar] [CrossRef]
  7. Sosa-Echeverría, R.; Alarcón-Jimémez, A.L.; Torres-Barrera, M.D.C.; Jaimes-Palomera, M.; Retama-Hernández, A.; Sánchez-Álvarez, P.; Granados Hernández, E.; Bravo-Álvarez, H. Spatial and temporal variation of acid rain in the Mexico City Metropolitan Zone. Atmosphere 2019, 32, 55–69. [Google Scholar] [CrossRef]
  8. Jaramillo, J.V. Los 100 Sitios y Monumentos más Importantes del Centro Histórico de la Ciudad de México, CDMX: Matesis Asociados, S de R. L. Mi. 2012. Available online: http://centro.paot.org.mx/documentos/gdf/sitios_monumentos.pdf (accessed on 1 January 2024).
  9. Rahmouni, K.; Takenouti, H.; Hajjaji, N.; Srhiri, A.; Robbiola, L. Protection of ancient and historic bronzes by triazole derivatives. Electrochim. Acta 2009, 54, 5206–5215. [Google Scholar] [CrossRef]
  10. Serghini-Idrissi, M.; Bernard, M.; Harrif, F.; Joiret, S.; Rahmouni, K.; Srhiri, A.; Takenouti, H.; Vivier, V.; Ziani, M. Electrochemical and spectroscopic characterizations of patinas formed on an archaeological bronze coin. Electrochim. Acta 2005, 50, 4699–4709. [Google Scholar] [CrossRef]
  11. Li, W.; Hu, L.; Zhang, S.; Hou, B. Effects of two fungicides on the corrosion resistance of copper in 3.5% NaCl solution under various conditions. Corros. Sci. 2011, 53, 735–745. [Google Scholar] [CrossRef]
  12. Velazquez-Torres, N.; Martinez, H.; Porcayo-Calderon, J.; Vazquez-Velez, E.; Gonzalez-Rodriguez, J.G.; Martinez-Gomez, L. Use of an amide-type corrosion inhibitor synthesized from the coffee bagasse oil on the corrosion of Cu in NaCl. Green Chem. Lett. Rev. 2018, 11, 1–11. [Google Scholar] [CrossRef]
  13. Pillard, D.; Cornell, J.S.; DuFresne, D.L.; Hernandez, M.T. Toxicity of Benzotriazole and Benzotriazole Derivatives to Three Aquatic Species. Water Res. 2001, 35, 557–560. [Google Scholar] [CrossRef]
  14. MGil, M.J.; Soto, A.M.; Usma, J.I.; Gutiérrez, O.D. Contaminantes emergentes en aguas, efectos y posibles cambios. Prod. + Limpia 2012, 7, 52–73. [Google Scholar]
  15. Tasic, Z.Z.; Mihajlovic, M.B.P.; Simonovic, A.T.; Radovanovic, M.B.; Antonijevic, M.M. Ibuprofen as a corrosion inhibitor for copper in synthetic acid rain solution. Sci. Rep. 2019, 9, 14710. [Google Scholar] [CrossRef] [PubMed]
  16. Montaser, A.A.; El-Mahdy, M.S.; Mahmoud, E.E.E.; Fouda, A.S. Recycling of expired ciprofloxacin in synthetic acid rain (SAR) solution as a green corrosion inhibitor for copper: A theoretical and experimental evaluation. J. Appl. Electrochem. 2024, 54, 439–456. [Google Scholar] [CrossRef]
  17. Gardić, V.; Tasić, Ž.Z.; Mihajlović, M.B.P.; Radovanović, M.B.; Antonijević, M.M. Corrosion Behavior of the Cu24Zn5Al Alloy in Sodium Sulfate Solution in the Presence of 1-Phenyl-5-mercaptotetrazole. Metals 2023, 13, 1863. [Google Scholar] [CrossRef]
  18. Abdel-Karim, A.M.; El-Shamy, A.M. A Review on Green Corrosion Inhibitors for Protection of Archeological Metal Artifacts. J. Bio-Tribo-Corros. 2022, 8, 35. [Google Scholar] [CrossRef]
  19. Reyes-Dorantes, E.; Zúñiga-Díaz, J.; Quinto-Hernández, A.; Porcayo-Calderon, J.; Gonzalez-Rodriguez, J.; Pedraza-Basulto, G.; Martínez-Gomez, L. Rice Bran as Source for the Synthesis of Imidazoline-type Inhibitors: Synthesis and Corrosion Performance. Int. J. Electrochem. Sci. 2018, 13, 101–118. [Google Scholar] [CrossRef]
  20. Sotelo, O.; Henao, J.; Vazquez-Velez, E.; Poblano-Salas, C.A.; Martinez-Valencia, H. Corrosion Inhibition Studies of Synthesized Oleic Sources-Based Green Inhibitors from Agro-Industrial Waste. In Handbook of Research on Corrosion Science and Engineering; IGI Global: Hershey, PA, USA, 2023; pp. 362–382. [Google Scholar]
  21. Cruz-Zabalegui, A.; Vazquez-Velez, E.; Galicia-Aguilar, G.; Casales-Diaz, M.; Lopez-Sesenes, R.; Gonzalez-Rodriguez, J.; Martinez-Gomez, L. Use of a non-ionic Gemini-surfactant synthesized from the wasted avocado oil as a CO2-corrosion inhibitor for X-52 steel. Ind. Crop. Prod. 2019, 133, 203–211. [Google Scholar] [CrossRef]
  22. Sanchez-Salazar, E.; Vazquez-Velez, E.; Uruchurtu, J.; Porcayo-Calderon, J.; Casales, M.; Rosales-Cadena, I.; Lopes-Cecenes, R.; Gonzalez-Rodriguez, J.G. Use of a Gemini-Surfactant Synthesized from the Mango Seed Oil as a CO2-Corrosion Inhibitor for X-120 Steel. Materials 2021, 15, 4206. [Google Scholar] [CrossRef]
  23. Cárdenas, D.; Olaya, J.; Herrera, L.K. Estudio de la Resistencia a la Corrosión en Recubrimientos de Bronce al aluminio Proxon 21071® producidos con la técnica de proyección Térmica por Llama. Rev. Colomb. Mater. 2014, 5, 170–176. [Google Scholar] [CrossRef]
  24. Zúñiga-Diaz, J.; Reyes-Dorantes, E.; Quinto-Hernandez, A.; Porcayo-Calderon, J.; Gonzalez-Rodriguez, J.G.; Martinez-Gomez, L. Oil Extraction from “Morelos Rice” Bran: Kinetics and Raw Oil Stability. J. Chem. 2017, 2017, 1–9. [Google Scholar] [CrossRef]
  25. Schönemann, A.E.; Edwards, H.G.M. Raman and FTIR microspectroscopic study of the alteration of Chinese tung oil and related drying oils during ageing. Anal. Bioanal. Chem. 2011, 400, 1173–1180. [Google Scholar] [CrossRef] [PubMed]
  26. Porcayo-Calderon, J.; Regla, I.; Vazquez-Velez, E.; de la Escalera, L.M.M.; Canto, J.; Casales-Diaz, M. Effect of the Unsaturation of the Hydrocarbon Chain of Fatty-Amides on the CO2 Corrosion of Carbon Steel Using EIS and Real-Time Corrosion Measurement. J. Spectrosc. 2015, 2015, 184140. [Google Scholar] [CrossRef]
  27. Amin, M.A.; Arida, H.; Kandemirli, F.; Saracoglu, M.; Arslan, T.; Basaran, M.A. Monitoring corrosion and corrosion control of iron in HCl by non-ionic surfactants of the TRITON-X series—Part III. Immersion time effects and theoretical studies. Corros. Sci. 2011, 53, 1895–1909. [Google Scholar] [CrossRef]
  28. Marušić, K.; Ćurković, H.O.; Takenouti, H. Corrosion Inhibition of Bronze and Its Patina Exposed to Acid Rain. J. Electrochem. Soc. 2013, 160, C356–C363. [Google Scholar] [CrossRef]
  29. Simonović, A.T.; Tasić, Z.; Radovanović, M.B.; Mihajlović, M.B.P.; Antonijević, M.M. Influence of 5-Chlorobenzotriazole on Inhibition of Copper Corrosion in Acid Rain Solution. ACS Omega 2020, 5, 12832–12841. [Google Scholar] [CrossRef]
  30. Hassairi, H.; Bousselmi, L.; Khosrof, S.; Triki, E. Evaluation of the inhibitive effect of benzotriazole on archeological bronze in acidic medium. Appl. Phys. A 2013, 113, 923–931. [Google Scholar] [CrossRef]
  31. Elachouri, M.; Hajji, M.S.; Kertit, S.; Essassi, E.M.; Salem, M.; Coudert, R. Coudert, Some surfactants in the series of 2-(alkyldimethylammonio) alkanol bromides as inhibitors of the corrosion of iron in acid chloride solution. Corros. Sci. 1995, 37, 381–389. [Google Scholar] [CrossRef]
  32. Kwon, H. Corrosion Behaviors of Artificial Chloride Patina for Studying Bronze Sculpture Corrosion in Marine Environments. Coatings 2023, 13, 1630. [Google Scholar] [CrossRef]
  33. Bernardi, E.; Chiavari, C.; Lenza, B.; Martini, C.; Morselli, L.; Ospitali, F.; Robbiola, L. The atmospheric corrosion of quaternary bronzes: The leaching action of acid rain. Corros. Sci. 2009, 51, 159–170. [Google Scholar] [CrossRef]
  34. Gianni, L.; Cavallini, M.; Natali, S.; Adriaens, A. Wet and Dry Accelerated Aging Tests in a Spray Chamber to Understand the Effects of Acid Rain Frequencies on Bronze Corrosion. Int. J. Electrochem. Sci. 2013, 8, 1822–1838. [Google Scholar] [CrossRef]
  35. Kwon, H.; Cho, N. Corrosion Behaviors of Outdoor Bronze Sculptures in an Urban–Industrial Environment: Corrosion Experiment on Artificial Sulfide Patina. Metals 2023, 13, 1101. [Google Scholar] [CrossRef]
  36. Juškėnas, R.; Mockus, Z.; Kanapeckaitė, S.; Stalnionis, G.; Survila, A. XRD studies of the phase composition of the electrodeposited copper-rich Cu–Sn alloys. Electrochim. Acta 2006, 52, 928–935. [Google Scholar] [CrossRef]
  37. De Oliveira, F.J.R.; Lago, D.C.B.; Senna, L.F.; De Miranda, L.R.M.; D’elia, E. Study of patina formation on bronze specimens. Mater. Chem. Phys. 2009, 115, 761–770. [Google Scholar] [CrossRef]
  38. Graedel, T.E.; Nassau, K.; Franey, J.P. Copper patinas formed in the atmosphere—I. Introduction. Corros. Sci. 1987, 27, 639–657. [Google Scholar] [CrossRef]
  39. Di Carlo, G.; Giuliani, C.; Riccucci, C.; Pascucci, M.; Messina, E.; Fierro, G.; Lavorgna, M.; Ingo, G.M. Artificial patina formation onto copper-based alloys: Chloride and sulphate induced corrosion processes. Appl. Surf. Sci. 2017, 421, 120–127. [Google Scholar] [CrossRef]
  40. FitzGerald, K.P.; Nairn, J.; Skennerton, G.; Atrens, A. Atmospheric corrosion of copper and the colour, structure and composition of natural patinas on copper. Corros. Sci. 2006, 48, 2480–2509. [Google Scholar] [CrossRef]
  41. Milošev, I.; Kovačević, N.; Kovač, J.; Kokalj, A. The roles of mercapto, benzene and methyl groups in the corrosion inhibition of imidazoles on copper: I. Experimental characterization. Corros. Sci. 2015, 98, 107–118. [Google Scholar] [CrossRef]
  42. Privitera, A.; Corbascio, A.; Calcani, G.; Della Ventura, G.; Ricci, M.A.; Sodo, A. Raman approach to the forensic study of bronze patinas. J. Archaeol. Sci. Rep. 2021, 39, 103115. [Google Scholar] [CrossRef]
  43. Kosec, T.; Ropret, P.; Legat, A. Raman investigation of artificial patinas on recent bronze—Part II: Urban rain exposure. J. Raman Spectrosc. 2012, 43, 1587–1595. [Google Scholar] [CrossRef]
  44. Hayez, V.; Costa, V.; Guillaume, J.; Terryn, H.; Hubin, A. Micro Raman spectroscopy used for the study of corrosion products on copper alloys: Study of the chemical composition of artificial patinas used for restoration purposes. Analyst 2005, 130, 550–556. [Google Scholar] [CrossRef]
  45. Sharygin, L.M.; Vovk, S.M. Raman spectroscopy studies of structural changes in hydrated titanium and tin dioxide gels under drying. J. Appl. Spectrosc. 1997, 64, 283–286. [Google Scholar] [CrossRef]
  46. Said, K.A.M.; Ismail, N.Z.; Jama’In, R.L.; Alipah, N.A.M.; Sutan, N.M.; Gadung, G.G.; Baini, R.; Zauzi, N.S.A. Application of Freundlich and Temkin Isotherm to Study the Removal of Pb(II) Via Adsorption on Activated Carbon Equipped Polysulfone Membrane. Int. J. Eng. Technol. 2018, 7, 91–93. [Google Scholar] [CrossRef]
  47. Akinbulumo, O.A.; Odejobi, O.J.; Odekanle, E.L. Thermodynamics and adsorption study of the corrosion inhibition of mild steel by Euphorbia heterophylla L. extract in 1.5 M HCl. Results Mater. 2020, 5, 100074. [Google Scholar] [CrossRef]
Figure 1. Oil extraction yields from rice bran under different solvent volumes and time conditions.
Coatings 14 01152 g001
Figure 2. Raman spectrum of (a) rice bran oil; (b) fatty imidazolines, with their molecules structures, respectively.
Coatings 14 01152 g002
Figure 3. Potentiodynamic polarization curves for bronze recorded in acid rain solution without and with the addition of fatty imidazolines.
Coatings 14 01152 g003
Figure 4. (a) Nyquist, (b) Bode and (c) Phase angle plots at different times using 0 and 50 ppm of inhibitor for bronze in acid rain solution, with inset plot of experimental (black short dot) and fitted (red solid line) EIS data at 24 h.
Coatings 14 01152 g004
Figure 5. Equivalent electrical circuits at (a) 0 ppm and (b) 50 ppm of inhibitor.
Coatings 14 01152 g005
Figure 6. SEM–EDS images of the bronze surface obtained after electrochemical tests in acid rain solution with (a) 0 ppm, (b) 10 ppm, (c) 25 ppm, (d) 50 ppm, and (e) 100 ppm.
Coatings 14 01152 g006
Figure 7. Diffractograms of the bronze and the patina formed on the bronze surface at 0 and 50 ppm after exposure to acid rain.
Coatings 14 01152 g007
Figure 8. Optical micrographs at 20× and their Raman spectra of the patina formed on the surface of the bronze exposed to acid rain at different inhibitor concentrations. C1: Cuprite (Cu2O), T: Tenorite (CuO), C2: Covellite (CuS), C3: Casiterita nano-crystals of SnOx(OH)y), A: Antlerite (Cu3SO4(OH)4), nantokite (CuCl),and R: Rouaite (Cu2(NO3)(OH)3).
Coatings 14 01152 g008
Figure 9. Analysis of surface wettability at 0 ppm and 50 ppm of inhibitor concentration.
Coatings 14 01152 g009
Figure 10. Freundlich adsorption Isotherm of fatty imidazolines on the bronze surface.
Coatings 14 01152 g010
Table 1. Elemental composition in weight percentage of bronze [23].
ElementAlCuFeNiPPbSiSnZn
SAE 620.0787.590.140.600.260.380.2810.10.33
Table 2. Composition by weight of ions dissolved in acid rain found in Mexico City [7].
IonsCa2+ClMg2+SO42−NH4+NO3K+
mgL−10.2640.3390.0660.0660.3190.3190.075
Table 3. Electrochemical parameters of bronze in acid rain solution without and with the addition of fatty imidazolines.
Inhibitor
Concentration
Ecorr (mV) vs. Ag/AgCl EIcorr (µAcm−2)βc
(mV/Dec)
βa
(mV/Dec)
Inhibitor
Efficiency (%)
Surface Coverage (Θ)Vcorr
(mm/year)
0 ppm−140.695.84−169128----0.044
10 ppm−117.801.88−19817968%0.680.014
25 ppm−131.961.38−20917576%0.760.010
50 ppm−168.860.61−22815890%0.900.004
100 ppm−190.231.71−23018371%0.710.013
Table 4. Fit experimental data from impedance parameters to selected equivalent circuits of bronze in acid rain solution at different inhibitor concentrations.
Cinh
(ppm)
Rs
(Ω×cm2)
CPEdl
(F/cm2)
Rct
(Ω×cm2)
CPEInh
(F/cm2)
RInh
(Ω×cm2)
CPEf
(F/cm2)
Rf
(Ω×cm2)
Rp
(Ω×cm2)
χ2
0 ppm4578.79 × 10−65897----3.98 × 10−556,29262,6461.14 × 10−3
10 ppm5033.12 × 10−699244.47 × 10−571,4372.41 × 10−719,873101,7376.52 × 10−4
25 ppm5332.46 × 10−612,1363.48 × 10−5148,5321.09 × 10−360,289221,4905.40 × 10−4
50 ppm5742.01 × 10−615,3672.98 × 10−5181,2972.83 × 10−5182,413379,6512.55 × 10−3
100 ppm5211.82 × 10−614,2892.54 × 10−5159,8743.47 × 10−4151,629326,3136.26 × 10−4
Table 5. Fit experimental data from impedance parameters for bronze in acid rain solution at different times using 0 ppm and 50 pm inhibitor.
Cinh
(ppm)
Rs
(Ω×cm2)
CPEdl
(F/cm2)
Rct
(Ω×cm2)
CPEInh
(F/cm2)
RInh
(Ω×cm2)
CPEf
(F/cm2)
Rf
(Ω×cm2)
Rp
(Ω×cm2)
χ2
0 ppm4578.79 × 10−65897----3.98 × 10−556,29262,6461.14 × 10−3
50 ppm
0 h3746.11 × 10−695731.97 × 10−5104,4974.01 × 10−596,043210,4872.58 × 10−3
4 h4875.95 × 10−611,1502.29 × 10−5132,6683.92 × 10−5126,440270,7452.52 × 10−3
8 h5524.70 × 10−615,8242.55 × 10−5152,8113.80 × 10−5164,330333,5172.56 × 10−3
12 h5903.68 × 10−617,5382.88 × 10−5179,2732.85 × 10−5180,523377,9242.51 × 10−3
16 h6151.40 × 10−622,4323.38 × 10−5240,9162.50 × 10−5195,445459,4082.50 × 10−3
20 h6041.91 × 10−619,7583.02 × 10−5223,5552.72 × 10−5188,536432,4532.53 × 10−3
24 h5742.01 × 10−615,3672.98 × 10−5181,2972.83 × 10−5182,413379,6512.55 × 10−3
Disclaimer/Publisher’s Note: The statements, opinions and data contained in all publications are solely those of the individual author(s) and contributor(s) and not of MDPI and/or the editor(s). MDPI and/or the editor(s) disclaim responsibility for any injury to people or property resulting from any ideas, methods, instructions or products referred to in the content.

