


The Evaluation and Analysis of the Anti-Corrosion Performance of the Sealing Material B72 for Metal Artifacts Based on Electrochemical Noise


Abstract
1. Introduction
2. Materials and Methods
2.1. Materials
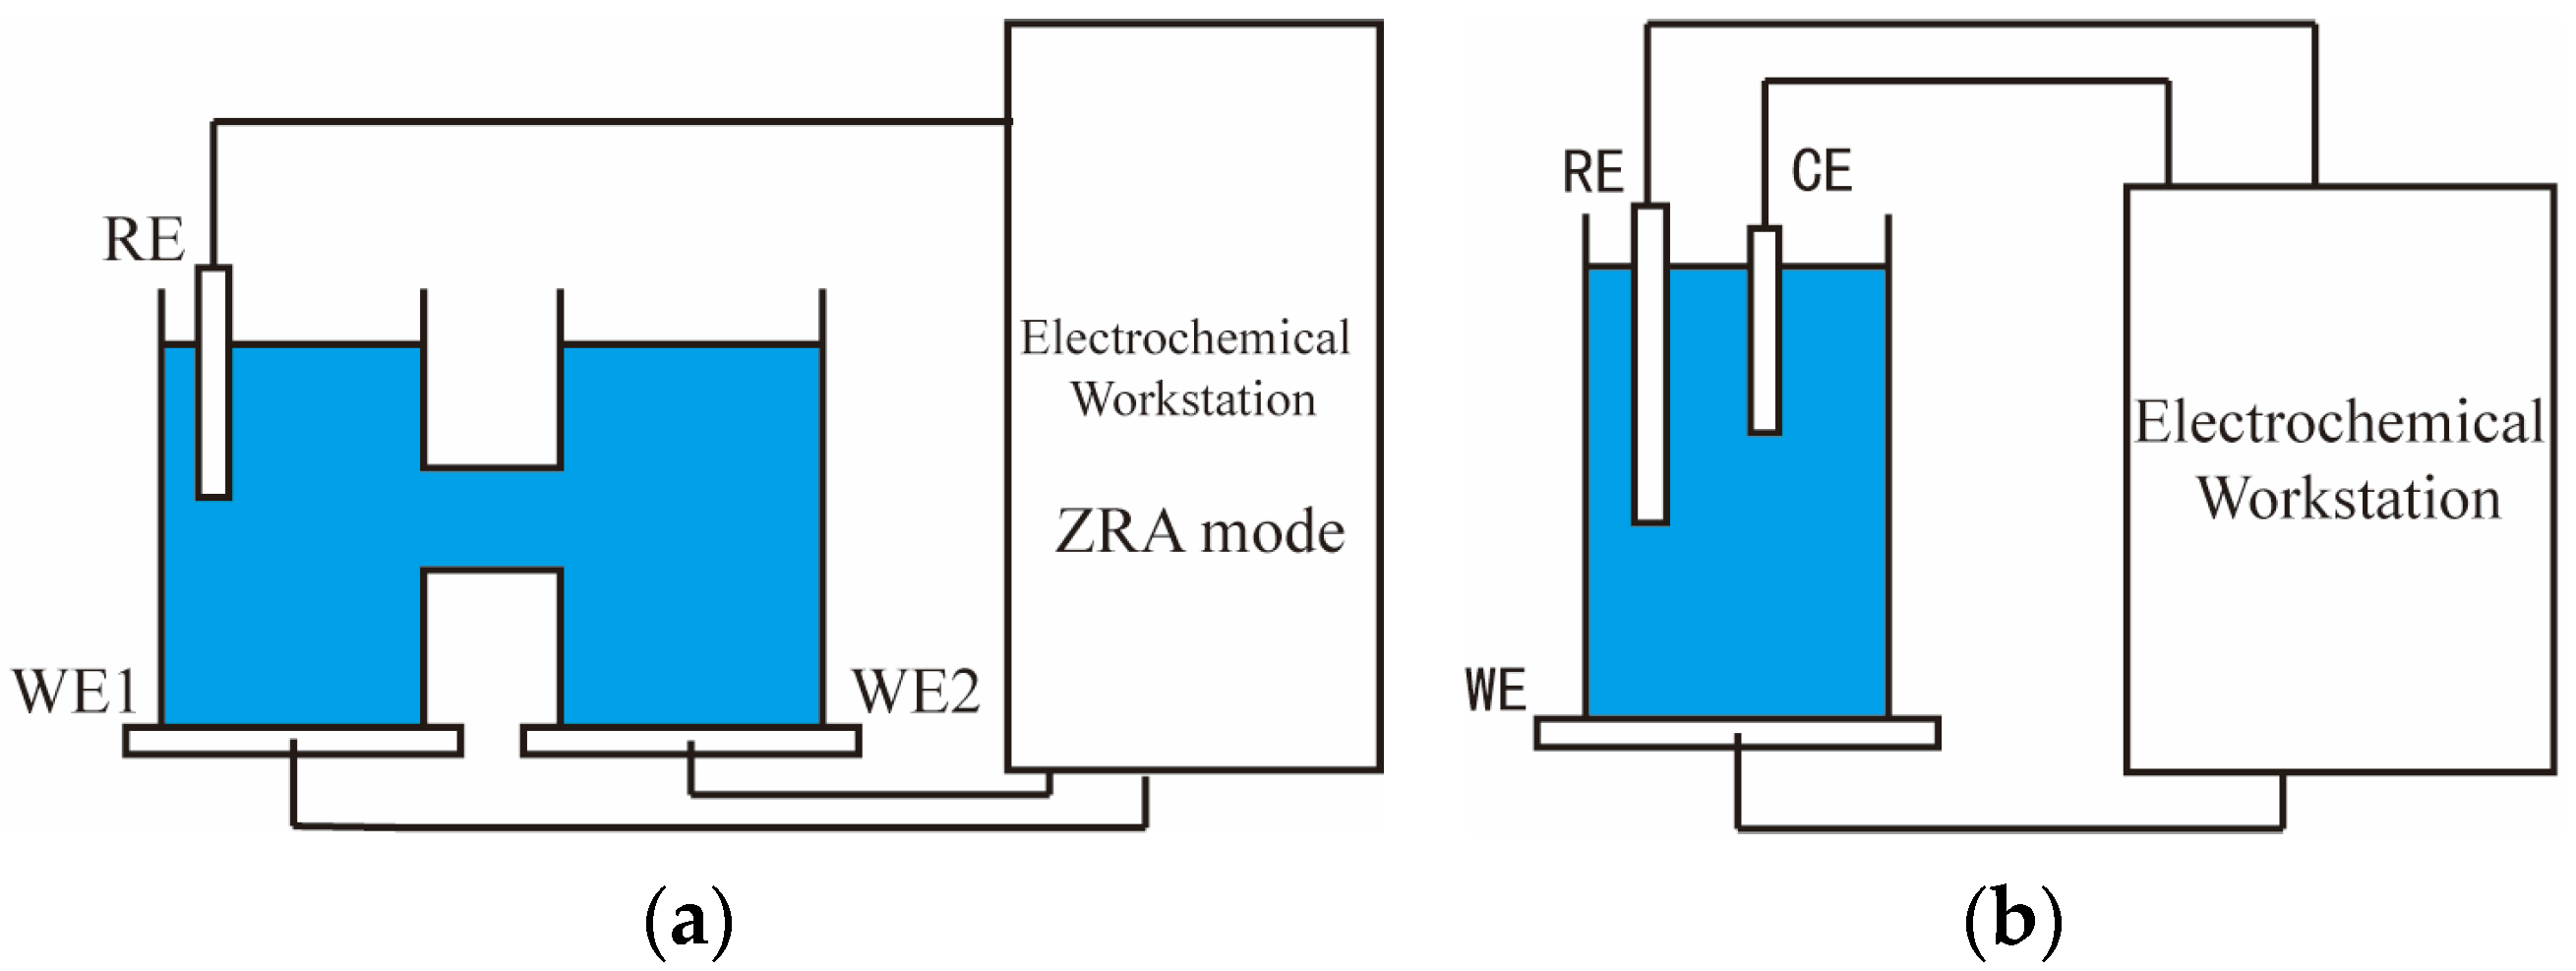
2.2. Methods
3. Results and Discussion
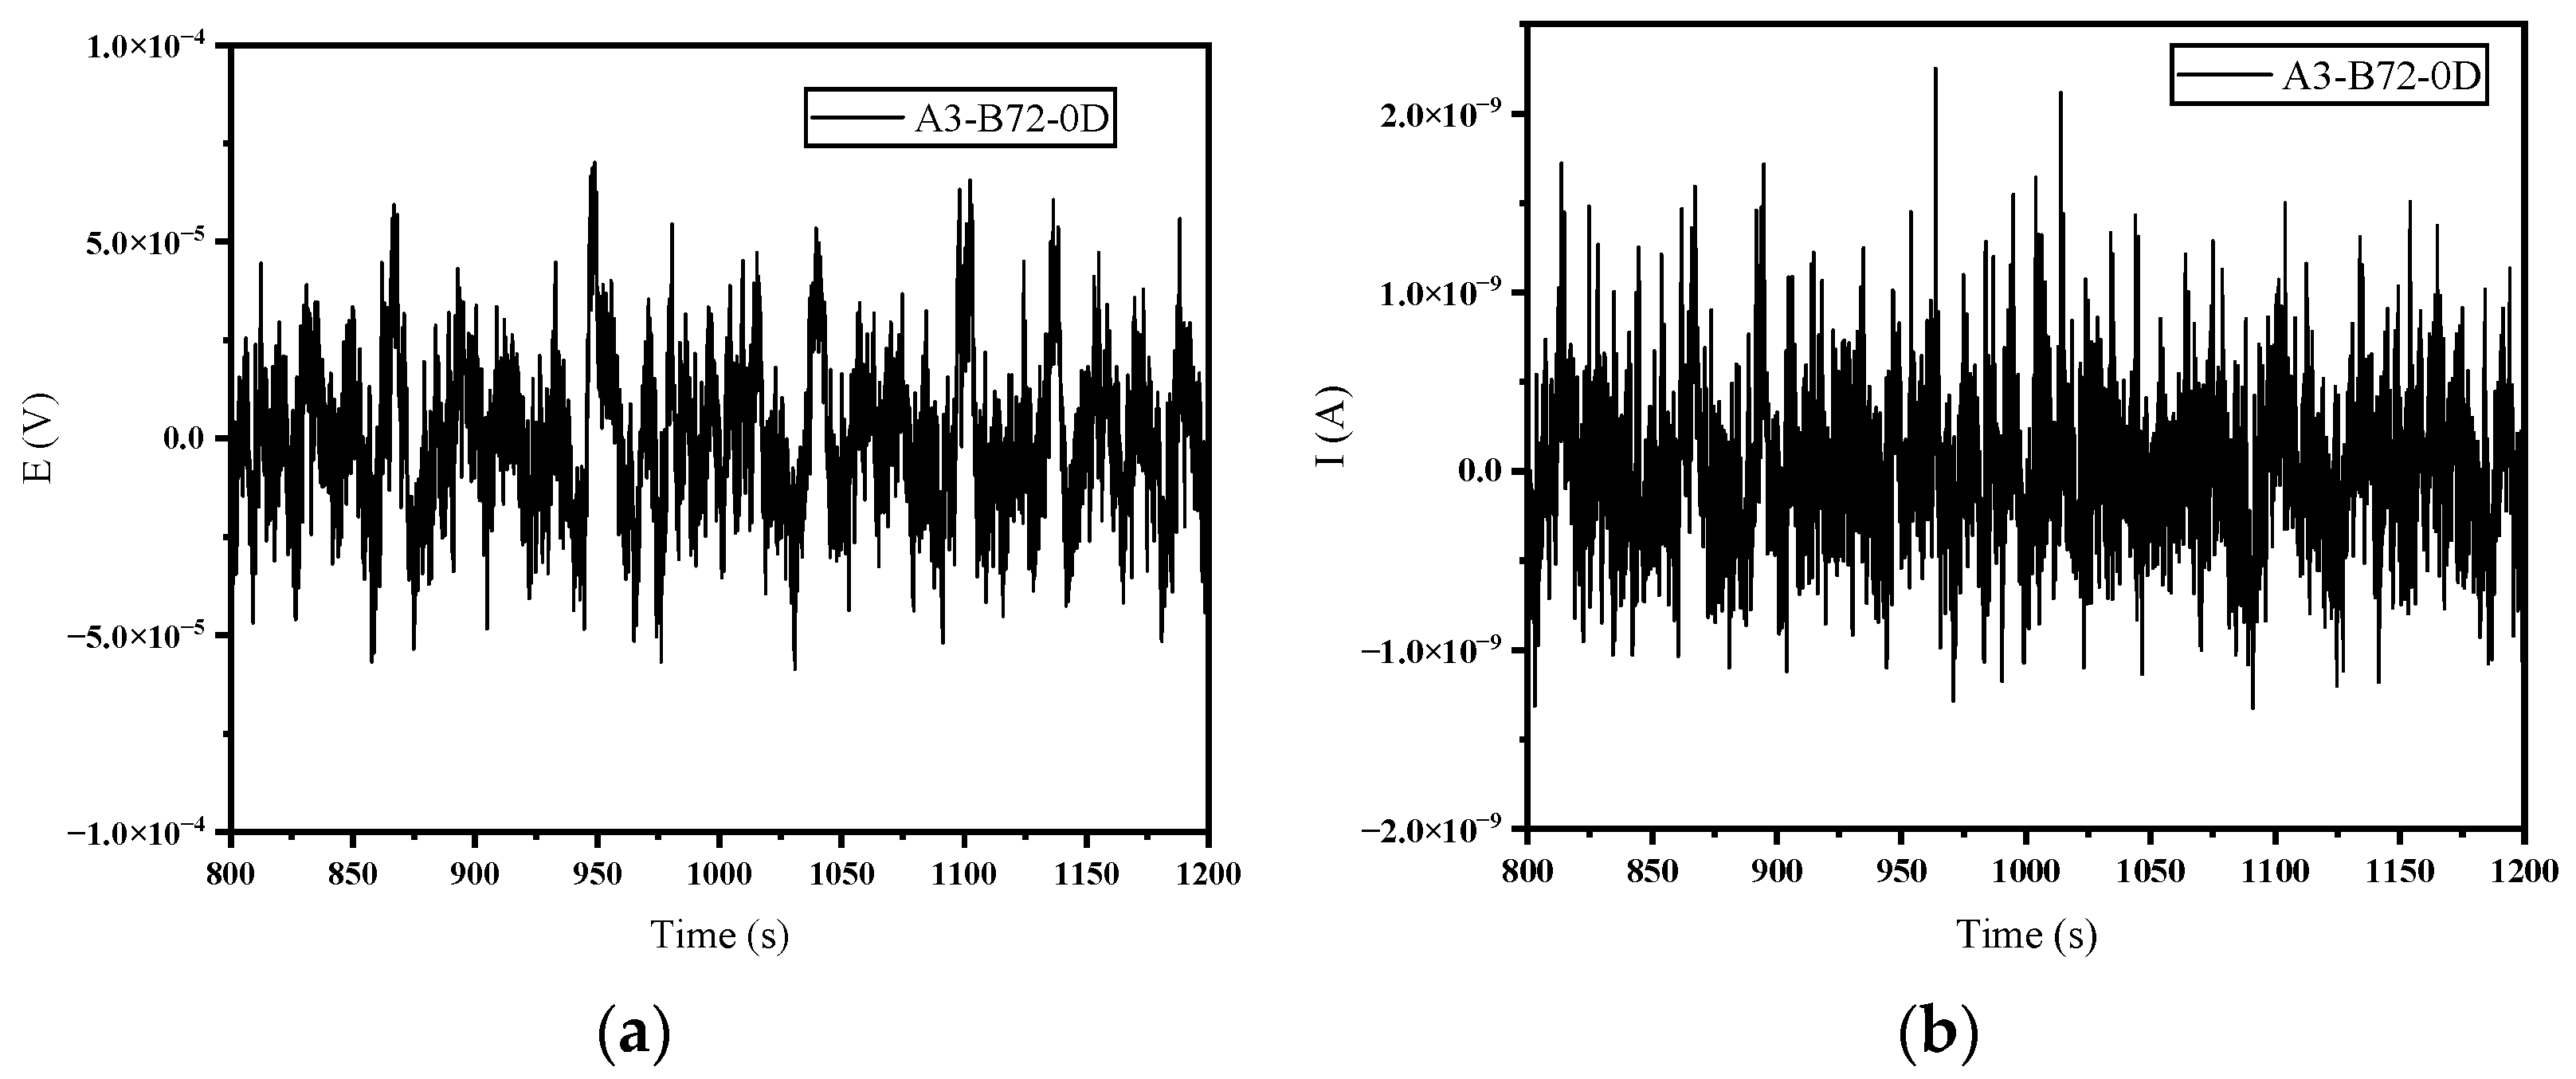
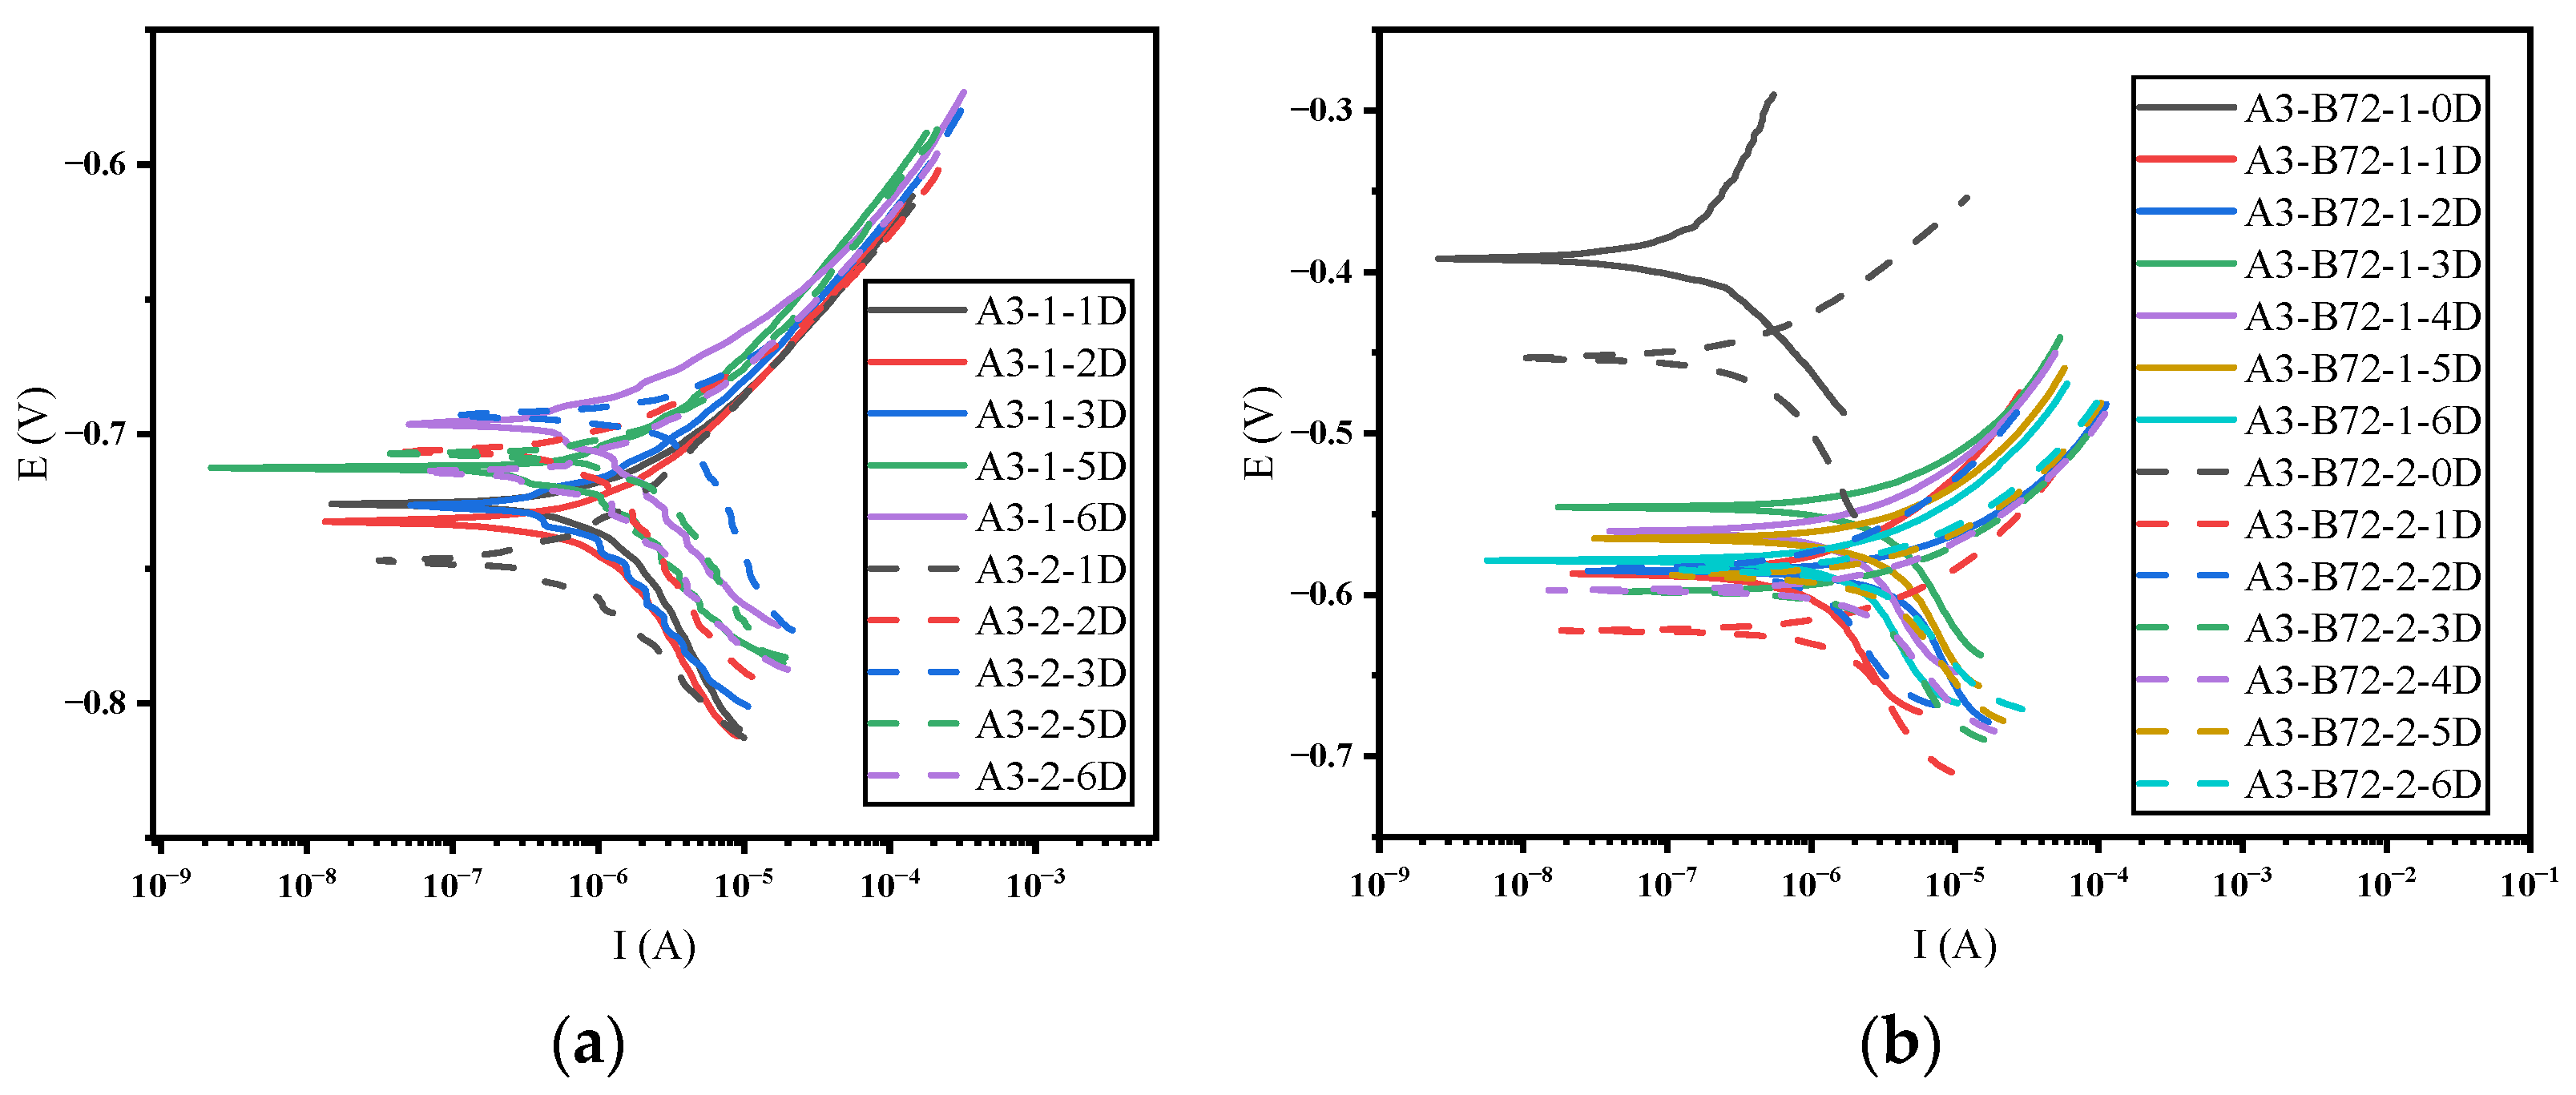
3.1. Time Domain Analysis and Polarization Resistance
3.2. Frequency Domain Analysis and Impedance Spectra
3.3. Scanning Electron Microscope
4. Conclusions
- The comparison between the time and frequency domain analysis of electrochemical noise and the conventional electrochemical methods had good consistency, which indicated that the ENM can well characterize the corrosion rate of the measured system. The electrochemical noise technique can non-destructively obtain parameters similar to the polarization resistance Rp and impedance modulus compared with conventional electrochemical methods. The electrochemical noise technique required less stability than the polarization curves and electrochemical impedance spectroscopy technique, which was more suitable for on-site measurements.
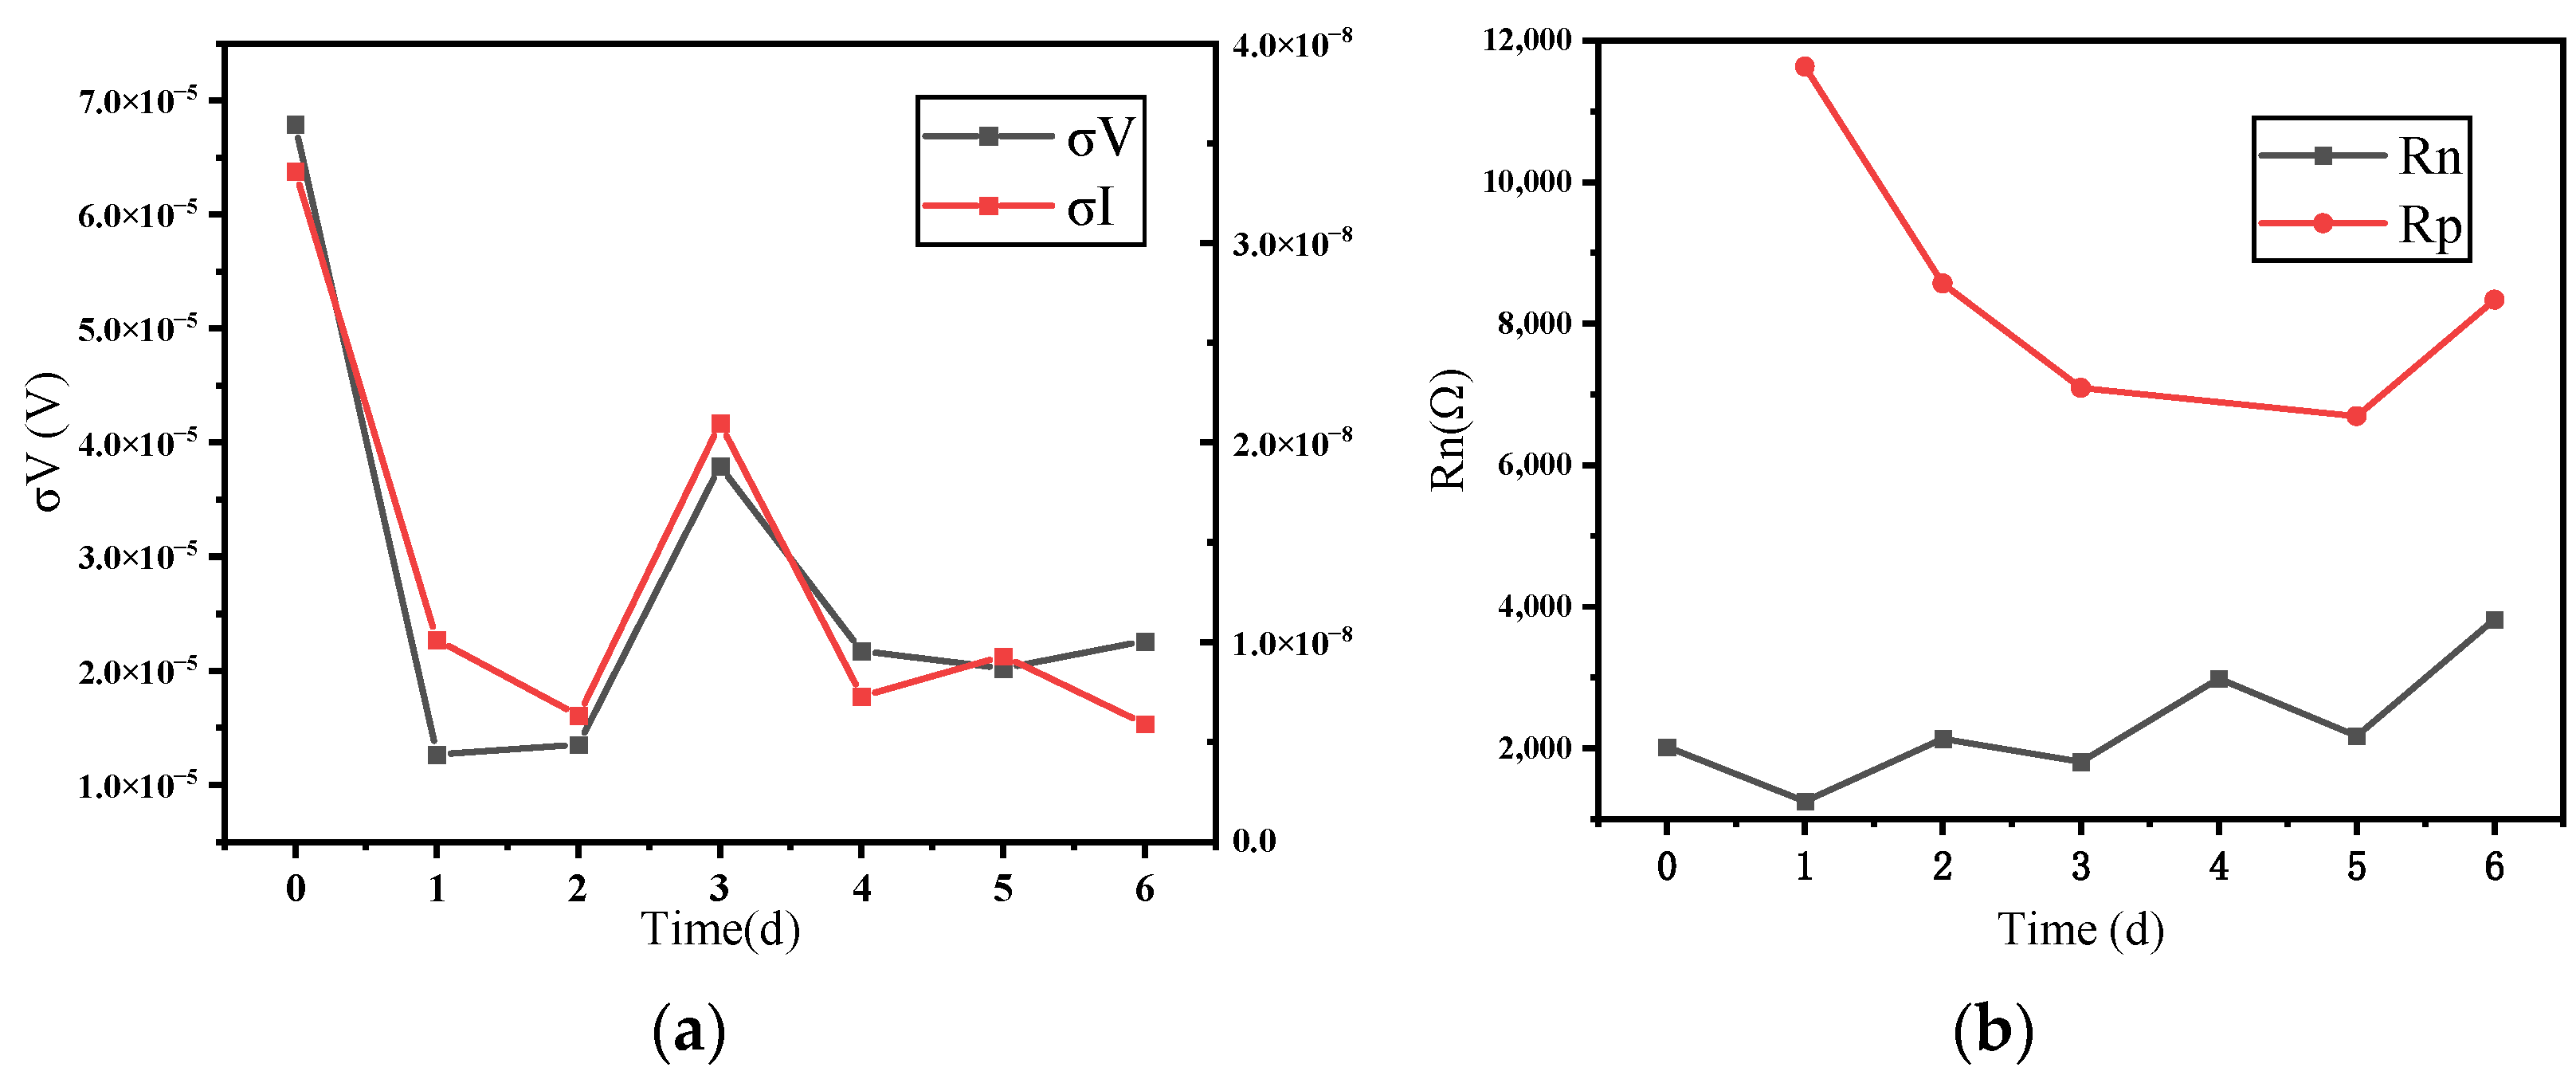
- In the time domain analysis, the σI showed a gradual decrease in the corrosion rate in the blank group and a gradual increase in the corrosion rate in the B72 group, which was consistent with the macroscopic recognition of corrosion. Meanwhile, the noise resistance Rn and polarization resistance Rp showed consistency in trend although they were not exactly the same in value.
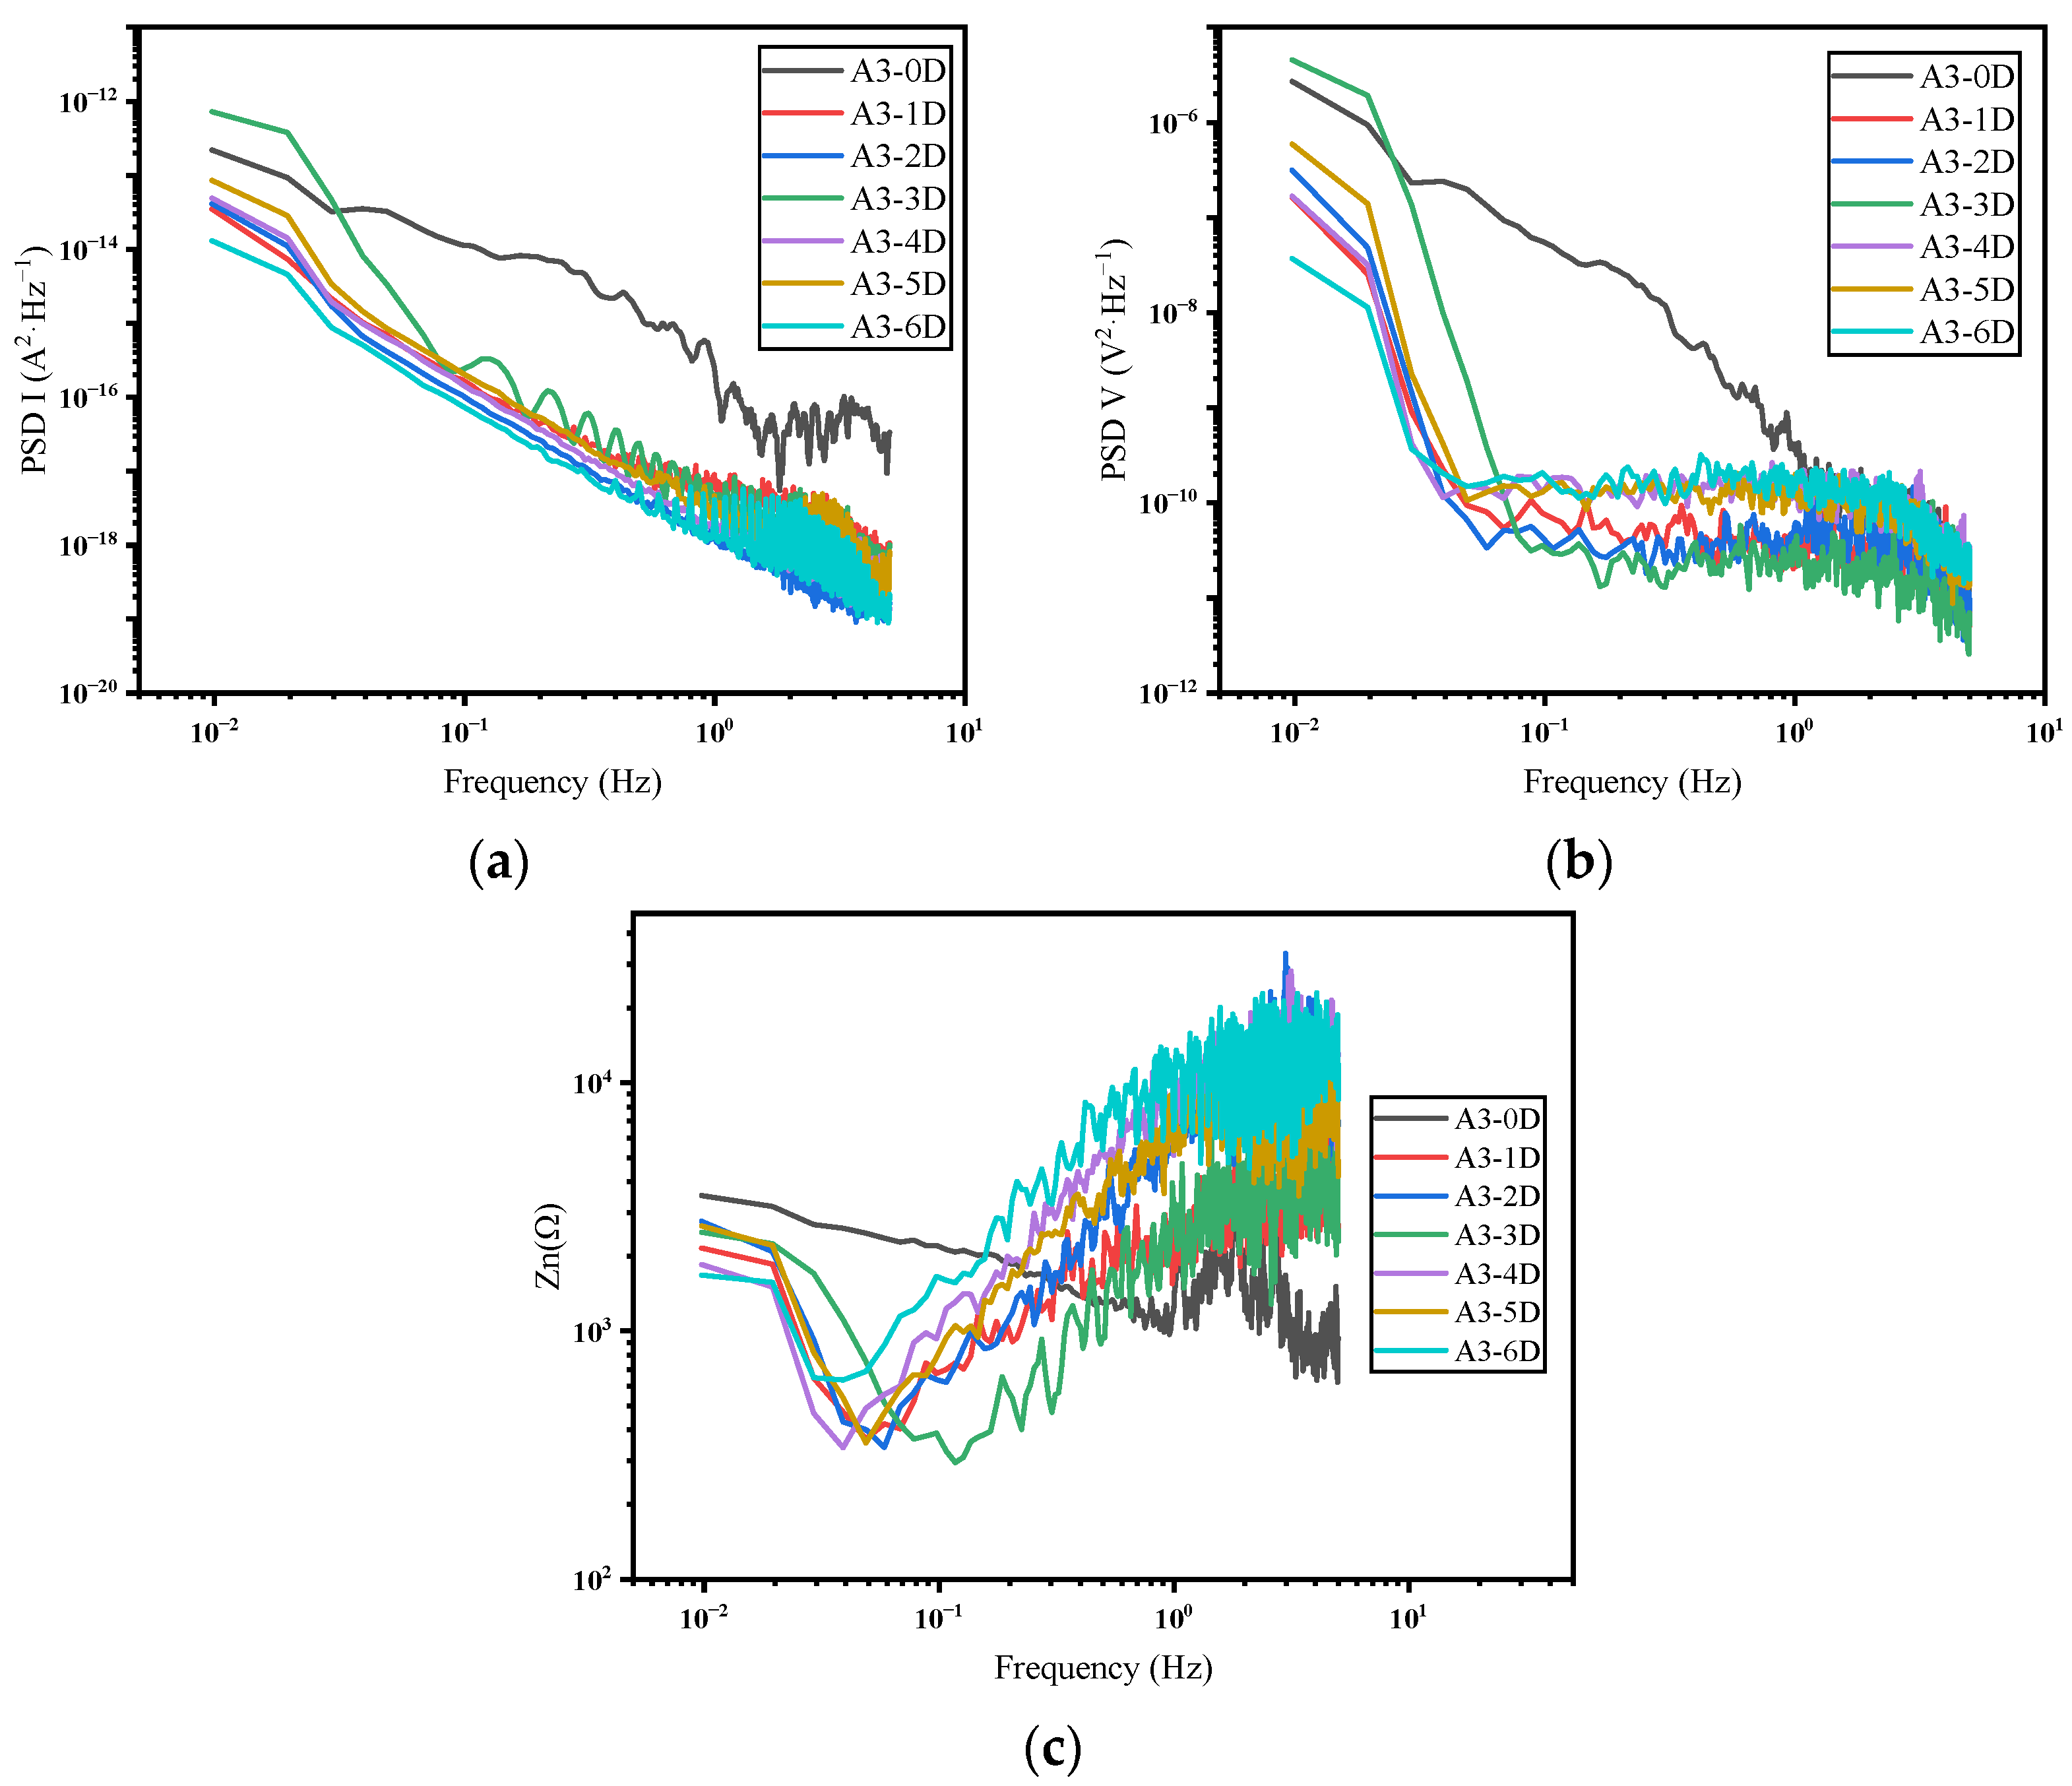
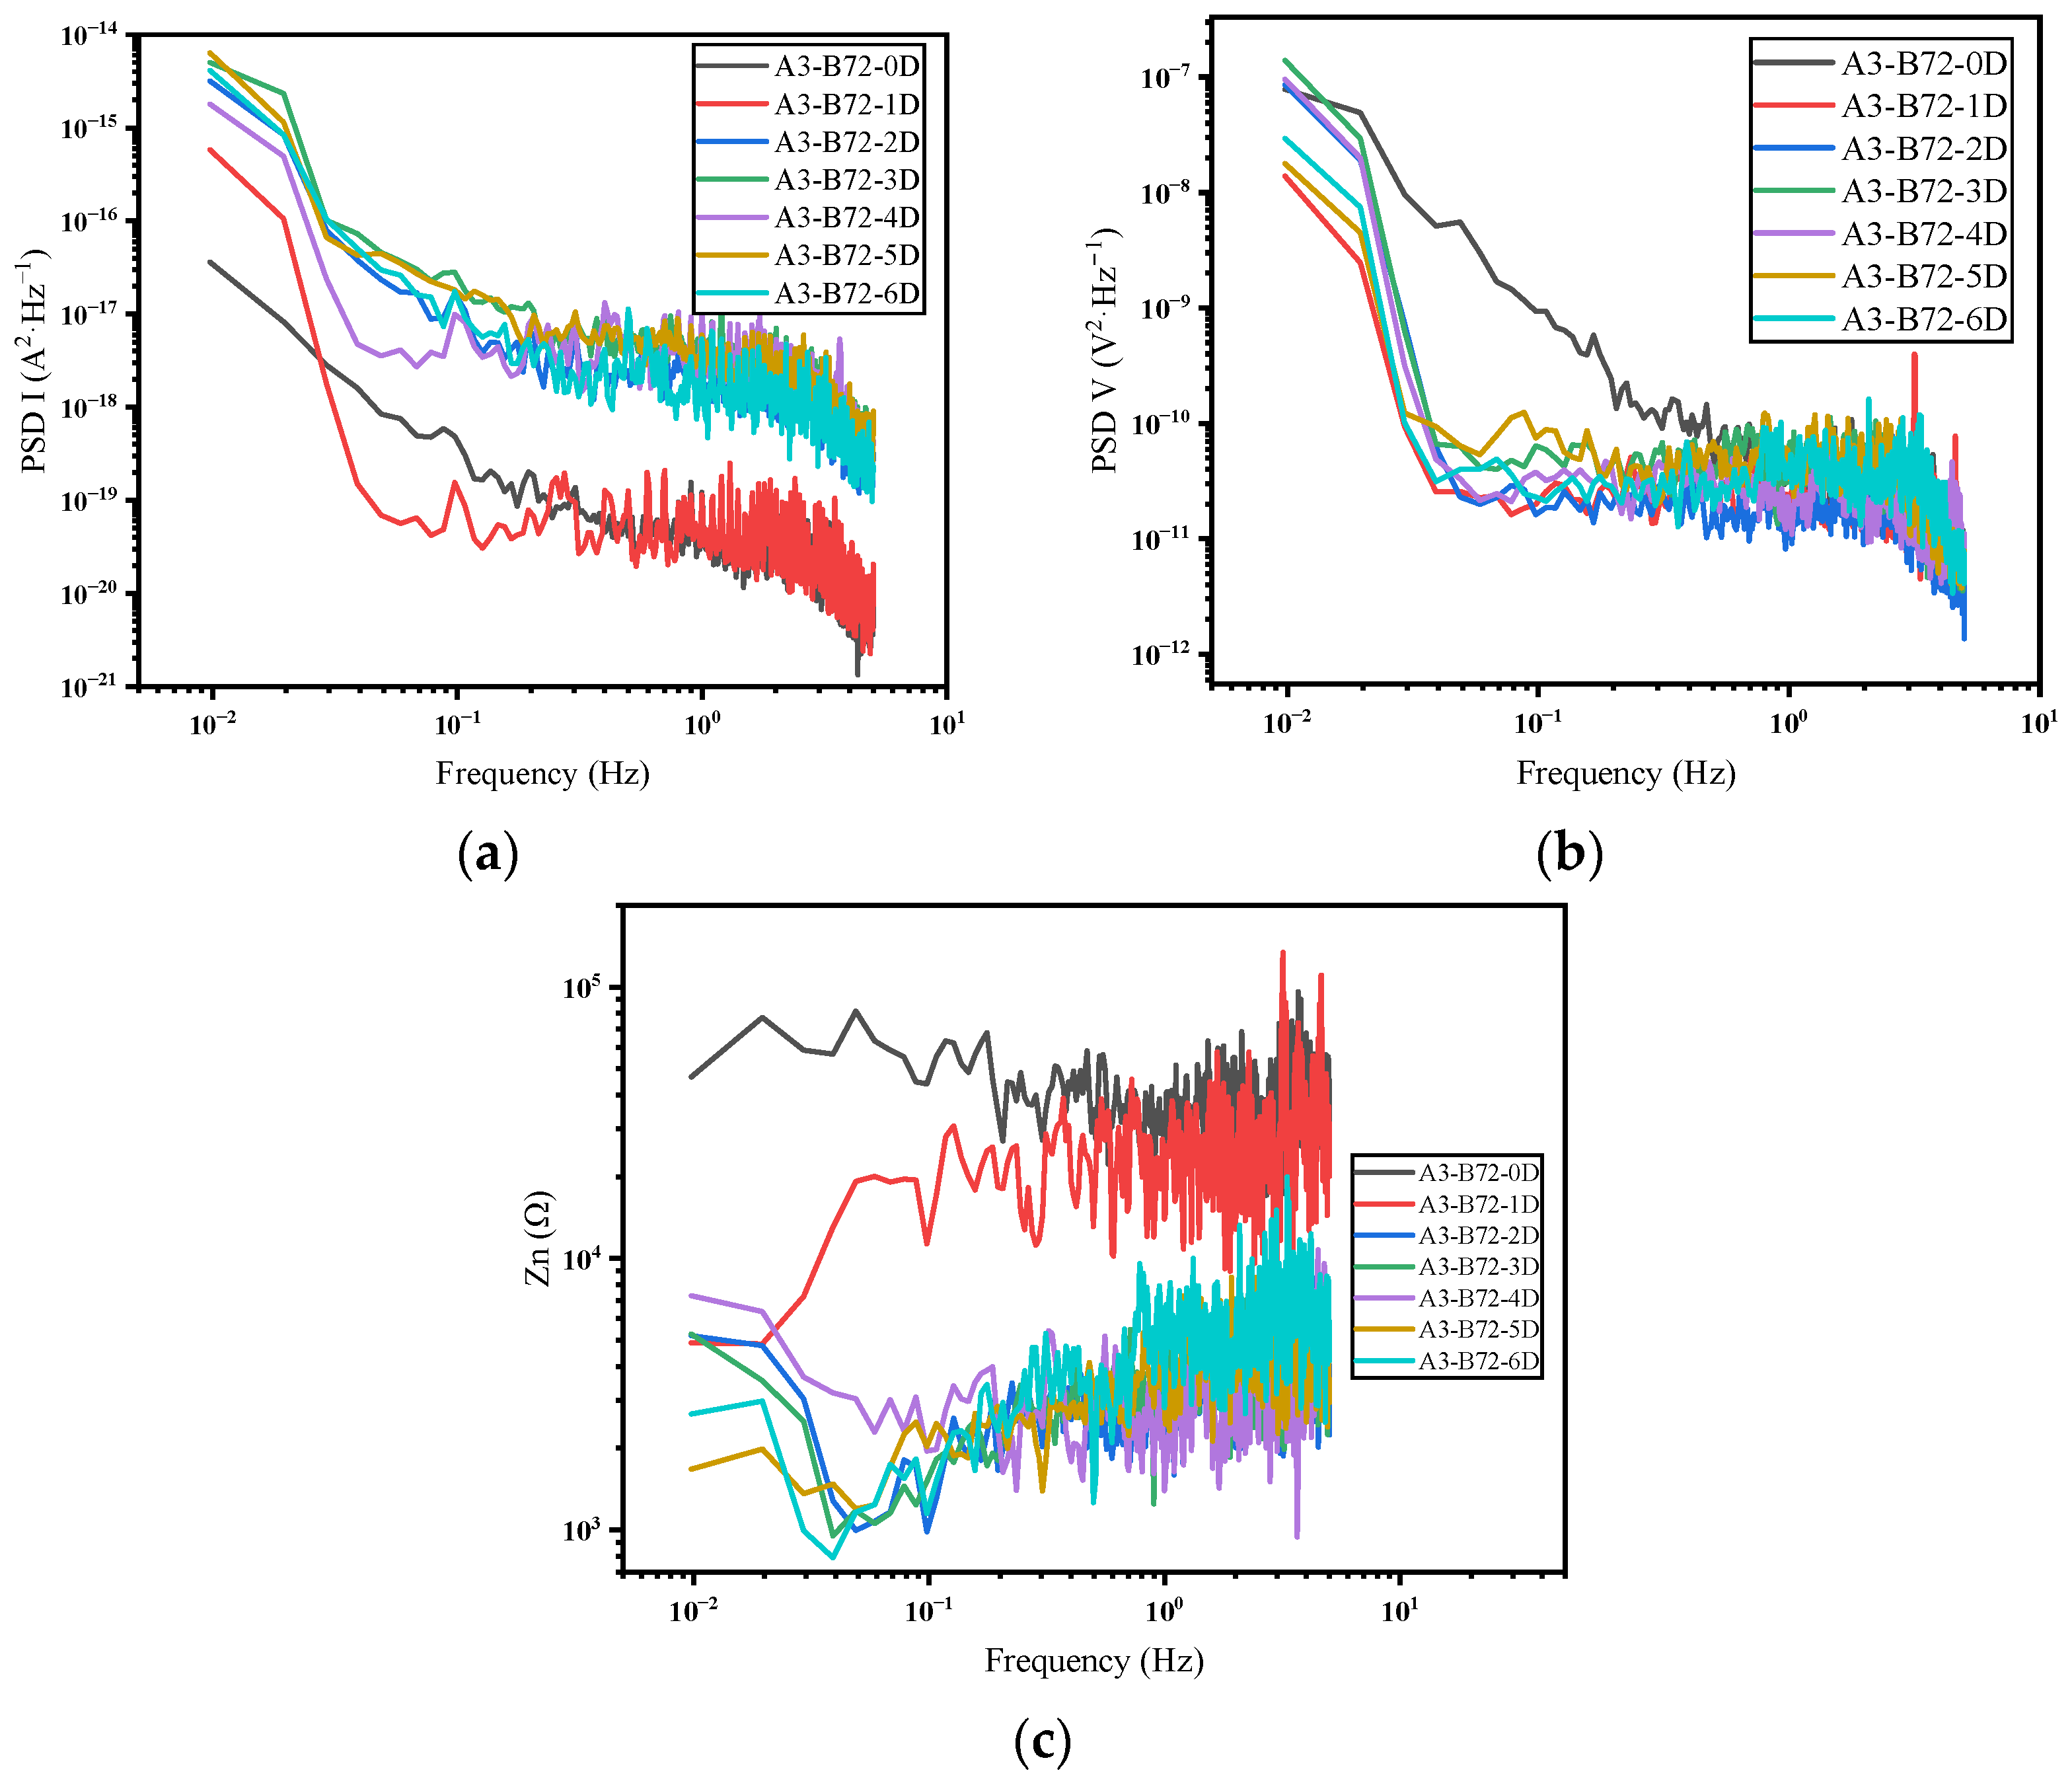
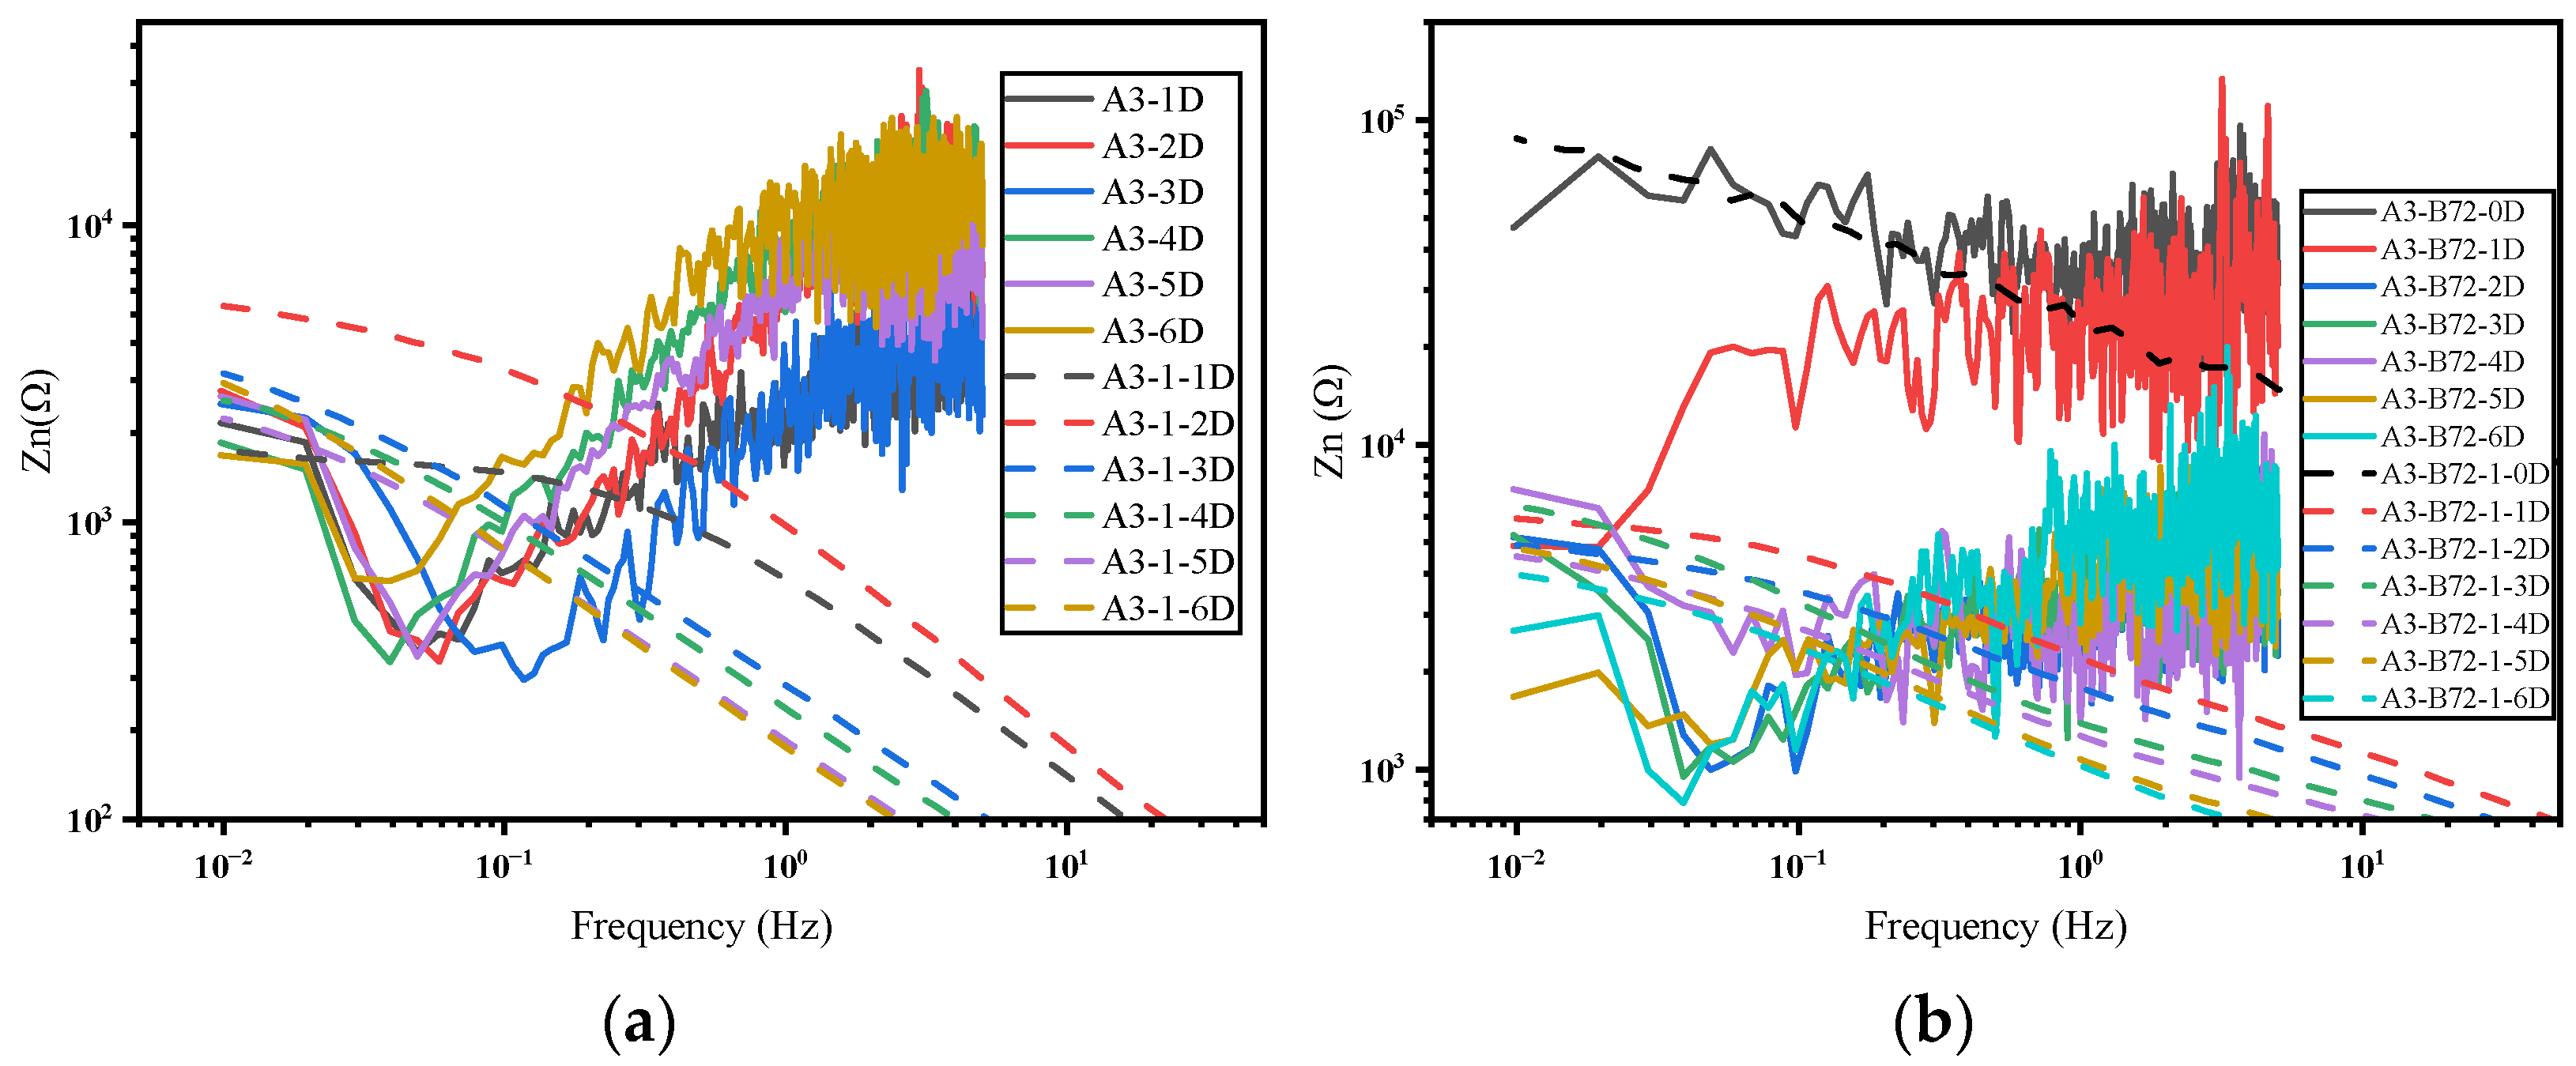
- In the frequency domain analysis, the current PSD can reflect the distribution of the power of the current density at different frequencies, which in turn reflects the corrosion rate of the system. Furthermore, the noise impedance in the low-frequency band and the impedance modulus can match well.
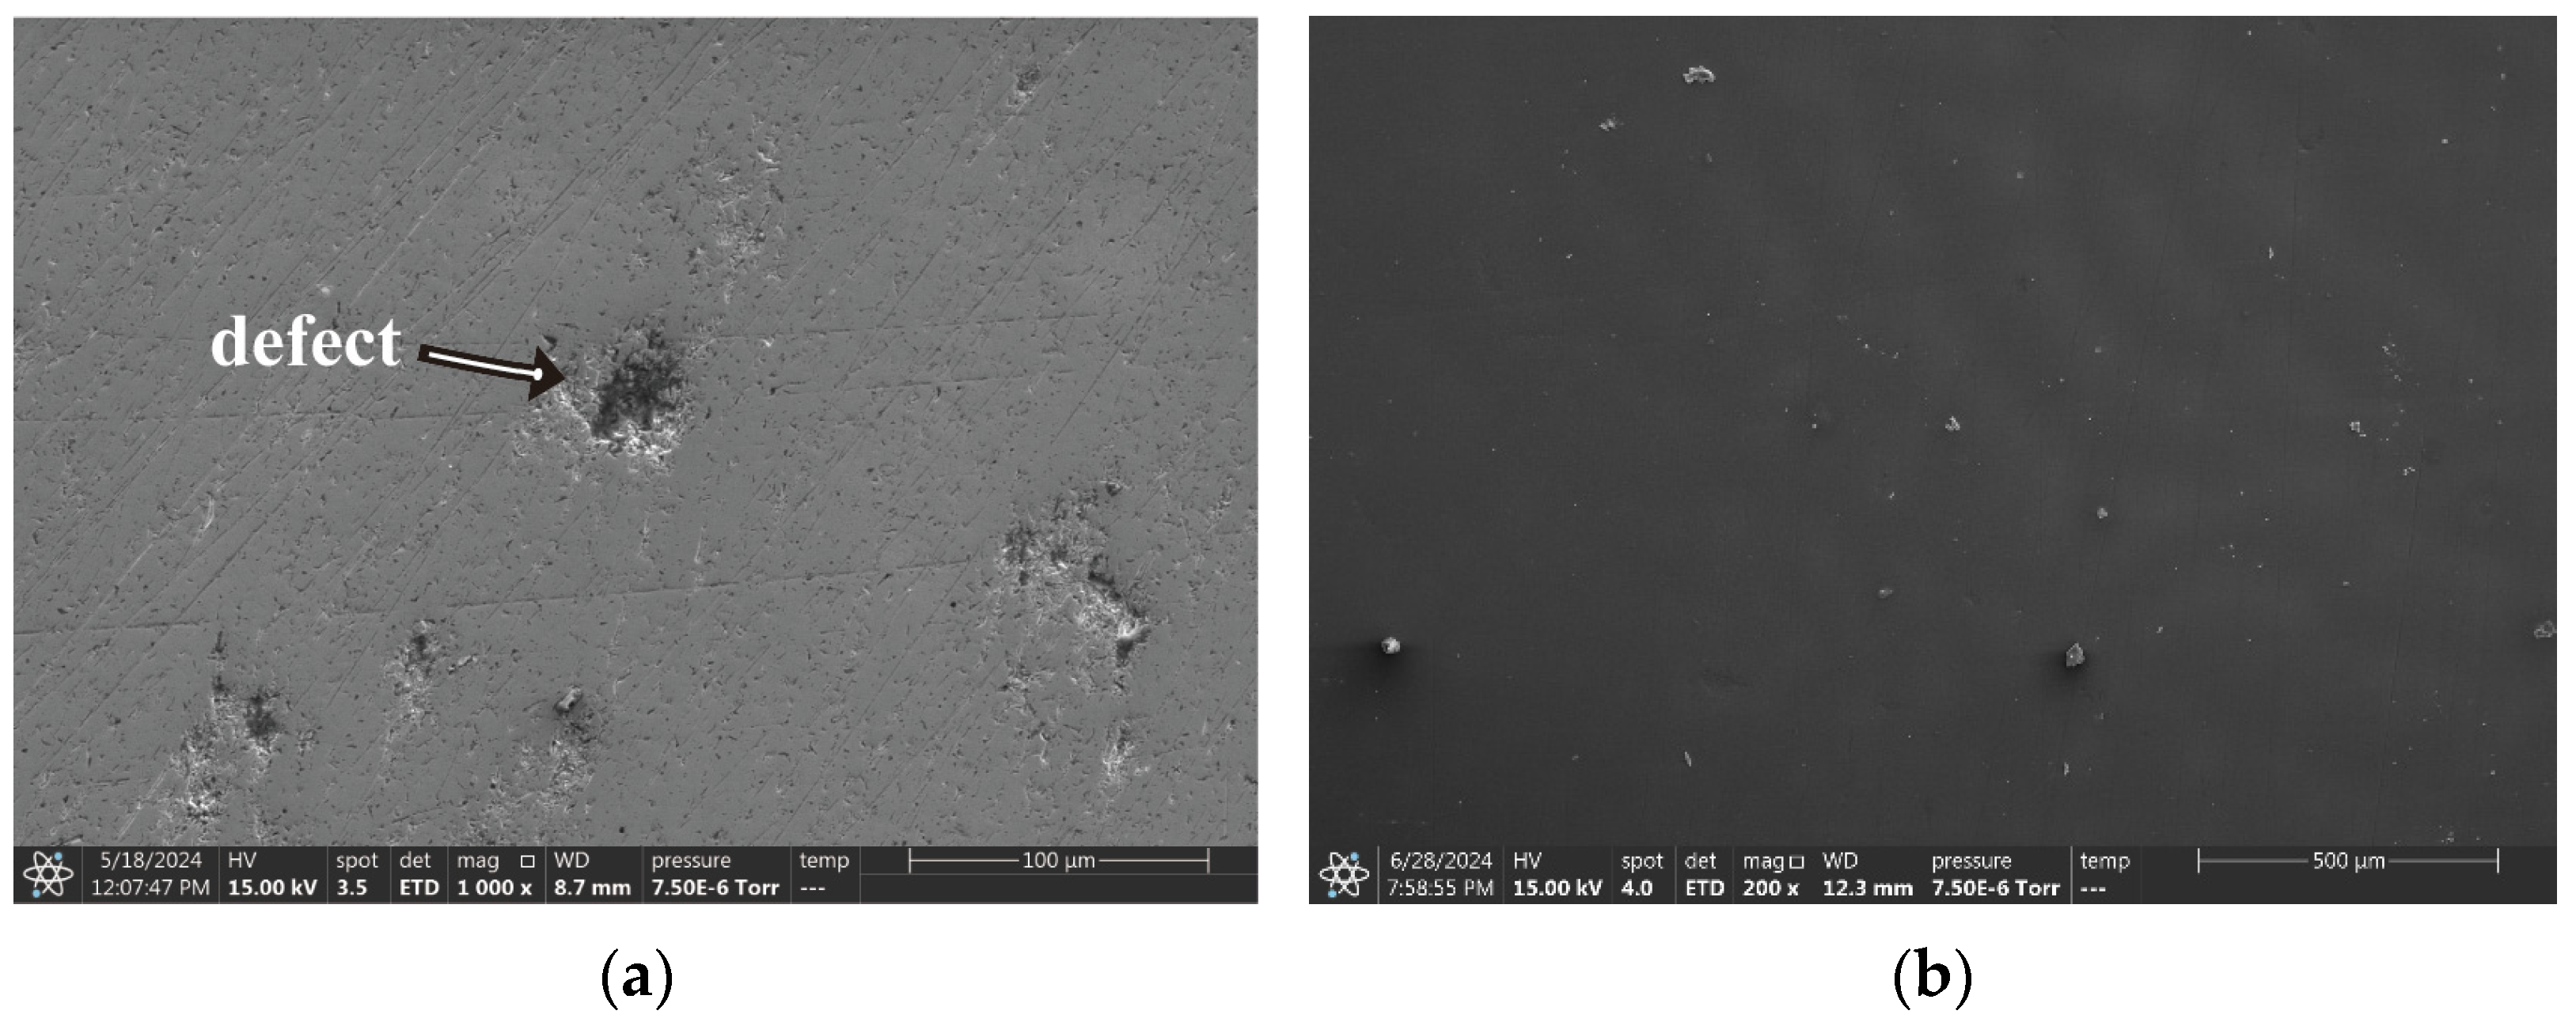
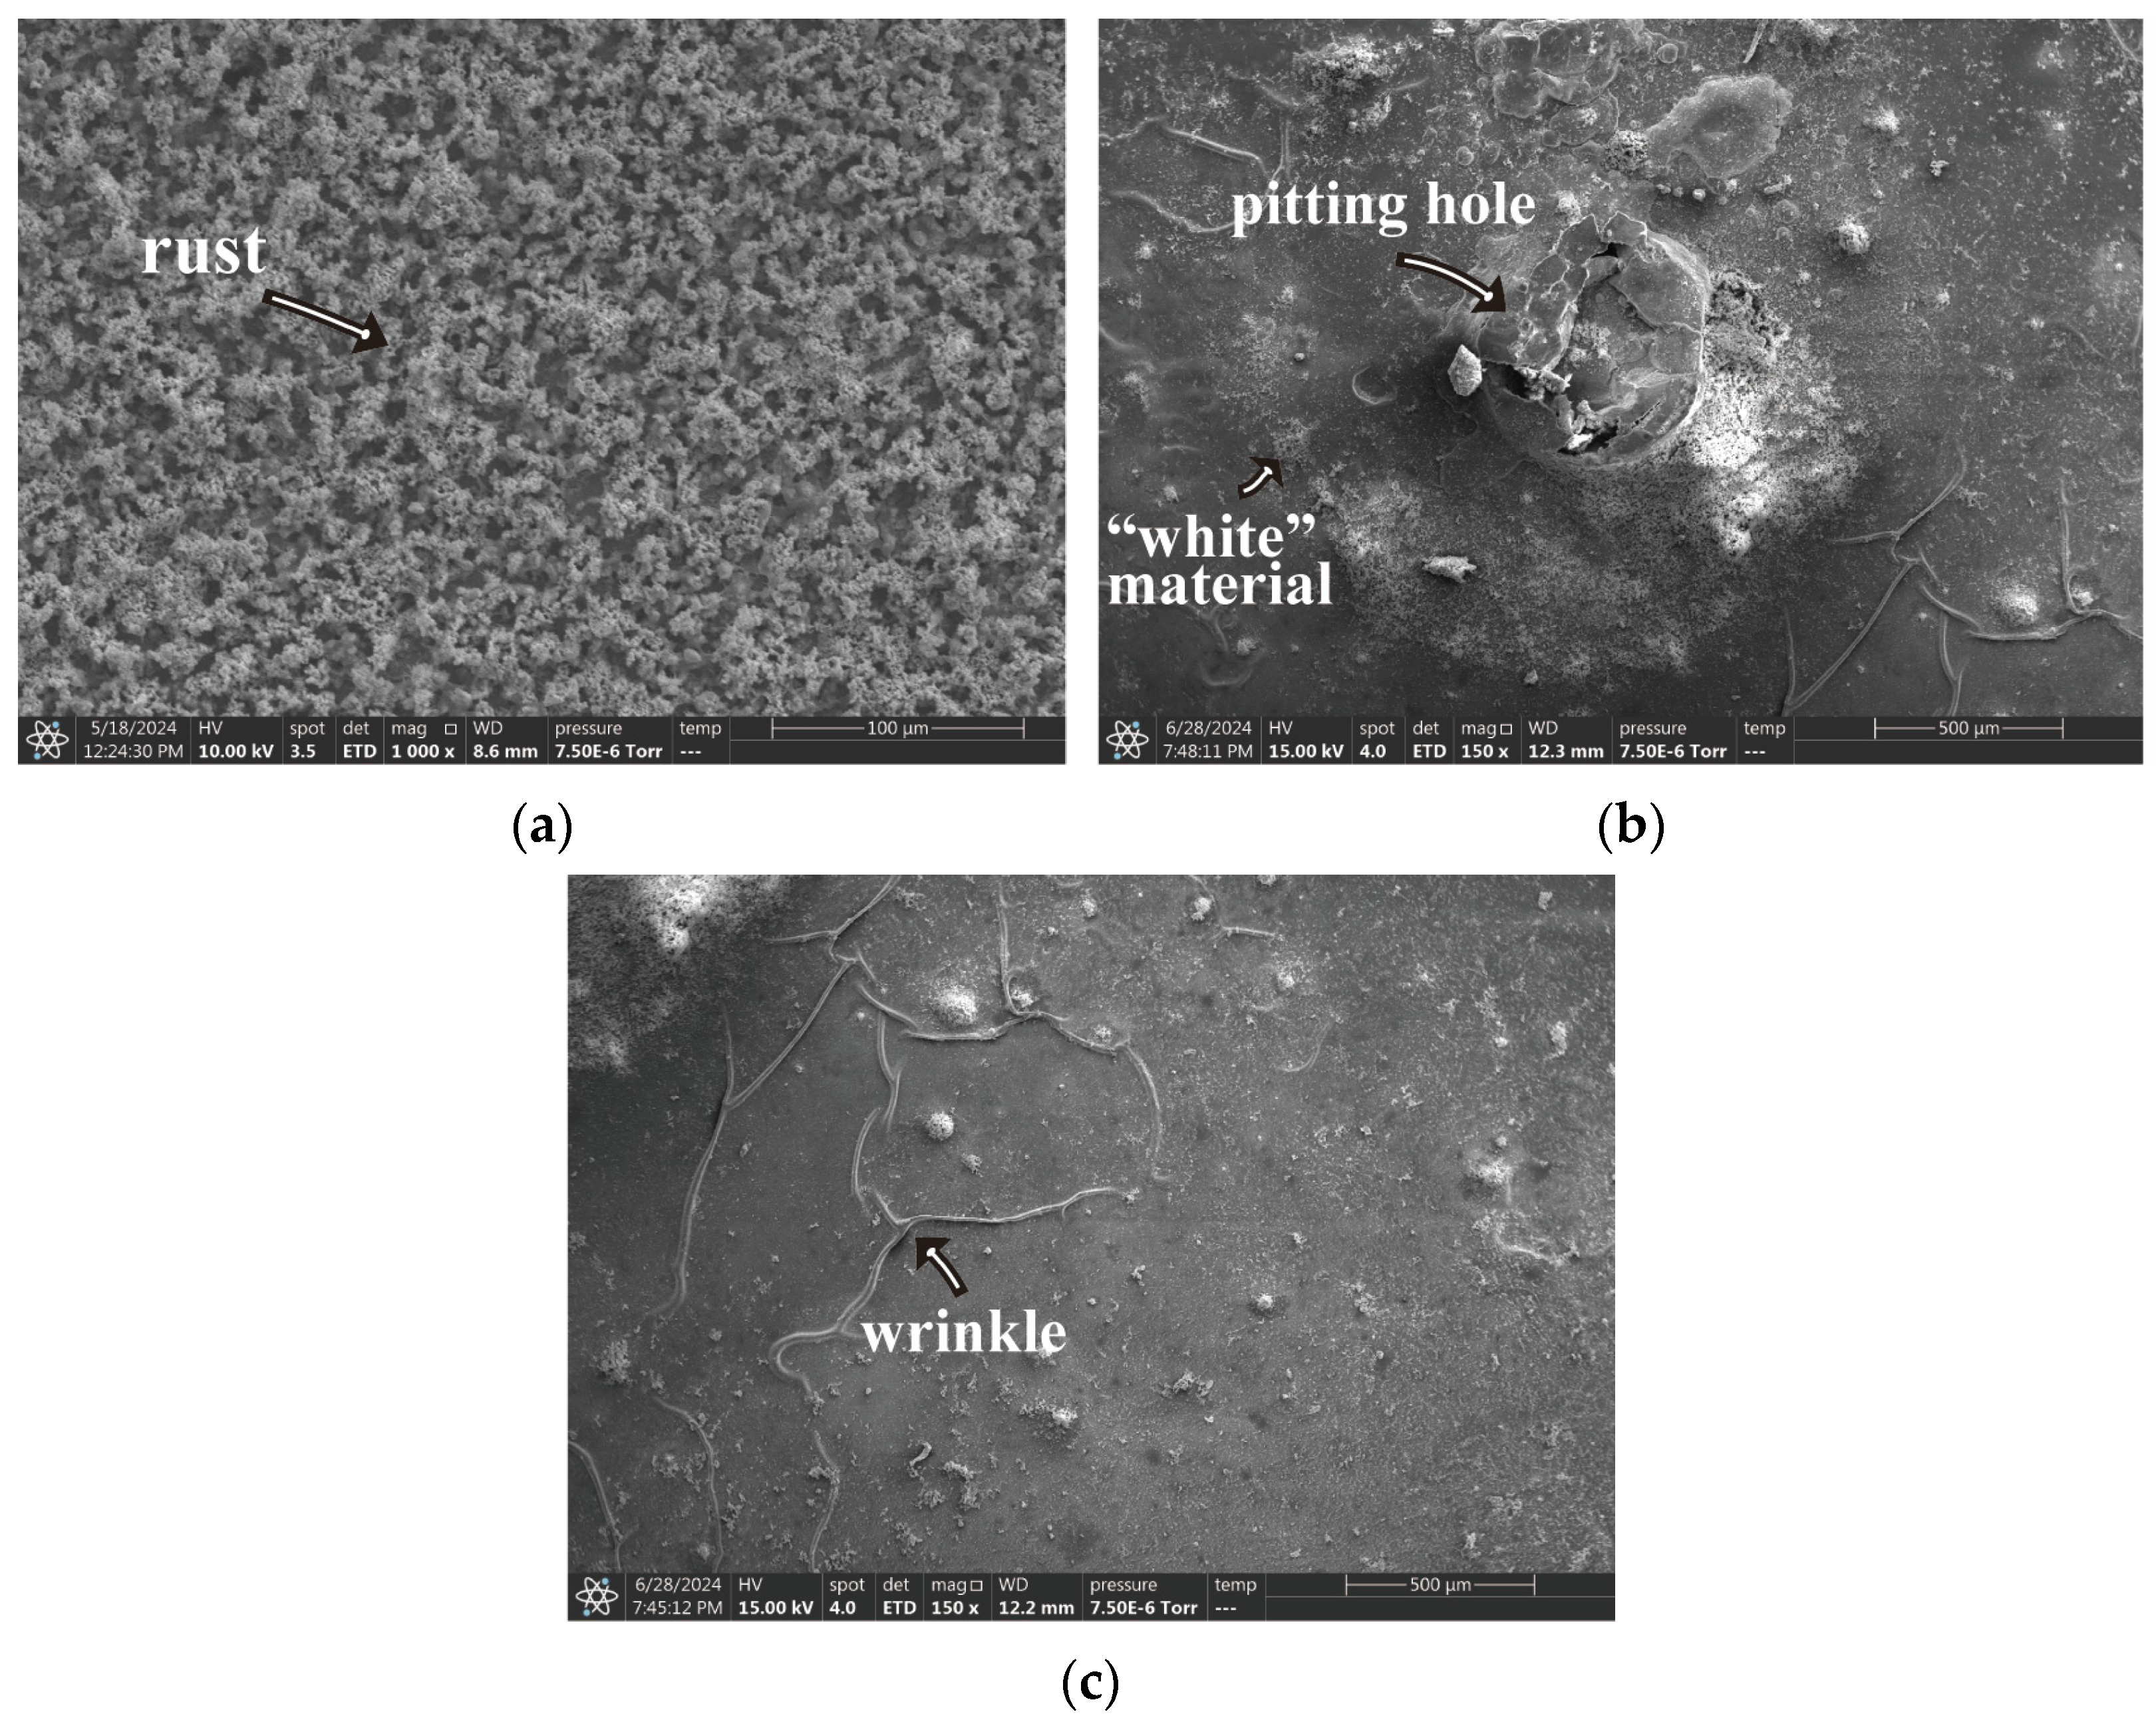
- Regarding the B72 sealing material itself, the sealing coating had a good protective effect on the metal artifacts in the initial stage. Both Rp and impedance modulus or Rn and Zn were higher than that of the blank group, which indicated that B72 had a good inhibition of corrosion but almost lost its effect after a short period (2–3 d) of immersion in a 3.5 wt% NaCl solution. σV decreased while σI increased, indicating that the coating became poorly protective. Electrochemical parameters and morphology observation showed that the B72 material itself had poor water resistance. B72 gradually lost its bond with the substrate when exposed to water. The corrosion generated by the pitting holes destroyed the film and led to the development of corrosion (Figure 15b), and the corrosion proceeded slowly even under an intact film layer (Figure 16). In practical applications, it is necessary to keep the surface to be sealed dry and free of water, and the subsequent preservation needs to control the humidity to avoid the formation of liquid film or liquid droplets on the surface of the object when the humidity is too high.
Author Contributions
Funding
Institutional Review Board Statement
Informed Consent Statement
Data Availability Statement
Conflicts of Interest
References
- Cottis, R.A. Sources of electrochemical noise in corroding systems. Russ. J. Electrochem. 2006, 42, 497–505. [Google Scholar] [CrossRef]
- Liu, H. Corrosion Measurement Technology; Chemical Industry Press: Beijing, China, 2023; p. 316. (In Chinese) [Google Scholar]
- Iverson, W.P. Transient Voltage Changes Produced in Corroding Metals and Alloys. J. Electrochem. Soc. 1968, 115, 617. [Google Scholar] [CrossRef]
- Blanc, G.; Gabrielli, C.; Ksouri, M.; Wiart, R. Experimental-study of Relationships between Electrochemical Noise and Structure of Electrodeposits of Metals. Electrochim. Acta 1978, 23, 337–340. [Google Scholar] [CrossRef]
- Bertocci, U.; Koike, M.; Leigh, S.; Qiu, F.; Yang, G. A Statistical-Analysis of the Fluctuations of the Passive Current. J. Electrochem. Soc. 1986, 133, 1782–1786. [Google Scholar] [CrossRef]
- Eden, D.A.; John, D.G.; Dawson, J.L. Detecting Localised Corrosion of Metallic Surface—By Comparing Test Electrode Coupling Current with Electrochemical Current Noise. Patent WO 8707022-A, 19 November 1987. [Google Scholar]
- Eden, D.A.; Hladky, K.; John, D.G.; Dawson, J.L. Electrochemcial Noise—Simultaneous Monitoring of Potential and Current Noise Signals from Corroding Electrodes. In Proceedings of the Tri-Service Conference on Corrosion, Colorado Springs, CO, USA, 5–7 May 1987. [Google Scholar]
- Hladky, K.; Dawson, J.L. The Measurement of Corrosion Using Electrochemical 1/f Noise. Corros. Sci. 1982, 22, 231–237. [Google Scholar] [CrossRef]
- Hladky, K.; Dawson, J.L. The Measurement of Localized Corrosion Using Electrochemical Noise. Corros. Sci. 1981, 21, 317–322. [Google Scholar] [CrossRef]
- Hladky, K. Monitoring Corrosion of Metal Part Using Voltage Measurements between Part and Electrode. Patent EP 84404-A, 27 July 1983. [Google Scholar]
- Chen, J.F.; Bogaerts, W.F. The Physical Meaning of Noise Resistance. Corros. Sci. 1995, 37, 1839–1842. [Google Scholar] [CrossRef]
- Gusmano, G.; Montesperelli, G.; Pacetti, S.; Petitti, A.; Damico, A. Electrochemical noise resistance as a tool for corrosion rate prediction. Corrosion 1997, 53, 860–868. [Google Scholar] [CrossRef]
- Mansfeld, F.; Xiao, H. Electrochemical Noise-Analysis of Iron Exposed to NaCl Solutions of Different Corrosivity. J. Electrochem. Soc. 1994, 141, 1403–1404. [Google Scholar] [CrossRef]
- Dawson, J.L.; Eden, D.A.; Carr, R.N. Production of Electrochemical Impedance Spectra Uses Spontaneously Occurring Potential Noise between Array of Electrodes to Produce Electrochemical Impedance Spectra. Patent WO 9216825-A1, 1 October 1992. [Google Scholar]
- Bertocci, U.; Gabrielli, C.; Huet, F.; Keddam, M. Noise resistance applied to corrosion measurements: I. Theoretical analysis. J. Electrochem. Soc. 1997, 144, 31–37. [Google Scholar] [CrossRef]
- Bertocci, U.; Gabrielli, C.; Huet, F.; Keddam, M.; Rousseau, P. Noise resistance applied to corrosion measurements: II. Experimental tests. J. Electrochem. Soc. 1997, 144, 37–43. [Google Scholar] [CrossRef]
- Bertocci, U.; Huet, F. Noise resistance applied to corrosion measurements; III. Influence of the instrumental noise on the measurements. J. Electrochem. Soc. 1997, 144, 2786–2793. [Google Scholar] [CrossRef]
- Lei, H. A Review on Electrochemical Noise Analysis. Corros. Prot. 2015, 36, 84–90+94. (In Chinese) [Google Scholar]
- Zhang, T.; Yang, Y.; Shao, Y.; Meng, G.; Wang, F. Advances of the Analysis Methodology for Electrochemical Noise. J. Chin. Soc. Corros. Prot. 2014, 34, 1–18. (In Chinese) [Google Scholar]
- Cottis, R.A.; Al-Awadhi, M.A.A.; Al-Mazeedi, H.; Turgoose, S. Measures for the detection of localized corrosion with electrochemical noise. Electrochim. Acta 2001, 46, 3665–3674. [Google Scholar] [CrossRef]
- Al-Mazeedi, H.A.A.; Cottis, R.A. A practical evaluation of electrochemical noise parameters as indicators of corrosion type. Electrochim. Acta 2004, 49, 2787–2793. [Google Scholar] [CrossRef]
- Sanchez-Amaya, J.M.; Cottis, R.A.; Botana, F.J. Shot noise and statistical parameters for the estimation of corrosion mechanisms. Corros. Sci. 2005, 47, 3280–3299. [Google Scholar] [CrossRef]
- Cerna, M.; Harvey, A.F. The Fundamentals of FFT-Based Signal Analysis and Measurement. Appl. Note 2000, 41, 1–20. [Google Scholar]
- Aballe, A.; Bethencourt, M.; Botana, F.; Marcos, M.; Sanchez-Amaya, J. Use of wavelets to study electrochemical noise transients. Electrochim. Acta 2001, 46, 2353–2361. [Google Scholar] [CrossRef]
- Aballe, A.; Bethencourt, M.; Botana, F.J.; Marcos, M. Using wavelets transform in the analysis of electrochemical noise data. Electrochim. Acta 1999, 44, 4805–4816. [Google Scholar] [CrossRef]
- Aballe, A.; Bethencourt, M.; Botana, F.J.; Marcos, M. Wavelet transform-based analysis for electrochemical noise. Electrochem. Commun. 1999, 1, 266–270. [Google Scholar] [CrossRef]
- Huang, N.E.; Shen, Z.; Long, S.R.; Wu, M.L.C.; Shih, H.H.; Zheng, Q.N.; Yen, N.C.; Tung, C.C.; Liu, H.H. The empirical mode decomposition and the Hilbert spectrum for nonlinear and non-stationary time series analysis. Proc. R. Soc. Math. Phys. Eng. Sci. 1998, 454, 903–995. [Google Scholar] [CrossRef]
- Homborg, A.M.; van Westing, E.P.M.; Tinga, T.; Zhang, X.; Oonincx, P.J.; Ferrari, G.M.; de Wit, J.H.W.; Mol, J.M.C. Novel time-frequency characterization of electrochemical noise data in corrosion studies using Hilbert spectra. Corros. Sci. 2013, 66, 97–110. [Google Scholar] [CrossRef]
- Shi, W.; Dong, Z.; Guo, X. Analysis of Electrochemical Noise by Hilbert-Huang Transform and Its Application. J. Chin. Soc. Corros. Prot. 2014, 34, 138–146. (In Chinese) [Google Scholar]
- Girija, S.; Mudali, U.K.; Raju, V.R.; Dayal, R.K.; Khatak, H.S.; Raj, B. Determination of corrosion types for AISI type 304L stainless steel using electrochemical noise method. Mater. Sci. Eng. Struct. Mater. Prop. Microstruct. Process. 2005, 407, 188–195. [Google Scholar] [CrossRef]
- Li, Y.; Cai, Z.X.; Huang, L.J.; Liao, R.Q. A Comparative Study of the Corrosion Behavior of P110 Casing Steel in Simulated Concrete Liquid Containing Chloride and Annulus Fluid from an Oil Well. Coatings 2024, 14, 294. [Google Scholar] [CrossRef]
- Jáquez-Muñoz, J.M.; Gaona-Tiburcio, C.; Chacón-Nava, J.; Cabral-Miramontes, J.; Nieves-Mendoza, D.; Maldonado-Bandala, E.; Delgado, A.D.; Flores-De los Rios, J.P.; Bocchetta, P.; Almeraya-Calderón, F. Electrochemical Corrosion of Titanium and Titanium Alloys Anodized in H2SO4 and H3PO4 Solutions. Coatings 2022, 12, 325. [Google Scholar] [CrossRef]
- Jamali, S.S.; Mills, D.J.; Sykes, J.M. Measuring electrochemical noise of a single working electrode for assessing corrosion resistance of polymer coated metals. Prog. Org. Coat. 2014, 77, 733–741. [Google Scholar] [CrossRef]
- Jamali, S.S.; Zhao, Y.; Gao, Z.; Li, H.; Hee, A.C. In situ evaluation of corrosion damage using non-destructive electrochemical measurements-A case study. J. Ind. Eng. Chem. 2016, 43, 36–43. [Google Scholar] [CrossRef]
- Jamali, S.S.; Mills, D.J.; Cottis, R.A.; Lan, T.Y. Analysis of electrochemical noise measurement on an organically coated metal. Prog. Org. Coat. 2016, 96, 52–57. [Google Scholar] [CrossRef]
- Xia, D.-H.; Song, Y.; Song, S.; Behnamian, Y.; Xu, L.; Wu, Z.; Qin, Z.; Gao, Z.; Hu, W. Identifying defect levels in organic coatings with electrochemical noise (EN) measured in Single Cell (SC) mode. Prog. Org. Coat. 2019, 126, 53–61. [Google Scholar] [CrossRef]
- Barrera, P.R.; Gómez, F.J.R.; Ochoa, E.G. Assessing of New Coatings for Iron Artifacts Conservation by Recurrence Plots Analysis. Coatings 2019, 9, 12. [Google Scholar] [CrossRef]
- Wang, H. Cultural Relics Preservation; Cultral Relics Press: Beijing, China, 2009. (In Chinese) [Google Scholar]
- Jia, M.; Hu, P.; Hu, G. Stabilization and Protection of Catechins on Simulated Archaeological Iron. Corros. Prot. 2022, 43, 1–7. (In Chinese) [Google Scholar]
- Teng, F.; Jing, Y.; Hu, G. Research of Compound Volatile Corrosion Inhibitors for Cast Iron Relics. J. Chin. Soc. Corros. Prot. 2015, 35, 265–270. (In Chinese) [Google Scholar]
- Rui, S.; Shao, S.; Li, Z.; Zhan, Y. Study on preparation and anticorrosion of silane sealing film on carbon steel. New Chem. Mater. 2019, 47, 267–271. (In Chinese) [Google Scholar]
- Lv, J.; Yue, Q.-X.; Ding, R.; Wang, X.; Gui, T.-J.; Zhao, X.-D. The Application of Electrochemical Noise for the Study of Metal Corrosion and Organic Anticorrosion Coatings: A Review. Chemelectrochem 2021, 8, 337–351. [Google Scholar] [CrossRef]
- Mills, D.J.; Mabbutt, S. Investigation of defects in organic anti-corrosive coatings using electrochemical noise measurement. Prog. Org. Coat. 2000, 39, 41–48. [Google Scholar] [CrossRef]
- Mabbutt, S.; Mills, D.J.; Woodcock, C.P. Developments of the electrochemical noise method (ENM) for more practical assessment of anti-corrosion coatings. Prog. Org. Coat. 2007, 59, 192–196. [Google Scholar] [CrossRef]
- Wang, R.; Tian, X.-l.; Jia, Z. Study and Application of Sealing Materials for Copper Cultural Relics. Total Corros. Control 2020, 34, 20–27+98. (In Chinese) [Google Scholar] [CrossRef]
- Huang, K.; Ma, Q.-l. The Conservation and Restoration Technology of Chinese Cultural Relics; Science Press: Beijing, China, 2009; p. 789. (In Chinese) [Google Scholar]
- Davis, S.L.; Roberts, C.; Poli, A. Paraloid® B-72/B-48N 1:1 as an Adhesive for Use in Hot Climates: Literature Review, Laboratory Testing, and Observational Field Study. Stud. Conserv. 2022, 67, 357–365. [Google Scholar] [CrossRef]
- Koob, S.P. The use of Paraloid B-72 as an adhesive: Its application for archaeological ceramics and other materials. Stud. Conserv. 1986, 31, 7–14. [Google Scholar] [CrossRef]
- Luo, X.-Y.; Chen, J.; Lu, Y.; Wu, L.; Fang, S.; Zhang, W.; Xu, W.; Gong, Y. Emergency preservation of ivory artifacts unearthed from Fuquan Hill. Sci. Conserv. Archaeol. 2012, 24, 33–40. (In Chinese) [Google Scholar]
- Han, K.; Teri, G.; Cheng, C.; Tian, Y.; Huang, D.; Ge, M.; Fu, P.; Luo, Y.; Li, Y. Evaluation of commonly used reinforcement materials for color paintings on ancient wooden architecture in China. Herit. Sci. 2024, 12, 122. [Google Scholar] [CrossRef]
- Yang, L.; Wang, L.; Wang, P.; Tang, l.; Wang, F.; Huang, J. Investigation of photo-stability of acrylic polymer Paraloid B72 used for conservation. Sci. Conserv. Archaeol. 2007, 19, 54–58. (In Chinese) [Google Scholar] [CrossRef]
- Wang, L.Q.; Yang, L.; Dang, G.C.; Zhao, J.; Liang, G.Z. A study on the anti-photoageing property of the modified B72 as a relic protection material. J. Northwest Univ. Nat. Sci. Ed. 2006, 36, 761–764. (In Chinese) [Google Scholar]
- Jamali, S.S.; Mills, D.J. A critical review of electrochemical noise measurement as a tool for evaluation of organic coatings. Prog. Org. Coat. 2016, 95, 26–37. [Google Scholar] [CrossRef]
- Jamali, S.S.; Mills, D. An assessment of intrinsic noise of pseudo-reference electrodes and instrumental noise to enable reliable electrochemical noise measurements in situ on organically coated metal. Electrochim. Acta 2021, 398, 139279. [Google Scholar] [CrossRef]
- Lentka, Ł.; Smulko, J. Methods of trend removal in electrochemical noise data—Overview. Measurement 2019, 131, 569–581. [Google Scholar] [CrossRef]
- Skerry, B.S.; Eden, D.A. Characterization of Coatings Performance Using Electrochemical Noise-Analysis. Prog. Org. Coat. 1991, 19, 379–396. [Google Scholar] [CrossRef]
- Comas, C.; Huet, F.; Ngo, K.; Fregonese, M.; Idrissi, H.; Normand, B. Corrosion propagation monitoring using electrochemical noise measurements on carbon steel in hydrogenocarbonated solution containing chloride ions. Corros. Sci. 2021, 193, 109885. [Google Scholar] [CrossRef]
- Ritter, S.; Huet, F.; Cottis, R.A. Guideline for an assessment of electrochemical noise measurement devices. Mater. Corros.-Werkst. Korros. 2012, 63, 297–302. [Google Scholar] [CrossRef]
- Huet, F.; Ngo, K. Electrochemical Noise-Guidance for Improving Measurements and Data Analysis. Corros. J. Sci. Eng. 2019, 75, 1065–1073. [Google Scholar] [CrossRef] [PubMed]
- Xia, D.-H.; Song, S.; Behnamian, Y.; Hu, W.; Cheng, Y.F.; Luo, J.-L.; Huet, F. Review—Electrochemical Noise Applied in Corrosion Science: Theoretical and Mathematical Models towards Quantitative Analysis. J. Electrochem. Soc. 2020, 167, 081507. [Google Scholar] [CrossRef]
- Monticelli, C.; Brunoro, G.; Frignani, A.; Trabanelli, G. Evaluation of Corrosion-Inhibitors by Electrochemical Noise-Analysis. J. Electrochem. Soc. 1992, 139, 706–711. [Google Scholar] [CrossRef]
- Legat, A.; Dolecek, V. Corrosion Monitoring-System based on Measurement and Analysis of Electrochemical Noise. Corrosion 1995, 51, 295–300. [Google Scholar] [CrossRef]
- Cheng, Y.F.; Luo, J.L.; Wilmott, M. Spectral analysis of electrochemical noise with different transient shapes. Electrochim. Acta 2000, 45, 1763–1771. [Google Scholar] [CrossRef]
- Monrrabal, G.; Huet, F.; Bautista, A. Electrochemical noise measurements on stainless steel using a gelled electrolyte. Corros. Sci. 2019, 148, 48–56. [Google Scholar] [CrossRef]


Disclaimer/Publisher’s Note: The statements, opinions and data contained in all publications are solely those of the individual author(s) and contributor(s) and not of MDPI and/or the editor(s). MDPI and/or the editor(s) disclaim responsibility for any injury to people or property resulting from any ideas, methods, instructions or products referred to in the content. |
© 2024 by the authors. Licensee MDPI, Basel, Switzerland. This article is an open access article distributed under the terms and conditions of the Creative Commons Attribution (CC BY) license (https://creativecommons.org/licenses/by/4.0/).
Share and Cite
Xu, H.; Jia, M.; Hu, P.; Liu, S.; Hu, G. The Evaluation and Analysis of the Anti-Corrosion Performance of the Sealing Material B72 for Metal Artifacts Based on Electrochemical Noise. Coatings 2024, 14, 1190. https://doi.org/10.3390/coatings14091190
Xu H, Jia M, Hu P, Liu S, Hu G. The Evaluation and Analysis of the Anti-Corrosion Performance of the Sealing Material B72 for Metal Artifacts Based on Electrochemical Noise. Coatings. 2024; 14(9):1190. https://doi.org/10.3390/coatings14091190
Chicago/Turabian StyleXu, Hao, Minghao Jia, Pei Hu, Shengyu Liu, and Gang Hu. 2024. "The Evaluation and Analysis of the Anti-Corrosion Performance of the Sealing Material B72 for Metal Artifacts Based on Electrochemical Noise" Coatings 14, no. 9: 1190. https://doi.org/10.3390/coatings14091190
APA StyleXu, H., Jia, M., Hu, P., Liu, S., & Hu, G. (2024). The Evaluation and Analysis of the Anti-Corrosion Performance of the Sealing Material B72 for Metal Artifacts Based on Electrochemical Noise. Coatings, 14(9), 1190. https://doi.org/10.3390/coatings14091190