Abstract
Slow-release fertilizer was developed by encapsulating NPK compound pellets with graphene oxide (GO) sheets employing a waterless synthesis technique. As-prepared GO sheets were characterized by XRD, Raman, XPS, FTIR, SEM, and EDS. The XRD patterns of the GO sheets indicate that the peak for the GO is observed at 2θ = 9.3°, and the peak (002) for graphite vanished. Moreover, a higher intensity ratio of the Raman ID/IG of the GO sheets than that of pristine graphite confirms the oxidation of the graphite. The FTIR and XPS analyses provided information on electronic structure, chemical structure, and oxygen-bonding neighbors. The SEM images indicated the GO sheet, whereby its morphology resembles a thin curtain or corrugated shape. The EDS spectrum of coated GO-F pellets revealed the distribution of C, O, N, P, and K elements in the synthesized materials. Afterwards, GO shell formation on fertilizer pellets greatly improved the slow-release characteristics of fertilizer, thus providing plants with their requisite nutrients and reducing environmental pollution.
1. Introduction
Crop production is impacted by extreme weather conditions, causing chemical fertilizers to be used in excessive and disproportionate quantities to raise crop yields. However, this practice has no benefits in terms of ensuring crop yield and nutritional quality. It carries the risk of environmental pollution and soil acidification, which also poses a threat to food security [1]. According to a Ministry of Agriculture and Rural Affairs of the People’s Republic of China survey in 2017, China’s fertilizer use rate of 328.5 kg/ha is much higher than the world average (120 kg/ha) [2,3]. Hence, reducing the use of chemical fertilizers and maintaining high-yielding crops are long-term goals of the Chinese government. In addition, another problem associated with traditional fertilizers is their fast dissolution in soil compared to their rate in plant absorption. This leads to fertilizer loss and contamination of the surrounding environment. Consequently, to enhance the delivery efficiency of nutrients to crops and minimize the harmful effects on the environment with the goal to make agricultural production more efficient, resilient, and sustainable, it is crucial to accelerate the development of new materials and innovative technologies [4].
In order to improve the efficiency of fertilizer use and reduce environmental issues caused by its application, slow-release fertilizer (SRF) has been developed. This type of high-efficiency fertilizer reduces nutrient loss and enhances utilization efficiency through the slow release of nutrient elements through diffusion, dissolution, or other mechanisms [5]. SRF can be categorized into coated and non-coated types according to their release mechanisms. Coated SRF is a substrate with a coating that physically separates the nutrient from the soil [6], allowing for gradual diffusion or release after the coating breaks. On the other hand, non-coated SRF achieves its effect by reducing solubility in water through different combinations of fertilizer and slow-release material. In particular, coated fertilizer significantly improves slow-release effectiveness compared to chemical fertilizer. In water, the release time of coated SRF is 20–30 times longer than that of uncoated fertilizer [7]. Compared with non-coated fertilizer, coated fertilizer can enhance nitrogen utilization efficiency and reduce nitrogen loss. In the present technology, coated SRF uses synthetic polymer coatings [8], such as polyolefin and polyvinylidene chloride. But these coatings are difficult to degrade, leading to accumulation over time, which usually necessitates the use of either organic solvents or toxic polymerization initiators, or requires time-consuming and complex procedures, which not only increase the costs of production but also lead to health issues [9]. Furthermore, the majority of SH-based synthetic polymers, including poly (acrylic acid), poly (acrylamide), and copolymer, are non-biodegradable and contribute to environmental pollution [10]. Therefore, research into the development of coated SRFs, green fertilizers that can regulate the nutrient release rate, meet the nutrient requirements of a variety of crops at different growth stages through a single application, have a straightforward manufacturing process, and are environmentally benign, represents a significant area of interest within the field of new fertilizers.
Graphene oxide (GO) is a unique material with excellent chemical properties, adsorption capacity, and biocompatibility. It has a 2D structure, large surface area (2600 m2/g) [11], cost-effective production, and the ability to interact directly with different biomolecules and nanoparticles. Moreover, its structure is enriched by various functional groups, including epoxy-functional (–CH (O) CH–), hydroxyl (–OH), carboxyl (–COOH), and ester (–COO–) groups [12,13], making it an ideal substrate for functionalization processes. GO finds applications in several fields. In optics, the optical properties of GO are governed by the functionalization of surfaces and play a pivotal role in tailoring their optical properties [14]. In catalysis, GO’s inherent functional groups enable it to accelerate chemical reactions, which benefits sectors such as energy production and environmental applications [15]. In biomedical applications, the functionalization of GO’s carboxyl groups also demonstrates GO’s promise in creating enzyme electrodes that can be used in biomedicine and clinical diagnostics [12]. In the agriculture field, the application of GO-based nanomaterials was shown to improve the efficiency of agrochemicals through targeted delivery and slow-release action and to promote plant growth and development in the soil environment [16]. Safikhan et al. (2017) [17] showed GO NPs in agricultural crop improvement. Soil-based graphene oxide treatment significantly enhanced the physicochemical qualities of the soil. Lalwani et al. (2014) [18] showed that lignin peroxidase (ligninolytic enzyme released from white-rot fungi) can effectively degrade GO in the soil, and then turn it into a completely harmless product, thus avoiding secondary pollution of the environment. In Silybum marianum, a study showed that graphene oxide use increased chlorophyll content and RWC and improved the growth potential and yield of plants [4]. These studies confirmed the potential application of GO as a slow-release fertilizer; however, the preparation methods of GO employed as either the KClO3-based Brodie [19] and Staudenmaier [20] method or the KMnO4-based Hummers [21] method have been the three primary routes for synthesizing graphite oxide, which all depend on the homogeneous reactions of graphite with mixed strong oxidants [22]. While the Hummers method has advantages over the technique of Brodie and Staudenmaier, there are some practical issues that must be resolved, such as long reaction time, security risks, difficult quality control, and a large amount of acid liquid waste [23]. Consequently, the cost of synthesis and processing was still too high as a coating material on the surface of fertilizer, limiting its application in agriculture.
Therefore, we aim to find a green, safe, and economical way to prepare GO for employment as a coating material. In this paper, a novel waterless synthesis method is presented for the GO sheet as a slow-release fertilizer coating material. The slow-release performance and evaluation of the prepared GO-F were analyzed and can also provide a theoretical basis for the further development of GO-Fs with high efficiency, a simple process, and reduced environmental pollution.
2. Materials and Methods
2.1. Materials
Fine flakes of graphite (99% carbon basis, 600 mesh particle size (≥90%)) were purchased from Gongyi Baichuan Environmental Protection Engineering Co., Ltd. (Henan, China), and fully dried in an oven at 80 °C for 24 h before use. Concentrated sulfuric acid (98 wt.%, H2SO4), phosphoric acid (85 wt.%, H3PO4), potassium permanganate (KMnO₄), hydrogen peroxide (30 wt.%, H2O2), and ethanol (99 wt.%, C2H6O) were from purchased Guangzhou Chemical Reagent Factory (Guangzhou, China), Damao Chemical Reagent Factory (Tianjin, China), Yien Chemical Technology Co., Ltd. (Tianjin, China), and Fengchuan Chemical Reagent Co., Ltd. (Shanghai, China), respectively. All the chemicals are analytical grade, and their solutions were prepared using deionized water (18.2 MΩ) from Dongguan Chaojing Water Treatment Technology Co., Ltd., Dongguan, China.
2.2. Synthesis of GO Material
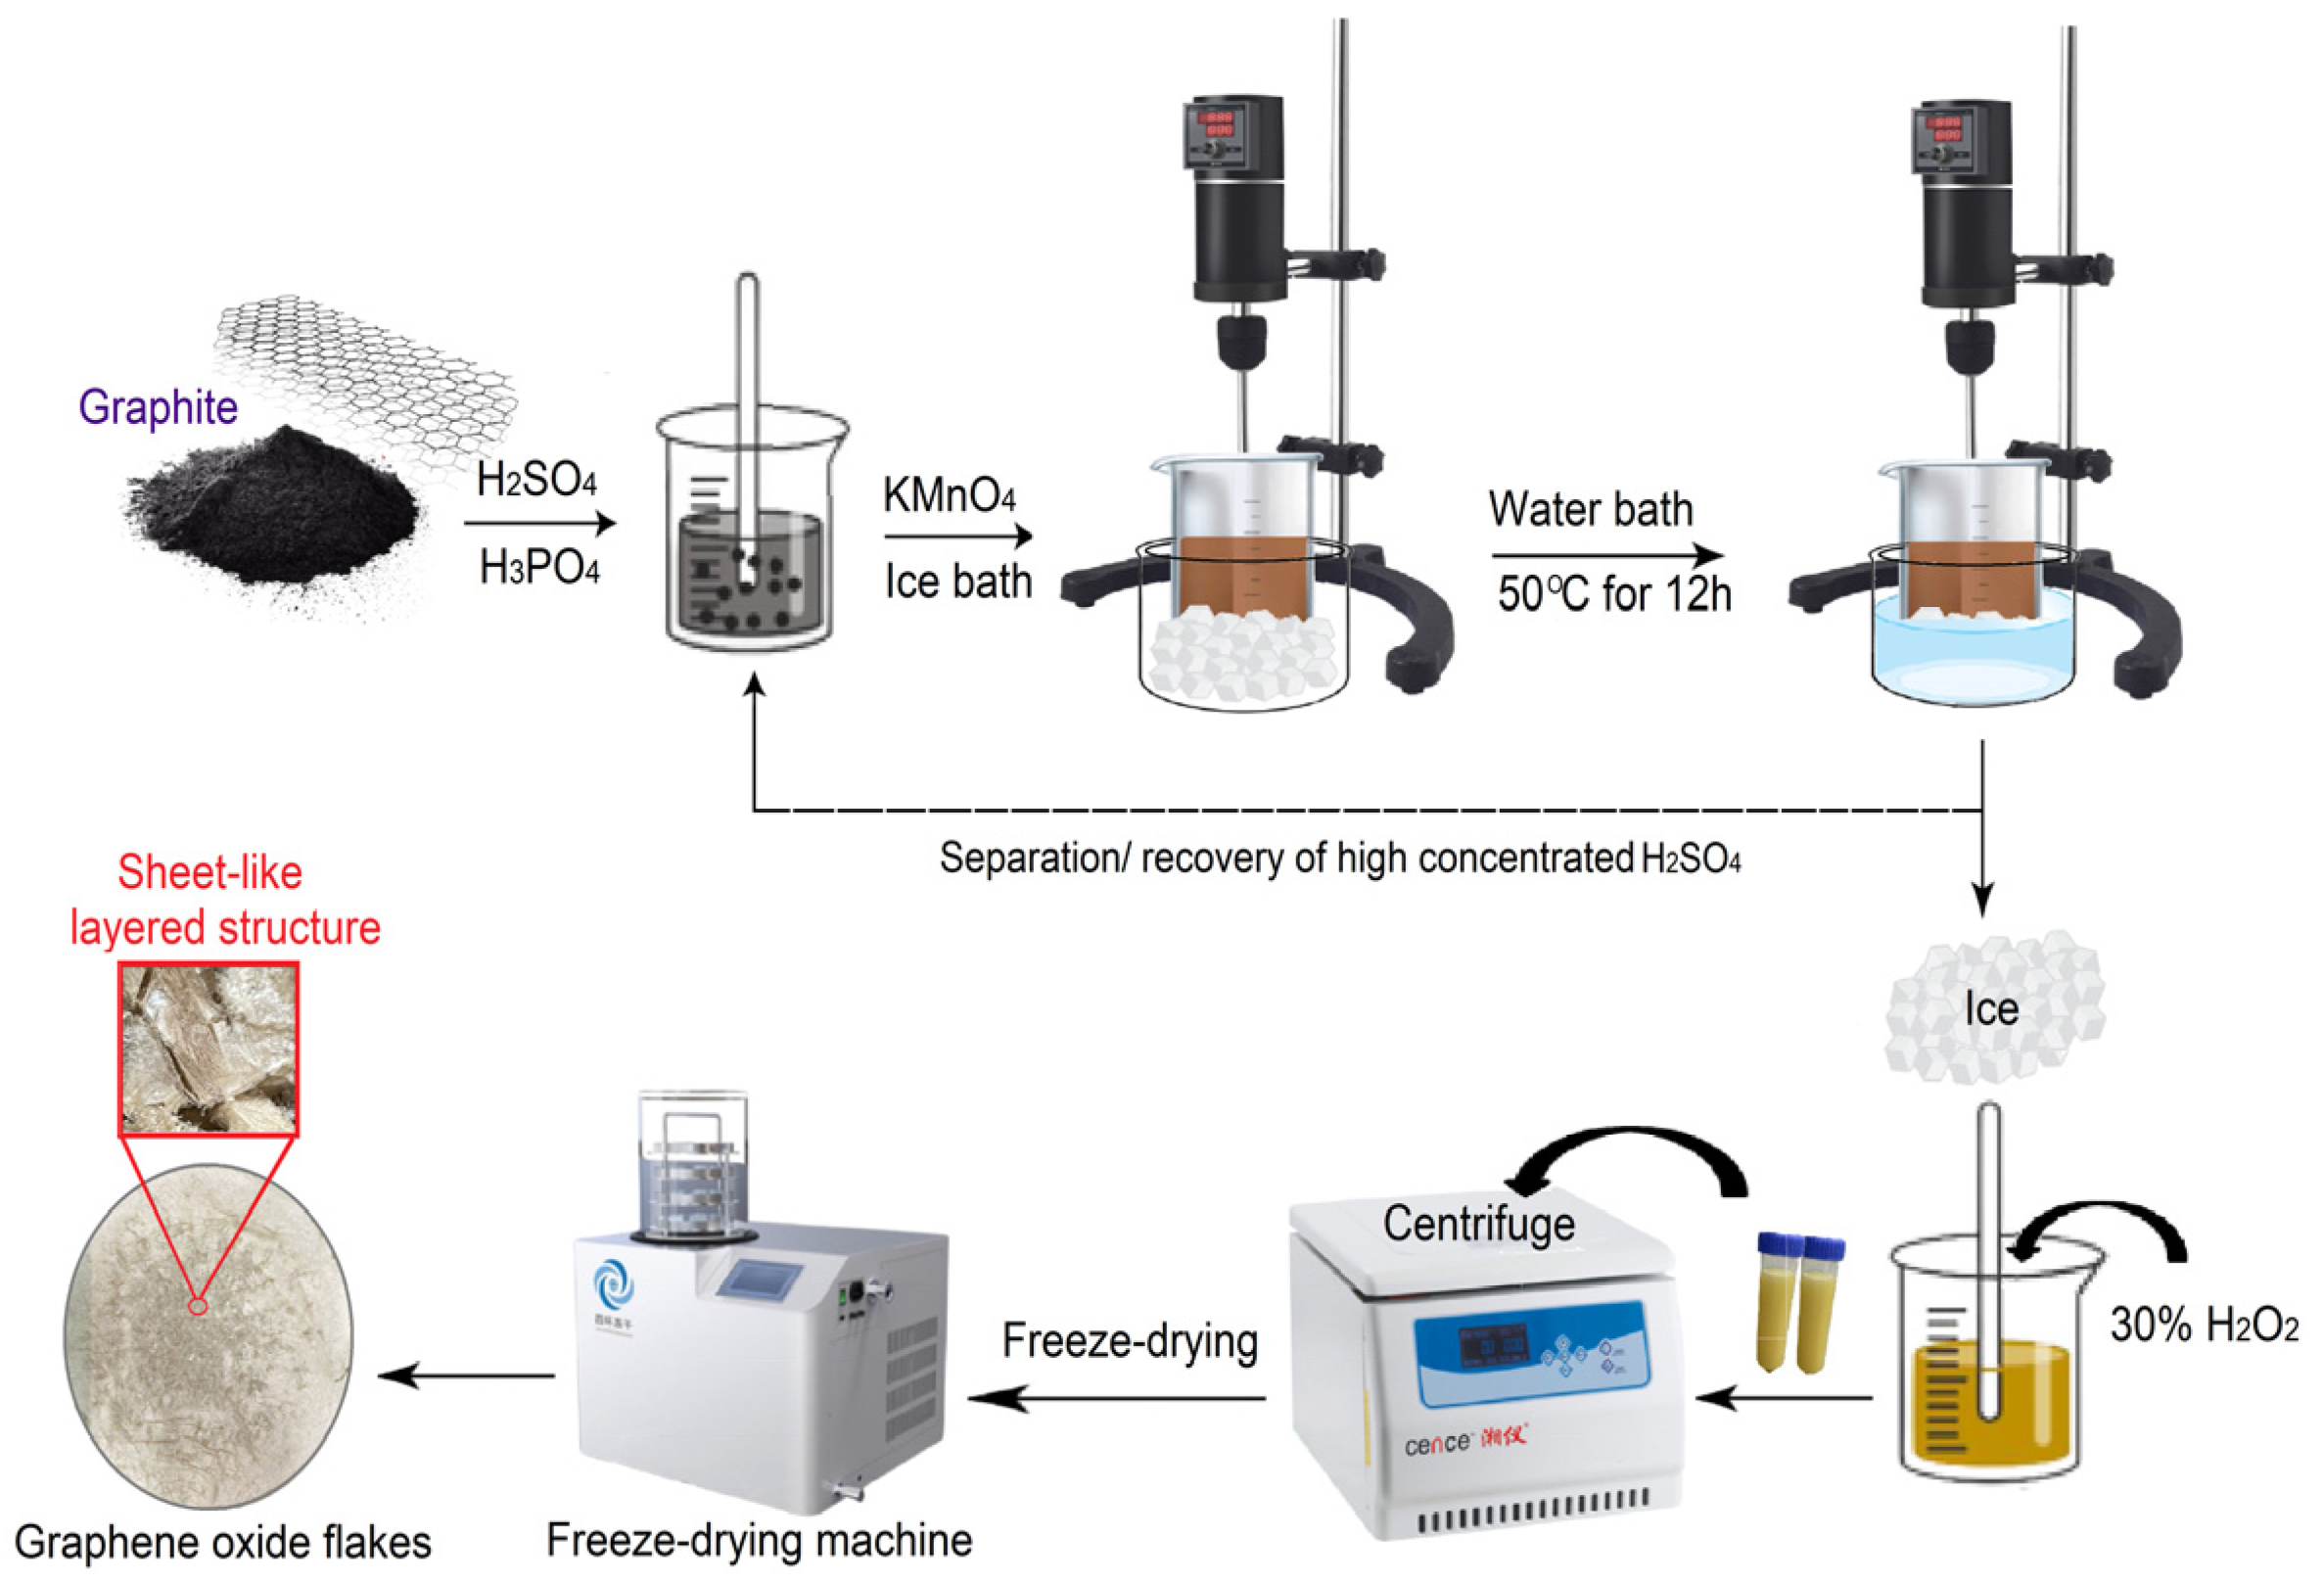
The waterless synthesis of GO was achieved by modification of the improved Hummer’s method and preparing the sample of GO. The advantage of this method is the fact that the oxidation process does not require the addition of additional deionized water. After the reaction was completed, the GO product was immediately separated from the acid solution. The concentrated H2SO4 is recovered for future use. A total of 2 g of graphite powder was added into a mixture of concentrated H2SO4 and H3PO4 with a volume ratio of 9:1 (81:9 mL) [24], then put into a 500 mL flask for mechanical stirring (300 rpm) in an ice bath, followed by the gradual addition of KMnO4 (13 g) to keep the temperature of the suspension below 20 °C. The reaction mixture was then heated to 50 °C and mixed by mechanical stirring for 12 h. Thereafter, the reaction mixture was cooled down to room temperature, also to recover the sulfuric acid for further use. One subsequent addition of H2O2 (3 mL) stopped the oxidation process and the color of the reaction mixture changed to bright yellow, indicating a high oxidation level of graphite. After this process, centrifugation was performed to separate the precipitate from the liquid, and the deionized water was added until a neutral pH was reached. Following this process, centrifugation (4500 rpm) and repeated washing with deionized water and ethanol until the supernatant became neutralized to prevent any inorganic ion sedimentation was conducted. The obtained GO solution was freeze-dried for two days to obtain the GO sheet material. The process of GO sheet material synthesization is illustrated in Figure 1.
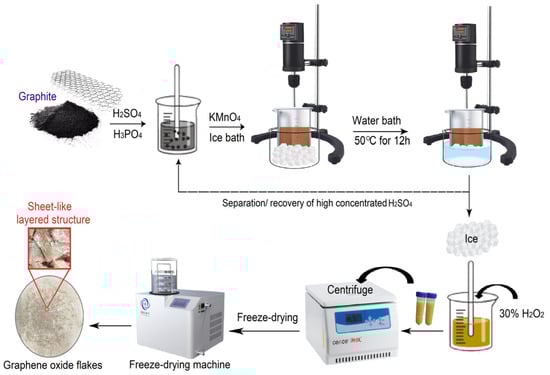
Figure 1.
Schematic of GO material synthesis.
2.3. Preparation of GO-Coated Fertilizer Particles
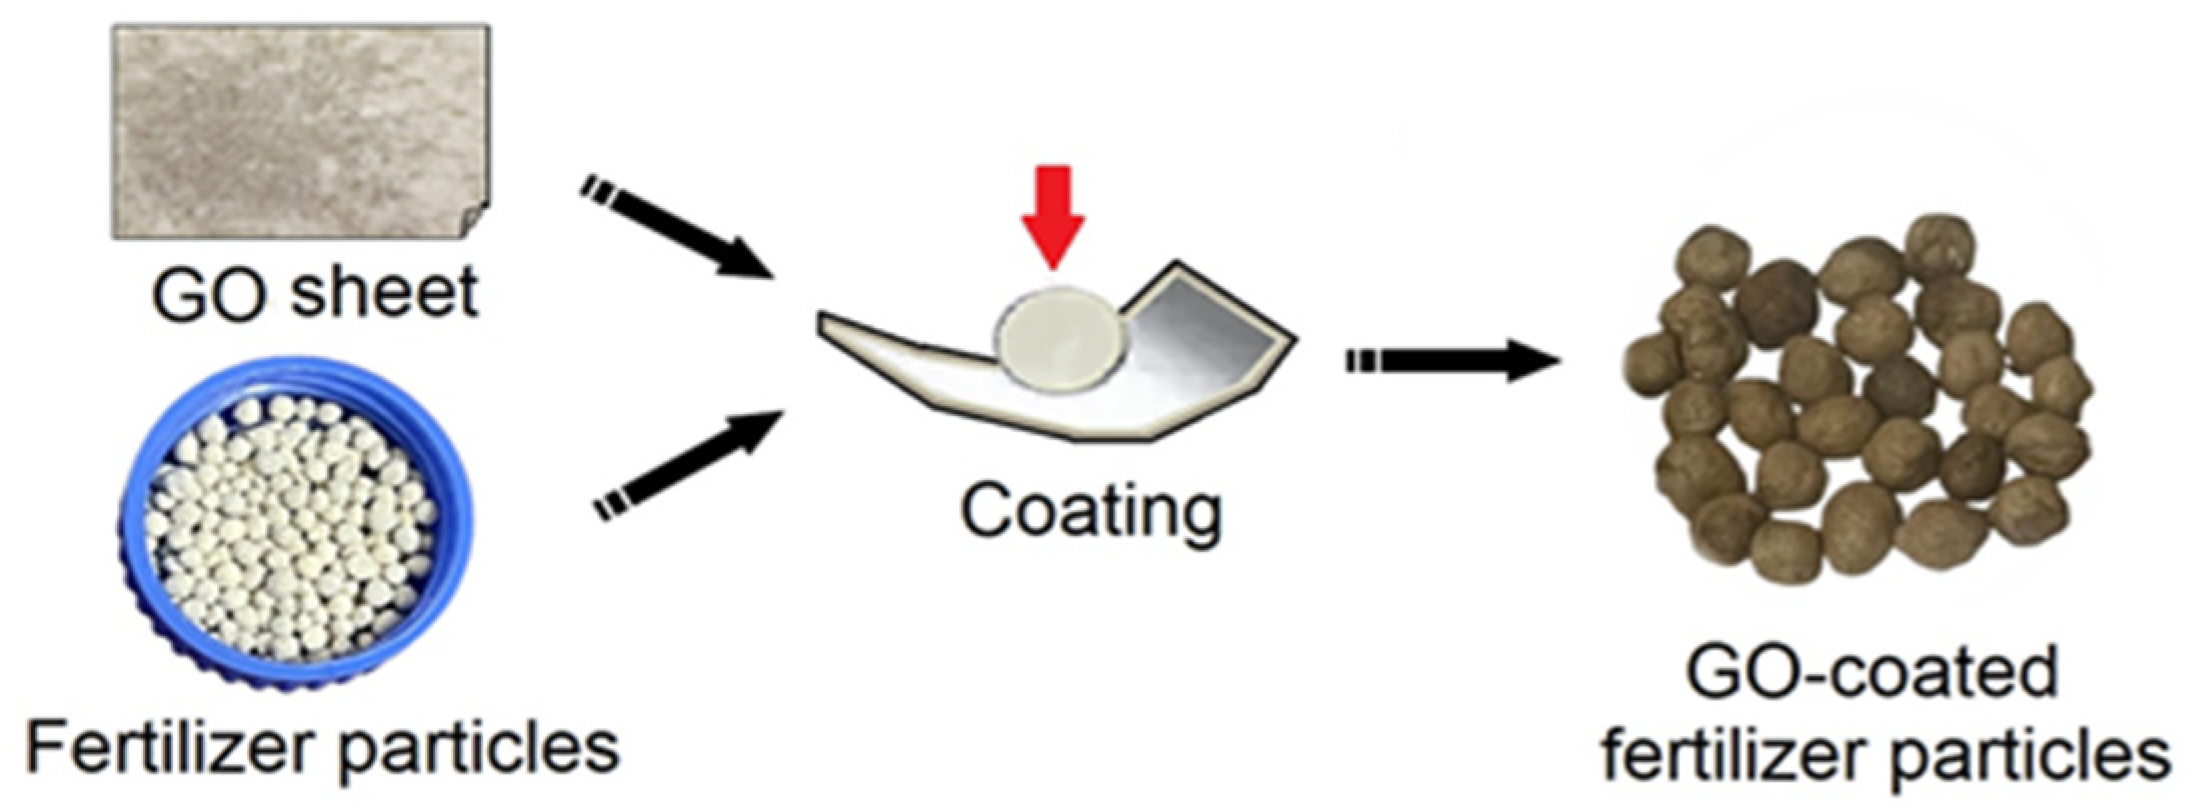
After freeze-drying for two days to obtain the GO sheet, gently remove the GO sheet with fine-pointed tweezers, and pay attention to the application of force during the removal process to maintain the fluffy state of the GO samples. Then, grab composite fertilizer particles with tweezers and apply mechanical force to coat the GO sheet on the surface of the fertilizer to obtain GO-coated fertilizer particles (GO-F), as shown in Figure 2. Finally, dry the GO-F particles and store them in sealed containers for future use.

Figure 2.
Schematic illustration of preparation of GO-coated composite fertilizer.
2.4. Characterization
The materials’ structures were measured using X-ray diffraction (XRD, Rigaku Ultima IV, Rigaku, Tokyo, Japan). Raman spectra of graphene oxide with different oxidation degrees were measured at 20 °C with a LabRAM HR Evolution spectrometer (Horiba JY, France SAS) using a laser wavelength of 532 nm in the range from 1000 to 3500 nm cm−1. X-ray photoelectron spectroscopy (XPS, K-Alpha, Thermo Scientific, East Grinstead, UK) analyzes elemental composition and bonding state information. Physicochemical properties of employing Fourier-transform infrared (FT-IR) spectra were recorded on an Avatar 360 Nicolet instrument (Thermo Fisher Scientific, Shanghai, China) by measuring the samples. The field emission scanning electron microscope (FE-SEM, Zeiss Sigma 300, Carl Zeiss, Germany) operating at 30 kV was used to characterize the area, size, and morphology. An energy-dispersive X-ray spectroscopy (EDS, Bruker Quantax XFlash SDD 6/30, Berlin, Germany) at 15 kV was used to identify and quantify the elements (C, O, N, P, and K) present in the GO-F.
2.5. Nutrient Release Properties of GO-F
The nutrient release behavior of GO-F in water at 25 °C was measured in accordance with the Chinese National Standard of slow-release fertilizer protocol (GB 23348-2009). In total, 1 g of GO-F and F samples was sealed in a 100-mesh nylon bag and added to 50 mL of distilled water, put in a 150 mL flask, and incubated at 25 °C in the incubator. After 1, 1.5, 2, 3, 4, 5, 6, 7, 8, 9, and 10 h, respectively, the samples were filtered, and a certain amount of solution was taken out to measure the N, P, and K content. Subsequently, 10 mL of deionized water was added to each flask to maintain the desired initial concentration. All samples were tested in triplicate and the average value was taken as the N, P, and K concentration of each sample. The nutrient release longevity of GO-F and F was defined as the time at which the cumulative nutrient release reached 100%. Finally, the concentration of N, P, and K was measured by a nutrient rapid analyzer, and the contents of N, P, and K were further calculated.
3. Results and Discussion
3.1. Characterization of GO Sheet and GO-F
3.1.1. Structures of GO Sheet and Graphite
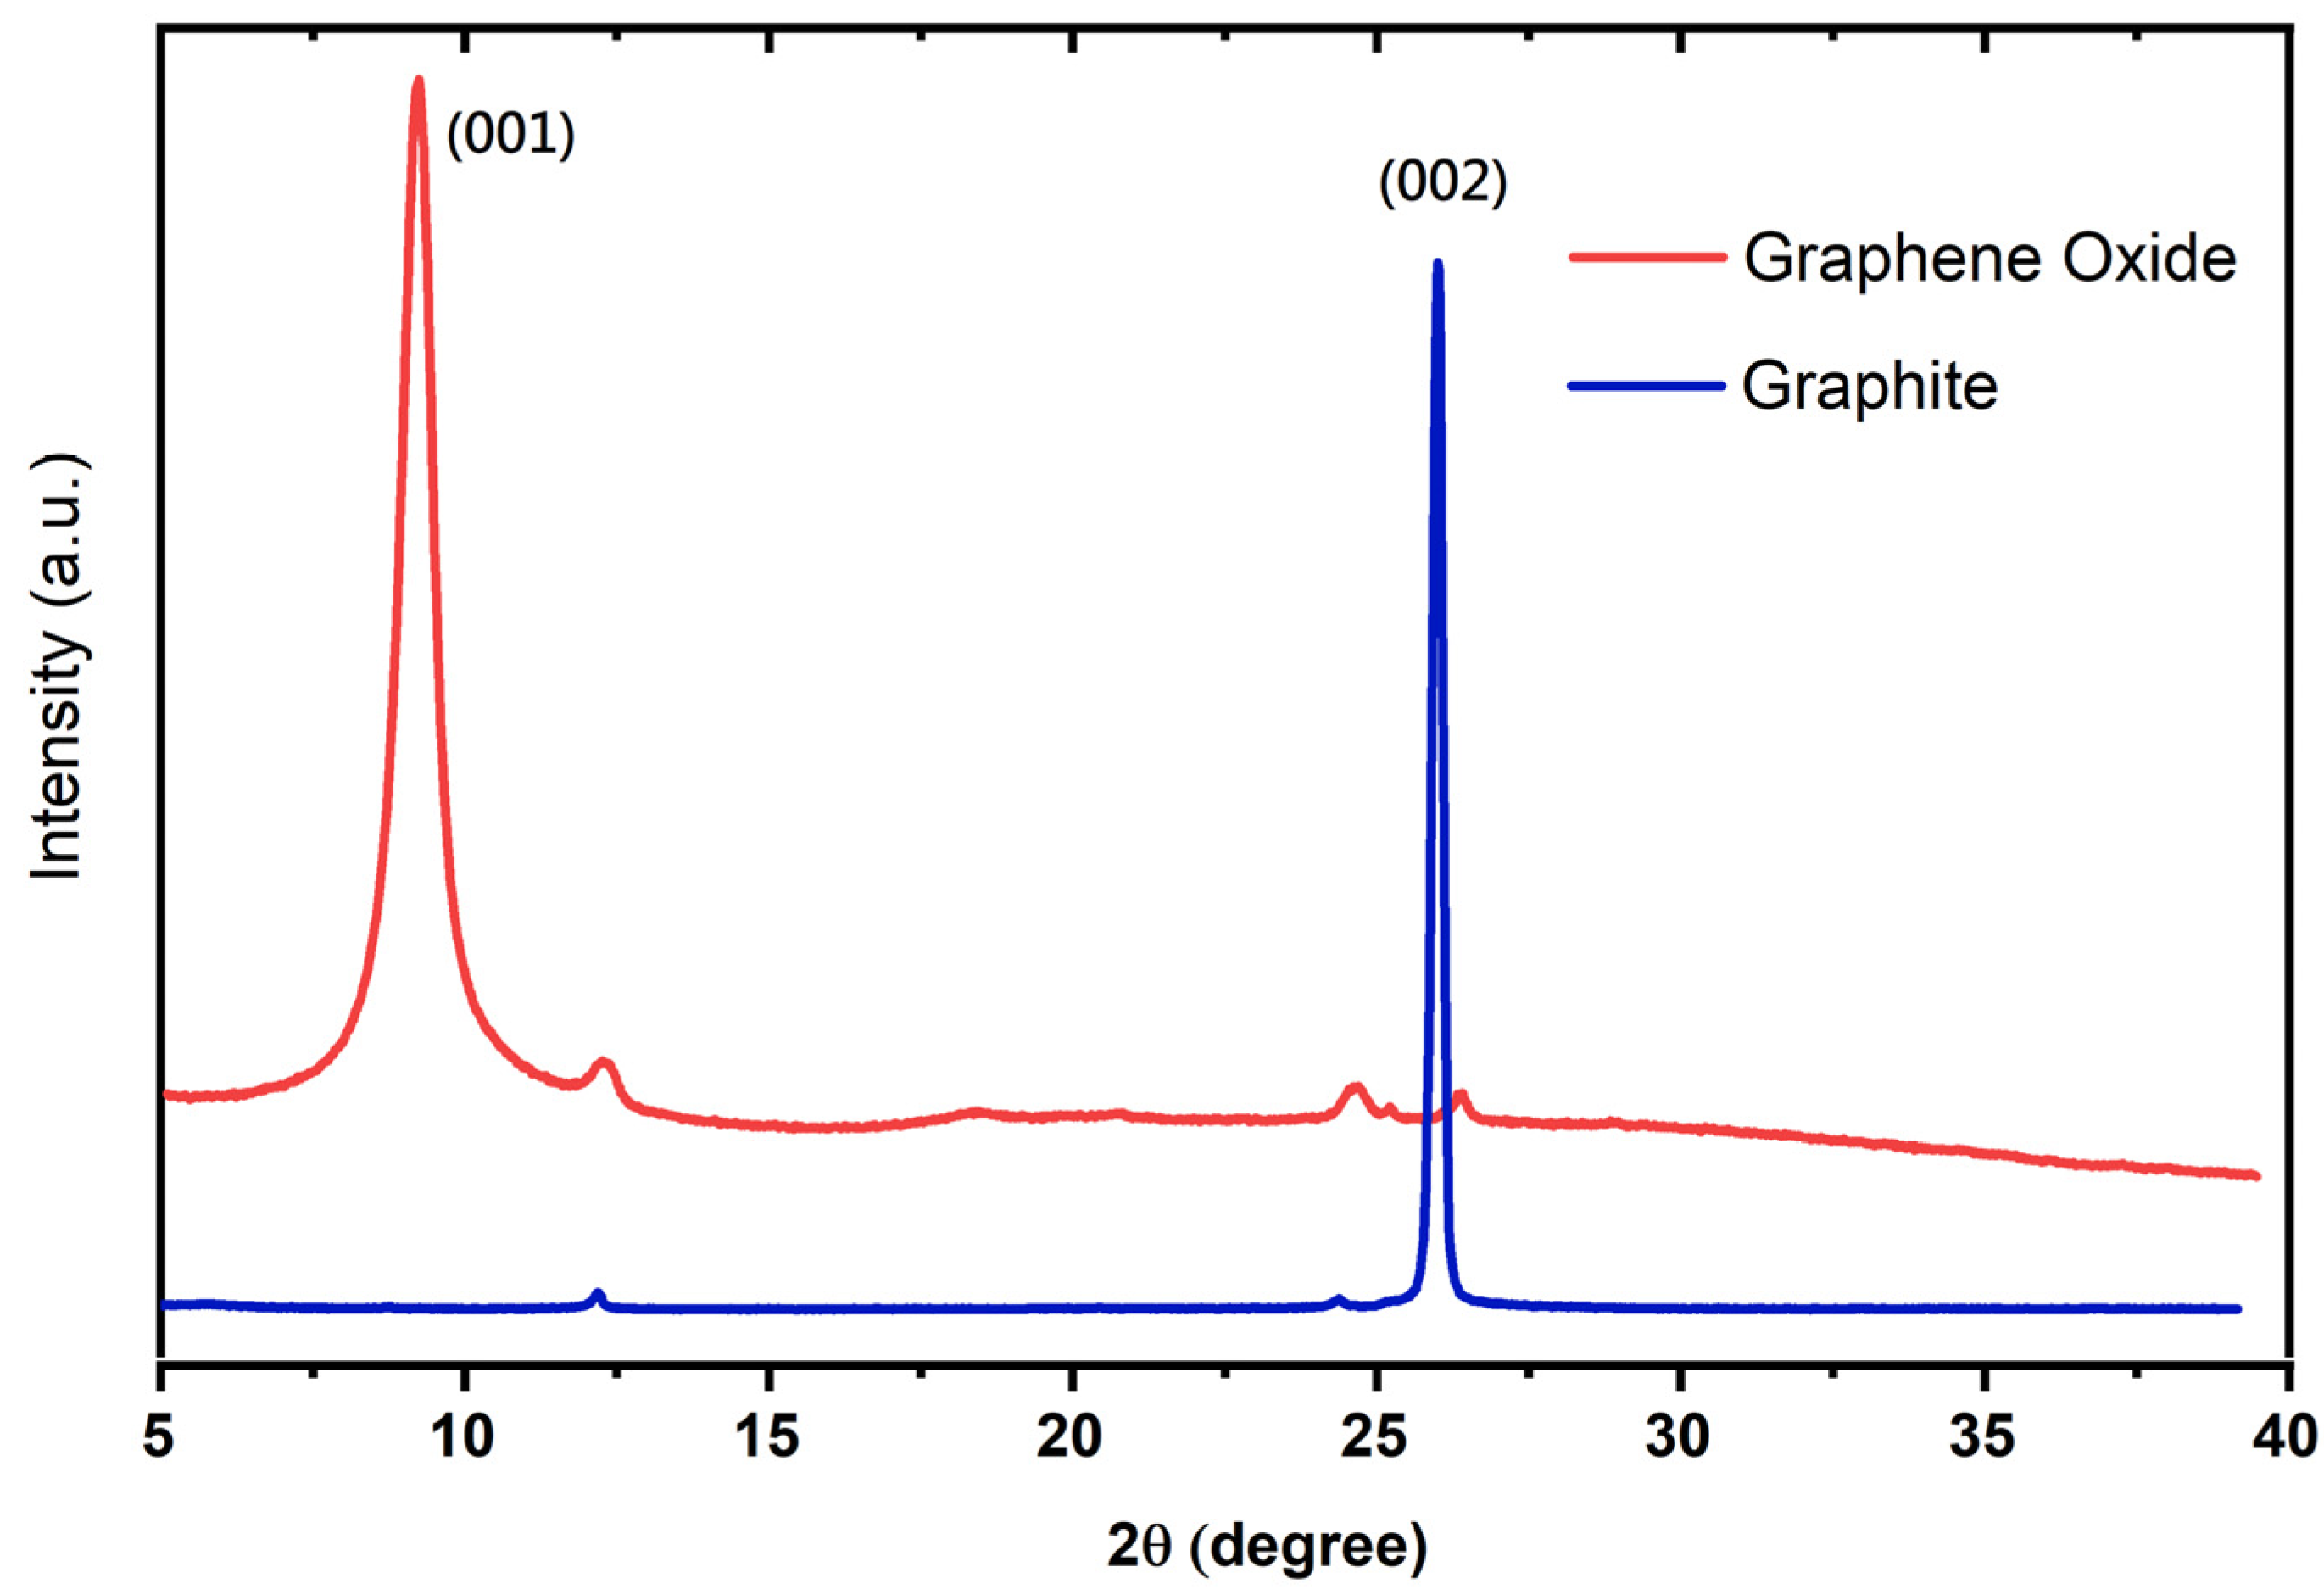
The XRD patterns of GO sheets and graphite powder were analyzed by scanning the sample through a range of 2θ angles from 5° to 40° with Cu-Kα radiation (λ = 1.5406 Å) to analyze the interlayer spacing. Figure 3 shows that the graphite flakes showed a characteristic sharp peak at 2θ = 26° (d = 0.34 nm), referring to graphite as the presence of a hexagonally ordered structure in the graphitic materials [25]. Following the oxidation of graphite, the peak for the GO sheet is observed at 2θ = 9.3° (d = 1.0.6 nm), attributed to the forming of epoxy (–CH (O) CH–), hydroxyl (–OH), and carboxyl (–COOH) groups due to oxidation [12,13,26,27], resulting in a wider interlayer distance of the GO sheet. Additionally, the observed peak (002) for graphite completely vanished in the case of the GO sheet, consistent with the existing literature [28]. The initial results of XRD demonstrated the successful synthesis of the GO sheets.
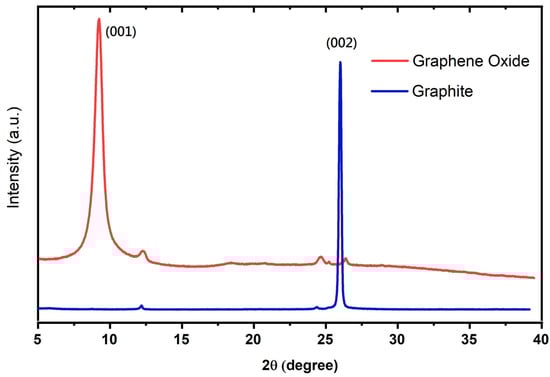
Figure 3.
XRD patterns of GO sheet and graphite.
3.1.2. Raman Analysis of GO Sheet and Graphite
Raman spectroscopy provides essential information for characterizing the crystal structure of graphene derivatives and determining the presence of disorder or defects in the graphitic material resulting from the synthesis route. Figure 4 displays the Raman spectra of the GO sheet and graphite upon its transformation from graphite to graphene oxide, requiring an oxidation process to structurally change, during the chemical process, graphite into graphene oxide. The pristine graphite material shows a sharp G band, attributed to the in-plane stretching motion between sp2 carbon atoms. The D band is recognized to be a disordered band originating in structural defects, edge effects, and dangling sp2 carbon bonds that break the symmetry. For pristine graphite, the D and G peak positions were centered at 1292.95 and 1485.92 cm−1, while the GO sheet peaks were at 1350.70 and 1573.24 cm−1, respectively. The G band of the GO sheet broadens and up-shifts in comparison to what is observed in the pristine graphite (strong G band at 1573.24 cm−1 due to first-order scattering of the E2g mode) [29]. A possible explanation of this behavior is the presence of isolated double bonds which resonate at higher frequencies. Furthermore, the D band at 1350.70 cm−1 becomes prominent, indicating that the oxidation process influences the size of the in-plane sp2 domains [30]. In addition, the D band represents the disorder or defect band that shows defects caused by breaks in the infinite-symmetry carbon honeycomb-shaped lattice [31]. The shift of the G band to a higher wavenumber upon graphite oxidation suggests amorphization of the graphite and the presence of a significant amount of sp3 carbon [32].
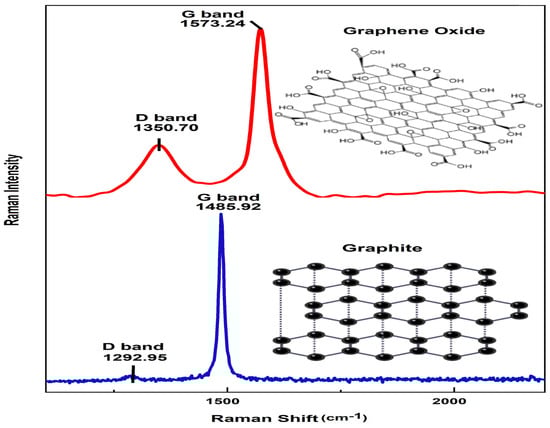
Figure 4.
Raman spectra for GO sheet and graphite.
The intensity ratio of ID/IG provides direct evidence of the degree of functionalization. In this study, the ID/IG ratio of the graphite and GO sheet was found to be 0.19 and 0.863, respectively. This result confirmed that the intensity ratio of ID/IG of GO was higher than that of pristine graphite, which confirms the oxidation of graphite, referring to the D band, which increased during oxidation since oxygen functional groups were introduced into the graphitic chain [33], where lattice defects could be a type of sp3 defect (epoxides) caused [34].
3.1.3. FTIR and XPS Analysis of GO Sheet
The FTIR spectrum can identify functional groups and determine molecular structures. FTIR analysis evidence for the presence of various peaks corresponding to various oxygen-containing functional groups confirms the formation of the GO sheet, as shown in Figure 5. In the spectrum of the GO sheet, a broad peak appeared at 3433 cm−1 in the high-frequency area, attributed to the existence of hydroxyl groups and surface-adsorbed water [34]. The peak at 2985 cm−1 represents the asymmetric and symmetric stretching vibrations of C–H bonds [35]. The peak at 1631 cm−1 is attributed to the stretching vibration of the carbonyl group (C=O) from the ketones [36]. The peak at 1401 cm−1 is attributed to the stretching vibrations of (C–OH) side groups, and the one at 1051 cm−1 is attributed to the C–O (alkoxy) stretching of the epoxy or peroxide group [35,37].
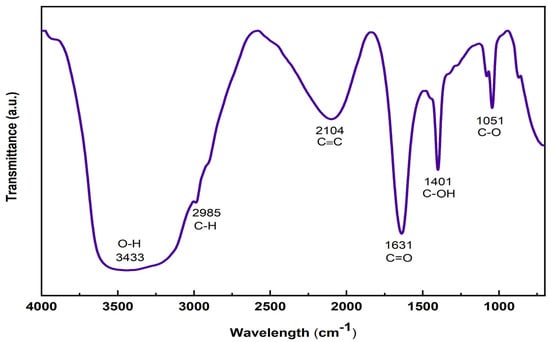
Figure 5.
FTIR spectra of GO sheet.
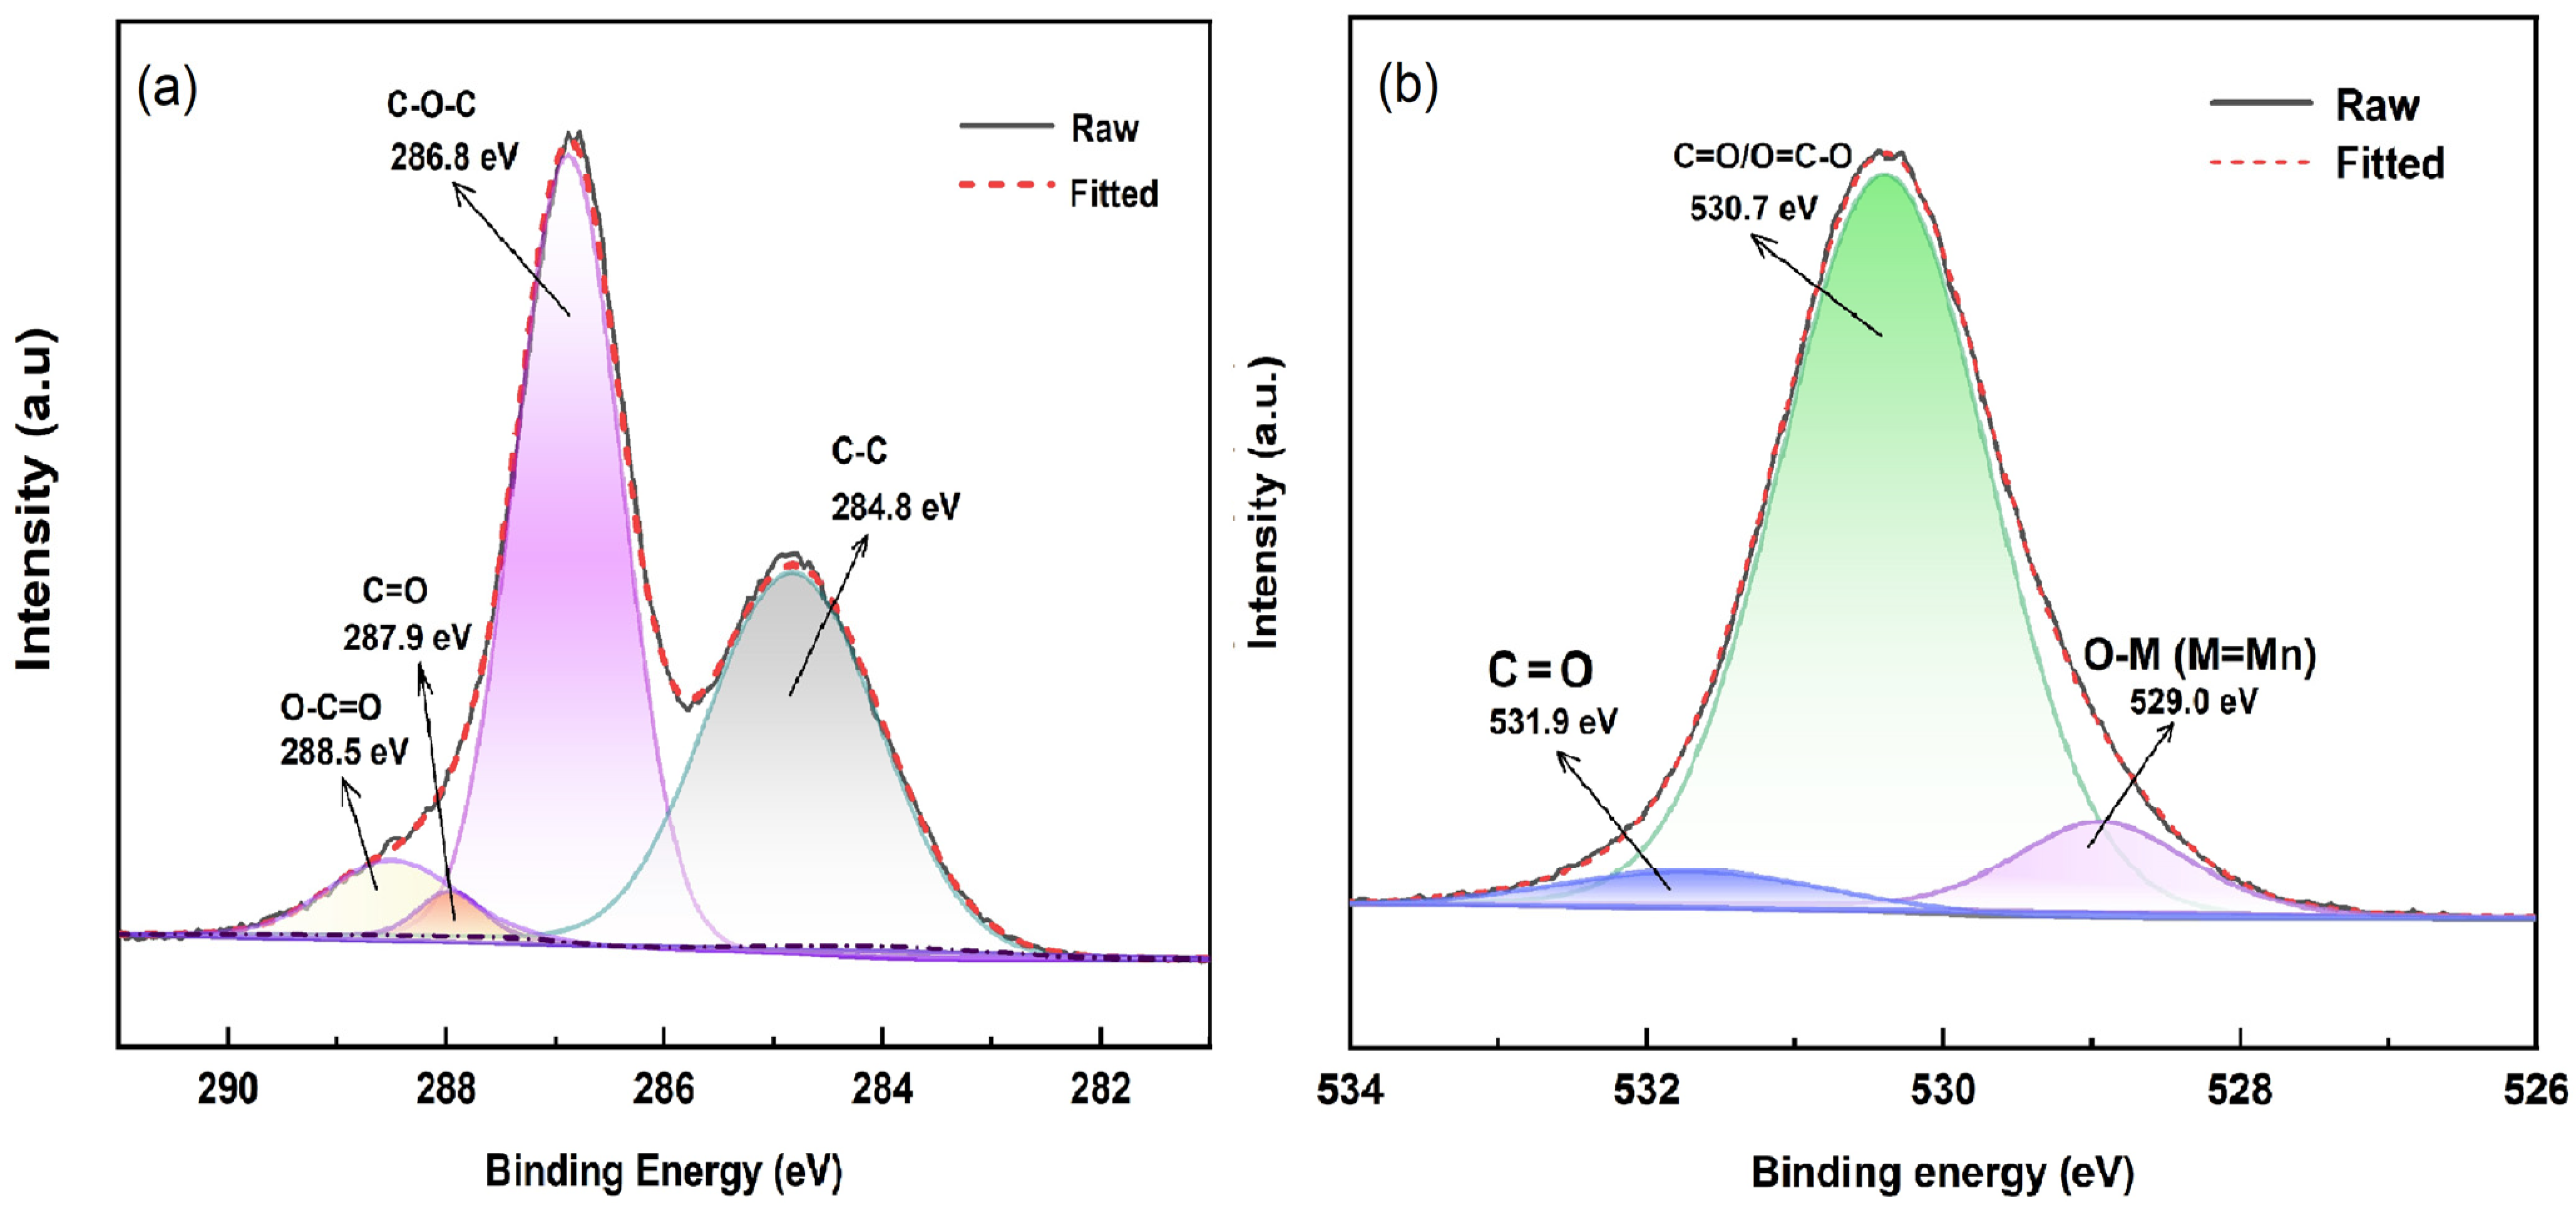
To further investigate the obtained GO sheet composite after the presentation of oxygen-containing functional groups, XPS analysis was conducted, as shown in Figure 6. For the GO sheet, as illustrated in Figure 6a, the XPS C 1s spectrum of the GO sheet was deconvoluted into four component peaks centered at 284.8 eV, 286.8 eV, 287.9 eV, and 288.5 eV, respectively. These peaks correspond to sp2 carbon (284.8 eV) [38,39,40], and/or sp3 hybridized carbon corresponds to the following oxygen-containing groups [41]: C–O–C epoxy group (286.8 eV) [39,40], C=O carbonyl group (287.9 eV) [40,42], and O–C=O carboxyl group (288.5 eV) [43,44], respectively. The high-resolution O 1s XPS spectrum of the GO flake contains three fitted peaks at 531.9 eV, 530.7 eV, and 529 eV (see Figure 6b). The peaks at 531.9 eV and 530.7 eV indicate the presence of surface oxygen (C=O and O–C=O) [44,45], while the peak at 529 eV corresponds to O-M lattice oxygen [46], possibly resulting from the reduction of KMnO4 to MnO2 by oxidation. The presence of oxygen-containing functional groups confirms the successful oxidation of the graphite into the GO sheet.
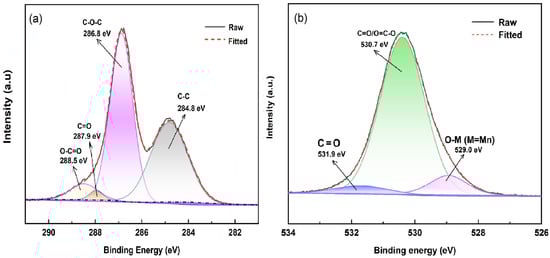
Figure 6.
C 1s (a) and O1s (b) core-level XPS spectra of GO sheet.
3.1.4. SEM-EDS Analysis of GO Sheet and GO-F Particle
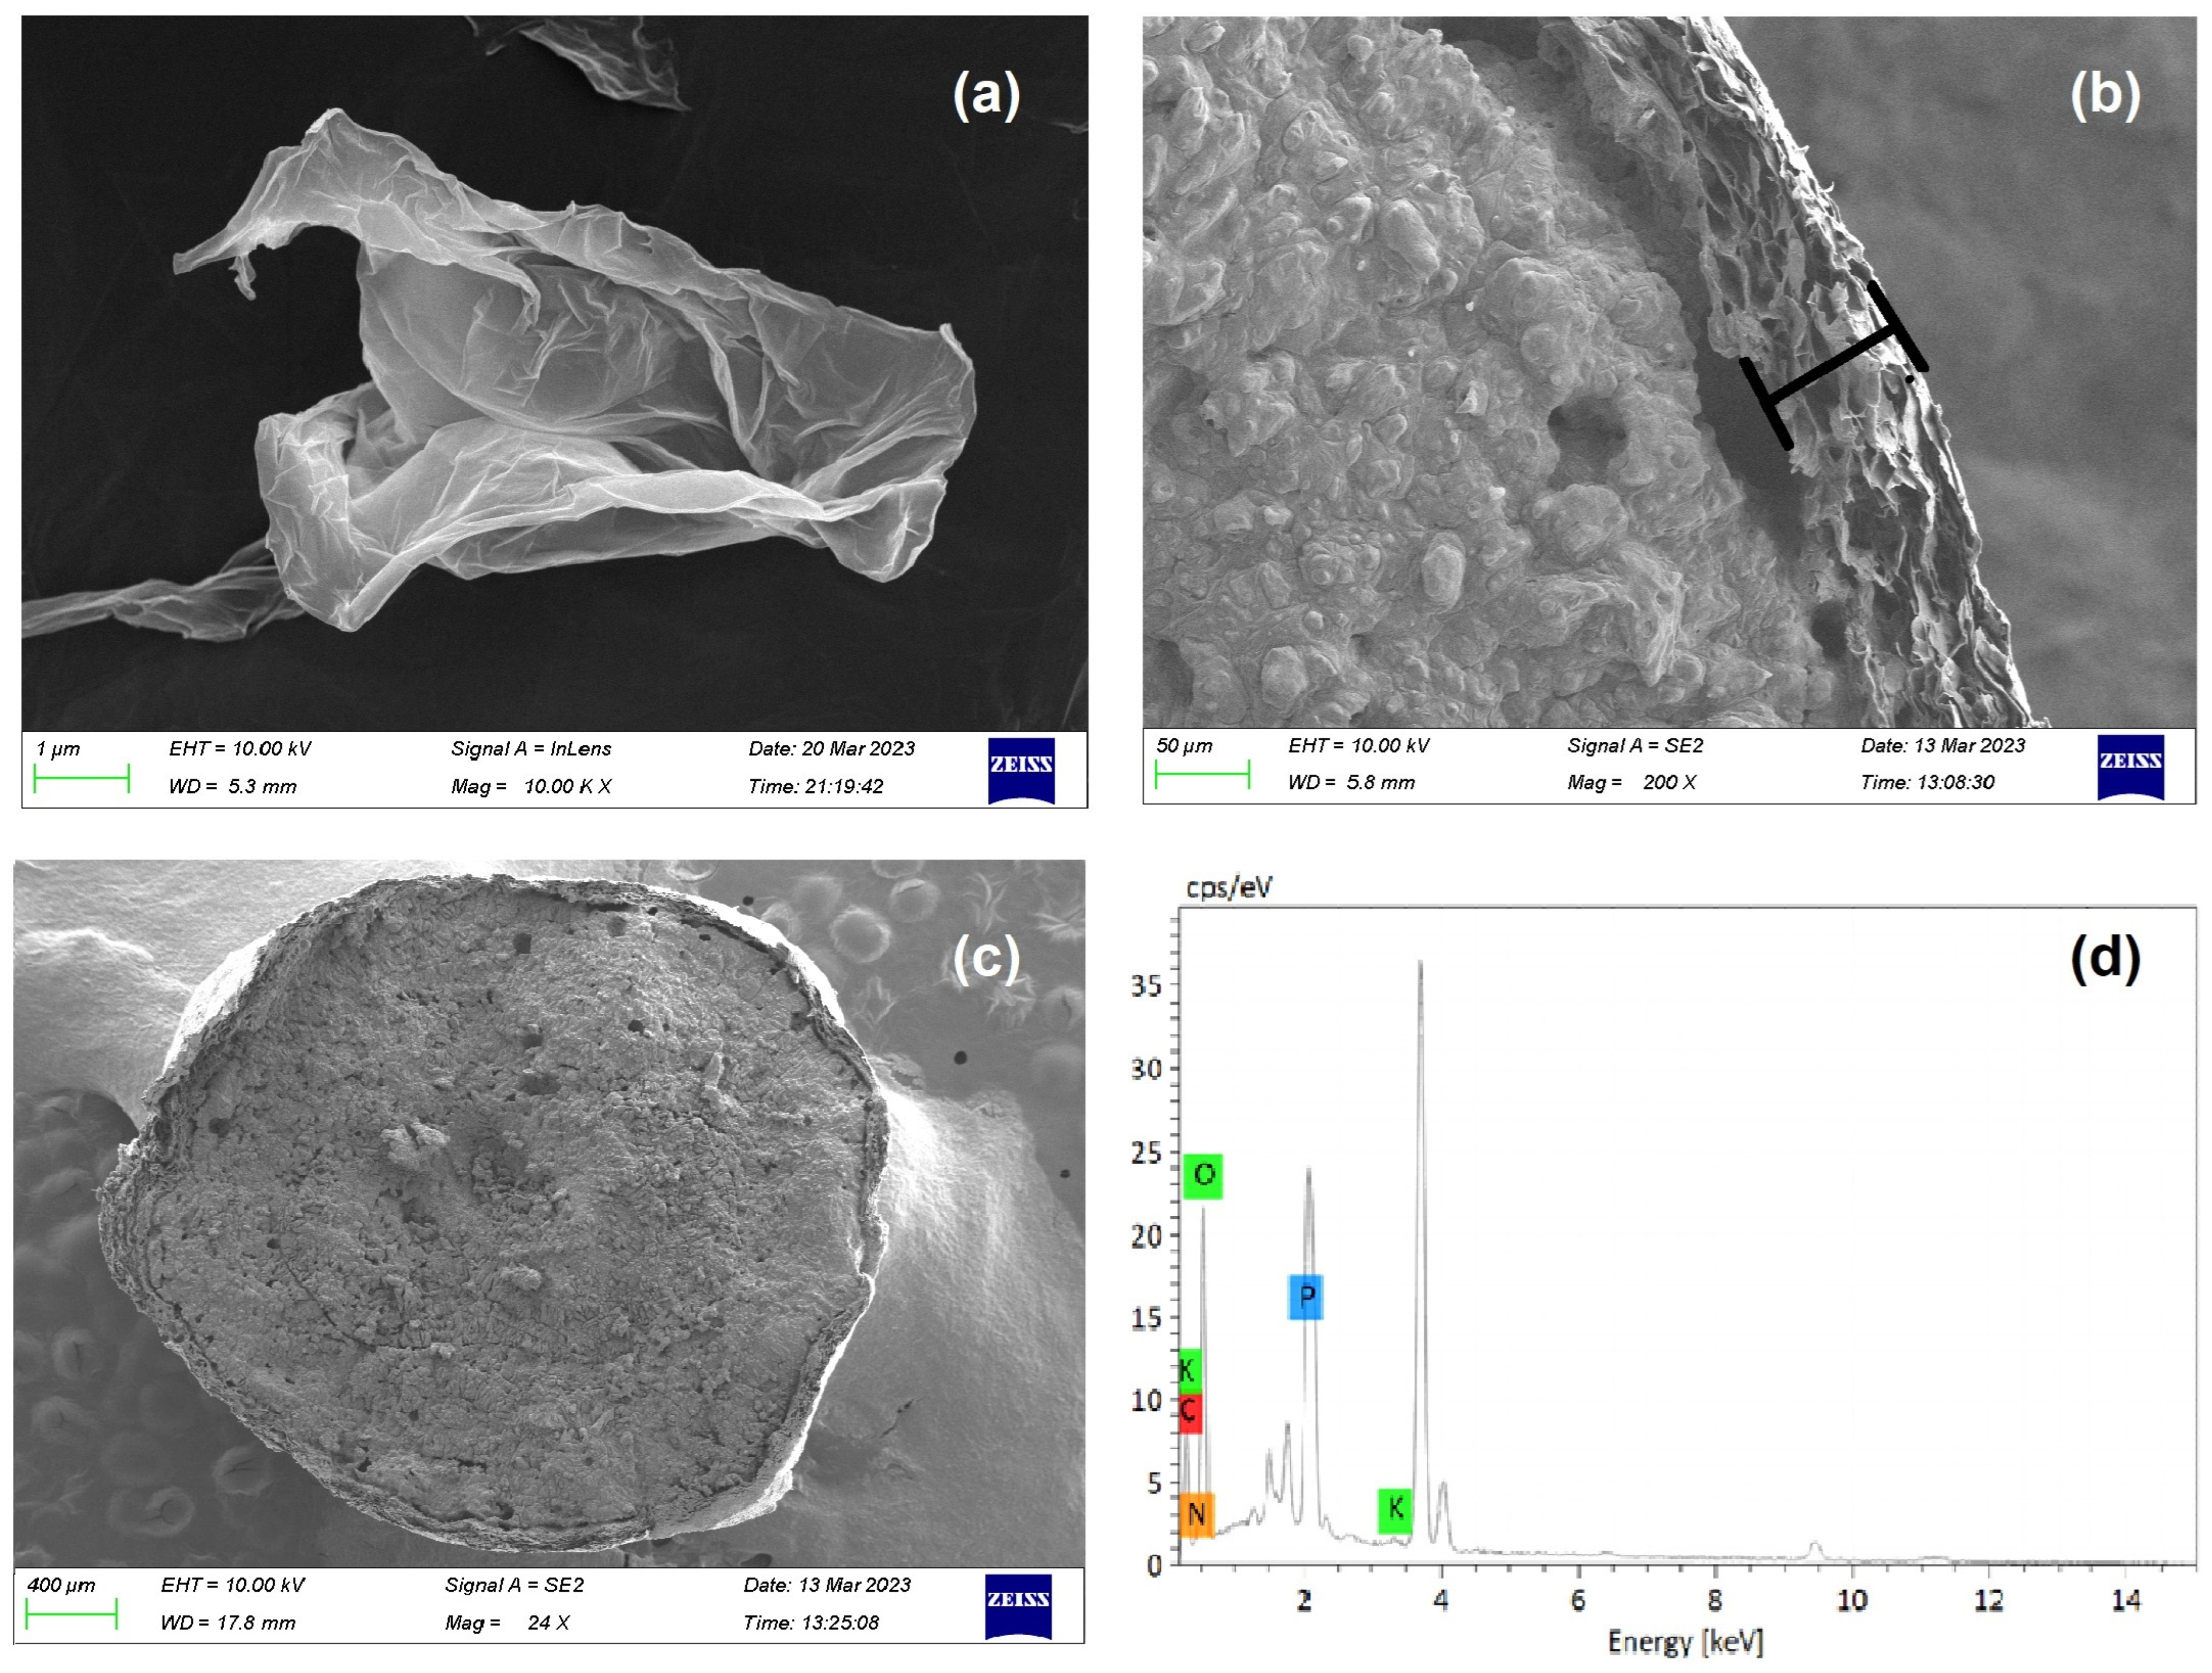
The analysis of the GO sheet and GO-F were observed by SEM at a magnification of 10.00 K, as shown in Figure 7a–c, respectively. As observed in Figure 7a, the waterless synthesized GO sheet shows that when graphite is oxidized and exfoliated into GO sheets, there is evidence of GO sheets whereby their morphology resembles a thin curtain or corrugated shape, which was the result of deformation upon the exfoliation and restacking process [47,48]. The synthesized GO membrane formed from GO sheets coated in each fertilizer particle (GO-F) is observed in Figure 7b to have formed a complete shell around the fertilizer core. A more detailed examination of the cross-sectional GO shell reveals a thickness of approximately 50–60 µm (Figure 7b). The high-magnification SEM imaging of the surface of the GO-F demonstrates that it has a dense GO shell without any apparent apertures outside (Figure 7c). Figure 7d presents the results of the EDS analysis, which confirms the chemical composition of the GO-F particles. The analysis revealed that the particles are composed of C (40.74%), O (42.92%), N (5.63%), P (9.58%), and K (1.13%) elements, respectively.
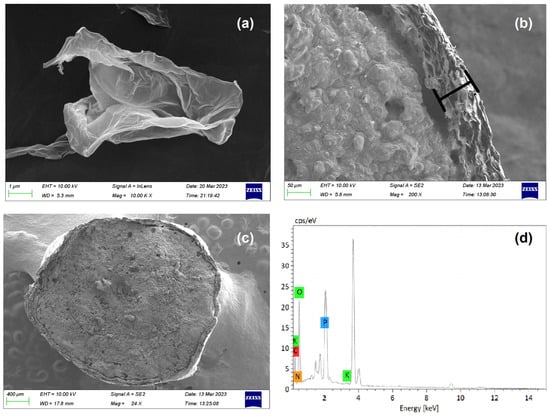
Figure 7.
SEM-EDS analysis of (a) GO Sheet; (b,c) GO-F particle observation of shell section; and (d) EDS spectra of GO-F.
3.2. Slow-Release Behavior of GO-F Particle in Water
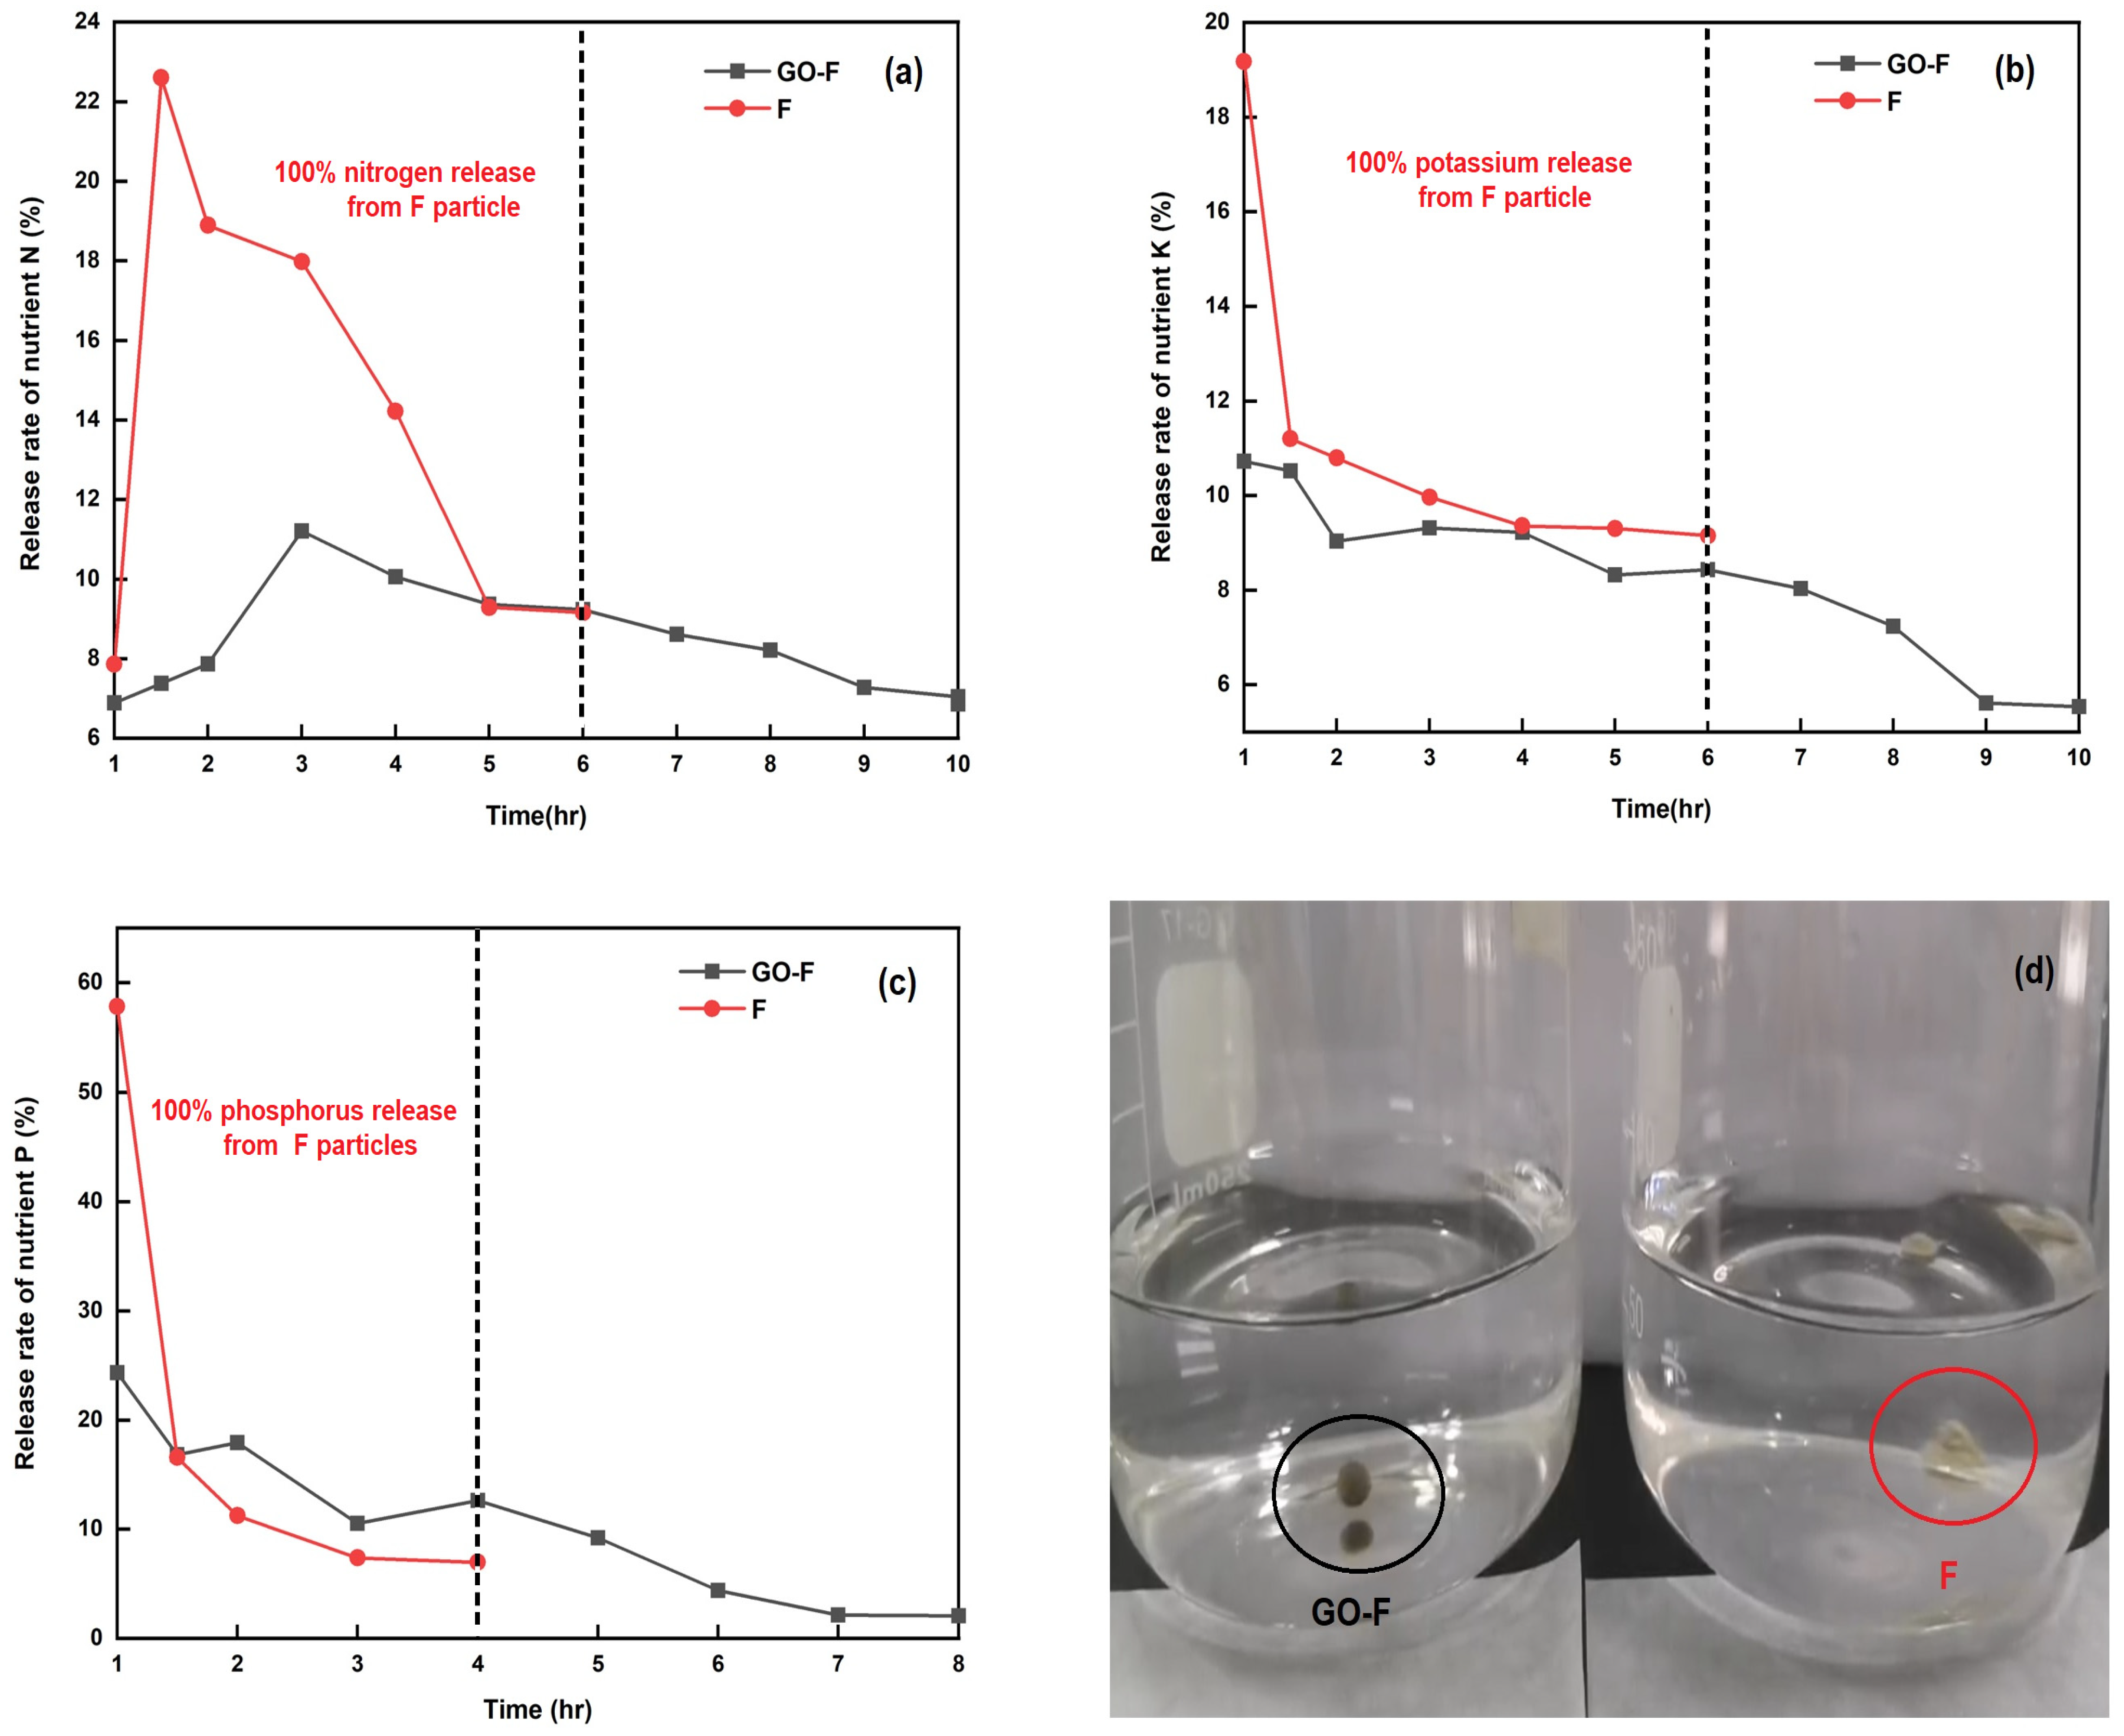
To assess the nutrient release of the GO-F and F pellets (i.e., in a granular-form commercial granular fertilizer), experiments were performed to determine their release rates of NPK nutrients in water dissolution. As shown in Figure 8a–c, more than 81.51%, 85.64%, and 81.55% of the N, P, and K in the uncoated F pellets were released within 4, 2, and 4 h (Figure 8a, Figure 8b, and Figure 8c), respectively. The results indicated that the release rate of NPK nutrients was arranged in different stages since the GO sheets coating the fertilizer pellets (i.e., GO-F) were used as a coating to delay the whole release process. In the initial stage, spanning from 0 to 4 h, the release rate was relatively slow compared with the uncoated F pellets’ stage. At this stage, only approximately 43.41%, 57.07%, and 55.1% of the NPK ions were released from the GO-F into the water. The burst release of NPK ions takes place in the stage from 7 to 8 h, after which about 92.96%, 95.81%, and 94.45% of the NPK ions were released from the fertilizers, in agreement with the results of Zhang et al. [49]. However, after 6 h, the coated GO-F pellets cracked on the sheet, which led to the penetration of water into the NPK compound fertilizer core through these tiny cracks, inducing the rapid release of NPK ions. The data also reveal that the release of NPK ions from the GO-F to the water reaches its equilibrium after about 10 h, indicating that the sheet has a slow-release ability, which can meet the nutrient requirement of plants during this time. Meanwhile, as shown in Figure 8d, uncoated F pellets immediately structurally collapsed with water; conversely, the coated GO-F pellets remained in as good a shape as they began when placed underwater, without structural collapse. This demonstrates that the GO sheet-coated fertilizer (i.e., GO-F) can provide a promising coating technique for the slow-release characteristic.
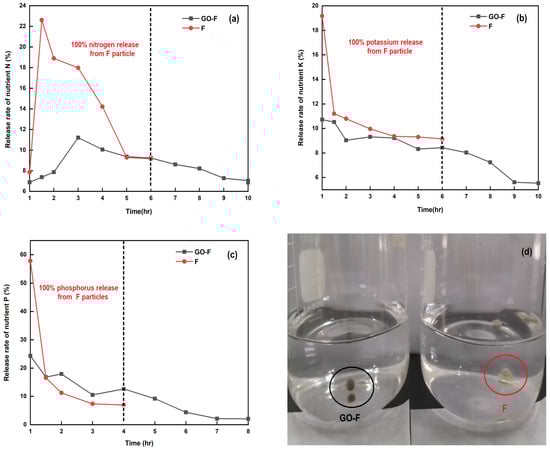
Figure 8.
The release rate of nutrients vs. time for the GO-F and F pellets (a–c); and (d) photograph of GO-F and F pellets soaking in water.
4. Conclusions
This study demonstrates that the GO-F coating technique offers a promising approach to achieving slow-release behavior. The GO-F particle was developed by encapsulating NPK compound pellets with GO sheets, employing a waterless synthesis technique. The findings indicated that uncoated F pellets exhibited a higher release rate, with 81.51%, 85.64%, and 81.55% of their NPK ions released within 4, 2, and 4 h, respectively. In contrast, the release of NPK ions from the coated GO-F pellets was significantly lower, with only approximately 43%, 57%, and 55% released at this stage. These findings demonstrate that the GO sheet, when employed as a coating material, exhibits excellent slow-release behavior of the encapsulated GO-F particle. With the unique characteristics of GO, this newly developed method could be used for developing fertilizers that have slow-release behavior, thereby providing plants with their requisite nutrients, enhancing productivity, and reducing environmental pollution.
Author Contributions
H.C. prepared the original draft of the manuscript and performed the experiments and measurements; Y.H. and Y.X. performed the experiments and measurements; H.C. and X.H. coordinated the scientific group and reviewed and edited the draft manuscript; H.C. and Y.H. were involved in the development of the investigation concept. All authors have read and agreed to the published version of the manuscript.
Funding
This research was funded by the Guangdong Provincial Department of Education (Grant No. 2021ZDZX4022) and Guangdong Provincial Department of Science and Technology (Grant No. 2024A0505050037).
Institutional Review Board Statement
Not applicable.
Informed Consent Statement
Not applicable.
Data Availability Statement
The original contributions presented in this study are included in the article, and further inquiries can be directed to the corresponding author.
Conflicts of Interest
The authors declare no conflicts of interest.
References
- Pahalvi, H.N.; Rafiya, L.; Rashid, S.; Nisar, B.; Kamili, A.N. Chemical fertilizers and their impact on soil health. Microbiota Biofertil. 2021, 2, 1–20. [Google Scholar]
- Wu, H.; Hao, H.; Lei, H.; Ge, Y.; Shi, H.; Song, Y. Farm size, risk aversion and overuse of fertilizer: The heterogeneity of large-scale and small-scale wheat farmers in Northern China. Land 2021, 10, 111. [Google Scholar] [CrossRef]
- Guo, J.; Li, C.; Xu, X.; Sun, M.; Zhang, L. Farmland scale and chemical fertilizer use in rural China: New evidence from the perspective of nutrient elements. J. Clean. Prod. 2022, 376, 134278. [Google Scholar] [CrossRef]
- Yang, Y.; Zhang, R.; Zhang, X.; Chen, Z.; Wang, H.; Li, P.C.H. Effects of graphene oxide on plant growth: A review. Plants 2022, 11, 2826–2837. [Google Scholar] [CrossRef] [PubMed]
- Lu, J.; Cheng, M.; Zhao, C.; Li, B.; Peng, H.; Zhang, Y.; Hassan, M. Application of lignin in preparation of slow-release fertilizer: Current status and future perspectives. Ind. Crops Prod. 2022, 176, 114267. [Google Scholar] [CrossRef]
- Wang, C.; Song, S.; Yang, Z.; Liu, Y.; He, Z.; Zhou, C.; Li, P. Hydrophobic modification of castor oil-based polyurethane coated fertilizer to improve the controlled release of nutrient with polysiloxane and halloysite. Prog. Org. Coat. 2022, 165, 106756. [Google Scholar] [CrossRef]
- Bhardwaj, D.; Sharma, M.; Sharma, P.; Tomar, R. Synthesis and surfactant modification of clinoptilolite and montmorillonite for the removal of nitrate and preparation of slow release nitrogen fertilizer. J. Hazard. Mater. 2012, 227, 292–300. [Google Scholar] [CrossRef]
- Shaviv, A. Advances in controlled-release fertilizers. Adv. Agron. 2001, 71, 292–300. [Google Scholar]
- Nikolić, L.B.; Zdravković, A.S.; Nikolić, V.D.; Ilić-Stojanović, S.S. Synthetic hydrogels and their impact on health and environment. Cellul. Based Superabsorbent Hydrogels 2019, 61, 1363–1391. [Google Scholar]
- Motamedi, E.; Safari, M.; Salimi, M. Improvement of tomato yield and quality using slow release NPK fertilizers prepared by carnauba wax emulsion, starch-based latex and hydrogel nanocomposite combination. Sci. Rep. 2023, 13, 11118. [Google Scholar] [CrossRef]
- Kabiri, S.; Baird, R.; Tran, D.N.; Andelkovic, I.; McLaughlin, M.J.; Losic, D. Cogranulation of low rates of graphene and graphene oxide with macronutrient fertilizers remarkably improves their physical properties. ACS Sustain. Chem. Eng. 2018, 6, 1299–1309. [Google Scholar] [CrossRef]
- Chen, D.; Feng, H.; Li, J. Graphene oxide: Preparation, functionalization, and electrochemical applications. Chem. Rev. 2012, 112, 6027–6053. [Google Scholar] [CrossRef] [PubMed]
- Jin, L.; Yang, K.; Yao, K.; Zhang, S.; Tao, H.; Lee, S.T.; Peng, R. Functionalized graphene oxide in enzyme engineering: A selective modulator for enzyme activity and thermostability. ACS Nano 2012, 6, 4864–4875. [Google Scholar] [CrossRef] [PubMed]
- Politano, G.G.; Versace, C. Variable angle spectroscopic ellipsometry characterization of DMOAP-functionalized graphene oxide Films. Coatings 2023, 13, 2066. [Google Scholar] [CrossRef]
- Sachdeva, H. Recent advances in the catalytic applications of GO/rGO for green organic synthesis. Green Process. Synth. 2020, 9, 515–537. [Google Scholar] [CrossRef]
- Perreault, F.; De Faria, A.F.; Elimelech, M. Environmental applications of graphene-based nanomaterials. Chem. Soc. Rev. 2015, 44, 5861–5896. [Google Scholar] [CrossRef]
- Shekari, F.; Abbasi, A.; Mustafavi, S.H. Effect of silicon and selenium on enzymatic changes and productivity of dill in saline condition. J. Saudi Soc. Agric. Sci. 2017, 16, 367–374. [Google Scholar] [CrossRef]
- Lalwani, G.; Xing, W.; Sitharaman, B. Enzymatic degradation of oxidized and reduced graphene nanoribbons by lignin peroxidase. J. Mater. Chem. B 2014, 2, 6354–6362. [Google Scholar] [CrossRef]
- Brodie, B.C. On the atomic weight of graphite. Philos. Trans. R. Soc. Lond. 1859, 149, 249–259. [Google Scholar]
- Staudenmaier, L. Verfahren zur darstellung der graphitsäure. Berichte Dtsch. Chem. Ges. 1898, 31, 1481–1487. [Google Scholar] [CrossRef]
- Hummers, W.S., Jr.; Offeman, R.E. Preparation of graphitic oxide. J. Am. Chem. Soc. 1958, 80, 1339. [Google Scholar] [CrossRef]
- Pei, S.; Wei, Q.; Huang, K.; Cheng, H.M.; Ren, W. Green synthesis of graphene oxide by seconds timescale water electrolytic oxidation. Nat. Commun. 2018, 9, 145. [Google Scholar] [CrossRef] [PubMed]
- Cao, K.; Tian, Z.; Zhang, X.; Wang, Y.; Zhu, Q. Green preparation of graphene oxide nanosheets as adsorbent. Sci. Rep. 2023, 13, 9314. [Google Scholar] [CrossRef] [PubMed]
- Habte, A.T.; Ayele, D.W. Synthesis and characterization of reduced graphene oxide (rGO) started from graphene oxide (GO) using the tour method with different parameters. Adv. Mater. Sci. Eng. 2019, 2019, 5058163. [Google Scholar] [CrossRef]
- Ramya, A.V.; Manoj, B.; Mohan, A.N. Extraction and characterization of wrinkled graphene nanolayers from commercial graphite. Asian J. Chem. 2016, 28, 1031. [Google Scholar] [CrossRef]
- Lerf, A.; Buchsteiner, A.; Pieper, J.; Schöttl, S.; Dekany, I.; Szabo, T.; Boehm, H.P. Hydration behavior and dynamics of water molecules in graphite oxide. J. Phys. Chem. Solids 2006, 67, 1106–1110. [Google Scholar] [CrossRef]
- Fan, Z.; Wang, K.; Wei, T.; Yan, J.; Song, L.; Shao, B. An environmentally friendly and efficient route for the reduction of graphene oxide by aluminum powder. Carbon 2010, 48, 1686–1689. [Google Scholar] [CrossRef]
- Meng, H.; Yang, W.; Ding, K.; Feng, L.; Guan, Y. Cu2O nanorods modified by reduced graphene oxide for NH3 sensing at room temperature. J. Mater. Chem. A 2015, 3, 1174–1181. [Google Scholar] [CrossRef]
- Gurzęda, B.; Buchwald, T.; Krawczyk, P. Thermal exfoliation of electrochemically synthesized graphite intercalation compound with perrhenic acid. J. Solid State Electrochem. 2020, 24, 1363–1370. [Google Scholar] [CrossRef]
- Malgorzata, W.; Chen, X.; Kalenczuk, R.J.; Wajda, A.; Łapczuk, J.; Kurzewski, M.; Drozdzik, M.; Chu, P.K.; Borowiak-Palen, E. Synthesis, dispersion, and cytocompatibility of graphene oxide and reduced graphene oxide. Colloids Surf. B 2012, 89, 79–85. [Google Scholar]
- Ferrari, A.C.; Robertson, J. Interpretation of Raman spectra of disordered and amorphous carbon. Phys. Rev. B 2000, 61, 14095. [Google Scholar] [CrossRef]
- Safie, N.E.; Azam, M.A. Understanding the structural properties of feasible chemically reduced graphene. AIMS Mater. Sci. 2022, 9, 617–627. [Google Scholar] [CrossRef]
- Dubale, A.A.; Su, W.N.; Tamirat, A.G.; Pan, C.J.; Aragaw, B.A.; Chen, H.M.; Chen, C.H.; Hwang, B.J. The synergetic effect of graphene on Cu2O nanowire arrays as a highly efficient hydrogen evolution photocathode in water splitting. J. Mater. Chem. A 2014, 2, 18383–18397. [Google Scholar] [CrossRef]
- Hontoria-Lucas, C.; López-Peinado, A.J.; López-González, J.D.D.; Rojas-Cervantes, M.L.; Martín-Aranda, R.M. Study of oxygen-containing groups in a series of graphite oxides: Physical and chemical characterization. Carbon 1995, 33, 1585–1592. [Google Scholar] [CrossRef]
- Kumar, N.; Das, S.; Bernhard, C.; Varma, G.D. Effect of graphene oxide doping on superconducting properties of bulk MgB2. Supercond. Sci. Technol. 2013, 26, 095008. [Google Scholar]
- Shen, Y.; Jing, T.; Ren, W.; Zhang, J.; Jiang, Z.G.; Yu, Z.Z.; Dasari, A. Chemical and thermal reduction of graphene oxide and its electrically conductive polylactic acid nanocomposites. Compos. Sci. Technol. 2012, 72, 1430–1435. [Google Scholar] [CrossRef]
- Witjaksono, G.; Junaid, M.; Khir, M.H.; Ullah, Z.; Tansu, N.; Saheed, M.S.B.M.; Siddiqui, M.A.; Ba-Hashwan, S.S.; Algamili, A.S.; Magsi, S.A.; et al. Effect of nitrogen doping on the optical bandgap and electrical conductivity of nitrogen-doped reduced graphene oxide. Molecules 2021, 26, 6424. [Google Scholar] [CrossRef]
- Tiong, P.; Lintang, H.O.; Endud, S.; Yuliati, L. Improved interfacial charge transfer and visible light activity of reduced graphene oxide–graphitic carbon nitride photocatalysts. RSC Adv. 2015, 5, 94029–94039. [Google Scholar] [CrossRef]
- Rani, J.R.; Lim, J.; Oh, J.; Kim, D.; Lee, D.; Kim, J.-W.; Shin, H.S.; Kim, J.H.; Jun, S.C. Substrate and buffer layer effect on the structural and optical properties of graphene oxide thin films. RSC Adv. 2013, 3, 5926–5936. [Google Scholar] [CrossRef]
- Ershov, I.V.; Lavrentyev, A.A.; Prutsakova, N.V.; Holodova, O.M.; Mardasova, I.V.; Zhdanova, T.P.; Kozakov, A.T. Characterization of graphenic carbon produced by pulsed laser ablation of sacrificial carbon tapes. Appl. Sci. 2021, 11, 11972. [Google Scholar] [CrossRef]
- Cuesta, A.; Dhamelincourt, P.; Laureyns, J.; Martinez-Alonso, A.; Tascon, J.M. Comparative performance of X-ray diffraction and Raman microprobe techniques for the study of carbon materials. J. Mater. Chem. 1998, 8, 2875–2879. [Google Scholar] [CrossRef]
- Bao, L.; Liu, C.; Zhang, Z.L.; Pang, D.W. Photoluminescence-tunable carbon nanodots: Surface-state energy-gap tuning. Adv. Mater. 2015, 27, 1663–1667. [Google Scholar] [CrossRef] [PubMed]
- Sun, S.; Zhang, L.; Jiang, K.; Wu, A.; Lin, H. Toward high-efficient red emissive carbon dots: Facile preparation, unique properties, and applications as multifunctional theranostic agents. Chem. Mater. 2016, 28, 8659–8668. [Google Scholar] [CrossRef]
- Wei, S.; Yin, X.; Li, H.; Du, X.; Zhang, L.; Yang, Q.; Yang, R. Multi-color fluorescent carbon dots: Graphitized sp2 conjugated domains and surface state energy level Co-modulate band gap rather than size effects. Chem. Eur. J. 2020, 26, 8129–8136. [Google Scholar] [CrossRef]
- Zhang, P.; Zheng, Y.; Ren, L.; Li, S.; Feng, M.; Zhang, Q.; Qi, R.; Qin, Z.; Zhang, J.; Jiang, L. The Enhanced Photoluminescence Properties of Carbon Dots Derived from Glucose: The Effect of Natural Oxidation. Nanomaterials 2024, 14, 970. [Google Scholar] [CrossRef]
- Mirghni, A.A.; Madito, M.J.; Oyedotun, K.O.; Masikhwa, T.M.; Ndiaye, N.M.; Ray, S.J.; Manyala, N. A high energy density asymmetric supercapacitor utilizing a nickel phosphate/graphene foam composite as the cathode and carbonized iron cations adsorbed onto polyaniline as the anode. RSC Adv. 2018, 8, 11608–11621. [Google Scholar] [CrossRef]
- Mensah, B.; Konadu, D.S.; Nsaful, F.; Angnunavuri, P.N.; Kwofie, S. A systematic study of the effect of graphene oxide and reduced graphene oxide on the thermal degradation behavior of acrylonitrile-butadiene rubber in air and nitrogen media. Sci. Afr. 2023, 19, e01501. [Google Scholar] [CrossRef]
- Manoratne, C.H.; Rosa, S.R.D.; Kottegoda, I.R.M. XRD-HTA, UV visible, FTIR and SEM interpretation of reduced graphene oxide synthesized from high purity vein graphite. Mater. Sci. Res. India 2017, 14, 19–30. [Google Scholar] [CrossRef]
- Zhang, M.; Gao, B.; Chen, J.; Li, Y.; Creamer, A.E.; Chen, H. Slow-release fertilizer encapsulated by graphene oxide films. Chem. Eng. J. 2014, 255, 107–113. [Google Scholar] [CrossRef]


Disclaimer/Publisher’s Note: The statements, opinions and data contained in all publications are solely those of the individual author(s) and contributor(s) and not of MDPI and/or the editor(s). MDPI and/or the editor(s) disclaim responsibility for any injury to people or property resulting from any ideas, methods, instructions or products referred to in the content. |
© 2024 by the authors. Licensee MDPI, Basel, Switzerland. This article is an open access article distributed under the terms and conditions of the Creative Commons Attribution (CC BY) license (https://creativecommons.org/licenses/by/4.0/).