Abstract
The design and implementation of two-dimensional materials into a metal matrix have been the focus of considerable research interest for achieving enhanced properties. Nevertheless, conventional and modern manufacturing techniques often struggle to fabricate bulk 2D metal matrix composites (2DMMCs) while preserving the desired distribution and preventing thermomechanical damage to the constituent phases. Cold spray technology is a solid-state manufacturing method known for maintaining the composition of the original feedstock without causing significant detrimental changes during the deposition process. This study investigates the influence of cold spray process parameters on the microstructure, porosity, and microhardness of copper composites reinforced with 1 wt.% graphene platelets. The copper–graphene composite powder was synthesized via high-energy ball milling and subsequently deposited using two distinct sets of cold spray parameters employing medium- and high-pressure systems. Scanning electron microscopy, dispersive X-ray spectroscopy, porosity measurements, microhardness testing, and Raman spectroscopy were used to comprehensively evaluate the deposits. The findings demonstrate the preservation of the 2D phase and show how cold spray parameters influence porosity, hardness, and the incorporation of graphene within the copper matrix.
1. Introduction
Metal matrix composites (MMCs) are being increasingly developed to address the growing demand for enhanced mechanical and thermal performance in various fields while maintaining low density [1,2]. Copper (Cu), well regarded for its high thermal and electrical conductivity, is a primary candidate for applications in electronics, aerospace, and energy storage. However, its high thermal expansion coefficient, relatively low hardness, and susceptibility to wear limit its use in demanding environments [3]. To address these challenges, researchers have explored the integration of two-dimensional (2D) materials such as graphene (Gr) as reinforcements in Cu matrices. Gr, a 2D allotrope of carbon, possesses remarkable properties including high thermal conductivity, exceptional mechanical strength, and excellent electrical conductivity [4,5]. Incorporating Gr into Cu can potentially reduce thermal expansion, improve wear resistance, and enhance overall thermal stability, which are particularly valuable for applications in thermal management systems, high-performance electronics, and structural components exposed to high thermal loads [6]. Nevertheless, achieving effective Cu-Gr composites is challenging because of Gr’s sensitivity to mechanical strain, potential degradation under high shear forces, and tendency for non-uniform dispersion, which can result in compromised composite properties [7]. Various techniques for fabricating Gr-reinforced MMCs have been explored, including powder metallurgy, stir casting, friction stir welding, severe plastic deformation, selective laser melting, and pressure infiltration. These techniques generally offer a homogeneous distribution of Gr and ensure strong interfacial bonding. However, they often face challenges, including the formation of pores in powder metallurgy, limitations of Gr content in stir casting, difficulties in fabricating large or complex shapes through friction stir welding, severe plastic deformation, and issues with laser absorption in selective laser melting, owing to the characteristics of Gr. Recent advancements in pressure-infiltration casting have shown effectiveness in enhancing the thermal and mechanical properties of MMCs [8,9]. However, for GrMMCs, the poor wettability between graphene and the molten metal hinders the infiltration process, leading to weak bonding and nonhomogeneous reinforcement distribution. Although this method is effective for many applications, it often involves complex processing steps and high temperatures, which can result in issues such as interfacial degradation and uneven intermetallic formation [10,11].
Cold spray (CS) is an advanced solid-state deposition technology that utilizes a supersonic gas stream to accelerate powder particles to high speeds, causing them to adhere and form bonds with the target surface upon impact. This bonding occurs solely through high-velocity impacts rather than through melting, which enables CS to deposit metals and composites without altering feedstock properties [12,13]. CS minimizes thermal defects and oxidation in the deposited material by avoiding the high temperatures associated with melting-based techniques [14]. The solid-state and low-temperature nature of CS has high potential to mitigate the risk of damaging the Gr structure, allowing for the potential retention of its unique properties within the Cu matrix [15,16]. CS has demonstrated significant potential in coating deposition, repair, and, more recently, in additive manufacturing (AM), where it offers the ability to produce thick dense deposits with controlled deposition thicknesses [17,18]. CS allows for very high fabrication rates while maintaining desirable mechanical properties in the final product [19,20].
Although cold spray technology offers several advantages, it also has certain limitations. One key challenge is the limited control over the geometry and shape of the deposits owing to the Gaussian distribution of particles [21]. The lack of precise geometrical control is also due to the fact that this technique typically produces large spot sizes, making it less suitable for applications requiring fine details or intricate patterns [22]. Additionally, the process is highly sensitive to the particle size distribution (PSD) and the morphology of feedstock particles, which can significantly affect the deposition efficiency and coating quality [19]. These limitations highlight the need for the further optimization of process parameters and feedstock preparation to expand the applicability of CS in advanced manufacturing.
The performance of CS-deposited composites is highly sensitive to various process parameters. Parameters such as gas pressure and temperature determine the particle velocity, which influences its bonding behavior, and consequently, the density, microstructural characteristics, and mechanical properties of the deposited coating [23,24,25]. This sensitivity to process parameters has resulted in varying outcomes reported in the literature, with some investigations demonstrating high-density deposits exhibiting favorable mechanical properties, while others have reported challenges such as increased porosity, inadequate bonding, or insufficient Gr distribution, all as part of the very limited number of studies performed on this topic [26,27]. These inconsistencies highlight the need for a systematic investigation of CS process parameters to optimize the deposition conditions for Cu-Gr composites.
The primary objective of this investigation was to evaluate the potential of CS to preserve the integrity of the 2D phase in the deposit. This necessitates the meticulous selection of CS process parameters. Thus, in this study, we investigated the relationships between CS process parameters and the key characteristics of deposited Cu-Gr composites, focusing on particle bonding, porosity, grain structure, microhardness, and Gr conservation within the Cu matrix. Two distinct CS parameter sets were analyzed to determine their effects on the microstructure and mechanical properties of Cu-Gr composites reinforced with 1 wt.% Gr using mid- and high-pressure cold spray systems. Characterization methods, including porosity and microhardness measurements, scanning electron microscopy (SEM), dispersive X-ray spectroscopy (EDS) analysis, and Raman spectroscopy, were used to provide a comprehensive understanding of how different CS process parameters affect the quality, structure, and performance of the obtained composites. By systematically comparing the outcomes of the two parameter sets, this study will generate valuable insights into optimizing CS conditions to produce high-quality Cu-Gr composites, with broader implications for advanced applications where material performance and reliability are paramount.
2. Materials and Methods
2.1. Powder Preparation
Few-layered Gr was synthesized in-house via the mechanical exfoliation of industrial graphite flakes (Sigma Aldrich 332461, Merck KGaA, Darmstadt, Germany). Commercial spherical Cu powder (99.95% purity, particle size of 15–38 µm) was purchased from Safina CZ (Safina CZ, Prague-Vestec, Czech Republic). Gr-reinforced Cu matrix composite powders were prepared via low-energy dry ball milling using a planetary ball mill. In this process, 1 wt.% Gr was added to the Cu powders at a milling speed of 150 rpm for a duration of 6 h and a powder-to-ball ratio of 1:10. Both the 500 mL milling jars and the 5 mm grinding balls were made of stainless steel 304. Milling was performed under a protective argon atmosphere to prevent the oxidation of the Cu powder [28].
2.2. Medium- and High-Pressure CS Depositions
Major CS parameters, including the process gas stagnation pressure and temperature, feed rate, and standoff distance, determine the particle velocity and temperature at the onset of impact. Consequently, these factors are critical in determining both the potential thermomechanical damage to the 2D phase and the principal characteristics of the deposit, such as porosity and hardness, as well as process effectiveness, which is expressed in terms of deposition efficiency. To evaluate the state of Gr in the CS deposits, CS experiments were conducted using two CS systems: a mid-pressure system and a high-pressure system. Each system employed a distinct set of process parameters to compare the resulting CS deposits. Pure Cu was used as the substrate and Cu-Gr 1% as the feedstock powder in both cases. The following sections briefly present the details and parameters of each trial.
2.2.1. Mid-Pressure CS Trials
An in-house CS system (STAM laboratory, TCD, IRE) was used with a WC-15Co De-Laval-type nozzle with a throat diameter of 2 mm and an exit diameter of 6 mm. It featured a 29.78 mm converging section and a 180.22 mm diverging section. The parameters for the mid-pressure process, as detailed in Table 1, were derived from a recent investigation of CS deposition. This earlier study examined the deposition of a Cu-1 vol% Gr ball-milled feedstock onto an aluminum substrate using the same CS system [22]. The nozzle toolpath strategy included two raster sections, each consisting of three tracks with a hatch distance of 3 mm. Each section was covered 3 times using the same toolpath strategy.

Table 1.
List of process parameters used for both mid- and high-pressure CS trials.
2.2.2. High-Pressure CS Trials
To perform high-pressure CS, an Impact 6/11 gun equipped with a SiC OUT1 nozzle (Impact Innovations GmbH, Rattenkirchen, Germany) with an expansion ratio of 5.6 was used. The main process parameters were selected following a literature review and a search among works implementing high pressure for the CS deposition of pure Cu, focusing on those yielding high deposition efficiency and low porosity, together with a high ductility of the final deposit for pure Cu [29]. The toolpath strategy was a raster arrangement of ten tracks with a hatch distance of 1.2 mm, which was repeated twice. The parameters of the mid- and high-pressure CS trials, hereafter referred to as mid-P and high-P, are summarized in Table 1.
2.3. Characterization Techniques
2.3.1. Particle Size Distribution
Particle size and shape influence the critical velocity required for successful adhesion. In addition, particle size distribution (PSD) affects the flowability of the powder, which consequently influences the stability of the powder feeding rate and the consistency of deposit formation and properties. To consider these possible parameters, a sample of feedstock comprising 20,000 particles was scanned and analyzed using the Malvern Morphologi 4 automated imaging system for particle characterization (Malvern Panalytical, Malvern, UK). This analysis yielded results encompassing the particle equivalent circle diameter distribution based on the number and volume, in addition to other pertinent outputs, such as sphericity and aspect ratio.
2.3.2. Microscopical Observations
For the SEM observations, the deposits were cut, cleaned, and cold-mounted using resin pellets, and subsequently ground using gradually refined abrasive paper. The final polishing step was performed with colloidal silica to obtain a smooth scratch-free surface. SEM analysis was performed using a Zeiss Sigma 500 instrument (Zeiss, Oberkochen, Germany) equipped with an Altee energy-advanced (Oxford Instruments, Abingdon, UK) EDS system. A Nikon Eclipse LV150NL light optical microscope (OM) (Nikon Metrology NV, Leuven, Belgium) with a maximum magnification of 100×, was also used to investigate the polished specimen cross-sections after chemical etching. The etching step consisted of 100 mL of cold saturated + 40 g solution for 30 s.
2.3.3. Porosity Measurements
Variations in the process parameters influence the impact velocity of the particles, their subsequent deformation, and consequently, the porosity of the resultant deposit. Archimedes’ principle was used to measure any discrepancies between the apparent and actual deposit volumes. This approach relies on the precise measurement and comparison of the volume and dry and wet mass of the sample, adhering to the methodology delineated in ASTM D792-20 [30]. The measurements were performed using a Sartorius YDK01 density measurement kit (Sartorius AG, Göttingen, Germany). When executed with precision, this methodology yields a global estimation of deposit porosity, transcending the limitations inherent in localized observations and measurements associated with the image processing method.
2.3.4. Raman Spectroscopy
Raman spectroscopy was performed using the WITec-Raman Alpha 300R system (Oxford Instruments, Ulm, Germany) with a laser excitation wavelength of 532 nm. Characterization was conducted using a 600 g/mm grating. Each spectrum was acquired with an iteration time of 2 s and accumulation of 50 scans to enhance the signal.
2.3.5. Microfocus X-Ray CT Analysis
A microfocus X-ray Computed Tomography (CT) scanning system (Nikon, XTH225ST, Tokyo, Japan) was used to conduct a comprehensive void and carbon phase distribution analysis on the mid-P samples with a maximum 225 kV X-ray source and a 3 µm focal spot size. The scanned sample was obtained from the deposited layer with a cross-sectional area of 2.56 mm2 and a height of 4 mm. It was positioned on the stage and incrementally rotated for exposure (708 ms per step) under X-ray irradiation at a voltage of 200 kV.
2.3.6. Microhardness Measurements
Microhardness is considered a significant indicator of the mechanical properties and wear resistance of CS deposits and coatings, with higher microhardness often leading to improved wear resistance [31]. This relationship has been observed across various materials and applications of CS technology. The microhardness of CS deposits can vary significantly from the coating–substrate interface to the surface. Near the interface, the microhardness is typically higher owing to the severe plastic deformation and work-hardening of the particles during impact [32]. As the coating builds up, the microhardness may decrease toward the surface owing to the reduced impact energy and reduced particle deformation [33]. Herein, measurements were performed on the polished cross-sections of the deposits using a microhardness machine FM 700 (FUTURE-TECH CORP, Kanagawa, Japan) with a 300 g test load and a dwell time of 10 s. Microhardness measurements were conducted at five equidistant vertical positions across the deposit thickness, ensuring the exclusion of the deposit–substrate interface and top edge. At each vertical position, three measurements were performed at distinct lateral points. The average values of the two deposits are reported.
3. Results
3.1. Powder Characterization
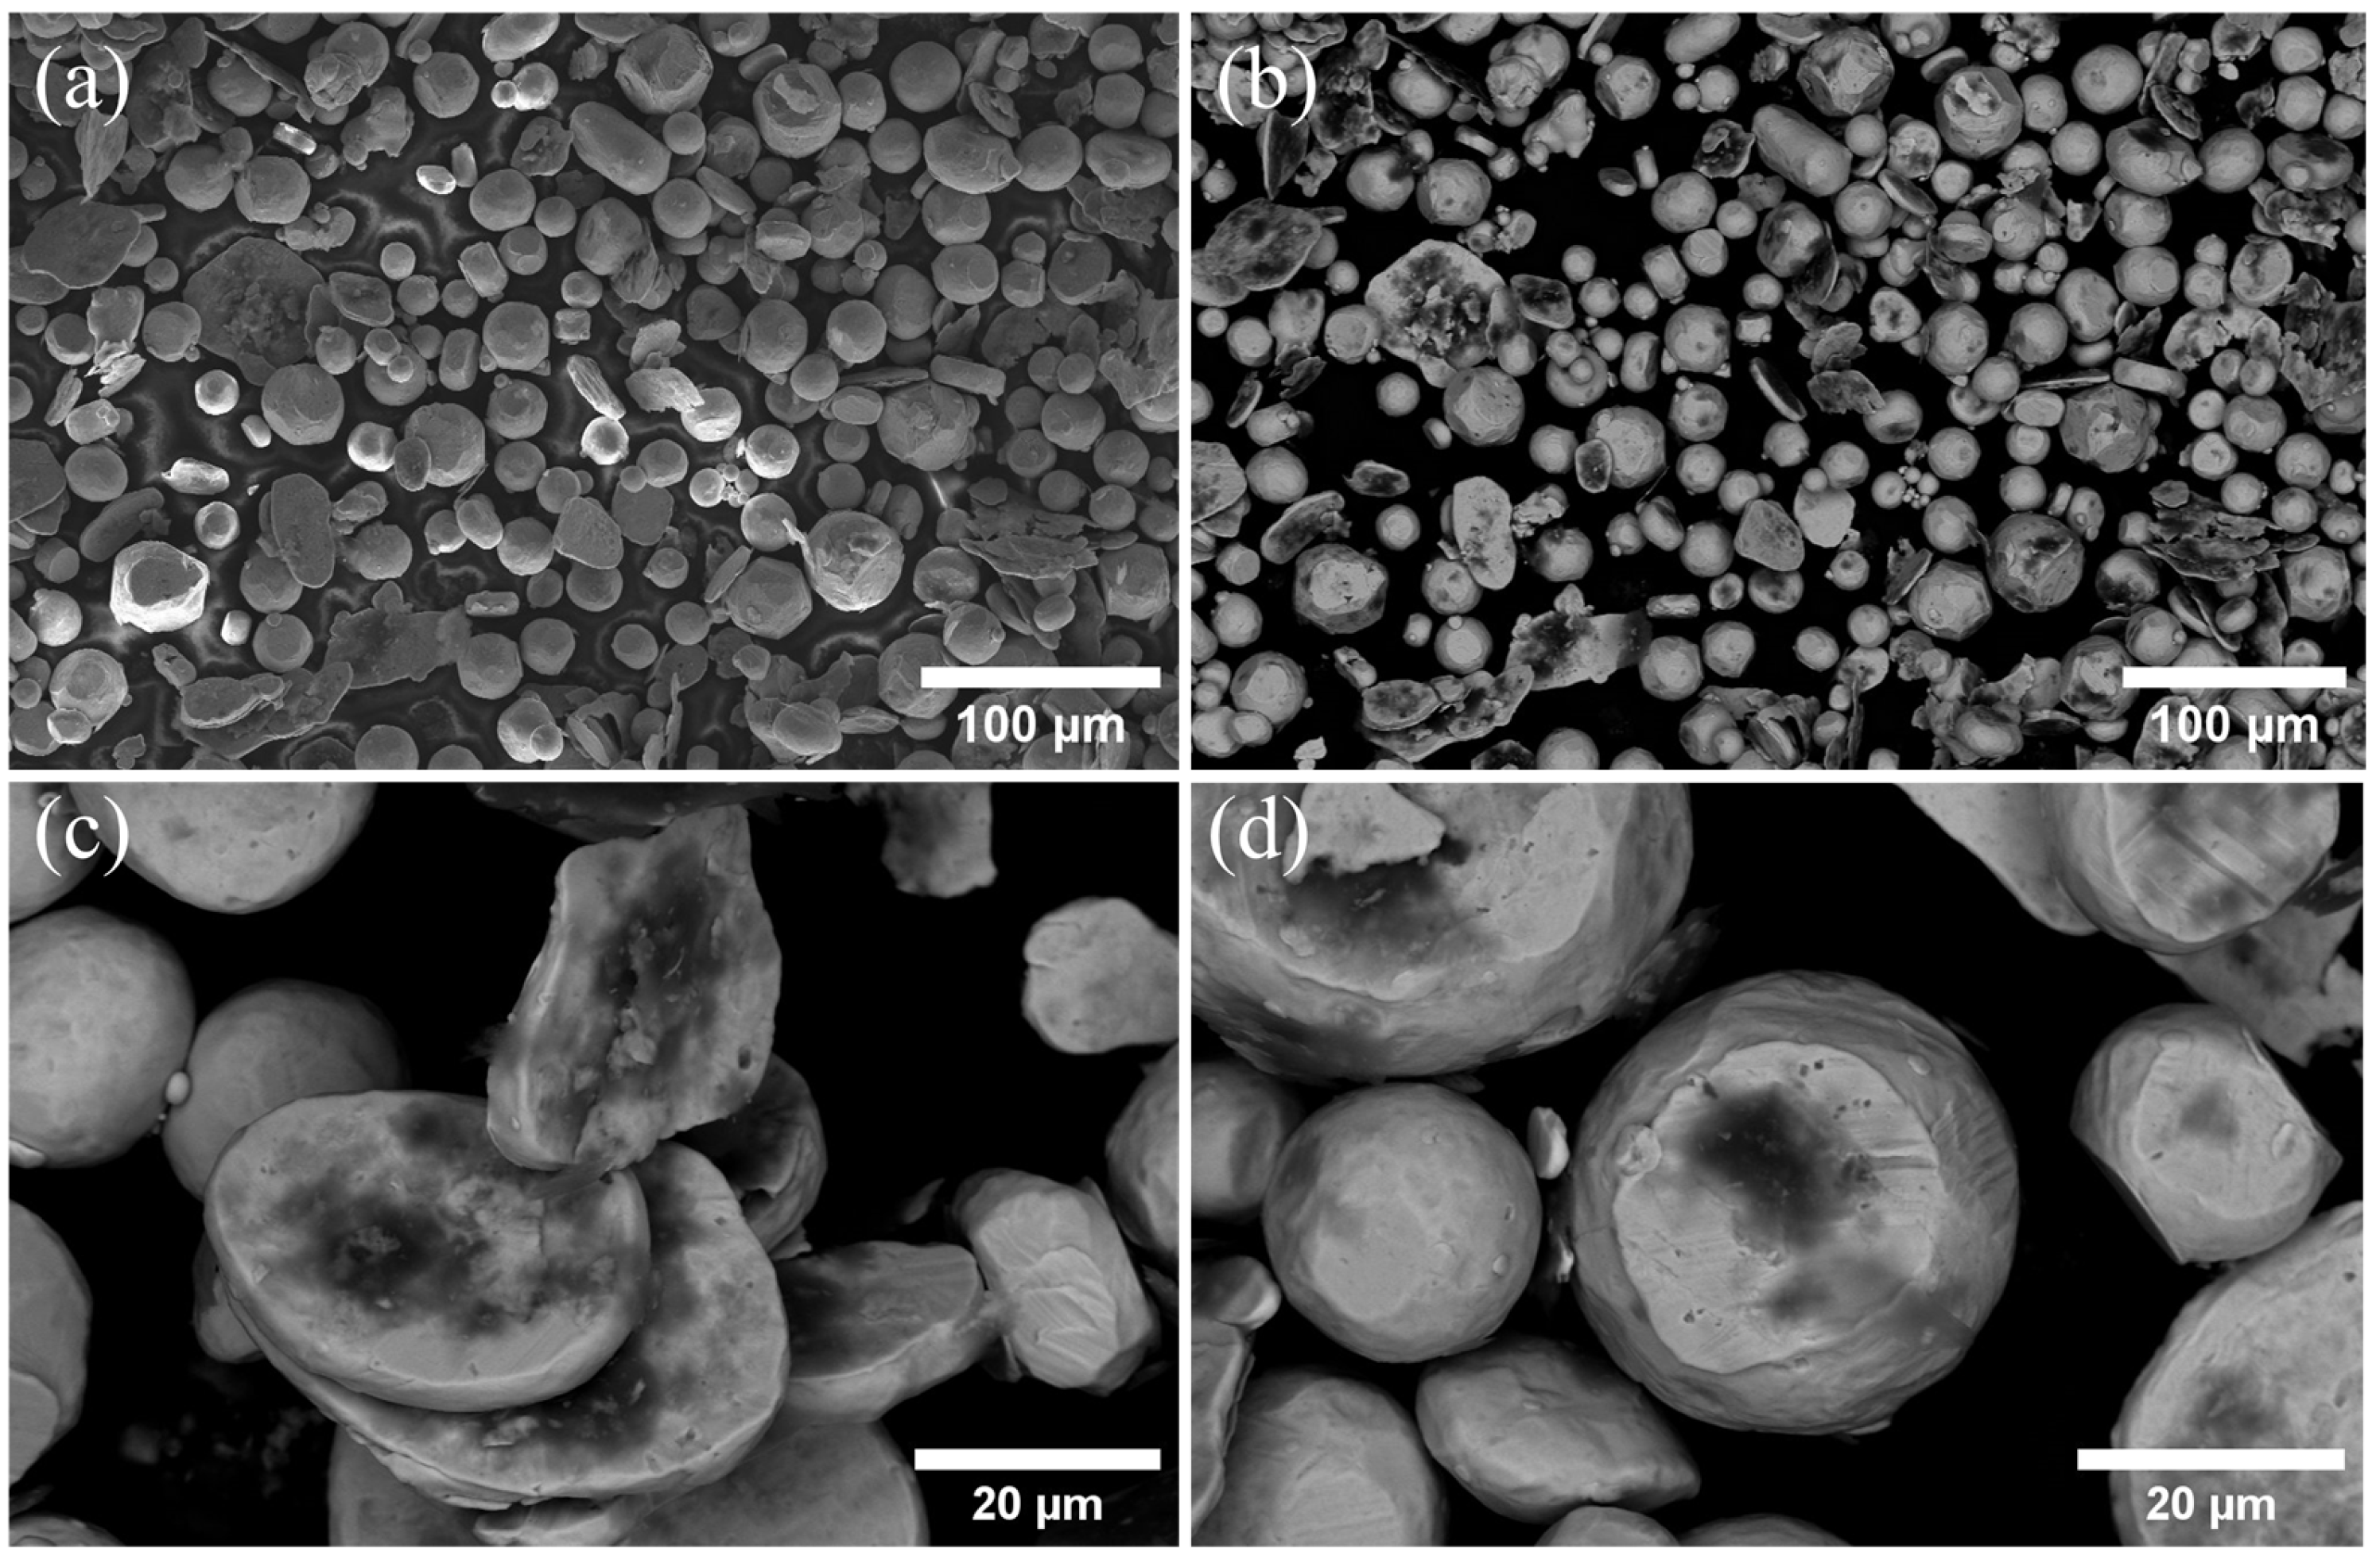
The Cu-1 wt.%Gr (Cu-Gr) composite powder was examined in terms of the particle morphology and material properties pertinent to CS applications. SEM analysis (Figure 1) indicates that the Cu-Gr composite exhibited a heterogeneous morphology consisting of both spherical and flake-like particles. Generally, ball milling significantly modifies the particle shape, converting spherical particles into flatter disk-like forms. However, in this case, we noticed less flattening than expected compared to the initial fully spherical morphology of the pure copper feedstock. These findings suggest that the addition of Gr during ball milling can have a considerable impact on the shape characteristics of the resulting powder.

Figure 1.
(a,b) SEM images of ball-milled Cu-Gr powder and (c,d) higher magnification images of particles highlighting different morphologies.
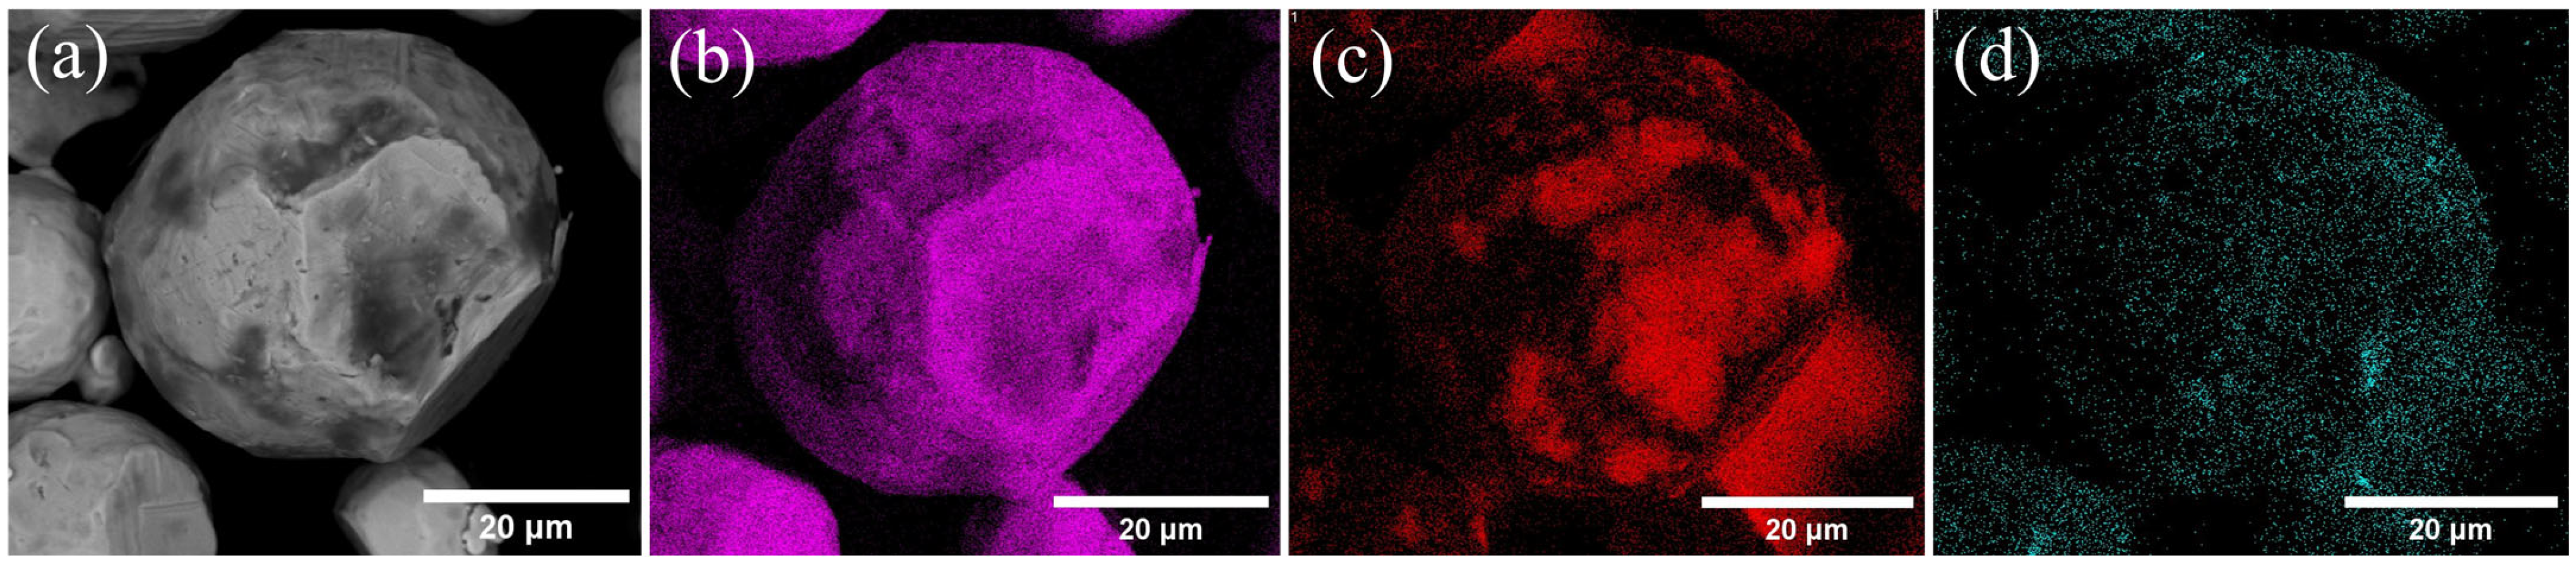
Backscattered SEM images revealed distinct dark regions on the surface of certain Cu particles corresponding to Gr, thus confirming the effective surface adhesion and dispersion of Gr after ball milling. Furthermore, EDS mapping (Figure 2) verified the presence of carbon (from Gr), Cu, and oxygen traces, confirming the integration of Gr onto the Cu particle surfaces.

Figure 2.
EDS elemental mapping of Cu-Gr particles: (a) micrograph of the particle (b) Cu, (c) carbon, and (d) oxygen contents.
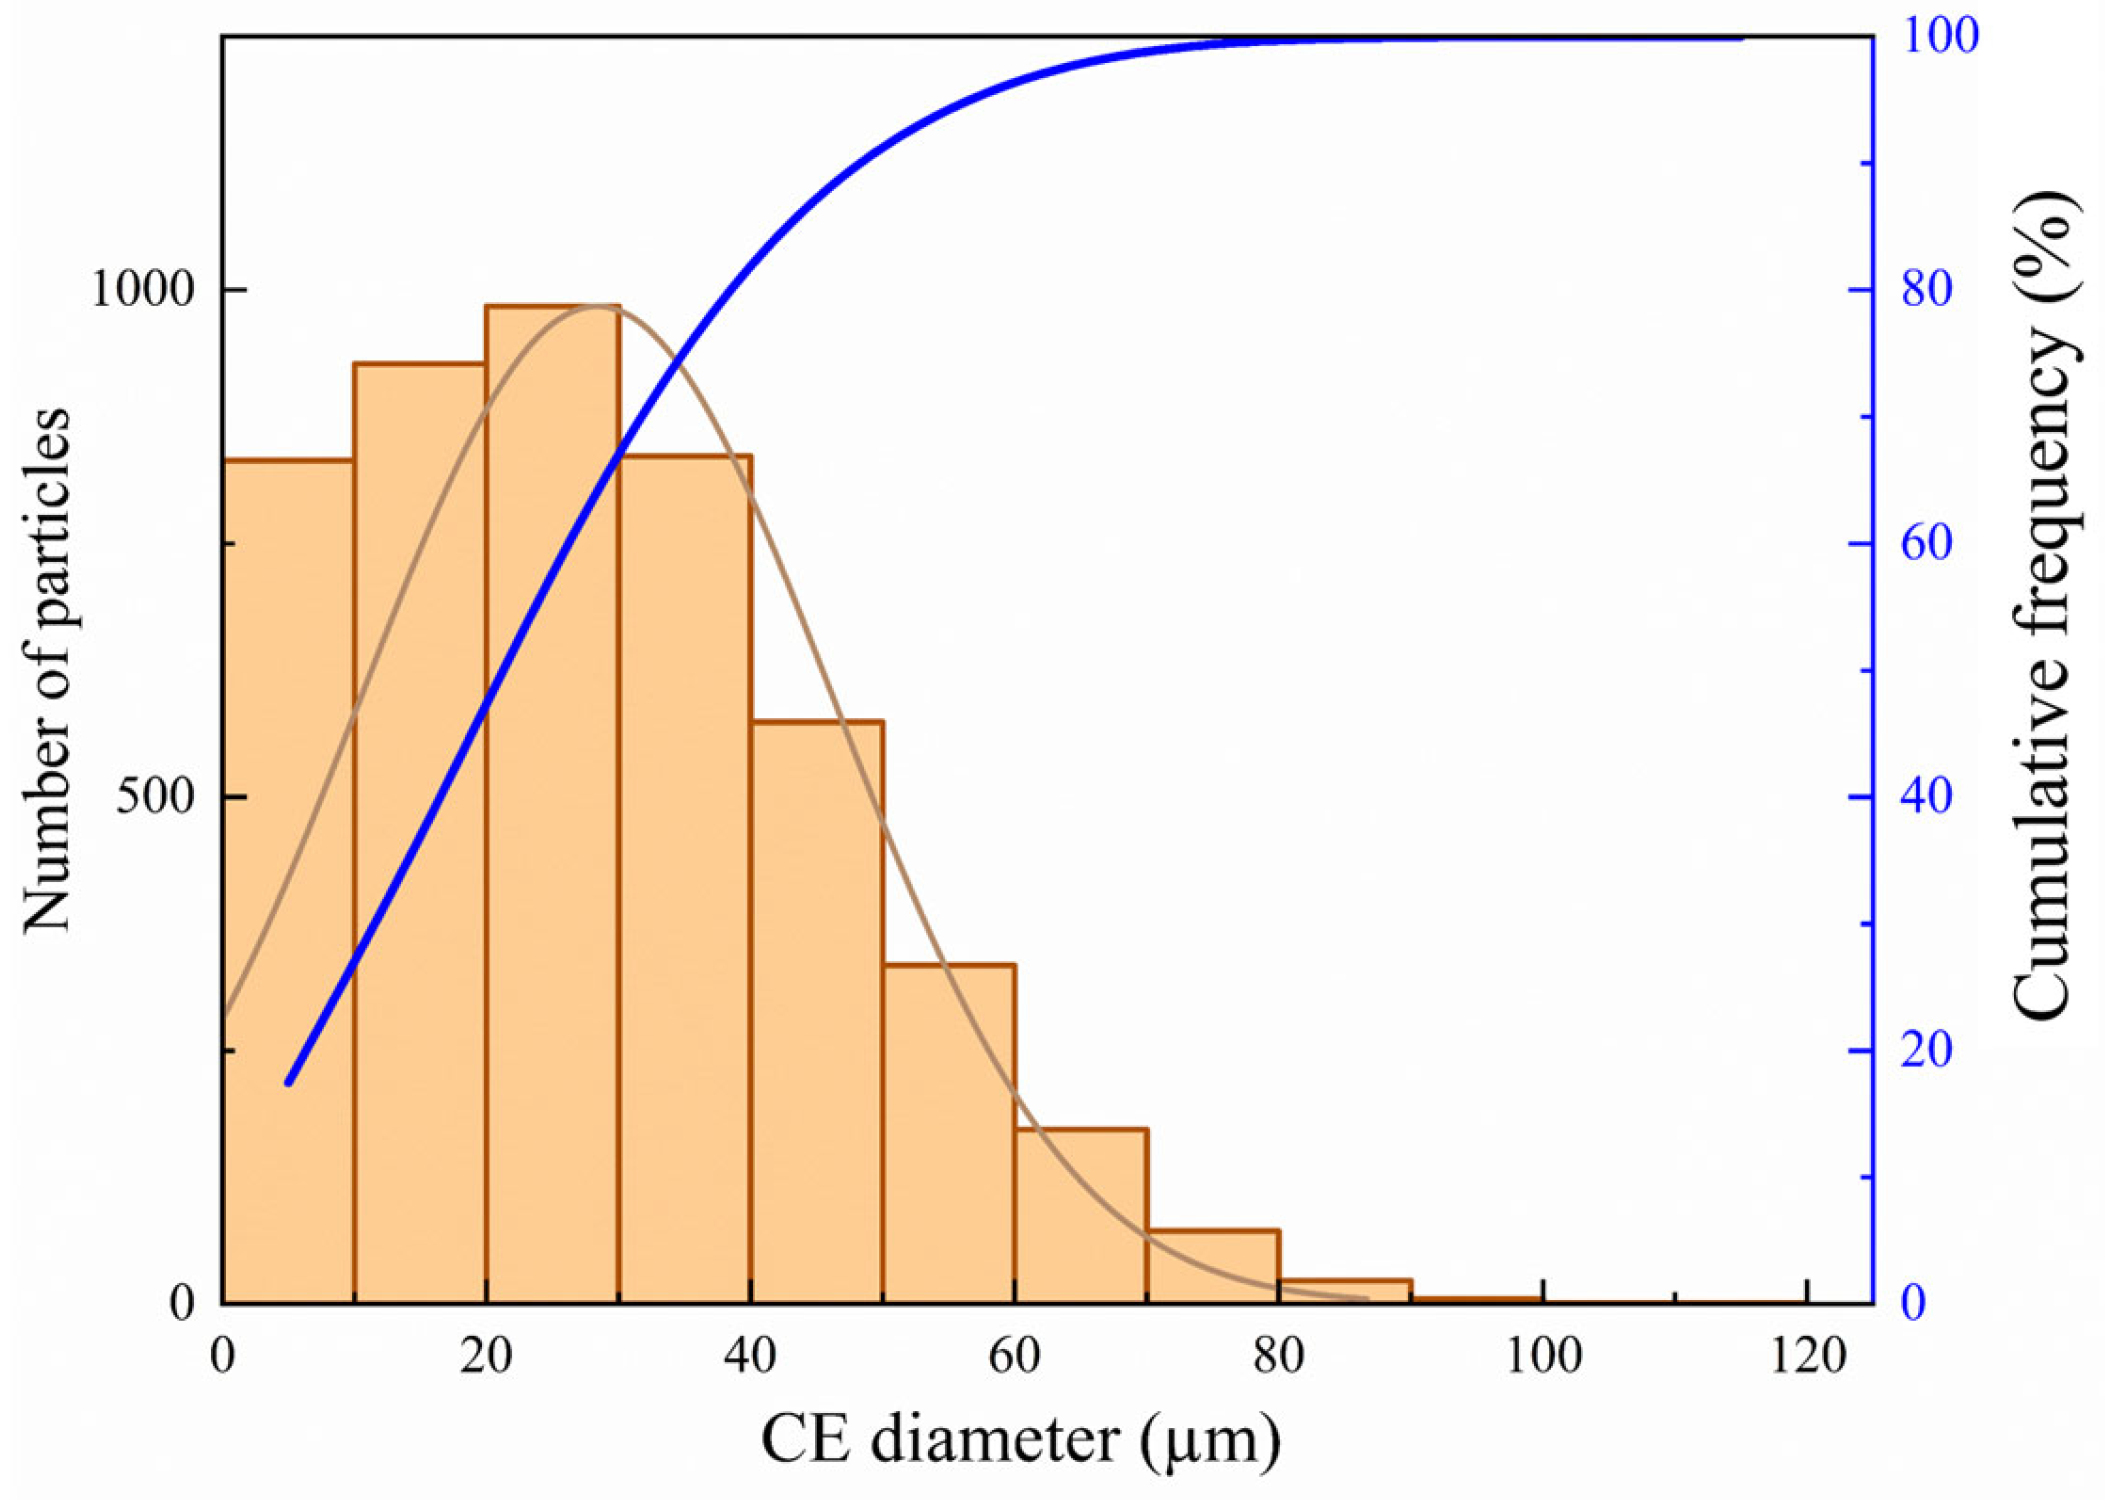
The PSD results of circle equivalent (CE) diameters (Figure 3) revealed D_10, D_50, and D_90 values of 2.64 μm, 18.19 μm, and 36.15 μm, respectively, indicating a significant variability in particle sizes. The minimum particle diameter was measured to be 1.01 μm, whereas the largest particle size was found to be 113.89 μm. This broad distribution suggests that the powder consists of both fine and coarse particles. The considerable volume and number of very fine particles, as shown in Figure 3, make this PSD potentially not ideal for CS, where a controlled range of particle sizes and shapes is beneficial for optimizing deposition efficiency and coating quality [34].

Figure 3.
A graph depicting the distribution of particle sizes, showing both the quantity and cumulative frequency of particles in the feedstock based on their CE diameter.
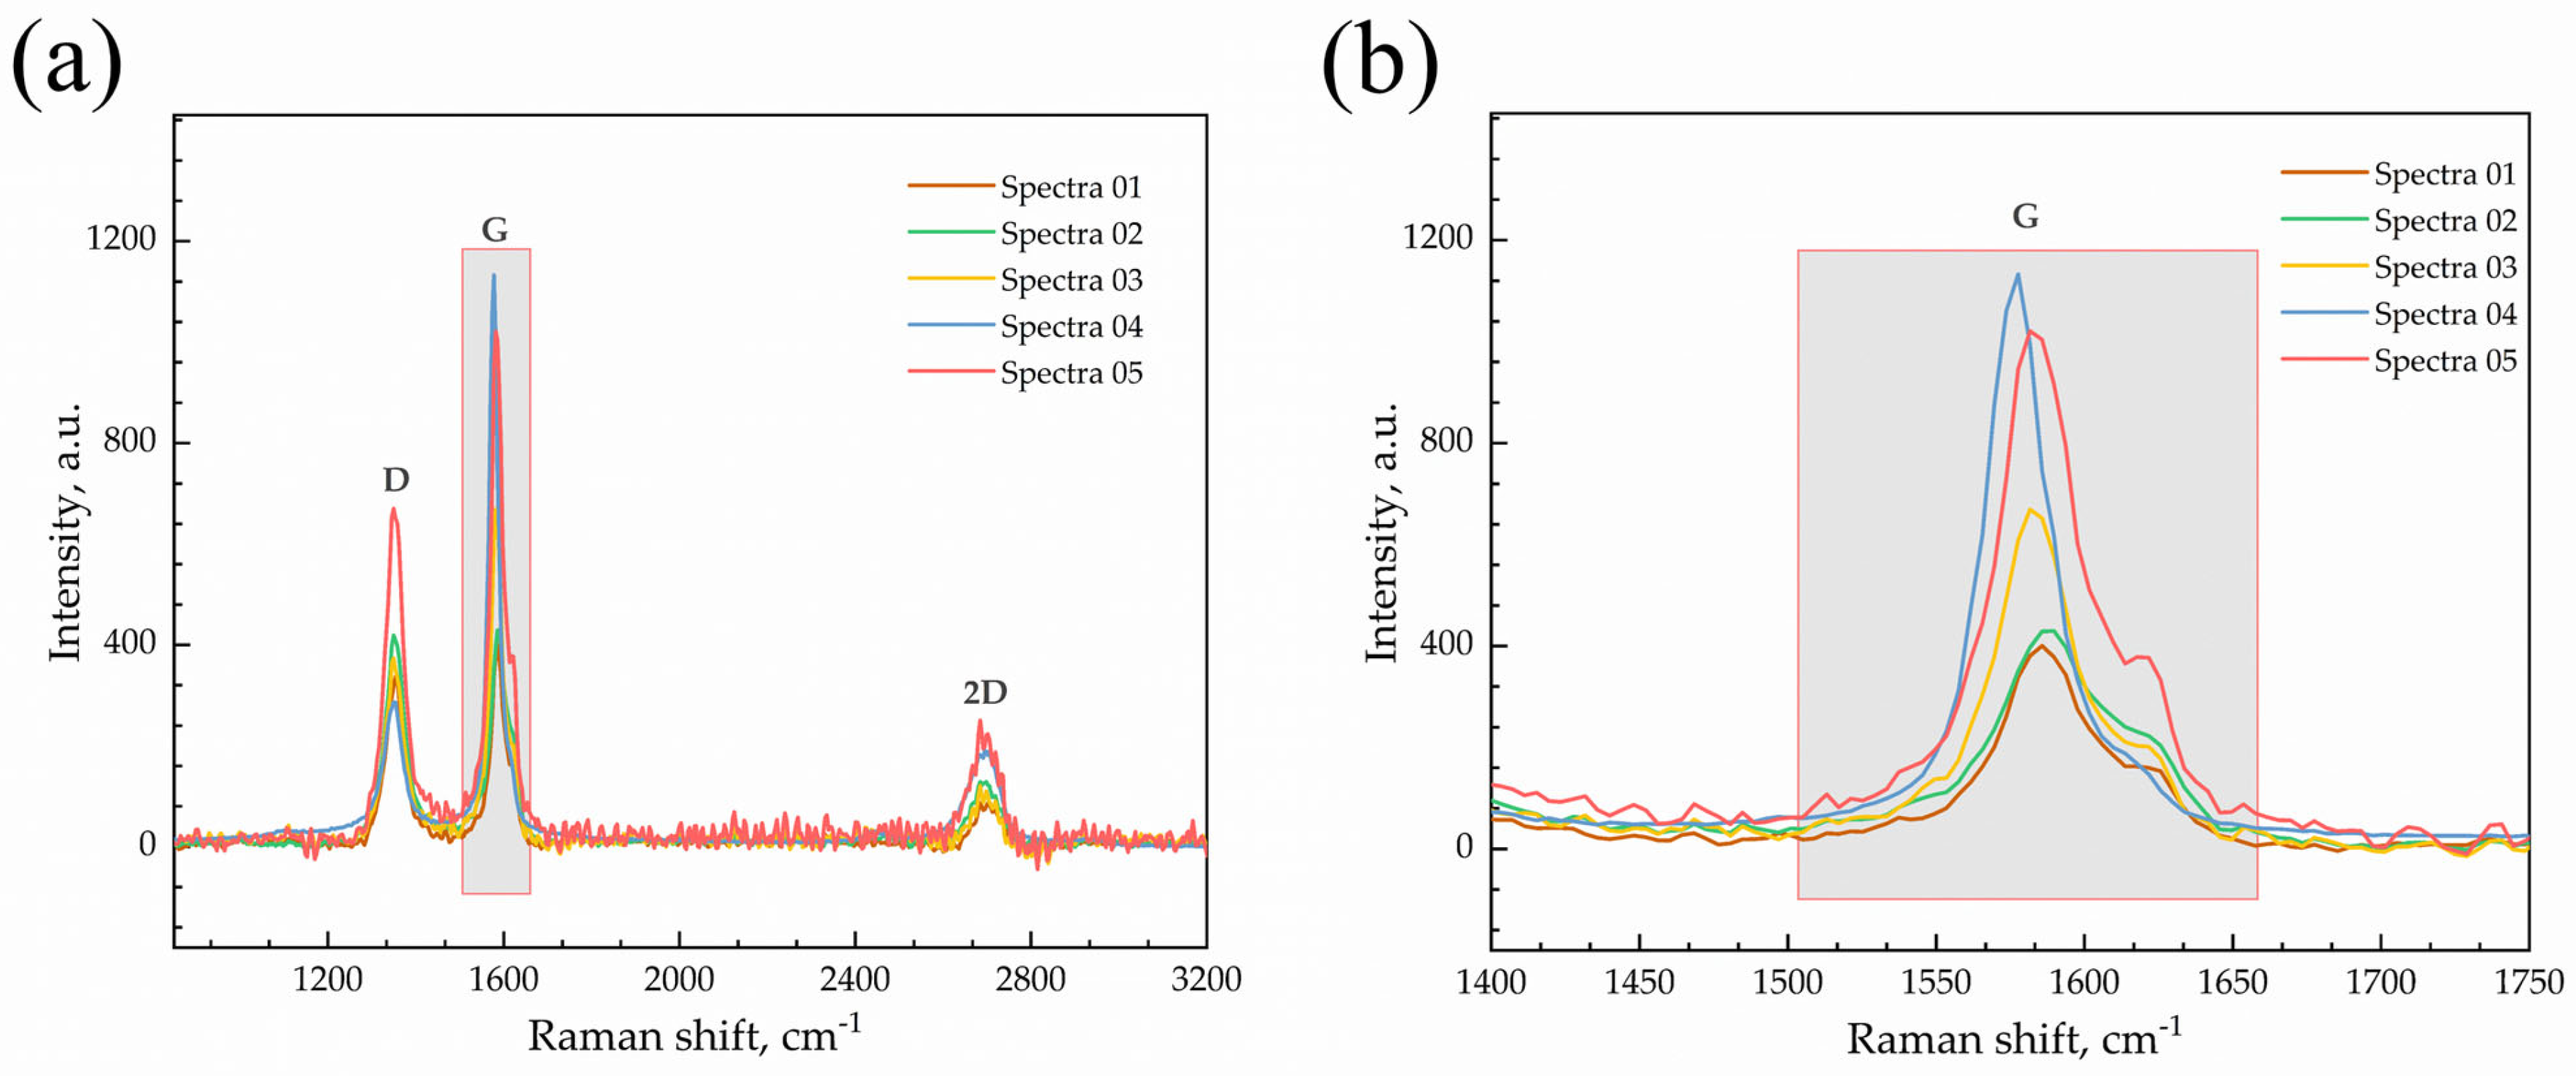
Raman spectroscopy can be used to identify the presence and state of Gr in the feedstock and within the deposit. This non-destructive technique provides valuable information regarding the structural integrity and quality of the incorporated Gr. Through the analysis of the characteristic peaks in the Raman spectrum, particularly the G band (~1580 cm−1) and 2D band (~2700 cm−1), it is possible to confirm the presence of Gr and assess its layer thickness. The intensity ratio of these bands () indicates whether the Gr is single-layer, few-layer, or multilayer [35]. Graf et al. have compared the Raman spectra for different numbers of layers of Gr and reported that the intensity ratio G band is stronger than the 2D band for few-layer Gr [36]. The presence of multilayer Gr can be identified by analyzing the ratio, where a decrease in this ratio indicates an increase in the number of Gr layers [37]. Furthermore, the D band (~1350 cm−1) provides information regarding defects or disorders in the Gr structure [38].
The results of the Raman spectroscopy analysis of the Cu-Gr composite powder are shown in Figure 4. The Raman spectra collected from five distinct regions of the composite powder exhibit G and 2D peaks at Raman shifts, indicative of the presence of graphene. The analysis revealed average intensity ratios of = 0.2421 and = 0.6650, with a D peak observed at 1350 cm−1. These findings suggest the existence of structural irregularities and imperfections as well as the presence of few-layer graphene. Furthermore, Mohiuddin et al. reported that the G peak in Raman spectroscopy is highly sensitive to strain and stress [39]. When the material undergoes strain, the G peak splits into two sub-bands: and . As the strain increases, the splitting between these components becomes more pronounced. The 2D and D peaks can also exhibit a downshift in frequency; however, they do not split under small strains. Figure 4 shows a slight splitting of the G peak, which can be attributed to the effects of the ball milling process. This suggests that the Gr particles experienced varying levels of stress during ball milling, as confirmed by the different morphologies shown in Figure 1. As previously explained, the mixed morphology of the powders is a direct consequence of the ball milling process.
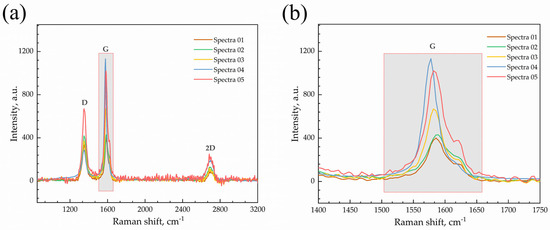
Figure 4.
Raman spectroscopy for Cu-Gr ball-milled powder and (a) representation of G, 2D, and D peaks and (b) G peak zone.
3.2. Deposit Characterization
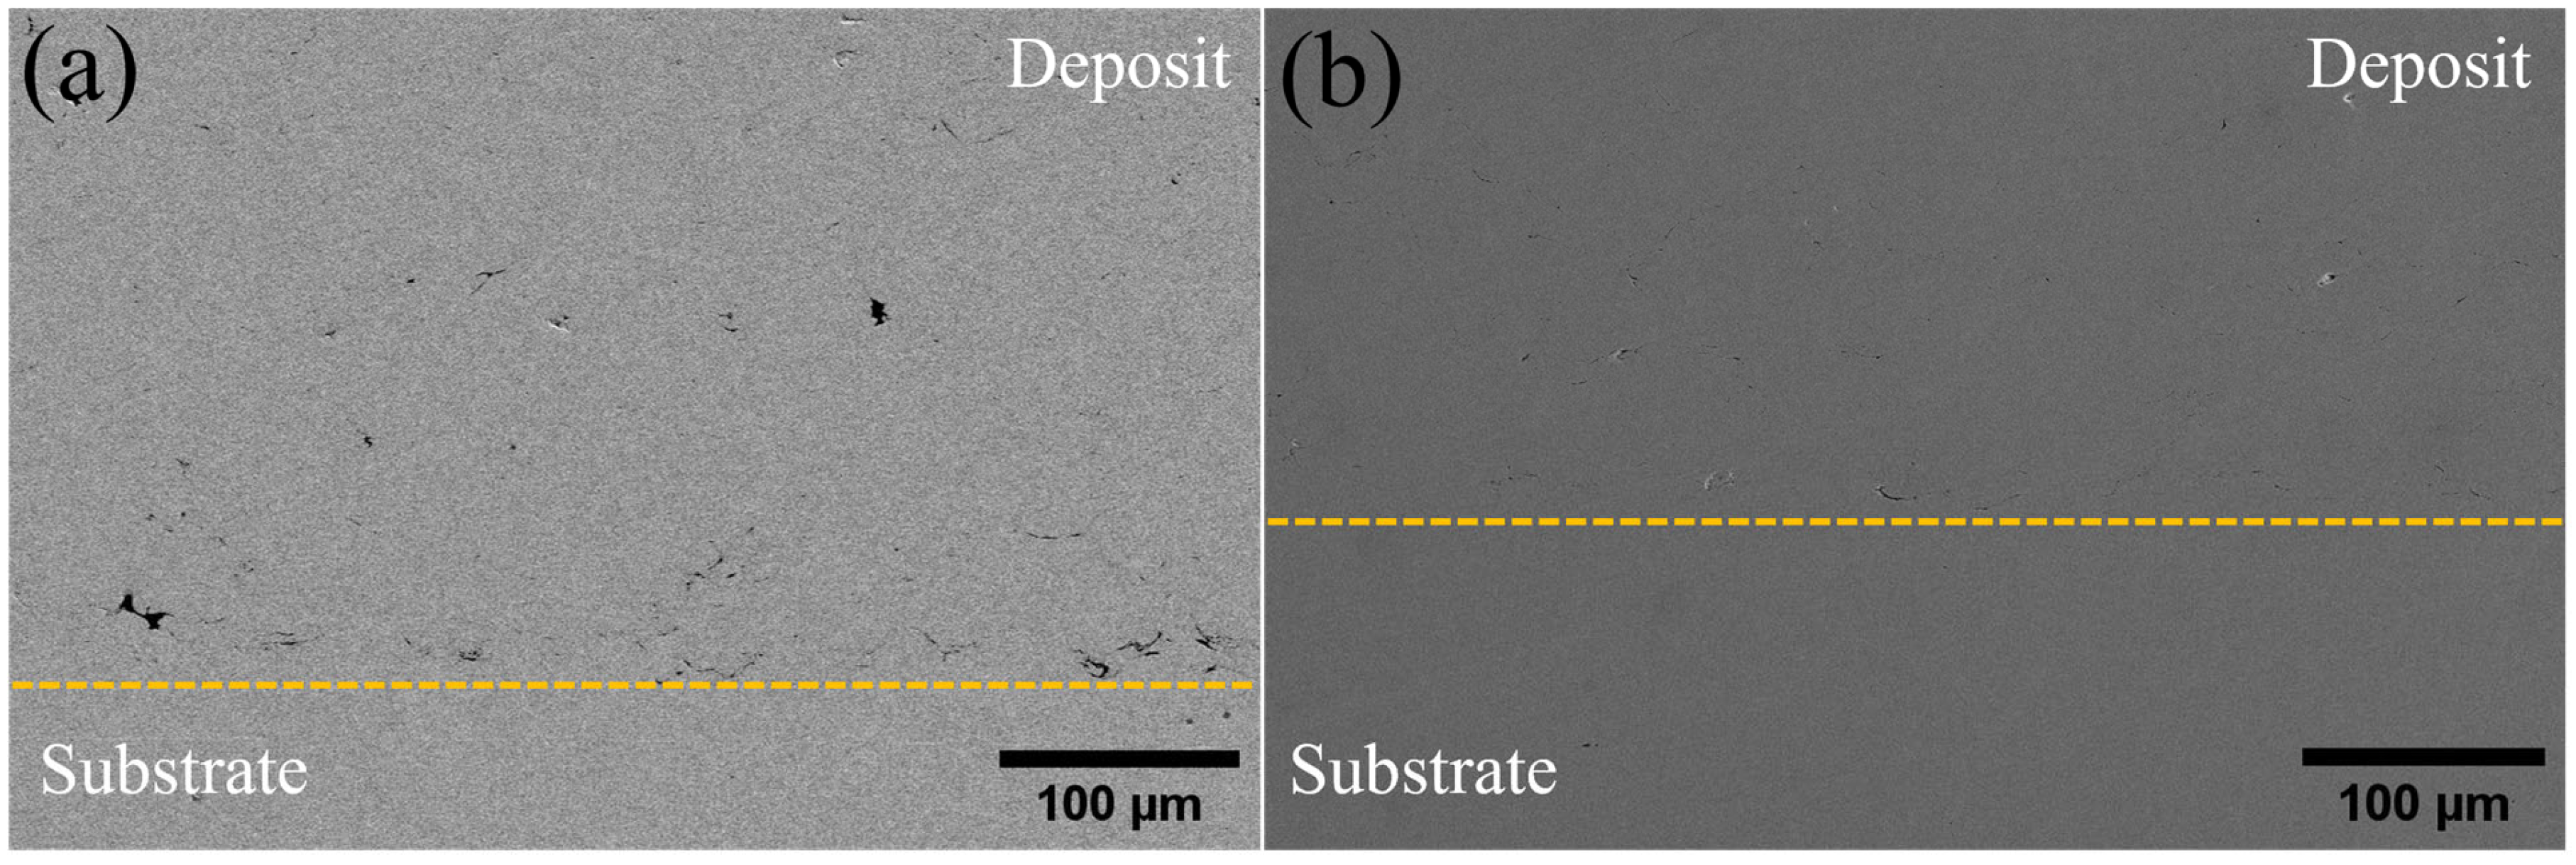
Figure 5 presents SEM images of the cross-sections of the samples deposited with two distinct CS parameter sets, along with their measured relative densities, emphasizing the influence of the process parameters on the microstructural characteristics.
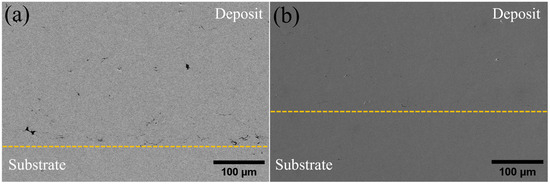
Figure 5.
SEM cross-sectional images of both samples, (a) mid-P and (b) high-P; the dashed line represents the interface between the substrate and the deposited coating.
The micrographs reveal differences between the two samples in terms of particle bonding and porosity. In the mid-P sample (Figure 5a), the microstructure showed the presence of a few pores and irregular particle interfaces, indicating weaker bonding compared to the high-P sample. The slightly higher temperature used for the deposition of the high-P samples promoted particle ductility and deformation, whereas the increased pressure provided a higher kinetic energy for effective impact and adhesion. The measurements using the Archimedes method indicated a density of 96.2% (8.606 g/cm3) for the mid-P series compared to 99.2% (8.87 g/cm3) for the high-P samples, which demonstrated a denser and more uniform microstructure (Figure 5b).
Nevertheless, the SEM images of both samples in Figure 5 reveal that the disparity in the porosities of the two series in the central region is significantly less pronounced. The substantial variation in the measured porosities can be explained by the increased local porosity observed in the upper layers of the mid-P deposits, as discussed later.
Notably, in both series, Gr appeared to have integrated well within the Cu matrix without introducing additional voids, demonstrating its compatibility with the CS process. Similar behavior has been reported in Gu-Cu composite films produced by CS, where Gr, which was grown on Cu particles via chemical vapor deposition (CVD), showed successful integration into the matrix without increasing porosity [15].
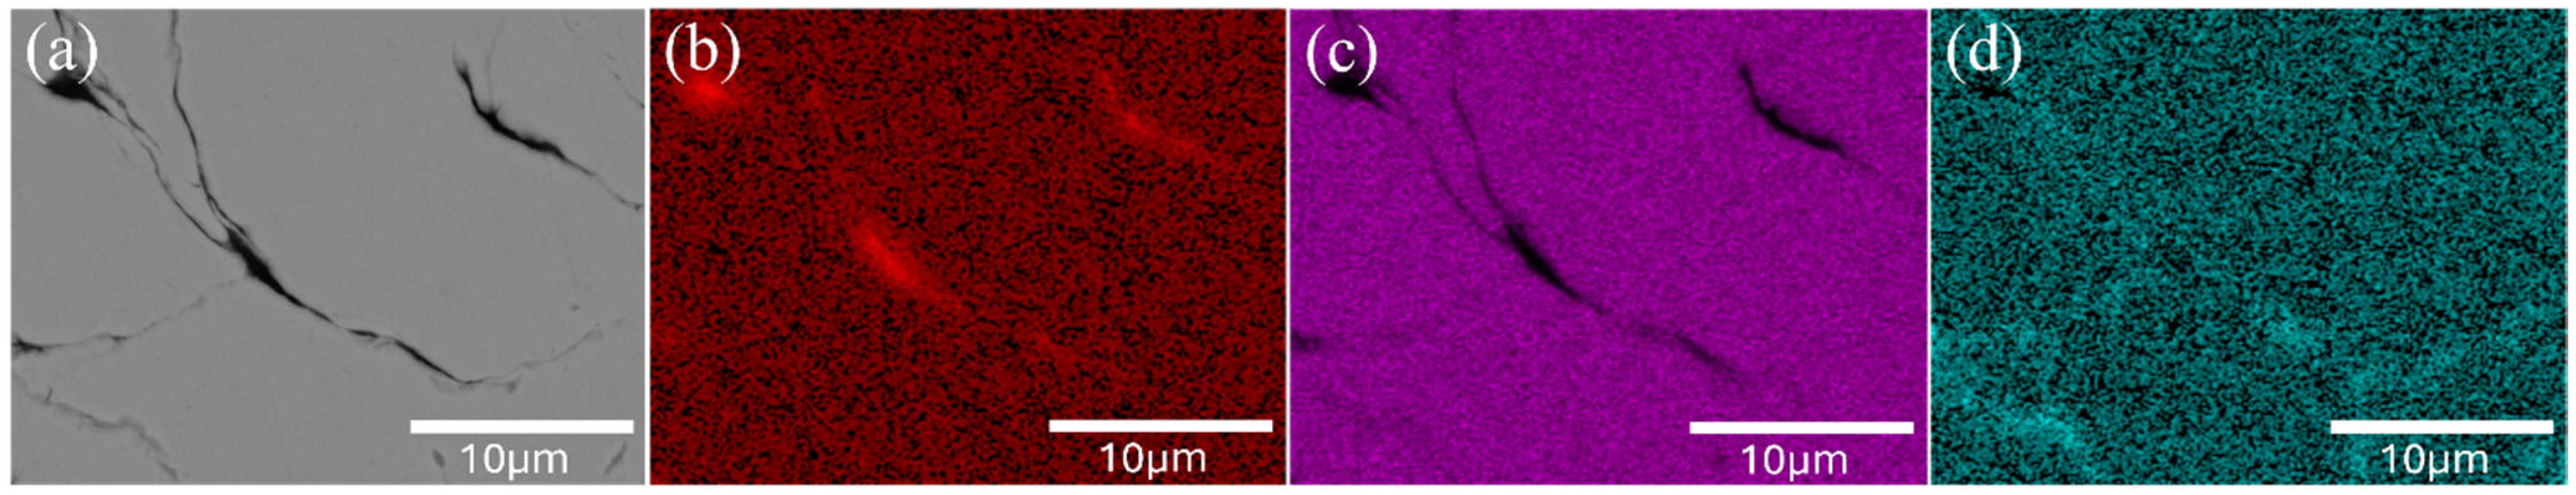
SEM and EDS mapping was performed to further assess the Gr distribution within the deposits. The EDS maps of the high-P sample, shown in Figure 6, confirm the uniform distribution of Gr across the matrix, indicating that the higher processing temperature and spray pressure effectively preserved and embedded the Gr phase in the structure. The concurrent examination of the SEM and EDS results (Figure 6) reveals that the carbon content detected in the images is indicative of the presence of Gr following the deposition process.
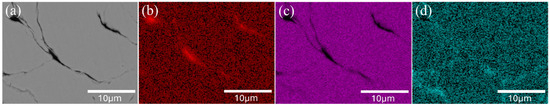
Figure 6.
(a) SEM image of the cross-sectional area and EDS maps exhibiting the distribution of (b) carbon, (c) Cu, and (d) oxygen within the high-P sample.
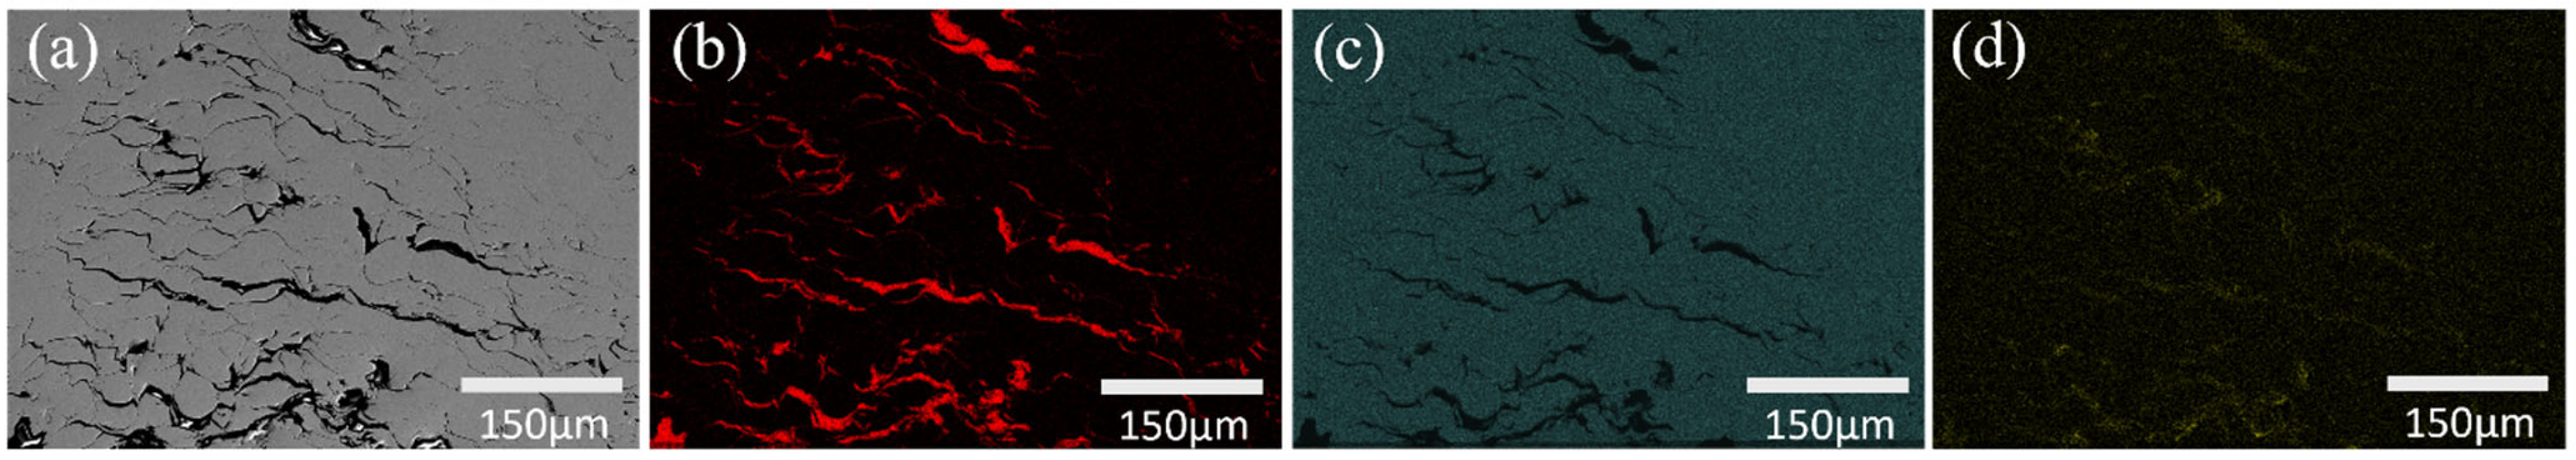
In contrast, for the mid-P sample, EDS analysis (Figure 7) revealed the presence of elongated black striated structures across the deposited area. These formations, previously identified as carbon phases in the feedstock using EDS, were also observed near the surface of the deposit. This suggests that the lower processing conditions may have resulted in the partial detachment or aggregation of Gr, with the carbon phase being locally concentrated at the surface rather than uniformly integrated into the matrix.
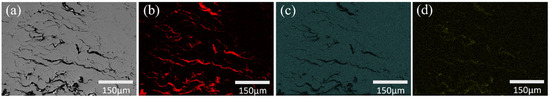
Figure 7.
(a) SEM image of the cross-sectional area and EDS maps exhibiting the distribution of (b) carbon, (c) Cu, and (d) oxygen near the top region of the mid-P sample.
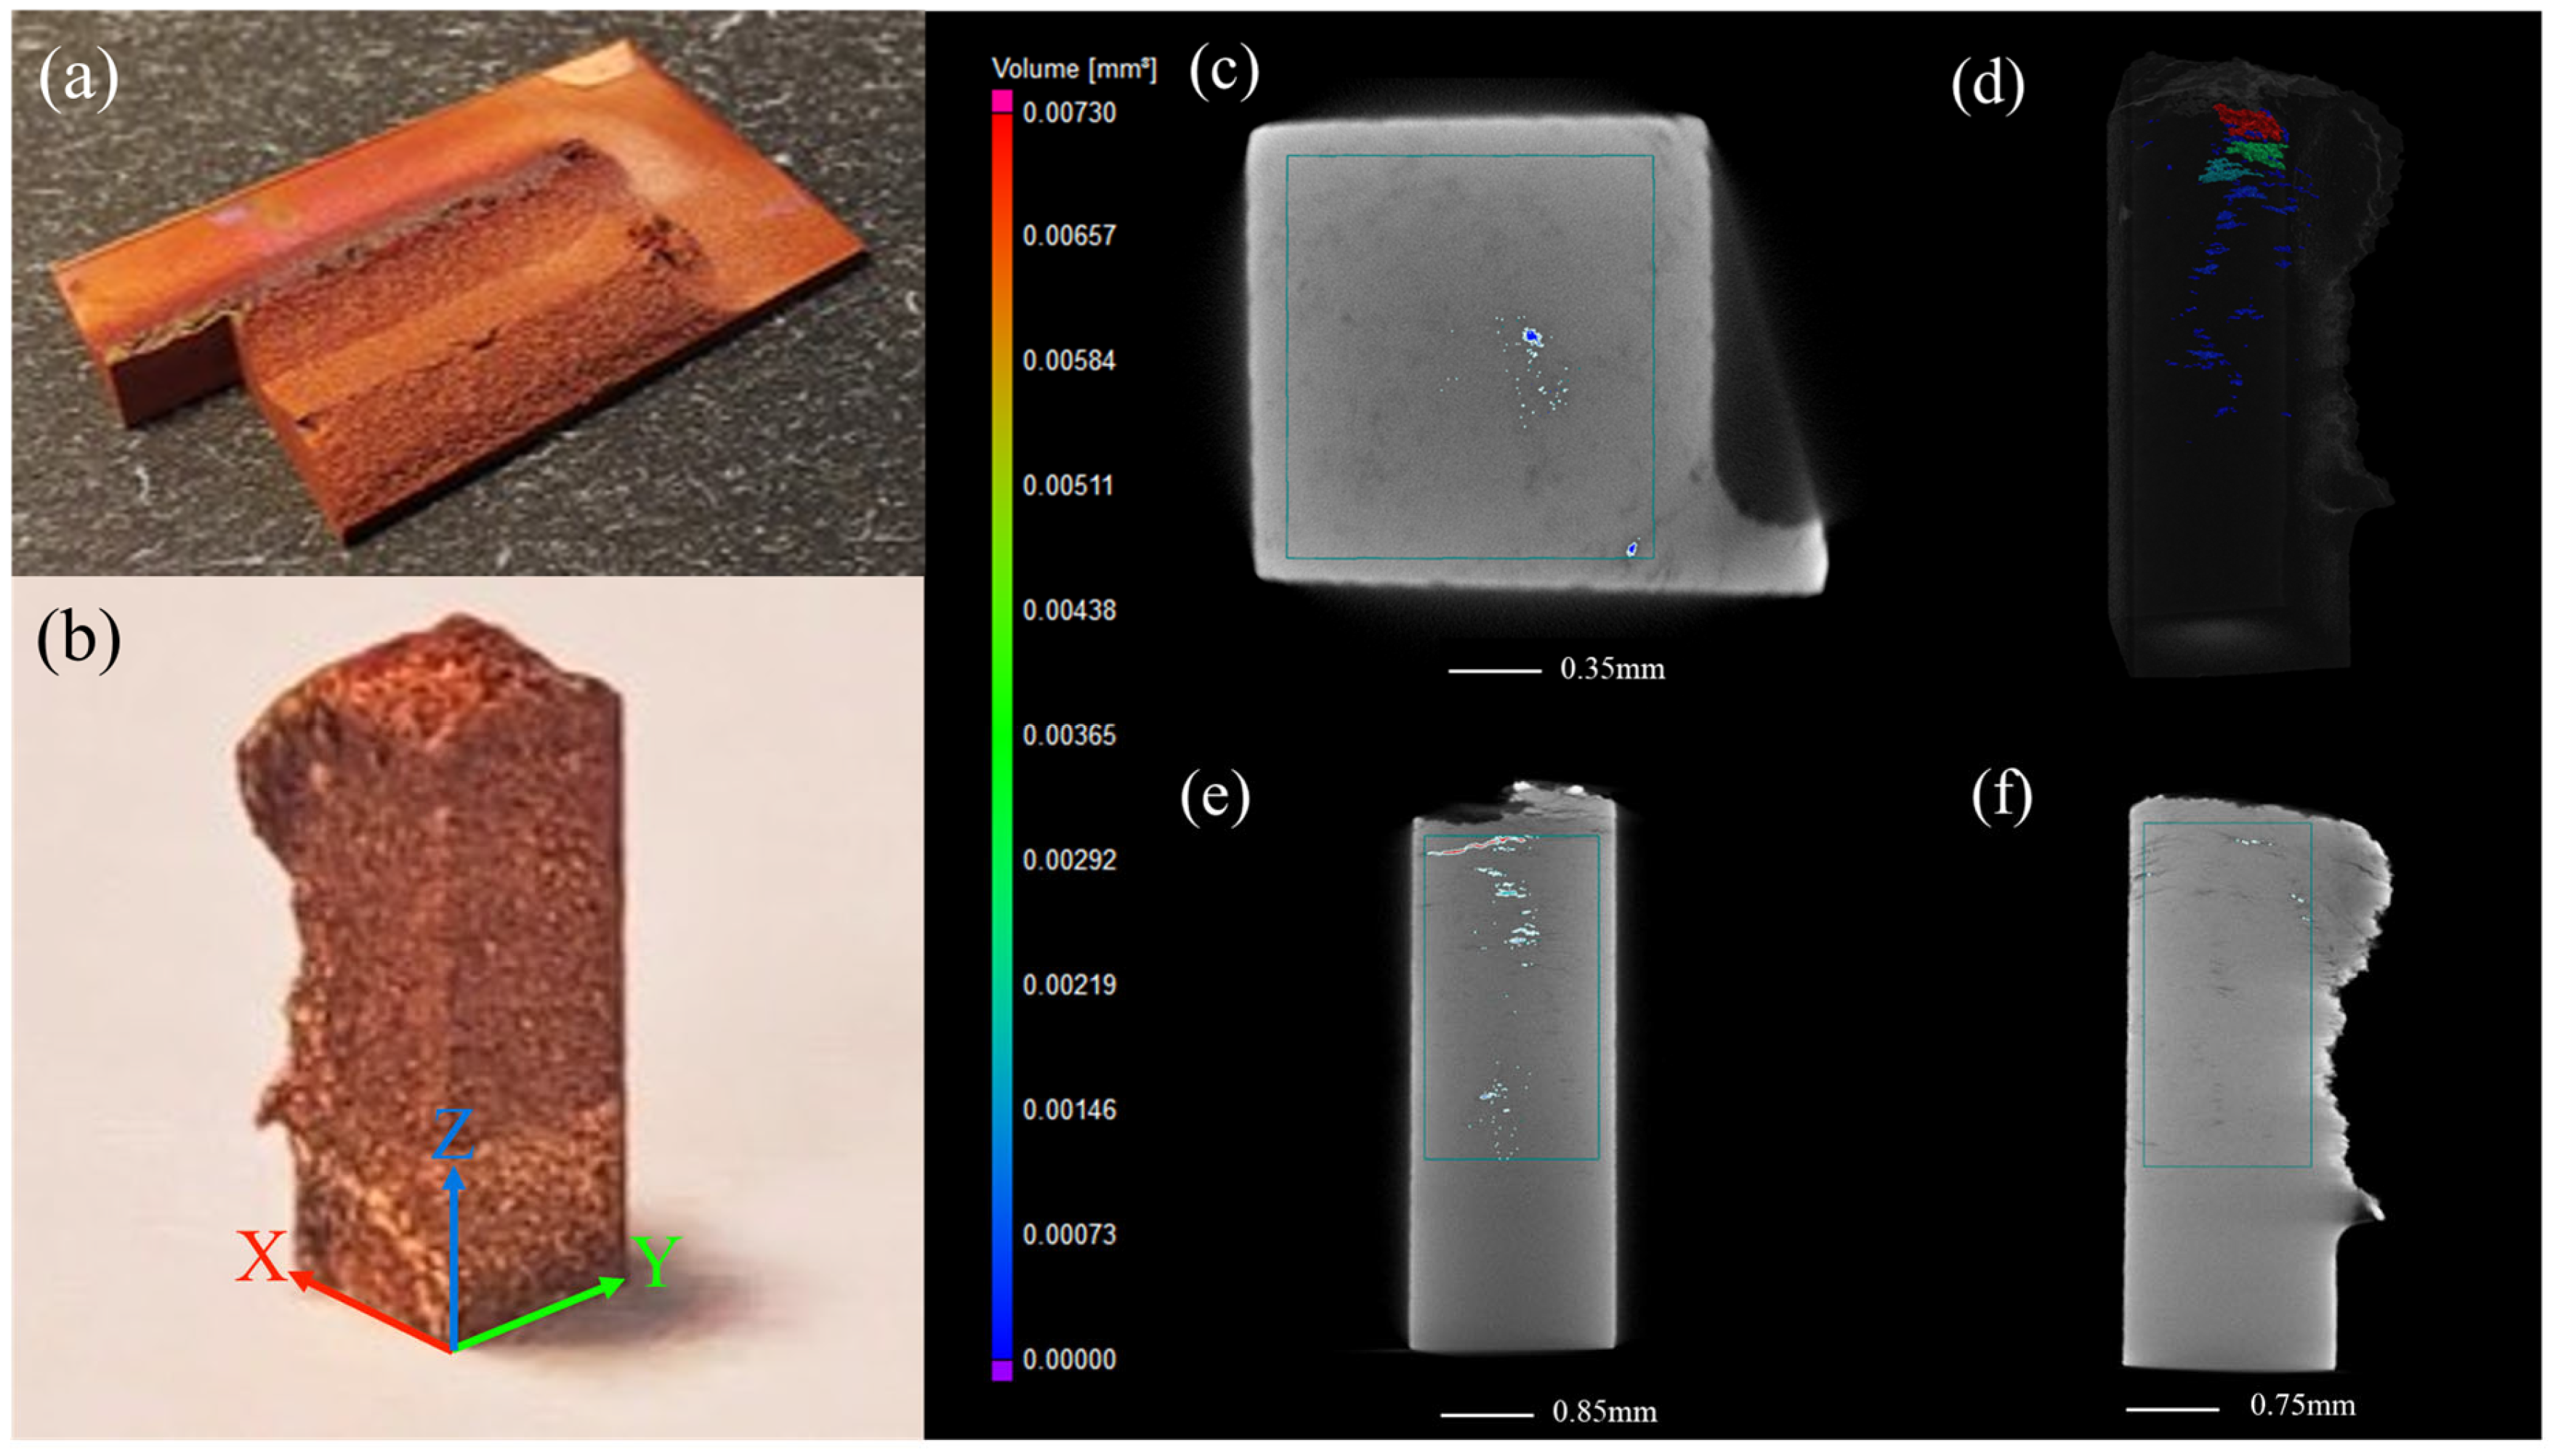
Further investigation of the mid-P samples utilizing micro-CT scanning, as illustrated in Figure 8, revealed that the interconnected carbon phases observed in these samples resemble the appearance of voids owing to their thinness and X-ray transparency. Although distinguishing Gr from pores in micro-CT analysis is difficult, the similarity between the stratification observed near the surface and that seen in the SEM micrographs (Figure 7) indicates that they are likely to be the same carbon phases. This localized distribution could be attributed to the relatively lighter, few-layer Gr migrating toward the surface under the dynamic flow of nitrogen (N2) gas during deposition, which could have also been affected by the scanning strategy. Alternatively, the stratification may be related to the lower density of the top layers, where the reduced peening effect at the surface results in less effective particle consolidation and increased porosity, which is in good agreement with the density results reported in Figure 5.
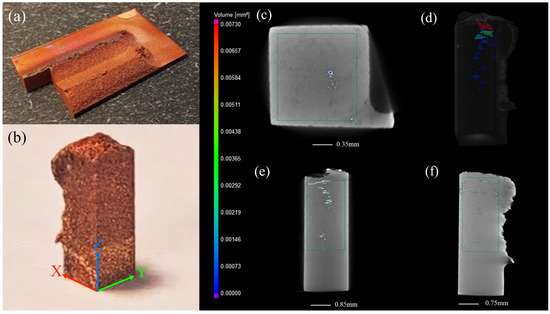
Figure 8.
Micro-CT scanning of the mid-P sample: (a,b) the small bulk with a dimension of 1.6 × 1.6 × 4 mm in (b) was cut from (a) using EDM to fit into the micro-CT scanning area (resolution 3–4 μm); (c–f) different views of the micro-CT scanned area.
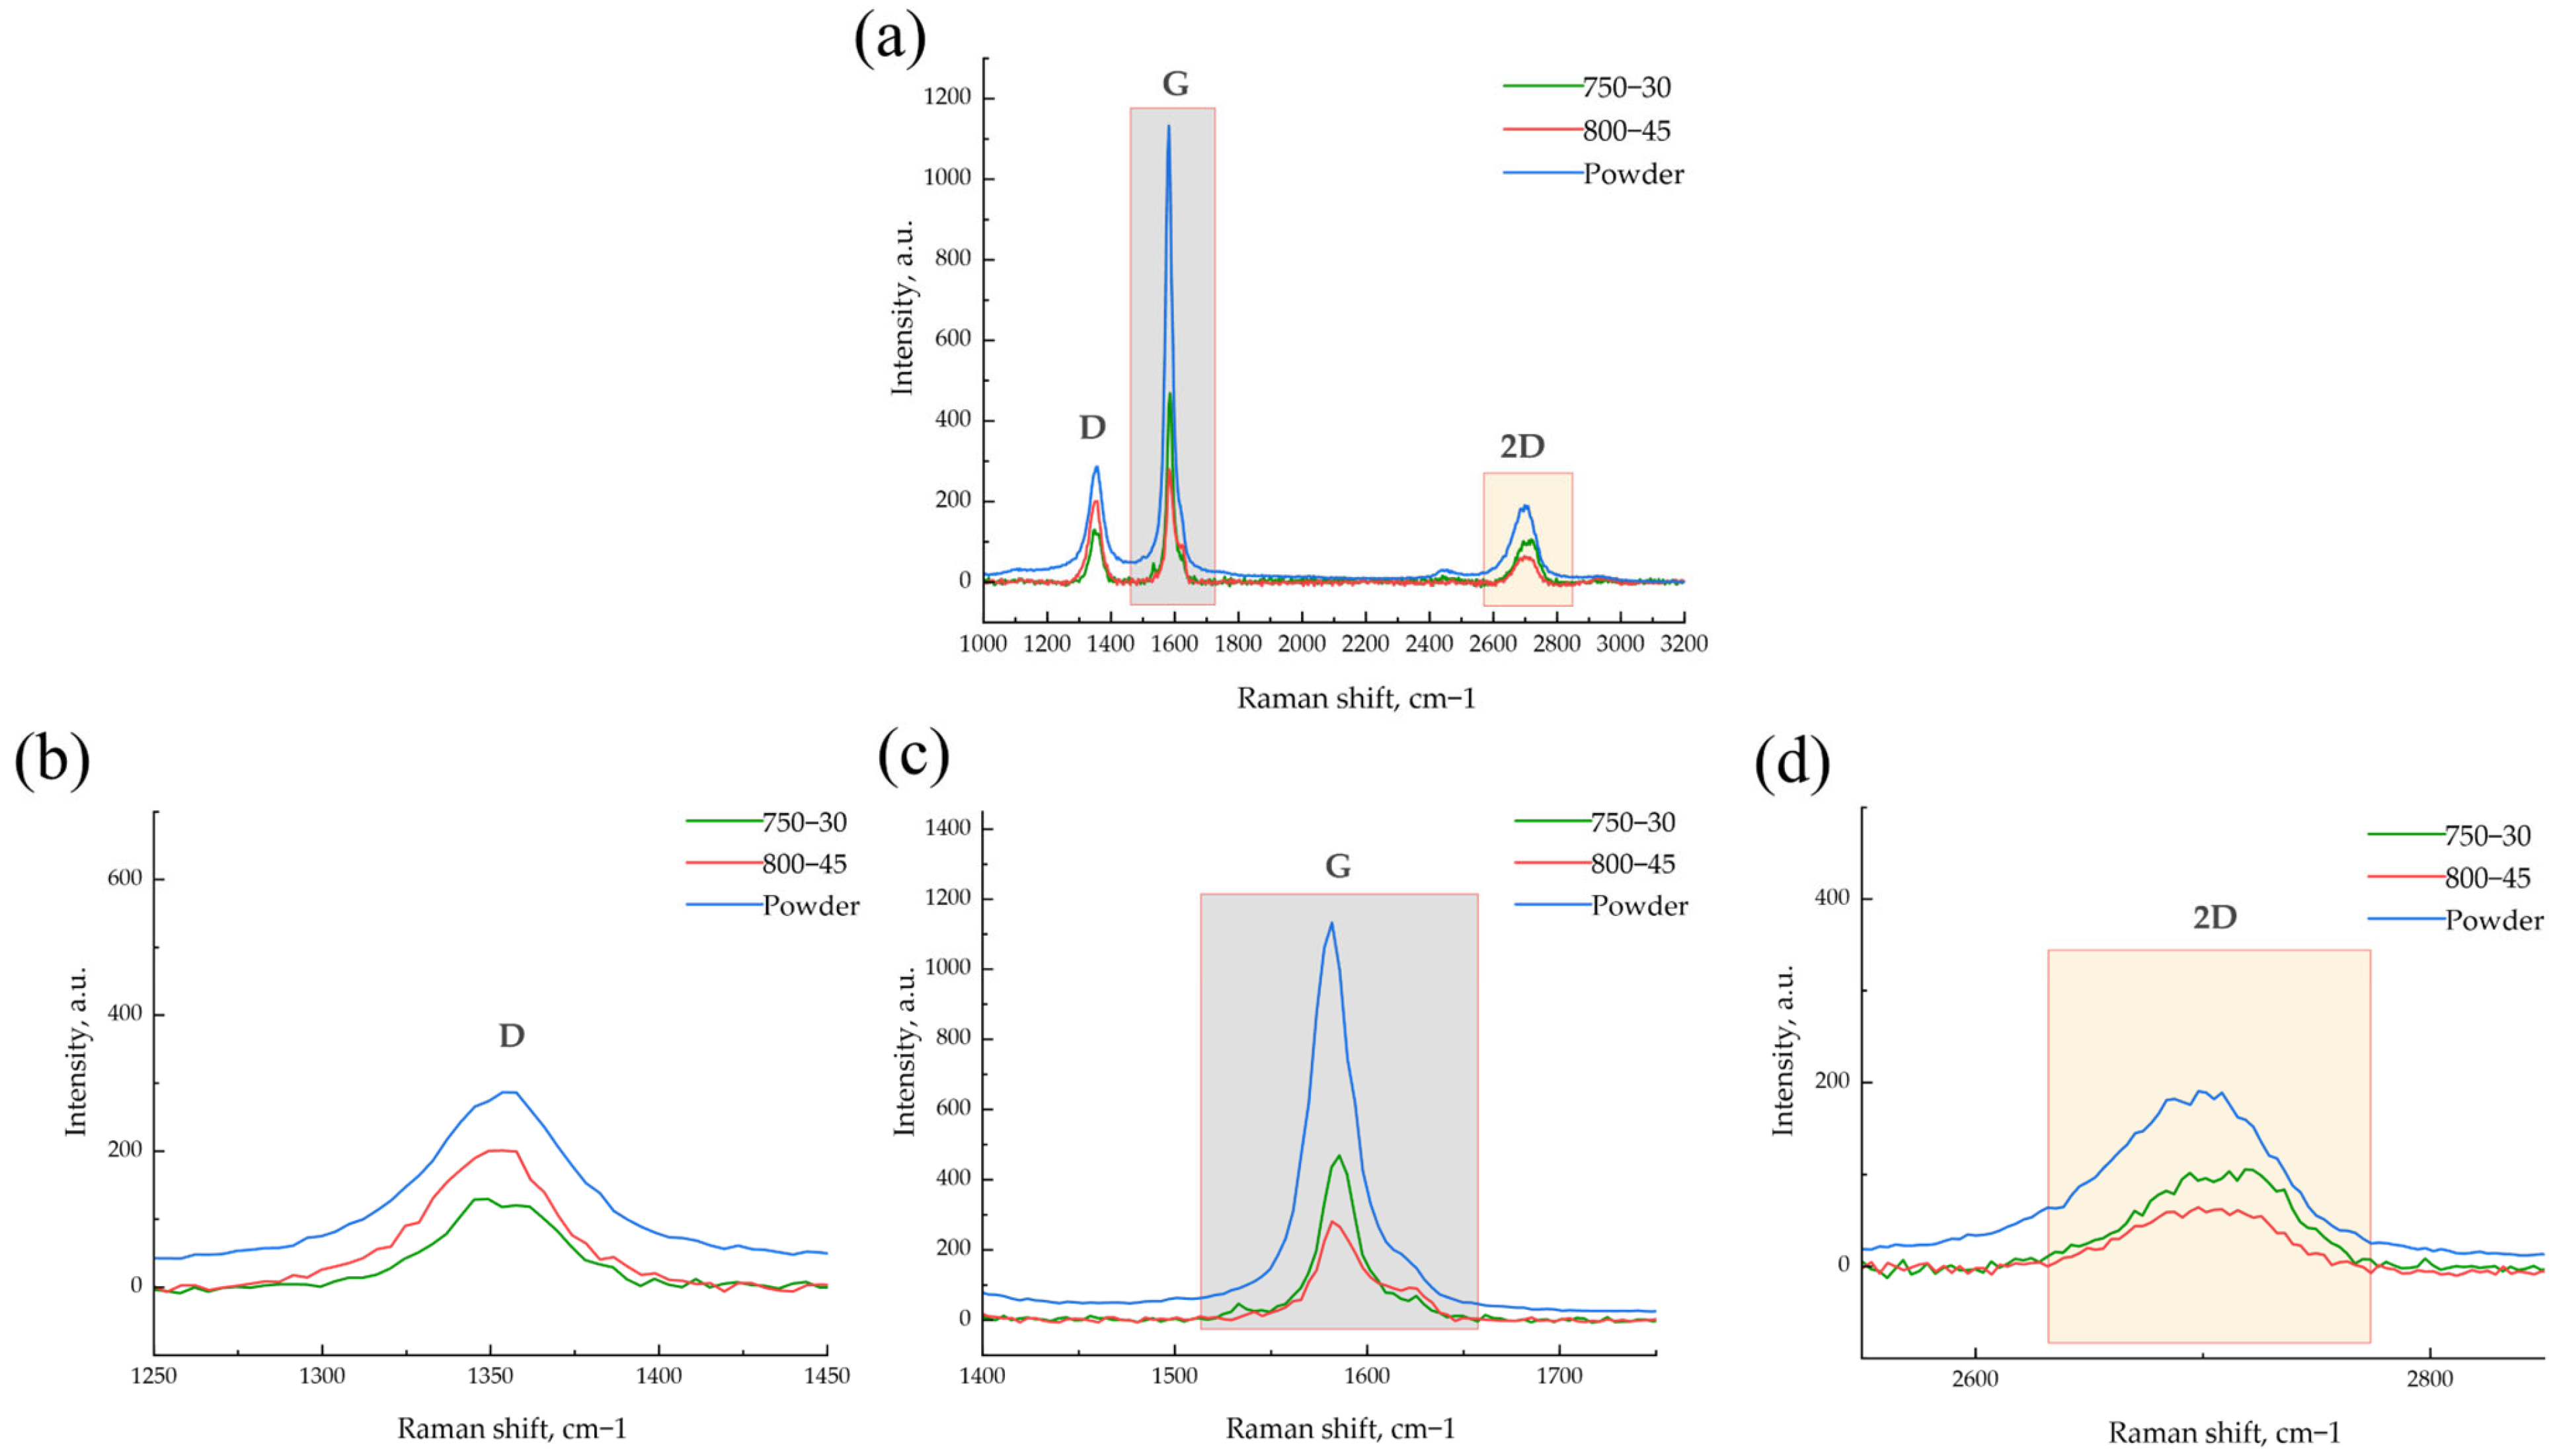
Raman spectroscopic analysis was also performed on the deposits to evaluate the presence of Gr after deposition and to investigate potential structural damage or agglomeration induced by the CS process. Figure 9 displays the mean value of the three spectra obtained from different areas of each deposit, with the Cu luminescence background removed. Table 2 summarizes the and ratios for the powder, mid-P, and high-P deposits.
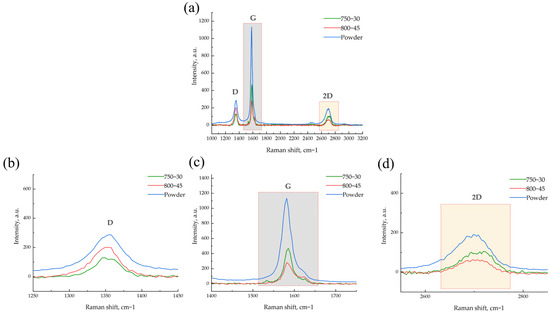
Figure 9.
(a) Raman spectroscopy results for powder, mid-P, and high-P samples with higher magnification for (b) D, (c) G, and (d) 2D bands.
Table 2.
Summary of and ratios for powder, Mid-P, and High-P samples.
The results from the two processing sets showed a G band at approximately 1580 cm−1 and a 2D band around 2700 cm−1. The ratio of both samples was consistent with the initial powder characteristics. This suggests that Gr maintains its structure with minimal agglomeration during CS.
Figure 9 shows a slight splitting of the G band for both the powder and CS deposits, which could be attributed to the combined effect of the ball milling and CS processes, with a higher contribution of ball milling considering the results obtained for the powder before deposition. Furthermore, we investigated the for possible structural damage induced by CS. Defects in Gr, represented by the D band, can arise from various types of imperfections [40]. A detailed characterization of these defect types is beyond the scope of this study. However, the presence of the D peak and the increase in its intensity provided a general means of comparing the level of defects between the powder and the deposit. An increase in indicates an increase in the amount of Gr defects. One specific type of defect can be caused by thermal input. Nan et al. investigated the thermal stability of Gr and reported that bilayer Gr exhibits greater thermal stability than single-layer Gr. Their study observed the emergence of a D peak at approximately 600 °C for bilayer Gr, indicating the onset of structural degradation [41].
The values for both the mid-P and high-P deposits were largely similar to those of the composite powder, which already exhibited some degree of disorder caused by the ball milling process. This indicates that the CS process does not introduce additional damage to the Gr structure, which is consistent with previous reports [28,42]. Although the CS process temperatures were set to 750 °C and 800 °C for the mid-P and high-P sets, respectively, the actual particle temperatures were predicted to remain below 600 °C across various particle sizes, as shown in Figure 10, where the velocity and temperature of the particles at the onset of impact are shown. These data were determined using Computational Fluid Dynamics (CFD) simulations performed with Kinetic Spray Solutions (KSS) software.
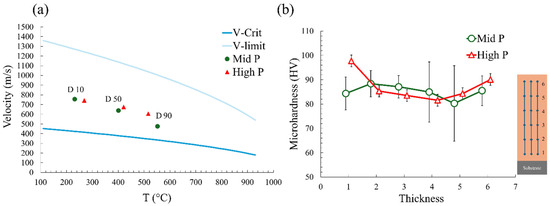
Figure 10.
(a) KSS simulation results demonstrate the combined influence of gas stagnation temperature () and pressure () on particle temperature and velocity at the onset of impact for the two considered process parameter sets. (b) Through-thickness microhardness measurements for mid-P and high-P samples.
The mechanical properties of the two series of Cu-Gr deposits were characterized by microhardness testing. A schematic representation of the selected measurement points across the deposit height is shown in Figure 10, providing a visual guide to the locations of microhardness measurements along with the results for the mid-P and high-P samples. Each data point represents the average of three measured values. The microhardness results indicate that for the mid-P sample, the average hardness was 85.09 HV, while for the high-P series, the average value increased to 87.78 HV. Additionally, the mid-P sample exhibited a higher standard deviation in microhardness measurements, reflecting greater variability in the results. This can be linked to the lower deposit density and uneven particle interfaces, which collectively led to inconsistencies in the measured hardness of the mid-P deposit.
OM observations of the etched cross-sections of the samples, shown in Figure 11, illustrate the microstructure of the Cu-Gr deposits. These images reveal that the particles within the deposit experienced significant deformation, resulting in a flattened morphology, with the deformation predominantly concentrated at the interparticle boundaries. After etching, these boundaries became more distinct, indicating that they were more susceptible to etching than the interior regions of particles. This behavior suggests weaker particle bonding in the mid-P sample, as its interparticle boundaries were more prominent under the same etching conditions than those of the high-P sample. Irregular deformed particle shapes, attributable to the presence of various particle morphologies in the initial feedstock (indicated by the dashed lines in Figure 11), were more prominent at the cross-section of the mid-P sample. The white arrows in Figure 11 likely indicate areas where flake-like particles interact and deform against each other, resulting in the formation of porosity, particularly near the edges. This behavior was particularly prominent in the mid-P sample because of the lower kinetic energy of the particles. Furthermore, Figure 11 shows the microstructure of the deposit cross-sections after chemical etching. The grain size in the high-P deposits was larger than that in the mid-P deposits. The observations indicate that severe deformation during the deposition process induced grain refinement in both cases. However, owing to the higher impact velocity in the high-P samples, the grain refinement was more pronounced, resulting in a more refined microstructure. Additionally, the lower flattening ratio observed in the mid-P samples contributes to reduced strain hardening, which, in turn, explains the lower deformation and hardness values reported for these samples.
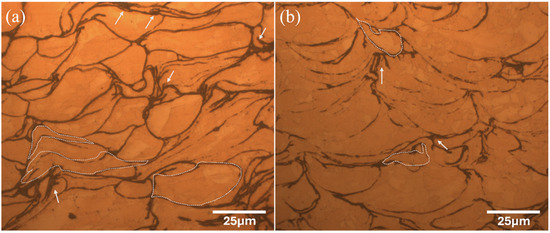
Figure 11.
Cross-sectional OM images of etched (a) mid-P and (b) high-P samples; the white arrows indicate the deformed flaky particles, and the white dashed lines indicate the irregular deformed shapes of the particles.
The flattening ratio plays a crucial role in determining the properties and performance of CS coatings. A higher flattening ratio generally indicates better particle deformation and bonding, leading to an improved coating quality [43]. In this study, the flattening ratio for each splat was computed by calculating the ratio between the diameter of its circumscribed circle and the diameter of its inscribed circle. Determining the flattening ratio of flake-like particles after deformation using image analysis presents significant challenges. Therefore, the flattening ratio was primarily measured for the predominantly circular particles. The flattening ratio, measured using image analysis, yielded an average result of 4.59 ± 1.22 for the high-P samples, which is higher than the 3.47 ± 1.25 estimated for the mid-P series. A lower flattening ratio could indicate the lower strain hardening of the particles during deposition, as confirmed by the lower hardness observed in the mid-P sample.
4. Conclusions
This study demonstrates the feasibility of using cold spray as an advanced deposition technology for the deposition of Cu-Gr composite coatings. The objectives were to evaluate the condition of the Gr reinforcement phase in the feedstock and the cold spray deposit, examine the extent of structural disorders, preserve the graphene during the ball milling and CS processes, and assess the potential impact of various ranges of process parameters. Two CS systems of medium and high pressure were used, with the temperature and pressure reaching 800 °C and 45 bar, respectively.
A feedstock particle size distribution analysis revealed a wide distribution characterized by a low proportion of extremely fine and large particles, with a mean particle size suitable for CS deposition. Despite the nonhomogeneous morphology and particle size distribution of the ball-milled composite powder, as indicated by the SEM observations, no notable challenges were observed during the deposition process, indicating that the spherical portion of the feedstock led to favorable flowability, contributing to the formation of dense and homogeneous deposits.
Although a wide PSD is generally not ideal for CS applications, the findings indicate that achieving a deposit density of 99.2% is possible under high-pressure conditions. This suggests that process parameters can have a more pronounced impact on deposition quality than PSD and powder morphology. Through the fine-tuning of parameters such as gas pressure, temperature, and spray velocity, it is feasible to attain high-quality deposits, even with suboptimal PSDs.
By examining both series of deposits, the EDS mappings from the SEM analysis confirmed the Gr preservation in the deposits. The Raman spectroscopy results further corroborated the findings from EDS mapping, providing additional evidence for the homogeneous distribution of Gr within the deposited material, particularly when using a high-pressure system. Further comparative analysis of the two process settings, 750 °C at 30 bar (medium pressure) and 800 °C at 45 bar (high pressure), revealed differences in the properties of the deposit characteristics. Specifically, the 750 °C-30 bar process yielded a deposit with lower density and hardness, possibly because of the reduced particle impact velocity at lower temperatures. This observation was further verified by a lower flattening ratio, indicating decreased particle deformation and, consequently, a less compact structure.
The ability to produce dense, homogeneous coatings through the careful regulation of process parameters highlights the potential of CS technology for 2DMMC applications in advanced manufacturing sectors.
Regarding the local porosity observed in the case of samples deposited using a low-pressure system, it was theorized that the flake-shaped particles in the feedstock may have led to the increased porosity near the top of the deposit. The hardened flakes’ resistance to deformation and flattening, compared to spherical particles, may have created gaps and spaces within the final deposit’s structure, which, combined with the specific scanning strategy, consequently led to reduced density and diminished microhardness.
Additionally, this work contributes to the understanding of how graphene reinforcement alters the dynamics of particle deformation and microstructure evolution during CS deposition, leading to differences in porosity, density, and mechanical properties. These findings highlight that the interplay between feedstock morphology and process parameters provides new insights into the design of optimized feedstocks and deposition conditions for 2DMMCs.
In summary, the choice of process parameters proved to be crucial for achieving high-quality Cu-Gr composite coatings using a cold spray process. These findings underscore the high potential of cold spray for depositing 2DMMCs and highlight the significance of regulating process parameters and meticulously selecting powder characteristics to modulate the mechanical and microstructural properties of the resultant deposit.
While the results obtained provide valuable insights, future research could explore a wider range of process parameters to further optimize the distribution of graphene within the deposit. Additionally, the effect of these parameters on the mechanical and thermal properties of the composites should be thoroughly examined to better understand their potential for practical applications. Such studies could help enhance the performance and reliability of graphene-based composites produced via CS technology.
Author Contributions
Conceptualization, F.Z., A.A.L. and S.B.; methodology, F.Z. and A.A.L.; software, A.A.L.; validation, F.Z. and S.R.; formal analysis, F.Z. and S.R.; investigation, F.Z., A.A.L. and S.R.; resources, R.L. and S.B.; data curation, F.Z.; writing—original draft preparation, F.Z. and S.R.; writing—review and editing, F.Z., A.A.L., S.B. and M.G.; visualization, F.Z. and S.R.; supervision, S.Y., R.L., M.G. and S.B.; project administration, R.L. and S.B.; funding acquisition, R.L. and S.B. All authors have read and agreed to the published version of the manuscript.
Funding
The research leading to these results has received funding from the European Union’s Horizon Europe Research and Innovation Program under grant agreement No. 101046835 (ThermoDust).
Institutional Review Board Statement
Not applicable.
Informed Consent Statement
Not applicable.
Data Availability Statement
Data are contained within the article.
Conflicts of Interest
The authors declare no conflict of interest.
Abbreviations
The following abbreviations are used in this manuscript:
| 2DMMC | 2D material-based metal matrix composite |
| MMC | metal matrix composite |
| Gr | graphene |
| Cu | copper |
| AM | additive manufacturing |
| CS | cold spray |
| 2D materials | two-dimensional materials |
| PSD | particle size distribution |
| CVD | chemical vapor deposition |
| SEM | scanning electron microscope |
| EDS | dispersive x-ray spectroscopy |
| OM | optical microscopy |
| CFD | Computational Fluid Dynamics |
| KSS | Kinetic Spray Solutions |
References
- Qu, X.; Zhang, L.; Wu, M.; Ren, S. Review of metal matrix composites with high thermal conductivity for thermal management applications. Prog. Nat. Sci. Mater. Int. 2011, 21, 189–197. [Google Scholar] [CrossRef]
- Sun, Q.; Zhi, G.; Zhou, S.; Dong, X.; Shen, Q.; Tao, R.; Qi, J. Advanced Design and Manufacturing Approaches for Structures with Enhanced Thermal Management Performance: A Review. Adv. Mater. Technol. 2024, 9, 2400263. [Google Scholar] [CrossRef]
- Silvain, J.-F.; Veillere, A.; Heintz, J.-M.; Vincent, C.; Guillemet, T.; Lacombe, G.; Lu, Y.; Chandra, N. The role of controlled interfaces in the thermal management of copper–carbon composites. Emerg. Mater. Res. 2012, 1, 75–88. [Google Scholar] [CrossRef]
- Singer, F.; Deisenroth, D.C.; Hymas, D.M.; Ohadi, M.M. Additively manufactured copper components and composite structures for thermal management applications. In Proceedings of the 2017 16th IEEE Intersociety Conference on Thermal and Thermomechanical Phenomena in Electronic Systems (ITherm), Orlando, FL, USA, 30 May–2 June 2017; pp. 174–183. [Google Scholar]
- Wu, F.; Tian, H.; Shen, Y.; Zhu, Z.-Q.; Liu, Y.; Hirtz, T.; Wu, R.; Gou, G.; Qiao, Y.; Yang, Y.; et al. High Thermal Conductivity 2D Materials: From Theory and Engineering to Applications. Adv. Mater. Interfaces 2022, 9, 2200409. [Google Scholar] [CrossRef]
- Zarei, F.; Sheibani, S. Comparative study on carbon nanotube and graphene reinforced Cu matrix nanocomposites for thermal management applications. Diam. Relat. Mater. 2021, 113, 108273. [Google Scholar] [CrossRef]
- Hidalgo-Manrique, P.; Lei, X.; Xu, R.; Zhou, M.; Kinloch, I.A.; Young, R.J. Copper/graphene composites: A review. J. Mater. Sci. 2019, 54, 12236–12289. [Google Scholar] [CrossRef]
- Ma, Y.; Guo, L.; Wang, J.; Chen, B.; Qi, L.; Li, H. Collaborative enhancement of thermal diffusivities and mechanical properties of Csf-Cu/Mg composites via introducing Cu coating with different thicknesses. J. Magnes. Alloys 2024, in press. [Google Scholar] [CrossRef]
- Shao, P.; Yang, W.; Zhang, Q.; Meng, Q.; Tan, X.; Xiu, Z.; Qiao, J.; Yu, Z.; Wu, G. Microstructure and tensile properties of 5083 Al matrix composites reinforced with graphene oxide and graphene nanoplates prepared by pressure infiltration method. Compos. Part Appl. Sci. Manuf. 2018, 109, 151–162. [Google Scholar] [CrossRef]
- Yang, W.; Zhao, Q.; Xin, L.; Qiao, J.; Zou, J.; Shao, P.; Yu, Z.; Zhang, Q.; Wu, G. Microstructure and mechanical properties of graphene nanoplates reinforced pure Al matrix composites prepared by pressure infiltration method. J. Alloys Compd. 2018, 732, 748–758. [Google Scholar] [CrossRef]
- Das, S.; Kordijazi, A.; Akbarzadeh, O.; Rohatgi, P.K. An innovative process for dispersion of graphene nanoparticles and nickel spheres in A356 alloy using pressure infiltration technique. Eng. Rep. 2020, 2, e12110. [Google Scholar] [CrossRef]
- Assadi, H.; Kreye, H.; Gärtner, F.; Klassen, T. Cold spraying—A materials perspective. Acta Mater. 2016, 116, 382–407. [Google Scholar] [CrossRef]
- Singh, H.; Sidhu, T.S.; Kalsi, S.B.S. Cold spray technology: Future of coating deposition processes. Fract. Struct. Integr. 2012, 6, 69–84. [Google Scholar] [CrossRef]
- Bagherifard, S.; Monti, S.; Zuccoli, M.V.; Riccio, M.; Kondás, J.; Guagliano, M. Cold spray deposition for additive manufacturing of freeform structural components compared to selective laser melting. Mater. Sci. Eng. A 2018, 721, 339–350. [Google Scholar] [CrossRef]
- Choi, J.; Okimura, N.; Yamada, T.; Hirata, Y.; Ohtake, N.; Akasaka, H. Deposition of graphene–copper composite film by cold spray from particles with graphene grown on copper particles. Diam. Relat. Mater. 2021, 116, 108384. [Google Scholar] [CrossRef]
- Díaz, E.T.; Silvello, A.; Ramirez, E.R.; Vaz, R.F.; Cano, I.G. Graphene nanoplatelets in titanium coatings deposited by cold spray: Mechanical properties. J. Mater. Res. Technol. 2024, 34, 1549–1558. [Google Scholar] [CrossRef]
- Bagherifard, S.; Kondas, J.; Monti, S.; Cizek, J.; Perego, F.; Kovarik, O.; Lukac, F.; Gaertner, F.; Guagliano, M. Tailoring cold spray additive manufacturing of steel 316 L for static and cyclic load-bearing applications. Mater. Des. 2021, 203, 109575. [Google Scholar] [CrossRef]
- Guo, D.; Kazasidis, M.; Hawkins, A.; Fan, N.; Leclerc, Z.; MacDonald, D.; Nastic, A.; Nikbakht, R.; Ortiz-Fernandez, R.; Rahmati, S.; et al. Cold Spray: Over 30 Years of Development Toward a Hot Future. J. Therm. Spray Technol. 2022, 31, 866–907. [Google Scholar] [CrossRef]
- Gärtner, F.; Stoltenhoff, T.; Schmidt, T.; Kreye, H. The cold spray process and its potential for industrial applications. J. Therm. Spray Technol. 2006, 15, 223–232. [Google Scholar] [CrossRef]
- Bagherifard, S.; Guagliano, M. Fatigue performance of cold spray deposits: Coating, repair and additive manufacturing cases. Int. J. Fatigue 2020, 139, 105744. [Google Scholar] [CrossRef]
- Yin, S.; Cavaliere, P.; Aldwell, B.; Jenkins, R.; Liao, H.; Li, W.; Lupoi, R. Cold spray additive manufacturing and repair: Fundamentals and applications. Addit. Manuf. 2018, 21, 628–650. [Google Scholar] [CrossRef]
- Pattison, J.; Celotto, S.; Morgan, R.; Bray, M.; O’Neill, W. Cold gas dynamic manufacturing: A non-thermal approach to freeform fabrication. Int. J. Mach. Tools Manuf. 2007, 47, 627–634. [Google Scholar] [CrossRef]
- Assadi, H.; Schmidt, T.; Richter, H.; Kliemann, J.-O.; Binder, K.; Gärtner, F.; Klassen, T.; Kreye, H. On Parameter Selection in Cold Spraying. J. Therm. Spray Technol. 2011, 20, 1161–1176. [Google Scholar] [CrossRef]
- Nourian, A.; Schwartz, T.; Boese, S.; Müftü, S. Effects of Process Parameters on Cold Spray Deposition of Al-6061 Alloy. J. Therm. Spray Technol. 2022, 31, 2517–2536. [Google Scholar] [CrossRef]
- Ghelichi, R.; Guagliano, M. Coating by the Cold Spray Process: A state of the art. Fract. Struct. Integr. 2009, 3, 30–44. [Google Scholar] [CrossRef]
- Liu, Q.; Gong, C.; Zhou, C.; Liang, T.; Hao, Z.; Wang, Z.; Tian, X. Comparative Analysis of Mechanical and Electrical Properties of Graphene/Copper Composite Coating on PEEK via Cold Spray with Varied Nozzle Speed. J. Therm. Spray Technol. 2024, 33, 2209–2226. [Google Scholar] [CrossRef]
- Prasad, K.; Rahman Rashid, R.A.; Hutasoit, N.; Palanisamy, S.; Hameed, N. Fabrication of Metal/Graphene Composites via Cold Spray Process: State-of-the-Art and the Way Forward. C—J. Carbon Res. 2022, 8, 65. [Google Scholar] [CrossRef]
- Yin, S.; Zhang, Z.; Ekoi, E.J.; Wang, J.J.; Dowling, D.P.; Nicolosi, V.; Lupoi, R. Novel cold spray for fabricating graphene-reinforced metal matrix composites. Mater. Lett. 2017, 196, 172–175. [Google Scholar] [CrossRef]
- Huang, J.; Yan, X.; Chang, C.; Xie, Y.; Ma, W.; Huang, R.; Zhao, R.; Li, S.; Liu, M.; Liao, H. Pure copper components fabricated by cold spray (CS) and selective laser melting (SLM) technology. Surf. Coat. Technol. 2020, 395, 125936. [Google Scholar] [CrossRef]
- D792 Standard Test Methods for Density and Specific Gravity (Relative Density) of Plastics by Displacement. Available online: https://www.astm.org/d0792-20.html (accessed on 27 November 2024).
- Alidokht, S.A.; Wu, L.; Bessette, S.; Chromik, R.R. Microstructure and tribology of cold spray additively manufactured multimodal Ni-WC metal matrix composites. Wear 2024, 538, 205218. [Google Scholar] [CrossRef]
- Hao, Y.; Wang, J.; Cui, X.; Wu, J.; Li, T.; Xiong, T. Microstructure Characteristics and Mechanical Properties of Al-12Si Coatings on AZ31 Magnesium Alloy Produced by Cold Spray Technique. J. Therm. Spray Technol. 2016, 25, 1020–1028. [Google Scholar] [CrossRef]
- Perard, T.; Sova, A.; Robe, H.; Robin, V.; Zedan, Y.; Bocher, P.; Feulvarch, E. Friction stir processing of austenitic stainless steel cold spray coating deposited on 304L stainless steel substrate: Feasibility study. Int. J. Adv. Manuf. Technol. 2021, 115, 2379–2393. [Google Scholar] [CrossRef]
- Rokni, M.R.; Nutt, S.R.; Widener, C.A.; Champagne, V.K.; Hrabe, R.H. Review of Relationship Between Particle Deformation, Coating Microstructure, and Properties in High-Pressure Cold Spray. J. Therm. Spray Technol. 2017, 26, 1308–1355. [Google Scholar] [CrossRef]
- Ni, Z.; Wang, Y.; Yu, T.; Shen, Z. Raman spectroscopy and imaging of graphene. Nano Res. 2008, 1, 273–291. [Google Scholar] [CrossRef]
- Graf, D.; Molitor, F.; Ensslin, K.; Stampfer, C.; Jungen, A.; Hierold, C.; Wirtz, L. Spatially Resolved Raman Spectroscopy of Single- and Few-Layer Graphene. Nano Lett. 2007, 7, 238–242. [Google Scholar] [CrossRef] [PubMed]
- Li, Z.; Deng, L.; Kinloch, I.A.; Young, R.J. Raman spectroscopy of carbon materials and their composites: Graphene, nanotubes and fibres. Prog. Mater. Sci. 2023, 135, 101089. [Google Scholar] [CrossRef]
- Beams, R.; Cançado, L.G.; Novotny, L. Raman characterization of defects and dopants in graphene. J. Phys. Condens. Matter 2015, 27, 083002. [Google Scholar] [CrossRef]
- Mohiuddin, T.M.G.; Lombardo, A.; Nair, R.R.; Bonetti, A.; Savini, G.; Jalil, R.; Bonini, N.; Basko, D.M.; Galiotis, C.; Marzari, N.; et al. Uniaxial strain in graphene by Raman spectroscopy: G peak splitting, Grüneisen parameters, and sample orientation. Phys. Rev. B 2009, 79, 205433. [Google Scholar] [CrossRef]
- Wu, J.-B.; Lin, M.-L.; Cong, X.; Liu, H.-N.; Tan, P.-H. Raman spectroscopy of graphene-based materials and its applications in related devices. Chem. Soc. Rev. 2018, 47, 1822–1873. [Google Scholar] [CrossRef]
- Nan, H.Y.; Ni, Z.H.; Wang, J.; Zafar, Z.; Shi, Z.X.; Wang, Y.Y. The thermal stability of graphene in air investigated by Raman spectroscopy. J. Raman Spectrosc. 2013, 44, 1018–1021. [Google Scholar] [CrossRef]
- Sun, W.; Tan, A.W.-Y.; Bhowmik, A.; Xue, F.; Marinescu, I.; Liu, E. Evaluation of cold sprayed graphene nanoplates–Inconel 718 composite coatings. Surf. Coat. Technol. 2019, 378, 125065. [Google Scholar] [CrossRef]
- Neo, R.G.; Tham, N.Y.S.; Wu, K.; Puthan Veetil, S.; Tan, S.C.; Zhou, W. Evaluation of Powders for Cold Spray Coatings Through Study of Single Particle Impact. In Proceedings of the 2nd International Conference on Advanced Surface Enhancement (INCASE 2021); Wei, Y., Chng, S., Eds.; Lecture Notes in Mechanical Engineering; Springer: Singapore, 2022; pp. 163–167. ISBN 9789811657627. [Google Scholar]


Disclaimer/Publisher’s Note: The statements, opinions and data contained in all publications are solely those of the individual author(s) and contributor(s) and not of MDPI and/or the editor(s). MDPI and/or the editor(s) disclaim responsibility for any injury to people or property resulting from any ideas, methods, instructions or products referred to in the content. |
© 2025 by the authors. Licensee MDPI, Basel, Switzerland. This article is an open access article distributed under the terms and conditions of the Creative Commons Attribution (CC BY) license (https://creativecommons.org/licenses/by/4.0/).