Article

Numerical Examination of Particle and Substrate Oxide Layer Failure and Porosity Formation in Coatings Deposited Using Liquid Cold Spray

1
Department of Mechanical and Industrial Engineering, University of Toronto, Toronto, ON M5S 3G8, Canada
2
Polycontrols, 3650 Boul Matte A1, Brossard, Quebec, QC J4Y 2Z2, Canada
3
Department of Mechanical, Industrial, and Aerospace Engineering, Concordia University, Montreal, QC H3G 1S6, Canada
*
Author to whom correspondence should be addressed.
Coatings 2025, 15(4), 405; https://doi.org/10.3390/coatings15040405
Submission received: 4 March 2025 / Revised: 25 March 2025 / Accepted: 27 March 2025 / Published: 28 March 2025
(This article belongs to the Special Issue New Materials and New Applications for the Cold Gas Spray Process)

Abstract

:
Cold spray (CS) uses high-velocity gas to deposit solid particles without oxidation or phase change. To make the spraying process more economical, a wider-sized cut of feedstock particles needs to be deposited. The liquid cold spray (LCS) process, which uses water as a propellant, has been developed to achieve this goal. The use of water as a propellant may adversely affect particle deformation and adhesion. In this study, numerical methods are used to analyze particle and substrate oxide failure to determine the effects of wetting on particle adhesion to a substrate. The results indicate that water on the particle surface or on substrate would reduce the deformation of both. The area in which oxide layers fail and metallurgical bonding can occur would be reduced. A portion of the water may become entrapped between the particle and the substrate, adversely affecting the bonding area. Increasing particle velocity and decreasing water thickness can reduce the volume of trapped water and improve density by increasing particle deformation and decreasing pore size.

1. Introduction

Cold spray (CS) is a thermal spray process used to deposit metallic coatings without the threat of oxide formation or phase change [1,2,3,4]. In the CS process, solid particles are rapidly accelerated with a supersonic flow of gaseous propellant, such as nitrogen or helium, and are deposited at a high velocity and relatively low temperature [5,6]. During impact, the particles experience severe plastic deformation, resulting in the rupture of the native oxide layer on the particle and substrate, which is then ejected with the aid of the material jet. When these fresh metallic surfaces are in contact with each other under pressure, the formation of metallic bonds will occur, and the particle will adhere [7,8,9,10,11]. Several experiments have been conducted to investigate the effects of spray parameters, including particle velocity and substrate temperature, on oxide film failure and adhesion strength [12,13,14]. According to their findings [12,13,14], increasing particle velocity and substrate temperature increases both deformation and adhesion strength.
According to experimental and numerical studies, nanoscale oxides deform plastically prior to failure [15,16,17]. Therefore, it is possible to study oxide film failure during particle and substrate deformation using elastic–plastic finite element analysis [7,18,19]. Since this deformation occurs at high strain rates, the failure of the oxide layer does not depend on the material properties, i.e., the failure of the oxide layer depends only on the displacement at the fracture point [18,19]. Numerical studies indicate that the substrate oxide layer is more resistant to failure than the particle oxide layer and is only affected by substrate deformation, which can be increased by increasing the impact velocity or substrate temperature. This is because at the beginning of the impact, the particle starts to deform more significantly compared to the substrate, especially at velocities close to the critical value. Hence, the substrate oxide layer is more resistant to failure than the particle oxide layer [19]. Among some of the most recent studies [20,21,22,23], Ren et al. [20,23] used a novel method known as peridynamics instead of the finite element method to examine the behavior of the particle oxide layer when a copper particle impinges on a copper substrate. After validating their results with outcomes obtained from the finite element method, they were able to study the ejection of broken oxide pieces from the interface [20,23]. It has also been illustrated that elevating the particle and substrate temperature affects the failure of their oxide layers. Preheating the particle makes it thermally softer, causing more of its oxide layer to fail during impact, while less of the substrate’s oxide layer fails. This is due to the impact of a softer particle on the substrate. To enhance bonding in an elevated-temperature solid-state deposition process where the particle is preheated, it is also necessary to preheat the substrate to promote the failure of more of its oxide layer during deposition [19].
In the CS process, particles collide with previously deposited particles at high speed, which further deforms the already deposited particles, and this is known as the peening effect. Since deformation is related to dislocation density, particles that experience higher deformation, like the first deposited layers, will have higher stored dislocation density and higher hardness. This behavior has been demonstrated both experimentally and numerically [1,2,3,4,5,6,24,25]. The higher deformation of the first deposited layers also results in a denser structure, as the deformation allows voids to be filled, whereas the last deposited layers, where the peening effect is not significant, are expected to have a higher porosity level [1,2,3,4,5,6,24,25,26,27]. Related to this, the compressive residual stress of the first deposited layers is also higher [1,2,3,4,5,6,24,25]. It is worth noting that residual stresses in cold-sprayed coatings can be caused by factors other than peening. Residual stresses can develop during cooling as a result of thermal expansion mismatch between particles and substrate, which can result in either tensile or compressive stress. Additionally, quenching, defined by the rapid cooling rate of the deposited particles or substrate, may result in tensile stresses due to temperature gradients during the deposition process [28]. Unlike other thermal spray processes, the particles in CS impact at low temperatures, minimizing these thermal effects, and resulting in the peening effect as the major contributor to the final residual stress state [29].
The CS process has many advantages, for instance its low cost of operation, high deposition rates, and its ability to deposit particles without oxidation or phase change. However, its cost-efficiency is hampered due to a narrow (10–55 microns) and expensive particle size requirement. A new CS method, known as liquid cold spray (LCS), has been developed to address this issue by depositing solid particles up to 150 µm in size using a liquid (for instance, water) instead of a gas as propellant. The said liquid is pressurized up to 600 MPa and heated up to 400 °C before flowing through a small orifice to produce a high-speed jet of water and vapor [23,24,25,26,27,28,29,30,31,32,33,34]. A schematic representation of LCS and a copper coating produced by LCS is shown in Figure 1a [31]. In LCS, the increased density of the fluid increases the drag on the particles, allowing for the efficient transfer of momentum from the flow to large particles, something that is difficult in conventional CS. As a result, the large particles impact the substrate surface at high speeds, while the water jet becomes a mist of water droplets and vapor. Unlike when dealing with a gas in CS, in LCS, there is no bow shock to negatively affect particle velocity, as the mist of water droplets and vapor stagnates on the surface of the substrate [31,34].
LCS technology is still in its infancy, and some concerns have been raised about particle deformation, adhesion, and porosity resulting from the presence of water during impact. There have been studies for other applications on the effect of wet particles using both experimental and numerical methods [29,30,35,36]. To the authors’ knowledge, no work has been done to accurately measure the thickness of the water wetting either the particle and/or the substrate, nor has any literature been published on the effect of water surrounding an in-flight particle on its plastic deformation, other than the authors’ previous publications [30,31]. In these works, it was demonstrated that wetting the substrate or the particle results in a reduction in plastic deformation, as part of the kinetic energy of the particle is used to penetrate the water layer. A practical method to overcome this effect is to increase the impact velocity and/or reduce the water thickness [30,31].
To extend previous studies that focused on the effect of water on the deformation of particles and substrates [30,31] and to investigate the effect of water on the adhesion mechanism in more detail, this paper examines the failure of oxide layers during particle deformation along with porosity formation. In other words, this paper employs the same method used for studying oxide layer failure [18,19]. What makes this work unique is its consideration of the presence of water in the ambient environment during deposition, providing a better understanding of liquid cold spray or cold spray in a water-ambient environment, as reported in previous studies. Since it is not feasible to study particle deformation and water behavior experimentally, this paper uses elastic–plastic finite element methods to investigate the effect of using water to deposit solid particles in LCS. Using a coupled Eulerian–Lagrangian (CEL) method and an elastic–plastic model, a 20 µm copper particle was modeled to deposit on copper substrates to simultaneously predict the failure of the oxide layer and the effect of water on deformation and porosity formation.

2. Numerical Methodology

2.1. Mie–Grüneisen Equation of State and Johnson–Cook Plasticity Model

To explain the finite element method, it is necessary to understand the elastic and plastic models used to describe particle and substrate deformations. For the elastic part, the Mie–Grüneisen equation of state (EoS) is used (Equation (1)), while for the plastic part, the Johnson–Cook equation is used (Equation (2)). A detailed description of these models can be found in the literature [24,37,38].
P = ρ 0 c 0 2 η ( 1 s η ) 2 1 η Γ 0 2 + Γ 0 ρ 0 E m
σ = A + B ε p n 1 + C l n ε ˙ p ε ˙ 0 1 ( T T r T m T r ) m
where P is total pressure; ρ 0 c 0 2 is the elastic modulus at small nominal strains; c 0 , s , Γ 0 , and ρ 0 are material constants; E m expresses internal energy per unit mass; and η is nominal compressive volumetric strain, which is equal to 1   ρ 0 / p ( p stands as pressure stress). In addition, σ , ε p , ε ˙ p , ε ˙ 0 , T r , T m , and T are flow stress, equivalent plastic strain, plastic strain rate, reference strain rate, reference temperature, melting point, and temperature, respectively. A , B , C , n , and m represent material constants [24,37,38].

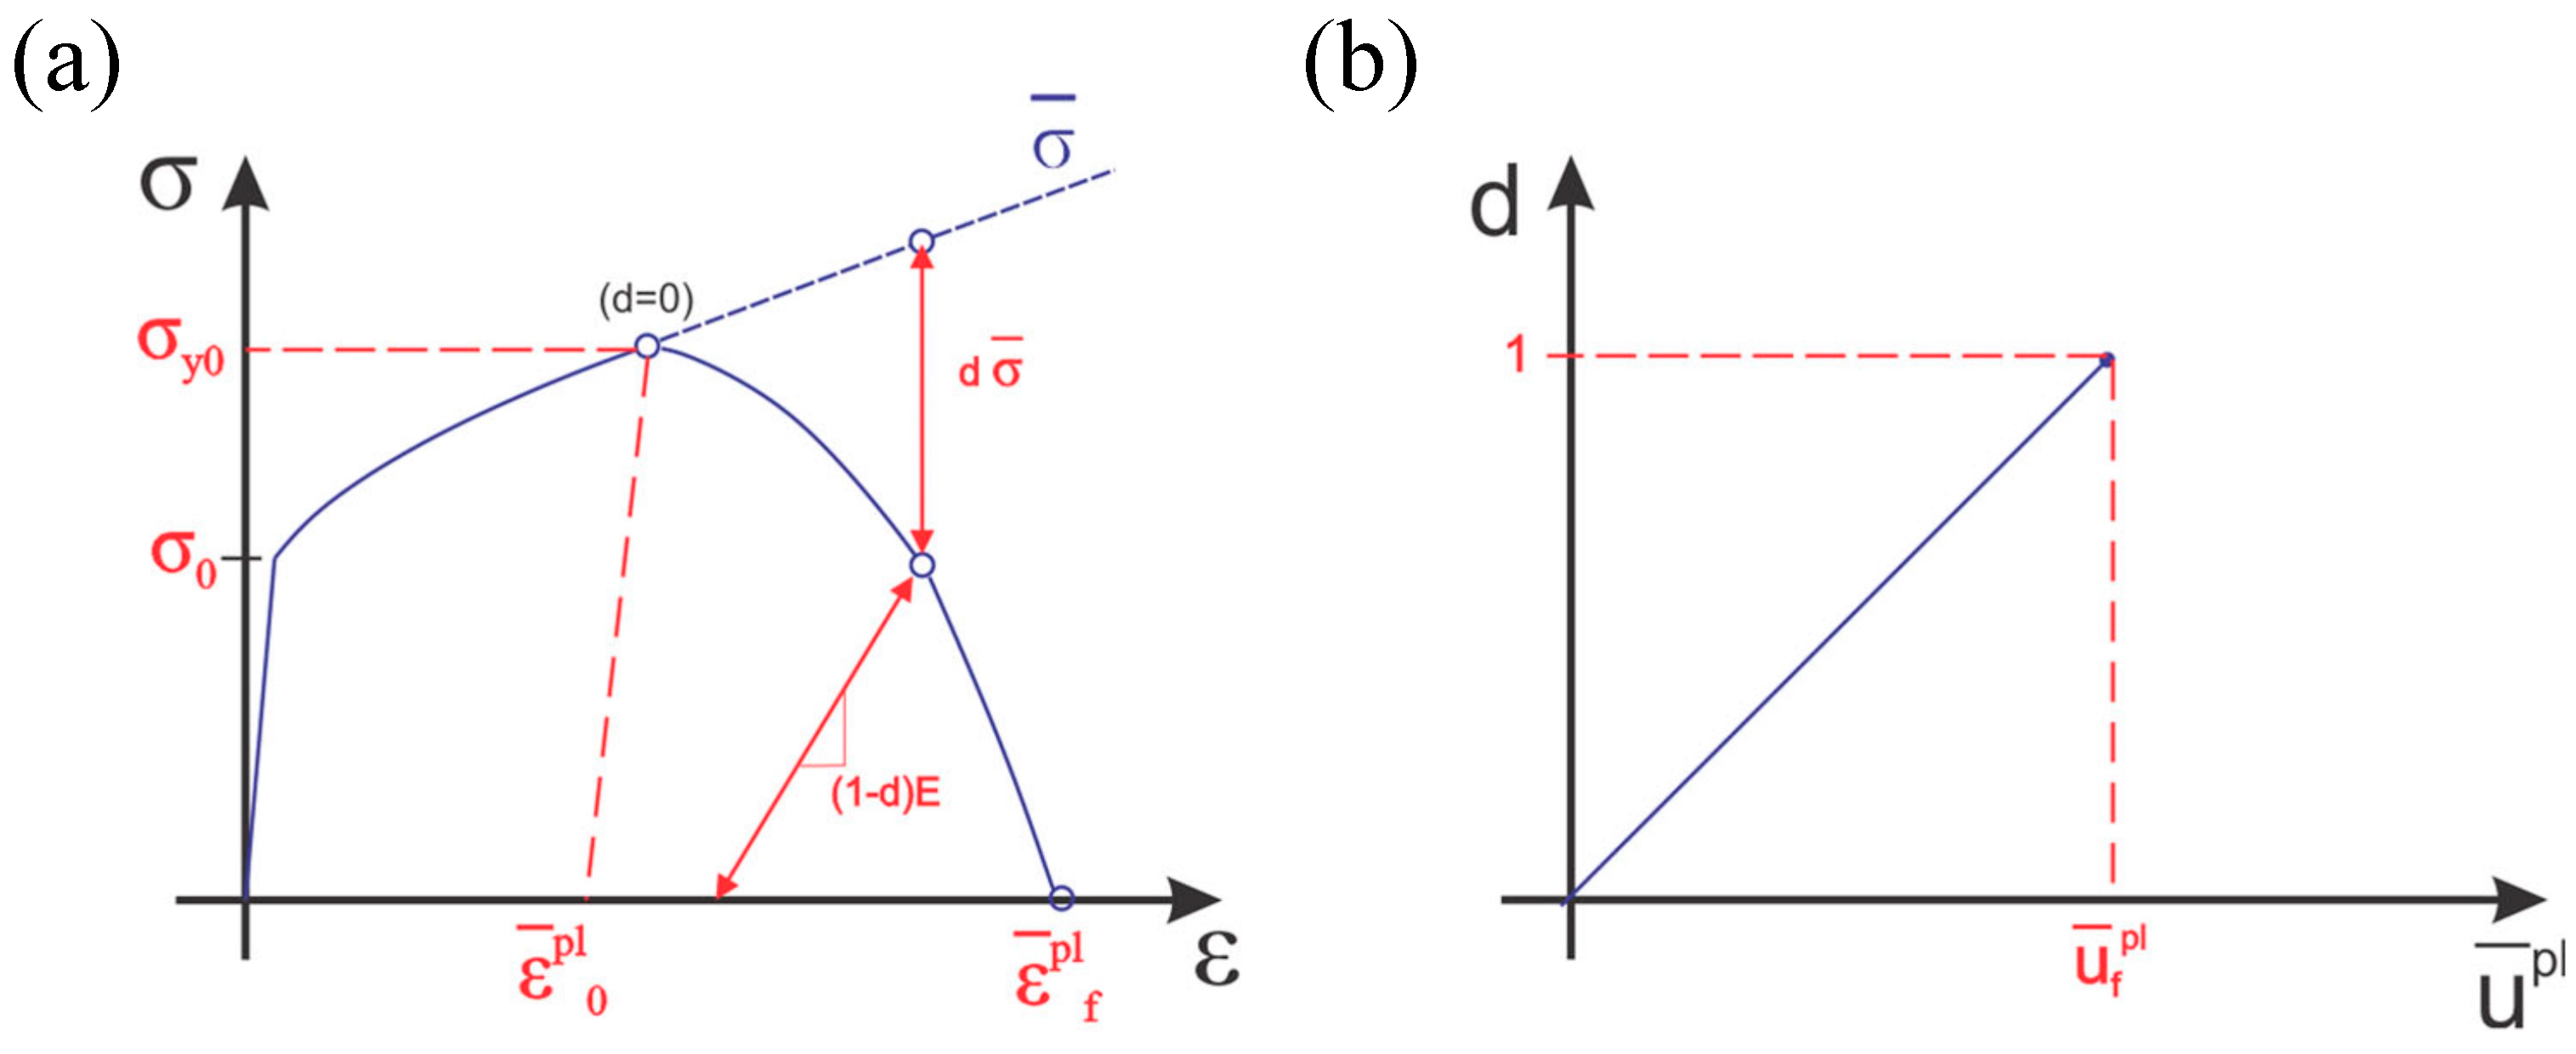
2.2. Johnson–Cook Damage Model

To study oxide damage, crack initiation must be modeled using the ratio of equivalent plastic strain ( ε ¯ ) to equivalent fracture strain ( ε ¯ f ). This ratio equals 1, as shown in Equation (3) [39,40]:
D = ε ¯ ε ¯ f = 1
In the present study, the Johnson–Cook damage model (Equation (4)) was used in conjunction with the Johnson–Cook plasticity model to study fracture initiation [39,40]:
ε ¯ f = d 1 + d 2 . exp d 3 η × 1 + d 4 . ln ε ¯ ˙ ε ¯ ˙ 0 × 1 + d 5 . T T r o o m T m T r o o m
where d 1 , d 2 , d 3 , d 4 , and d 5 are initial failure strain, exponential factor, triaxiality factor, strain rate factor, and temperature factor, respectively.
It is important to consider damage evolution models when analyzing failure patterns [39,40,41]. In both experiments and numerical simulations, thin brittle oxide films showed significant ductility [15,16,17,18,19,42,43,44,45,46]; therefore, a ductile fracture model, such as the Johnson–Cook damage model, was selected to study the failure of thin brittle oxide films [18,42]. In this work, the reduction rate of the damage evolution law is determined based on the actual plastic displacement ( u ¯ p l ), as shown in Equations (5) and (6) [18,19,38].
u ¯ ˙ p l = L ε ¯ ˙ p l
d ˙ = L ε ¯ ˙ p l     u ¯ f p l = u ¯ ˙ p l u ¯ f p l
where L is the element length, u ¯ ˙ p l represents effective plastic displacement, ε ¯ ˙ p l is equivalent plastic strain rate, u ¯ f p l stands as the effective plastic displacement at the failure point, and d ˙ is for the damage variable rate.
In this study, a linear type of damage evolution was used. In this model, the material stiffness is completely reduced (d = 1) when the effective plastic displacement reaches the fracture value ( u ¯ p l = u ¯ f p l ). In the damage evolution law for brittle fracture, the value of u ¯ f p l has been set to zero. For ductile fracture, the value of u ¯ f p l is defined by the mesh size, which can be found accurately by experimental investigation, as shown in Figure 2 [18,19,38]. In this paper, the same range tested in the literature [18,19,38] was used to study the failure of the oxide layer.

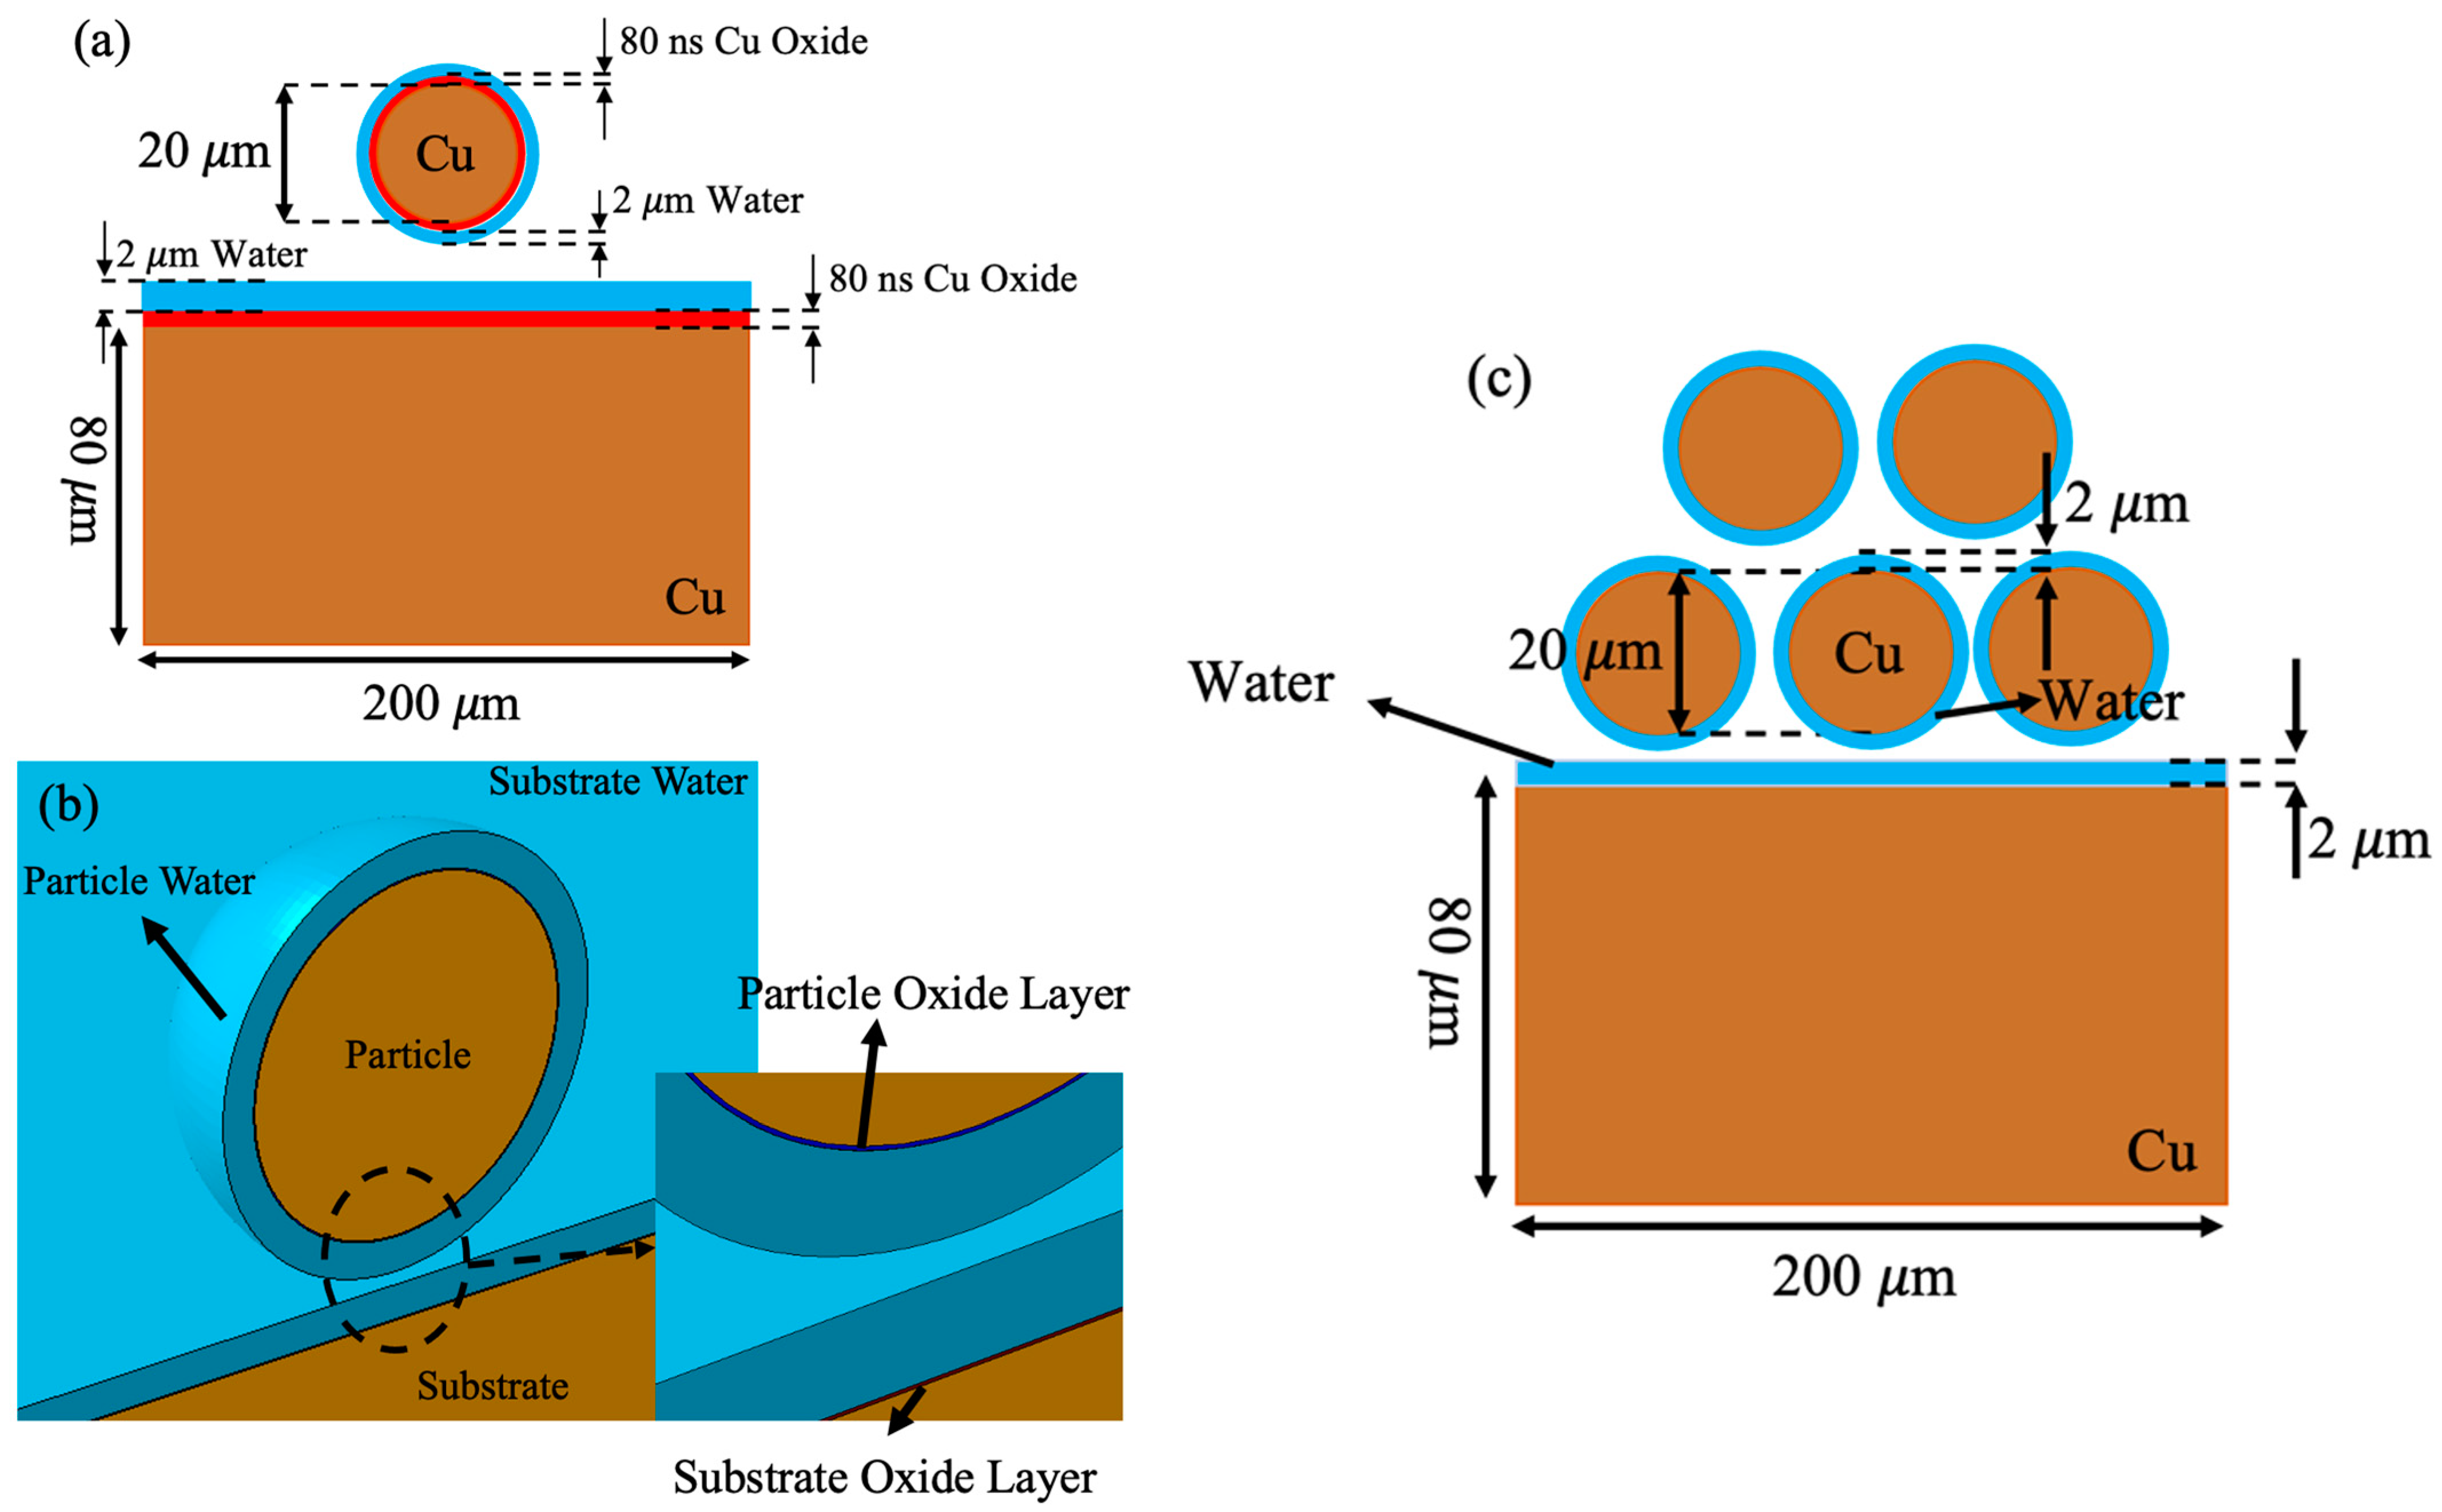
2.3. Finite Element Method

To solve the three-dimensional models, ABAQUS/Explicit can be used in addition to coupled Eulerian–Lagrangian (CEL). Lagrangian parts were used to define copper particles, copper substrates, and oxide layers, while the Eulerian part was used to define water. The reason for choosing copper for both particle and substrate is due to its soft nature making it easier to run simulation using lower velocity and run time [7,18,20,23,24,37,41]. A dynamic explicit solver was chosen to solve the problem. The coefficient of friction is estimated to be 0.3 [30,31]. The particle mesh size is 1 µm, the particle oxide layer mesh size is 0.5 µm, the substrate mesh size is 5 µm, and the substrate oxide layer mesh size is 1 µm. All the mesh sizes are in the range of reported values in previous literature [9,18,19,30,31,41,47,48]. As previously reported [18,19,30,31], both particle and substrate oxide layers contain a single element in their thickness. The element size of the water film wetting the particle and substrate and the Eulerian part are systematically investigated, as shown in Appendix A, before the investigation of the water effect on oxide failure and porosity formation. The mesh type of the Lagrangian parts is C3D8RT (an 8-node thermally coupled brick, trilinear displacement, temperature, reduced integration, and hourglass control), and the mesh type of the Eulerian part is EC3D8RT (an 8-node thermally coupled linear Eulerian brick, reduced integration, and hourglass control) [19]. The behavior of the oxide layer is completely independent of its own material constant, since it is only affected by particle and substrate deformation. Therefore, the same elastic and plastic material constants for the core particle were used for the oxide layer, along with the damage evolution model and the fracture point displacement, which was 0.00025 [18,19]. The linear Us–Up Hugoniot form of the Mie–Grüneisen equation of state is considered as the constitutive model for water [33,35]. All dimensions used in this numerical study are shown in Figure 3. Table 1 shows that these constants are applicable to the materials used in this study [18,19,30,31,39]. The validity of the model has been approved and verified with experimental results for solid-state deposition methods such as CS in previous literature. Therefore, to avoid repetition, and since no changes have been made to the model used, we have not reported the validation results for the models [7,17,18,19,24,37,41]. Regarding the use of the experimental setup of LCS to validate our results, it is worth noting that, due to the uncertainty surrounding the thickness of the water film wetting the particle or substrate, comparing our results to numerical studies will be a challenge for future work and is out of the scope of this paper.
To study both oxide layer failure and porosity formation in LCS coatings, three different conditions were used. The first condition assumes that a conventional cold spray was used for deposition, so that both particles and substrates are dry. In the second condition, only the particle is wet, and in the third condition, only the substrate is wet. To examine oxide layer failure and to avoid highly deformed elements to study oxide film failure, a 20 µm copper particle impacts a copper substrate at different velocities at room temperature with an 80 nm oxide film surrounding both particle and substrate; for simplicity, the variation of oxide thickness which might be observed in practical applications is not considered. The size of the oxide thickness is in the range that was previously used in other literature [9,18,19,41,47,48]. Water thickness is 2 µm when it wets either the particle or substrate. The difference between water thicknesses is intended to capture the water effect on the results and to avoid irrational long run times. It is worth noting that all the impact velocities (500, 600, or 700 m/s selected for this study) are greater than the critical value required to deposit 20 µm copper particles on a copper substrate while both are at room temperature (298 K) [10]. However, calculating the critical velocity of LCS required a more in-depth understanding of water film and oxide film thickness, which can be obtained using CFD modeling and experimental examination, respectively, both of which are beyond the scope of this paper. Moreover, in our previous works, it was shown that for a copper particle deposited using LCS to reach the same amount of deformation as one using CS, high impact velocity is required. This means that the critical velocity in LCS is expected to be higher. After studying the effects of water wetting the particle or substrate on their deformation and oxide film failure, we must investigate some methods to enhance the area of the failed oxide layer, such as increasing particle velocity.
To study porosity formation, five 20 µm copper particles were impacted on a copper substrate in the same order used in the literature [49]. In each part of the model, all dimensions and initial conditions are within the ranges used in the previous investigations [9,18,19,30,31,49]. Table 2 displays the initial conditions used to study the effects of particle velocity and water film thickness on porosity in the LCS-deposited coating. It is worth noting that because particles are Lagrangian, it is not possible to calculate the amount of porosity reported in the following chapters.
The in-flight particle velocity has been studied using experimental methods in LCS. There is evidence that particle velocity increases with increasing water pressure [32,33,34]. As reported in the literature, for a 180 µm and 300 µm copper particle, the velocity would be approximately 880 m/s and 800 m/s, respectively, at a water pressure of 380 ksi [32,33,34]. As part of the experimental investigation previously conducted, water velocity and particle velocity were measured. Based on the water pressure and particle size, the particle velocity is approximately 500 m/s or higher, which is close to the velocity of the water jet [34]. This explanation illustrates that the selected particle velocity in our work can be achievable using the experimental setup of LCS [32,33,34]. Since higher particle velocity reduces the volume of interfacial water, an impact velocity of 500 m/s was selected to investigate the effect of mesh size on observing the interfacial water trapped between the particle and the substrate [31]. It is important to note that accurately determining the water thickness requires computational fluid dynamics (CFD) modeling, which is beyond the scope of this study. Therefore, all water thickness dimensions are based on previous works [30,31]. Accordingly, the particle velocity values selected in this study are within an acceptable range [32,33,34]. In the end, the flattening of the deposited particles was calculated using Equation (7), below. In this equation, ∆h is the difference between the deformed particle height and the initial particle diameter (d0) [19,25].
F l a t t e n i n g = h d o

3. Results and Discussion

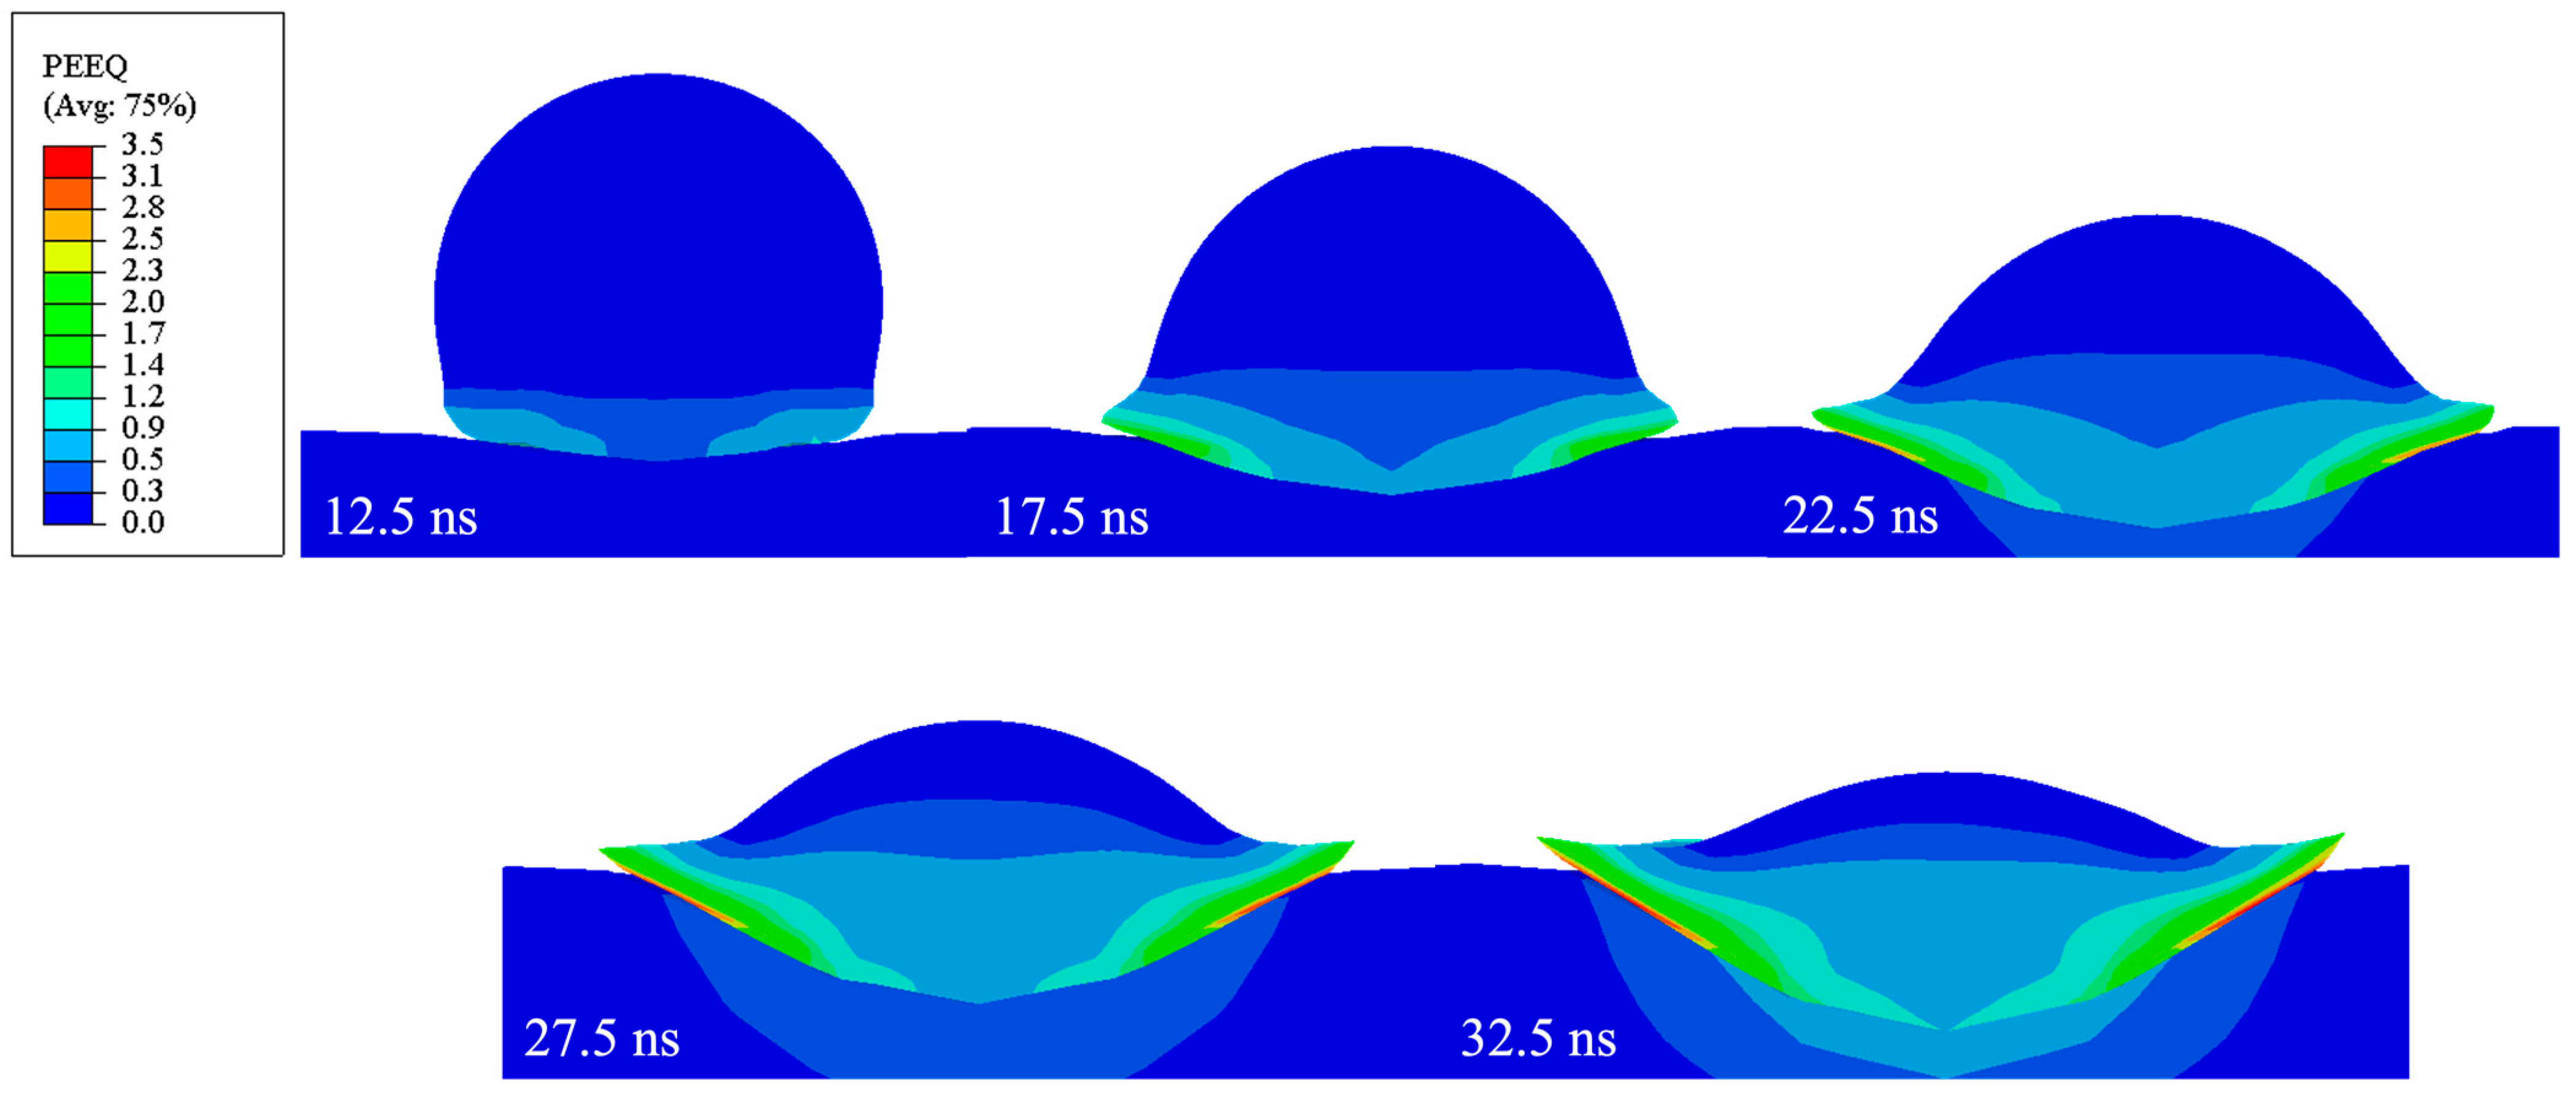
3.1. Oxide Layer Behavior

3.1.1. Oxide Layer Failure in LCS

Before studying oxide failure, it is necessary to study particle and substrate deformation. This is because oxide failure is primarily the result of particle and substrate deformation [18,19]. Figure 4 shows the final shape of a deformed copper particle after impacting a 20 µm copper particle on a copper substrate at 600 m/s for 50 ns while both surfaces are coated with 80 nm oxide layers. To emphasize the deformation, the 2 µm water film has been removed from the images. According to the literature, the selected impact velocity of the pure, 20 µm copper particle is higher than the critical velocity and can cause the resulting material jet to eject broken oxide pieces and cause the particle to become metallically bonded to the substrate [6,18,19]. Figure 4 illustrates that a significant amount of material jet is produced when a copper particle is deposited using CS, indicating that no water was used during the deposition process. The significance of the material jet and the flattening ratio decreased significantly due to the impact of wet particles or a wet substrate. Therefore, the use of water as a propellant could adversely affect the critical velocity and particle deformation. This is in agreement with the previous fundamental studies [30,31]. To understand the failure of the oxide layers shown in Figure 4 where the green oxide layer is for the particle and the red one is for the substrate, it is necessary to become familiar with the fact that both the particle and the substrate oxide layers fail in a ring-shaped region where particle and substrate are more deformed—a region in which ASI is likely to occur, in accordance with previous findings [8,10,11,18,19]. It is possible to demonstrate this deformation using equivalent plastic strain, as shown in Figure 5. As one can see, the equivalent plastic strain is higher in the circular regions when wet copper particles impact dry copper surfaces. According to the literature [6,18,19], particle and substrate oxide layers would fail in the ASI region and would then be ejected by a material jet, which can be observed in Figure 4.
In addition to the reduction in kinetic energy, deformation, and area of failed oxide layers after particle or substrate wetting [30,31], wetting can have another effect on bonding. Figure 6 illustrates the contact area between the particle and the substrate. The brown portion represents the oxide layer of the substrate, the green portion represents the oxide layer of the particle, the orange portion represents the particle, and the light blue portion represents water. Due to the absence of interfacial water in Figure 6a, wetting a substrate does not adversely affect the bond. According to our last work [19], when a particle is wet, some of the water is trapped between the particle and the substrate. However, almost no water can be found in the interface represented in Figure 6b. In the following section, in which the impact velocity is reduced, significant interfacial water can be found. The interfacial water is trapped at the point where the oxide layer fails, where there is an opportunity for metallurgical bonding between the particle and the substrate. According to the method described in the literature [25], approximately 1% of the water wetting the particle is trapped as interfacial water.
As discussed in the previous studies, the reason for the presence of interfacial water is highly related to particle and substrate deformation [30,31]. Additionally, the failure of the oxide layer and the provision of more area capable of producing metallic bonds are also related to particle and substrate deformation. In solid-state deposition, deformation is highly dependent on particle velocity and kinetic energy at impact. Thus, it is necessary to investigate the effect of particle velocity on oxide layer failure and water behavior in the LCS process. It is worth noting that the focus of the paper will be devoted to the time in which a wet particle impinges on a dry substrate, as water will not only reduce deformation but also lead to the presence of interfacial water.

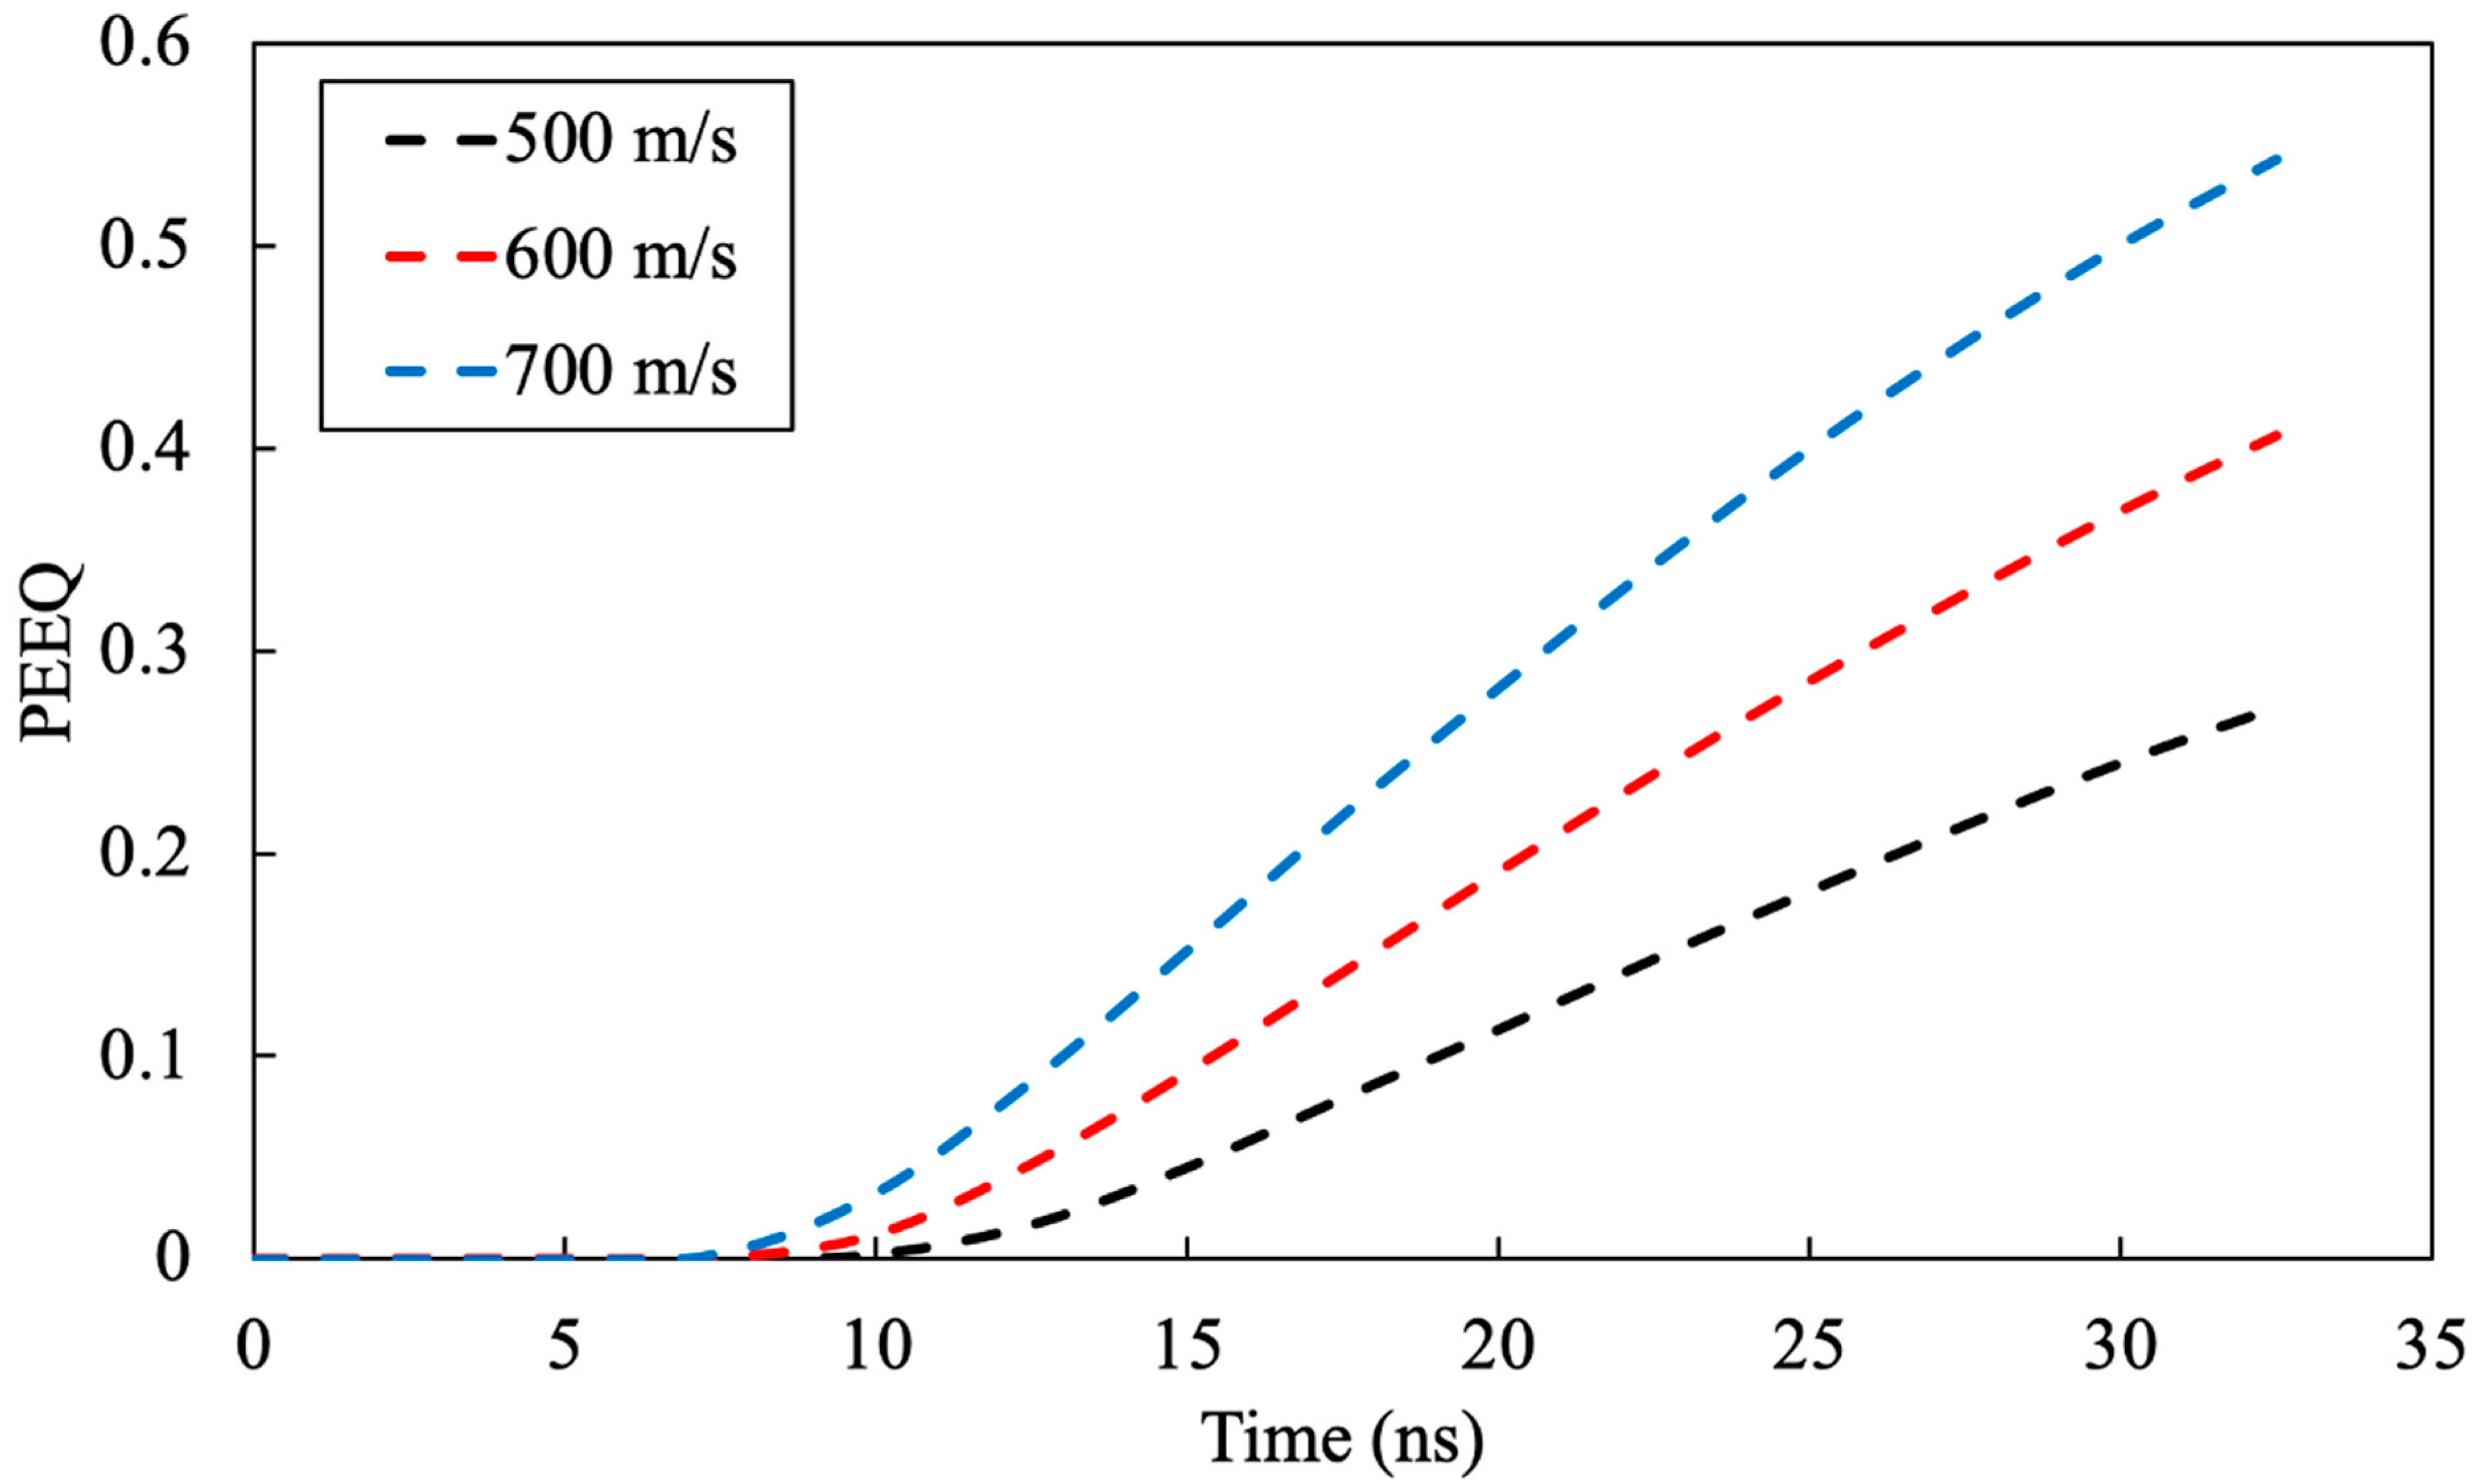
3.1.2. Particle Velocity Effect

To examine the effect of particle velocity on oxide film failure, this section assumes that a copper particle with a diameter of 20 µm is deposited at 500, 600, and 700 m/s on a copper substrate coated with 80 nm oxide films, with water wetting the particle with a thickness of 2 µm. To avoid repeating the results and to focus on a parameter that has two negative effects on the bond area and bond strength at the same time, this section only examines the situation where the water is wetting the particle. This situation not only reduces the deformation (such as the time when the substrate is wet and the particle is dry), but it can also lead to finding interfacial water trapped between the particle and the substrate.
Figure 7 illustrates the shape of the deformed particles and the failure of the oxide layer when a wet copper particle is impacted at different velocities. Water has been removed from the images to emphasize particle deformation. In all three cases, the particles are highly deformed and have penetrated the copper substrate. By increasing the impact velocity, the particle has more kinetic energy, resulting in a higher flattening ratio, which translates into increased particle deformation. In addition, Figure 7 illustrates the failure of the oxide layer. In the brown color, there is an oxide layer on the substrate, while the green color is the oxide layer of the particles. The white areas are those where both oxide layers have failed, and a metallic bond can be formed. Increasing the particle velocity resulted in a significant increase in the white area where both oxide layers failed.
The deformation of the particles is only responsible for the failure of its own oxide layer. As shown in our previous study, the failure of the substrate oxide layer depends on how much of the substrate is deformed [19]. Therefore, by taking the equivalent plastic strain (PEEQ) of the substrate during its 50 ns of deformation (Figure 8), it is possible to determine that increasing the impact velocity would increase the equivalent plastic strain and substrate deformation. Consistent with previous findings in the literature [19,31], this study confirms that increasing particle velocity leads to increased particle and substrate deformation, resulting in a larger area of failed oxide layers capable of producing a strong metallurgical bond with high adhesion strength.
In Figure 9, the effect of increasing the particle velocity on the volume of interfacial water is demonstrated. It is apparent that an increase in impact velocity from 500 m/s to 700 m/s would significantly reduce the volume of interfacial water but would not eliminate it completely. The ratio of the interfacial water volume to the total volume of water wetting the particle was calculated for all three conditions, as seen in Figure 9b. Based on this ratio, increasing the impact velocity from 500 m/s to 700 m/s would result in a reduction of the ratio by approximately 73%. Thus, increasing the impact velocity can be considered as an effective way to reduce the interfacial water and increase the area of failed oxide layers.

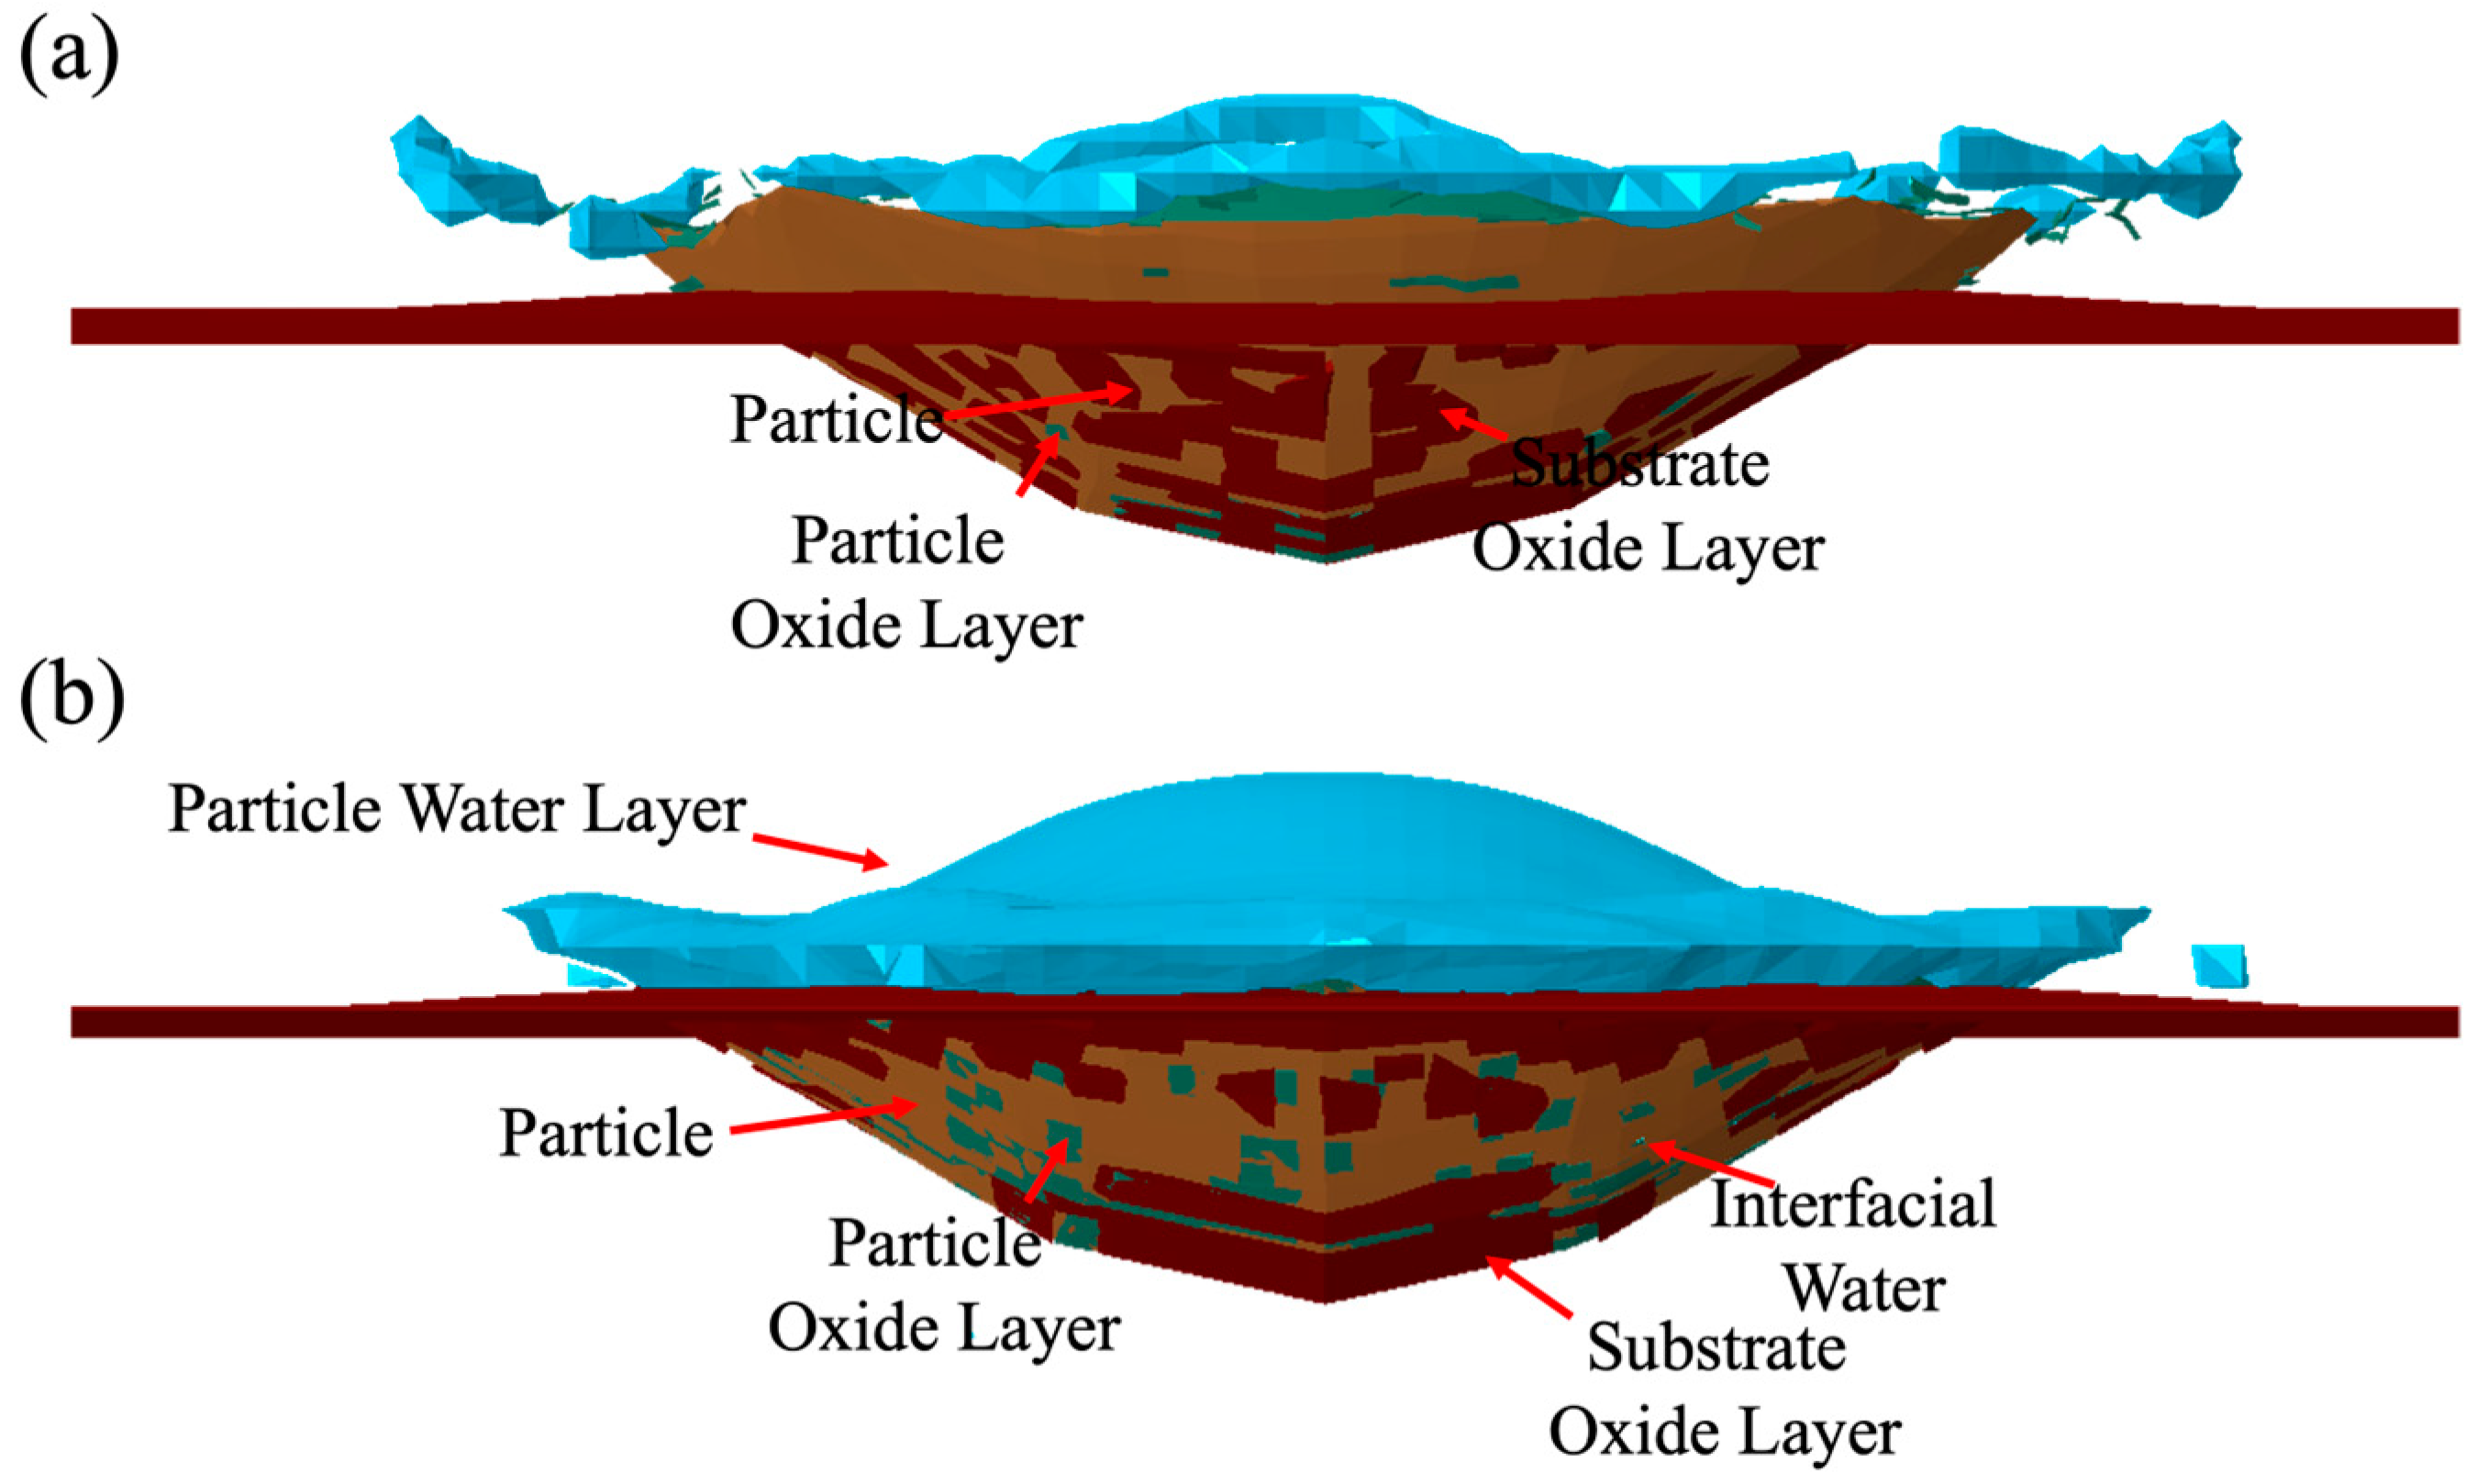
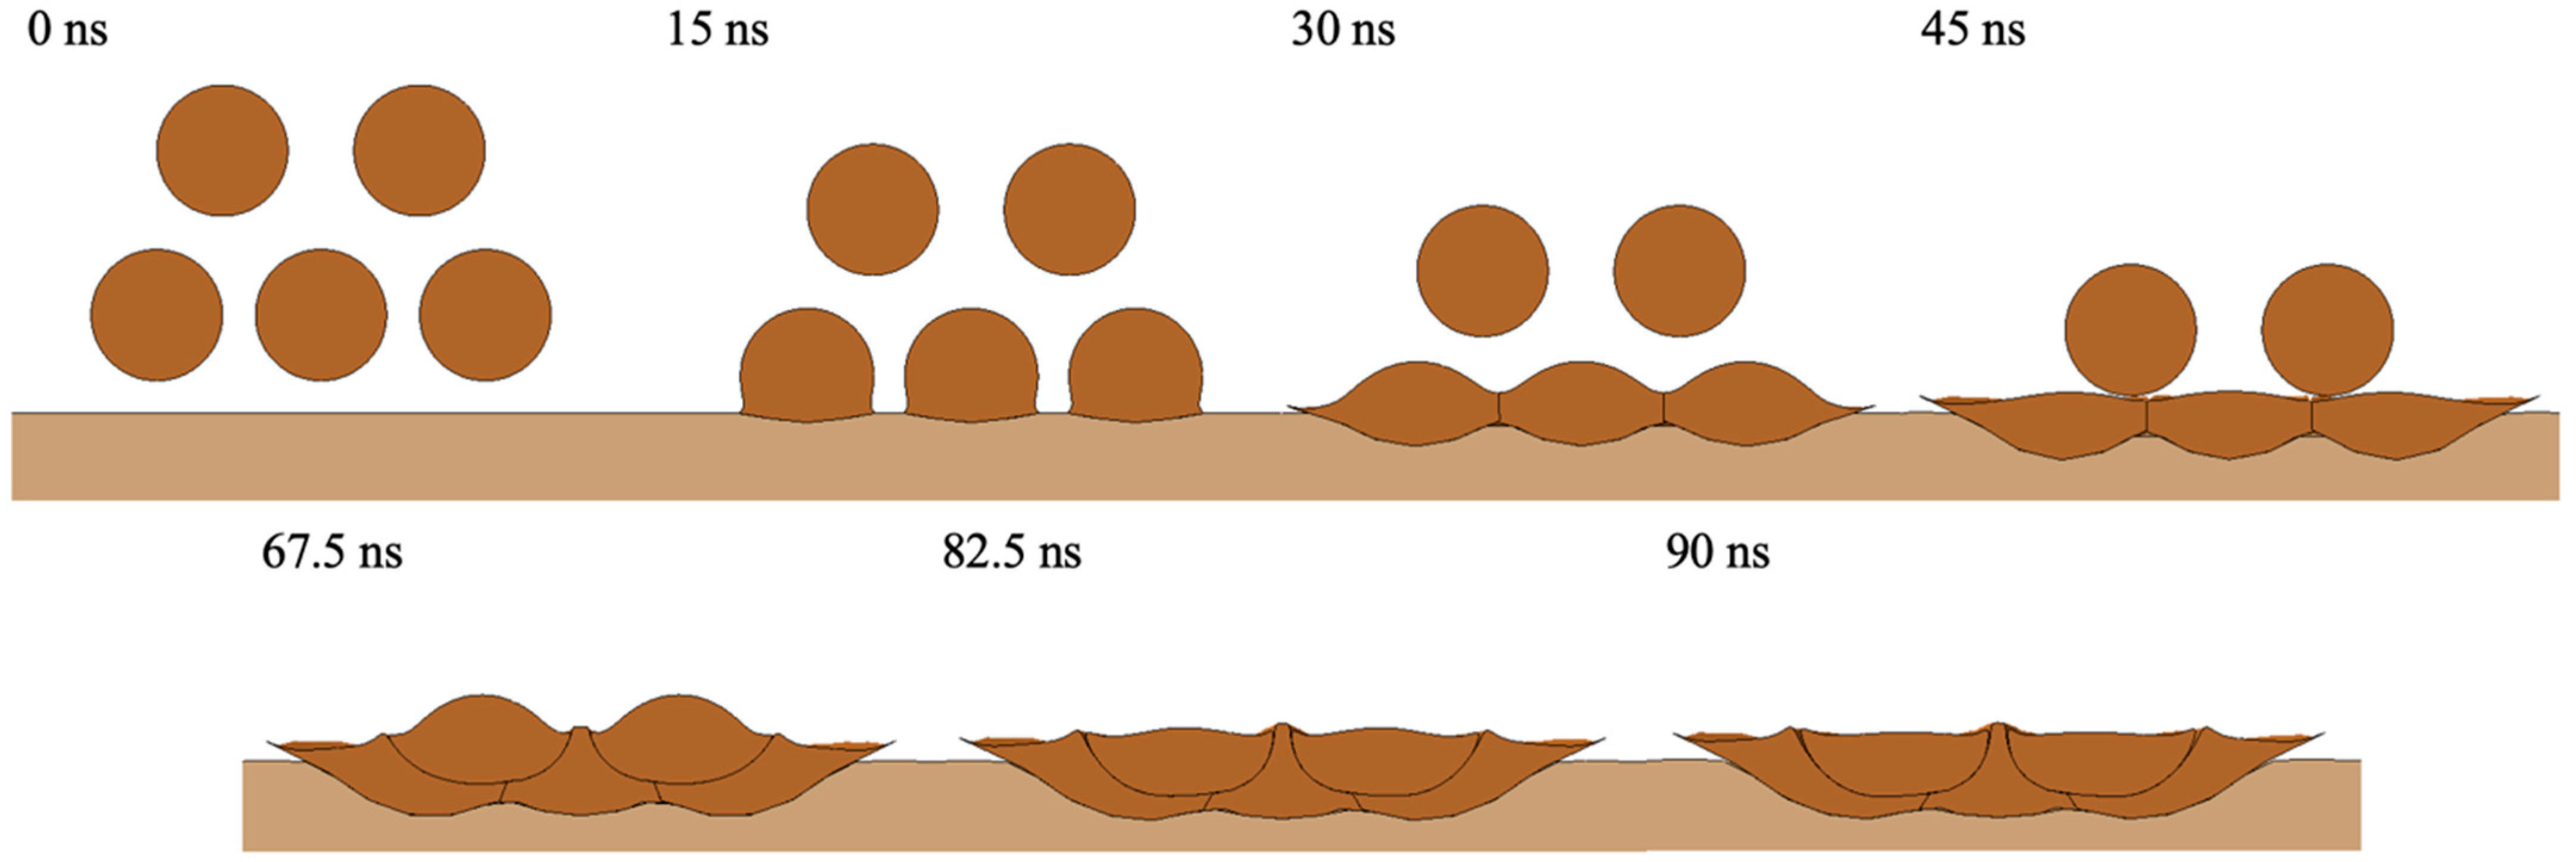
3.2. Porosity Level Formation

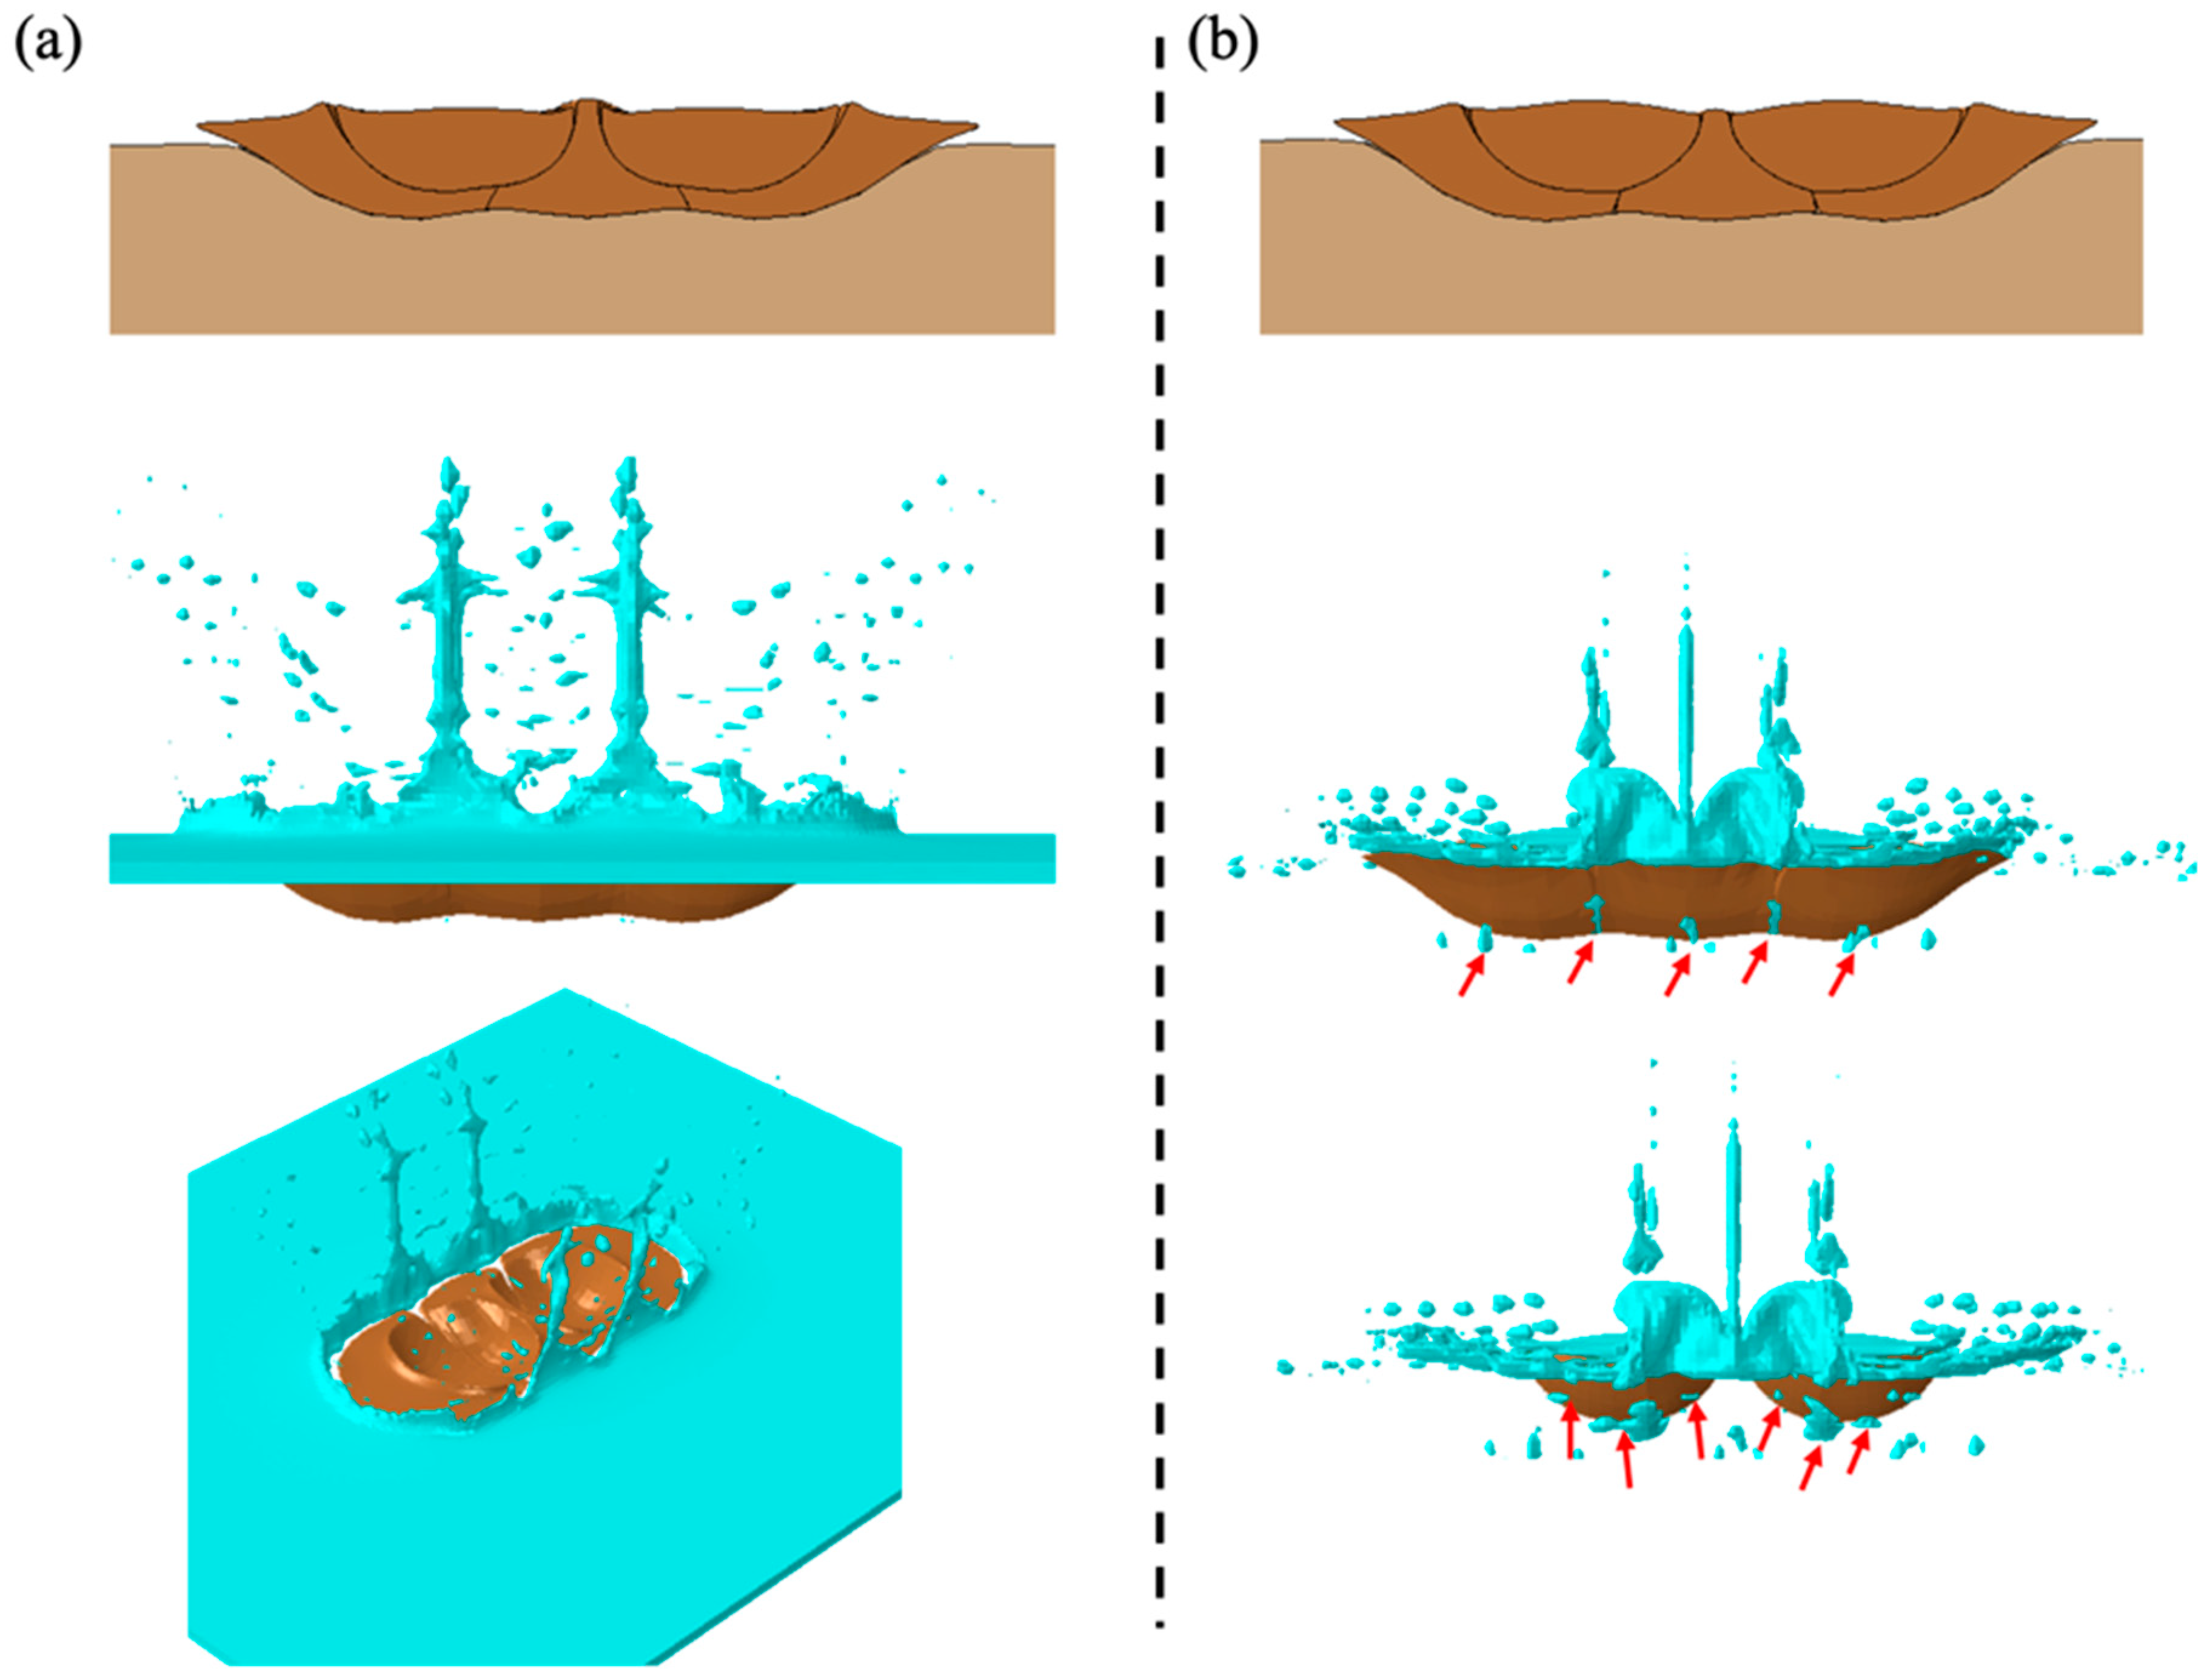
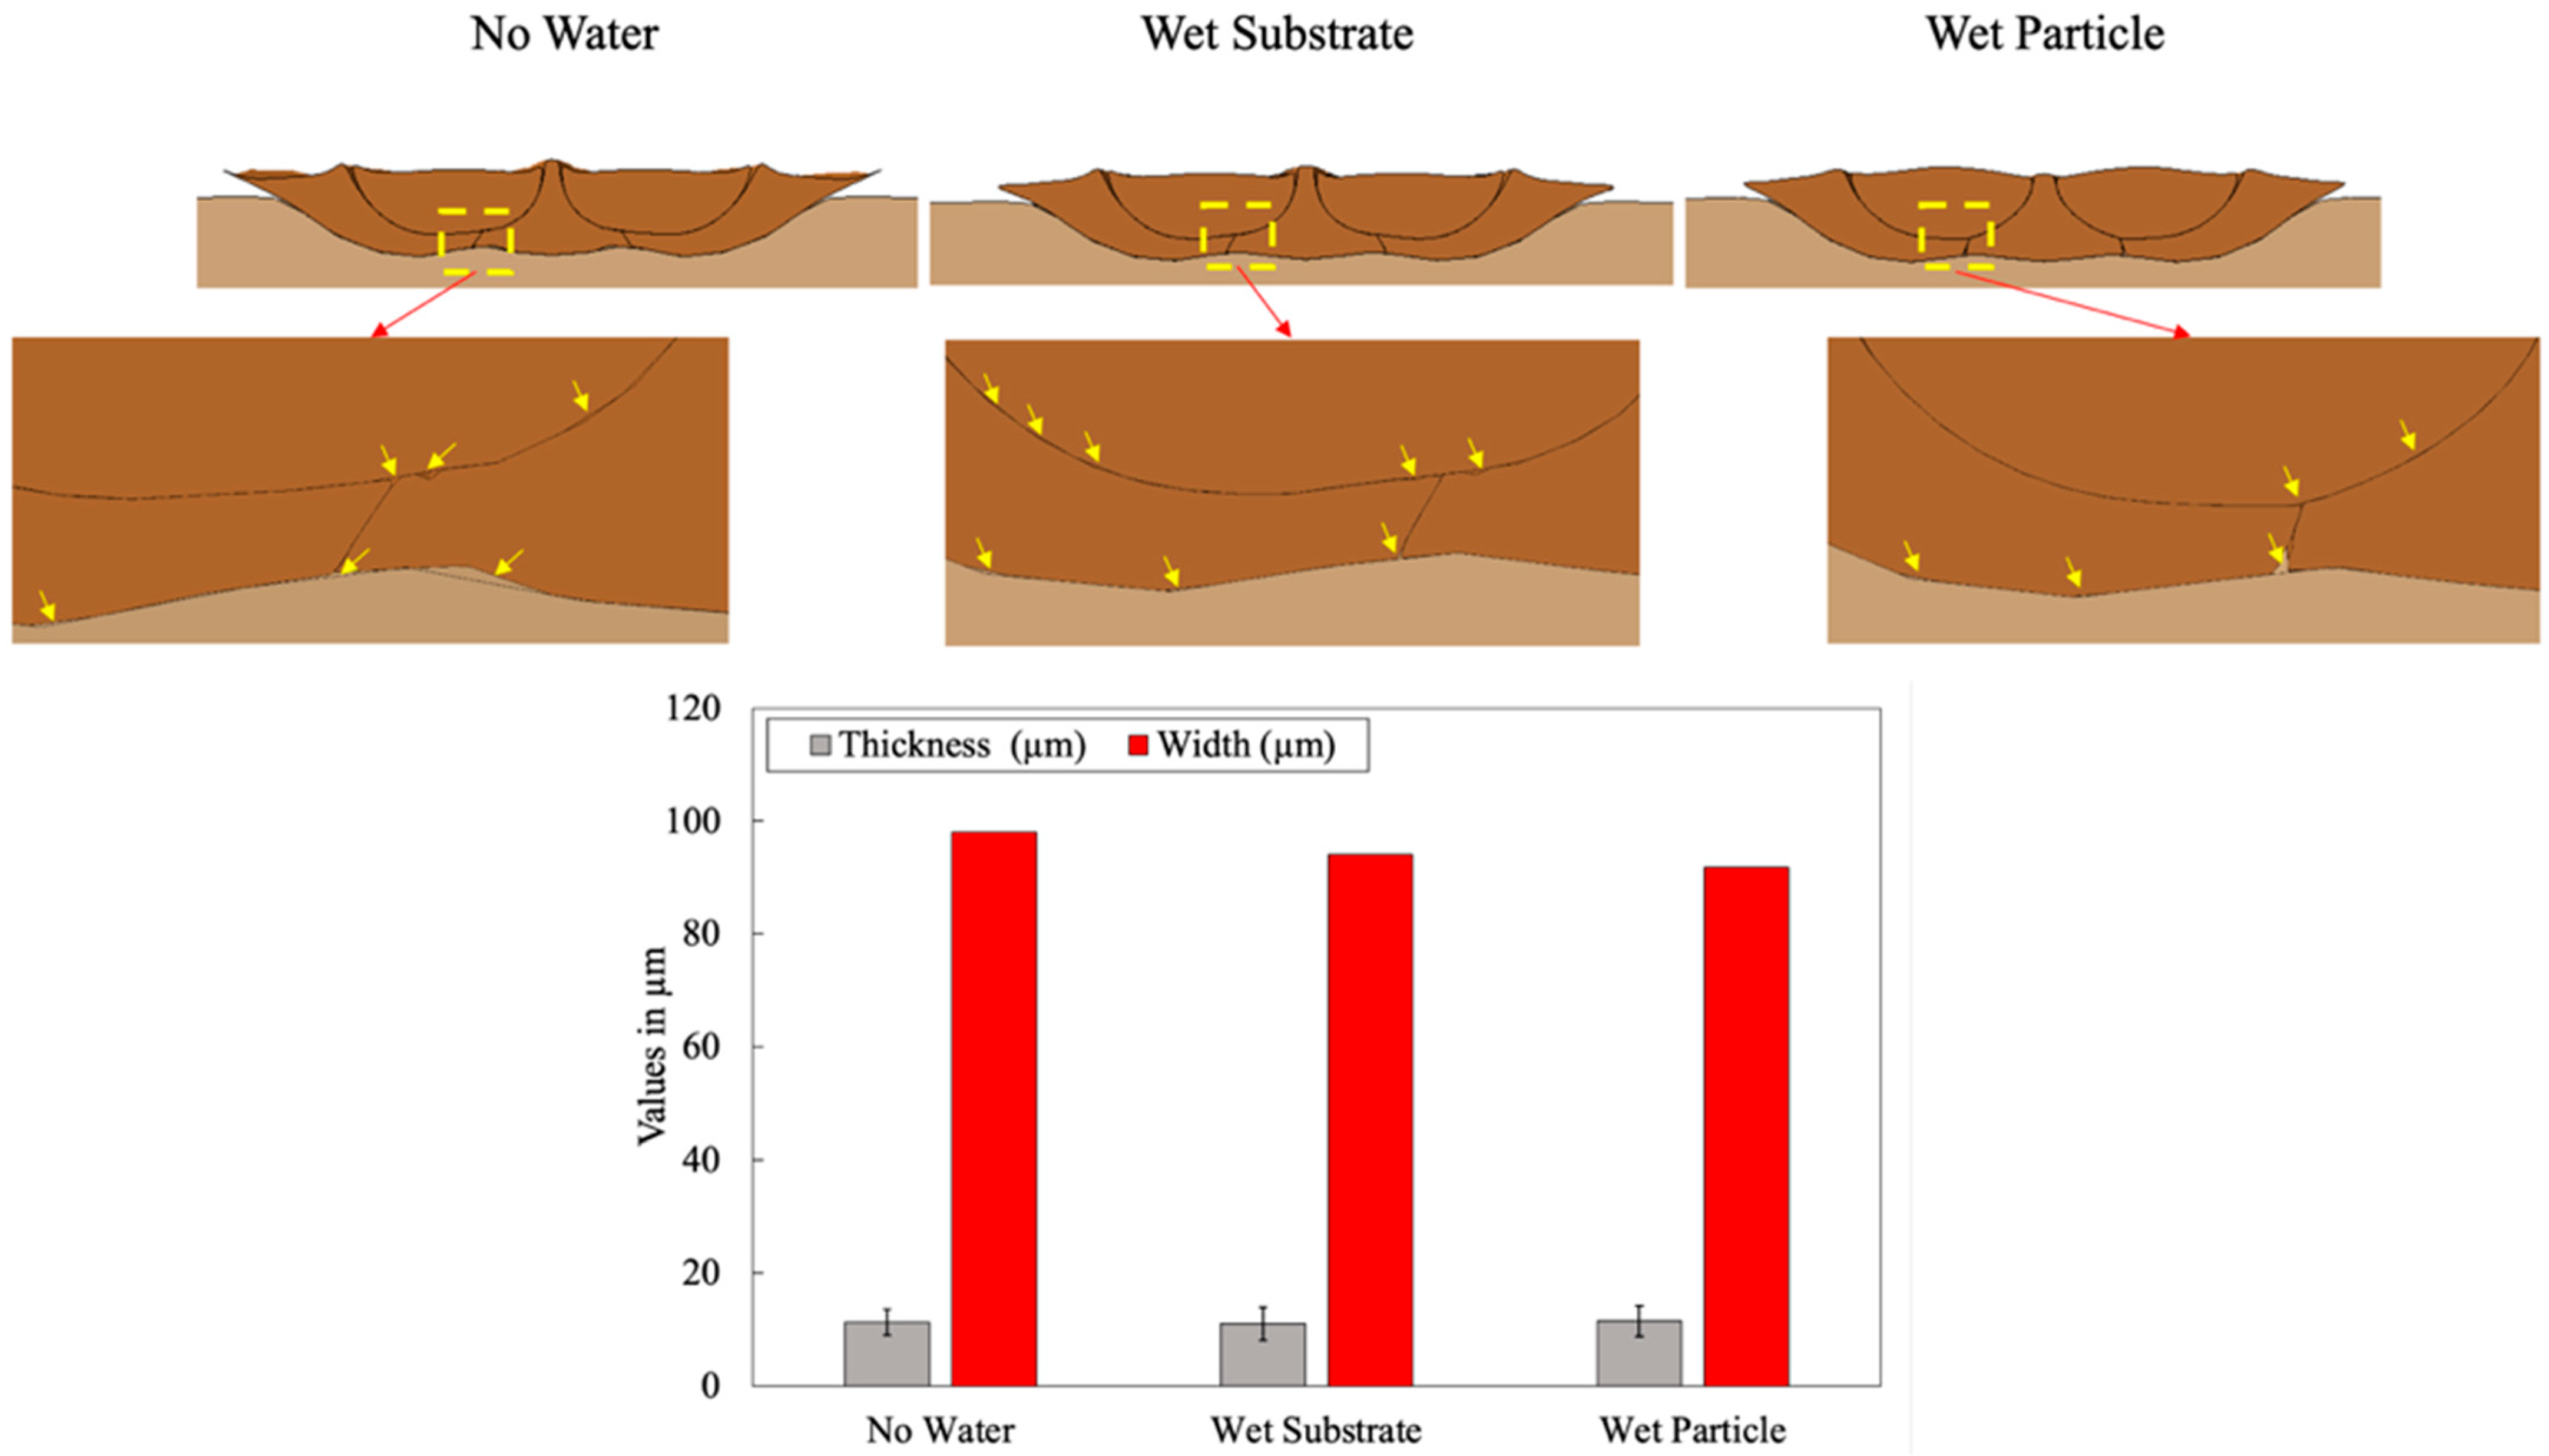
3.2.1. Water Effect on Porosity Formation

In this section, it is assumed that five 20 µm copper particles are impacting a copper substrate at 600 m/s. This particular arrangement of particles was chosen based on the literature to avoid highly deformed elements [49]. Figure 10 shows that all five particles are deformed upon impact, forming a dense coating with CS. To avoid long run times and to gain a deeper understanding of the water effect on coating formation, instead of considering the wet particle and substate simultaneously, the effect of water wetting the substrate and the effect of water wetting the particles on porosity formation and interfacial water were investigated separately.
Figure 11 shows that in both cases, the particles are significantly deformed, and coatings have formed. By examining the particles and the substrate from the images, it can be seen in Figure 11a that water wetting the substrate alone would not end up being trapped between the particles and the substrate or between the particles themselves. Figure 11b shows that wetting the particles results in water being trapped between the particles and the substrate (interfacial water) and between the particles themselves (interparticle water), as indicated by the red arrows.
The formation of pores occurred regardless of whether LCS or CS was used, as shown in the cross-sectional images in Figure 12. These pores were found between the particles themselves and between the particles and the substrate, and are indicated by yellow arrows. Figure 12 also shows that the average thickness of the coatings deposited with LCS, regardless of whether the substrate or particles are wetted with water, is slightly higher, while their final width is slightly smaller compared to the coating deposited with CS. This is due to the fact that part of the kinetic energy of the particles was used to push the water aside and the deformation of the particles was reduced, as discussed above and in our previous work [30,31].
According to the results discussed, the impact of wet particles on the dry substrate does not affect the porosity formation or the presence of interfacial and interparticle water. This would adversely affect the microstructure of the coating. As shown in our previous work [31], two factors, increasing particle velocity and reducing water thickness, are effective in reducing the amount of entrapped water. In the following sections, the effect of each parameter on the volume of interfacial and interparticle water in the deposited coatings is examined in more detail.

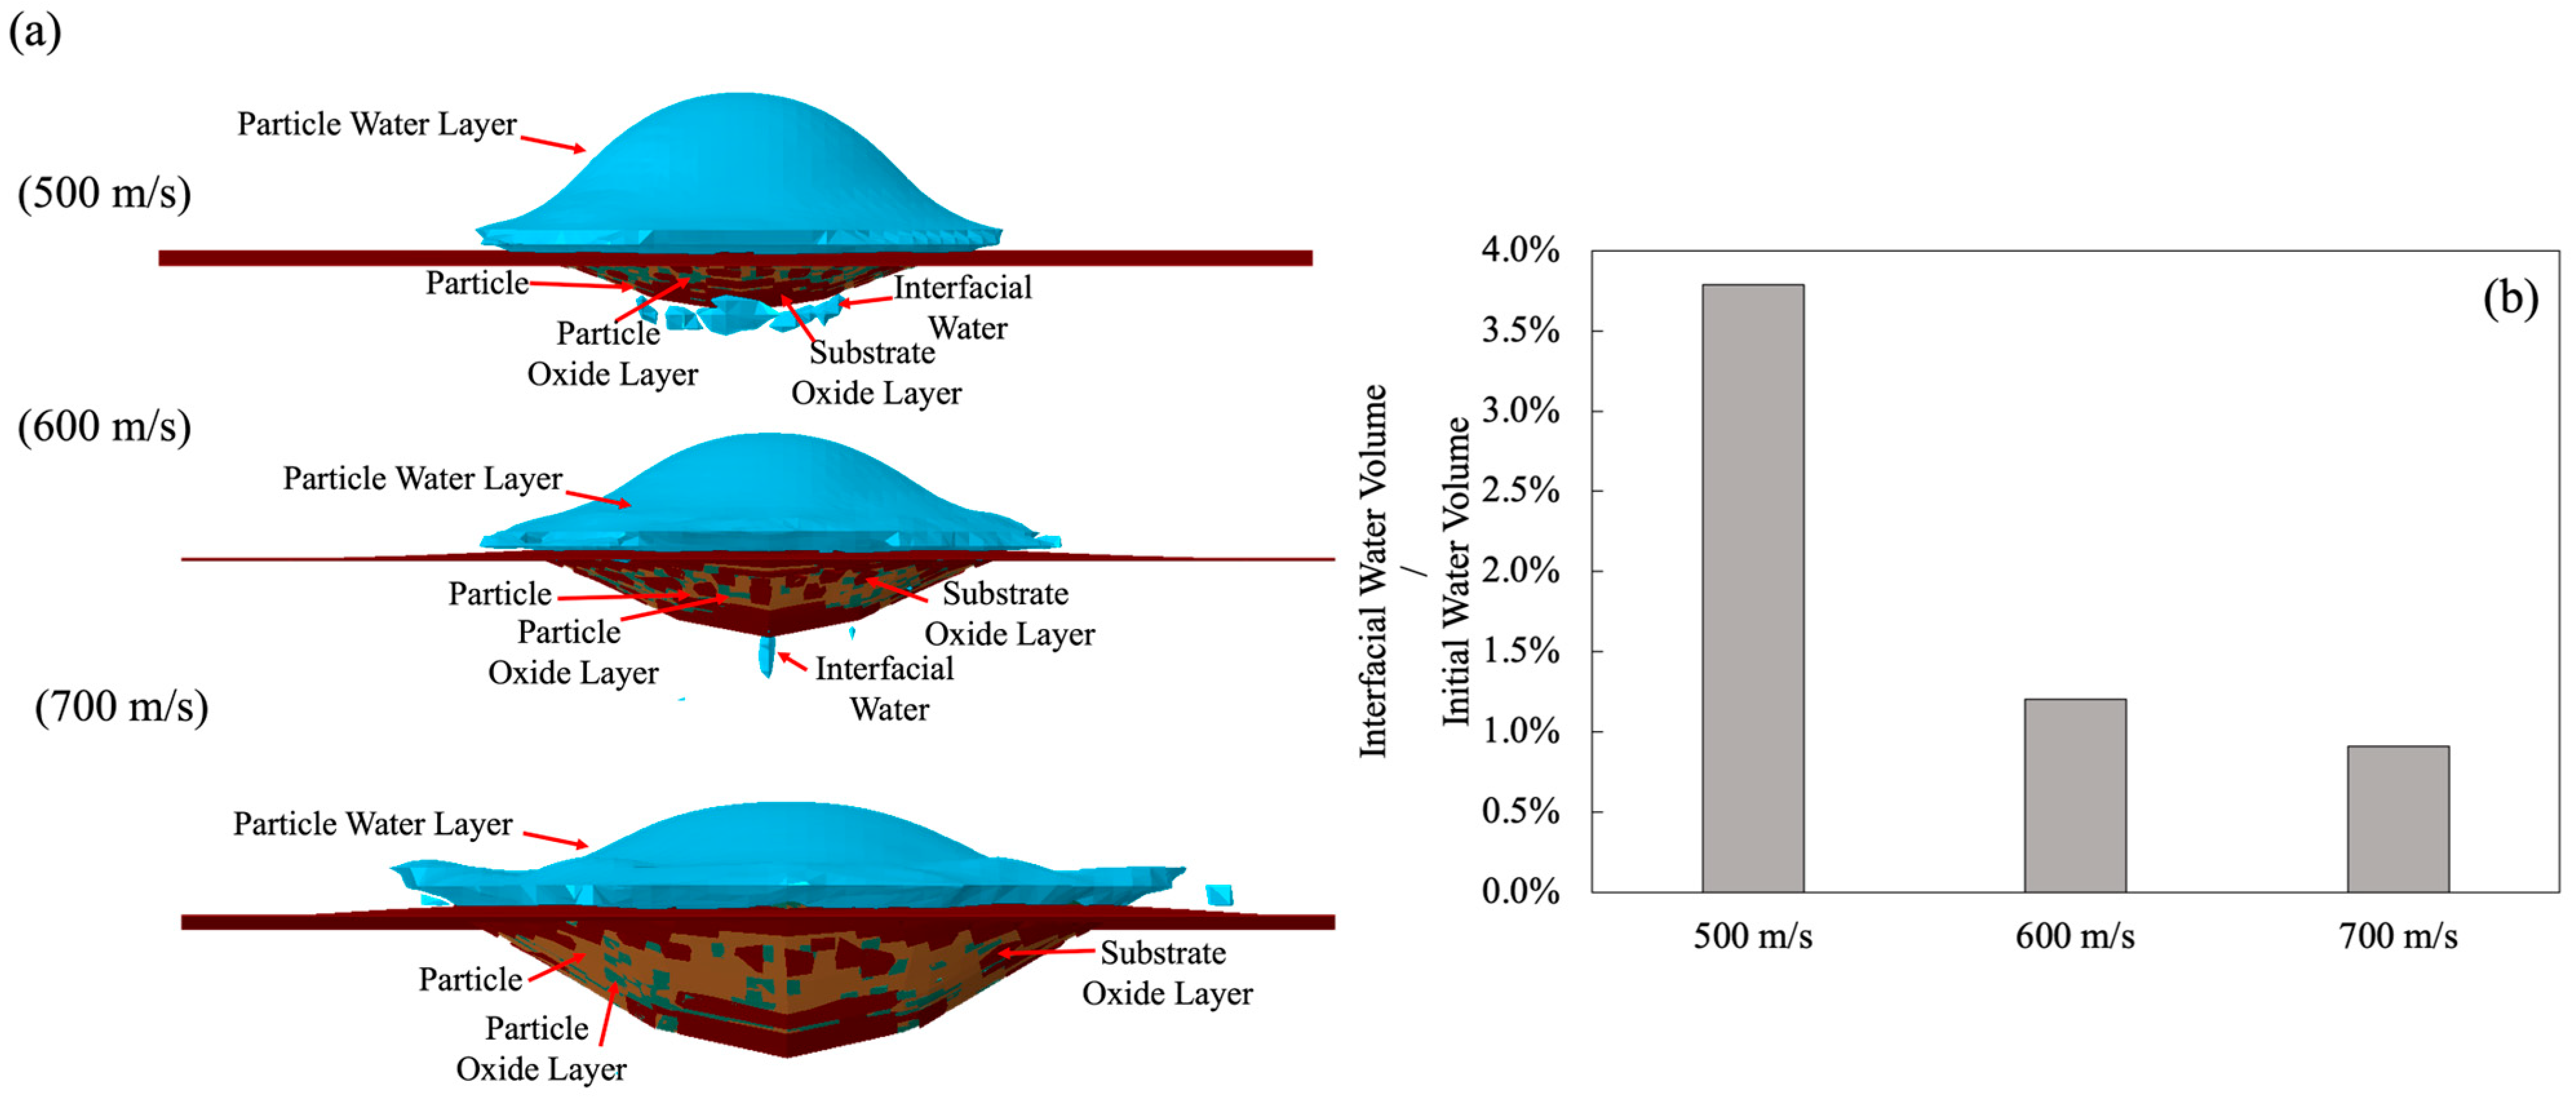
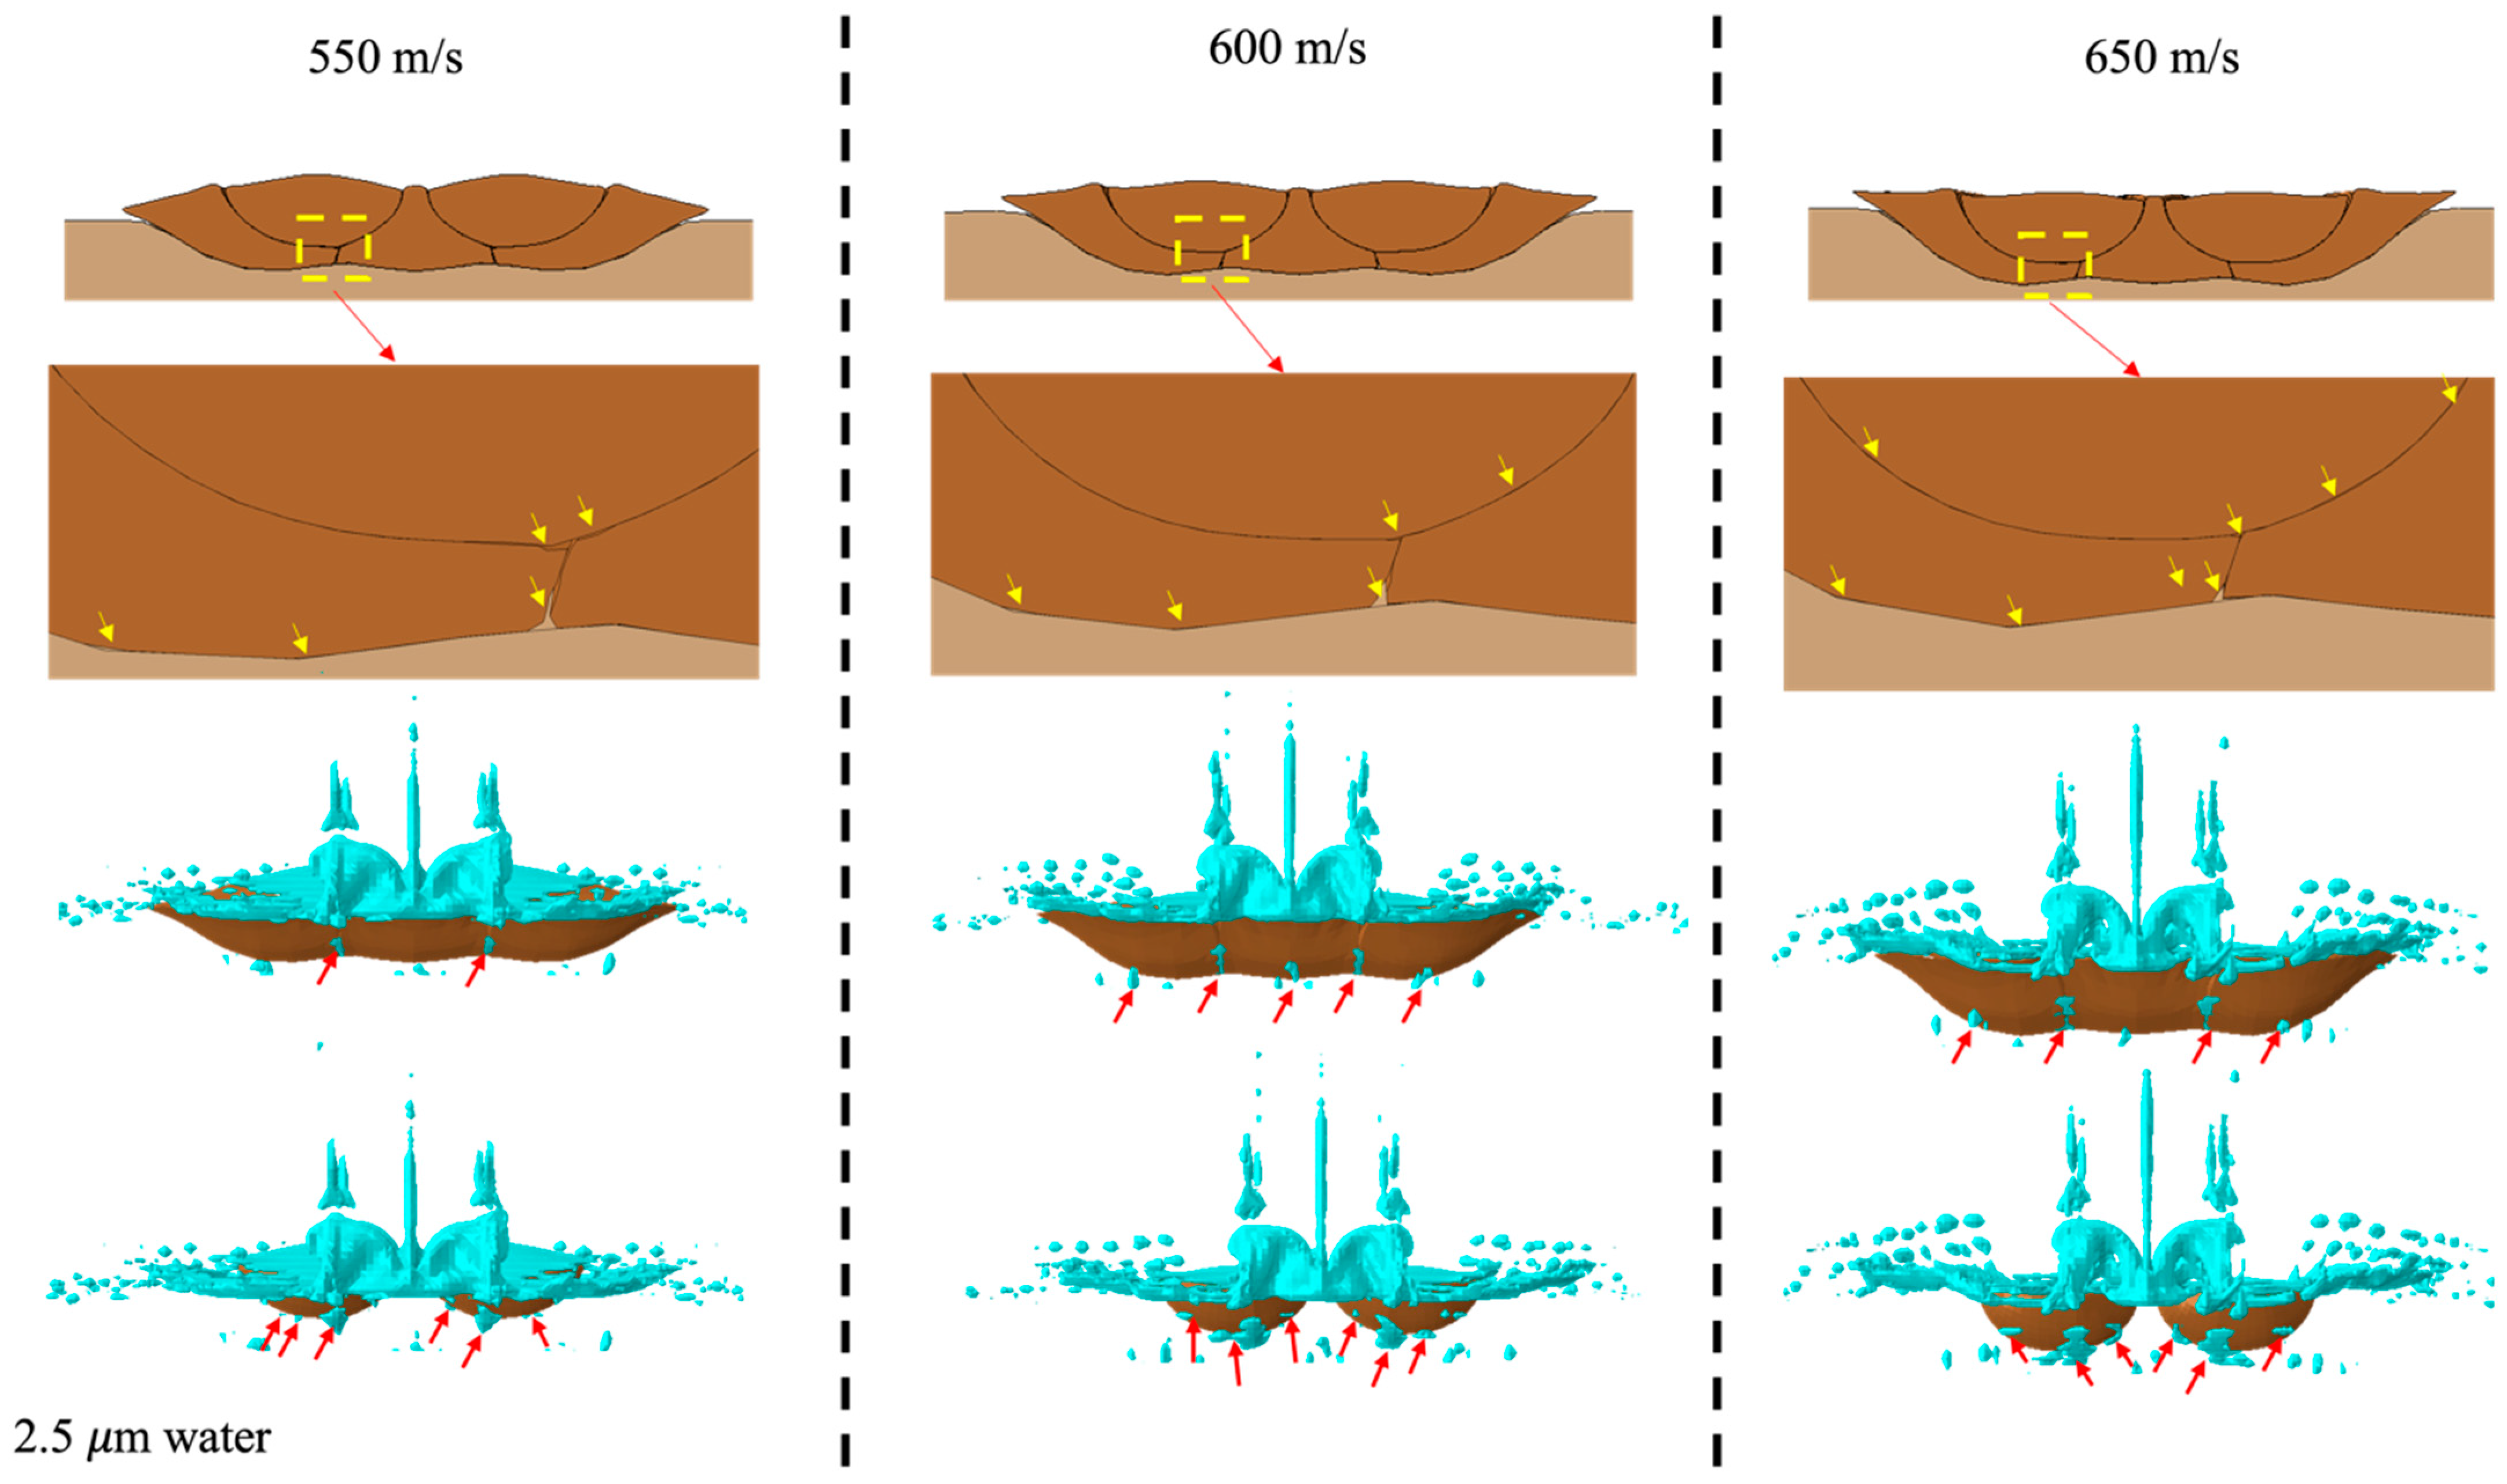
3.2.2. Particle Velocity Effect

The first attempted method to reduce the interfacial and interparticle water is to increase the particle velocity. This has the potential to increase the kinetic energy of the particle, which increases its deformation [30,31]. In this section, five 20 µm copper particles surrounded by 2.5 µm of water were impacted onto a copper substrate at 550, 600, and 650 m/s (Figure 13). As shown in Figure 13, all three conditions resulted in a dense structure; however, interparticle pores were found in all three samples, indicated by yellow arrows. The width of the deposited film increased by about 10.5% with an increase in particle velocity from 550 m/s to 650 m/s (Figure 14a), and the average thickness decreased slightly by the same increase in particle velocity (Figure 13 and Figure 14a).
Examining the interface of the particle and the substrate illustrates the existence of interfacial water, as indicated by the yellow arrows in Figure 13. By eliminating the top two particles from the pictures, interparticle water trapped between deposited particles can also be found. To be more accurate, using the method described in the literature [25], it can be found that by increasing the particle velocity from 550 m/s to 650 m/s, the ratio of trapped water in both interfacial and interparticle form to the total initial volume of water decreases by almost 20% (Figure 14b). This is because by increasing particle velocity, more kinetic energy is provided to pass and disperse the same thickness of water film.

3.2.3. Particle Velocity Effect

The other parameter that has been shown to affect particle deformation and the volume of interfacial water is the thickness of the water film wetting the particle [31]. In this section, it is assumed that five 20 µm copper particles have been deposited at the velocity of 600 m/s toward a copper substrate. The water film wetting these particles has been assumed to be 1.5, 2, and 2.5 µm. Figure 15 and Figure 16a show that the size and the shape of deposited coatings are almost identical. This means that by increasing the water film thickness from 1.5 to 2.5 µm, particles have been deformed similarly, and the thickness and the width of the coatings have not changed. Figure 15 demonstrates the interparticle porosity. In all three cases, interparticle pores and porosity between the deposited particles and substrate can be found and are shown by yellow arrows.
By examining the interfacial and interparticle water, we can see (Figure 15) that the volume of trapped water increases as the initial water films become thicker. To be more precise, using the technique mentioned in the literature [25], by increasing the water film thickness from 1.5 to 2.5 µm, the ratio of trapped water in both interfacial and interparticle form to the total initial volume of water increases by almost 28% (Figure 16b). This is because the same kinetic energy must pass through thicker water, and it would be more difficult for it to disperse. Thus, more water would be trapped within the deposited coating.

4. Conclusions

Despite the promising results obtained with the LCS approach, there may be some concerns about the effect of wetting on the bond between the particle and the substrate. The purpose of this paper was to investigate the effect of particle or substrate wetting on the failure of the oxide layer that results in bonding, using finite element analysis. Furthermore, this paper applied the CEL method to investigate the use of water as a propellant in the formation of porosity and the detection of traces of water in coatings fabricated using LCS.
When a wet particle strikes a wet substrate, the kinetic energy of the particle is reduced because the particle must pass through a film of water, resulting in less particle and substrate deformation. Therefore, the oxide layer on the particle and/or substrate would be less likely to fail, reducing the possibility of metallurgical bonding. In addition, wetting the particle would result in the presence of interfacial water at the location of the failed oxide layers, thus preventing the formation of metallurgical bonds between the two metal surfaces. By increasing the impact velocity, the area of the failed oxide layer can be increased, and the volume of interfacial water can be reduced.
Numerical analysis shows that using water as a propellant would increase the thickness of as-sprayed coatings and the size of porosities due to less deformation of the particles. During the time the deposited particles are wet, water would be trapped both between the particles and between the particles and the substrate. FEM is not able to propose a mechanism for such work, while using experimental work or CFD modeling was beyond the objective of this paper. The results show that the coatings would be denser, and the volume of trapped water would be smaller, if the particles hit the substrate at a higher velocity and lower water film thickness.
In conclusion, the results obtained in this study will contribute to a better understanding of the effect of water on deposition in LCS, which is still in the early stages of development at the Concordia University research facility. CFD-based and experimental studies, which were beyond the scope of this paper, are needed for comparison with reported results and to optimize deposition by minimizing the presence of water, thereby producing denser coatings with higher adhesion strength while avoiding interfacial or interparticle trapped water.

Author Contributions

P.K.: methodology, software, validation, writing, draft preparation; A.A., D.M. and L.P.: supervision and review the manuscript draft; C.M. and A.D.: writing—review and editing, supervision, project administration, funding acquisition. All authors have read and agreed to the published version of the manuscript.

Funding

This research received no external funding.

Institutional Review Board Statement

Not applicable.

Informed Consent Statement

Not applicable.

Data Availability Statement

Data are contained within the article.

Acknowledgments

A special thanks goes to Polycontorls (Brossard, QC) and the Natural Sciences and Engineering Research Council of Canada (NSERC) for supporting this study. This project was funded by grant agency of NSERC via the program of Alliance Missions (Grant number: ALLRP 570560-2021).

Conflicts of Interest

The authors declare no conflicts of interest.

Abbreviations

The following abbreviations are used in this manuscript:
CSCold spray
LCSLiquid cold spray
CELCoupled Eulerian–Lagrangian
EoSEquation of state
CFDComputational fluid dynamics
PEEQEquivalent plastic strain
NSERCNatural Sciences and Engineering Research Council of Canada

Appendix A

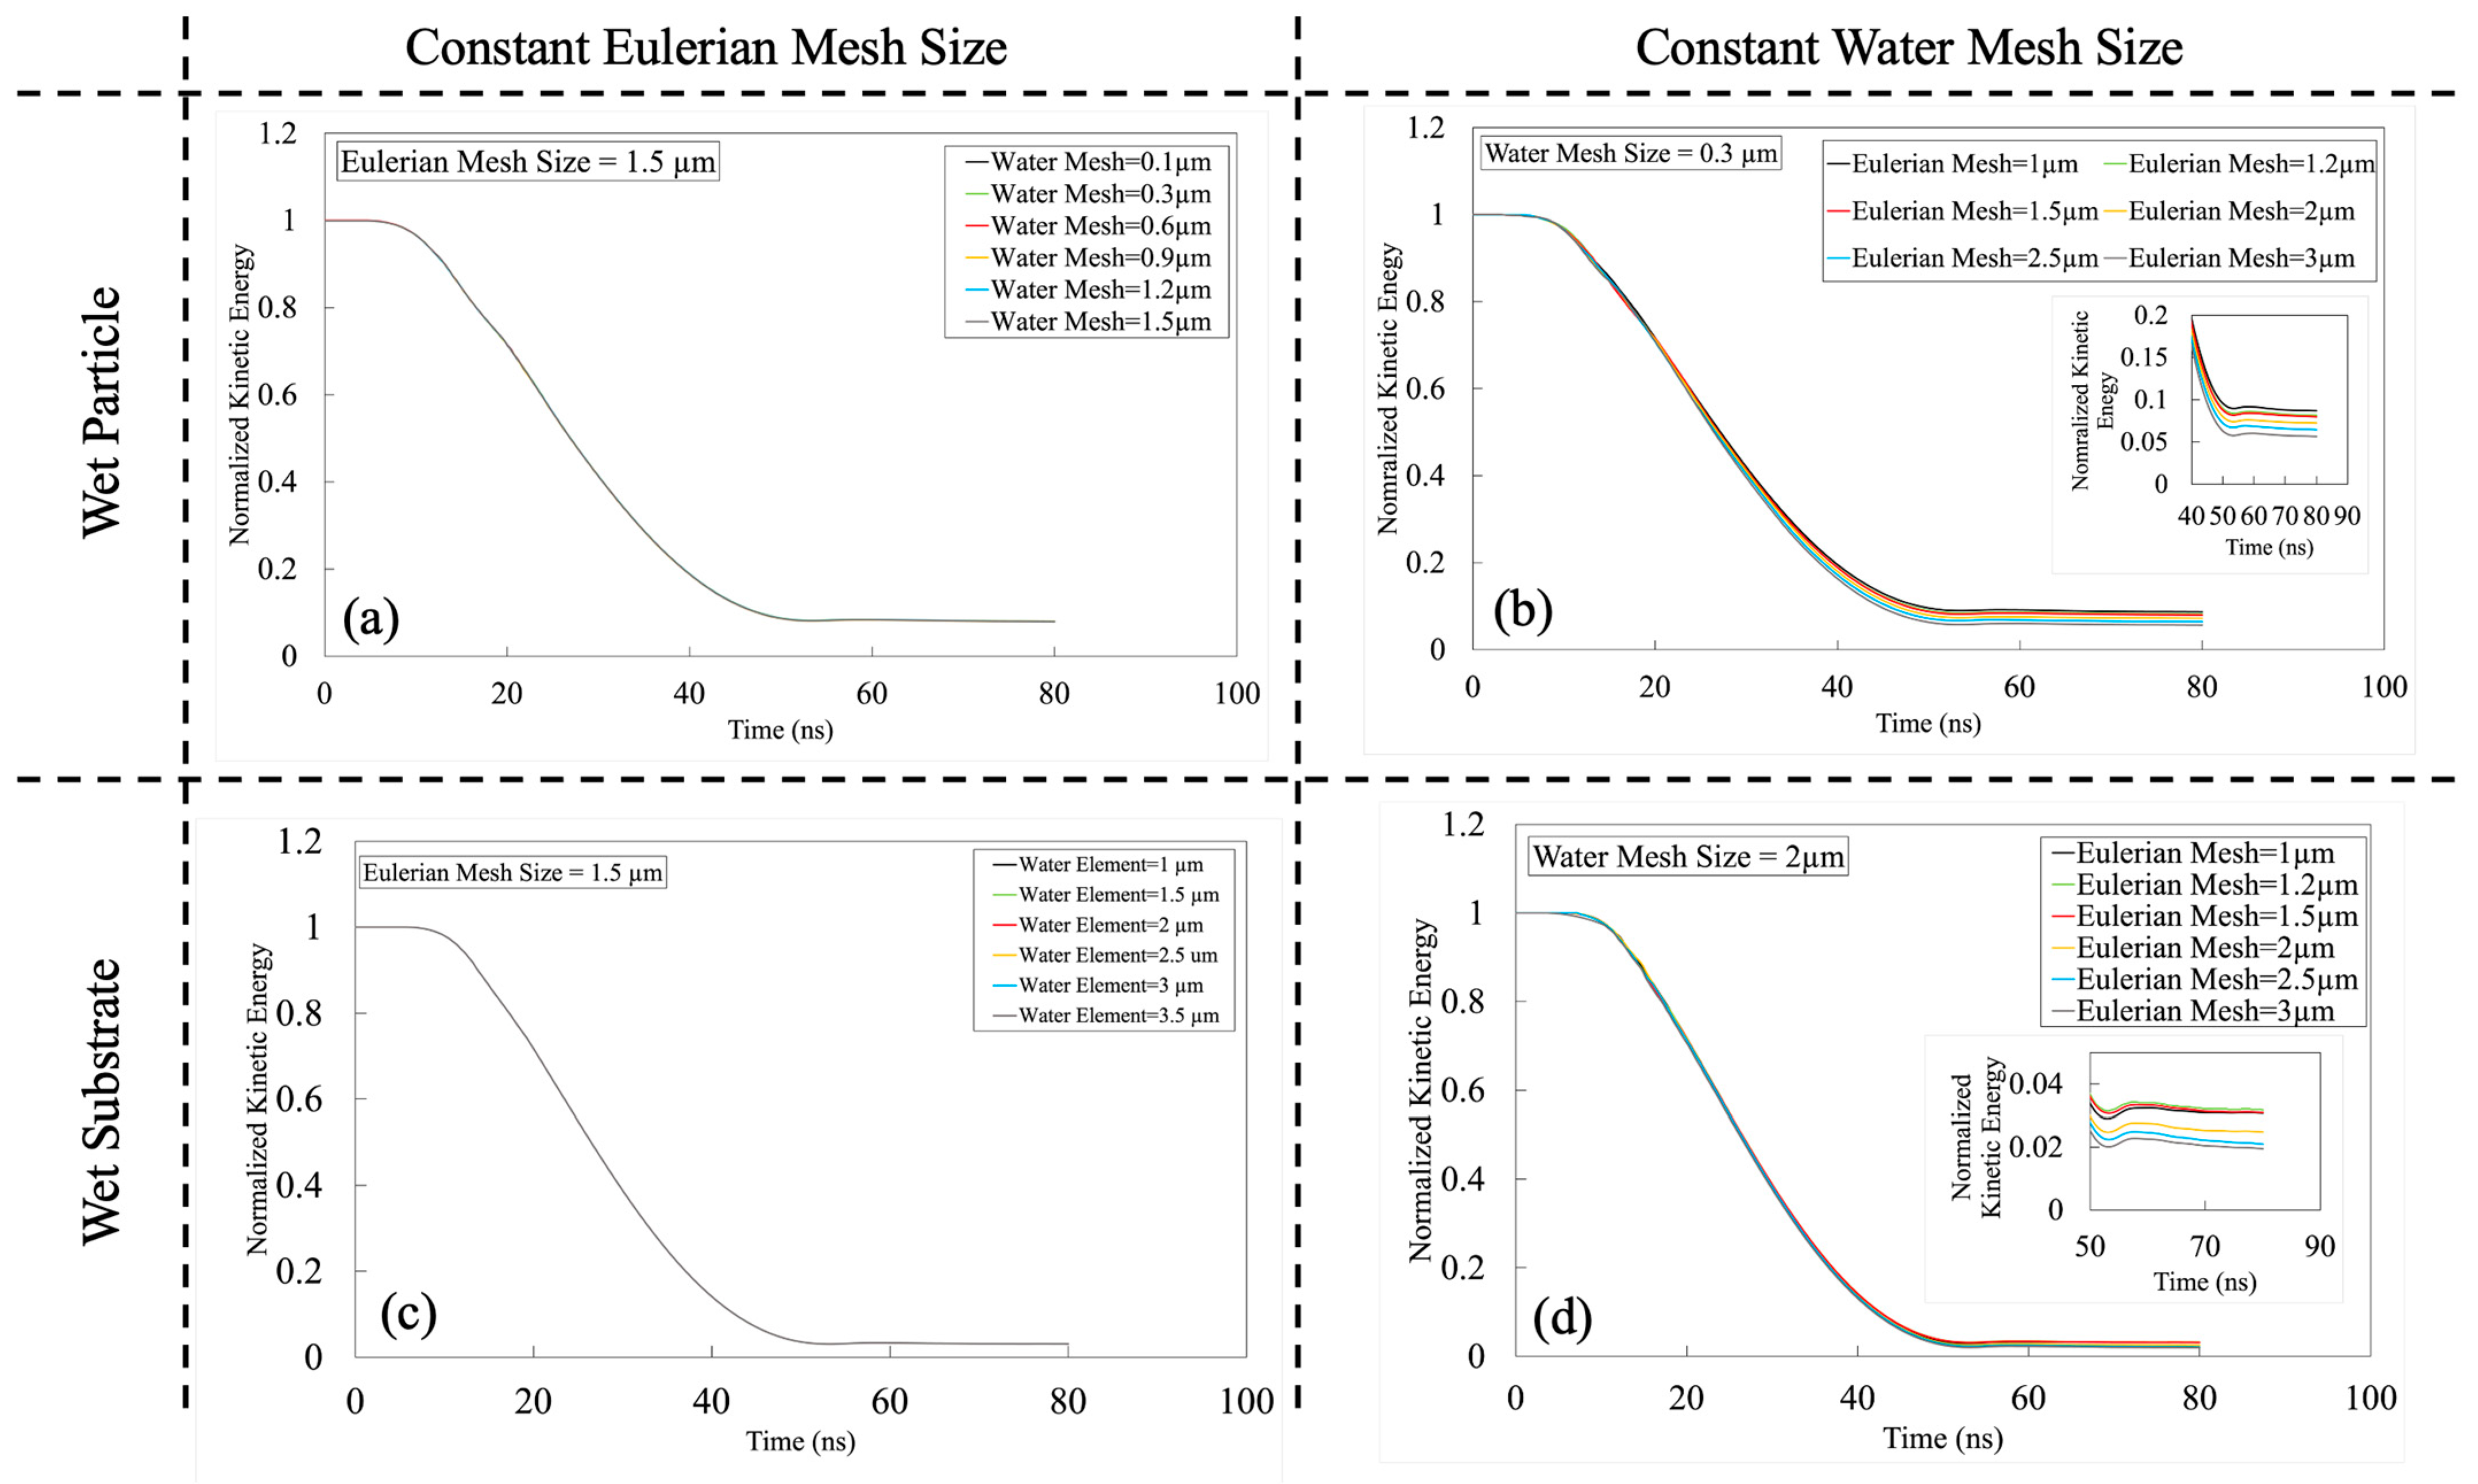
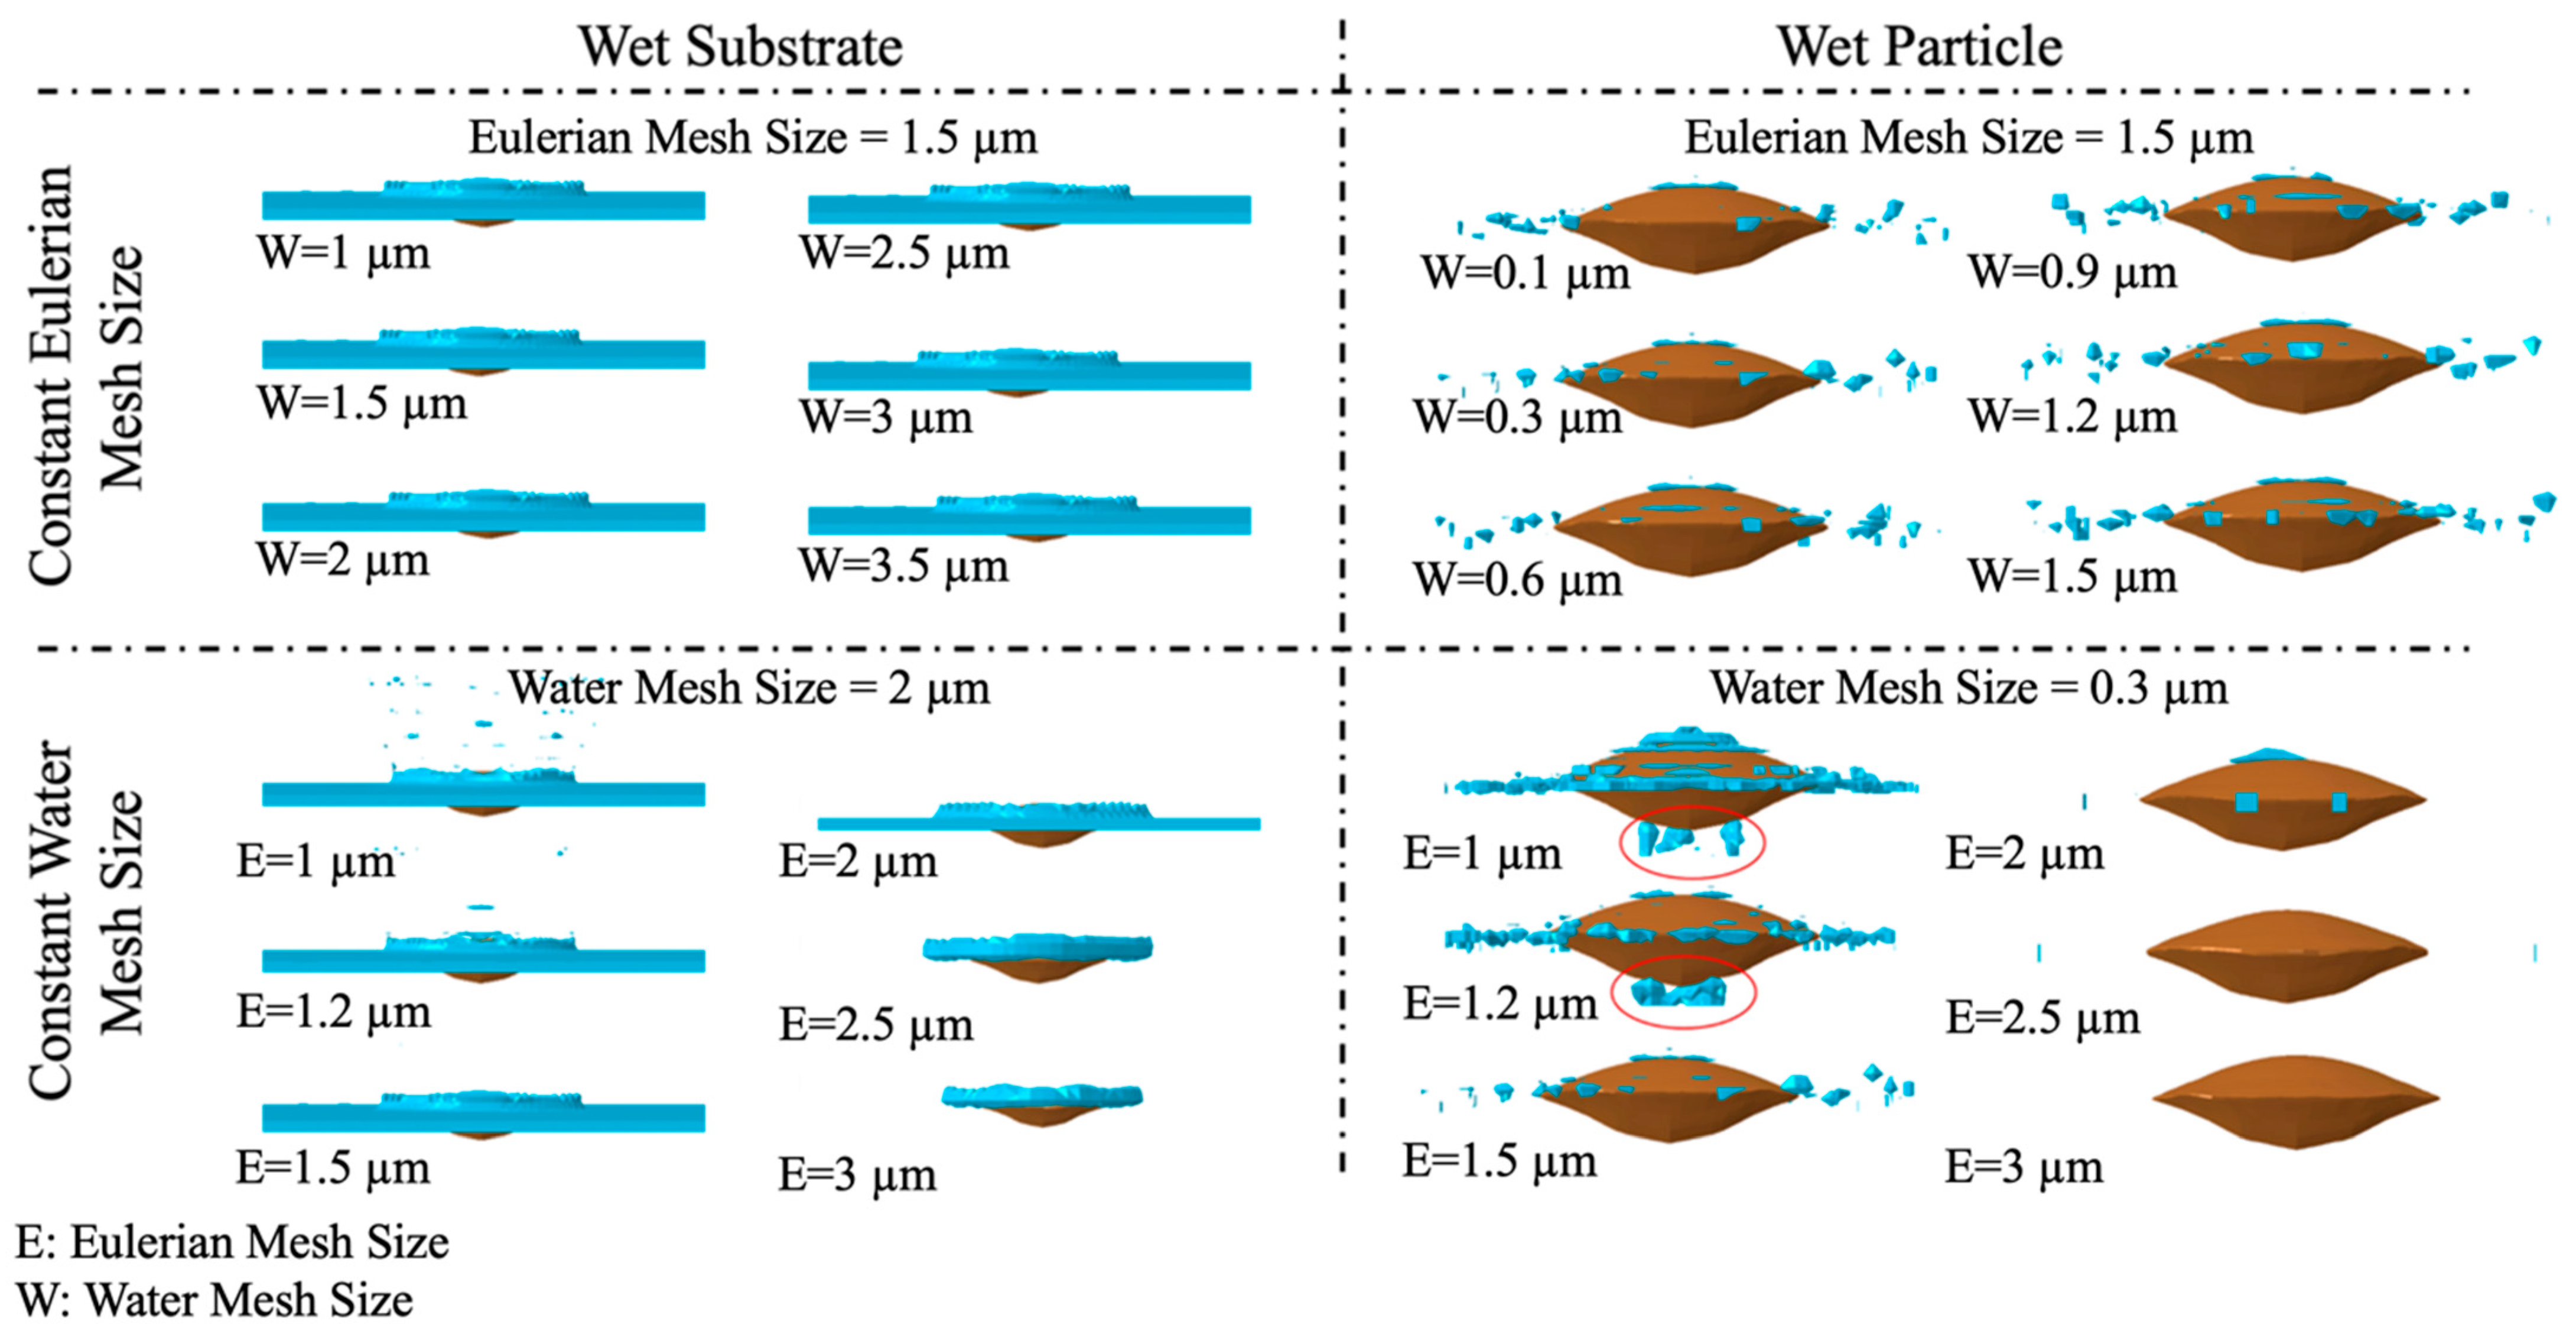
Appendix A.1. Methodology for Systematic Study of Mesh Size Effect

For the systematic study to obtain the best combination of element size for the water film and the Eulerian part, it is assumed that the thickness of the water film wetting the particle and the substrate is 2.5 µm and 2 µm, respectively, while the particle velocity is 500 m/s. This velocity is very close to the critical value reported in the literature for a 20 µm particle [10]. Since increasing particle velocity decreases the volume of interfacial water, the 500 m/s impact velocity was chosen to examine the effect of mesh size on observation of the interfacial water trapped between the particle and the substrate [31]. It is worth noting that computational fluid dynamics (CFD) modeling is required to accurately determine the water thickness, which is beyond the scope of this study, and all the water thickness dimensions are selected based on previous works [30,31]. Hence, the chosen values in this paper are selected such that the water effect can be captured, while the run time of the simulation is not so high that it becomes impossible to compute the simulation. The combination of element sizes used for this systematic study is shown in Table A1 below. It is necessary to clarify the terms used in this section. To define water film in a Eulerian part in ABAQUS, the “discrete field” method needs to be used. In this method, first a Lagrangian water film and a Eulerian part must be created and meshed, and then the Lagrangian water film must be assembled at its exact wanted location in the Eulerian part. In the next step, a discrete field is defined using these two notated parts. Finally, the material constant is applied to the defined discrete field. Thus, in this section, the water mesh size (W) will be referred to as the Lagrangian part and the Eulerian mesh size (EL) will be referred to as the Eulerian part [30,31,38].
Table A1. The conditions used to study the effects of the element size of the water film and the Eulerian part on the results.
Wet ParticleWet Substrate
Condition
Name
Eulerian Element
Size (µm)
Water Element
Size (µm)
Condition
Name
Eulerian Element
Size (µm)
Water Element
Size (µm)
Change in Water Element SizeEL15_W011.50.1EL15_W11.51
EL15_W031.50.3EL15_W151.51.5
EL15_W061.50.6EL15_W21.52
EL15_W091.50.9EL15_W251.52.5
EL15_W121.51.2EL15_W31.53
EL15_W151.51.5EL15_W351.53.5
Change in Water Element SizeEL1_W0310.3EL1_W212
EL12_W031.20.3EL12_W21.22
EL15_W031.50.3EL15_W21.52
EL2_W0320.3EL2_W222
EL25_W032.50.3EL25_W22.52
EL3_W0330.3EL3_W232

Appendix A.2. Results and Discussion of Systematic Analysis of Element Size

First, it is necessary to ensure that the most accurate combination of element sizes for the water film and the Eulerian part has been selected. For this purpose, it is assumed that the mesh size of the water film changes while the Eulerian mesh size remains constant. Then it is assumed that the mesh size of the water film is constant while the mesh size of the Eulerian part changes. Under the conditions given in Table A1 above, when either the particle or the substrate is wetted by the water and the Eulerian mesh size is constant, the run time is almost constant, with a negligible variation (Figure A1a,c). However, when the water mesh size is constant and the Eulerian mesh size increases, the run time decreases significantly for the time in which the water wets the substrate (Figure A1b) or the particle (Figure A1d). This shows that the run time depends only on the mesh size of the Eulerian part.
Figure A1. The normalized CPU time when the particle is wet and (a) the Eulerian mesh size is constant and (b) the water mesh is constant; and when the substrate is wet and (c) the Eulerian mesh size is constant and (d) the water mesh is constant.
Coatings 15 00405 g0a1
It has been shown above that water wetting of the particle or substrate reduces particle deformation, because a portion of the kinetic energy must be expended to move the particle through the water. Figure A2 below examines the effect of mesh size on the changes in kinetic energy with time. This figure shows that the change in kinetic energy with time is independent from the mesh size of the water (Figure A2a,c). However, when the mesh size of the Eulerian part is the one that changes, the kinetic energy does not show the same trend, as one can see in Figure A2b,d. To be more precise, the higher the mesh size of the Eulerian part, the higher the loss of kinetic energy. It is worth noting that for some conditions, the Eulerian mesh size is 3 μm, while the water film thickness wetting either particle or substrate is less than 3 μm. This means that during assignment of materials to the Eulerian part, less than one element is filled with water.
Figure A2. The normalized kinetic energy when the particle is wet and (a) the Eulerian mesh size is constant and (b) the water mesh is constant; and when the substrate is wet and (c) the Eulerian mesh size is constant and (d) the water mesh is constant.
Coatings 15 00405 g0a2
Figure A3 and Figure A4 examine the changes in equivalent plastic strain (PEEQ) for the particle and substrate, respectively. When either the particle or substrate is wet, Figure A3 and Figure A4 show that the particle equivalent plastic strain is constant as long as the mesh size of the Eulerian part is constant. However, when the mesh size of the Eulerian part is increased, the particle plastic strain changes without a specific trend. Substrate plastic strain remains almost unchanged with the change in either Eulerian or water mesh size when either the particle or substrate is wet.
Figure A3. The change in plastic strain of the particle when the particle is wet and (a) the Eulerian mesh size is constant and (b) the water mesh is constant; and when the substrate is wet and (c) the Eulerian mesh size is constant and (d) the water mesh is constant.
Coatings 15 00405 g0a3
Figure A4. The change in plastic strain of the substrate when the particle is wet and (a) the Eulerian mesh size is constant and (b) the water mesh is constant; and when the substrate is wet and (c) the Eulerian mesh size is constant and (d) the water mesh is constant.
Coatings 15 00405 g0a4
To examine the effect of mesh size on particle deformation in more detail, it is necessary to examine the deformed shape (Figure A5). Since the particle deformation is constant, by changing either the Eulerian or water mesh size, instead of using 24 pictures, only one deformed shape per category is presented, and the final height and width are obtainable by taking the average and standard deviation of all six conditions of each category. In all cases, the size of the deformed particle is similar regardless of the mesh size. The only remaining effect to examine is that of mesh size on water behavior. Figure A6 shows that when the substrate is wet, regardless of the mesh size, the water would disperse, and no water would be trapped between the particle and the substrate. When the Eulerian mesh size is constant, the water behavior results are similar. However, by increasing the Eulerian mesh size, the accuracy of predicting the water volume decreases significantly. Figure A6 also examines the effect of the mesh size of the water wetting the particle on the water behavior during the impact. It shows that the water behaves similarly when the Eulerian mesh size is constant and the mesh size of the water changes. However, more accuracy can be obtained by using a finer mesh size for the Eulerian part. When the mesh size of the Eulerian part is finer, it is also possible to capture the interfacial water trapped between the particle and the substrate, shown with red-dashed circles. That the water appears not to be attached to the particle is due to the error that ABAQUS made in visualization on the Eulerian part; however, it is expected that the water is trapped in the interface of the particle and the substrate.
Figure A5. Effect of mesh size on deformed particle shape and size after 80 ns of impact when the particle is wet and (a) the Eulerian mesh size is constant and (b) the water mesh is constant; and when the substrate is wet and (c) the Eulerian mesh size is constant and (d) the water mesh is constant.
Coatings 15 00405 g0a5
Figure A6. Effect of mesh size on water distribution after 80 ns of impact.
Coatings 15 00405 g0a6
Using the method described in the literature [19], it was found that the ratio of the volume of captured water to the initial volume of water wetting the particle decreases significantly with increasing Eulerian mesh size (Figure A7b), while it is almost independent of the water layer mesh size (Figure A7a). This proves that the water behavior is highly dependent only on the Eulerian mesh size, which means that the smaller the mesh size, the higher the accuracy of studying the water behavior during the impact. Therefore, for the rest of the paper, it is assumed that the Eulerian mesh size is 1 μm, the substrate water mesh size is 2 μm, and the particle water mesh size is 0.3 μm.
Figure A7. The ratio of the volume of trapped water to the initial volume of water when the particle is wet and the (a) Eulerian and (b) water mesh sizes are constant.
Coatings 15 00405 g0a7

References

  1. Yan, X.; Huang, C.; Chen, C.; Bolot, R.; Dembinski, L.; Huang, R.; Ma, W.; Liao, H.; Liu, M. Additive Manufacturing of WC Reinforced Maraging Steel 300 Composites by Cold Spray and Selective Laser Melting. Surf. Coat. Technol. 2019, 371, 161–171. [Google Scholar] [CrossRef]
  2. Khodabakhshi, F.; Marzbanrad, B.; Jahed, H.; Gerlich, A.P. Interfacial Bonding Mechanisms between Aluminum and Titanium during Cold Gas Spraying Followed by Friction-Stir Modification. Appl. Surf. Sci. 2018, 462, 739–752. [Google Scholar] [CrossRef]
  3. Goldbaum, D.; Shockley, J.M.; Chromik, R.R.; Rezaeian, A.; Yue, S.; Legoux, J.; Irissou, E. The Effect of Deposition Conditions on Adhesion Strength of Ti and Ti6Al4V Cold Spray Splats. J. Therm. Spray Technol. 2012, 21, 288–303. [Google Scholar] [CrossRef]
  4. Bagherifard, S.; Monti, S.; Zuccoli, M.V.; Riccio, M.; Kondas, J.; Guagliano, M. Cold Spray Deposition for Additive Manufacturing of Freeform Structural Components Compared to Selective Laser Melting. Mater. Sci. Eng. A 2018, 721, 339–350. [Google Scholar] [CrossRef]
  5. Chen, C.; Xie, Y.; Yan, X.; Yin, S.; Fukanuma, H.; Huang, R.; Zhao, R.; Wang, J.; Ren, Z.; Liu, M.; et al. Effect of Hot Isostatic Pressing (HIP) on Microstructure and Mechanical Properties of Ti6Al4V Alloy Fabricated by Cold Spray Additive Manufacturing. Addit. Manuf. 2019, 27, 595–605. [Google Scholar] [CrossRef]
  6. Fauchais, P.L.; Heberlein, J.V.R.; Boulos, M.I. Thermal Spray Fundamentals from Powder to Parts, 1st ed.; Springer: Berlin/Heidelberg, Germany, 2015. [Google Scholar] [CrossRef]
  7. Rahmati, S.; Jodoin, B. Physically Based Finite Element Modeling Method to Predict Metallic Bonding in Cold Spray. J. Therm. Spray Technol. 2020, 29, 611–629. [Google Scholar] [CrossRef]
  8. Xie, Y.; Yin, S.; Chen, C.; Planche, M.; Liao, H.; Lupoi, R. New Insights into the Coating/Substrate Interfacial Bonding Mechanism in Cold Spray. Scr. Mater. 2016, 125, 1–4. [Google Scholar] [CrossRef]
  9. Li, W.; Liao, H.; Li, C.; Bang, H.; Coddet, C. Numerical Simulation of Deformation Behavior of Al Particles Impacting on Al Substrate and Effect of Substrate Oxide Films on Interfacial Bonding in Cold Spraying. Appl. Surf. Sci. 2007, 253, 5084–5091. [Google Scholar] [CrossRef]
  10. Schmidt, T.; Gartner, F.; Assadi, H.; Kreye, H. Development of a Generalized Parameter Window for Cold Spray Deposition. Acta Mater. 2006, 54, 729–742. [Google Scholar] [CrossRef]
  11. Hassani-Gangaraj, M.; Veysset, D.; Champagne, V.K.; Nelson, K.A.; Schuh, C.A. Adiabatic Shear Instability is not Necessary for Adhesion in Cold Spray. Acta Mater. 2018, 158, 430–439. [Google Scholar] [CrossRef]
  12. Huang, R.; Ma, W.; Fukanuma, H. Development of Ultra-Strong Adhesive Strength Coatings Using Cold Spray. Surf. Coat. Technol. 2014, 258, 832–841. [Google Scholar] [CrossRef]
  13. Tiamiyu, A.A.; Chen, X.; Pang, E.L.; Sun, Y.; Lienhard, J.; LeBeau, J.M.; Nelson, K.A.; Schuh, C.A. Oxide Layer Delamination: An Energy Dissipation Mechanism During High-Velocity Microparticle Impacts. Appl. Surf. Sci. 2022, 574, 151673. [Google Scholar] [CrossRef]
  14. Xie, Y.; Planche, M.; Raoelison, R.; Liao, H.; Suo, X.; Herve, P. Effect of Substrate Preheating on Adhesive Strength of SS 316L Cold Spray Coatings. J. Therm. Spray Technol. 2016, 25, 123–130. [Google Scholar] [CrossRef]
  15. Almeida, C.M.; Prioli, R.; Ponce, F.A. Effect of native oxide mechanical deformation on InP nanoindentation. J. Appl. Phys. 2008, 104, 113509. [Google Scholar] [CrossRef]
  16. Zhang, C.; Kalia, R.K.; Nakano, A.; Vashishta, P.; Branicio, P.S. Deformation mechanisms and damage in α-alumina under hypervelocity impact loading. J. Appl. Phys. 2008, 103, 083508. [Google Scholar] [CrossRef]
  17. Khoei, A.R.; Khorrami, M.S. Mechanical properties of graphene oxide: A molecular dynamics study. Fuller. Nanotub. Carbon Nanostructures 2016, 24, 594–603. [Google Scholar] [CrossRef]
  18. Rahmati, S.; Veiga, R.G.A.; Zuniga, A.; Jodoin, B. A Numerical Approach to Study the Oxide Layer Effect on Adhesion in Cold Spray. J. Therm. Spray Technol. 2021, 30, 1777–1791. [Google Scholar] [CrossRef]
  19. Khamsepour, P.; Moreau, C.; Dolatabadi, A. Effect of Particle and Substrate Pre-Heating on the Oxide Layer and Material Jet Formation in Solid-state Spray Deposition: A Numerical Study. J. Therm. Spray Technol. 2023, 32, 1153–1166. [Google Scholar] [CrossRef]
  20. Ren, B.; Song, J. Effect of Particle Oxidation, Size and Material on Deformation, Bonding and Deposition During Cold Spray: A Peridynamic Investigation. arXiv 2024, arXiv:2403.01311. [Google Scholar] [CrossRef]
  21. Zhang, Z.; Liu, Z.; Wang, B.; Cai, Y. Effect of Plastic Deformation of Particle and Substrate on Metallurgical Bonding During Cold Spray. Mater. Lett. 2024, 373, 137157. [Google Scholar] [CrossRef]
  22. Vandadi, M.; Bond, T.; Asumadu, T.K.; Klenam, D.; Rahbar, N.; Soboyejo, W. Effect of Nanoscale Surface Oxide Layer on the Cold Spray of Commercially Pure Titanium and Ti-6Al-4V Powders. Comput. Mater. Sci. 2025, 246, 113454. [Google Scholar] [CrossRef]
  23. Ren, B.; Song, J. Peridynamics Simulation of Microparticle Impact: Deformation, Jetting, and the Influence of Surface Oxide Layer. Surf. Coat. Technol. 2024, 493, 131257. [Google Scholar] [CrossRef]
  24. Xie, J.; Nelias, D.; Berre, H.W.; Ogawa, K.; Ichikawa, Y. Simulation of the Cold Spray Particle Deposition Process. J. Tribol. 2015, 137, 041101. [Google Scholar] [CrossRef]
  25. Khamsepour, P.; Moreau, C.; Dolatabadi, A. Numerical Simulation of the Effect of Particle and Substrate Pre-Heating on Porosity Level and Residual Stress of As-Sprayed Ti6Al4V Components. J. Therm. Spray Technol. 2021, 31, 70–83. [Google Scholar] [CrossRef]
  26. Khamsepour, P.; Oberste-Berghaus, J.; Aghasibeig, M.; Moreau, C.; Dolatabadi, A. The Effect of Spraying Parameters of the Inner-Diameter High-Velocity Air–Fuel (ID-HVAF) Torch on Characteristics of Ti-6Al-4V In-Flight Particles and Coatings Formed at Short Spraying Distances. J. Therm. Spray Technol. 2023, 32, 568–585. [Google Scholar] [CrossRef]
  27. Oberste-Berghaus, J.; Aghasibeig, M.; Burgess, A.; Khamsepour, P.; Moreau, C.; Dolatabadi, A. Exploring Miniaturized HVOF Systems for the Deposition of Ti-6Al-4V. J. Therm. Spray Technol. 2023, 32, 760–772. [Google Scholar] [CrossRef]
  28. Xie, J. Simulation of Cold Spray Particle Deposition Process. Ph.D. Thesis, L’institut National des Sciences Appliquées de Lyon, Villeurbanne, France, 2014. [Google Scholar]
  29. Suhonen, T.; Varis, T.; Torrell, S.M.; Guilemany, J.M. Residual Stress Development in Cold Sprayed Al, Cu, and Ti Coatings. Acta Mater. 2013, 61, 6329–6337. [Google Scholar] [CrossRef]
  30. Khamsepour, P.; Akbarnozari, A.; Garmeh, S.; Moreau, C.; Dolatabadi, A. The Effect of Water Layer Covering Substrate Surface on the Deformation of the Impacting Particle Deposited by Liquid Cold Spray. In Proceedings of the Canadian Society for Mechanical Engineering International Congress, Edmonton, AB, Canada, 5–8 June 2022. [Google Scholar] [CrossRef]
  31. Khamsepour, P.; Akbarnozari, A.; Garmeh, S.; Moreau, C.; Dolatabadi, A. The Effect of Water Film Surrounding the Deposited Particle on Bonding Area: A Numerical Study. J. Therm. Spray Technol. 2023, 32, p877–p892. [Google Scholar] [CrossRef]
  32. Butler, T. Liquid Accelerated Cold Spray; Cold Spray Action Team (CSAT): Worcester, MA, USA, 2011. [Google Scholar]
  33. Butler, T. Liquid Accelerated Cold Spray; Cold Spray Action Team (CSAT): Worcester, MA, USA, 2012. [Google Scholar]
  34. Akbarnozari, A.; Garmeh, S.; Attouil, F.B.; Dolatabadi, A.; Desaulniers, S.; Pouliot, L.; Moreau, C. Recent Advance in Liquid Cold Spray (LCS). In Proceedings of the North American Cold Spray Conference 2022, New Orleans, LA, USA, 13–14 September 2022. [Google Scholar]
  35. Liu, Y.; Li, C.X.; Huang, X.F.; Ma, K.; Luo, X.T.; Li, C.J. Effect of Water Environment on Particle Deposition of Underwater Cold Spray. Appl. Surf. Sci. 2020, 506, 144542. [Google Scholar] [CrossRef]
  36. Meng, Y.; Saito, H.; Bernard, C.; Ichikawa, Y.; Ogawa, K. Parametric Study to Repair Leaks in Water Pipe Using the Low-Pressure Cold Spray Technique. J. Therm. Spray Technol. 2022, 31, 2560–2576. [Google Scholar] [CrossRef]
  37. Rahmati, S.; Ghaei, A. The Use of Particle/Substrate Material Models in Simulation of Cold-Gas Dynamic-Spray Process. J. Therm. Spray Technol. 2014, 23, 530–540. [Google Scholar] [CrossRef]
  38. Dassault Systemes. ABAQUS Analysis User’s Manuel, 6.11 ed.; Simulia: Providence, RI, USA, 2011. [Google Scholar]
  39. Wang, X.; Shi, J. Validation of Johnson-Cook Plasticity and Damage Model Using Impact Experiment. Int. J. Impact Eng. 2013, 60, 67–75. [Google Scholar] [CrossRef]
  40. Banerjee, A.; Dhar, S.; Acharyya, S.; Datta, D.; Nayak, N. Determination of Johnson Cook Material and Failure Model Constants and Numerical Modelling of Charpy Impact Test of Armour Steel. Mater. Sci. Eng. A 2015, 640, 200–209. [Google Scholar] [CrossRef]
  41. Pereira, L.M.; Rahmati, S.; Zuniga, A.; Jodoin, B.; Veiga, R.G.A. Atomistic Study of Metallurgical Bonding upon the High Velocity Impact of Fcc Core-Shell Particles. Comput. Mater. Sci. 2021, 186, 110045. [Google Scholar] [CrossRef]
  42. Nishimura, K.; Kalia, R.K.; Nakano, A.; Vashishta, P. Nanoindentation hardness anisotropy of alumina crystal: A molecular dynamics study. Appl. Phys. Lett. 2008, 92, 161904. [Google Scholar] [CrossRef]
  43. Cai, M.B.; Li, X.P.; Rahman, M. Study of the temperature and stress in nanoscale ductile mode cutting of silicon using molecular dynamics simulation. J. Mater. Process. Technol. 2007, 192, 607–612. [Google Scholar] [CrossRef]
  44. Bubar, S.F.; Vermilyea, D.A. Deformation of anodic oxide films. J. Electrochem. Soc. 1966, 113, 892. [Google Scholar] [CrossRef]
  45. Propp, M.; Young, L. Adhesion, Ductility, and Fracture of Anodic Oxide Films on Tantalum. J. Electrochem. Soc. 1979, 126, 624. [Google Scholar] [CrossRef]
  46. Assadi, H.; Schmidt, T.; Richter, H.; Kliemann, J.-O.; Binder, K.; Gärtner, F.; Klassen, T.; Kreye, H. On Parameter Selection in Cold Spraying. J. Therm. Spray Technol. 2011, 20, 1161–1176. [Google Scholar] [CrossRef]
  47. Kim, K.; Li, W.; Guo, X. Detection of Oxygen at the Interface and Its Effect on Strain, Stress, and Temperature at the Interface between Cold Sprayed Aluminum and Steel Substrate. Appl. Surf. Sci. 2015, 357, 1720–1726. [Google Scholar] [CrossRef]
  48. JSchreiber, M.; Smid, I.; Eden, T.J.; Koudela, K.; Cote, D.; Champagne, V. Cold Spray Particle Impact Simulation Using the Preston-Tonks-Wallace Plasticity Model. Finite Elem. Anal. Des. 2021, 191, 103557. [Google Scholar] [CrossRef]
  49. MacDoland, D.; Fernandez, R.; Delloro, F.; Jodoin, B. Cold Spraying of Armstrong Process Titanium Powder for Additive Manufacturing. J. Therm. Spray Technol. 2017, 26, 598–609. [Google Scholar] [CrossRef]
Figure 1. (a) Schematic illustration of LCS and (b,c) a copper coating deposited with LCS [31].
Coatings 15 00405 g001
Figure 2. (a) Schematic stress–strain diagram of material with progressive damage reduction and (b) linear damage evolution in terms of plastic displacement [18,19,38].
Coatings 15 00405 g002
Figure 3. (a) The dimension used to study the effect of water film on oxide film failure. (b) The finite element setup of oxide films. (c) The initial condition used to study porosity formation.
Coatings 15 00405 g003
Figure 4. (a) The final deformed shape of the particles and (b) the failed oxide layer result from the impact of a 20 µm copper particle on a copper substrate at 700 m/s when both are covered with 80 nm oxide layers at a water thickness of 2 µm.
Coatings 15 00405 g004
Figure 5. The plastic strain distribution in the particle and substrate at different time steps when the impact velocity is 700 m/s and the particle water thickness is 2 μm.
Coatings 15 00405 g005
Figure 6. Oxide film failure and water distribution in the particle–substrate contact area after 50 ns of impact when (a) the substrate is wet and (b) the particle is wet.
Coatings 15 00405 g006
Figure 7. The final deformed shape of the particles and the failed oxide layer result from the impact of a 20 µm copper particle on a copper substrate at different velocities when the particle is covered with 80 nm oxide layers and the water thickness is 2 µm.
Coatings 15 00405 g007
Figure 8. The changes in equivalent plastic strain of the substrate over time as the particle strikes the substrate at three different velocities.
Coatings 15 00405 g008
Figure 9. (a) The oxide layer failure and water distribution in the particle–substrate contact area after 50 ns of impact, and (b) the ratio of the volume of interfacial water to the volume of water wetting the particle when the particle impacts the substrate at three different velocities.
Coatings 15 00405 g009
Figure 10. The coating formation during the first 90 ns of the impact of five 20 µm copper particles at 600 m/s.
Coatings 15 00405 g010
Figure 11. Search for interfacial and interparticle water trapped when (a) substrate and (b) particles were wetted by a 2.5 µm water film.
Coatings 15 00405 g011
Figure 12. Comparison of coatings deposited with CS at 600 m/s with wet particles or substrate in porosity formation and the thickness and width of the deposited coatings. Error bar is standard deviation.
Coatings 15 00405 g012
Figure 13. Effect of particle velocity on porosity formation and interfacial water when a 20 µm wet copper particle with a 2 µm water film impinges on a copper substrate.
Coatings 15 00405 g013
Figure 14. (a) Thickness and width of deposited coatings using LCS with wet particles and (b) the effect of particle velocity on the volume of entrapped water.
Coatings 15 00405 g014
Figure 15. Effect of water film thickness wetting the particles on porosity formation and interfacial water when five 20 µm wet copper particles impact a copper substrate at 600 m/s.
Coatings 15 00405 g015
Figure 16. (a) Thickness and width of deposited coatings using LCS with wet particles and (b) effect of water film thickness wetting the particles on the volume of trapped water.
Coatings 15 00405 g016
Table 1. Material constants used in finite element analysis [18,19,30,31,39].
CopperWater
PropertyValuePropertyValue
Thermal Conductivity386 W/m.KThermal Conductivity0.598 W/m.K
Specific Heat383 J/Kg.KSpecific Heat4.186 J/Kg.K
Density8930 Kg/m3Density985 Kg/m3
Shear Modulus45 GPaSpeed of Sound1490 m/s
Melting Point1356 KViscosity1 mPa-s
Grüneisen’s Constant1.99
Speed of Sound3933 m/s
Hugoniot Slope1.5
A90 MPa
B292 MPa
C0.025
m1.09
n0.31
Reference Strain Rate1/s
Transition Temperature298 K
Table 2. The conditions used to study the effect of water on porosity formation.
Name of
the Condition
Particle
Velocity (m/s)
Particle
Temperature (K)
Substrate
Temperature (K)
Water Layer
Thickness (µm)
Water
Temperature (K)
VP15002982982298
VP26002982982298
VP36502982982298
VP46002982981.5298
VP56002982982298
VP66002982982.5298
Disclaimer/Publisher’s Note: The statements, opinions and data contained in all publications are solely those of the individual author(s) and contributor(s) and not of MDPI and/or the editor(s). MDPI and/or the editor(s) disclaim responsibility for any injury to people or property resulting from any ideas, methods, instructions or products referred to in the content.

