Article

Characterization of Laser-Textured Surfaces of Parts of a Biodegradable Polymer

by
Petronela-Daniela Rusu (Ostahie)
1,
Oktawian Bialas
2,
Anna Wozniak
2,
Marcin Adamiak
2,
Augustine Appiah
2,
Catalin Tampu
3,
Simona-Nicoleta Mazurchevici
1,
Panagiotis Kyratsis
4,
Anastasios Tzotzis
4,
Alexandra Nedelcu
5,
Teodor-Daniel Mindru
1 and
Dumitru Nedelcu
1,*
1
Department of Machine Manufacturing and Industrial Management, “Gheorghe Asachi” Technical University of Iasi, Blvd. Mangeron 59A, 700050 Iasi, Romania
2
Faculty of Mechanical Engineering, Silesian University of Technology, Akademicka 2A, 44-100 Gliwice, Poland
3
Faculty of Engineering, Vasile Alecsandri University of Bacau, 600115 Bacau, Romania
4
Department of Product and Systems Design Engineering, University of Western Macedonia, 501 00 Kozani, Greece
5
Faculty of Dental Medicine, University of Medicine and Pharmacy “Grigore T. Popa”, 700115 Iasi, Romania
*
Author to whom correspondence should be addressed.
Coatings 2025, 15(2), 246; https://doi.org/10.3390/coatings15020246
Submission received: 6 February 2025 / Revised: 17 February 2025 / Accepted: 17 February 2025 / Published: 19 February 2025

Abstract

:
Surface texturing entails surface alteration through forming, microgrooving, microdimpling, and microchanneling. This is achieved by laser micromachining, in addition to other related methods, of a substrate surface. The present paper describes the surface characteristics obtained after the laser texturing of a biodegradable polymer (Arbofill Fichte) with four and six passes in hexagonal and square patterns. The results of the wettability test indicate that this biodegradable polymer has a surface with a weak hydrophobic characteristic (contact angle near 90°), regardless of the type of texture that is obtained. The underlying material’s wear behavior changes as a result of the surface alteration due to laser surface texturing (LST). The coefficient of friction (COF) values thus increase for all samples. The hexagonal geometry offers greater stability and consistency compared to square geometry, independent of the number of passes. Square geometry is more susceptible to variations, particularly along the Y axis, and may need additional adjustment of the process parameters. The hexagonal structure naturally promotes more uniform leveling due to its tighter and more evenly spread arrangement, even at four texturing passes (4x). However, at six texturing passes (6x), the advantages become more pronounced because of the repeated overlaps in the laser trajectories. The overlap in the hexagonal configuration guarantees that each area of the material receives a relatively consistent energy dose, reducing localized discrepancies. The possibility of using this method to texture surfaces is viable; thus, based on the obtained results, there is the possibility that it can replace non-biodegradable polymers in different sectors.

1. Introduction

Surface texturing is a process used to create desired patterns on a material’s surface. As a result, this textured-surface material offers several important mechanical and tribological properties, including increased fatigue strength, corrosion resistance, wear resistance, anti-biofouling hydrophobicity, and enhanced load-carrying capacity. Several technical materials, including ceramics [1,2], metals [3,4], and polymers [5], have been successfully treated with laser surface texturing (LST). This approach has been effective in a number of technical fields, including coatings, tribology, and biomedicine. LST can produce a variety of patterns and textures to improve a material’s tribological behavior. Furthermore, the procedure improves the material’s wear resistance and coefficient of friction. A few of the patterns have different-sized and -shaped dimples and microgrooves [6,7,8].
A family of polymers known as biodegradable polymers decompose via a bacterial process after serving their intended function, producing natural byproducts such water, biomass, inorganic salts, and gases (CO2, N2) [9,10].
Since many biodegradable polymers are natural compounds, it is impossible to pinpoint the exact moment of their discovery and application. Catgut suture was one of the earliest uses of a biodegradable polymer [11].
In the 1980s, the idea of synthetic biodegradable polymers and plastics was initially proposed [12]. To develop a definition, standards, and testing processes for biodegradable polymers, leaders in the field convened an international symposium in 1992 [10].
Numerous industries, including packaging [13], agriculture [14], and medical [15], are very interested in biodegradable polymers. There are countless applications for biodegradable polymers in the biomedical industry, especially in the areas of drug delivery and tissue engineering [16,17].
Biomaterials and biodegradable polymers are also very interesting for tissue regeneration and tissue engineering. The ability to create new tissue using synthetic materials is known as tissue engineering. Such systems can be utilized to create new structures and organs in vitro using a biodegradable scaffold or to cultivate tissues and cells in vitro [18].
Biodegradable polymers are frequently utilized in packaging materials to cut down on waste as well as in medicine [12]. More significant efforts are also being made to create new materials from biodegradable components as substitutes for those derived from petrochemicals.
Due to their biocompatibility and favorable mechanical properties, which can sometimes mimic those of human tissues, natural and artificial polymers and biopolymers are widely used in biomedical applications [5,19]. Studies examining the impact of three different laser wavelengths (1.064 µm, 532 nm, and 355 nm) on the surface properties of carbon-coated polyethylene (UHMWPE) materials have shown that 355 nm and 532 nm lasers are more suitable for improving surface conditions, particularly roughness and wettability. The CO2 laser texturing of poly-l-lactide can modify the surface structure and physical properties of a polymer to meet specific cell requirements, while also inducing significant changes in the mechanical properties of the treated surface [20]. Using 1064 nm, 355 nm, and 532 nm lasers, the effects of laser variation on the wettability, roughness, and hardness of a polypropylene material were investigated. The authors suggested that the laser wavelength can effectively roughen the surface of polypropylene [21]. The scientific literature indicates that Ra values exceeding 1 µm are essential for improving bone bonding on implant surfaces. Mirzadeh et al. [22] improved the hydrophilicity and biocompatibility of ethylene-propylene rubber by grafting N-vinylpyrrolidone (NVP) and 2-hydroxyethyl methacrylate (HEMA) to the polymer using a pulsed CO2 laser at different powers. In a separate study, Dinca et al. [23] used excimer lasers to create roughness gradients on natural composite substrates in a single-step process.
Further research demonstrated that PC12 cells exhibited good adhesion to a patterned surface [24]. Direct laser writing on biodegradable polymers can create microchannels that promote a high degree of alignment for C2C12 myoblast cells. After four days, the cells multiply and form a merging patch within these channels, demonstrating successful attachment and growth [25]. Waugh et al. [26] characterized the surface properties of nylon 6.6 treated with a CO2 laser. Their findings suggested that laser-textured surfaces enhance the biomimetic properties of nylon 6,6, particularly with respect to osteoblast cell responses. Although numerous polymeric biomaterials have been investigated for tissue engineering applications [27,28,29], only a limited number are currently used in clinical practice. These include the following:
-
Poly(etheretherketone) (PEEK) has excellent mechanical properties (in some cases, even similar to cortical bone), high chemical resistance, and sterilization capacity. So far, the surface functionalization of PEEK by means of LST has been successfully achieved using laser wavelengths ranging from UV (355 nm) to middle infrared (MIR) (10.6 μm). PEEK was observed to respond very differently as a function of laser radiation. Laser radiation at 1064 nm burned the surface, while 532 nm laser radiation was able to ablate the material. Using this laser wavelength, grooves with a mean width of 100 μm were machined [30,31,32]. The 355 nm laser radiation only produced slight surface melting; however, this laser radiation was identified as the most suitable for biomedical purposes because it induced the formation of some polar groups. The main applications are in orthopedics (e.g., in joint replacement, cage implants, bone screws, and pins) [33,34,35].
-
Polypropylene (PP) has good biostability, good thermal stability, and appropriate mechanical properties. However, PP exhibits low surface energy, which hinders its systematic use in tissue replacement [36,37]. The effect of treatment under 1064, 532, and 355 nm laser wavelengths on the surface features of PP was evaluated [21]. A layer of carbon black was used to increase the original absorption features of this thermoplastic given its high transmittance for wavelengths ranging between 400 and 1600 nm [38]. The treated surfaces were characterized in terms of surface roughness (Ra), WCA, microhardness, and chemical composition. The LST of PP resulted in the melting of the surface, along with the adhesion of carbon particles to its surface. The final roughness (Ra) was found to be higher than 1 μm, which is considered the minimum required value to improve the bone/implant bonding degree [39]. To increase the wettability of polypropylene (PP), Murahara and Okoshi [40] utilized a different approach, irradiating the material with an ArF laser in the presence of tap water. This laser treatment significantly reduced the contact angle of the PP surface. The minimum contact angle achieved was 65° for the treated surfaces, compared to 93° for the untreated base material. This optimal wettability was observed at a laser fluence of 12.5 mJ/cm2 and a shot number of 10,000 [40].
-
Polyethylene (PE) is a synthetic thermoplastic polymer, bioinert, and non-biodegradable when in contact with body fluids. LST has been applied to this material given its inertness [41,42,43,44]. Okoshi and Inoue [42] studied the utilization of fs laser sources to ablate and modify the surface of PE samples. The LST of PE was performed with a fs Ti:sapphire laser source using 790 nm laser light, with second harmonics of 395 nm. Both wavelengths were found to successfully ablate PE surfaces [42,44]. The biological performance of PE laser-textured surfaces was evaluated after being subjected to Nd:YAG laser radiation (λ = 1064 nm) by Blanchemain et al. [43]. After laser irradiation, the surface roughness of PE was increased up to Ra = 0.2 μm [43]. Among the typical implant applications of this material, chin, cheek, and jaw reconstruction should be highlighted [41,42,43,44,45,46,47,48].
-
Polyimide (PI) was textured using different laser wavelengths (λ = 1064, 532, 355, and 266 nm) to avoid biofilm formation on indwelling medical devices. Several topographies were tested against Staphylococcus aureus adhesion [49].
Numerous medical devices benefit from textured surfaces. For example, Yasaka et al. [50] investigated the influence of textured surfaces on plastics, aiming to reduce the friction between biological tissues and medical device components. Their research demonstrated that textured soft plastic surfaces exhibited lower friction compared to conventional surfaces. In another study, Ikeuchi et al. [51] examined the tribological properties of water-based polyurethane grafted with methylhexanamine (DMAA). They highlighted that medical devices coated with DMAA enable painless insertion, precise operation, and enhanced tissue protection.
Shivakoti et al. [8] postulated that LST shows great biomedical promise, especially for polymers. Mirzadeh et al. [22] used a pulsed CO2 laser at varying intensities to graft N-vinylpyrrolidone (NVP) and 2-hydroxyethyl methacrylate (HEMA) onto ethylene-propylene rubber to improve its hydrophilicity and biocompatibility. On untreated films, alveolar macrophages adhered to the cells, propagated, and flattened, while those on treated EPR had a circular shape with limited cytoplasmic spreading and ruffling. Both cell types adhered better to microstructured surfaces than unstructured surfaces, especially high-roughness polymeric surfaces with gradient roughness ratios and wettability generated by laser micro/nano-textured silicon surfaces, according to Koufaki et al. [24]. It was also shown that PC12 cells attached well to the patterned surface. Evangelista et al. [52] stated that current equipment needs modifications to improve medical device tribological qualities while retaining its core features and design.
Surface interactions, also known as tribology, play a crucial role in the functionality of medical devices. Devices with relative motion, such as prosthetic implants, artificial joints, and dynamic mechanisms in drug delivery systems, experience higher failure rates due to wear and friction [53,54,55]. To address this, Bialas et al. [56] explored the use of laser texturing to infuse PEEK with gold nanoparticles, potentially improving its tribological properties.
The biodegradable biopolymer used in this study (Arbofill Fichte), which was patented by a group of researchers from the Fraunhofer Institute for Chemical Technology (ICT) in Pfinztal, Germany, in association with the business Tecnaro GmbH, has the potential to be used in a wide range of industrial applications, including those involving renewable resources and biopolymers such as polyester (e.g., bio-PET), polyhydroxyalkanoates (PHAs), poly-caprolactone (PCL), starch, polylactic acid (PLA), bio-polyolefins (bio-PEs), bio-polyamides (bio-PAs), lignin, natural resins, natural waxes, natural oils, natural fatty acids, cellulose, organic additives, and natural reinforcing fibers [57]. Previous studies conducted by members of our research team have determined the following key characteristics of the biodegradable biopolymer used: a melt volume rate of 6 cm3/10 min, a heat deflection temperature of 111 °C, and an impact strength of 17 kJ/m2 [57,58]. Further investigation revealed a tensile strength of 28 MPa at room temperature, decreasing to 13.5 MPa at 60 °C. The tensile strain at fracture was found to be 4.71% at room temperature and 7.1% at 60 °C [59], with a relative density of 1.08 and a microhardness in of 0.07804 MPa [60]. Furthermore, a dry friction coefficient in the range of 0.145–0.15 has been reported for pins against AISI 572 Gr 65 (OL60) steel disk [59].
The biodegradable biopolymer used in this study offers several advantages and limitations when used for laser texturing. Its eco-friendly composition, as a bio-composite material derived from renewable resources, aligns with the increasing demand for sustainable manufacturing practices. The microtexturing process also is a waste-reducing method for functionalizing material surfaces, making it a sustainable solution that aligns with pro-ecology policies. The material allows for precise and intricate texturing through laser technology, enabling customized designs, functional surface enhancements, and distinctive surface finishes that are difficult to achieve with conventional polymers or metals. It also exhibits good thermal stability during processing, making it capable of withstanding the localized heating effects of laser texturing without significant deformation. Additionally, its machinability facilitates smoother operations during laser processing and reduces equipment wear. The main characteristics of the biodegradable biopolymer used are as follows: tensile strength (at 23 °C)—(28.05 ± 1.09) MPa; tensile strength (at 60 °C)—(13.50 ± 0.23) MPa; tensile strain (at 23 °C)—4.71 ± 0.11%; tensile strain (at 60 °C)—7.1 ± 0.48%; microhardness, (73–81) MPa; friction coefficient by disk rotation—0.145; and friction coefficient by oscillation—0.1523 [57,59,61].
However, despite its thermal resistance, the biodegradable biopolymer used can experience localized burning or charring when exposed to high laser intensities, potentially affecting the uniformity of the textured surface. As a niche material, the biodegradable biopolymer used may also face challenges related to higher costs and limited availability compared to more common polymers or composites.
In previous research [62], textured pieces were obtained by injection molding of Arboblend V2 Nature material with two and four texturing passes with square and hexagonal geometries. As the experimental part, the following aspects were considered: surface free energy and contact angle, microscopic analysis (the reproducibility of the square and hexagonal side dimensions was shown), roughness, groove width and depth, coefficient of friction, and microindentation. This research was also carried out on injection-molded parts but using a biodegradable biopolymer with four and six texturing passes with the same geometries. The wear track morphology, degradation testing, and topography analysis should be mentioned as the novelties of this study.
In conclusion, the novelty of this work consists in texturing parts of another material, a biodegradable biopolymer (Arbofill Fichte), in order to widen the range of biodegradable materials used in medical applications. This paper also determines the tribology of the material through the study of wear, addresses the degradation of the textured parts, and presents the topography, in addition to the Rz and Rq values in three directions of the textured surfaces. This paper includes, in addition to the Ra component of roughness, the deviations from flatness, which are extremely important to know [58,59,61,63,64].

2. Materials and Methods

2.1. Sample Preparation

The samples used for texturing were obtained by injection molding using an SZ-600H injection machine (Shen Zhou, Zhangjiagang, China). To obtain better-quality results, homogenized sample preparation was used for each sample. Before laser micromachining, the mechanical finishing process was performed using a grinding–polishing machine known as TERGAMIN-30 (Struers, Willich, Germany). Each sample was mechanically planed and sequentially polished with paper with grain-size gradations of 500, 800, and 1200 grid/mm2 for time t = 4 min per gradient, then mechanically polished by polishing wheels, with gradations of 9, 3, and 1 μm.

2.2. Laser Surface Texturing (LST)

The surface texturing process utilized an A-355 picosecond laser system (Oxford Lasers Ltd., Didcot, UK), featuring a 335 nm wavelength diode-pumped solid-state picosecond laser. This system generated 5–10 ps pulse durations with 120 µJ energy at a pulse frequency of 400 Hz. The average laser power for the texturing system was 48 mW, with a Gaussian distribution of laser beam intensity. The laser pattern (or filling strategy) was designed with Cimita software (Oxford Lasers, Didcot, UK), which was integrated into the micromachining system.
The other LST processes used the parameters presented in Table 1.

2.3. Microscopic Observation

The geometric structure of the sample surfaces and the wear tracks were analyzed using a Leica DVM6 digital microscope (DM), Wetzlar, Germany.

2.4. Wettability Test

Contact angle (Θ) measurements were carried out using the sitting drop method to determine the wettability of the tested samples’ surfaces. For this purpose, a Biolin Scientific Attension Theta Flex strain gauge (Hangpilsgatan 7, Vastra Frolunda, Vastra Gotaland County 42677, SE) was used. Drops of distilled water, as the measuring liquid in a volume of 2 µL, were deposited on the surface of the tested samples, each time maintaining the minimum (same) height of the dispenser above the surface. Contact angle measurements were performed as a function of time (60 s) in a series of 3 measurements for each sample. Measurements were carried out at a room temperature of 289 K (25 °C).

2.5. Wear Test

The tribological properties of the tested samples were investigated using the ball-on-plate method using a CSM tribometer (CSM Instruments, Needham, MA, USA). As a counter sample, an Al2O3 ceramic ball with a 6 mm diameter was used. Normal loads of 4 N were used. The stroke length was fixed at 6 mm, and the frequency was 1 Hz, creating a sliding speed of 1.2 cm/s.

2.6. Degradation Test

The degradation test was performed using a WKL 100/40—Weiss Climate chamber according to the PN-EN 600068-14 standard [65]. The test parameters were as follows:
-
Step I: Temperature decrease T↓ up to T = −5 °C, t = 1 h;
-
Step II: Aging: T = −5 °C, t = 3 h;
-
Step III: Temperature increase T↑ up to T = 50 °C, HD = 90%, t = 1 h;
-
Step IV: Aging, T = 50 °C, HD = 90%, t = 3 h.
The surface morphology after the degradation test of the sample’s surfaces and the wear tracks were analyzed using a Leica DVM6 digital microscope (DM).

2.7. DSC Analysis

The thermal stability of the samples was determined by differential scanning calorimetry (DSC) using a NETZSCH calorimeter, DSC 200 F3 Maia, with a temperature accuracy of 0.1 K, a sensitivity below 1 μW, and an enthalpy accuracy below 1%. Calibration was performed with Hg, Bi, In, Sn, and Zn according to the standards. Heating was performed between RT and 180 °C for all samples using a heating rate of 10 °C/min. Sample fragments weighing less than 30 mg were cut and were investigated under an Ar-protective atmosphere. The resulting DSC thermographs, comprising heat flow variations with temperature, were evaluated with Proteus software v.6.1.

2.8. Topography

A Zegage-type profilometer was used to determine the topography of the surfaces. This method allows accurate measurements without damaging or altering the surface of a sample. Considering the small roughness values of the measured surfaces used for the determinations, an eyepiece with a magnification of 10× was used. It had a field of view (FOV) of 0.83/0.83 mm and a lateral resolution of 0.815 microns. The lateral resolution of the profilometer in distinguishing two points was a minimum distance of 0.815 microns from each other on the measured surface. In other words, two surface details that were separated by a distance greater than or equal to 0.815 microns appeared as distinct in the profilometer image.

3. Results and Discussion

3.1. Microscopic Observation

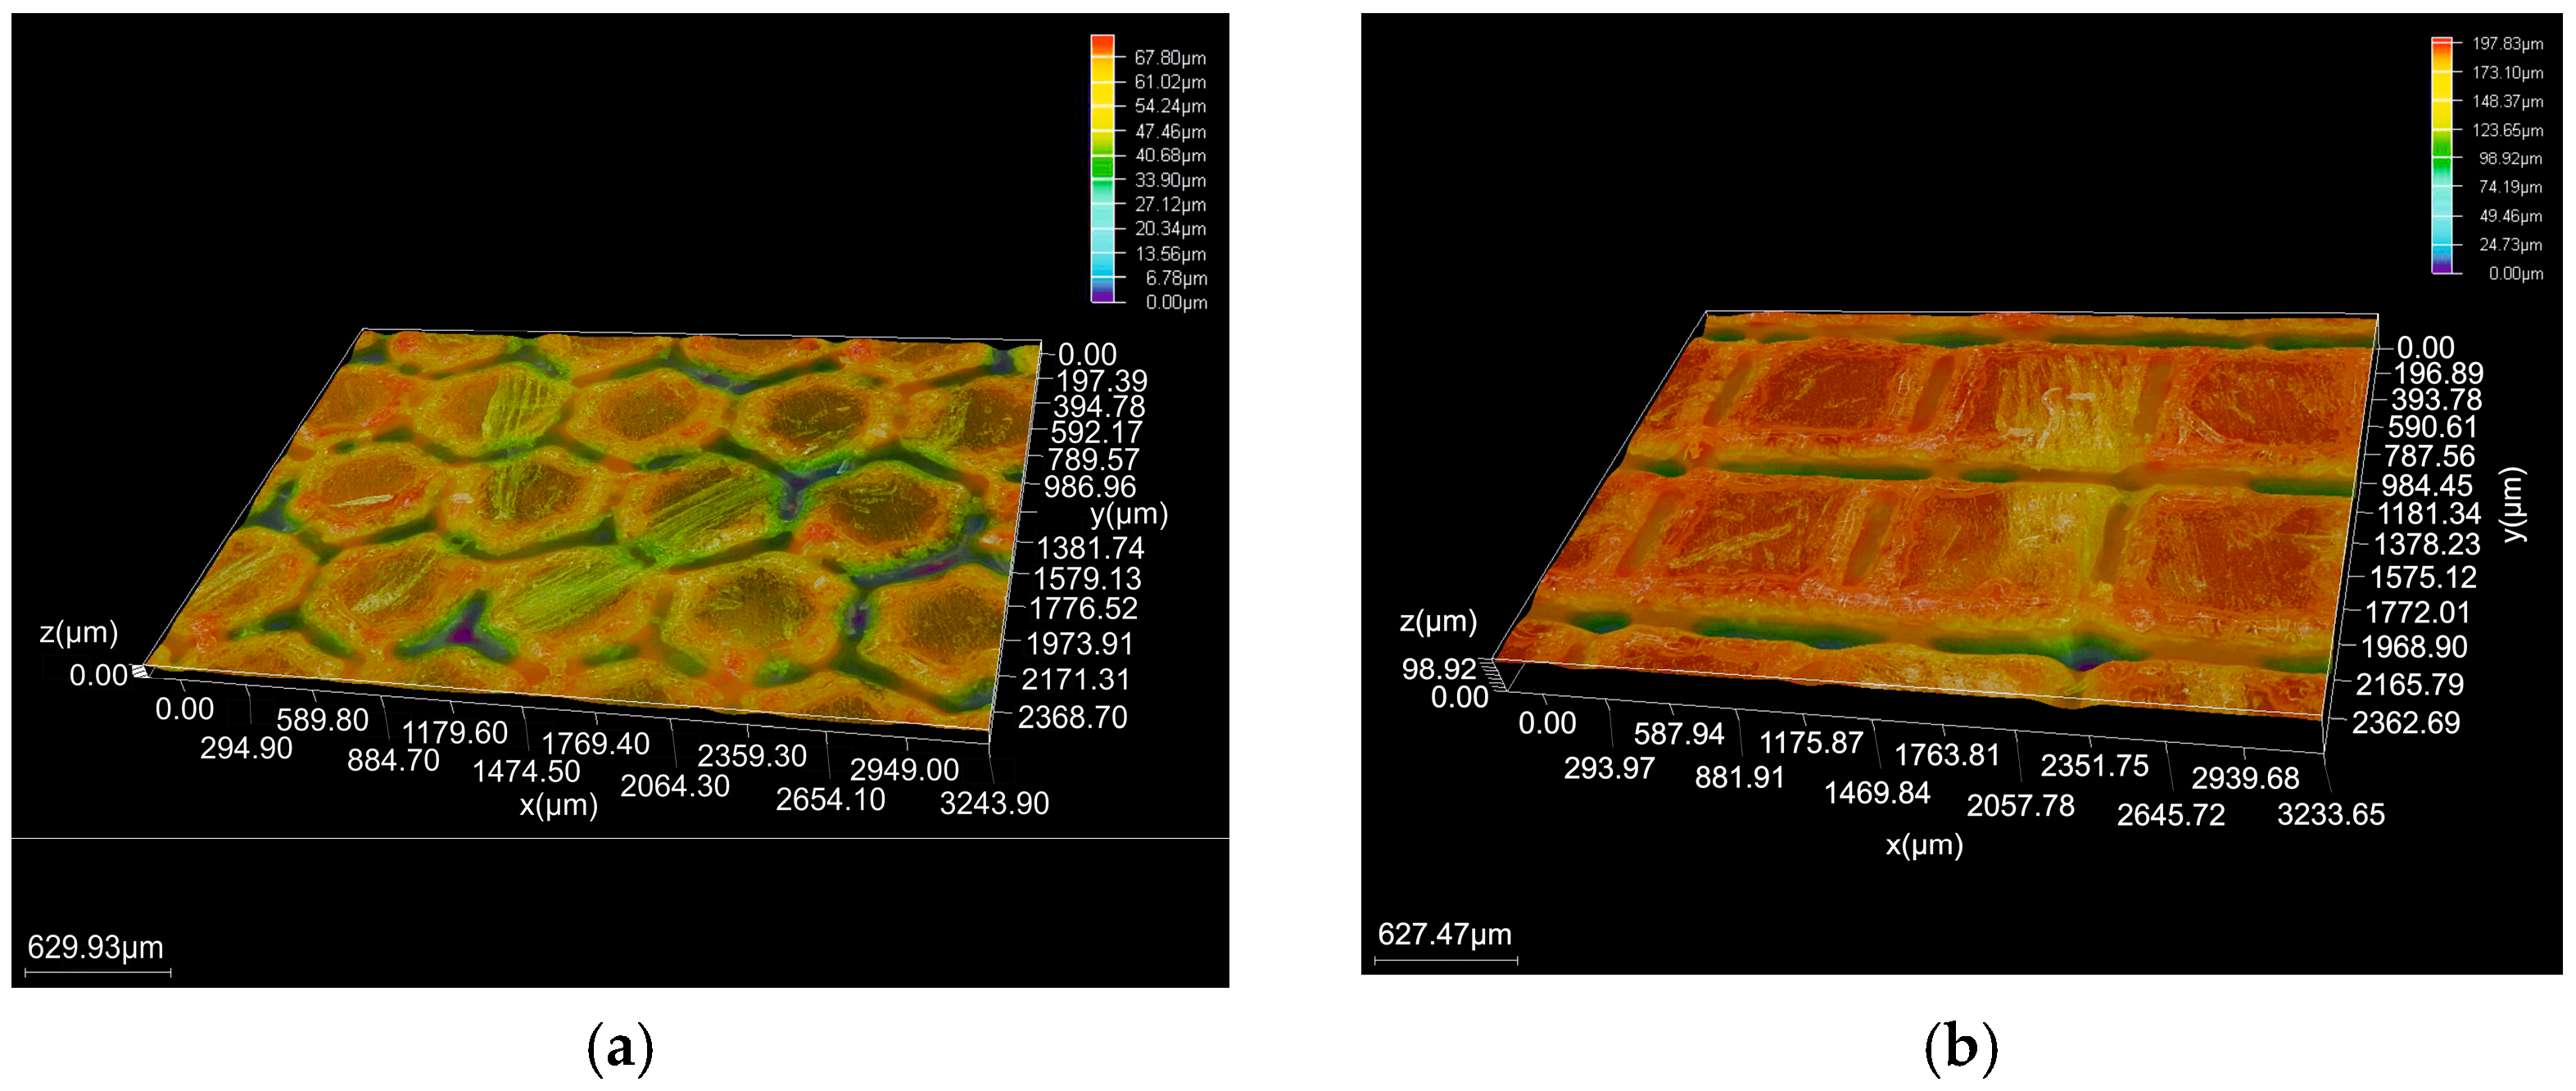
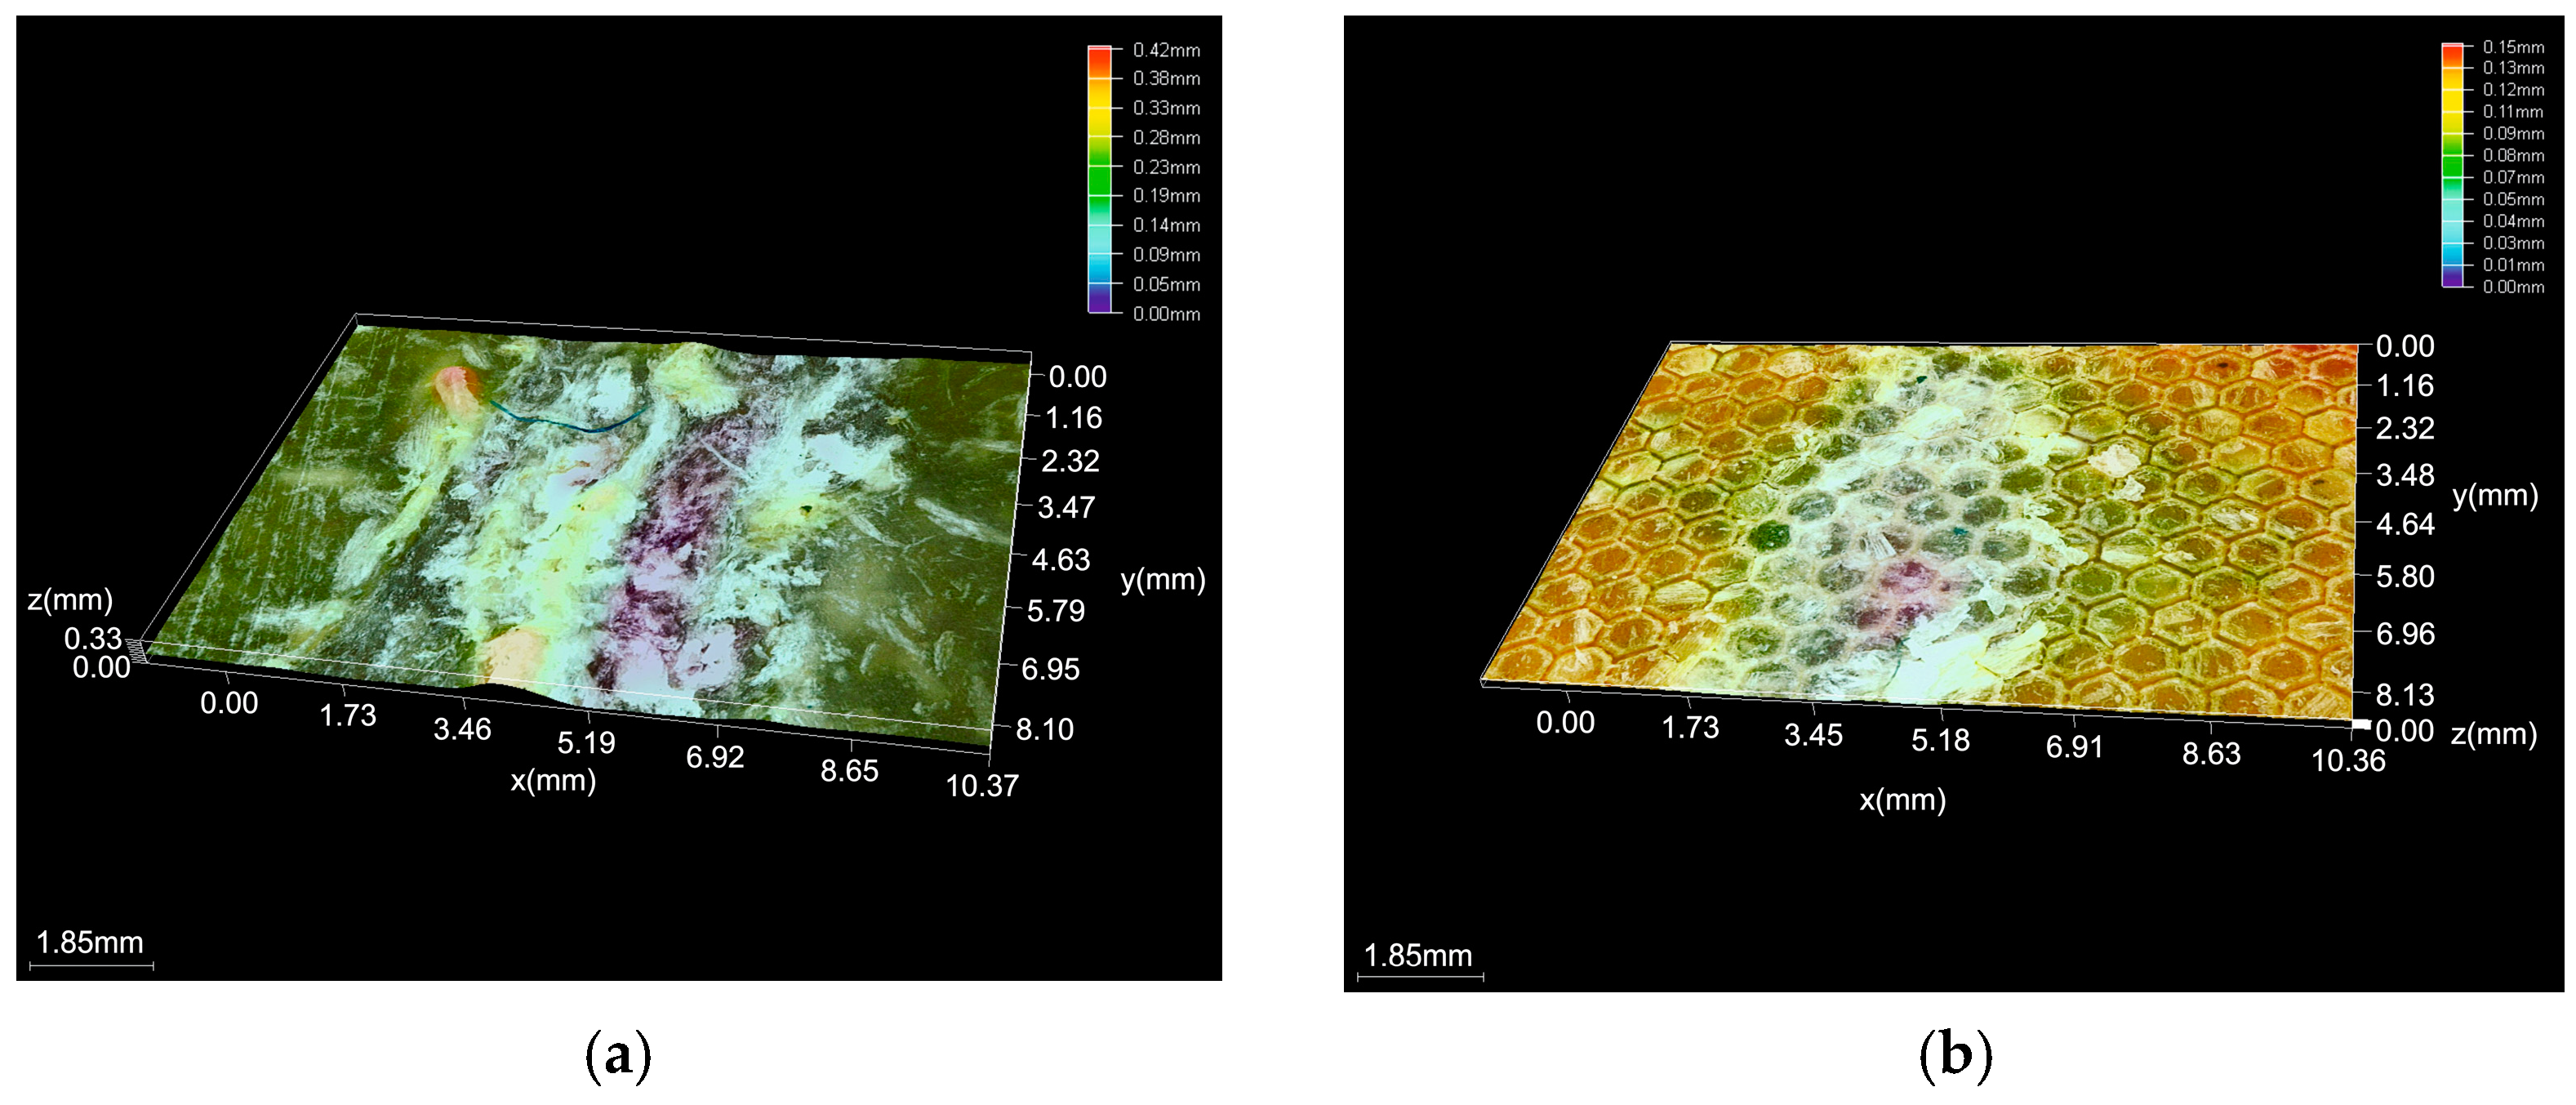
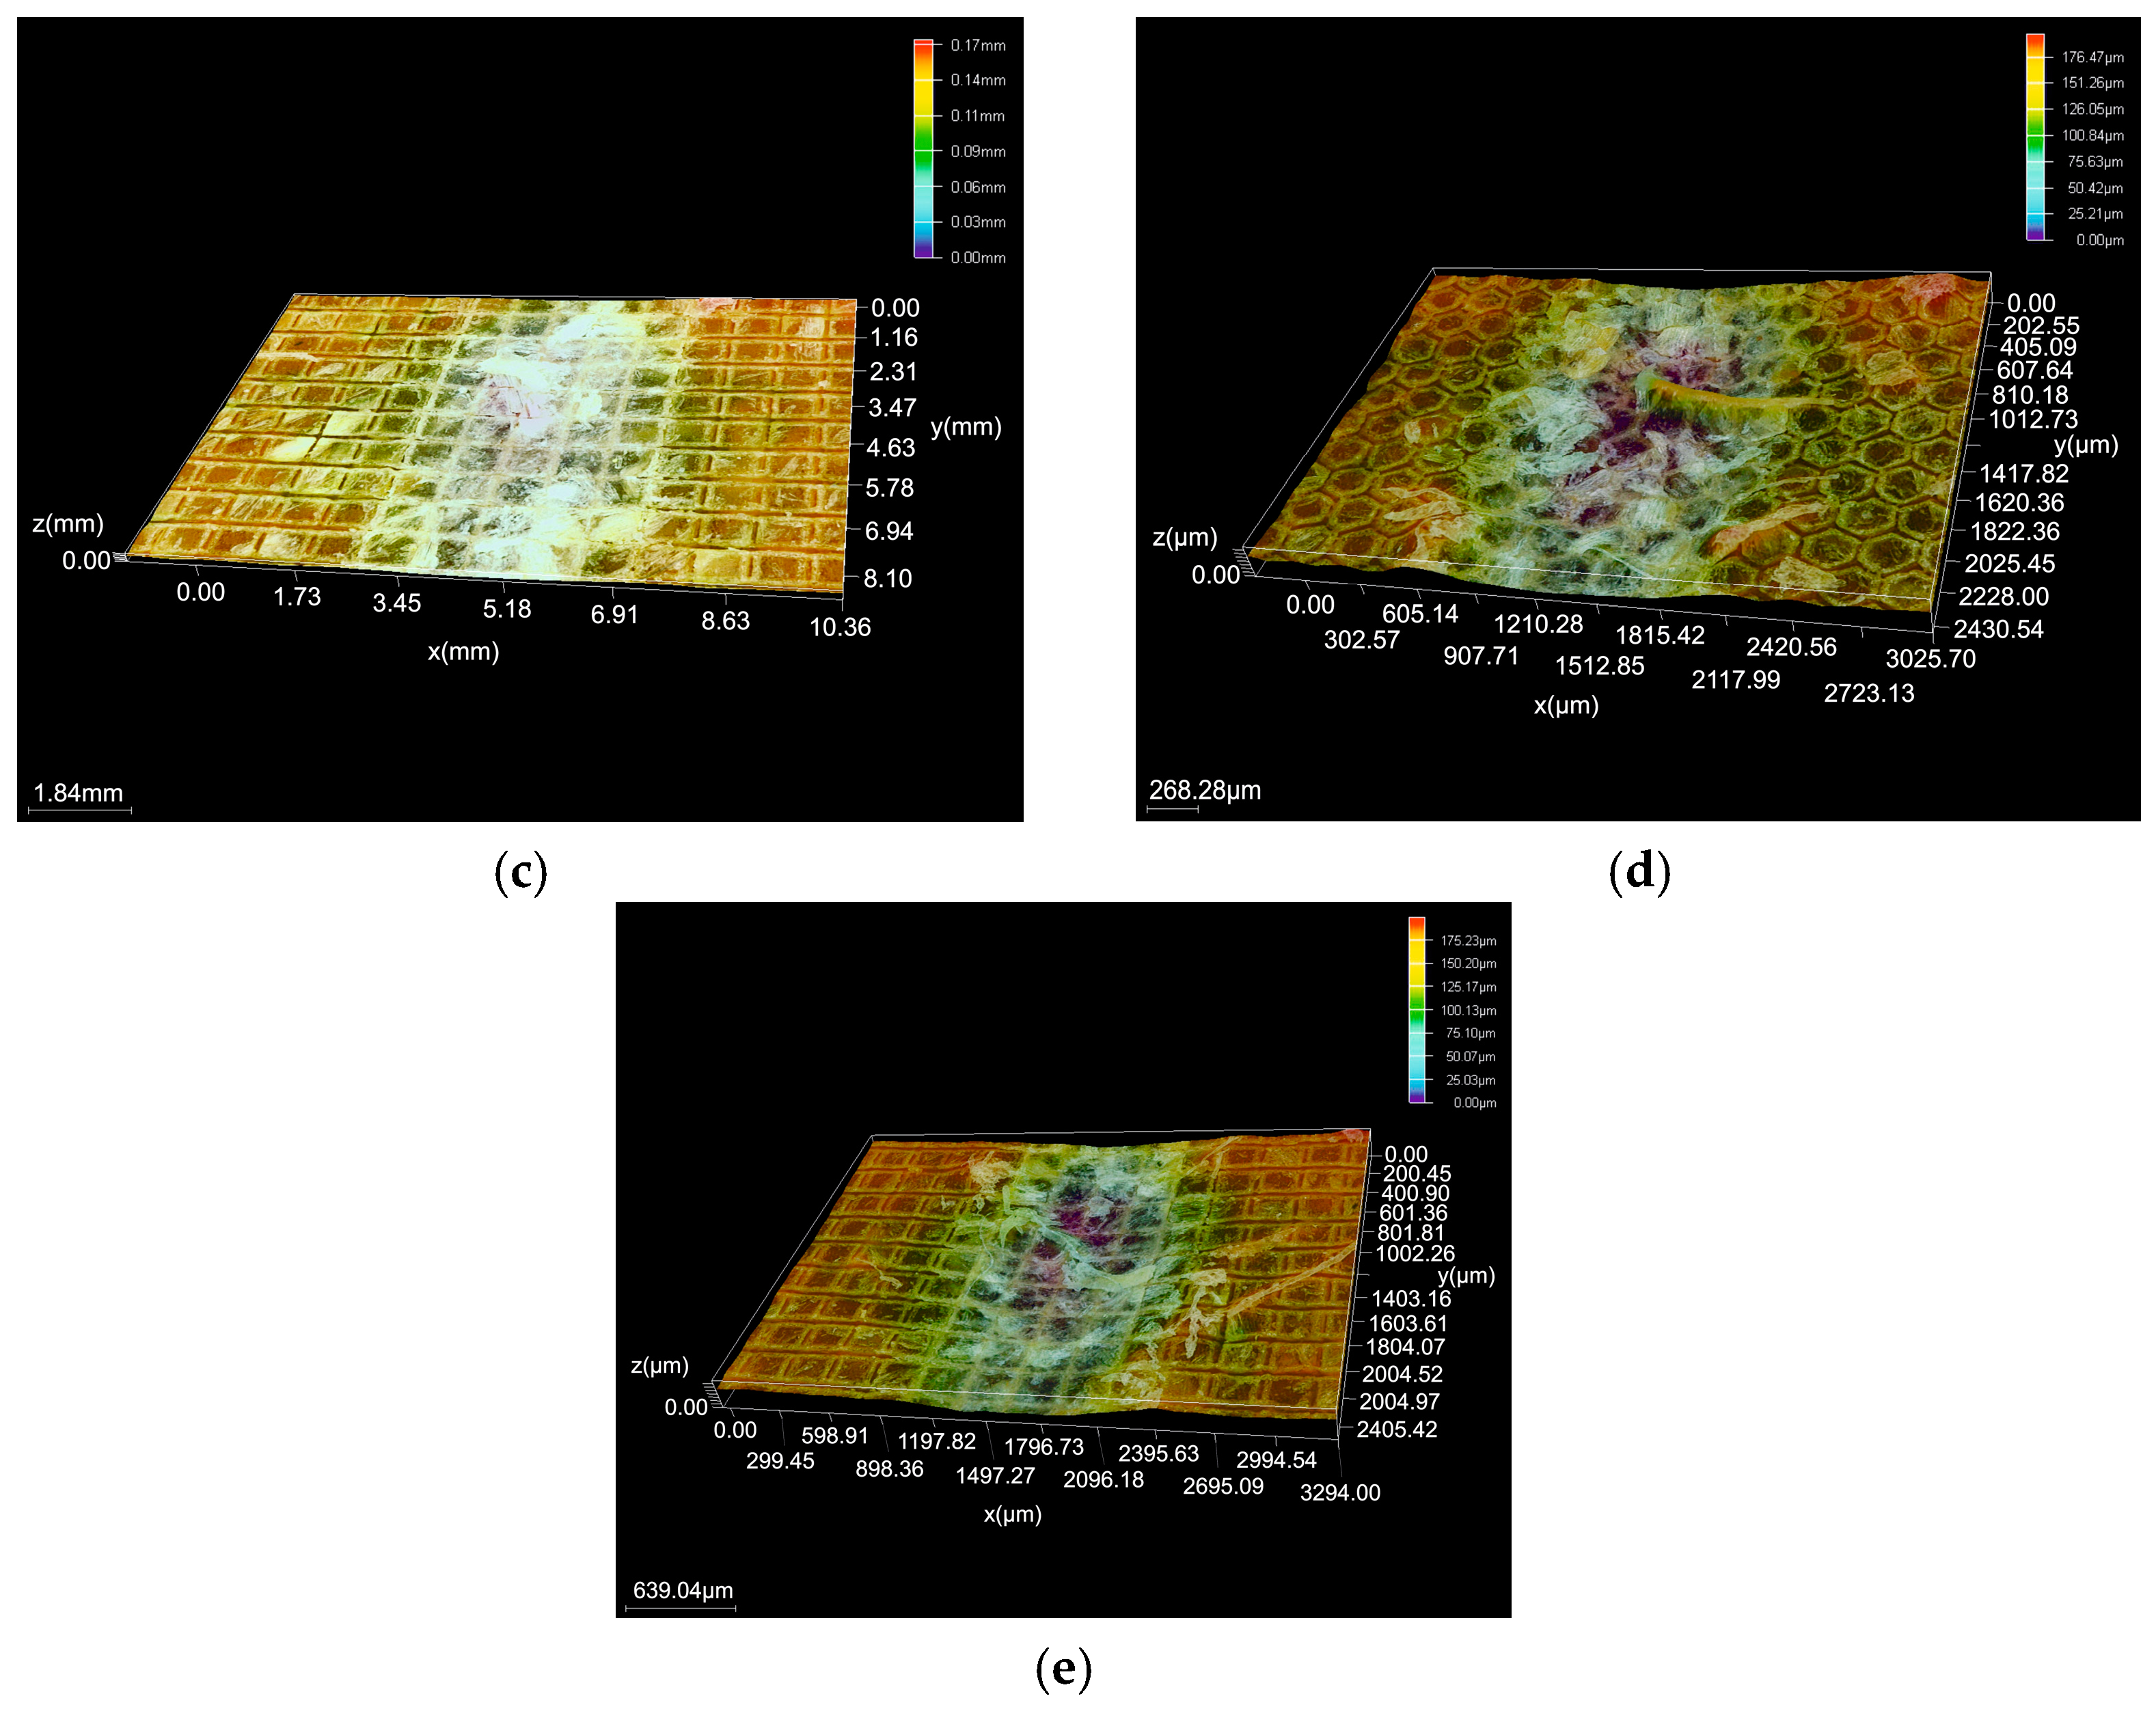
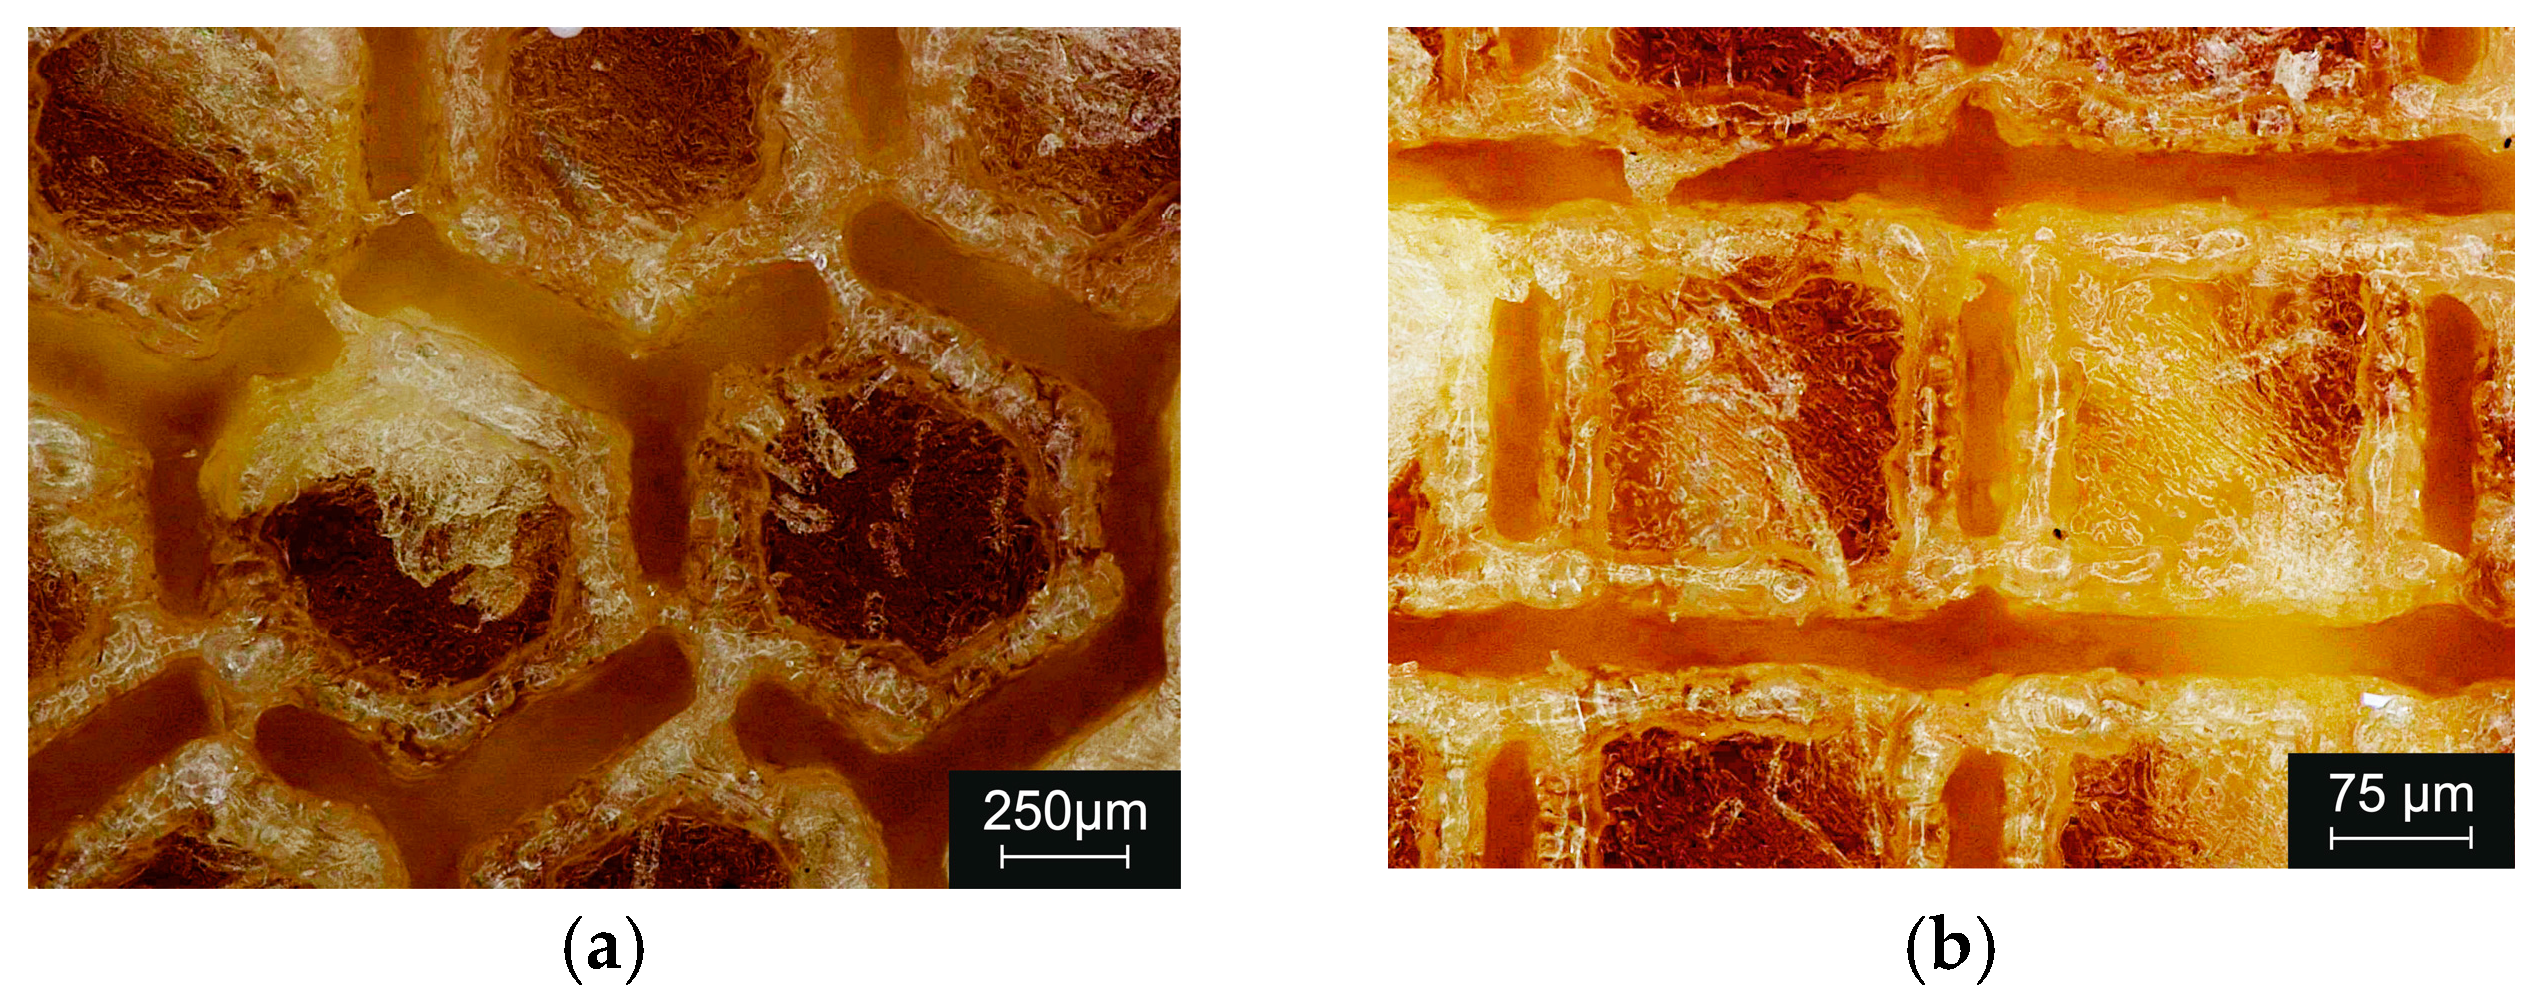
The surface morphology of the samples after the laser texturing process was as shown in Figure 1 and Figure 2. For all of the tested samples, regardless of the type of base material, honeycomb (group H) and cross-like microgroove (group S) patterns were observed, which are characteristic features of photothermal ablation. In this sense, transverse and parallel cuts demonstrated a wavy profile that constituted the texture. The diameter of the dimples was very even and fitted the design well. Based on the microscopic investigation, it was found that the grooves presented typical laser-induced surface structures, which were formed by the interaction of the laser beam and the sample surface. The textured surfaces obtained by laser ablation were characterized as continuous grooves.

3.2. Wettability Test

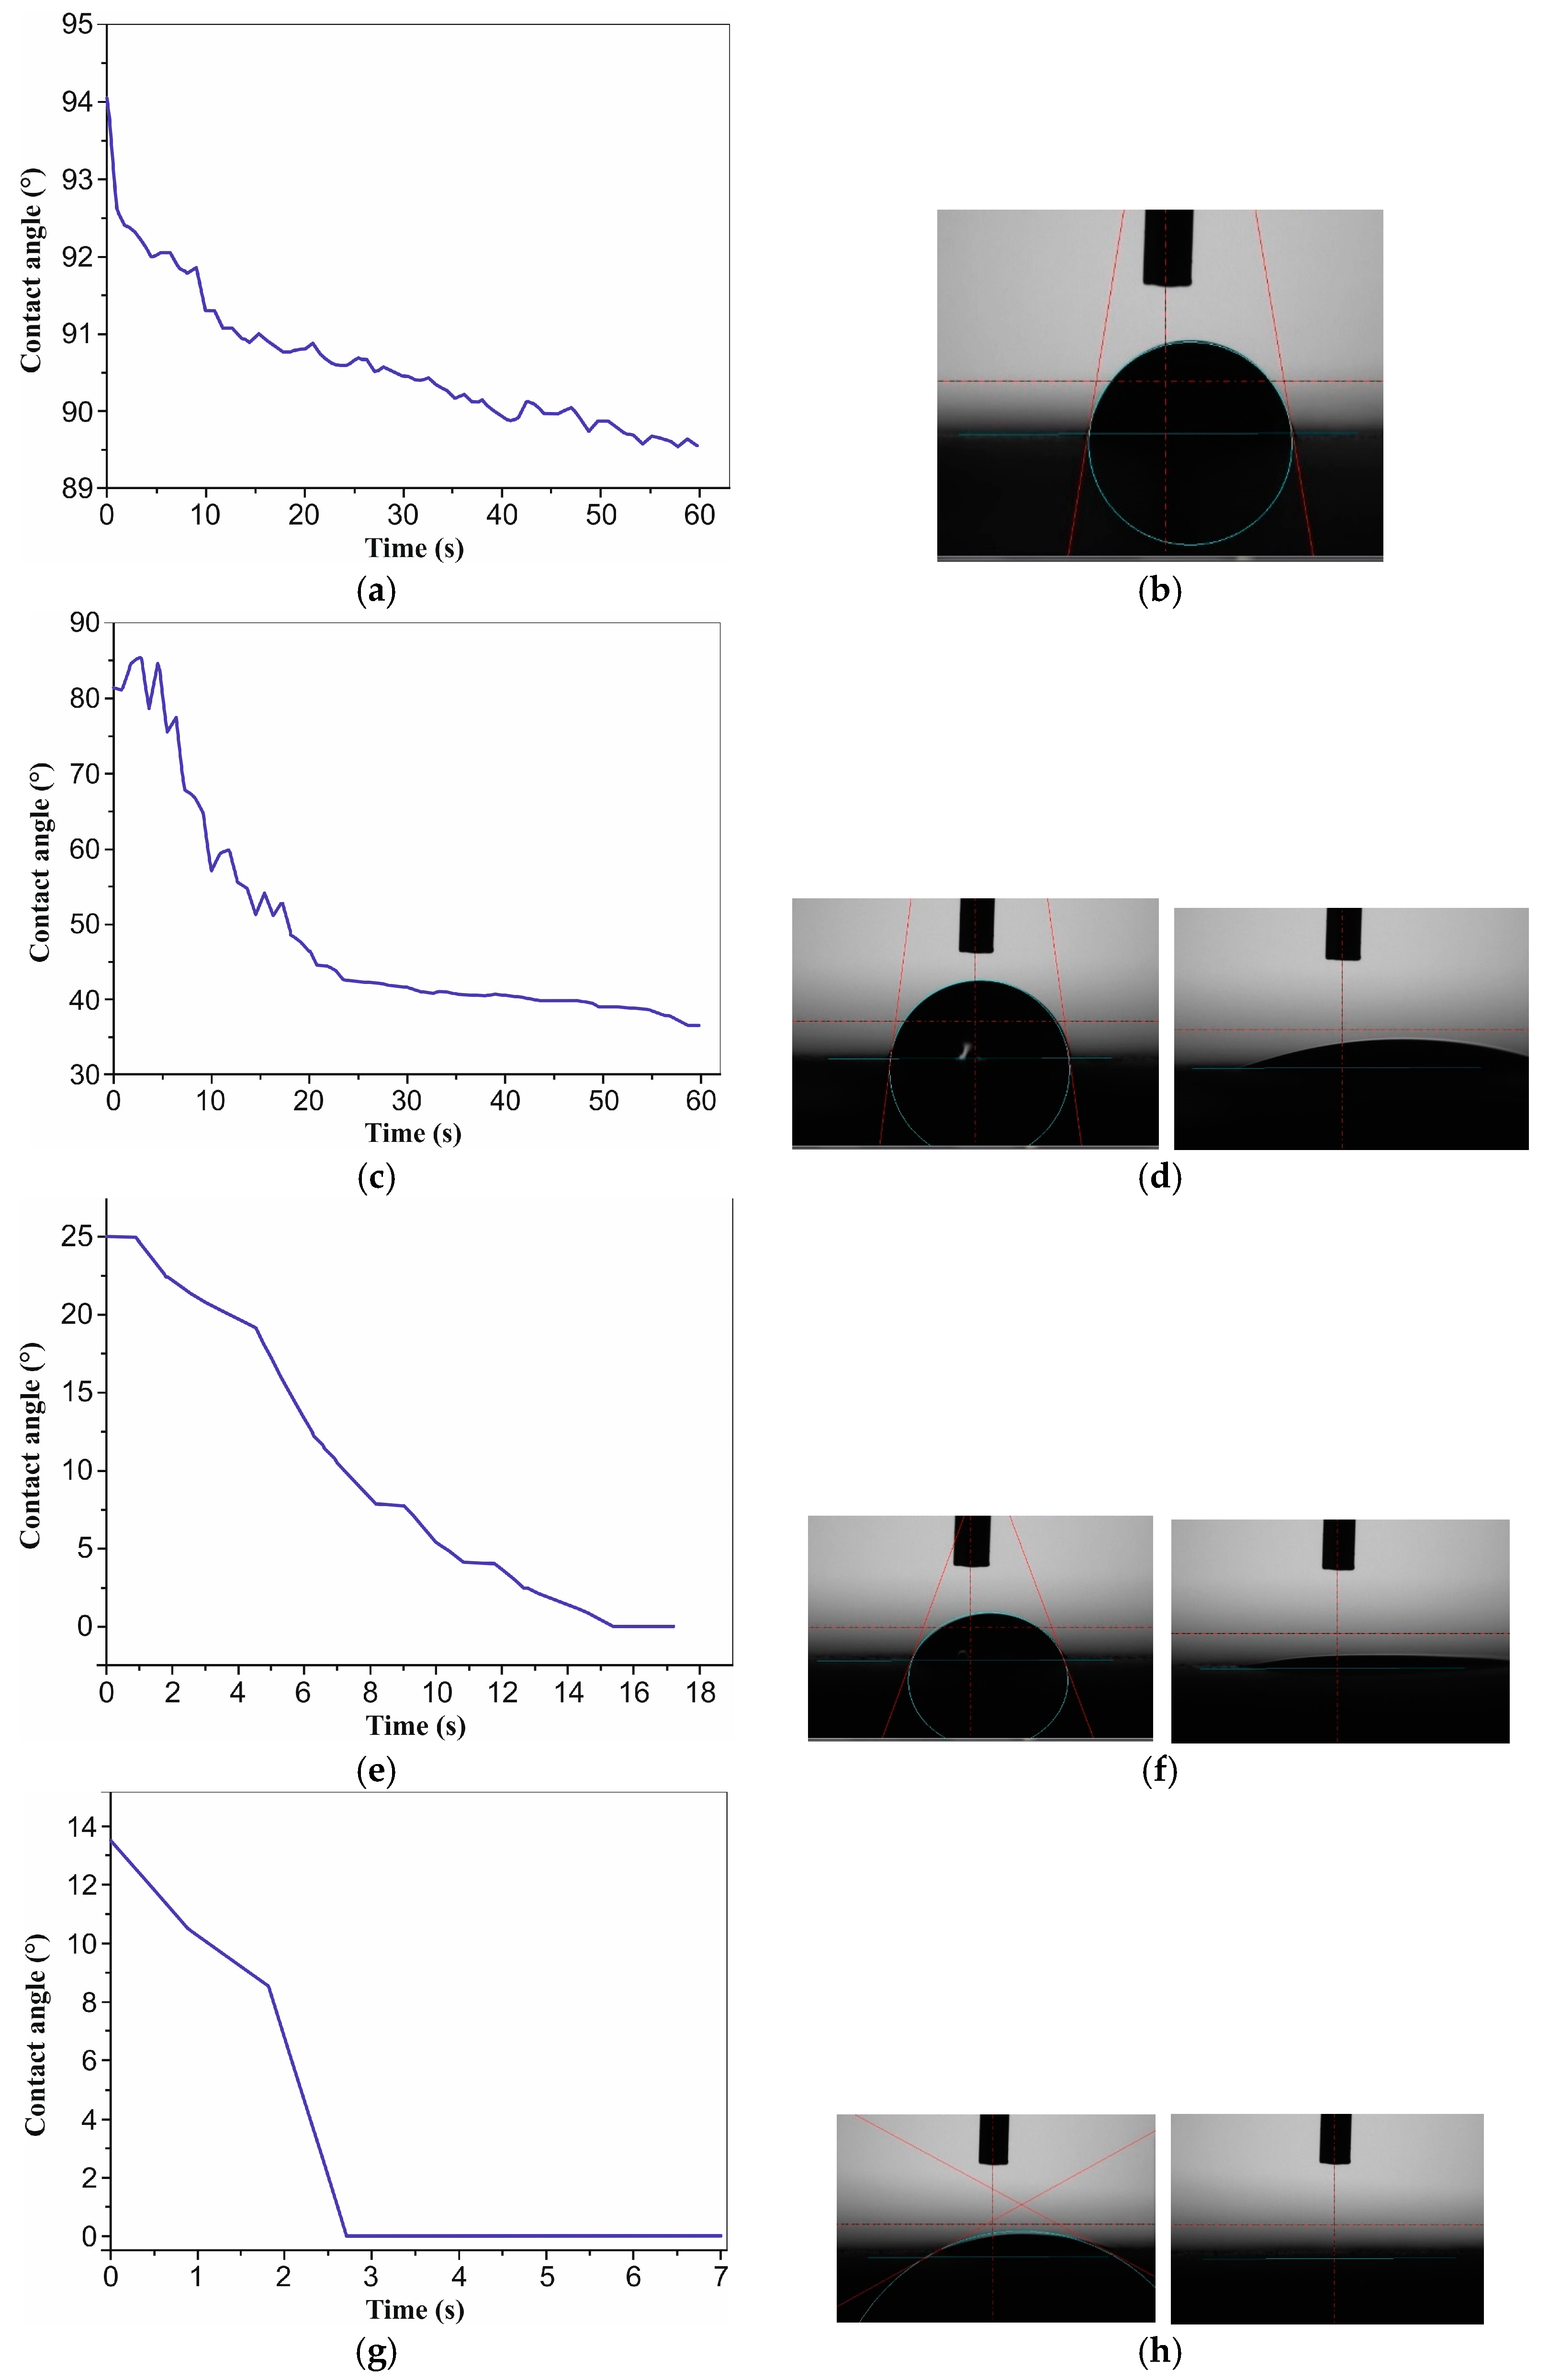
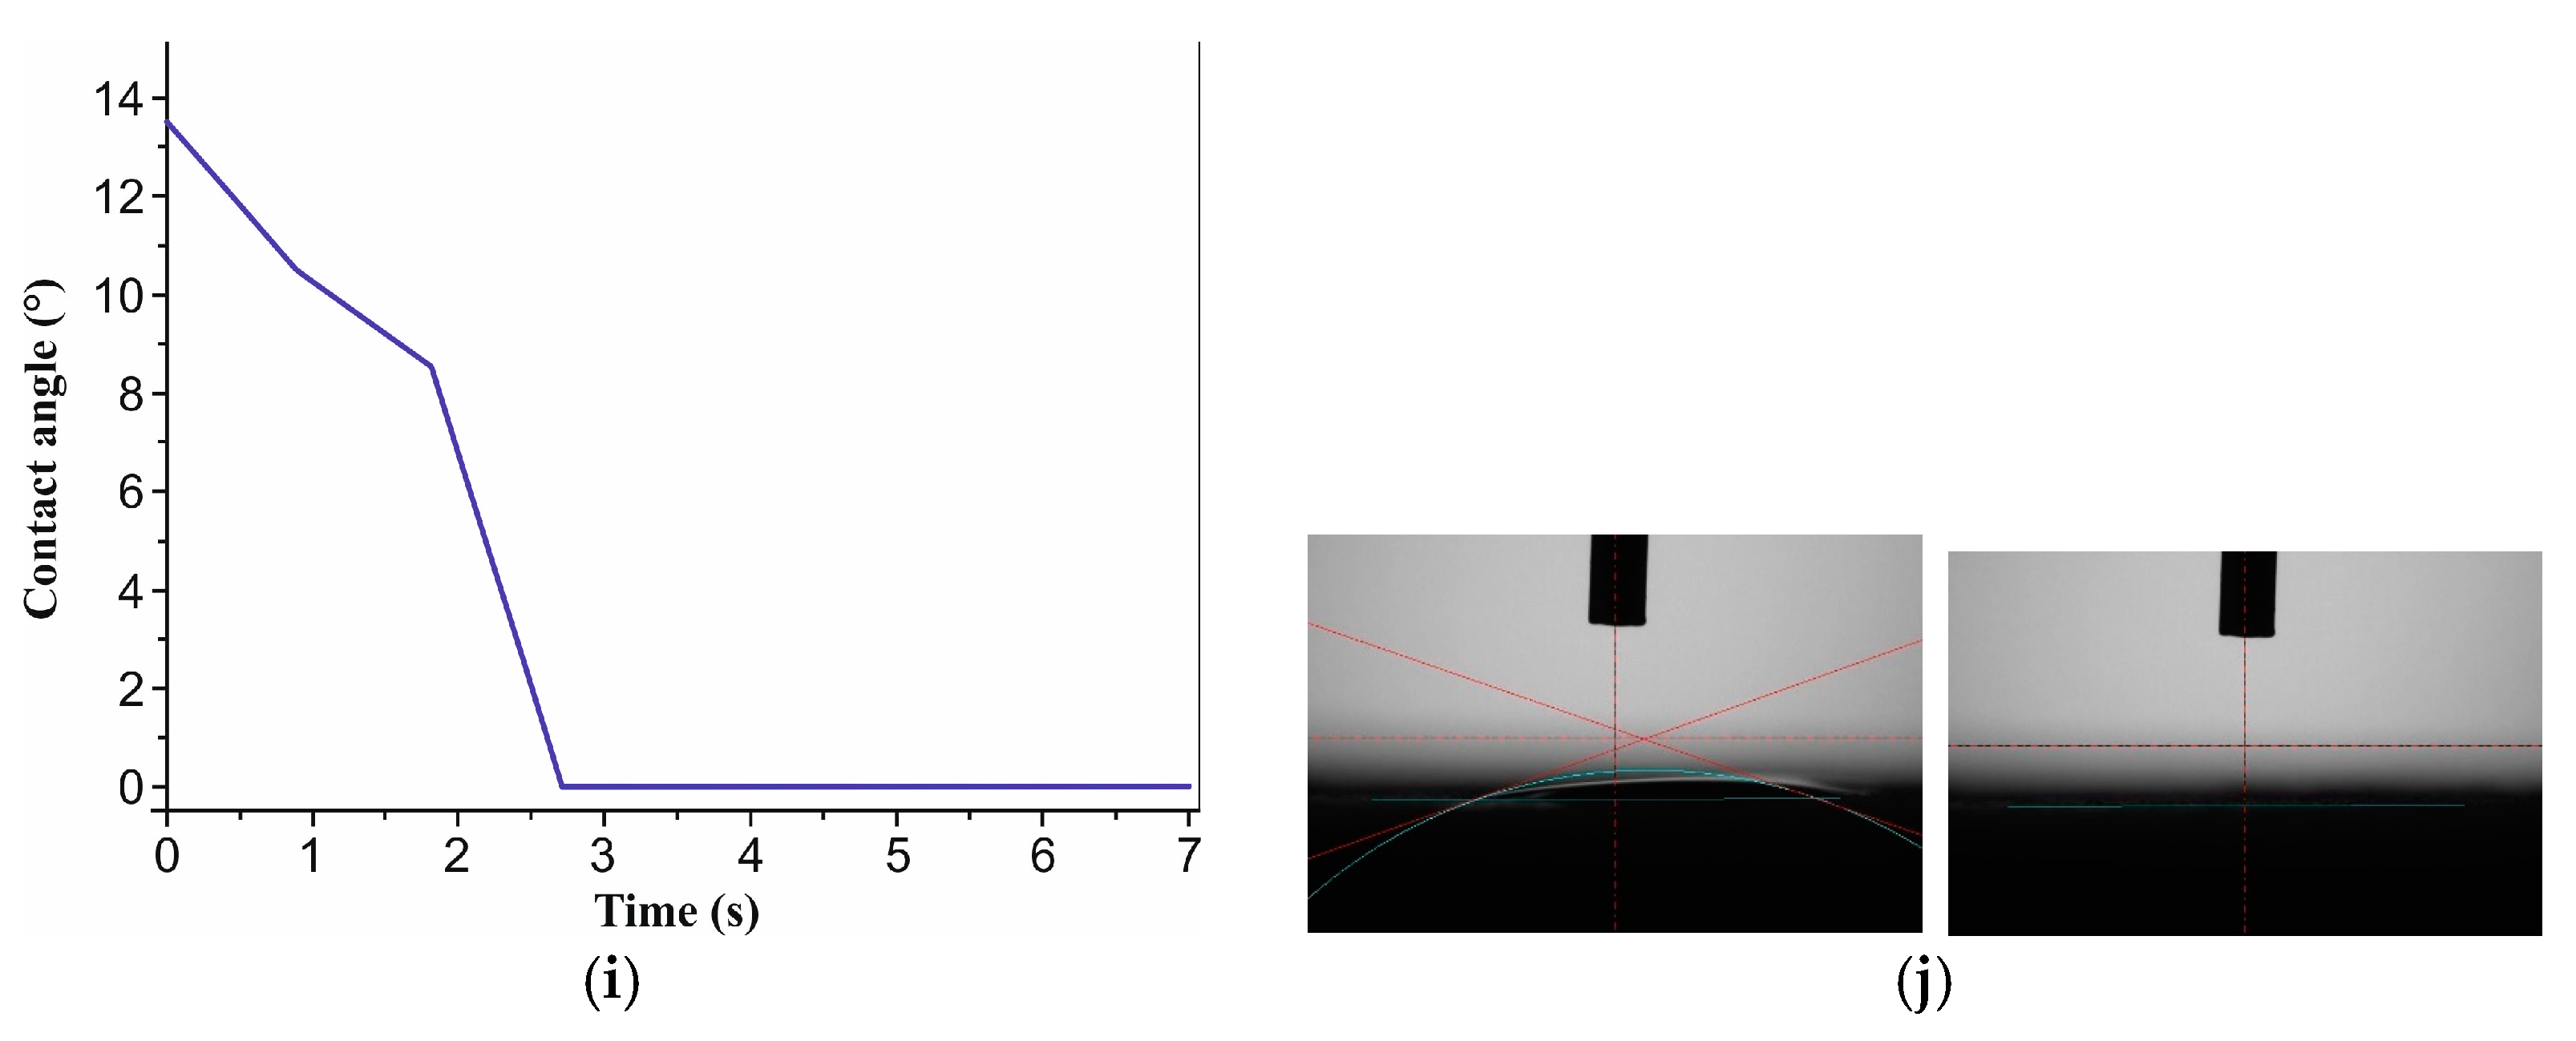
The mean distilled water wetting angle for the samples in their initial state was 87 ± 3° (Figure 3a,b), indicating a weakly hydrophobic surface (contact angle close to 90°). Surface modification via laser texturing significantly altered the wettability of the samples. For samples with a hexagonal texture created using four laser passes (4x), the mean water contact angle decreased to 38 ± 2°, reflecting a hydrophilic surface (Figure 3c,d). Notably, the initial wetting angle was approximately 85°, but within 25–30 s, the contact angle decreased further to a range of 40–20°.
In contrast, samples with a square texture processed with the same number of laser passes (4x) displayed an initial contact angle of approximately 19°. This angle rapidly declined to 0° within 16 s (Figure 3e,f), demonstrating the development of superhydrophilic properties upon surface wetting (Table 2). Similar surface behavior was observed in samples textured using six laser passes (6x), regardless of the pattern type (hexagonal or square).
However, the time required for the contact angle to reach 0° varied between the patterns. For hexagonal-patterned samples processed with four laser passes (4x), the contact angle reached 0° after 15 s (Figure 3g,h). In contrast, square-patterned samples processed with six laser passes (6x) achieved a contact angle of 0° in just 1 s (Figure 3i,j). The latter samples demonstrated absolute hydrophilic properties.
The variation in contact angle values during a single test was due to the dynamic interaction between water and the laser-textured surface. Initially, water may rest on trapped air (Cassie–Baxter state) but transitions to full wetting (Wenzel state) over time, reducing the contact angle. Laser processing alters surface energy through chemical changes and increased roughness, enhancing hydrophilicity. Capillary effects, water adsorption, and variations in texture uniformity further contribute to these changes. Additionally, environmental factors like temperature, humidity, and surface cleanliness can influence wettability, explaining the time-dependent behavior.

3.3. Wear Test

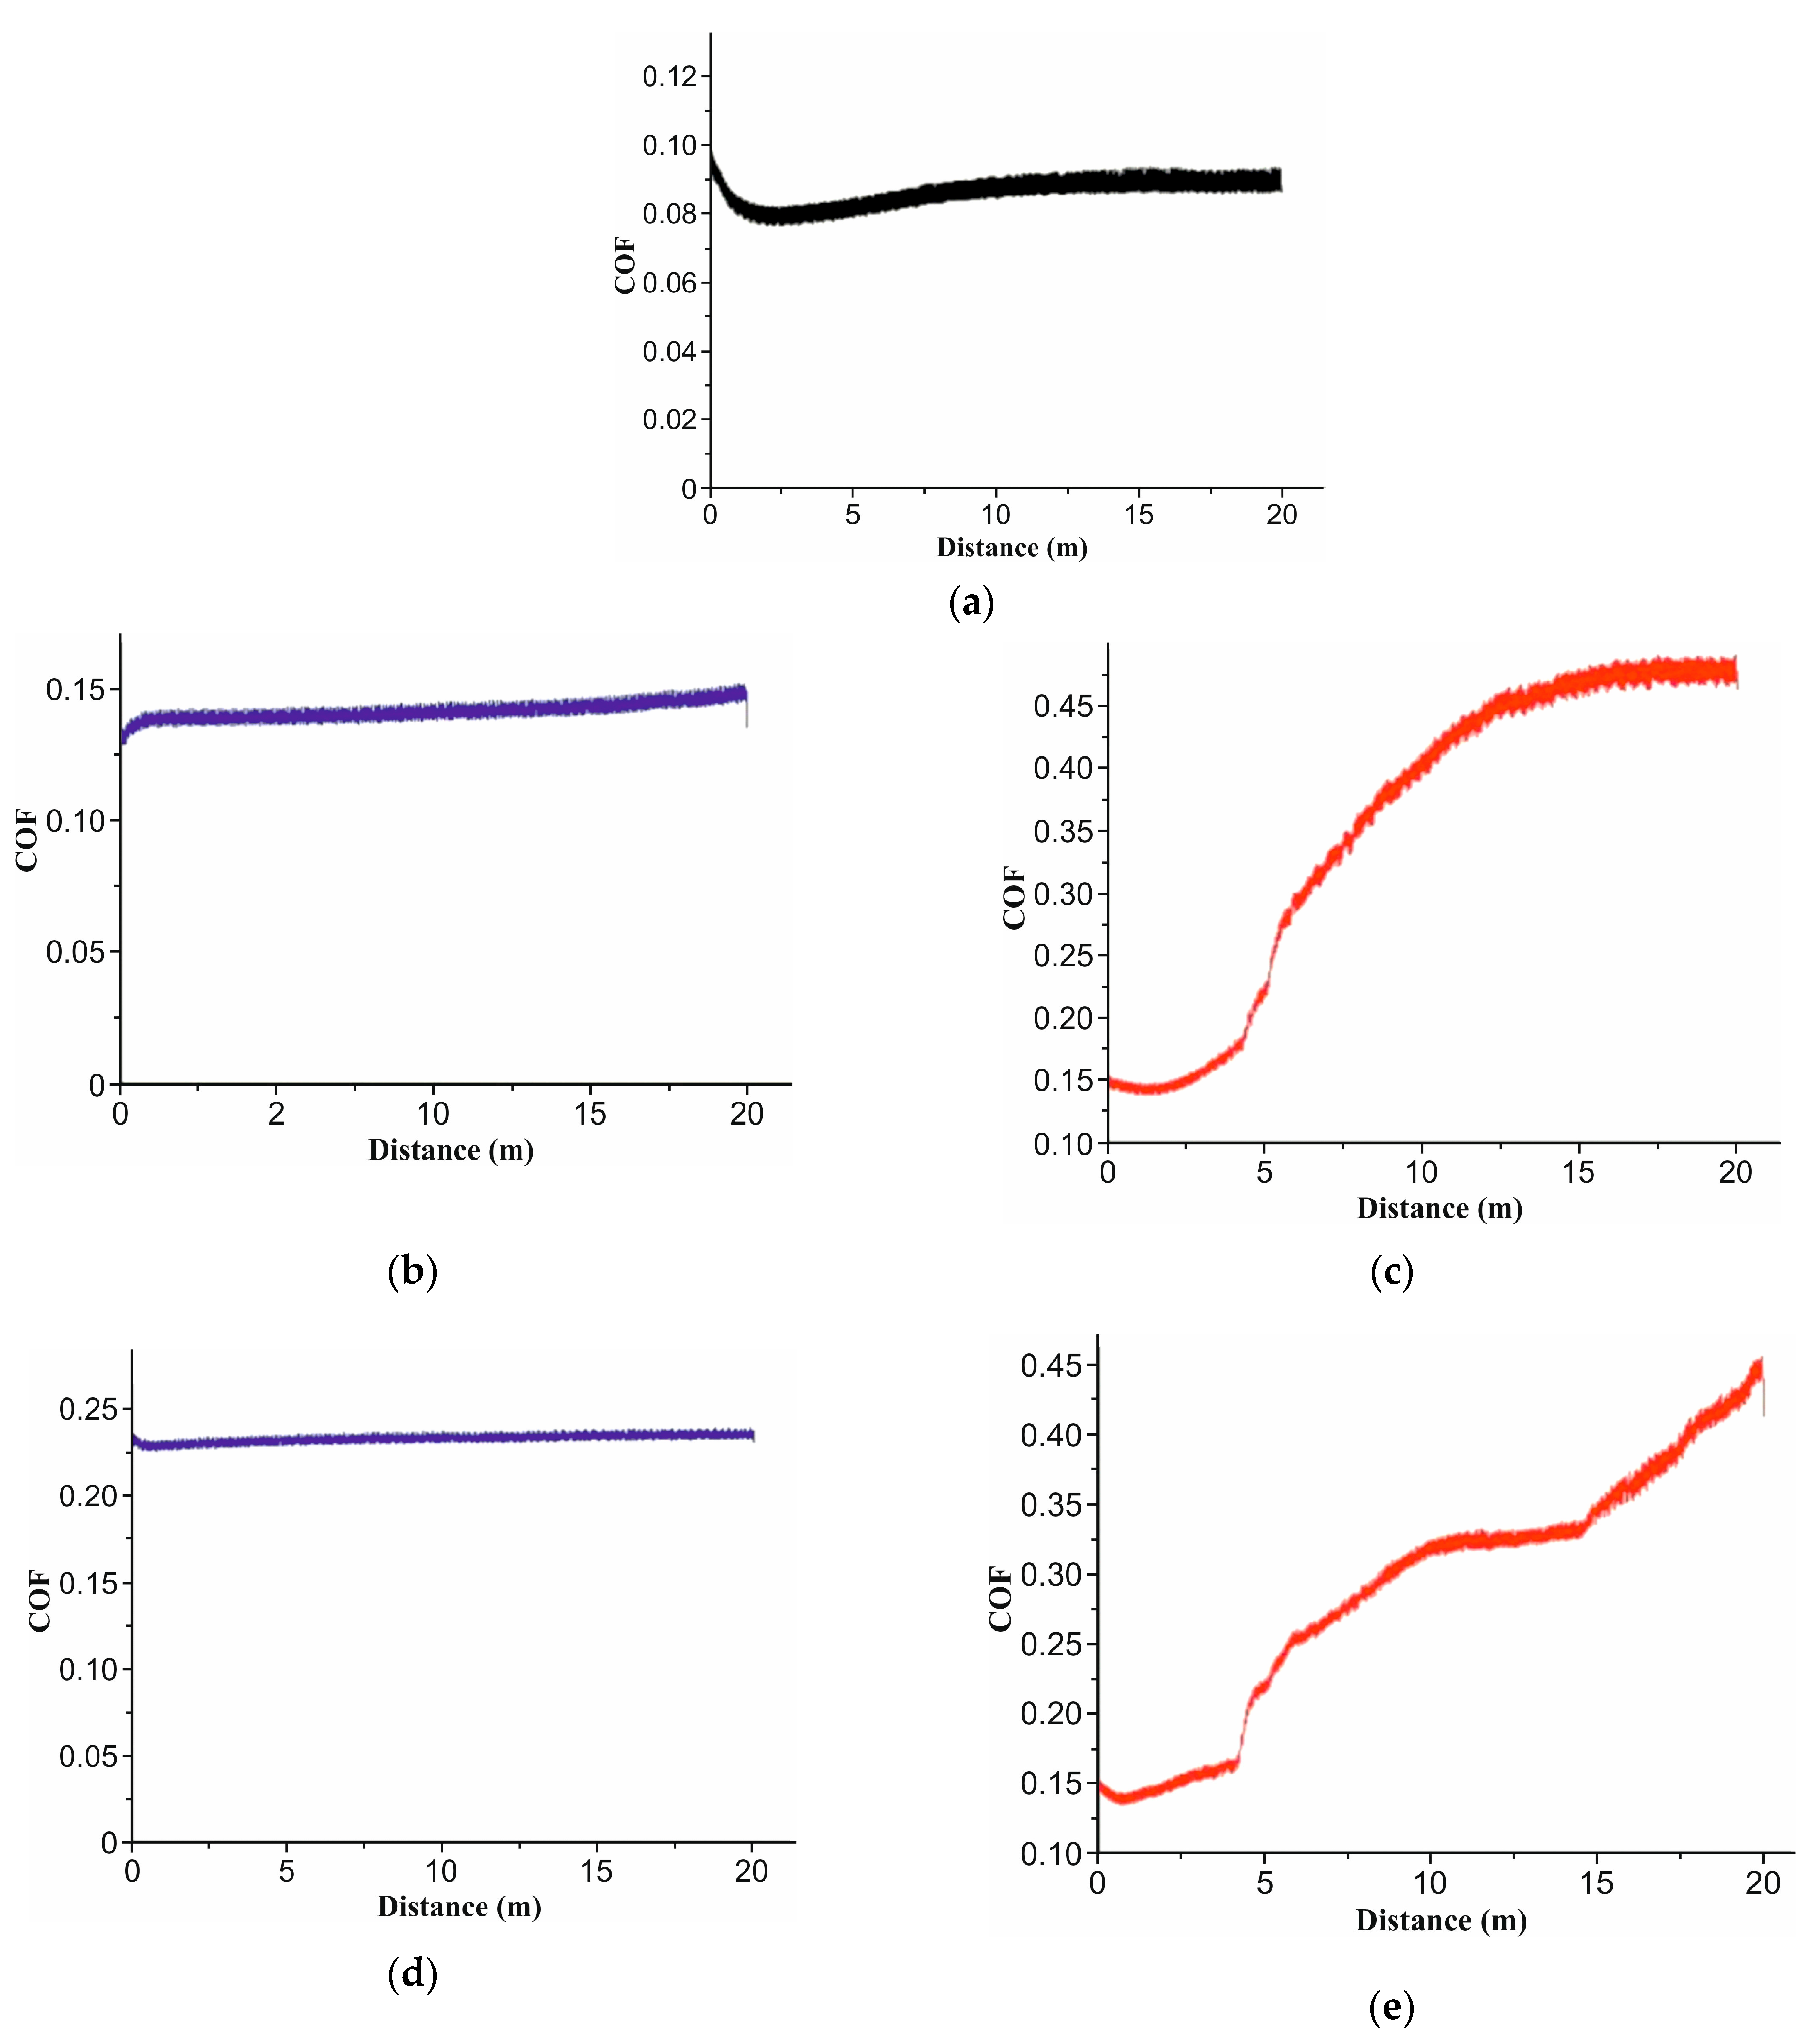
Table 3 shows the results of the coefficients of friction for both materials studied including before texturing.
The average coefficient of friction (COF) for the biodegradable biopolymer in the initial state was 0.10 (Figure 4a). For this sample group, the COF initially decreased during the wear resistance test, likely due to the presence of roughness of both surfaces (tested samples and Al2O3 ball, which was the counter specimen) in contact. The point of contact between the tested samples and the ceramic ball resulted in high local compressive pressure, leading to elevated shear stress. Consequently, the surfaces underwent sequential deformation and fragmentation, accelerating wear and undergoing a typical abrasive wear mechanism. Subsequently, the contact area increased over time along with the roughness of the friction surfaces, resulting in reduced pressure and gradual deceleration.
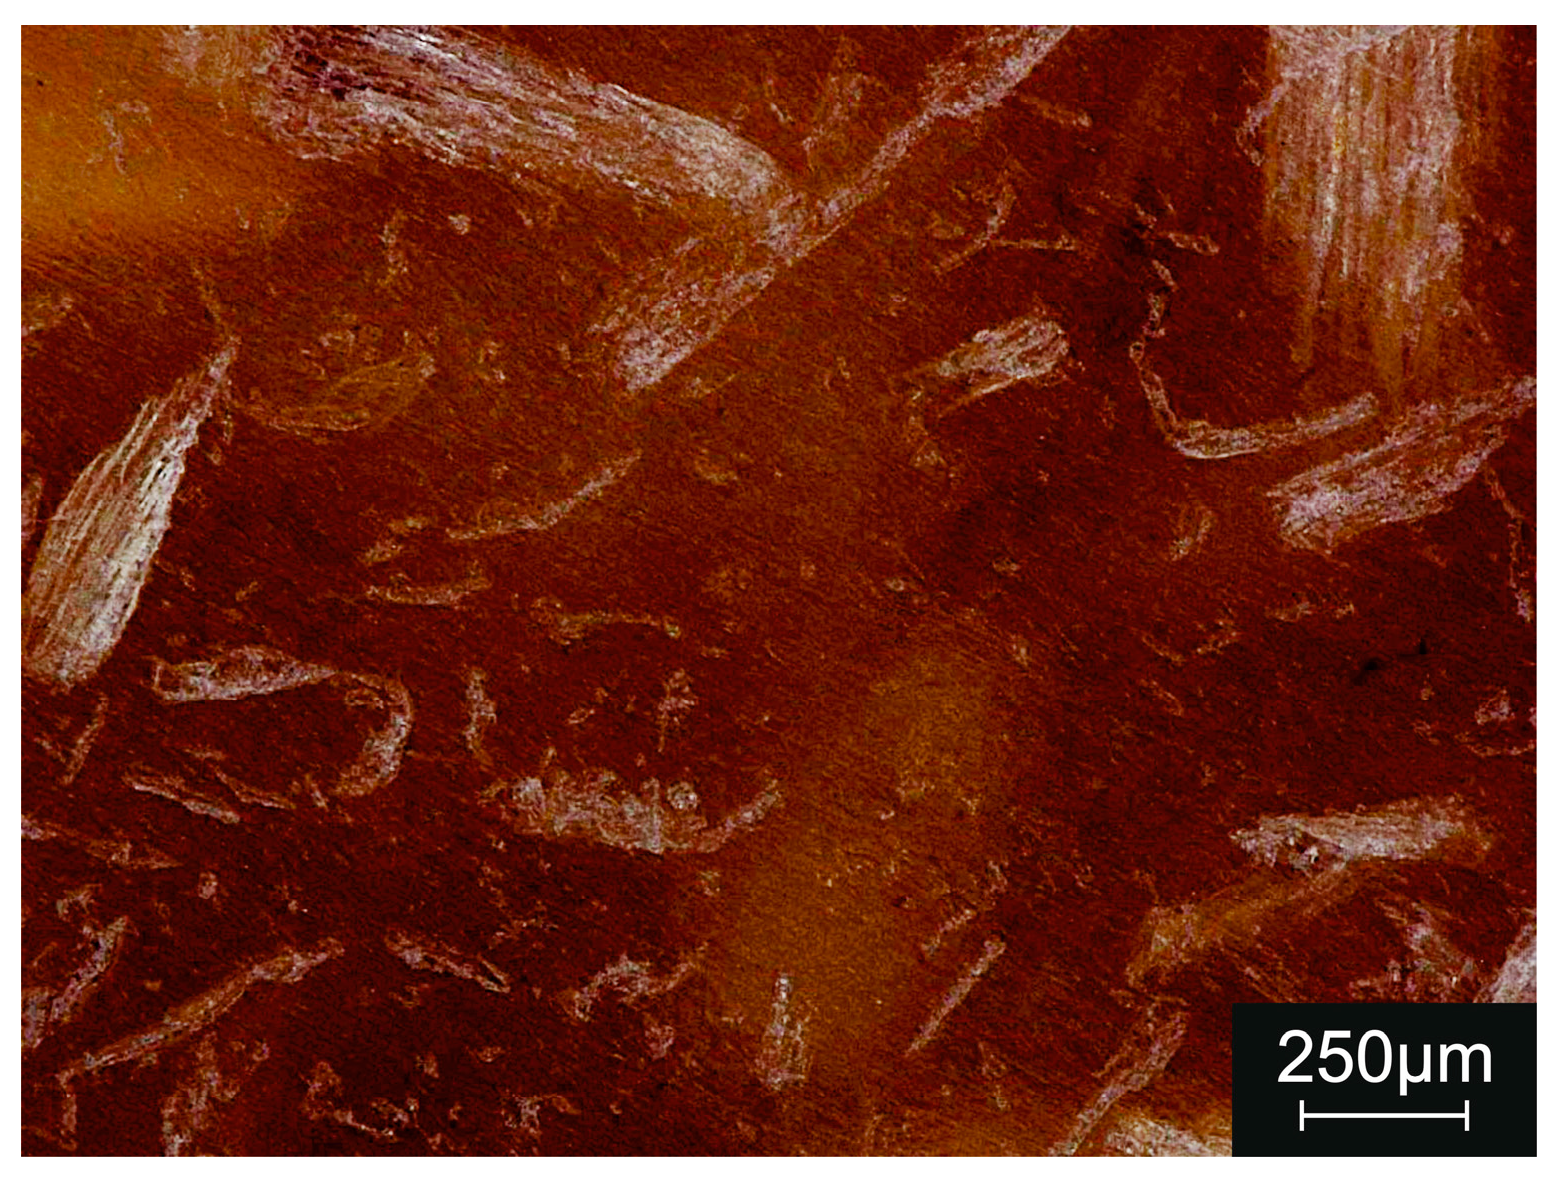
Laser surface texturing modified the wear behavior of the base material. Regardless of the specific process parameters and texture pattern, all tested samples exhibited an increase in the coefficient of friction (COF) value after undergoing the laser texturing process. Samples with an H-texture pattern (hexagonal) showed a COF increase to 0.26 after six passes, while those with an S-texture pattern (square) reached a COF of 0.51 after four passes. Notably, the COF for the S-texture pattern samples increased from 0.15 to 0.5 in the initial stages of the wear resistance test (Figure 4c), suggesting the removal of the textured pattern. Microscopic observation (Figure 5b–e) confirmed this removal. The findings indicated that under the proposed wear test conditions, the textured pattern was removed from most of samples during the test for both the hexagonal texture (Figure 5b) and square texture (Figure 5e).

3.4. Degradation Test

Based on the obtained weight measurements before and after the degradation test, an increase in weight was observed for all tested samples, 0.036 g in case of four passes and 0.039 in case of six texturing passes, as shown in Table 4. Generally, an increase in the weight of polymer materials after a degradation test indicates incomplete degradation; if the degradation process is not fully completed, residues from partially degraded polymer molecules may remain, contributing to a weight increase. However, based on the microscopic observation of all samples after the degradation test (Figure 6, Figure 7 and Figure 8), no degradation products were visible. Interactions of polymer-based materials with the testing environment (exposure to degradation conditions) might cause chemical reactions that result in weight gain. In some cases, degradation processes can result in the cross-linking of polymer chains, which can also increase the weight of the material.
Based on the results of the weight measurements before and after the degradation test, a slight increase in weight was observed for all tested samples (Table 4). The results of the degradation test with the Arbofill Fichte indicated that the material was highly resistant to the applied environmental conditions. As shown in our previous work [58], based on thermogravimetric analysis (TGA), it was found that Arbofill Fichte exhibits excellent thermostability up to 139 °C, with a weight loss only of 1.3%, probably caused by water evaporation from the material’s basic matrix. It can be concluded that laser texturing does not affect the degradation stability of Arbofill Fichte, and the thermal effect caused in the material after texturing occurs in the marginal areas of the textured zone. The laser beam was characterized by a Gaussian spatial fluence profile. The material’s surface starts melting and vaporizing in the peak on-axis Gaussian beam [66]. However, the microscopic observation of all of the samples after the degradation test (Figure 6, Figure 7 and Figure 8) revealed no visible degradation products. This suggested that other mechanisms contributed to the observed weight changes. The slight weight increase was likely due to minimal moisture absorption during the high-humidity phase of the test, suggesting that Arbofill Fichte exhibits low water absorption or hydrophilic behavior. The absence of observable degradation products under the microscope indicated that the material did not undergo significant chemical or structural breakdown. This suggests a high level of stability of the material, likely attributed to the robustness of its polymer matrix or strong interfacial bonding with its fillers. In addition, the interaction between polymer-based materials and the testing environment under degradation conditions could lead to chemical reactions, such as oxidation or hydrolysis, which may result in the formation of additional compounds or absorbed species, thereby increasing the weight. Furthermore, in some cases, degradation processes can induce the cross-linking of polymer chains. This phenomenon involves the formation of new covalent bonds between polymer chains under specific conditions, such as thermal or oxidative stress, which can increase the material’s weight.

3.5. DSC Analysis

The DSC thermograms recorded during heating are illustrated in Figure 9.
In the temperature range between RT and 130 °C, the base material and the 4x and 6x samples were thermally stable. For all samples, the endothermic minimum on the DSC charts recorded during heating was associated with the melting process [67].
The melting start temperature, Ts; the temperature where 50% of the sample melted, T50; the melting end temperature, Tf; as well as the amount of heat absorbed are shown in the Table 5.
According to the data in Table 5, during heating, the endothermic peaks recorded for the base material and the material after four texturing passes (4x/hexagonal, 4x/square) were similar. In the case of six texturing passes (6x/hexagonal, 6x/square), the start melting temperatures shifted to lower values, but the T50 temperature was appropriate. Also, in this case, more energy was needed for the melting process.

3.6. Topography

3.6.1. Topographic Analysis of Biodegradable Polymer with Hexagonal Texture

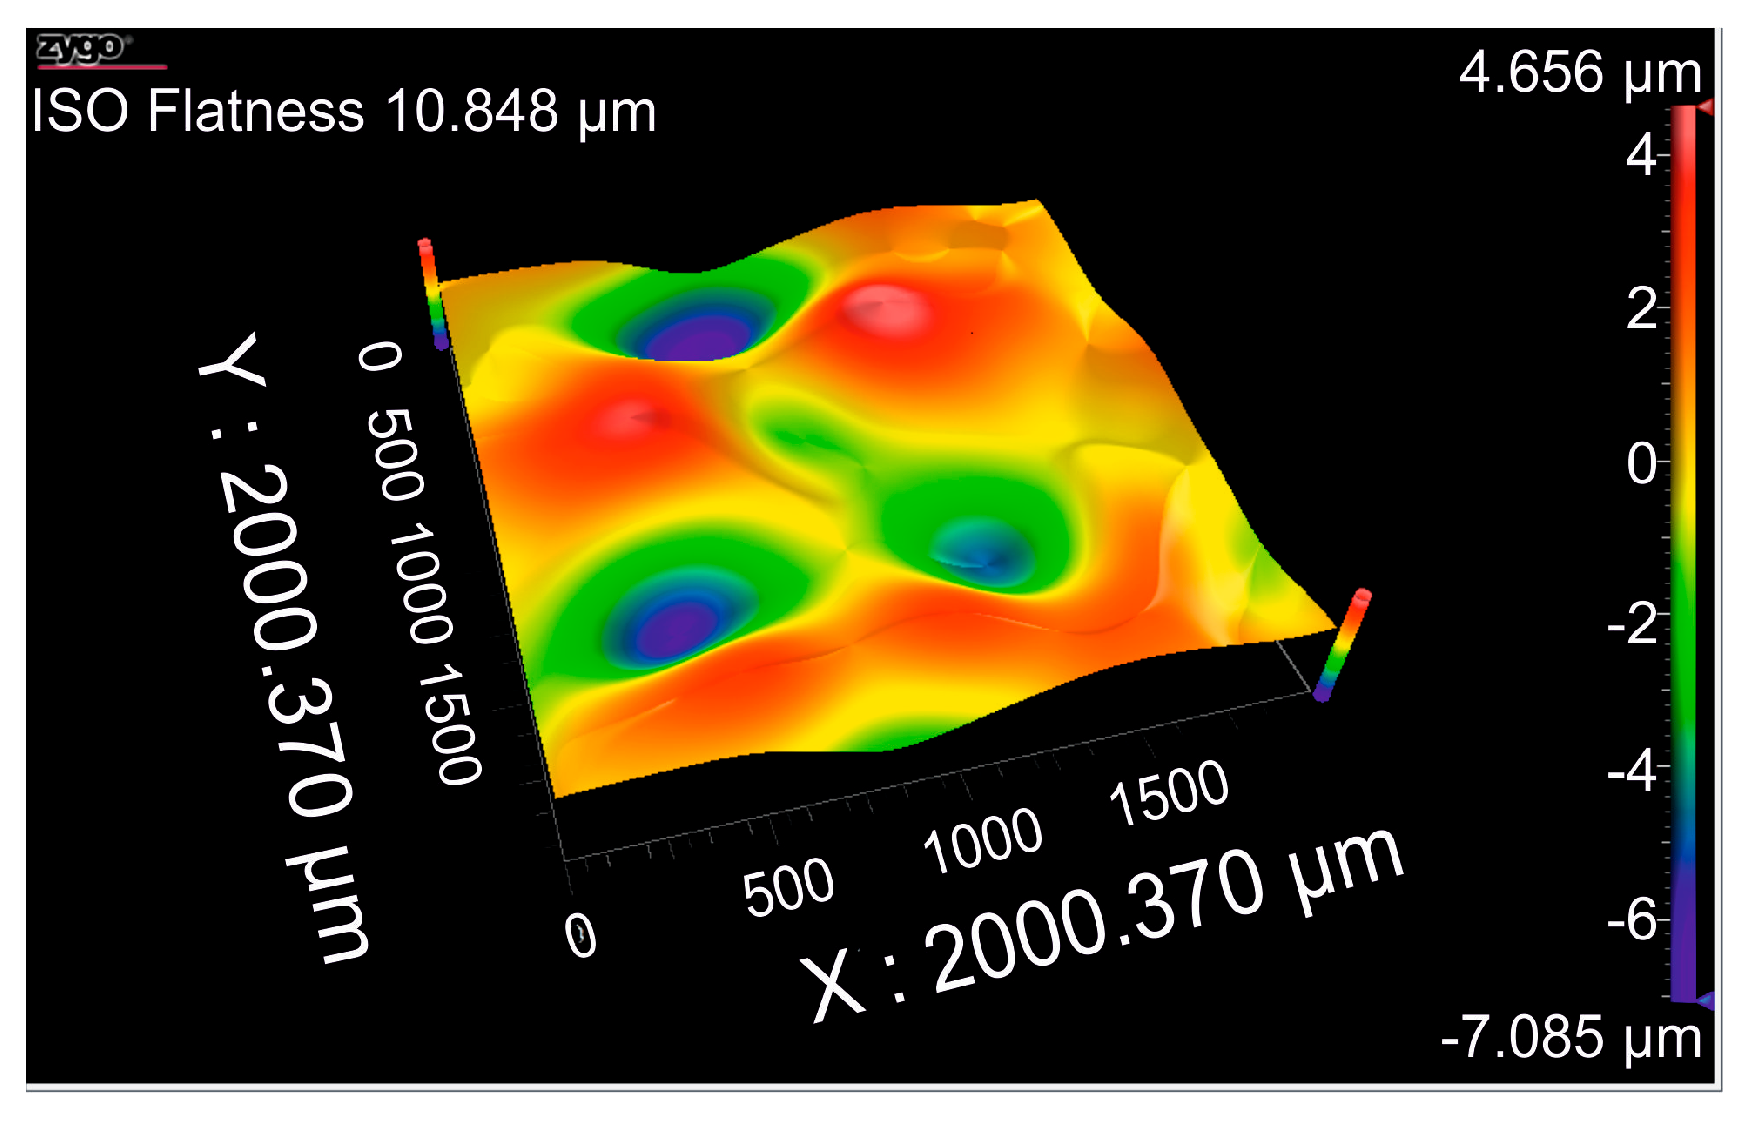
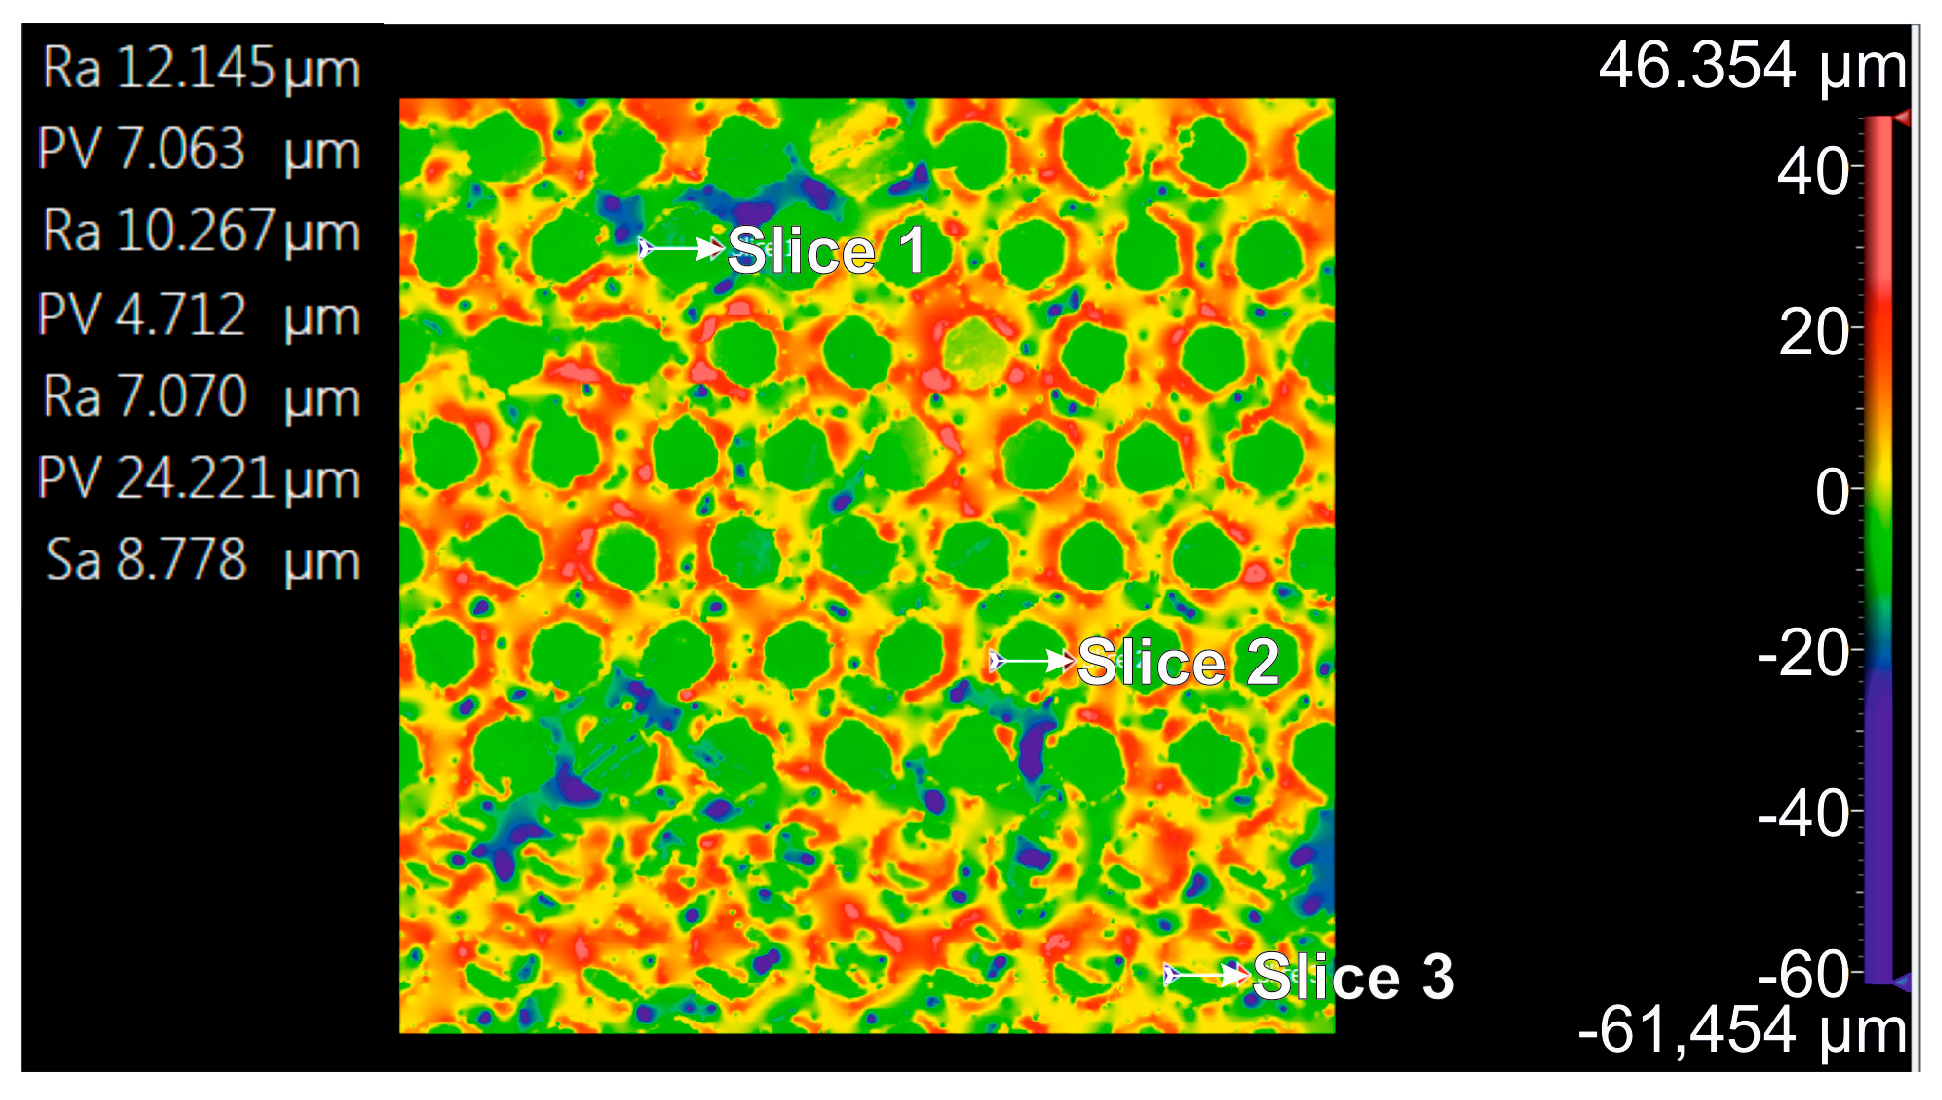
In the case of the Arbofill Fichte material with a hexagonal texture obtained with four passes, the largest distance between the lowest and the highest peak (Rz) for the three sections considered is shown in Figure 10, and, in Table 6, the corresponding statistical data are presented. The root mean square (Rq) was the highest (10.22 µm) for slice 2 while the maximum Rz of 64.88 µm was found for slice 3. Figure 11 displays the flatness deviation following texturing, which, according to ISO Flatness, was 10.848 µm. The roughness (Ra) values for the three selected reference lines are displayed in Figure 12, and they only match the hexagonal surfaces that were created without accounting for the spacing between hexagons. With the greatest values of Ra = 12.145 µm (slice 1) and Rz = 24.221 µm in the case of slice 3, the resulting Sa value was 8.778 µm.
In Figure 13, the values of the interstices on the X (length) and Y (depth) axes of the 4X processed material are presented. From the analysis of the presented graphs, we can observe that the stability of the processing with four passes (4x) generated a large variability between sections, particularly along the X axis (from 57.70 μm up to 78.15 μm).
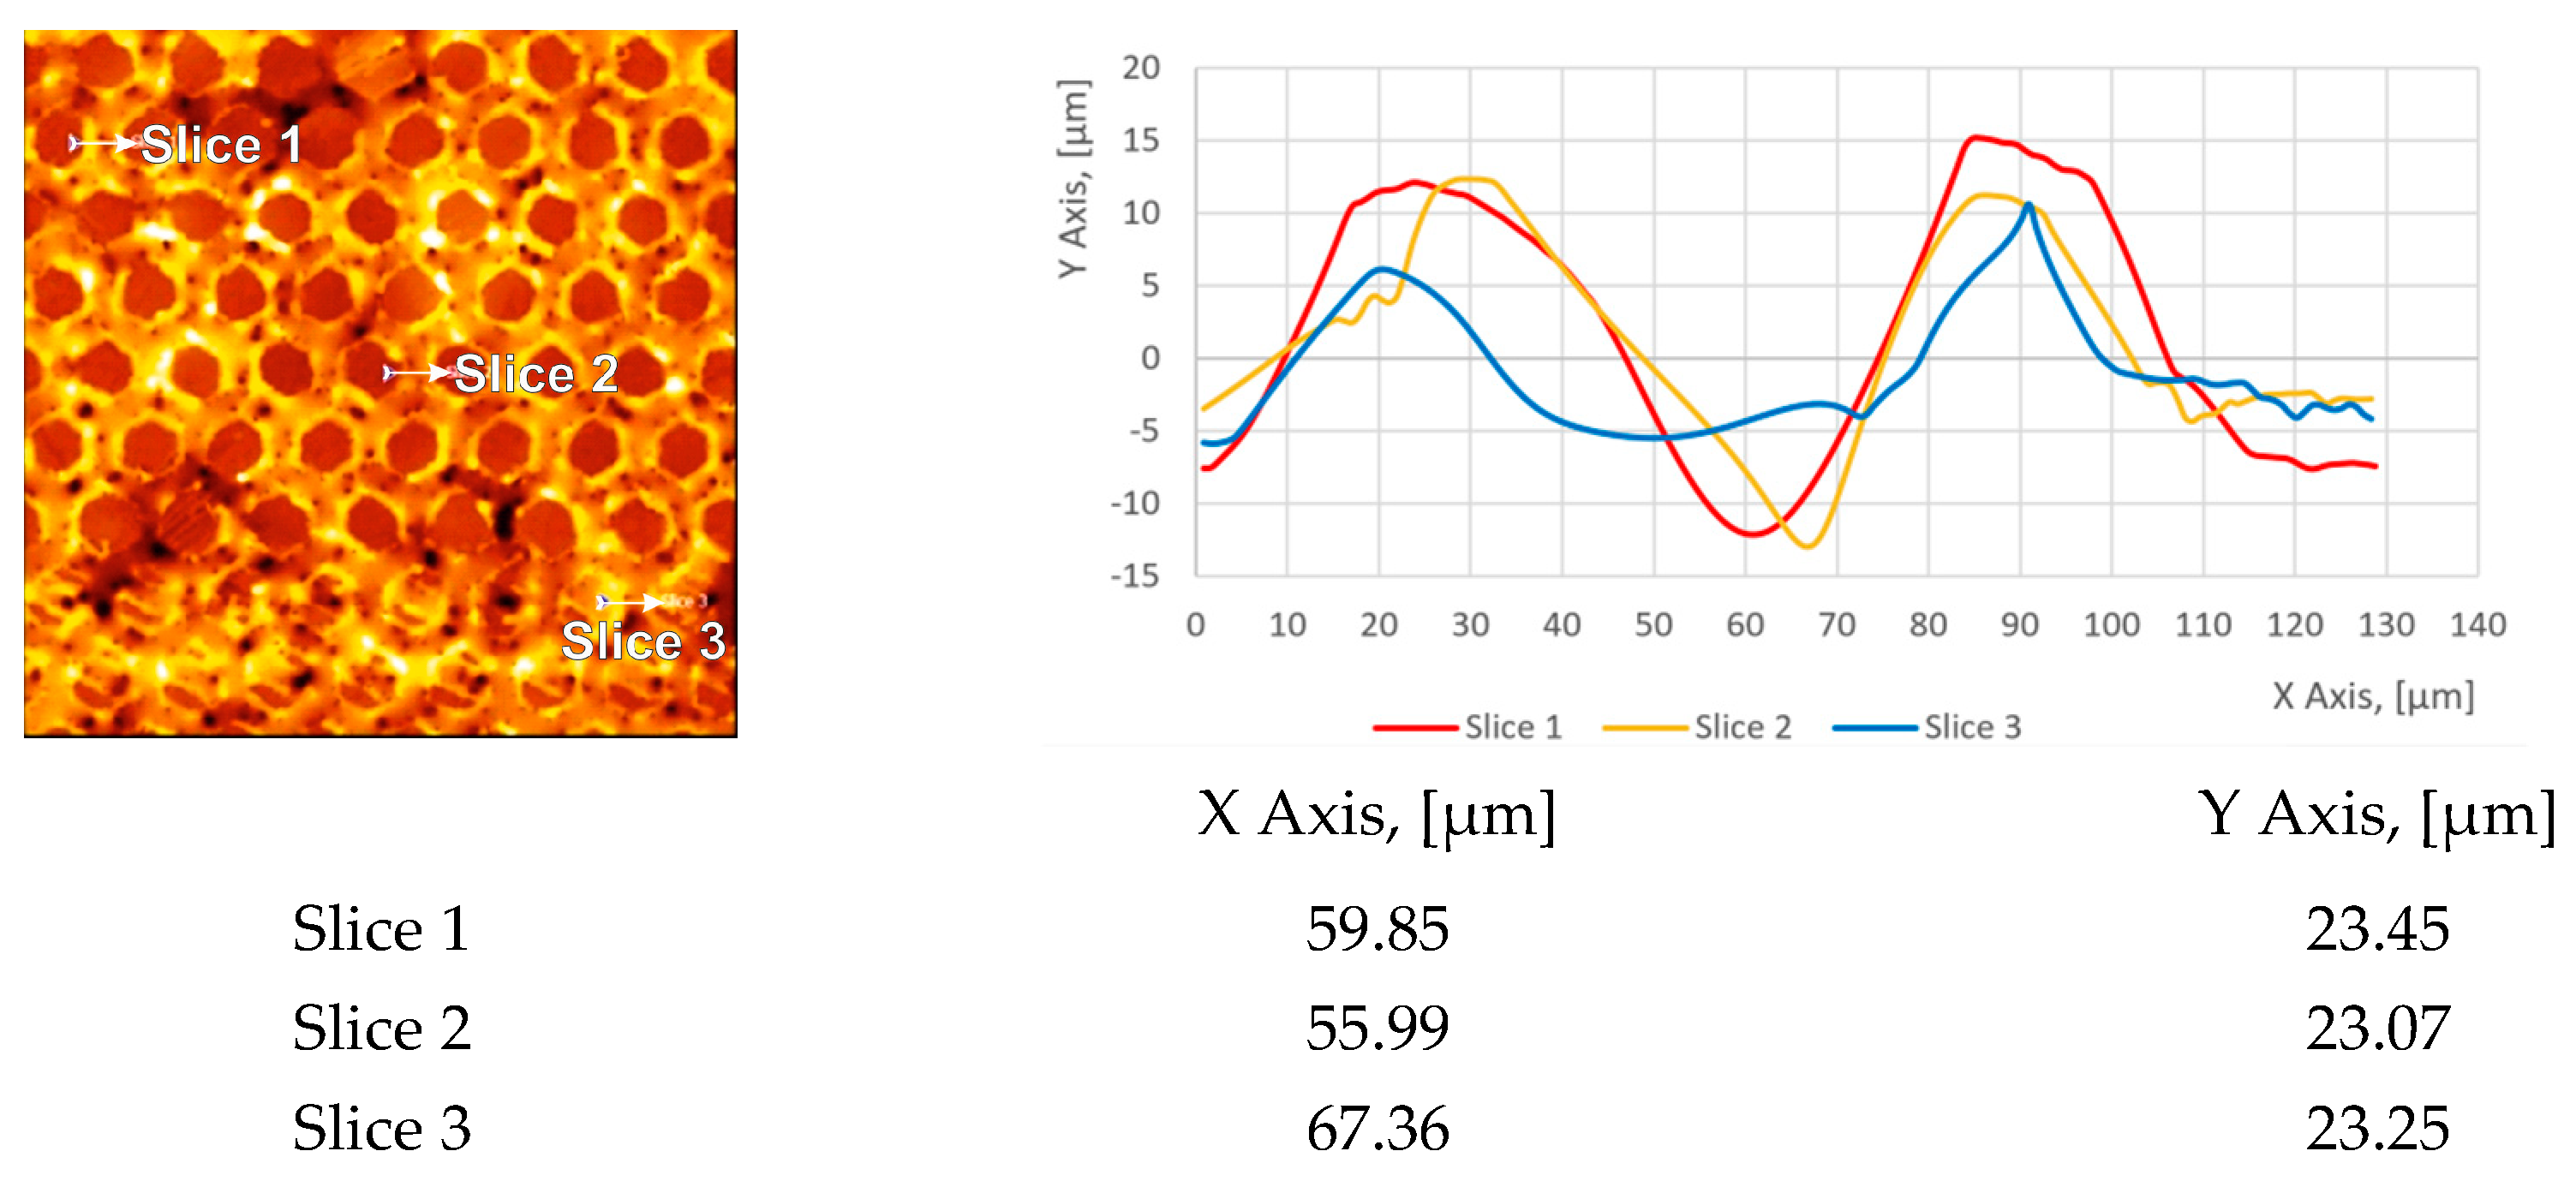
In the case of the hexagonal texture obtained with six passes, the largest distance between the lowest and the highest peak (Rz) for the three sections considered is shown in Figure 14, and, in Table 7, the corresponding statistical data are presented. Moreover, the mean Rz was 69.16 ± 25.58 µm and 8.352 ± 1.406 µm for the Rq.
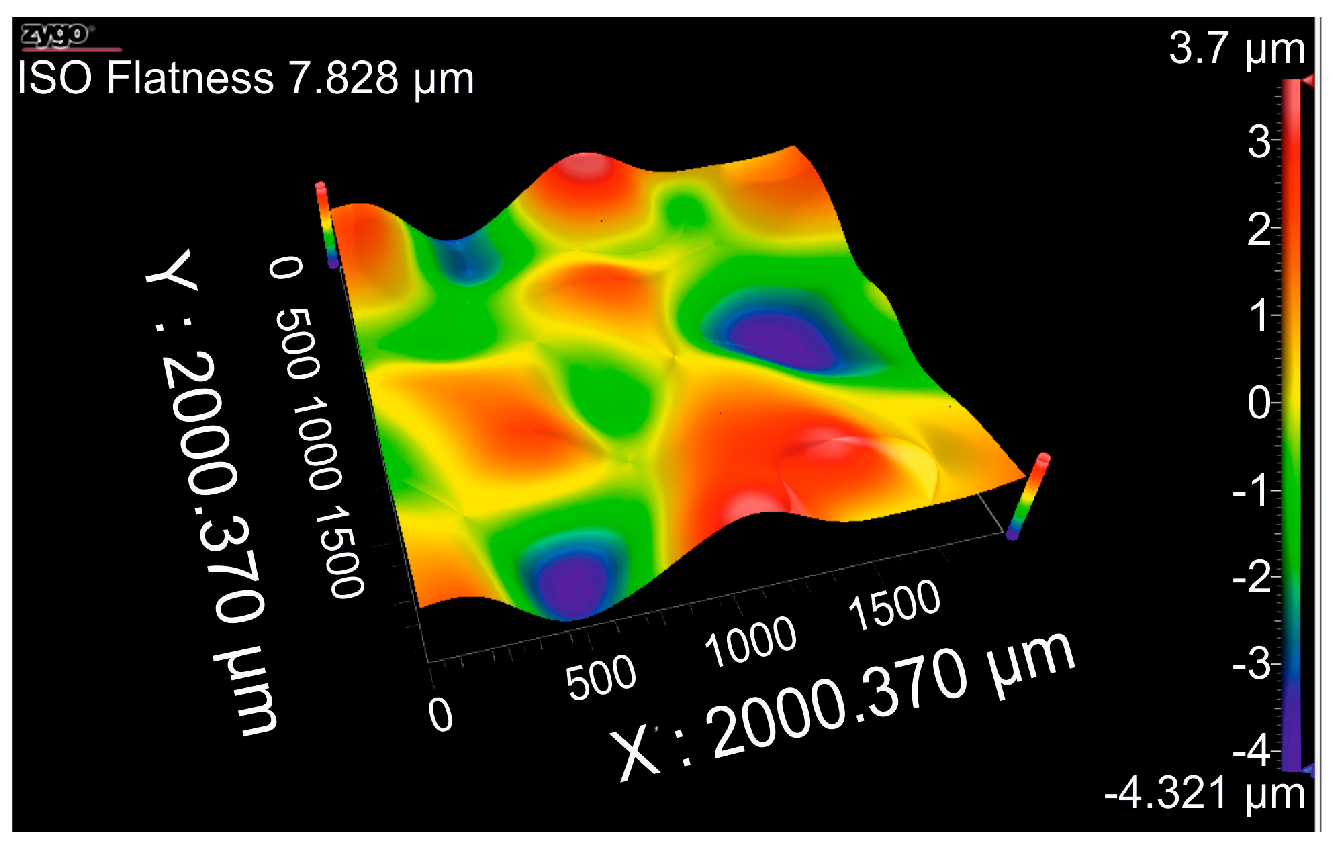
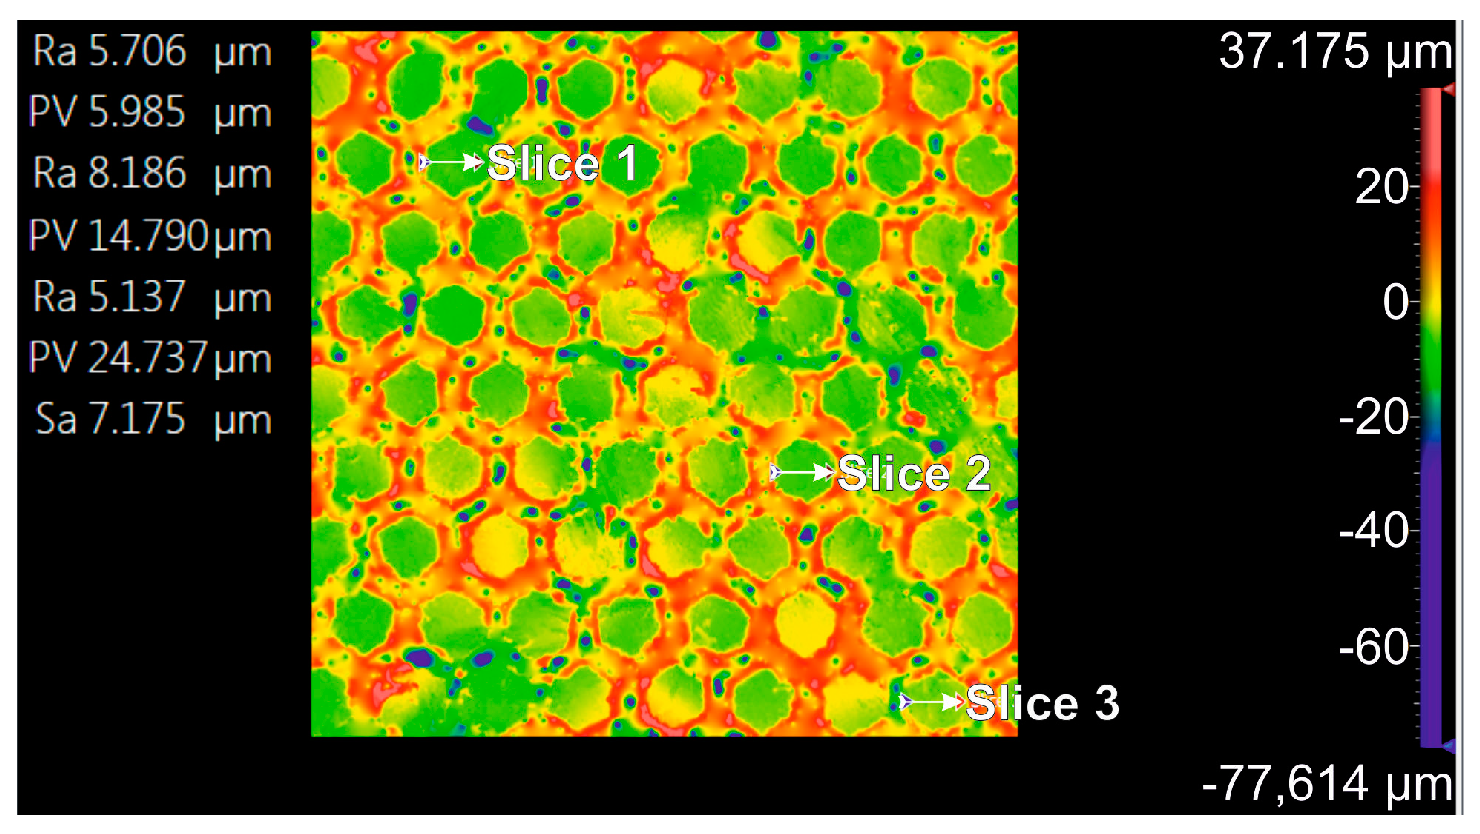
The flatness deviation after texturing is shown in Figure 15, with a value of 7.828 µm according to ISO Flatness. Figure 16 shows the roughness values Ra for the three reference lines chosen, which corresponded only to the hexagonal surfaces obtained without taking into account the distance between the hexagons. Thus, the Sa obtained had a value of 7.175 µm, with the highest Ra of 8.186 µm and Rz of 14.79 µm, both for slice 2.
In Figure 17, the values of the interstices on the X (length) and Y (depth) axes of the 6X processed material are presented. From the analysis of the presented graphs, we can observe that increasing the number of phases to 6X led to an improvement in process stability. Variations were reduced, with maximum differences of ~11 μm compared to ~20 μm with the 4x process. Concerning the repeatability of the process, the increase to 6x passes led to a decrease in variation.
In conclusion, regarding the texturing passes (4x and 6x), we can say that an increase in the passes from 4x to 6x led to a reduction in variability and improved the uniformity of the texture, which led to better process control.

3.6.2. Comparative Analysis Between Two Processing Models: 4x_H/6x_H

Comparatively analyzing the 4x and 6x laser texturing passes, the following can be stated:
In the case of the X axis, with four passes (4x), the X-axis distances varied between 57.70 μm and 78.15 μm, suggesting a large extension of the structure along this axis in certain sections. Increasing the number of passes to six (6x) caused the distances to vary between 55.09 μm and 67.36 μm, with greater compression along the X axis compared to 4x but with maximum variation in channel width in slice 3, indicating high variability in this case.
In the case of the Y axis, with four passes (4x), the distances varied between 19.66 μm and 26.51 μm, indicating a gradual compression in the vertical axis, with significant variation between the sections. At six passes (6x), the distances were approximately constant between 23.05 μm and 23.45 μm, suggesting superior stability along the Y (depth) axis, with no significant variation between the sections.
This analysis indicates that the material after six passes was more uniform along the Y (depth) axis, while the material underwent more changes along the vertical axis after four passes. The X-axis structure was variable in both cases but with higher compression after six passes.

3.6.3. Topographic Analysis of Arbofill Fichte Material with a Square Texture

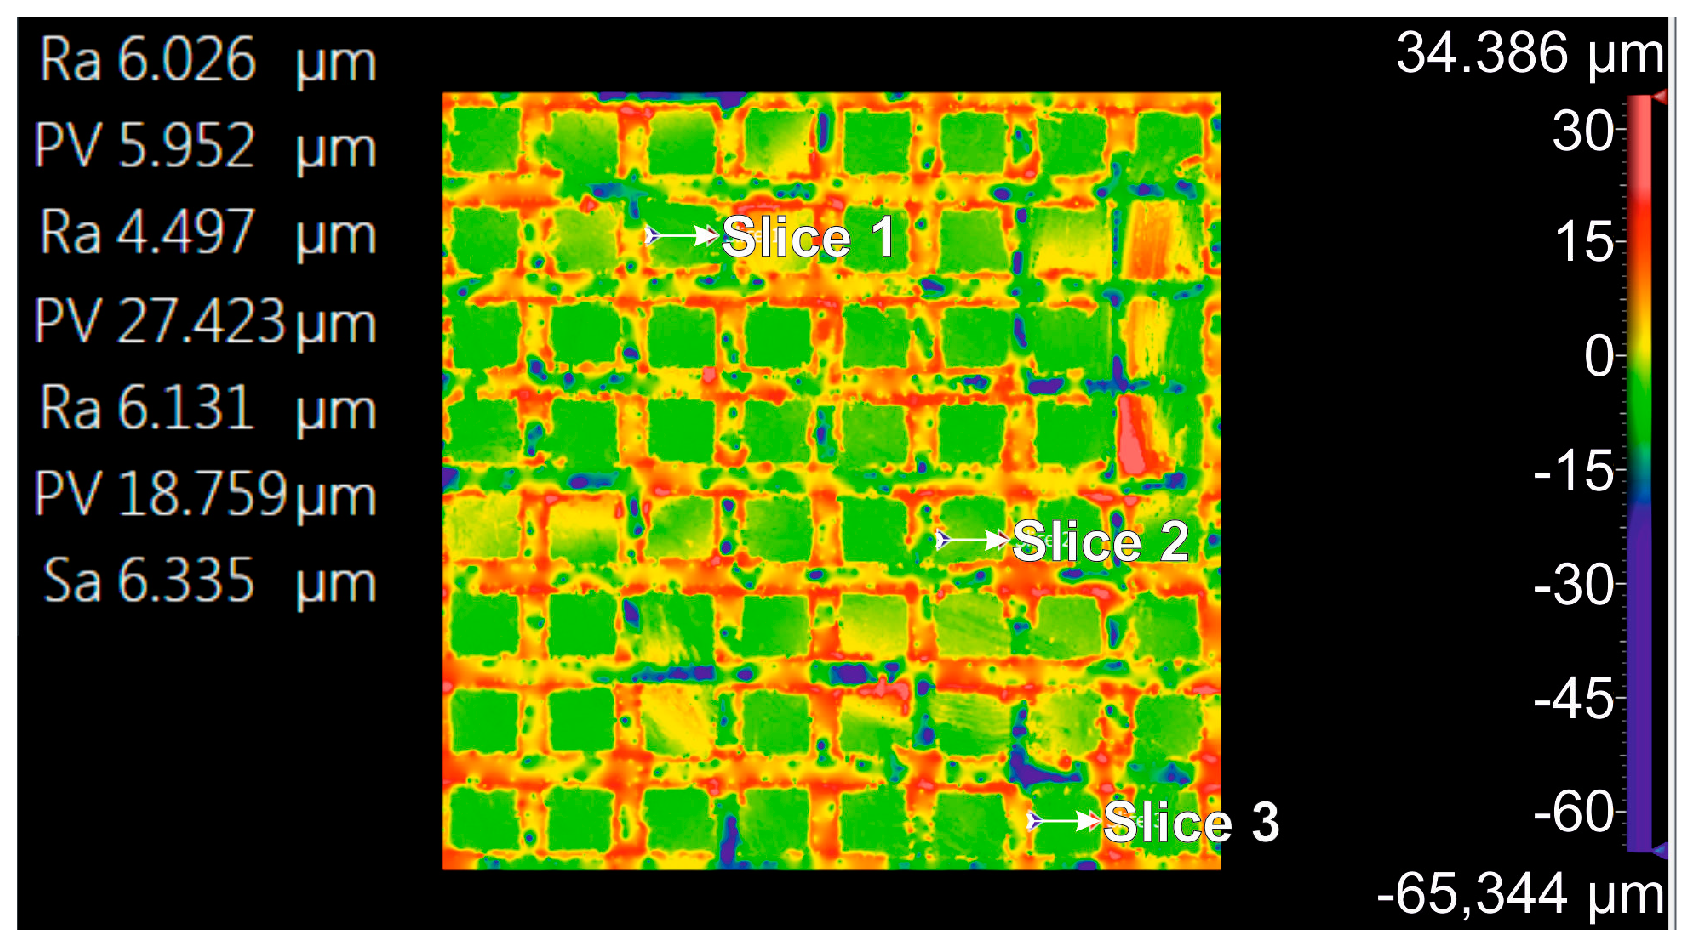
In the case of the Arbofill Fichte material with a square texture obtained with four passes, Figure 18 shows the largest distance between the lowest and the highest peak (Rz) for the three sections considered, and, in Table 8, the corresponding statistical data are presented. The mean Rz value was 44.75 ± 7.17 µm, and the Rq value was 6.416 ± 0.814 µm.
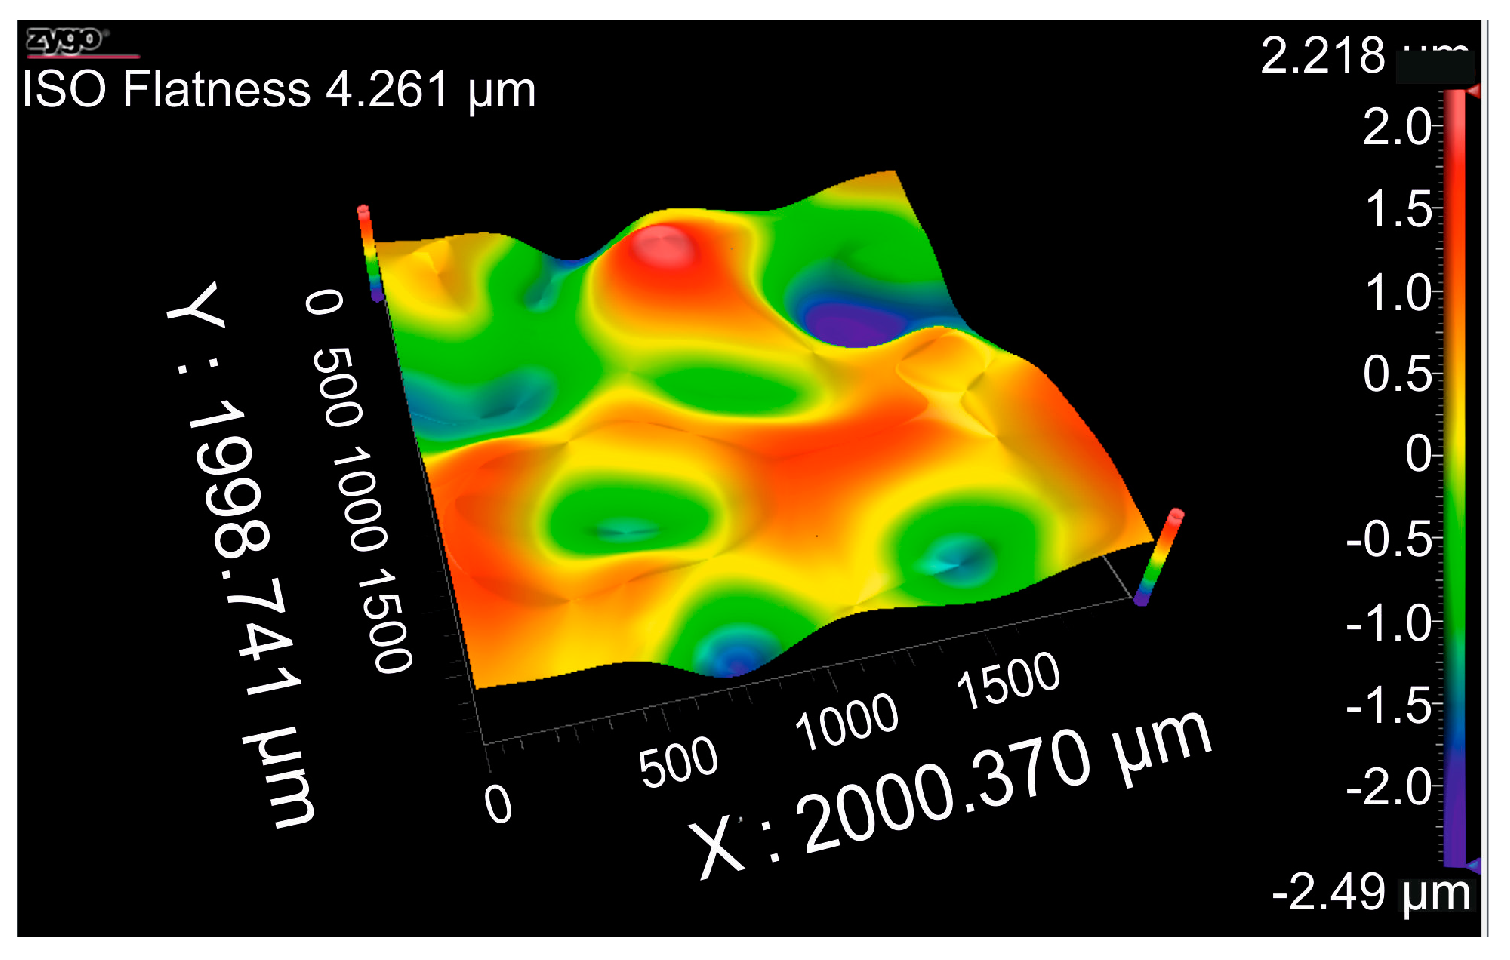
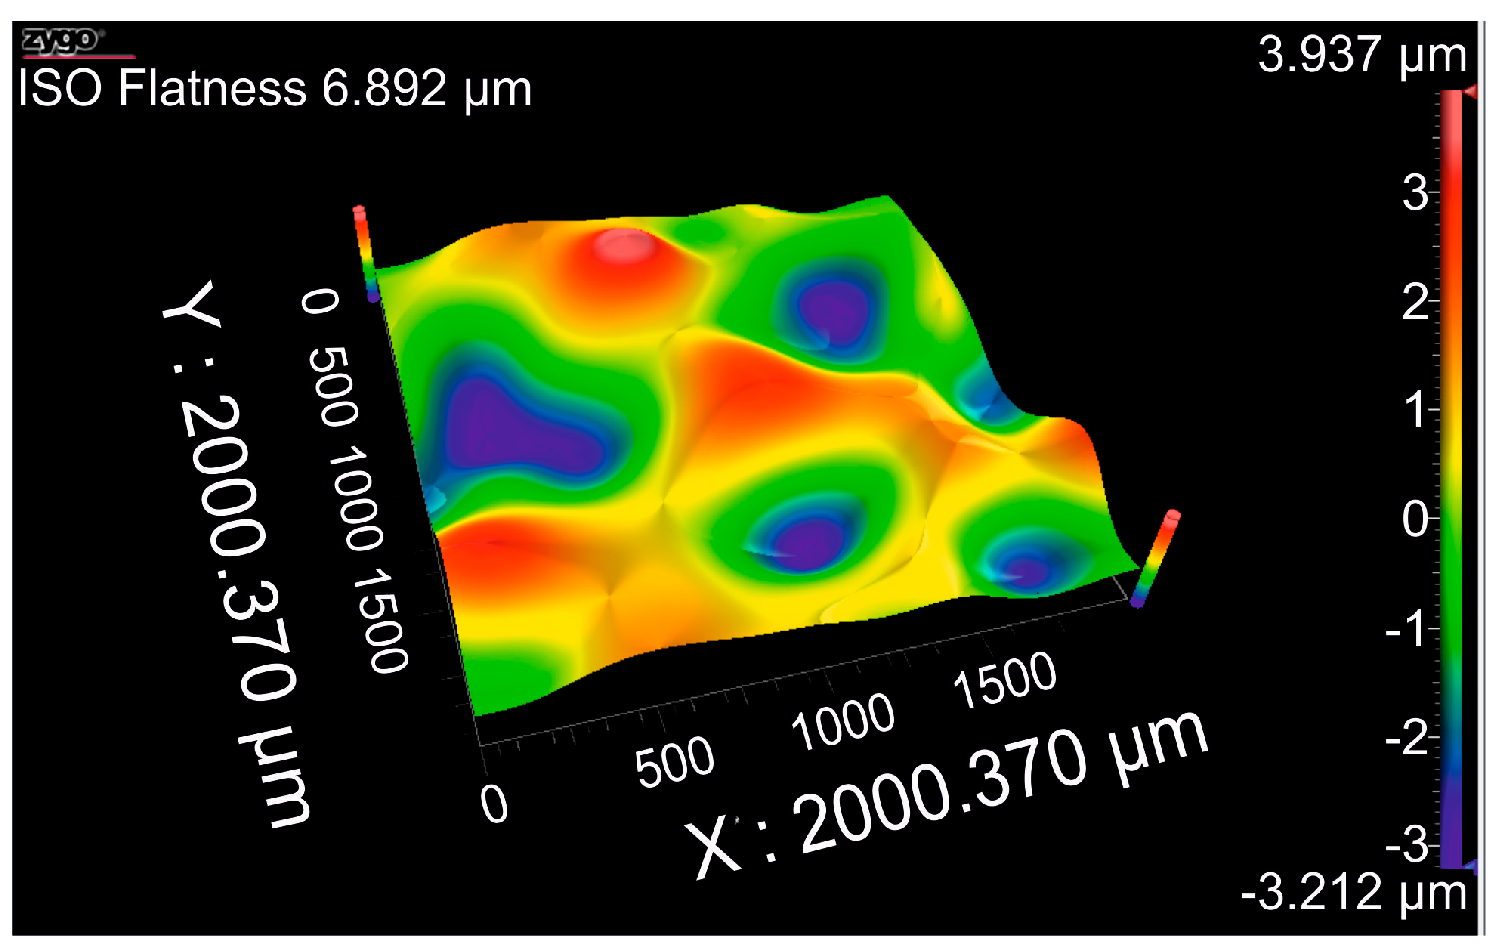
The flatness deviation after texturing is shown in Figure 19, with a value of 4.261 µm according to ISO Flatness. Figure 20 shows the roughness values (Ra) for the three reference lines chosen (5.551 µm as a mean value), which correspond only to the square surfaces obtained, without taking into account the distance between the squares and an Sa value of 6.335 µm.
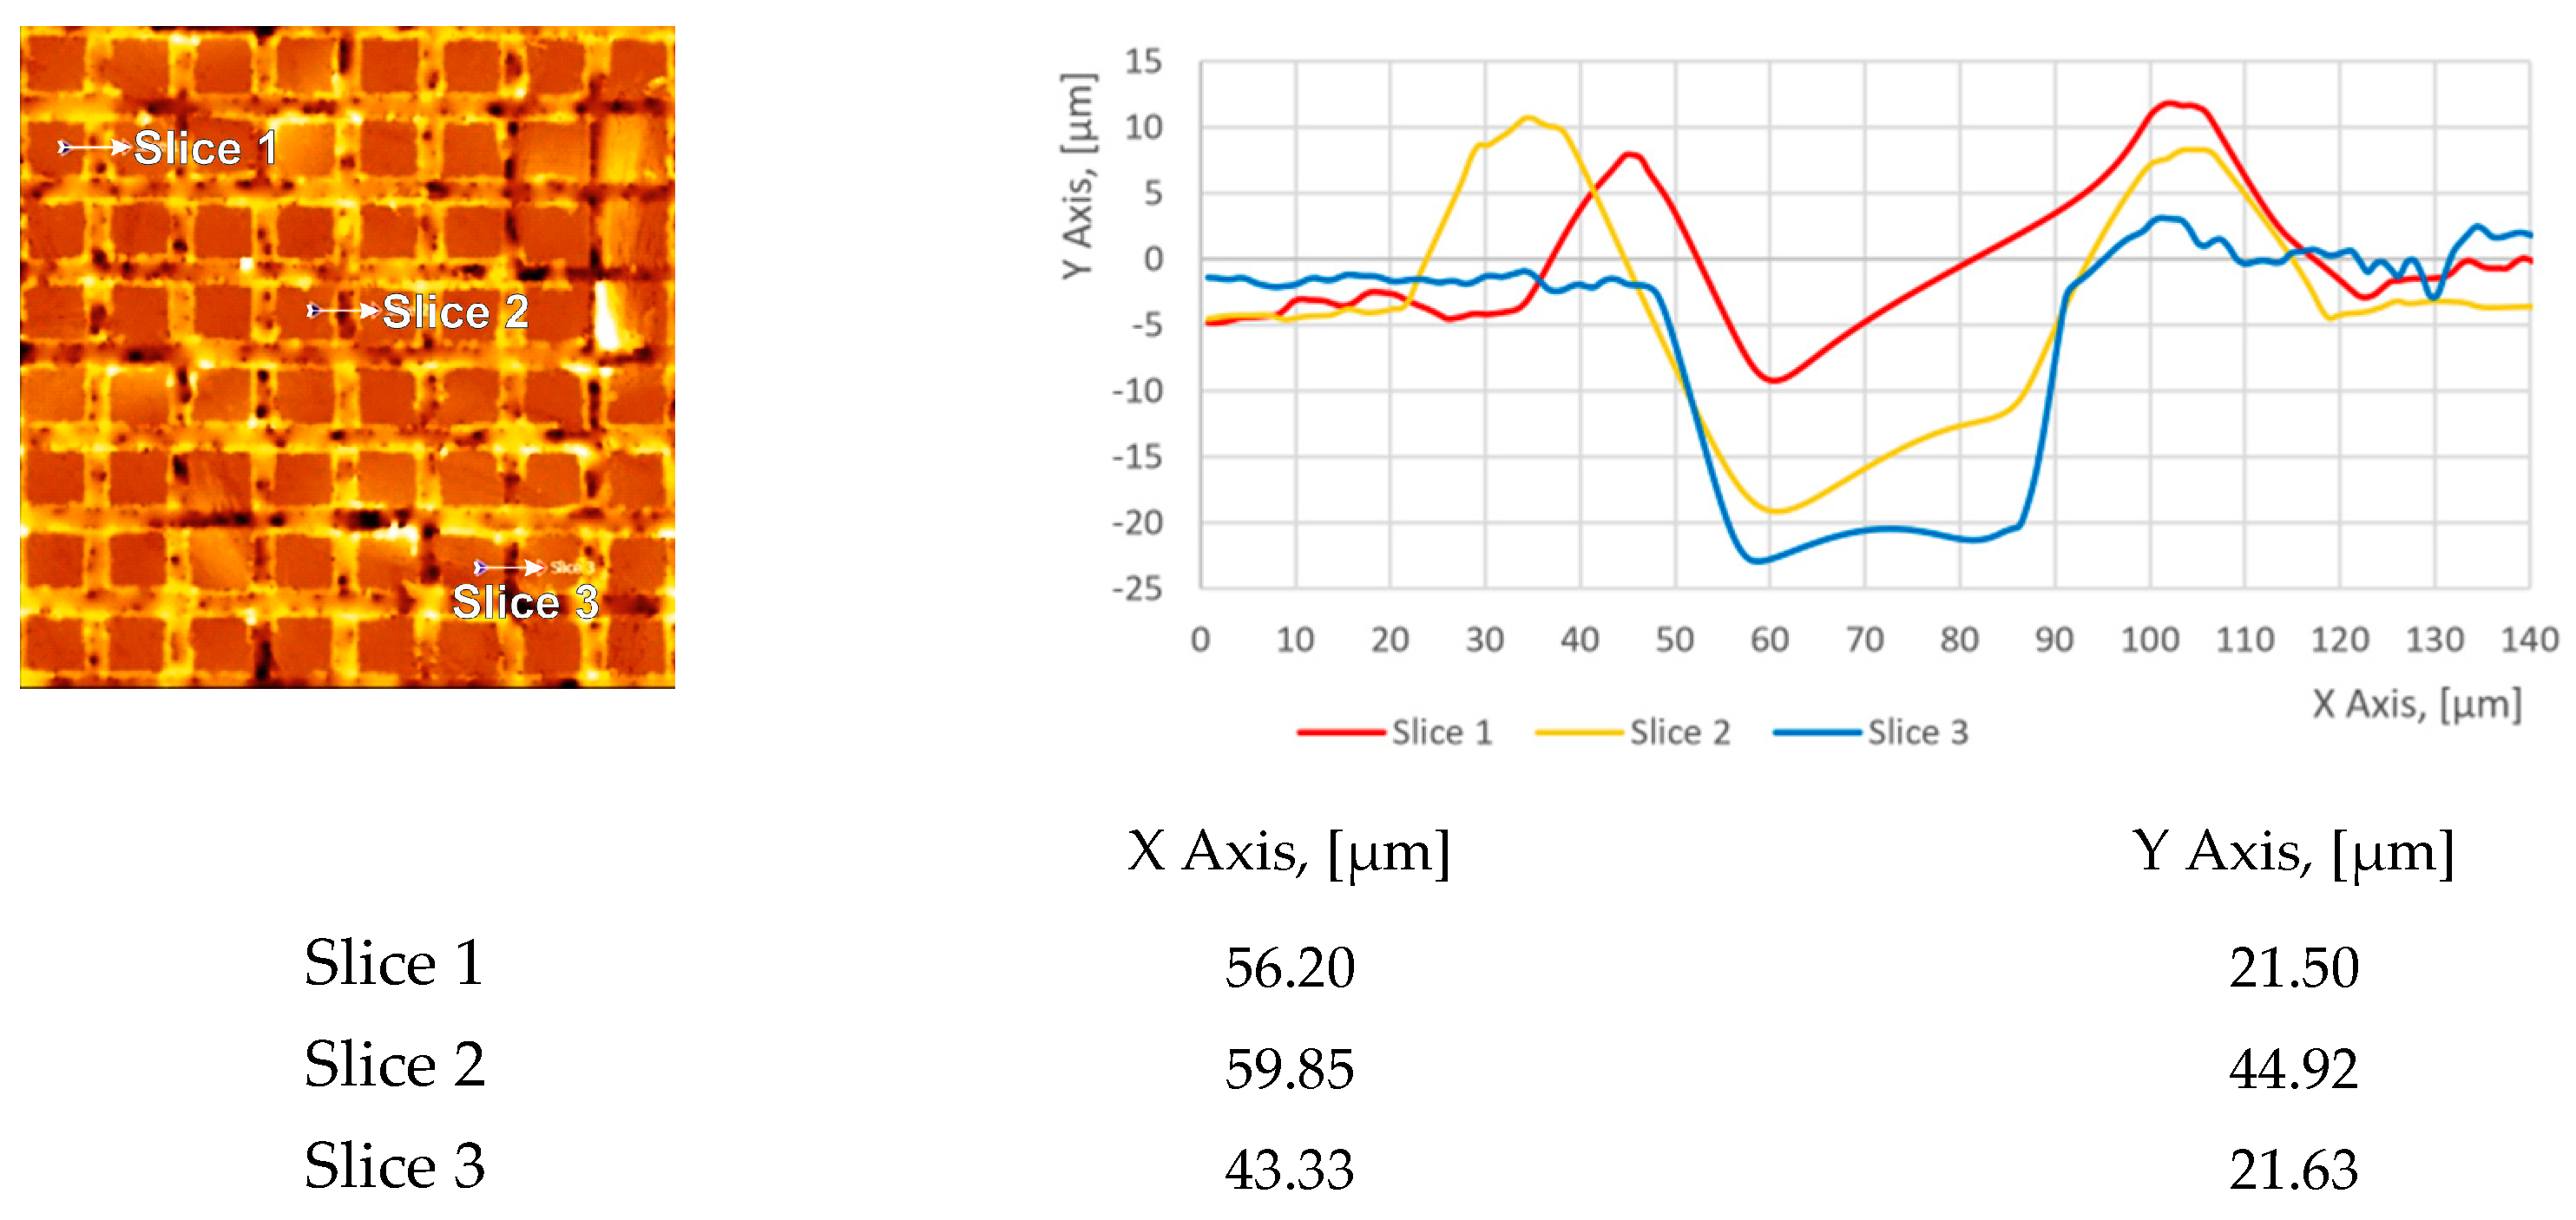
From the analysis of the presented graphs (Figure 21), we can observe that the stability of the process with four passes (4x) led to high variability, especially for slice 2, where the Y-axis value (44.92 μm) deviated significantly from the others.
For the Arbofill Fichte material with a square texture obtained with six passes, Figure 22 shows the largest distance between the lowest and the highest peak (Rz) for the three sections considered, and, in Table 9, the corresponding statistical data are presented. The mean Rz and Rq values were 41.82 ± 4.34 µm and 7.491 ± 0.562 µm.
The flatness deviation after texturing is shown in Figure 23, with an ISO Flatness value of 6.892 µm. Figure 24 shows the values of the roughness Ra for the three chosen reference lines (minimum value 6.841 µm and maximum 8.245 µm), which correspond only to the square surfaces obtained (7.643 µm), without taking into account the distance between them.
From the analysis of the presented graphs (Figure 25), we can observe that increasing the number of passes (to 6x) led to a slight improvement; but also, in this case, the middle section (slice 2) showed deviations (on Y axis from 17.23 up to 41.48 μm), indicating a small instability. Regarding the repeatability of the process, we noticed a behavior similar to that described for the hexagonal geometry. The increase in the process passes to 6X led to an improved repeatability overall, but the deviations in section 2 (slice 2) indicated that the square geometry may require additional adjustments to improve consistency.
In conclusion, increasing the texturing passes (6x) reduced the overall variability. Issues with slice 2 persisted, especially along the Y axis. This geometry appears to be more sensitive to the process parameters than the hexagonal geometry.
Analyzing the behavior of the influence of the number of passes, 4x or 6x, we observed that texturing with six passes generated a more stable surface than four passes. The improved leveling observed at 6x compared to 4x with this laser-textured plastic can be explained by several factors related to the interaction of the laser’s energy with the material, as well as the cumulative effects of multiple passes. One of the factors influencing the material’s behavior at 6x is related to the cumulative energy effect that led to increased energy deposition. Each laser pass deposited a certain amount of energy onto the material. At 6x, the cumulative energy applied was higher and more uniformly distributed due to the overlap of multiple passes. At 4x, the energy may have been insufficient in certain areas to create complete and uniform ablation, leading to greater variations in the final texture. Another reason for this behavior is related to a reduction in the local variations through overlap and enhanced laser energy absorption. Basically, with 4x, the overlap between the passes may be less consistent, creating areas where the energy is not evenly distributed. Increasing to six passes, the additional overlaps ensure the entire surface is more uniformly exposed, reducing local variations and yielding a more even texture. The energy generated by the laser show that after the first few passes (4x), the surface properties of the material may change (e.g., increased roughness or optical alterations), leading to the better absorption of laser energy. This is known as the absorption enhancement effect. With 6x, this effect becomes more pronounced, and the laser energy is absorbed more efficiently, leading to more controlled and consistent ablation.
Analyzing the influence of geometry some differences were observed.
With four passes (4x), regarding the stability of the process, the use of hexagonal geometry led to less variation between sections compared to the square geometry, particularly along the Y axis. The use of square geometry showed significant instability in section 2 (max. value equal to 44.92 μm on Y axis). The same behavior was observed regarding the repeatability of process. Using a hexagonal geometry led to better repeatability, with smaller differences between sections. The square geometry was less repeatable, as the profiles of the different slices diverged significantly.
With six passes (6x), regarding the stability of the process, the use of the hexagonal geometry led to better stability, with more uniform profiles across the sections. The square geometry showed improvement, but the persistent variability in section 2 (Y axis = 41.48 μm) highlights its sensitivity to process inconsistencies. Using the hexagon geometry led to better repeatability of the process, with closer alignment between sections. The stability of the square geometry improved with 6x, but it still lagged behind the hexagonal geometry in terms of process reliability.
In conclusion, the hexagonal geometry is inherently more stable and repeatable than the square geometry, regardless of the number of passes. The square geometry is more prone to deviations, especially along the Y axis, and may require further optimization of the process parameters.
The hexagonal geometry naturally facilitates more uniform leveling due to its denser and more evenly distributed pattern, even after 4x passes. However, after 6x, the benefits are more evident because of the repeated overlaps in the laser paths. The overlap between passes in the hexagonal pattern ensures that each region of the material receives a relatively uniform dose of energy, minimizing localized variations.

4. Conclusions

The textured surfaces produced by laser ablation were described as continuous grooves with a regular and vaporized bottom, according to the microscopic observation. The wettability of the samples was changed by the texturing process; that is, samples with a hexagonal texture (4x) showed an initial contact angle of about 19°, which quickly decreased to 0° in 16 s, indicating a superhydrophilic surface, while the samples with a square texture (4x) showed an average water contact angle that decreased to 38 ± 2° (87 ± 3° for the initial state).
Whether the pattern was square or hexagonal, the surface behavior of the textured (6x) samples was the same. Whereas individuals with an S-texture pattern (square) achieved a COF of 0.51 after four passes, those with a hexagonal texture saw their COF climb to 0.26 after six passes. The wear test results indicated that most samples had less of the rough hexagonal (4x) and square (6x) pattern was removed.
Furthermore, from the microscopic observations following the degradation test, it was seen that there were no obvious degraded surfaces, indicating that the material was extremely resistant to the impact of the external conditions.
The topographical analysis demonstrated that Arbofill Fichte possessed greater stability along the Y axis in both the hexagonal and square geometries, particularly with six texturing passes, indicating better resistance to vertical leveling. The material exhibited consistent behavior in terms of X-axis variation in the channel width and Y-axis leveling across both geometries and pass numbers, making its behavior under specific processing conditions more predictable.
Comparing the two geometries, the hexagonal texture proved to be more stable and uniform regarding variation in channel width along both axes, especially the X axis. The square geometry, while more extended along the X axis, showed greater variability between sections, particularly along the Y axis. This geometry was also found to be more sensitive to the number of texturing passes, exhibiting larger variations with six passes.

Author Contributions

Conceptualization, D.N. and M.A.; methodology, P.-D.R. and A.T.; introduction, A.N. and T.-D.M.; microscopy, wettability, and degradation tests, O.B. and A.A.; wear and COF tests, A.W.; formal analysis, materials, and methods, S.-N.M. and P.K.; topography tests, C.T. and T.-D.M.; writing—original draft preparation, D.N.; project administration, D.N. and M.A.; funding acquisition, D.N. All authors have read and agreed to the published version of the manuscript.

Funding

This research was funded by “Gheorghe Asachi” Technical University of Iasi, Bd. Dimitrie, Mangeron, under funding number 432/09.01.2023.

Institutional Review Board Statement

Not applicable.

Informed Consent Statement

Not applicable.

Data Availability Statement

Data is contained within the article.

Conflicts of Interest

The authors declare no conflicts of interest.

References

  1. Li, D.; Chen, X.; Guo, C.; Tao, J.; Tian, C.; Deng, Y.; Zhang, W. Micro surface texturing of alumina ceramic with nanosecond laser. Procedia Eng. 2017, 174, 370–376. [Google Scholar] [CrossRef]
  2. Xing, Y.; Deng, J.; Feng, X.; Yu, S. Effect of laser surface texturing on Si3N4/TiC ceramic sliding against steel under dry friction. Mater. Des. (1980–2015) 2013, 52, 34–45. [Google Scholar] [CrossRef]
  3. Šugár, P.; Šugárová, J.; Frnčík, M. Laser surface texturing of tool steel: Textured surfaces quality evaluation. Open Eng. 2016, 6, 90–97. [Google Scholar] [CrossRef]
  4. Tripathi, K.; Gyawali, G.; Joshi, B.; Amanov, A.; Wohn, S. Improved tribological behavior of grey cast Iron Under low and high viscous lubricants by laser surface texturing. Mater. Perform. Charact. 2017, 6, 24–41. [Google Scholar] [CrossRef]
  5. Riveiro, A.; Maçon, A.L.; del Val, J.; Comesaña, R.; Pou, J. Laser surface texturing of polymers for biomedical applications. Front. Phys. 2018, 6, 16. [Google Scholar] [CrossRef]
  6. Ezhilmaran, V.; Vasa, N.J.; Vijayaraghavan, L. Investigation on generation of laser assisted dimples on piston ring surface and influence of dimple parameters on friction. Surf. Coat. Technol. 2018, 335, 314–326. [Google Scholar] [CrossRef]
  7. Liang, L.; Yuan, J.; Li, X.; Yang, F.; Jiang, L. Wear behavior of the micro-grooved texture on WC-Ni3Al cermet prepared by laser surface texturing. Int. J. Refract. Met. Hard Mater. 2018, 72, 211–222. [Google Scholar] [CrossRef]
  8. Shivakoti, I.; Kibria, G.; Cep, R.; Pradhan, B.B.; Sharma, A. Laser Surface Texturing for Biomedical Applications: A Review. Coatings 2021, 11, 124. [Google Scholar] [CrossRef]
  9. Environmental Silicate Nano-Biocomposites; Averous, L., Pollet, E., Eds.; Springer: London, UK, 2012; ISBN 978-1-4471-4108-2. [Google Scholar]
  10. Handbook of Biodegradable Polymers; Bastioli, C., Ed.; Rapra Technology: Shrewsbury, UK, 2005; ISBN 978-1-8473-5044-2. [Google Scholar]
  11. Nutton, V. Ancient Medicine, 2nd ed.; Routledge: London, UK, 2012; ISBN 9780415520942. [Google Scholar]
  12. Vroman, I.; Tighzert, L. Biodegradable Polymers. Materials 2009, 2, 307–344. [Google Scholar] [CrossRef]
  13. Improving Biopolymers for Packaging Applications Using Surface-Tailored Cellulose Nanocrystals. Available online: https://research.fs.usda.gov/fpl/news/highlights/improving-biopolymers-packaging-applications-using-surface-tailored-cellulose (accessed on 15 January 2025).
  14. Milani, P.; França, D.; Balieiro, A.G.; Faez, R. Polymers and its applications in agriculture. Polímeros 2017, 27, 256–266. [Google Scholar] [CrossRef]
  15. Singh, D.; Thomas, D. Advances in medical polymer technology towards the panacea of complex 3D tissue and organ manufacture. Am. J. Surg. 2019, 217, 807–808. [Google Scholar] [CrossRef] [PubMed]
  16. Lendlein, A.; Sisson, A. (Eds.) Handbook of Biodegradable Polymers: Isolation, Synthesis, Characterization and Applications; Wiley-VCH Verlag GmbH Co. KGaA: Weinheim, Germany, 2011. [Google Scholar] [CrossRef]
  17. Tian, H.; Tang, Z.; Zhuang, X.; Chen, X.; Jing, X. Biodegradable synthetic polymers: Preparation, functionalization and biomedical application. Prog. Polym. Sci. 2012, 37, 237–280. [Google Scholar] [CrossRef]
  18. Biomaterials Principles and Applications; Park, J.B., Bronzino, J.D., Eds.; CRC Press: Boca Raton, FL, USA, 2002; ISBN 0-8493-1491-7. [Google Scholar]
  19. White, N.; Eder, K.; Byrnes, J.; Cairney, J.M.; McCarroll, I.E. Laser ablation sample preparation for atom probe tomography and transmission electron microscopy. Ultramicroscopy 2020, 220, 113161. [Google Scholar] [CrossRef] [PubMed]
  20. Tomanik, M.; Kobielarz, M.; Filipiak, J.; Szymonowicz, M.; Rusak, A.; Mroczkowska, K.; Antończak, A.; Pezowicz, C. Laser Texturing as a Way of Influencing the Micromechanical and Biological Properties of the Poly (L-Lactide) Surface. Materials 2020, 13, 3786. [Google Scholar] [CrossRef]
  21. Riveiro, A.; Soto, R.; Del Val, J.; Comesaña, R.; Boutinguiza, M.; Quintero, F.; Lusquiños, F.; Pou, J. Texturing of polypropylene (PP) with nanosecond lasers. Appl. Surf. Sci. 2016, 374, 379–386. [Google Scholar] [CrossRef]
  22. Mirzadeh, H.; Katbab, A.A.; Burford, R.P. CO2-laser graft copolymerization of HEMA and NVP onto ethylene-propylene rubber (EPR) as biomaterial-(III). Radiat. Phys. Chem. 1995, 46, 859–862. [Google Scholar] [CrossRef]
  23. Dinca, V.; Alloncle, P.; Delaporte, P.; Ion, V.; Rusen, L.; Filipescu, M.; Mustaciosu, C.; Luculescu, C.; Dinescu, M. Excimer laser texturing of natural composite polymer surfaces for studying cell-to-substrate specific response. Appl. Surf. Sci. 2015, 352, 82–90. [Google Scholar] [CrossRef]
  24. Koufaki, N.; Ranella, A.; Aifantis, K.E.; Barberoglou, M.; Psycharakis, S.; Fotakis, C.; Stratakis, E. Controlling cell adhesion via replication of laser micro/nano-textured surfaces on polymers. Biofabrication 2011, 3, 045004. [Google Scholar] [CrossRef]
  25. Yeong, W.Y.; Yu, H.; Lim, K.P.; Ng, K.L.; Boey, Y.C.; Subbu, V.S.; Tan, L.P. Multiscale topological guidance for cell alignment via direct laser writing on biodegradable polymer. Tissue Eng. Part C Methods 2010, 16, 1011–1021. [Google Scholar] [CrossRef] [PubMed]
  26. Waugh, D.; Lawrence, J. Laser surface processing of polymers for biomedical applications. In Laser-Assisted Fabrication of Materials; Springer: Berlin/Heidelberg, Germany, 2013; pp. 275–318. [Google Scholar]
  27. Jagur-Grodzinski, J. Polymers for tissue engineering, medical devices, and regenerative medicine. Concise general review of recent studies. Polym. Adv. Technol. 2006, 17, 395–418. [Google Scholar] [CrossRef]
  28. Kohane, D.S.; Langer, R. Polymeric biomaterials in tissue engineering. Pediatr. Res. 2008, 63, 487–491. [Google Scholar] [CrossRef] [PubMed]
  29. Teo, A.J.T.; Mishra, A.; Park, I.; Kim, Y.J.; Park, W.T.; Yoon, Y.J. Polymeric biomaterials for medical implants and devices. ACS Biomater. Sci. Eng. 2016, 2, 454–472. [Google Scholar] [CrossRef] [PubMed]
  30. Abu Bakar, M.S.; Cheng, M.H.W.; Tang, S.M.; Yu, S.C.; Liao, K.; Tan, C.T.; Khor, K.A.; Cheang, P. Tensile properties, tension–tension fatigue and biological response of polyetheretherketone–hydroxyapatite composites for load-bearing orthopedic implants. Biomaterials 2003, 24, 2245–2250. [Google Scholar] [CrossRef] [PubMed]
  31. Godara, A.; Raabe, D.; Green, S. The influence of sterilization processes on the micromechanical properties of carbon fiber-reinforced PEEK composites for bone implant applications. Acta Biomater. 2007, 3, 209–220. [Google Scholar] [CrossRef]
  32. Riveiro, A.; Soto, R.; Comesaña, R.; Boutinguiza, M.; del Val, J.; Quintero, F.; Lusquiños, F.; Pou, J. Laser surface modification of PEEK. Appl. Surf. Sci. 2012, 258, 9437–9442. [Google Scholar] [CrossRef]
  33. Zheng, Y.; Xiong, C.; Wang, Z.; Li, X.; Zhang, L. A combination of CO2 laser and plasma surface modification of poly(etheretherketone) to enhance osteoblast response. Appl. Surf. Sci. 2015, 344, 79–88. [Google Scholar] [CrossRef]
  34. Wilson, A.; Jones, I.; Salamat-Zadeh, F.; Watts, J.F. Laser surface modification of poly(etheretherketone) to enhance surface free energy, wettability and adhesion. Int. J. Adhes. Adhes. 2015, 62, 69–77. [Google Scholar] [CrossRef]
  35. Lorusso, A.; Nassisi, V.; Paladini, F.; Torrisi, L.; Visco, A.M.; Campo, N. Comparison of the laser effects induced on ultra-high-molecular-weight polyethylene. Radiat. Eff. Defects Solids 2008, 163, 435–440. [Google Scholar] [CrossRef]
  36. Riveiro, A.; Soto, R.; del Val, J.; Comesaña, R.; Boutinguiza, M.; Quintero, F.; Lusquiños, F.; Pou, J. Laser surface modification of ultra-high-molecular-weight polyethylene (UHMWPE) for biomedical applications. Appl. Surf. Sci. 2014, 302, 236–242. [Google Scholar] [CrossRef]
  37. Himma, N.F.; Anisah, S.; Prasetya, N.; Wenten, I.G. Advances in preparation, modification, and application of polypropylene membrane. J. Polym. Eng. 2016, 36, 329–362. [Google Scholar] [CrossRef]
  38. Wissemborski, R.; Klein, R. Welding and marking of plastics with lasers. Laser Tech. J. 2010, 7, 19–22. [Google Scholar] [CrossRef]
  39. Stanford, C.M. Surface modifications of dental implants. Aust. Dent. J. 2008, 53, S26–S33. [Google Scholar] [CrossRef]
  40. Murahara, M.; Okoshi, M. Photochemical surface modification of polypropylene for adhesion enhancement by using an excimer laser. J. Adhes. Sci. Technol. 1995, 9, 1593–1599. [Google Scholar] [CrossRef]
  41. Deshpande, S.; Munoli, A. Long-term results of high-density porous polyethylene implants in facial skeletal augmentation: An Indian perspective. Indian J. Plast. Surg. 2010, 43, 34–39. [Google Scholar] [CrossRef]
  42. Okoshi, M.; Inoue, N. Microfabrication of polyethylene using femtosecond Ti:sapphire laser and nanosecond ArF laser. Jpn. J. Appl. Phys. 2003, 42, 5642. [Google Scholar] [CrossRef]
  43. Blanchemain, N.; Chai, F.; Bacquet, M.; Gengembre, L.; Traisnel, M.; Setti, Y.; Hildebrand, H.F. Improvement of biological response of YAG laser irradiated polyethylene. J. Mater. Chem. 2007, 17, 4041–4049. [Google Scholar] [CrossRef]
  44. Okoshi, M.; Inoue, N. Laser ablation of polymers using 395 nm and 790 nm femtosecond lasers. Appl. Phys. Mater. Sci. Process 2004, 79, 841–844. [Google Scholar] [CrossRef]
  45. Ahad, I.U.; Budner, B.; Korczyc, B.; Fiedorowicz, H.; Bartnik, A.; Kostecki, J.; Burdyńska, S.; Brabazon, D. Polycarbonate polymer surface modification by extreme ultraviolet (EUV) radiation. Acta Phys. Pol. A 2014, 125, 924–928. [Google Scholar] [CrossRef]
  46. Viville, P.; Beauvois, S.; Lambin, G.; Lazzaroni, R.; Brédas, J.L.; Kolev, K.; Laude, L. Excimer laser-induced surface modifications of biocompatible polymer blends. Appl. Surf. Sci. 1996, 96, 558–562. [Google Scholar] [CrossRef]
  47. Ahad, I.U.; Butruk, B.; Ayele, M.; Budner, B.; Bartnik, A.; Fiedorowicz, H.; Ciach, T.; Brabazon, D. Extreme ultraviolet (EUV) surface modification of polytetrafluoroethylene (PTFE) for control of biocompatibility. Nucl. Instrum. Methods Phys. Res. Sect. B Beam Interact Mater. At. 2015, 364, 98–107. [Google Scholar] [CrossRef]
  48. Waugh, D.G.; Lawrence, J.; Morgan, D.J.; Thomas, C.L. Interaction of CO2 laser-modified nylon with osteoblast cells in relation to wettability. Mater. Sci. Eng. C 2009, 29, 2514–2524. [Google Scholar] [CrossRef]
  49. Günther, D.; Scharnweber, D.; Hess, R.; Wolf-Brandstetter, C.; Grosse Holthaus, M.; Lasagni, A.F. High precision patterning of biomaterials using the direct laser interference patterning technology. In Laser Surface Modification of Biomaterials; Vilar, R., Ed.; Woodhead Publishing: Cambridge, MA, USA, 2016. [Google Scholar] [CrossRef]
  50. Yasaka, K.; Koseki, Y.; Yoshinaka, K.; Miyake, K. Effects of Surface Texture on Soft-Materials for Medical Applications. Tribol. Online 2016, 11, 288–297. [Google Scholar] [CrossRef]
  51. Ikeuchi, K.; Takii, T.; Norikane, H.; Tomita, N.; Ohsumi, T.; Uyama, Y.; Ikada, Y. Water Lubrication of Polyurethane Grafted with Dimethylacrylamide for Medical Use. Wear 1993, 161, 179–185. [Google Scholar] [CrossRef]
  52. Evangelista, I.; Wencel, D.; Beguin, S.; Zhang, N.; Gilchrist, M.D. Influence of Surface Texturing on the Dry Tribological Properties of Polymers in Medical Devices. Polymers 2023, 15, 2858. [Google Scholar] [CrossRef] [PubMed]
  53. Affatato, S.; Brando, D. Introduction to wear phenomena of orthopaedic implants. In Wear of Orthopaedic Implants and Artificial Joints; Woodhead Publishing: Sawston, UK, 2013; pp. 3–26. [Google Scholar]
  54. Ching, H.A.; Choudhury, D.; Nine, M.J.; Abu Osman, N.A. Effects of surface coating on reducing friction and wear of orthopaedic implants. Sci. Technol. Adv. Mater. 2014, 15, 014402. [Google Scholar] [CrossRef]
  55. Howard, J.J. Balancing innovation and medical device regulation: The case of modern metal-on-metal hip replacements. Med. Devices 2016, 9, 267–275. [Google Scholar] [CrossRef] [PubMed]
  56. Bialas, O.; Lis, M.; Wozniak, A.; Adamiak, M. Laser Superficial Fusion of Gold Nanoparticles with PEEK Polymer for Cardiovascular Application. Materials 2021, 14, 971. [Google Scholar] [CrossRef] [PubMed]
  57. Available online: https://www.tecnaro.de/en/arboblend-arbofill-arboform/verarbeitung/ (accessed on 12 September 2022).
  58. Mazurchevici, S.-N.; Vaideanu, D.; Rapp, D.; Varganici, C.-D.; Cărăușu, C.; Boca, M.; Nedelcu, D. Dynamic mechanical analysis and thermal expansion of lignin-based biopolymers. Polymers 2021, 13, 2953. [Google Scholar] [CrossRef] [PubMed]
  59. Nedelcu, D. Investigation on microstructure and mechanical properties of samples obtained by injection from Arbofill. Compos. Part B Eng. 2013, 47, 126–129. [Google Scholar] [CrossRef]
  60. Nedelcu, D.; Ciofu, C.; Lohan, N.M. Microindentation and differential scanning calorimetry of “liquid wood”. Compos. Part B Eng. 2013, 55, 11–15. [Google Scholar] [CrossRef]
  61. Mazurchevici, S.; Quadrini, F.; Nedelcu, D. The liquid wood heat flow and material properties as a function of temperature. Mater. Res. Express 2018, 5, 035303. [Google Scholar] [CrossRef]
  62. Mazurchevici, S.N.; Bialas, O.; Mindru, T.D.; Adamiak, M.; Nedelcu, D. Characterization of Arboblend V2 Nature Textured Surfaces Obtained by Injection Molding. Polymers 2023, 15, 406. [Google Scholar] [CrossRef] [PubMed]
  63. Nedelcu, D.; Plavanescu, S.; Puiu, E. Impact resistance of “liquid wood”. Adv. Mater. Res. 2014, 1036, 13–17. [Google Scholar] [CrossRef]
  64. Broitman, E.; Nedelcu, D.; Mazurchevici, S.; Glenat, H.; Grillo, S. Tribological and nanomechanical behavior of liquid wood. J. Tribol. 2019, 141, 022001. [Google Scholar] [CrossRef]
  65. PN-EN 600068-14 Standard. Available online: https://magazin.asro.ro/ro/standard/179836 (accessed on 10 January 2025).
  66. Woźniak, A.; Bialas, O.; Adamiak, M.; Hadzima, B.; Szewczenko, J. The influence of laser texturing on the tribological behavior of titanium alloy Ti6Al4V in medical applications. Arch. Civ. Mech. Eng. 2024, 24, 1–19. [Google Scholar] [CrossRef]
  67. Costescu, E.P.; Vaideanu, D.; Simona, B.E.; Agop, M. Thermal and electrical behaviours of the arbofill, “liquid wood”. Int. J. Mod. Manuf. Technol. 2017, 9, 79–83. [Google Scholar]
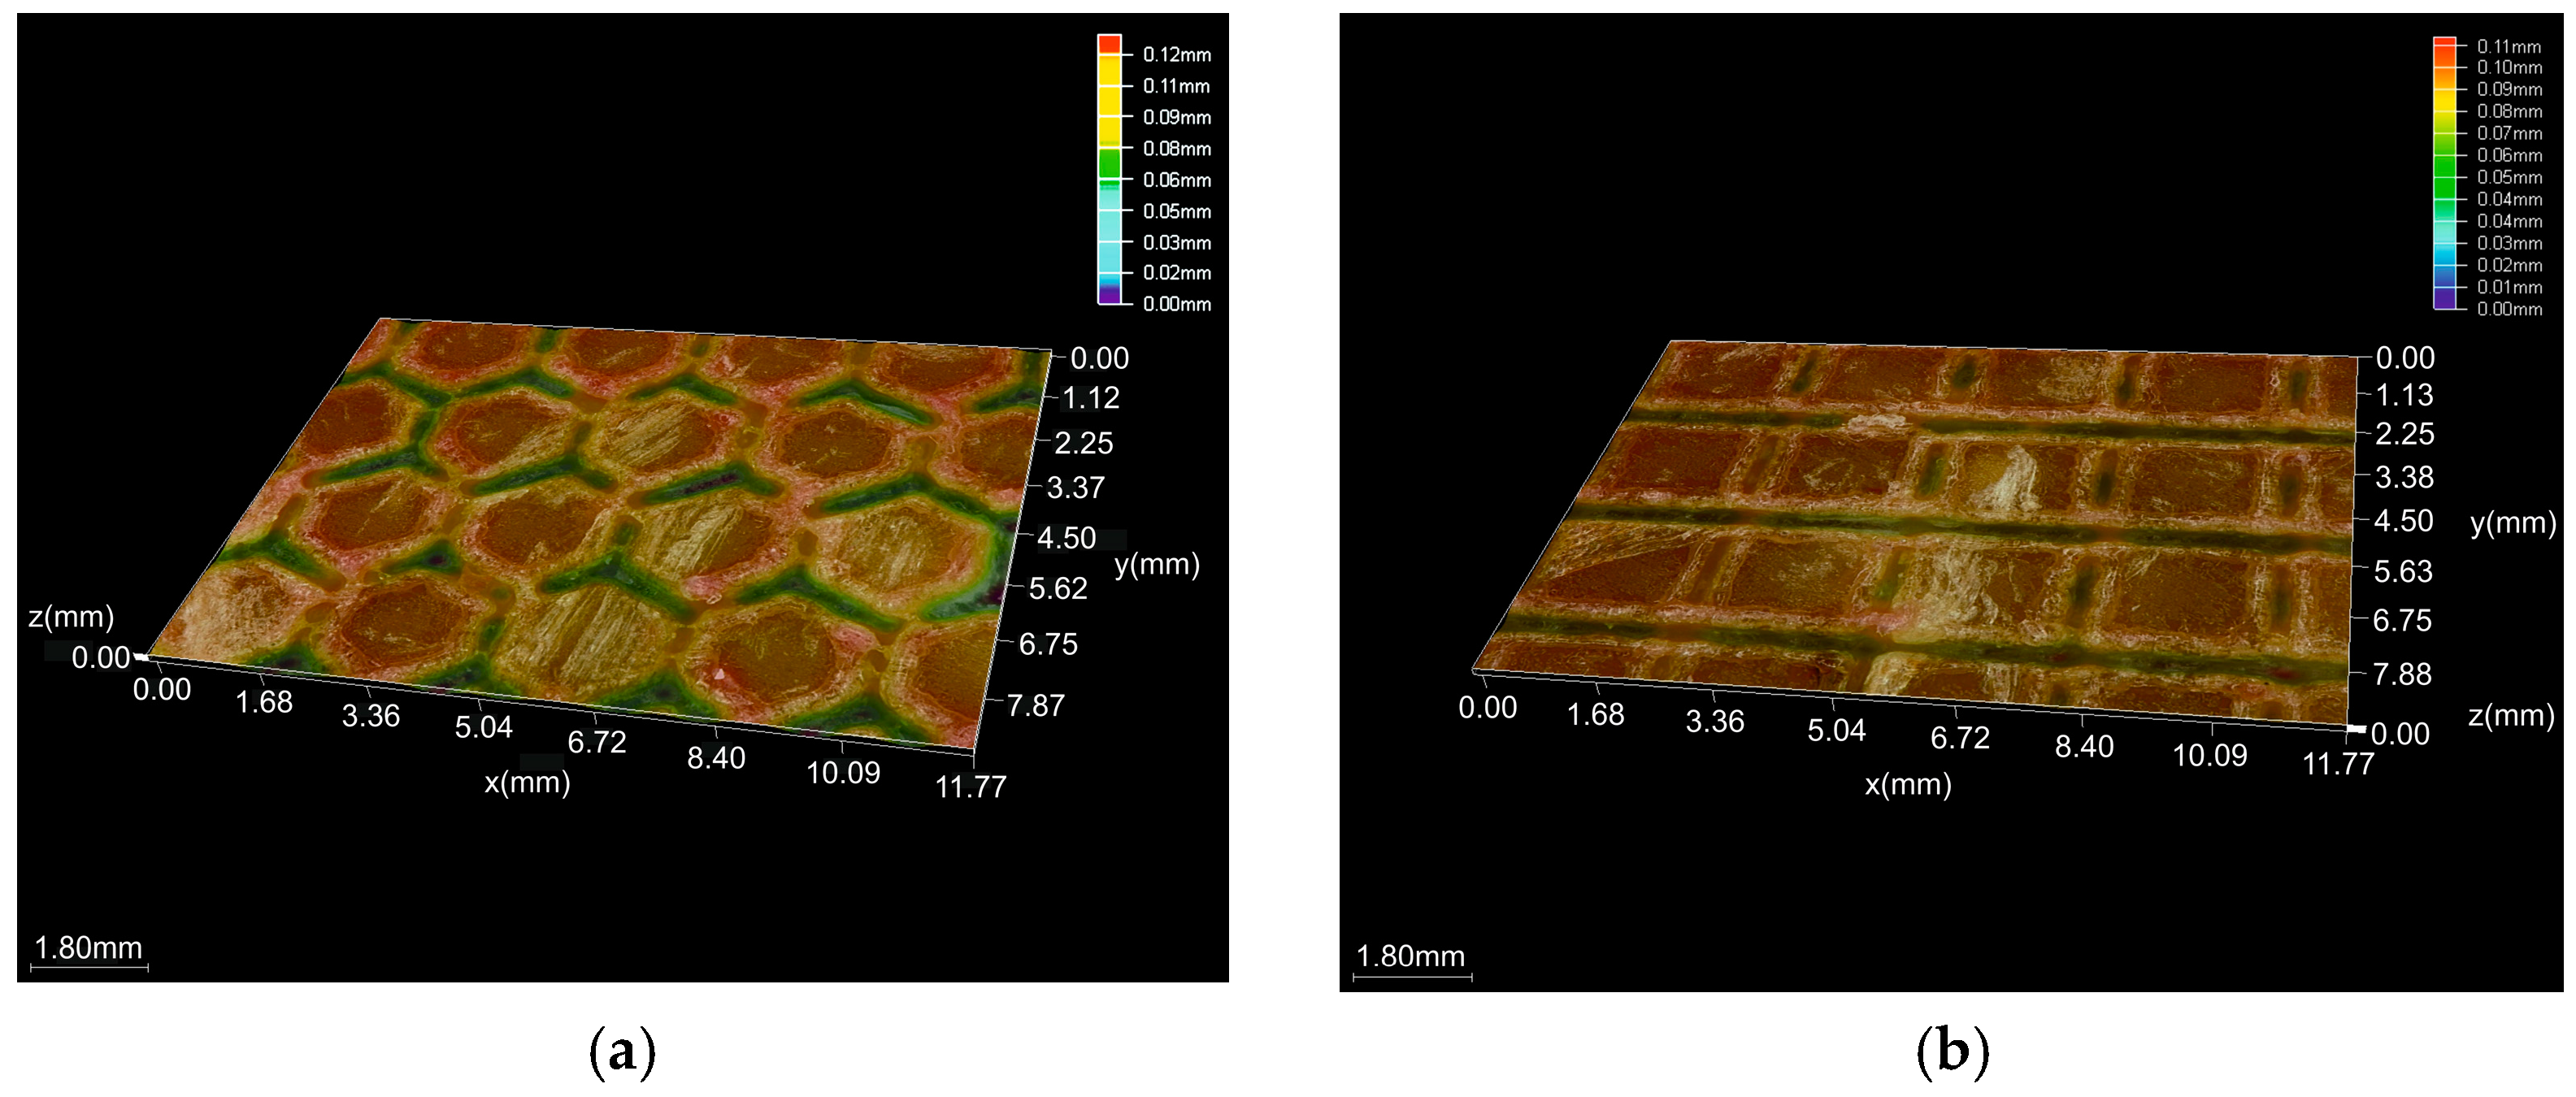
Figure 1. Microscopic observation of biodegradable biopolymer after laser texturing process: (a) 4x_H x300, (b) 4x_S x300.
Coatings 15 00246 g001
Figure 2. Microscopic observation of biodegradable biopolymer after laser texturing process: (a) 6x_H x300, (b) 6x_S x300.
Coatings 15 00246 g002
Figure 3. Contact angle diagram for the experiment: (a,b) initial state; (c,d) hexagonal-textured pattern with 4 passes; (e,f) square-textured pattern with 4 passes; (g,h) hexagonal-textured pattern with 6 passes; (i,j) square-textured pattern with 6 passes.
Coatings 15 00246 g003aCoatings 15 00246 g003b
Figure 4. Results of COF tests for biodegradable biopolymer: (a) base material, (b) 4x_H, (c) 4x S, (d) 6x_H, (e) 6x_S.
Coatings 15 00246 g004
Figure 5. Wear track morphology of biodegradable biopolymer samples: (a) base material x100; (b) 4x_H x100; (c) 4x_S x100; (d) 6x_H x100; (e) 6x_S x100.
Coatings 15 00246 g005aCoatings 15 00246 g005b
Figure 6. Microscopic observation of laser-untextured biodegradable polymer in initial state after degradation test.
Coatings 15 00246 g006
Figure 7. Microscopic observation of laser-textured Arbofill Fichte after degradation test: (a) 4x_H; (b) 4x_S.
Coatings 15 00246 g007
Figure 8. Microscopic observation of laser-textured biodegradable polymer after degradation test: (a) 6x_H; (b) 4x_S.
Coatings 15 00246 g008
Figure 9. Heat flow variation with temperature during heating for all samples: 1, base material; 2, hexagonal (4x); 3, square (4x); 4, hexagonal (6x); 5, square (6x).
Coatings 15 00246 g009
Figure 10. Maximum Rz value of three sections of Arbofill Fichte 4x_H: slice 1 (Sl.1); slice 2 (Sl.2); slice 3 (Sl.3).
Coatings 15 00246 g010
Figure 11. Flatness deviation after texturing—Arbofill Fichte: 4x_H.
Coatings 15 00246 g011
Figure 12. Roughness value Ra for three reference lines of Arbofill Fichte 4x_H.
Coatings 15 00246 g012
Figure 13. Interstial values for three reference lines—Arbofill Fichte: 4x_H, different geometric shapes.
Coatings 15 00246 g013
Figure 14. Maximum Rz value from the analysis of three sections—Arbofill Fichte: 6x_H, for different geometric shapes: slice 1 (Sl.1); slice 2 (Sl.2); slice 3 (Sl.3).
Coatings 15 00246 g014
Figure 15. Flatness deviation after texturing—Arbofill Fichte: 6x_H.
Coatings 15 00246 g015
Figure 16. Roughness value Ra for three reference lines—Arbofill Fichte: 6x_H, with a geometric shape.
Coatings 15 00246 g016
Figure 17. Gap value for three reference lines—Arbofill Fichte: 6x_H, with geometric shape.
Coatings 15 00246 g017
Figure 18. The maximum Rz value from the analysis of three sections—Arbofill Fichte: 4x_S, with geometric shape: slice 1 (Sl.1); slice 2 (Sl.2); slice 3 (Sl.3).
Coatings 15 00246 g018
Figure 19. Flatness deviation after texturing—Arbofill Fichte: 4x_S.
Coatings 15 00246 g019
Figure 20. Roughness value Ra for three reference lines—Arbofill Fichte: 4x_S, with geometric shape.
Coatings 15 00246 g020
Figure 21. Rz value for three reference lines—Arbofill Fichte: 4x_S, with geometric form.
Coatings 15 00246 g021
Figure 22. The maximum Rz value from the analysis of three sections—Arbofill Fichte: 6x_S, with geometric shape: slice 1 (Sl.1); slice 2 (Sl.2); slice 3 (Sl.3).
Coatings 15 00246 g022
Figure 23. Flatness deviation after texturing—Arbofill Fichte: 6x_S.
Coatings 15 00246 g023
Figure 24. Roughness value Ra for three reference lines—Arbofill Fichte: 6x_S, with geometric form.
Coatings 15 00246 g024
Figure 25. Interstitial values for three reference lines—Arbofill Fichte: 6x_S, with geometric shape.
Coatings 15 00246 g025
Table 1. Laser surface technology parameters.
SoftwareCimita Laser Micromachining Software Suite for Laser, Motion, and Vision
LaserDiode-pumped solid state
Cut speed1 [mm/s]
Cut passes4 and 6 passes
Wavelength355 [nm]
Pulse width6 [ps]
Table 2. Contact angle of biodegradable biopolymer.
Biodegradable Biopolymer Biodegradable Biopolymer
4 Texturing Passes
Biodegradable Biopolymer
6 Texturing Passes
No. of SampleContact Angle (°)Texturing TypeNo. of SamplesContact Angle (°)Texturing TypeNo. of SampleContact Angle (°)
Max. Min. AverageMax. Min.Average
189Hexagon194184138 ± 2Hexagon1400 (22 s)-
28428917352200 (9 s)-
39037220373350 (15 s)-
Average87 ± 3Square1240 (15 s)-Square1140 (2 s)-
2160 (20 s)-2180 (2 s)-
3180 (15 s)-3150 (1 s)-
Table 3. COF values.
Biodegradable Biopolymer—COF 0.10 Initial StateCOF
4 texturing passes Hexagon0.20
Square0.51
6 texturing passesHexagon0.26
Square0.49
Table 4. Results of degradation test.
MaterialWeight (g)Difference
Before
Degradation
After
Degradation
Biodegradable
polymer
4 texturing passes30.12330.159+0.036
6 texturing passes31.69731.736+0.039
Table 5. Summary of critical temperatures and absorbed heat during melting process according to the DSC chart in Figure 9.
SampleTs [°C]T50 [°C]Tf [°C]ΔH/m [kJ/kg]
Base material148.7151.0159.2−38.27
4x/hexagonal149.8153.0161.8−37.4
4x/square148.8152.2164.3−33.35
6x/hexagonal132.2154.4165.7−51.25
6x/square137.8151.8163.8−52.28
Table 6. Statistical data for Arbofill Fichte: 4x_H.
No.Reference LineRz (µm)Rq (µm)
1Slice 134.288.67
2Slice 246.6810.22
3Slice 364.889.24
4Mean48.619.38
5Standard deviation15.380.78
6Range30.591.58
73 Sigma46.162.35
Table 7. Statistical data for Arbofill Fichte: 6x_H.
No.Reference LineRz (µm)Rq (µm)
1Slice 177.689.961
2Slice 240.406.887
3Slice 389.408.478
4Mean69.168.352
5Standard deviation25.581.406
6Range49.002.804
73 Sigma76.754.219
Table 8. Statistical data for Arbofill Fichte: 4x_S.
No.Reference LineRz (µm)Rq (µm)
1Slice 139.755.784
2Slice 252.977.334
3Slice 341.546.130
4Mean44.756.416
5Standard deviation7.170.814
6Range13.221.550
73 Sigma21.522.441
Table 9. Statistical data for Arbofill Fichte: 6x_S.
No.Reference LineRz (µm)Rq (µm)
1Slice 142.886.953
2Slice 237.047.446
3Slice 345.548.074
4Mean41.827.491
5Standard deviation4.340.562
6Range8.491.121
73 Sigma13.031.686
Disclaimer/Publisher’s Note: The statements, opinions and data contained in all publications are solely those of the individual author(s) and contributor(s) and not of MDPI and/or the editor(s). MDPI and/or the editor(s) disclaim responsibility for any injury to people or property resulting from any ideas, methods, instructions or products referred to in the content.