Article

Potential of Cellulose After Oxidative Torrefaction for Fuel Enhancement and Utilization: Properties and Pyrolysis Characteristics

by
Lingzhi Zhu
,
Kehui Cen
,
Xiayu Ni
,
Mian Liu
and
Dengyu Chen
*
Co-Innovation Center of Efficient Processing and Utilization of Forest Resources, College of Materials Science and Engineering, Nanjing Forestry University, Nanjing 210037, China
*
Author to whom correspondence should be addressed.
Coatings 2025, 15(4), 407; https://doi.org/10.3390/coatings15040407
Submission received: 26 February 2025 / Revised: 26 March 2025 / Accepted: 27 March 2025 / Published: 29 March 2025
(This article belongs to the Special Issue Advanced Coatings for Fuel Cells)

Abstract

:
This study explored the properties and pyrolysis characteristics of oxidatively torrefied cellulose to enhance biomass utilization and conversion. Cellulose was torrefied at 200–300 °C with oxygen concentrations of 0%–15%. The carbon content in cellulose could reach up to 53.06%, while the oxygen content decreased to 41.53% under the conditions of 300 °C and a 15% oxygen concentration. Meanwhile, its higher heating value (HHV) increased from 15.22 to 16.95 MJ/kg, improving the energy density and fuel quality. Both the carbon yield (CY) and energy yield (EY) of cellulose decreased noticeably with increasing oxygen concentrations at 300 °C, reaching minimum values of 46.33% and 51.05%, respectively, which were lower than the 64.5% and 71.85% observed under non-oxidative torrefaction. FTIR and XRD showed that higher temperatures and oxygen concentrations accelerated cellulose bond breaking and crystallinity disruption, enhancing thermochemical conversion. Oxidative torrefaction lowered the pyrolysis initiation temperature, with the most evident effect occurring at a 5% oxygen concentration of 300 °C. Increased oxygen concentrations altered pyrolysis products, with anhydrosugars rising then falling, and more furans, aromatics, and phenols produced. This study demonstrates that oxidative torrefaction effectively enhances the energy density of cellulose, showing promising potential for biomass utilization as a renewable fuel.

1. Introduction

Biomass is a natural organic substance composed of cellulose, hemicellulose, and lignin, and is widely found in plants. Due to its promising carbon-neutral potential, biomass can be utilized to produce bio-fuels, chemicals, and other high-value-added products, which has attracted notable attention for its energy use [1,2]. However, inherent limitations like high moisture and oxygen contents restrict its direct use. Therefore, it typically requires thermochemical conversion technologies (such as combustion, gasification, and pyrolysis) to enhance its value, with pyrolysis being one of the most promising utilization methods [3,4,5]. Torrefaction is a practical pretreatment that improves biomass fuel properties and pyrolysis characteristics by removing moisture and volatile compounds, thereby enhancing the stability and energy density of the pyrolysis products [6,7,8].
Biomass torrefaction pretreatment ranging from 200 °C to 300 °C is typically carried out in a nitrogen or oxygen atmosphere, and is referred to as non-oxidative torrefaction and oxidative torrefaction, respectively. Currently, most research on how torrefaction affects pyrolysis has focused on non-oxidative torrefaction [9,10]. Studies have shown that torrefaction improves the thermal stability of biomass, increases the activation energy of the pyrolysis reaction [7], and improves the quality of bio-oil, leading to a higher yield of aromatic compounds [11,12]. Additionally, torrefaction treatment can decrease the acidity of bio-oil and improve the HHV (higher heating value) and stability of the produced char [13,14]. Research has demonstrated that different biomass types respond differently to torrefaction, influencing their final pyrolysis behaviors [15,16,17]. Furthermore, the degree of torrefaction significantly affects the chemical pathways of biomass decomposition, leading to different bio-oil compositions and solid fuel properties [18,19]. However, oxidative torrefaction has gradually become the preferred method due to its simplicity, high efficiency, low cost, and closer alignment with practical production needs [10,18,20]. Gao et al. [21] investigated the effects of three different torrefaction pretreatments (inert, oxidative, and wet torrefaction) on the pyrolysis kinetics of corn stover, and found that oxidative torrefaction, due to its ability to reduce the activation energy and improve pyrolysis efficiency, was recommended as the optimal pretreatment method. Soria-Verdugo et al. [22] found that, compared to inert atmospheres, the involvement of oxygen during torrefaction reduced the carbon and hydrogen content in biomass. Ramos-Carmona et al. [23] discovered that the properties of pinewood subjected to low-temperature torrefaction (<240 °C) in an air atmosphere, such as aromaticity, surface area, and morphology, were similar to those obtained from non-oxidative torrefaction at higher temperatures. Despite the extensive research on the oxidative torrefaction of biomass, most studies have focused on the overall biomass, with limited research specifically targeting individual components.
Oxidative torrefaction, as an effective biomass pretreatment method, can markedly alter the physicochemical properties of biomass, thereby optimizing its performance in subsequent pyrolysis processes. Currently, research on the impact of oxidative torrefaction on pyrolysis is still progressing. Several studies have investigated the pyrolysis characteristics of different biomasses under oxidative torrefaction conditions. Huang et al. [24] studied the effects of oxidative torrefaction with varying oxygen concentrations on the pyrolysis of camellia shell, and found that as the oxygen concentration increased, the CO content in the gas products markedly increased during pyrolysis and the pyrolysis reactions became more dynamic. Zhang et al. [25] examined the pyrolysis of oxidatively torrefied Clitocybe maxima stipes and observed that oxidative torrefaction enhanced the specific surface area and lead ion adsorption capacity of the pyrolysis biochar while also reducing the acidity of the liquid products and increasing the nitrogen content and phenolic compound levels. Other studies have also shown that oxidative torrefaction improves biochar properties [26,27]. Wang et al. [28] found that cellulose torrefied at 300 °C increased the yield of furfural and anhydrosugars in the pyrolysis products while reducing the amount of 5-hydroxymethylfurfural. Most existing studies focused on the pyrolysis of oxidatively torrefied biomass or non-oxidatively torrefied components. In contrast, there is still limited research on the impact of oxidative torrefaction on the pyrolysis of individual biomass components, and this field remains a promising area for further exploration.
Cellulose, a major component of biomass, has been extensively studied in the fields of torrefaction and pyrolysis. Due to its crystalline structure and thermal stability, cellulose undergoes a distinct thermal decomposition process compared to hemicellulose and lignin [29,30]. Zheng et al. [31] found that cellulose primarily undergoes deoxygenation, polymerization, and carbonization during the torrefaction process, and the optimal torrefaction temperature should be below 280 °C. Lv et al. [32] investigated the torrefaction process of cellulose and found that between 220 °C and 280 °C, the equivalence of temperature and time only applied when the mass loss did not exceed 50%. Li et al. [33] studied the effect of cellulose torrefaction on its pyrolysis and found that the degree of aromaticity in the pyrolysis biochar increased as the pretreatment temperature rose, while also enhancing the biochar’s thermal stability and hydrophobicity. This finding is supported by Chen et al. [34], who found that torrefaction promotes the structural transformation of cellulose, enhancing char formation during pyrolysis, particularly in the presence of potassium catalysts. Bennadji et al. [35] explored the stepwise pyrolysis of cellulose and found that the main products can be divided into heavy volatiles and light volatiles. Kawamoto [36] investigated the pyrolysis reactions and molecular mechanisms of cellulose, revealing that at high temperatures, cellulose rapidly depolymerized to produce anhydrosugars like levoglucosan, while at lower temperatures, mainly carbonaceous material and water are formed. Additionally, research by Chen et al. [29] suggests that torrefaction has varying impacts on the decomposition of hemicellulose, cellulose, and lignin. While cellulose largely maintains its stability up to 300 °C, hemicellulose degradation produces furfural and acetic acid, influencing the subsequent pyrolysis product distribution. Ni et al. [37] found that torrefaction enhances carbonization, reducing volatile contents while improving the heating value of cellulose biochar. Although extensive research has been conducted on the non-oxidative torrefaction and pyrolysis of cellulose, there are still limited studies on the effects of oxidative torrefaction on its properties and pyrolysis process.
The aim of this study was to systematically investigate the effects of oxidative torrefaction on the fuel properties and pyrolysis behavior of cellulose from the perspective of biomass components. By selecting cellulose as a typical biomass component, the study explored the changes in the elemental composition, chemical structure, and thermochemical conversion behavior under different oxidative torrefaction conditions (200 °C, 250 °C, and 300 °C; oxygen concentrations of 0%, 5%, 10%, and 15%). In addition, TG and Py-GC/MS analyses were employed to evaluate the pyrolysis behavior of the oxidative torrefaction products. This study is intended to provide theoretical support for improving the efficiency of biomass energy conversion and promoting the application of oxidative torrefaction as an effective pretreatment method for renewable biofuel production.

2. Materials and Methods

2.1. Materials and Oxidative Torrefaction Experiment

In this study, cellulose was used as the raw material, which was purchased from Sigma-Aldrich and was oven-dried at 105 °C for 24 h (GB/T 28731-2012 [38]). The oxidative torrefaction experiment was carried out in a vertical tube furnace (VTL1200–1200, Bojunton, Nanjing, China). Three torrefaction temperatures (200 °C, 250 °C, and 300 °C) and four oxygen concentrations (0%, 5%, 10%, and 15%) were selected, with a torrefaction time of 40 min. The torrefaction atmosphere was regulated by a gas supply system (GX–2, Bojunton, Nanjing, China) to adjust the ratio of nitrogen and oxygen fed into the furnace, with a total flow rate of 300 mL/min. Each experiment involved measuring 0.5 g of cellulose and evenly distributing it in a cylindrical container, which was then positioned at the top of a quartz tube. Once the furnace attained the preset temperature, the crucible was lowered into the pyrolysis zone of the quartz tube for torrefaction. Each measurement was repeated three times, and the average value was used for analysis. The measurement error was within 5%, ensuring the accuracy and reliability of the data. The oxygen content was estimated by the difference method.

2.2. Sample Labeling and Characterization

Cellulose was labeled as CE, and the torrefied solid products were labeled as “CE-YY-ZZ”, where YY and ZZ represented the torrefaction temperature and oxygen concentration, respectively. For instance, CE-200-5 refers to the torrefied product of cellulose at 200 °C with an oxygen concentration of 5%. CE-YY-0 indicates the non-oxidative torrefaction product under a pure nitrogen atmosphere. The characterization of the cellulose sample is provided in the Supplementary Materials, including the ultimate analysis, HHV, FTIR, XRD, TG/DTG, and PY-GC/MS analyses.

2.3. Indicators

The definitions of the indicators for solid yield (SY), energy yield (EY) [39], decarbonization (DC), dehydrogenation (DH), and deoxygenation (DO) [40] are as follows:
Solid   yield   ( % ) = Weight torrefied Weight raw × 100
Energy   yield   ( % ) =   Weight torrefied ×   HHV torrefied Weight raw   × HHV raw × 100
where the subscripts “raw” and “torrefied” represent the original and torrefied samples, respectively.
D C   ( % ) = ( 1 M 0 × SY × Y C , t M 0 × Y C , 0 ) × 100
D H   ( % ) = ( 1 M 0 × SY × Y H , t M 0 × Y H , 0 ) × 100
D O   ( % ) = ( 1 M 0 × SY × Y O , t M 0 × Y O , 0 ) × 100
where M represents the mass of the dry sample, and YC, YH, and YO represent the mass fractions of C, H, and O, respectively. SY denotes the solid yield. The subscripts t and 0 refer to cellulose before and after torrefaction, respectively.

3. Results

3.1. Physicochemical Characteristics

3.1.1. Basic Properties of Cellulose Before and After Oxidative Torrefaction

The ultimate analysis and HHV analysis results from the cellulose raw material and oxidative torrefaction products are presented in Table 1, which are consistent with previously reported results [37,41]. The ultimate analysis results showed that carbon and oxygen were the primary components of cellulose, together accounting for more than 90% of its total composition. Among them, the oxygen content was relatively higher, and oxygen was mainly present in the forms of hydroxyl (–OH) and carboxyl (–COOH) in cellulose [42]. These functional groups in cellulose contributed to the hydrophilicity of the biomass and resulted in a lower HHV, affecting the properties of the pyrolysis products. After torrefaction, a substantial quantity of oxygen-containing functional groups was removed from cellulose. Cellulose’s fuel properties were thus improved.
According to the ultimate analysis results, as the temperature and oxygen concentration rose, the carbon content in cellulose gradually increased due to the progressive removal of oxygen, whereas the hydrogen and oxygen contents decreased to varying degrees, reaching their minimum values at 300 °C and a 15% oxygen concentration. The carbon content in cellulose increased from 41.29% in the raw material to a maximum of 53.06%, while the oxygen content dropped from 52.16% in the raw material to 41.53%. This increase in carbon content is directly correlated with the increase in the energy density of the cellulose, as the higher carbon proportion improves the fuel quality. The ultimate analysis results of three samples subjected to non-oxidative torrefaction with an oxygen concentration of 0% showed that the carbon content in the torrefaction products at 200 °C, 250 °C, and 300 °C were 41.52%, 42.73%, and 45.49%, respectively. These values were all higher than 41.29% for the raw material, and the higher the torrefaction temperature, the greater the increase in the carbon content. Meanwhile, the oxygen content decreased to 51.97%, 50.87%, and 48.25%, respectively. This indicated that non-oxidative torrefaction effectively reduced the oxygen content in cellulose, increasing the carbon proportion and enhancing the energy density of the cellulose.
An increase in the torrefaction temperature, similar to non-oxidative torrefaction, caused decreases in moisture and oxygen-containing functional groups, resulting in a substantial decrease in the oxygen content. At specific torrefaction temperatures, oxidative torrefaction proved to be more effective at reducing the oxygen content than non-oxidative torrefaction. For example, at 250 °C, the carbon and oxygen contents of the non-oxidative torrefaction were 42.73% and 50.87%, respectively, while at the same temperature with an oxygen concentration of 5%, the carbon and oxygen contents were 43.95% and 49.81%, respectively. Additionally, as the oxygen concentration during torrefaction rose at this temperature, the oxygen content continued to drop, while the proportion of the carbon content increased further. This confirms that oxidative torrefaction has a better deoxygenation and carbon enrichment effects compared to non-oxidative torrefaction. In addition, the increase in the torrefaction temperature not only altered the elemental composition but also improved the higher heating value of cellulose. After torrefaction at 300 °C, the HHV of cellulose reached its maximum value of 16.95 MJ/kg. The increase in the HHV was closely related to the increase in the carbon content in cellulose. Higher temperature torrefaction effectively increased the carbon content and energy density of cellulose, enhancing its potential as a biofuel. In non-oxidative torrefaction, cellulose typically loses oxygen through the release of compounds like CO, CO2, and H2O, and a similar deoxygenation process also occurs in oxidative torrefaction. However, the HHV of the oxidatively torrefied products of cellulose at 300 °C was slightly lower than that of non-oxidatively torrefied products. This could be attributed to the increased reactivity of oxygen at high temperatures during torrefaction, which led to more oxygen being removed from cellulose in the form of CO, thus consuming more carbon and lowering the HHV.

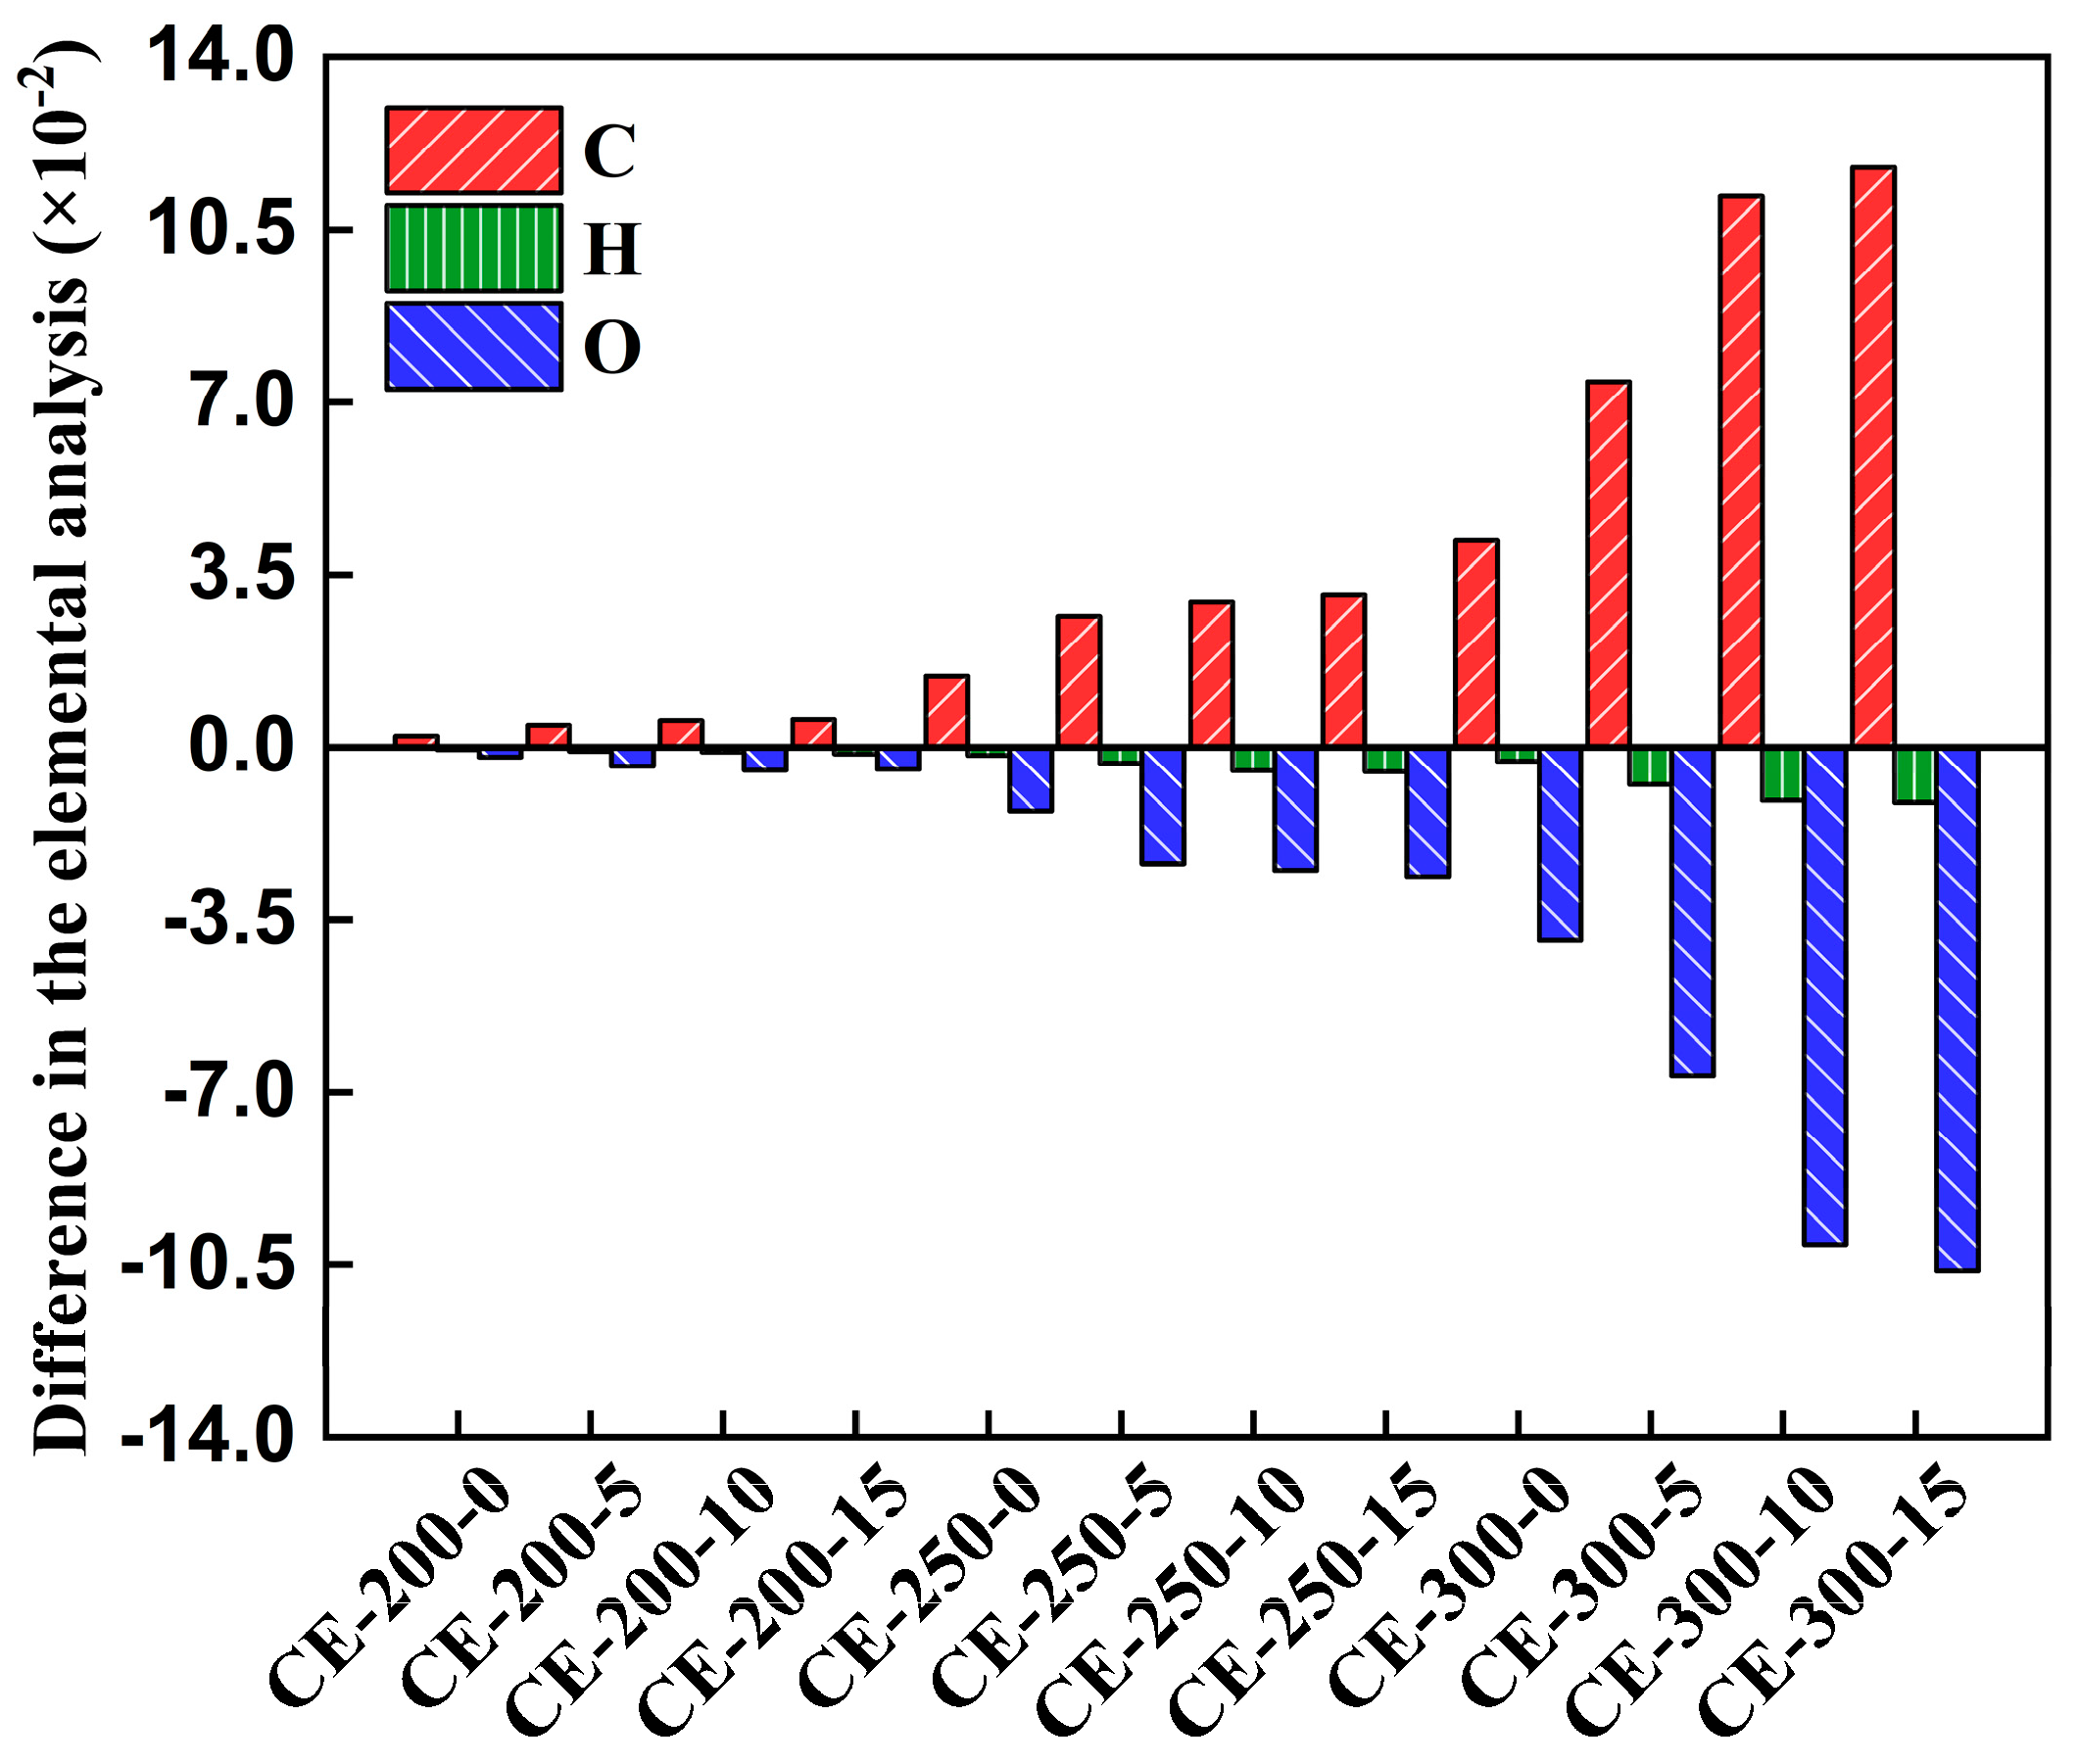
3.1.2. Changes in the Carbon, Hydrogen, and Oxygen Contents of Cellulose

Figure 1 shows the differences in the carbon, hydrogen, and oxygen contents of samples before and after torrefaction. For instance, the carbon content of the sample CE-200-5 was 41.54%, while the carbon content of the raw cellulose was 41.29%, resulting in a difference of 0.0025. It can be observed that increases in the torrefaction temperature and oxygen concentration resulted in a positive difference in the carbon content, whereas the differences in the oxygen and hydrogen contents were negative. The torrefaction temperature is a decisive factor influencing the elemental composition. When the torrefaction temperatures were 200 °C and 250 °C, the elemental changes in cellulose were relatively minor, especially at 200 °C, where the differences in elements were minimal. At lower torrefaction temperatures, the reactions were not very pronounced, but once the temperature exceeded 290 °C, the reaction rate increased [43]. At 300 °C, the differences in the C, H, and O elements between the torrefied cellulose and the raw material became more evident, likely due to the cleavage of glycosidic bonds in cellulose, which requires higher temperatures [44]. At 200 °C, variations in the oxygen concentration had a minimal impact on the elemental composition. However, as the torrefaction temperature reached 250 °C and 300 °C, the effect of the oxygen concentration became more pronounced. Compared to non-oxidative torrefaction with 0% oxygen, oxidative torrefaction had a greater impact on the oxygen content in cellulose, and hydrogen followed a similar trend. This is likely due to the oxidation reaction increasing the reaction rate of torrefaction, thereby accelerating deoxygenation [45]. As the oxygen concentration increased from 5% to 15%, the changes in elemental contents became less pronounced, suggesting that excessively high oxygen concentrations may be unfavorable for torrefaction.

3.1.3. Decarbonization, Dehydrogenation, and Deoxygenation

Figure 2 shows the decarbonization, dehydrogenation, and deoxygenation of cellulose. As shown in Figure 1, the relative contents of C, H, and O in cellulose increased or decreased under different torrefaction conditions. However, compared to the raw material, the C, H, and O elements all decreased to varying degrees. As the torrefaction temperature and oxygen concentration increased, the removal rates of the C, H, and O elements in the cellulose samples gradually increased, with the torrefaction temperature being the main influencing factor. It can be observed that when temperature increased from 200 °C to 250 °C, the DC, DH, and DO of cellulose showed considerable increases, reaching maximum values of 12.08%, 24.38%, and 22.31%, respectively. However, the overall removal rate remained relatively low. When the temperature rose from 250 °C to 300 °C, the DC, DH, and DO reached 40.46%, 61.64%, and 63.11%, respectively, indicating that most of the hydrogen and oxygen elements in the cellulose were removed, thereby improving the energy density of cellulose. Since 300 °C is considered a high temperature for cellulose torrefaction, it can be inferred that the suitable torrefaction temperature for cellulose should be between 250 °C and 300 °C.
It can be observed that the removal rate of oxygen was notably faster than that of carbon, resulting in a continuous rise in the relative content of carbon. This confirms that, during the torrefaction pretreatment of cellulose, oxidative torrefaction has better deoxygenation effects than non-oxidative torrefaction. This phenomenon aligns with previous findings on non-oxidative torrefaction [41]. For example, at 300 °C, the DH and DO for non-oxidative torrefaction were 38.27% and 40.34%, respectively, while at an oxygen concentration of 5%, they were 53.49% and 54.15%, respectively. An increase in the oxygen concentration from 0% to 5% resulted in an increase of 15.22% and 13.82% in DH and DO, respectively. However, as the oxygen concentration increased from 5% to 15%, DH and DO increased by 8.15% and 8.96%, respectively. Therefore, the most pronounced increase in DH and DO occurred when moving from non-oxidative torrefaction to a 5% oxygen concentration. It is noteworthy that although the hydrogen content was relatively low in cellulose and the change in its difference before and after torrefaction was small, the dehydrogenation percentage shown in Figure 2 was second only to deoxygenation and higher than decarbonization. Moreover, oxidative torrefaction has a better dehydrogenation effect, which may be due to the participation of oxygen, which increases the reaction rate and promotes dehydration reactions, thereby accelerating the removal of hydrogen.

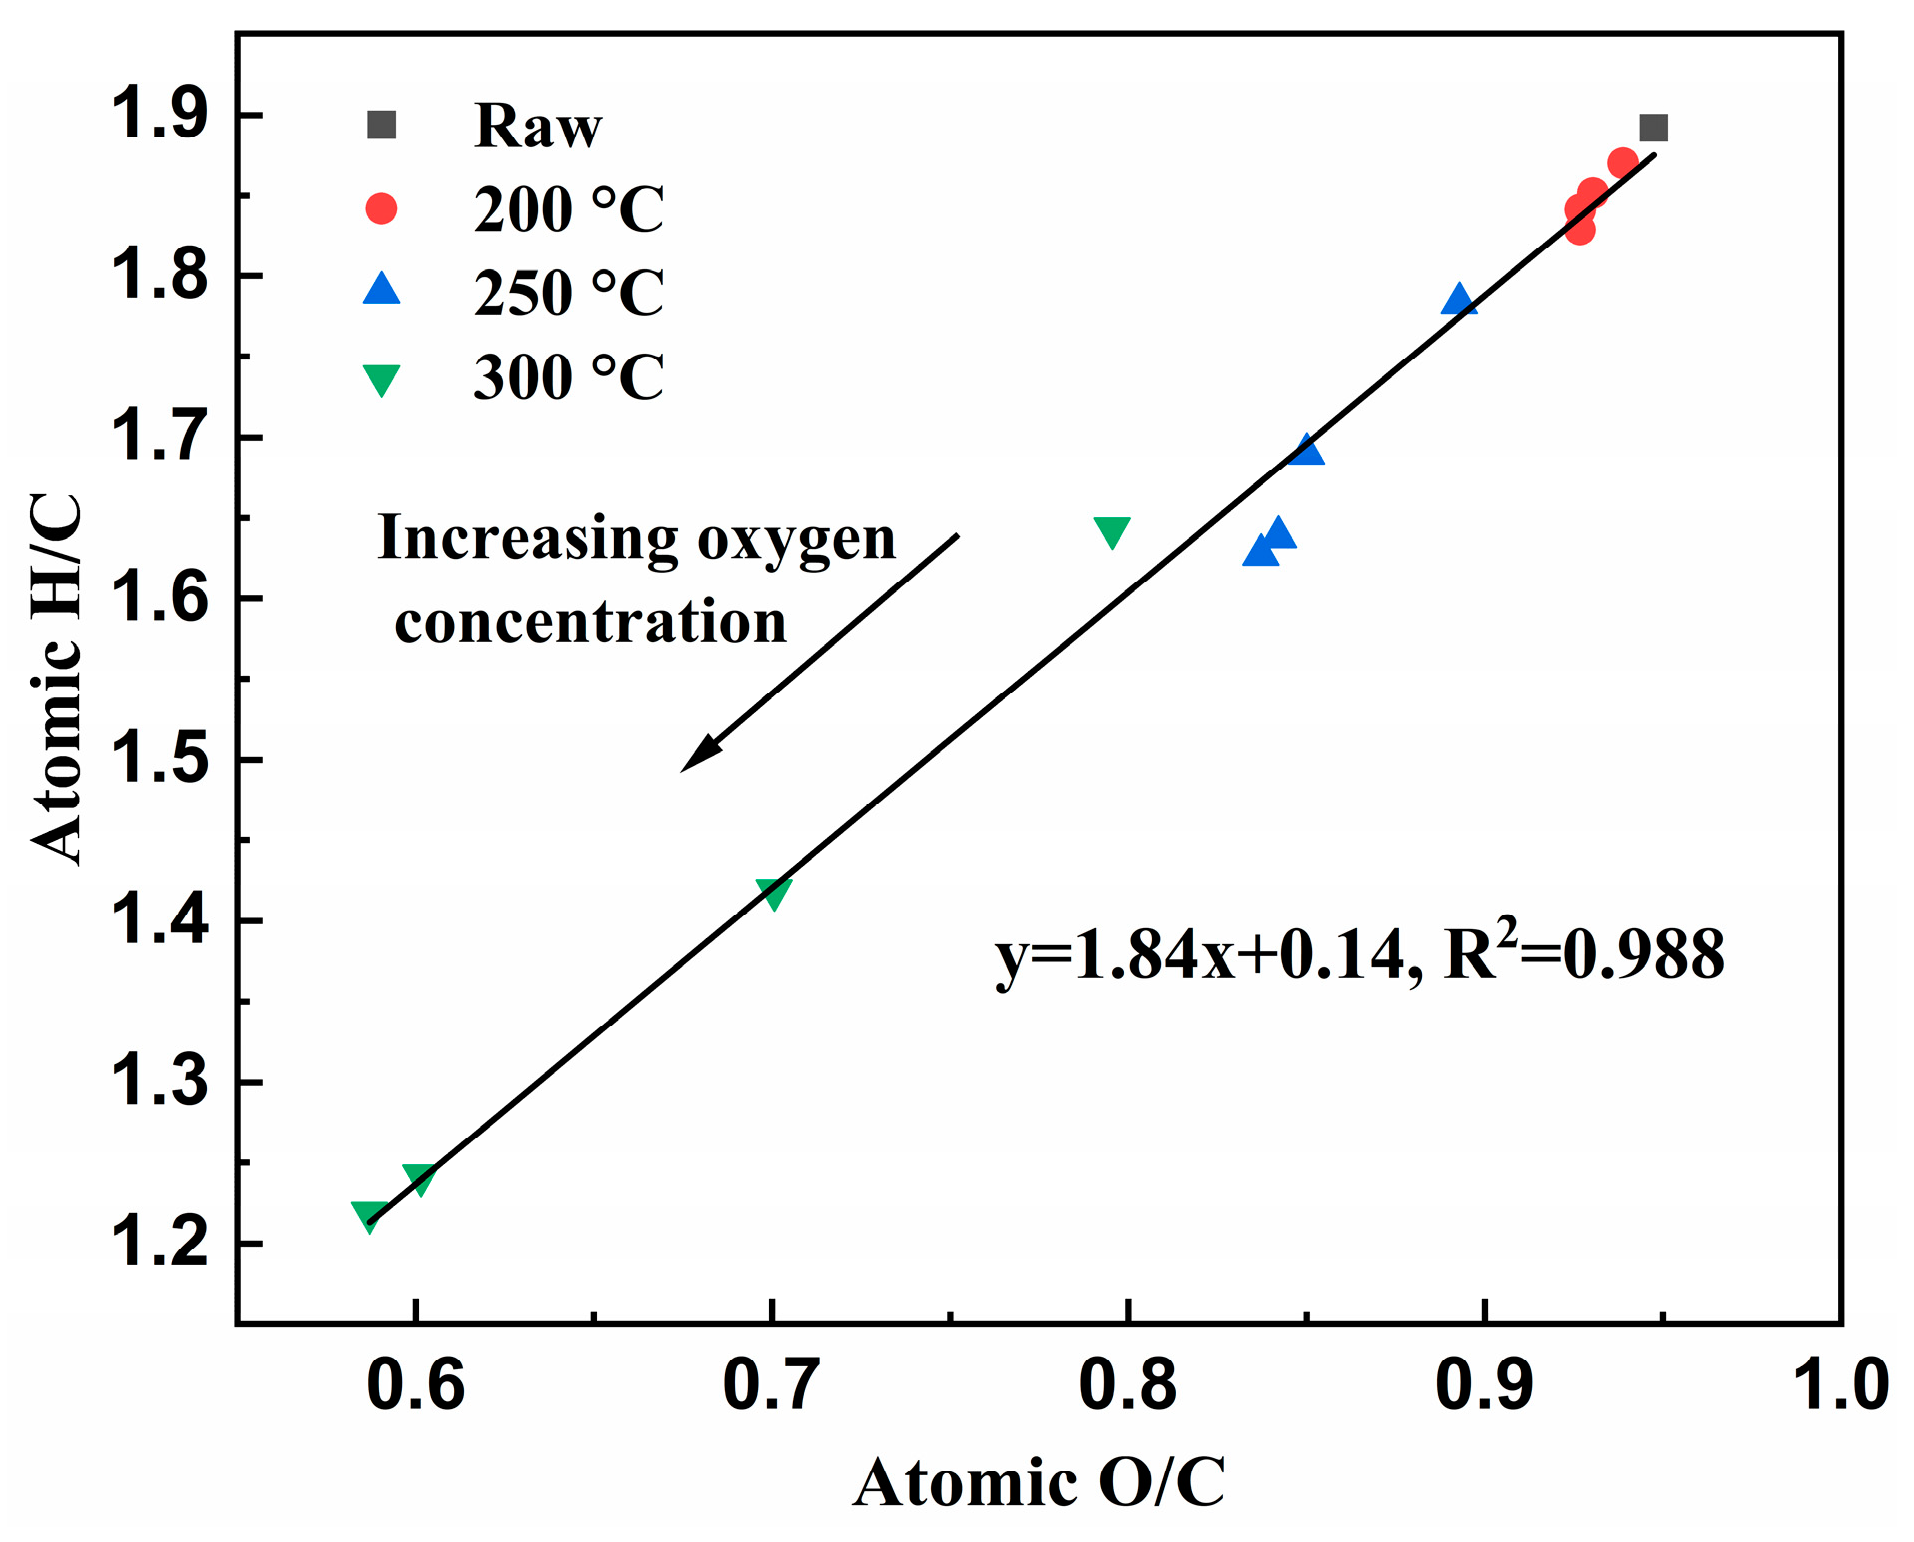
3.1.4. Van Krevelen Diagram of Cellulose

Figure 3 presents the van Krevelen diagram of cellulose samples. The atomic H/C and O/C ratios presented in Figure 3 are important indicators for assessing the energy density of the samples. Typically, a substance with lower H/C and O/C ratios tends to have a higher energy density and better fuel properties. It was evident that the H/C and O/C ratios of the torrefied cellulose were lower than those of the raw material, indicating that both non-oxidative and oxidative torrefaction improved the elemental composition of cellulose. Additionally, as the torrefaction temperature increased, the H/C and O/C ratios of cellulose decreased, resulting in improved fuel properties. The points at 200 °C were closely clustered, whereas at 300 °C, the points corresponding to different oxygen concentrations became more dispersed. This phenomenon indicated that the influence of the oxygen concentration on the elemental composition of cellulose increased with the torrefaction temperature. The relationship between the H/C and O/C ratios of cellulose can be represented by a linear equation with a slope of 1.84 (ΔH/CO/C), which is higher than the slope for a simple dehydration reaction (ΔH/CO/C = 2). This result suggested that during torrefaction, in addition to water, cellulose also released oxygen-containing compounds such as CO and CO2, leading to the more rapid removal of oxygen compared to a simple dehydration reaction [46]. However, the slope of the fitted line for oxidative torrefaction was slightly higher than the slope for non-oxidative torrefaction in previous studies (ΔH/CO/C = 1.57) [41]. This could be attributed to the participation of oxygen, which accelerated the decomposition of hydrogen-containing compounds in the biomass, particularly the elimination of volatiles, making the removal of hydrogen faster [47].

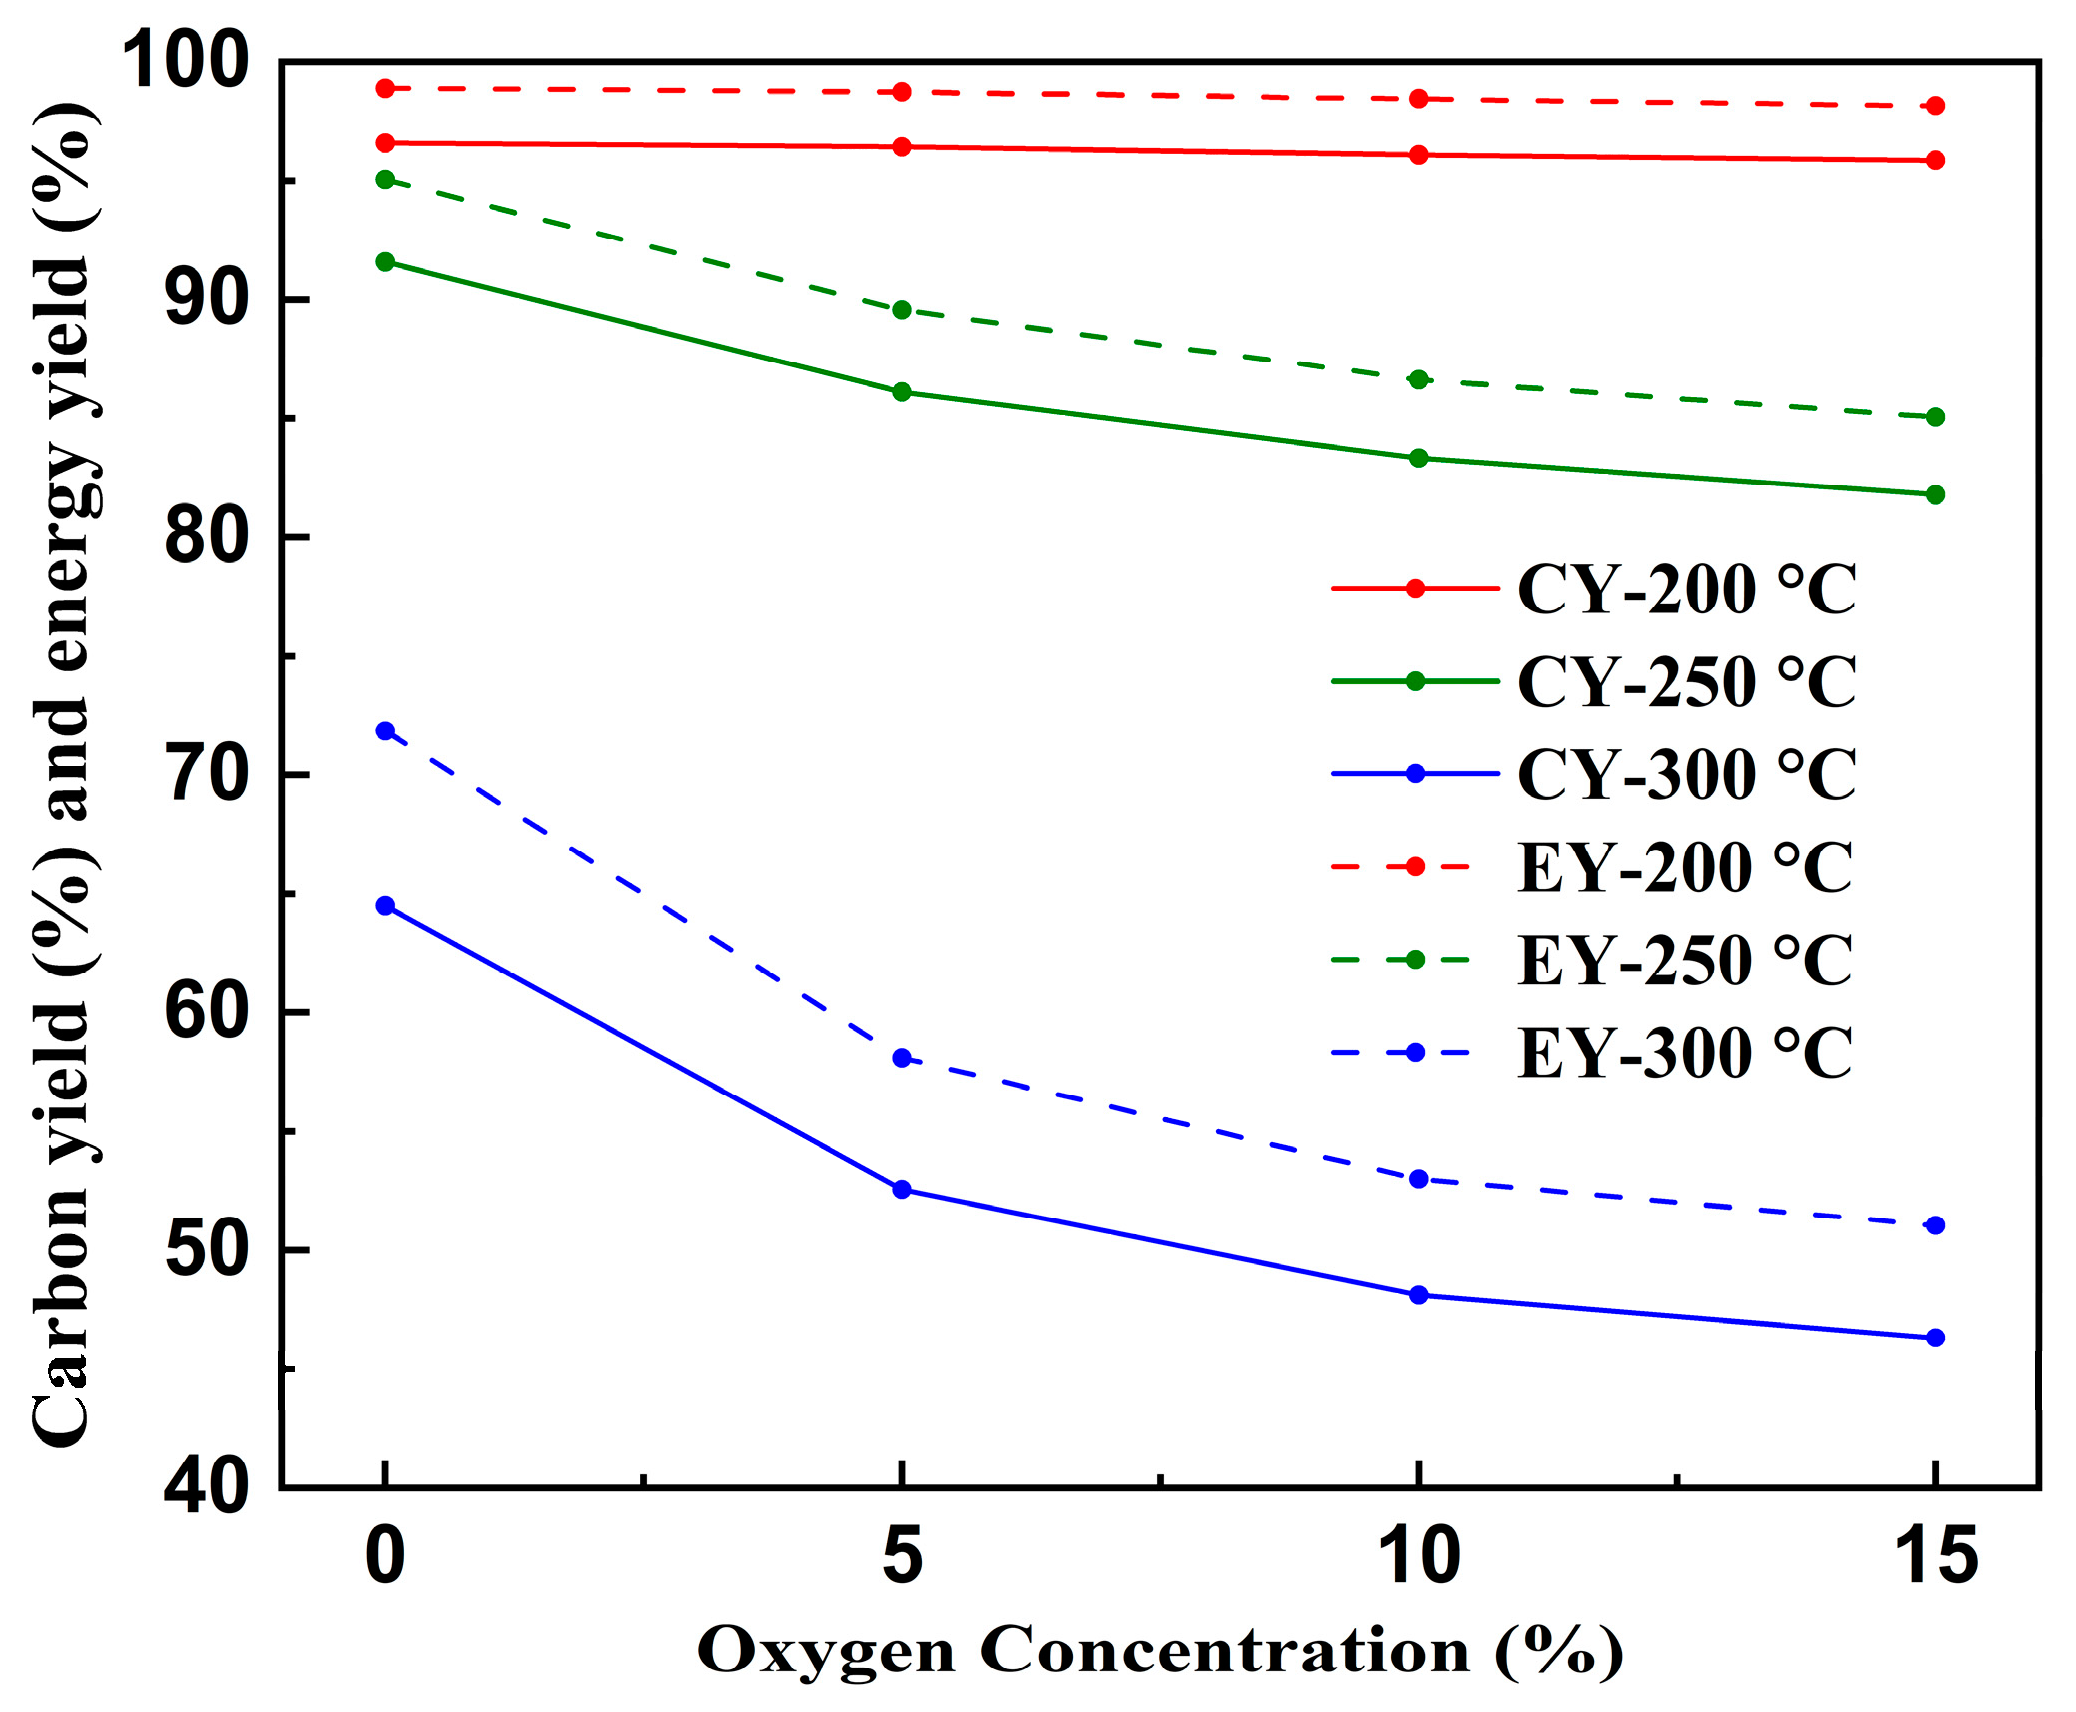
3.1.5. Carbon Yield and Energy Yield

Figure 4 shows the carbon yield (CY) and energy yield (EY) of cellulose during torrefaction. Carbon yield is numerically equivalent to solid yield. As the oxygen concentration increased, the CY and EY of cellulose in oxidative torrefaction decreased to varying extents at different torrefaction temperatures. It can be observed that regardless of the torrefaction conditions, the EY of cellulose was always higher than the CY, with both showing similar trends. This indicated that both oxidative and non-oxidative torrefaction enhanced the calorific value of cellulose. At 200 °C, the CY and EY of cellulose followed a nearly flat line, with values both above 95%. This indicated that the difference between oxidative and non-oxidative torrefaction at 200 °C was minimal, and changes in oxygen concentration had little impact on CY and EY. As oxygen concentration increased from 5% to 15%, CY and EY decreased by only 0.55% and 0.59%, respectively. At 250 °C, as the oxygen concentration increased, the CY and EY showed a slight downward trend. The reduction in yield between non-oxidative torrefaction and oxidative torrefaction at a 5% oxygen concentration was more noticeable, with CY and EY decreasing by 5.47% and 5.48%, respectively. The effect of the oxygen concentration on the yield also gradually became apparent. Furthermore, it can be observed that the lines for 200 °C and 250 °C were quite close to each other, while they were farther from the line for 300 °C. This may be due to the fact that cellulose undergoes more noticeable changes at torrefaction temperatures above 280 °C, meaning that torrefaction at 250 °C has a less pronounced impact on the yield [31]. Within this temperature range, cellulose primarily underwent dehydration and the volatilization of some light volatiles.
When the torrefaction temperature reached 300 °C, cellulose began to carbonize. The CY and EY values for non-oxidative torrefaction were 64.5% and 71.85%, respectively, indicating a notable decrease in yield. The effects of the presence or absence of oxygen on the CY and EY increased with the torrefaction temperature. The differences in CY and EY between 0% and 5% oxygen concentrations were 11.94% and 13.75%, respectively. At 300 °C, the impact of increasing oxygen concentrations on CY and EY became more pronounced. When the oxygen concentration increased from 5% to 15%, CY and EY decreased by 6.23% and 7.05%, respectively. The lowest CY and EY for the oxidative torrefaction of cellulose were 46.33% and 51.05%, occurring at 300 °C with a 15% oxygen concentration. As the temperature increased, the presence of oxygen enhanced the oxidation process on the cellulose surface, promoting heat and mass transfer [48]. As observed in the previous analysis, higher torrefaction temperatures and oxygen concentrations can effectively increase the carbon content of cellulose, thereby increasing its energy density. However, they also caused the CY and EY of cellulose to decrease to a lower value, which resulted in an increased demand for raw materials in subsequent processes. Therefore, during torrefaction, it is important to balance energy density and yield based on the specific requirements.

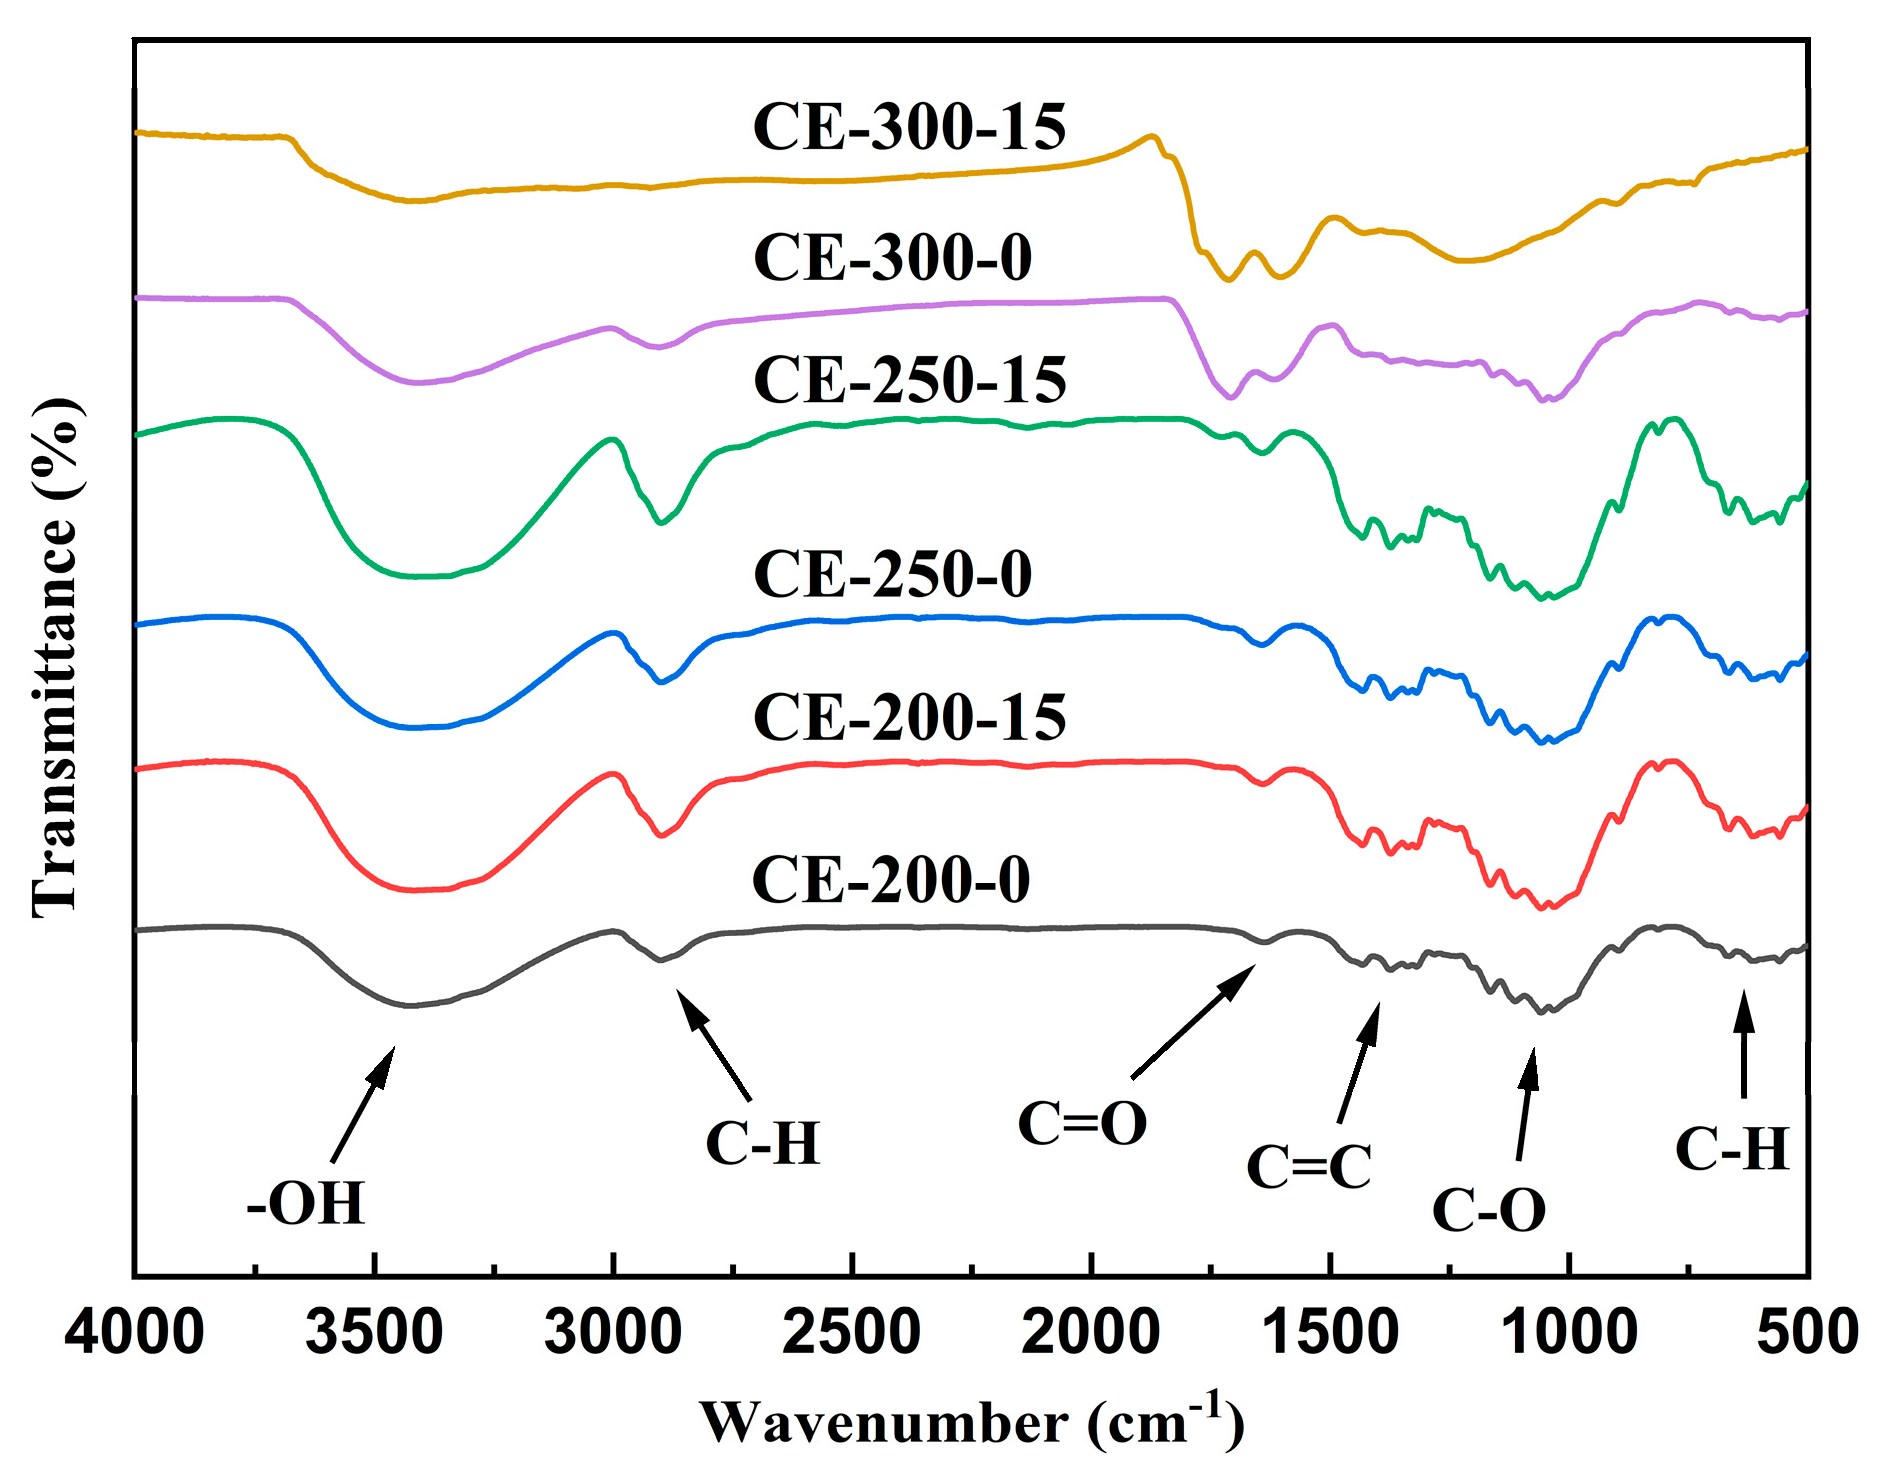
3.1.6. FTIR Analysis
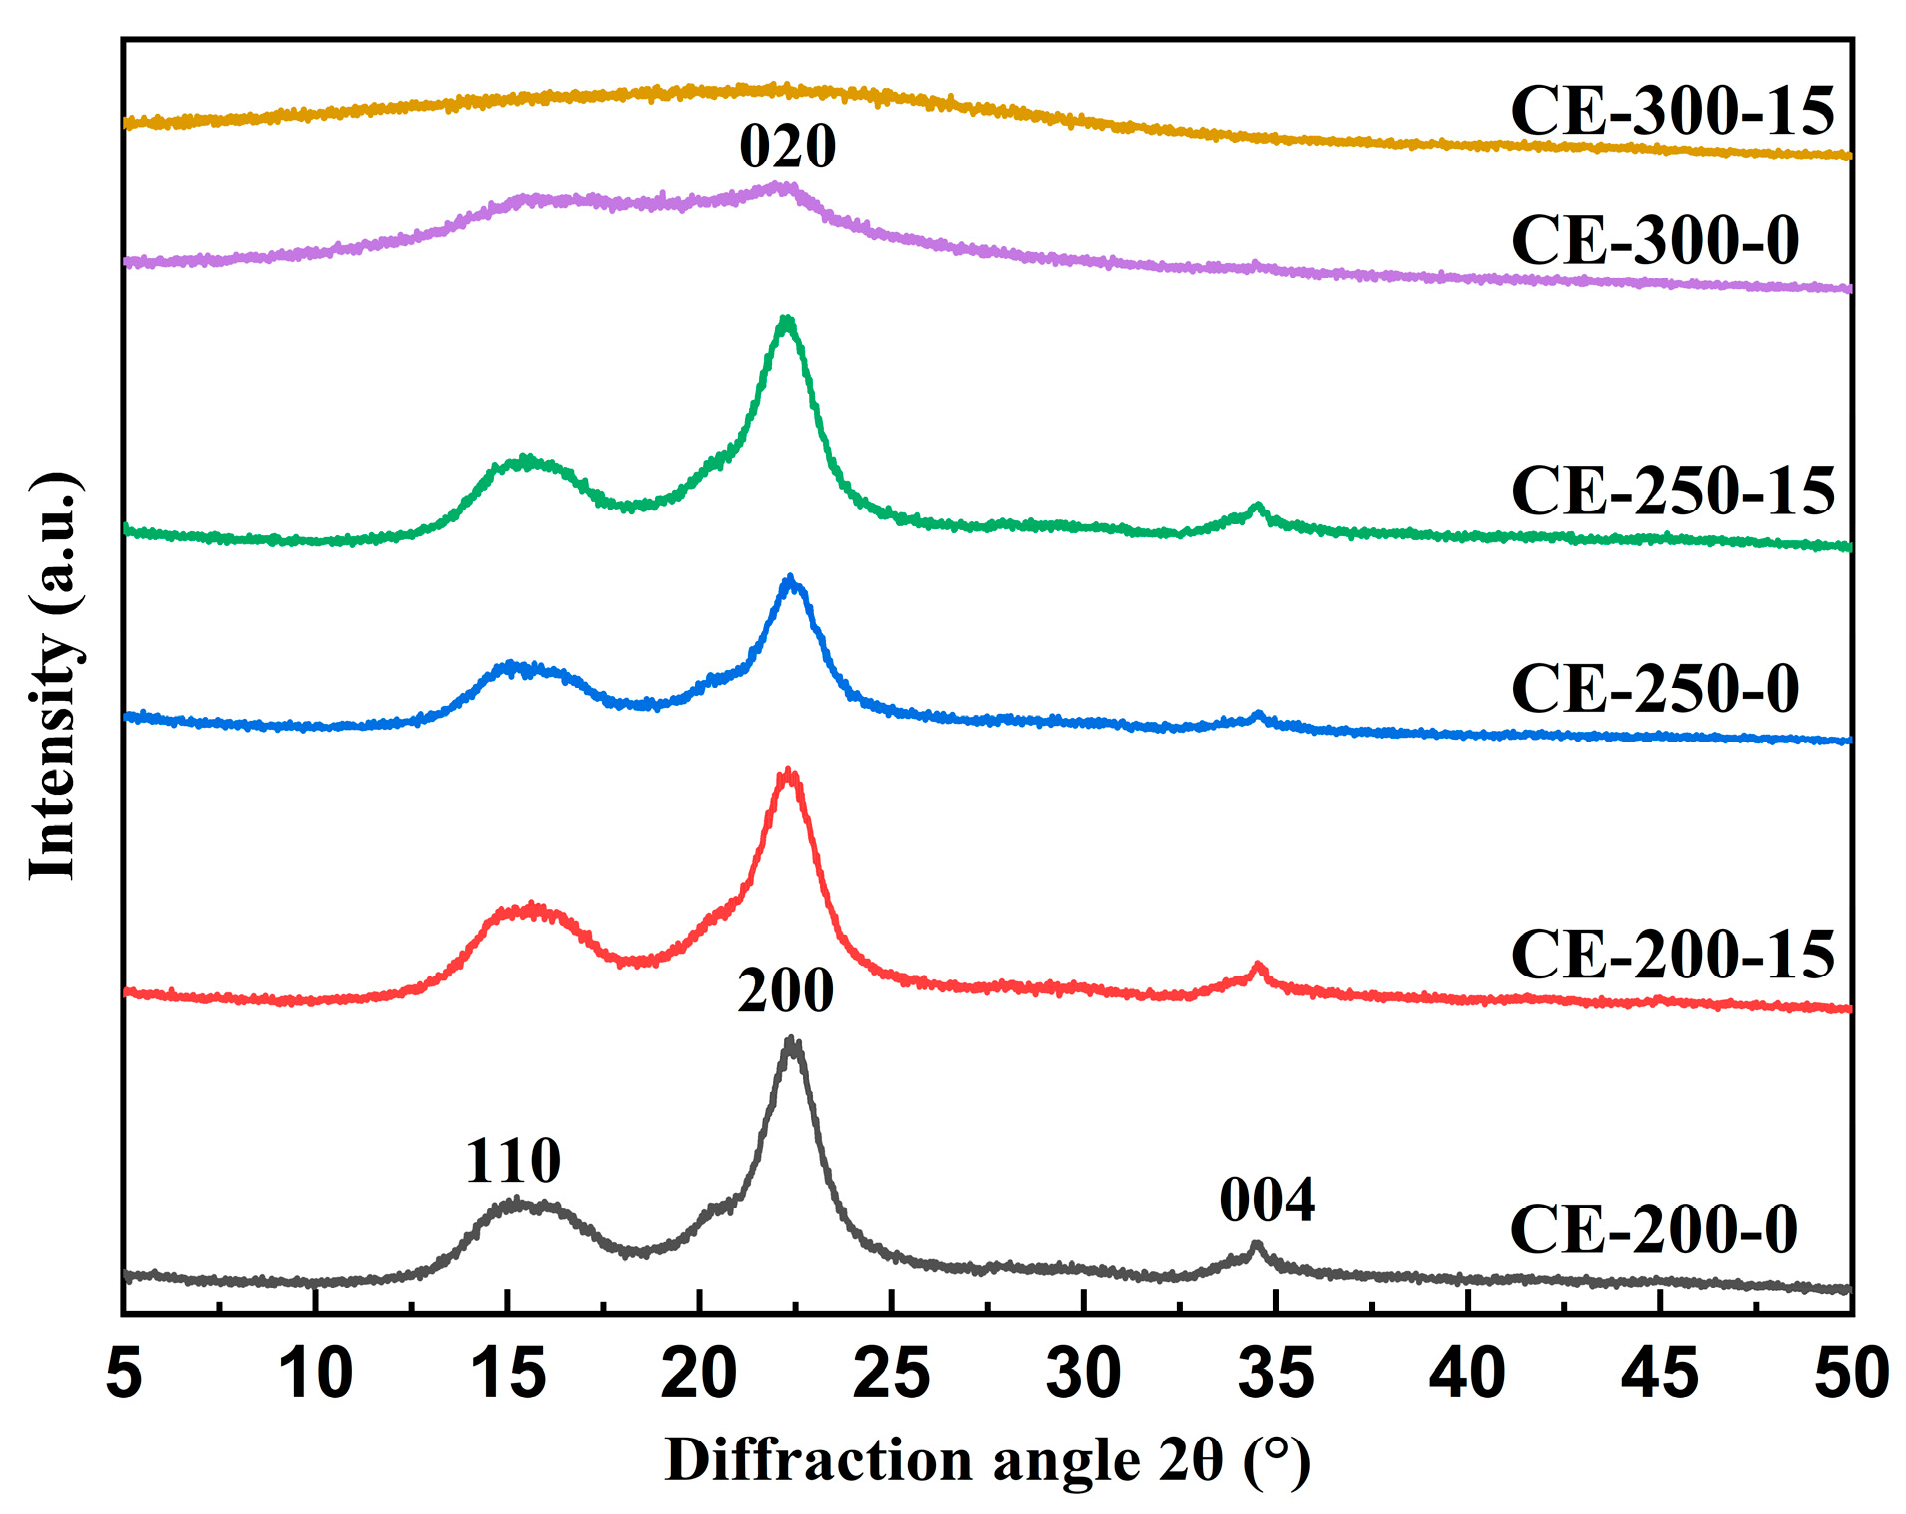
Figure 5 presents the FTIR spectra of cellulose subjected to non-oxidative torrefaction and oxidative torrefaction with a 15% oxygen concentration. The spectra exhibit six distinct characteristic peaks at 3700–3100, 3000–2700, 1750–1500, 1610–1450, 1400–1250, and 700–550 cm−1, corresponding to the stretching vibrations of –OH, C–H, C=O (carbonyl and carboxyl functional groups), C=C (aromatic benzene ring skeleton), C–O, and C–H, respectively [42]. As the torrefaction temperature increased, the intensity of these peaks generally decreased. At 200 °C and 250 °C, only minor changes were observed in the characteristic peaks of each functional group, suggesting that at temperatures below 250 °C, torrefaction mainly resulted in the removal of moisture and light volatiles from cellulose, with little impact on its chemical structure, regardless of oxidative or non-oxidative conditions.
However, at 300 °C, the FTIR spectrum displayed noticeable differences compared to those at 200 °C and 250 °C. The characteristic peak for –OH was markedly weakened, indicating the extensive cleavage of hydroxyl groups at this temperature. Meanwhile, the C=O characteristic peak became more pronounced at 300 °C, likely resulting from the reorganization of carbonyl and carboxyl functional groups during high-temperature torrefaction. Additionally, at 300 °C, the intensity of most of the characteristic peaks during oxidative torrefaction was lower than that during non-oxidative torrefaction, particularly the C–H peaks at 3000–2700 cm−1 and 700–550 cm−1, which almost disappeared in the oxidative torrefaction spectrum. Oxygen played a key role in accelerating the torrefaction of cellulose, promoting the breaking of chemical bonds within the structure. Additionally, the characteristic C–O peak also weakened in the presence of oxygen, likely due to decarboxylation reactions occurring in the oxygen atmosphere, with more C–O functional groups being released as light CO gases.

3.1.7. XRD Analysis

Figure 6 presents the XRD patterns of cellulose torrefaction products, showing the diffraction characteristics of the samples treated at various temperatures and oxygen concentrations. At 200 °C and 250 °C, distinct peaks at 2θ ≈ 16.0°, 22.5°, and 34.7° correspond to the (110), (200), and (004) planes of cellulose Iβ, indicating a typical monoclinic crystalline structure [49]. The positions and intensities of the main peaks remained almost unchanged under both oxidative and non-oxidative conditions, suggesting that torrefaction at these temperatures had little effect on the crystalline structure of cellulose. However, when the torrefaction temperature increased to 300 °C, the diffraction peak at 2θ ≈ 16.0° attributed to cellulose Iβ was significantly decreased in intensity, while the main peak shifted leftward to 2θ ≈ 22.0°, corresponding to the (020) plane of cellulose II. This indicates that the crystal structure of cellulose began to transform from cellulose Iβ to cellulose II. At this temperature, the crystalline region of cellulose was partially degraded and converted into small volatile molecules such as H2O and CO2 [50]. The difference between oxidative and non-oxidative torrefaction became more apparent at 300 °C. In oxidative torrefaction, only a broad diffraction peak around 2θ ≈ 20.0° was observed, characteristic of amorphous cellulose, suggesting that the structure further transformed from cellulose II into an amorphous state. This may be attributed to the involvement of 15% oxygen, which caused oxidative reactions in cellulose during the torrefaction process, releasing heat and leading to a disruption of the local crystalline structure of cellulose.

3.2. Pyrolysis Characteristics

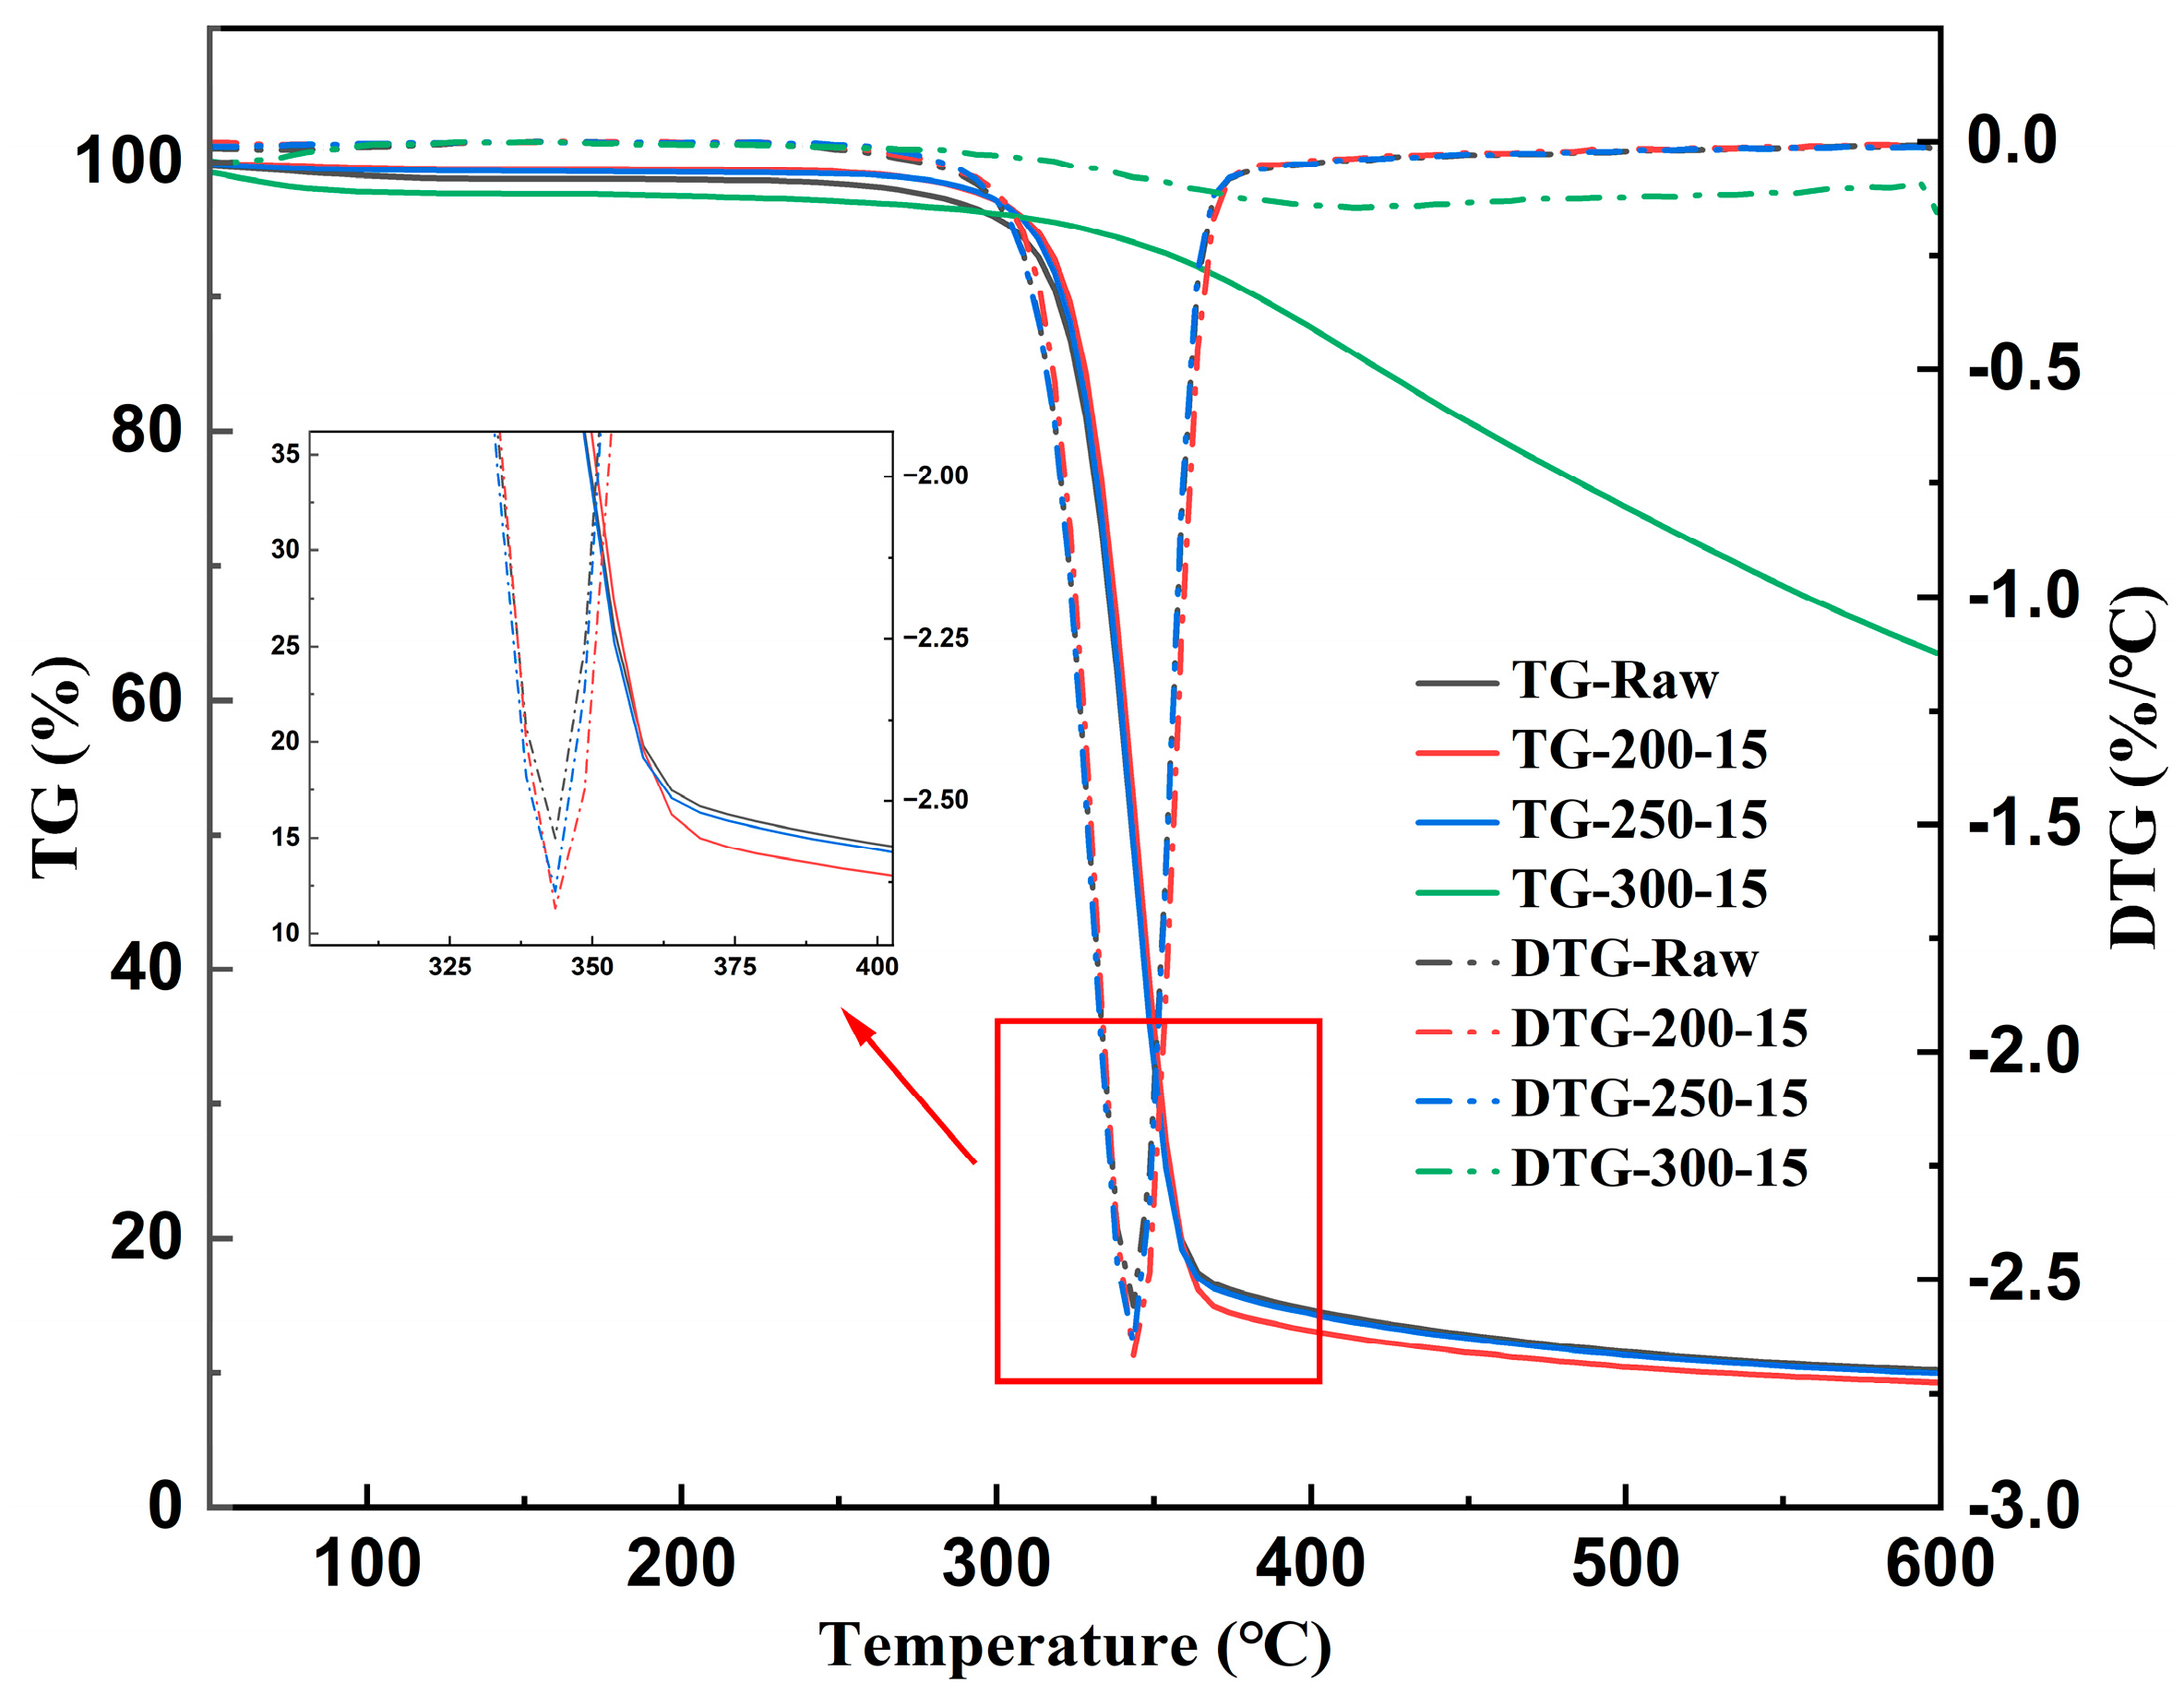
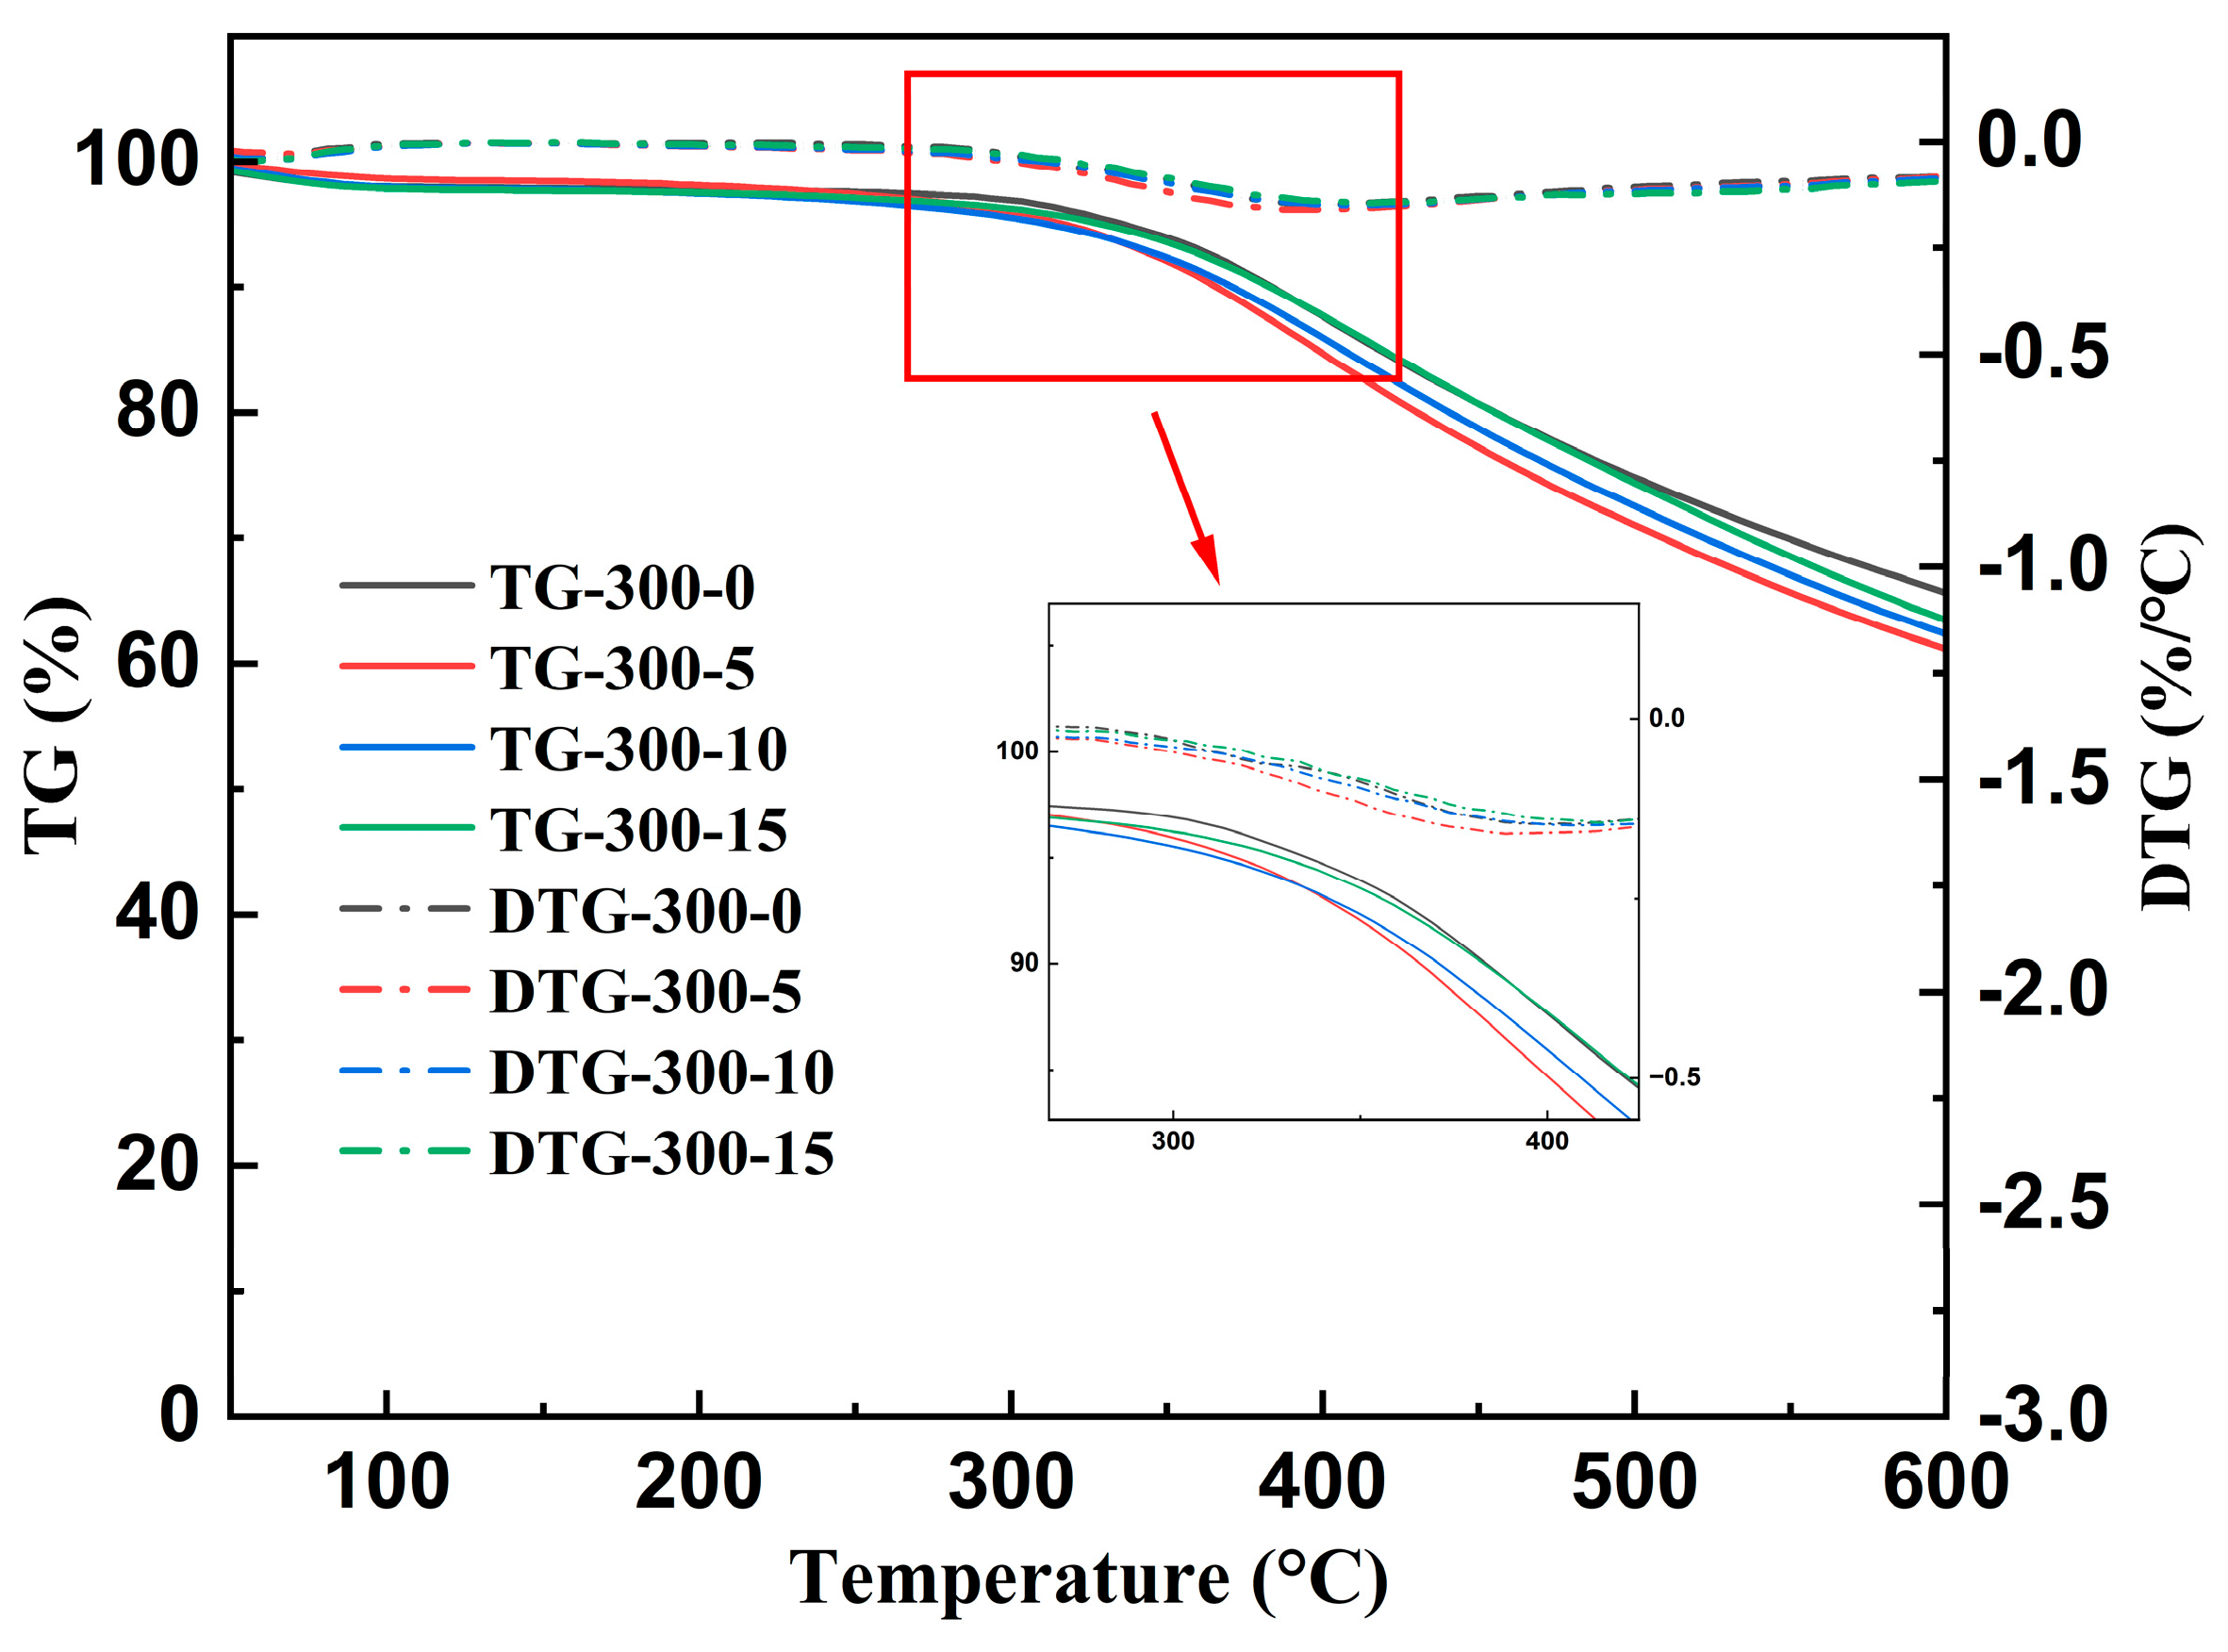
3.2.1. TG/DTG Analysis

The pyrolysis behavior of cellulose after oxidative torrefaction was studied using a thermogravimetric analyzer. Figure 7 presents the TG/DTG curves of the cellulose raw material and the oxidative torrefaction product with a 15% oxygen concentration, while Figure 8 presents the TG/DTG curves of cellulose products after non-oxidative and oxidative torrefaction at 300 °C. Figure 7 and Figure 8 demonstrate how the torrefaction temperature and oxygen concentration influence the pyrolysis behavior of products subjected to oxidative torrefaction. It can be seen that the torrefaction temperature is the primary factor affecting the pyrolysis characteristics of cellulose compared to the oxygen concentration. However, both figures display some common features. Both figures display some common features. The pyrolysis process of cellulose torrefaction products occurred in three distinct phases: from ambient temperature to 250 °C, from 250 °C to 400 °C, and above 400 °C. Typically, the initial weight reduction is primarily due to the evaporation of moisture; however, the weight loss of the torrefied samples in both TG/DTG curves did not exceed 5%, as cellulose had a very low moisture content after torrefaction and exhibited good hydrophobicity. The second stage represented the main weight loss region of cellulose, characterized by relatively rapid pyrolysis. The third stage showed little weight loss, corresponding to the slow carbonization of the residual material.
From Figure 7, it can be observed that the pyrolysis characteristics of cellulose treated at 200 °C and 250 °C under oxidative conditions were similar, with the maximum weight loss rate occurring around 350 °C, at 2.67%/°C and 2.64%/°C, respectively, which was slightly higher than the 2.56%/°C of the untreated cellulose. This indicates that torrefaction at lower temperatures primarily removes light volatiles from cellulose’s surface, with a minimal impact on its overall properties, which may explain why the deep structure of cellulose remains largely intact, resulting in similar pyrolysis characteristics between the raw cellulose and the low-temperature torrefied products. The pyrolysis characteristics of the sample torrefied at 300 °C were distinctly different from those of the other samples. Its maximum weight loss rate occurred around 400 °C, at 0.14%/°C, which is similar to previous studies [29,50]. The higher temperature of oxidative torrefaction had already removed most of the volatiles, leading to a slower release of volatiles during the pyrolysis process. In the third stage, the cellulose residue undergoes aromatization, producing char. During oxidative torrefaction, the presence of oxygen participated in the thermal cracking of cellulose, increasing the local reaction temperature through oxidation reactions, which facilitated the thermal decomposition of cellulose. Therefore, the oxygen concentration inevitably affected the torrefaction process, which in turn influenced its pyrolysis characteristics.
In Figure 8, the TG and DTG curves of the torrefaction products at different oxygen concentrations were similar. Around 300 °C, it can be observed that the TG curve of the oxidatively torrefied samples shifted to the left compared to the non-oxidatively torrefied sample, indicating that the presence of oxygen lowered the temperature required for pyrolysis, causing it to occur earlier. From the DTG curve, it can be seen that the oxidative torrefaction products reached the maximum weight loss rate at lower temperatures and with a higher maximum weight loss rate. At 300 °C under oxidative torrefaction conditions, the deoxygenation of cellulose was more effective at oxygen concentrations of 5%–10%, which also helped optimize the pyrolysis characteristics of cellulose.

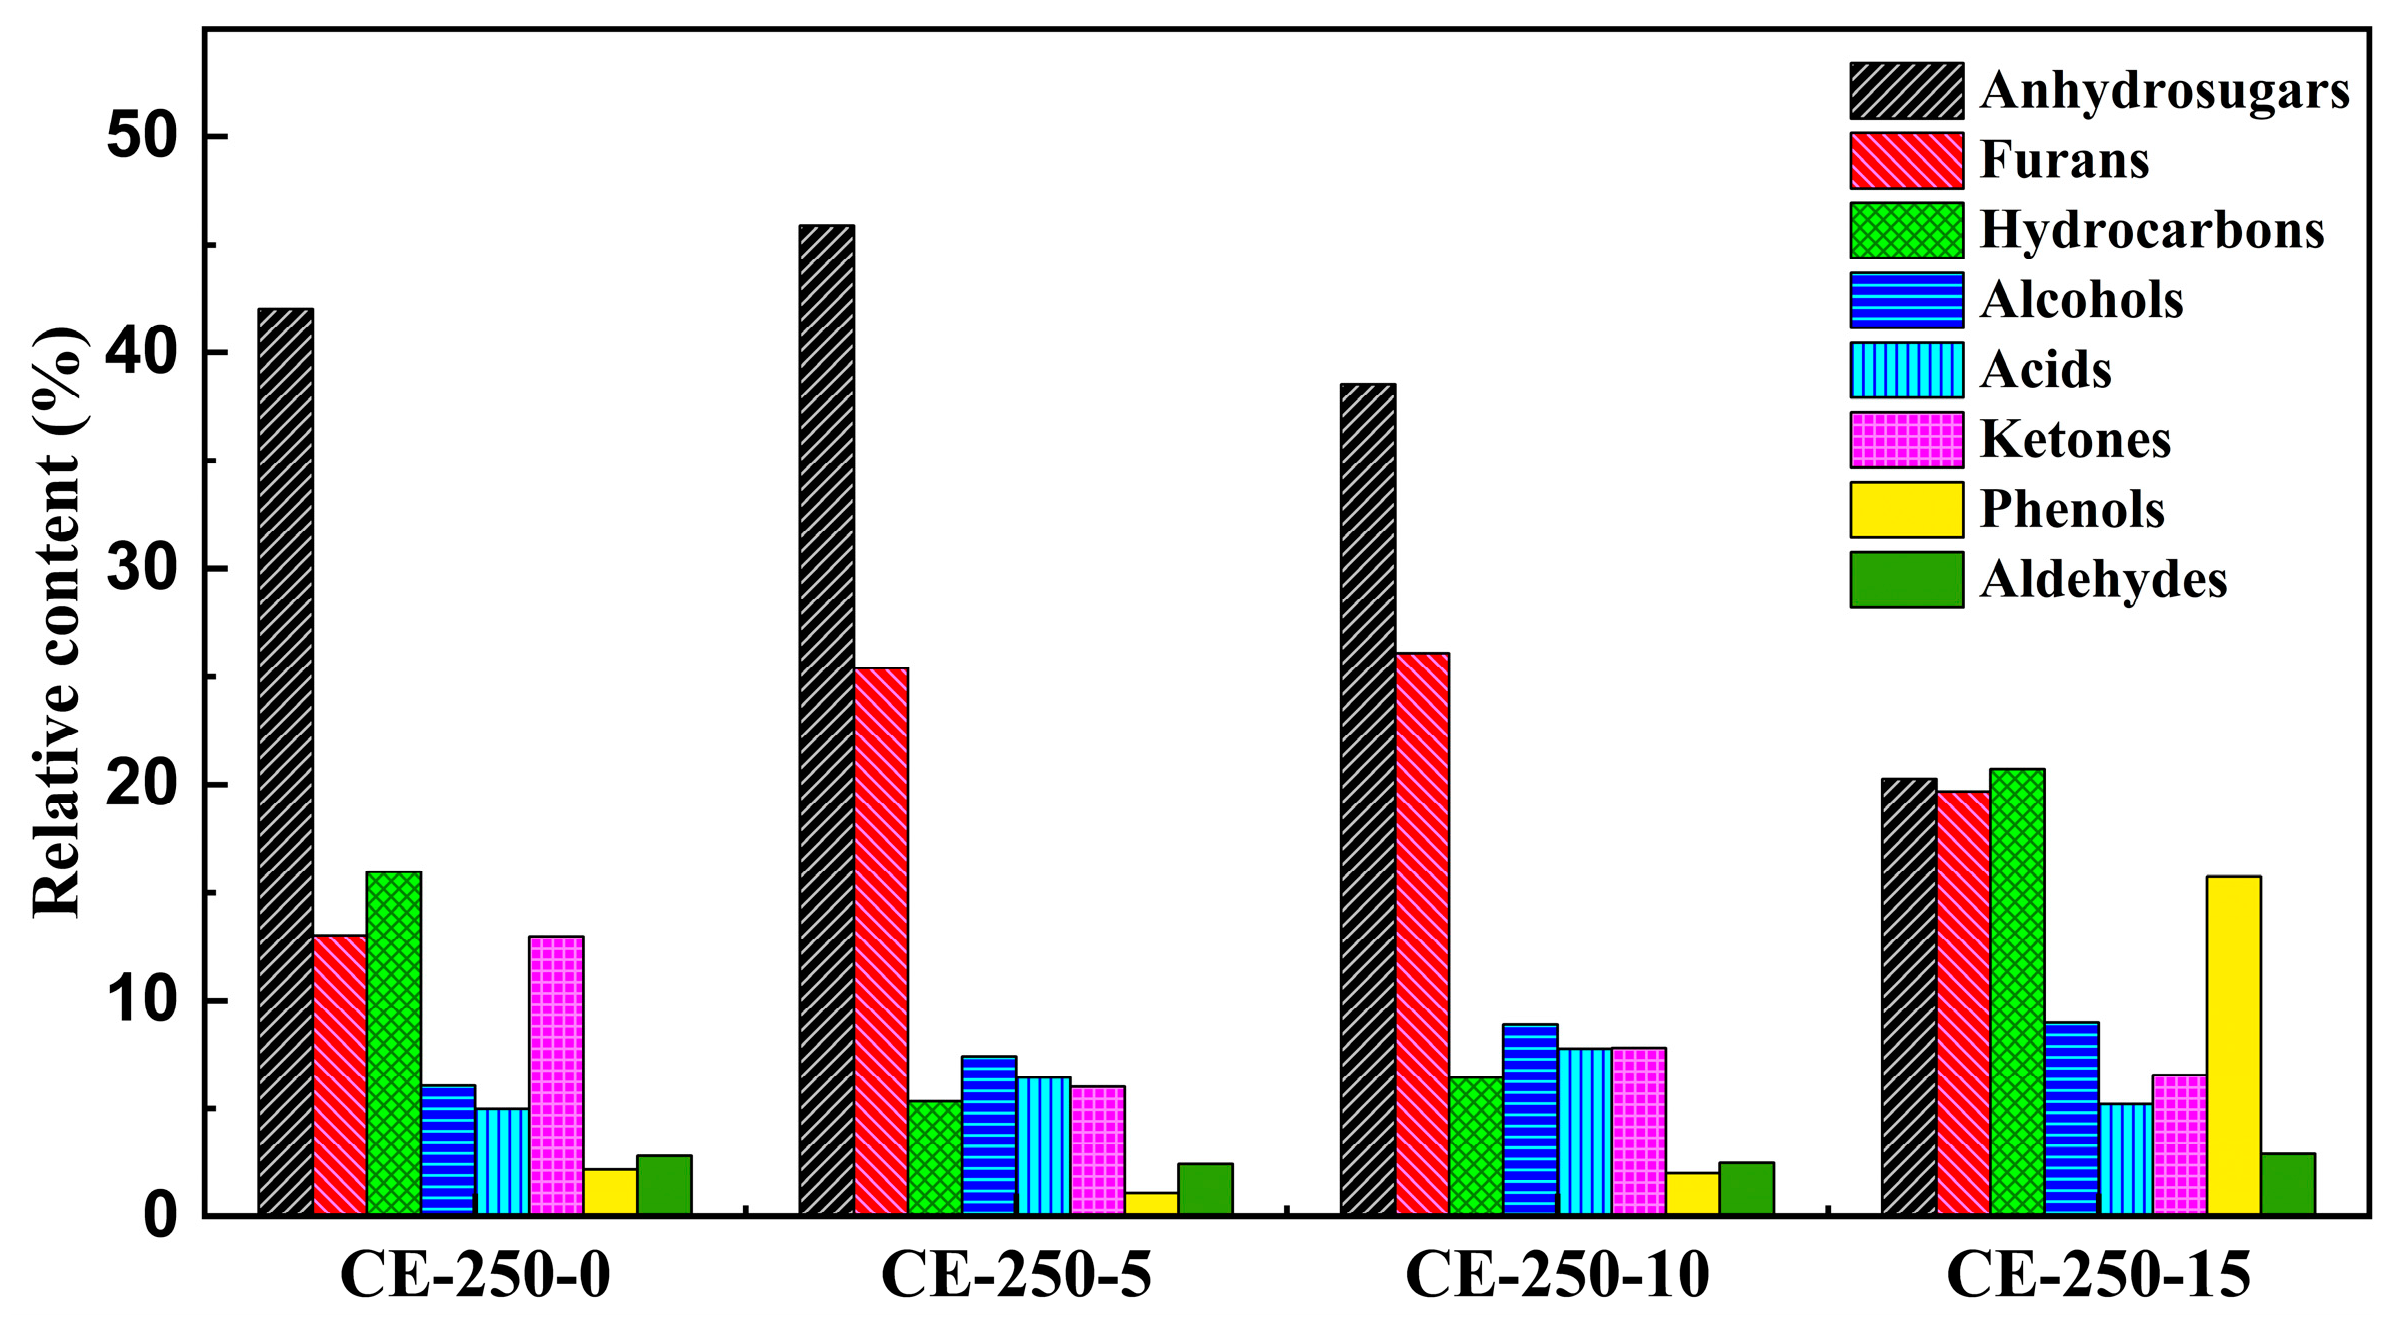
3.2.2. Analysis of the Pyrolysis Products

Figure 9 shows the distribution of the pyrolysis products of cellulose raw material and cellulose after non-oxidative/oxidative torrefaction at 250 °C. The types of pyrolysis products of cellulose torrefied under varying oxygen concentrations were generally the same, and can be divided into eight categories: furans, anhydrosugars, hydrocarbons, alcohols, acids, ketones, phenols, and aldehydes. However, the relative content of the pyrolysis products was influenced differently by the torrefaction conditions. Compared to non-oxidative torrefaction, the involvement of oxygen in the process triggered oxidation reactions, which not only accelerated the thermal cracking of cellulose but also affected its chemical composition, thereby altering the composition of the products. Therefore, there was a correlation between the torrefaction conditions and the distribution of rapid pyrolysis products.
Anhydrosugars were the main pyrolysis products of cellulose, and their relative content first increased and then decreased with increasing oxygen concentrations. When the oxygen concentration increased from 0% to 10%, the relative content of anhydrosugars fluctuated slightly but remained above 35%. However, when the oxygen concentration was 15%, the proportion of anhydrosugars decreased to 20.26%. This may be related to the presence of levoglucosan in anhydrosugars. The oxidation reactions under high-oxygen-concentration torrefaction cause the depolymerization of cellulose and extensive cleavage of glycosidic bonds, leading to a decrease in the production of levoglucosan in the pyrolysis products.
Furans had the second-highest relative content following anhydrosugars. The relative content of furans in non-oxidative torrefaction was 13.02%, while in oxidative torrefaction, the content of furans was higher, reaching a maximum of 26.08%. Lower oxygen concentrations in oxidative torrefaction were more favorable for the formation of furans [51]. The relative content of ketones decreased to varying degrees after oxidative torrefaction, which may be due to decarboxylation and decarbonylation reactions occurring during the torrefaction pretreatment of cellulose, leading to the release of small molecules such as CO and CO2.
At oxygen concentrations of 5% and 10%, the distribution of rapid pyrolysis products was relatively similar, with a reduction in hydrocarbons compared to non-oxidative torrefaction. However, at a 15% oxygen concentration, cellulose was more easily cracked into small molecules under oxidation reactions, resulting in a pronounced change in the relative content of hydrocarbons in the pyrolysis products. The high oxygen concentration enhanced the aromatization of cellulose, leading to the formation of more aromatics during pyrolysis. Additionally, the content of phenolic compounds increased notably under this condition, as high-oxygen-concentration torrefaction facilitated the generation of phenols.

4. Conclusions

This study explored the changes in cellulose properties under various oxidative torrefaction conditions and their effects on the pyrolysis characteristics, highlighting the advantages of oxidative torrefaction in enhancing the fuel properties of cellulose from the perspective of biomass components. With higher torrefaction temperatures and oxygen concentrations, cellulose experienced a steady increase in the carbon content, while the levels of hydrogen and oxygen dropped considerably, resulting in a higher energy density. Compared to non-oxidative torrefaction, oxidative torrefaction exhibited better deoxygenation effects. High-temperature and high-oxygen-concentration torrefaction can promote the breaking of chemical bonds and the breakdown of oxygen-containing functional groups. Regarding the pyrolysis characteristics of cellulose oxidative torrefaction products, increasing the oxygen concentration lowered the onset temperature for pyrolysis, accelerated the pyrolysis process, reduced the content of dehydrated sugars in the pyrolysis products, and increased the content of furans. Oxidative torrefaction has been proven to be more effective at enhancing the energy density and other fuel characteristics compared to non-oxidative torrefaction. This study investigated the oxidative torrefaction of cellulose to understand its effects on fuel property changes. However, as cellulose is only one component of biomass, it does not fully represent the overall transformation of biomass during torrefaction. Future research should explore the oxidative torrefaction of the whole biomass and its components to further optimize biomass conversion and improve fuel quality.

Supplementary Materials

The following supporting information can be downloaded at: https://www.mdpi.com/article/10.3390/coatings15040407/s1.

Author Contributions

L.Z. and K.C. designed the experiments; L.Z. performed the oxidative torrefaction experiments; M.L. and X.N. assisted in equipment maintenance; L.Z. and K.C. are major contributors in writing the manuscript; D.C. provided experimental instruments. All authors have read and agreed to the published version of the manuscript.

Funding

This work was supported by National Key Research and Development Program of China (2024YFB4206201).

Institutional Review Board Statement

Not applicable.

Informed Consent Statement

Not applicable.

Data Availability Statement

The data are contained within the article.

Conflicts of Interest

The authors declare no conflicts of interest.

References

  1. Vasileiadou, A. From Organic Wastes to Bioenergy, Biofuels, and Value-Added Products for Urban Sustainability and Circular Economy: A Review. Urban Sci. 2024, 8, 121. [Google Scholar] [CrossRef]
  2. Poornima, S.; Manikandan, S.; Prakash, R.; Deena, S.R.; Subbaiya, R.; Karmegam, N.; Kim, W.; Govarthanan, M. Biofuel and biochemical production Through Biomass Transformation Using Advanced Thermochemical and Biochemical Processes—A Review. Fuel 2024, 372, 132204. [Google Scholar]
  3. Zhang, L.H.; Xu, C.B.; Champagne, P. Overview of Recent Advances in Thermo-Chemical Conversion of Biomass. Energy Conv. Manag. 2010, 51, 969–982. [Google Scholar] [CrossRef]
  4. Tanger, P.; Field, J.L.; Jahn, C.E.; DeFoort, M.W.; Leach, J.E. Biomass for Thermochemical Conversion: Targets and Challenges. Front. Plant Sci. 2013, 4, 218. [Google Scholar]
  5. Fahmy, T.Y.A.; Fahmy, Y.; Mobarak, F.; El-Sakhawy, M.; Abou-Zeid, R.E. Biomass Pyrolysis: Past, Present, and Future. Environ. Eng. Manag. J. 2020, 22, 17–32. [Google Scholar]
  6. Boateng, A.A.; Mullen, C.A. Fast pyrolysis of Biomass Thermally Pretreated by Torrefaction. J. Anal. Appl. Pyrolysis 2013, 100, 95–102. [Google Scholar]
  7. Chen, C.S.; Qu, B.; Wang, W.X.; Wang, W.J.; Ji, G.Z.; Li, A.M. Rice Husk and Rice Straw Torrefaction: Properties and Pyrolysis Kinetics of Raw and Torrefied Biomass. Environ. Technol. Innov. 2021, 24, 101872. [Google Scholar] [CrossRef]
  8. Li, X.R.; Cen, K.H.; Wang, L.C.; Jia, D.X.; Zhu, X.F.; Chen, D.Y. Co-pyrolysis of Cellulose and Lignin: Effects of Pyrolysis Temperature, Residence Time, and Lignin Percentage on the Properties of Biochar Using Response Surface Methodology. Ind. Crops Prod. 2024, 219, 119071. [Google Scholar] [CrossRef]
  9. Ribeiro, J.M.C.; Godina, R.; Matias, J.C.D.; Nunes, L.J.R. Future Perspectives of Biomass Torrefaction: Review of the Current State-Of-The-Art and Research Development. Sustainability 2018, 10, 2323. [Google Scholar] [CrossRef]
  10. Chen, W.H.; Lin, B.J.; Lin, Y.Y.; Chu, Y.S.; Ubando, A.T.; Show, P.L.; Ong, H.C.; Chang, J.S.; Ho, S.H.; Culaba, A.B.; et al. Progress in Biomass Torrefaction: Principles, Applications and Challenges. Prog. Energy Combust. Sci. 2021, 82, 100887. [Google Scholar]
  11. Hu, Y.M.; Wang, S.; Wang, Q.; He, Z.X.; Abomohra, A.; Cao, B. Influence of Torrefaction Pretreatment on the Pyrolysis Characteristics of Seaweed Biomass. Cellulose 2019, 26, 8475–8487. [Google Scholar] [CrossRef]
  12. Neupane, S.; Adhikari, S.; Wang, Z.; Ragauskas, A.J.; Pu, Y. Effect of Torrefaction on Biomass Structure and Hydrocarbon Production from Fast Pyrolysis. Green Chem. 2015, 17, 2406–2417. [Google Scholar] [CrossRef]
  13. Zheng, A.Q.; Zhao, Z.L.; Chang, S.; Huang, Z.; He, F.; Li, H.B. Effect of Torrefaction Temperature on Product Distribution from Two-Staged Pyrolysis of Biomass. Energy Fuels 2012, 26, 2968–2974. [Google Scholar] [CrossRef]
  14. Zheng, Y.W.; Tao, L.; Yang, X.Q.; Huang, Y.B.; Liu, C.; Gu, J.Y.; Zheng, Z.F. Effect of the Torrefaction Temperature on the Structural Properties and Pyrolysis Behavior of Biomass. Bioresources 2017, 12, 3425–3447. [Google Scholar] [CrossRef]
  15. Alvarez, A.; Nogueiro, D.; Pizarro, C.; Matos, M.; Bueno, J.L. Non-Oxidative Torrefaction of Biomass to Enhance its Fuel Properties. Energy 2018, 158, 1–8. [Google Scholar] [CrossRef]
  16. Zhang, B.; Yang, B.L.; Wu, S.; Guo, W.; Zhang, J.; Wu, Z.Q.; Wang, Z.L.; Lim, J.C. Effect of Torrefaction Pretreatment on the fast Pyrolysis Behavior Of Biomass: Product Distribution and Kinetic Analysis on Spruce-Pin-Fir Sawdust. J. Anal. Appl. Pyrolysis 2021, 158, 105259. [Google Scholar]
  17. He, Z.; Zhang, F.; Tu, R.; Jia, Z.W.; Cheng, S.C.; Sun, Y.; Wu, Y.J.; Shen, X.W.; Jiang, E.C.; Xu, X.W. The Influence of Torrefaction on Pyrolysed Biomass: The Relationship of Bio-Oil Composition with the Torrefaction Severity. Bioresour. Technol. 2020, 314, 123780. [Google Scholar]
  18. Devaraja, U.M.A.; Dissanayake, C.L.W.; Gunarathne, D.; Chen, W.H. Oxidative Torrefaction and Torrefaction-Based Biorefining of Biomass: A Critical Review. Biofuel Res. J. 2022, 9, 1672–1696. [Google Scholar]
  19. Xin, S.Z.; Mi, T.; Liu, X.Y.; Huang, F. Effect of Torrefaction on the Pyrolysis Characteristics of High Moisture Herbaceous Residues. Energy 2018, 152, 586–593. [Google Scholar] [CrossRef]
  20. Zhang, C.Y.; Ho, S.H.; Chen, W.H.; Fu, Y.J.; Chang, J.S.; Bi, X.T. Oxidative Torrefaction of Biomass Nutshells: Evaluations of Energy Efficiency as Well as Biochar Transportation and Storage. Appl. Energy 2019, 235, 428–441. [Google Scholar]
  21. Gao, H.L.; Zhang, D.L.; Liu, Z.F.; Wang, F.; Su, X.H.; Liu, W.; Yi, W.M. Effect of Pretreatment on the Pyrolysis Kinetics of Corn Stalk: Comparison of Inert, Oxidative, and Wet Torrefaction. BioEnergy Res. 2025, 18, 12. [Google Scholar] [CrossRef]
  22. Soria-Verdugo, A.; Guil-Pedrosa, J.F.; García-Hernando, N.; Ghoniem, A.F. Evolution of Solid Residue Composition During Inert and Oxidative Biomass Torrefaction. Energy 2024, 312, 133486. [Google Scholar] [CrossRef]
  23. Ramos-Carmona, S.; Martínez, J.D.; Pérez, J.F. Torrefaction of Patula Pine Under Air Conditions: A Chemical and Structural Characterization. Ind. Crops Prod. 2018, 118, 302–310. [Google Scholar] [CrossRef]
  24. Huang, S.X.; Lei, C.; Qin, J.; Yi, C.; Chen, T.; Yao, L.L.; Li, B.; Wen, Y.J.; Zhou, Z.; Xia, M. Properties, Kinetics and Pyrolysis Products Distribution of Oxidative Torrefied Camellia Shell in Different Oxygen Concentration. Energy 2022, 251, 123941. [Google Scholar] [CrossRef]
  25. Zhang, Z.G.; Zhou, X.C.; Wang, L.; Tan, M.J.; Huang, Z.L.; Li, C.Z.; Wu, Z.J.; Qin, X.L.; Li, H. Effect of Oxidative Torrefaction on the Pyrolysis of Clitocybe Maxima Stipe: Pyrolysis Behaviour, and Products’ Properties. J. Anal. Appl. Pyrolysis 2024, 177, 106311. [Google Scholar] [CrossRef]
  26. Jiang, S.L.; Tan, M.J.; Huang, Z.L.; Hu, J.U.; Li, C.Z.; Lei, T.Z.; Zhang, X.; Wu, Z.J.; Huang, J.; Qin, X.L.; et al. Combining Oxidative Torrefaction and Pyrolysis of Phragmites australis: Improvement of the Adsorption Capacity of Biochar for Tetracycline. Front. Energy Res. 2021, 9, 673758. [Google Scholar] [CrossRef]
  27. Gao, X.F.; Tan, M.J.; Jiang, S.L.; Huang, Z.L.; Li, C.Z.; Lei, T.Z.; Wang, Z.W.; Zhu, Y.; Li, H. Pyrolysis of Torrefied Rice Straw from Gas-Pressurized and Oxidative Torrefaction: Pyrolysis Kinetic Analysis and the Properties Of Biochars. J. Anal. Appl. Pyrolysis 2021, 157, 105238. [Google Scholar] [CrossRef]
  28. Wang, S.R.; Dai, G.X.; Ru, B.; Zhao, Y.; Wang, X.L.; Xiao, G.; Luo, Z.Y. Influence of Torrefaction on the Characteristics and Pyrolysis Behavior of Cellulose. Energy 2017, 120, 864–871. [Google Scholar] [CrossRef]
  29. Chen, W.H.; Eng, C.F.; Lin, Y.Y.; Bach, Q.V.; Ashokkumar, V.; Show, P.L. Two-Step Thermodegradation Kinetics of Cellulose, Hemicelluloses, and Lignin Under Isothermal Torrefaction Analyzed by Particle Swarm Optimization. Energy Conv. Manag. 2021, 238, 114116. [Google Scholar] [CrossRef]
  30. Bartarajnai, E.; Czégény, Z.; Sebestyén, Z.; May, Z.; Bozi, J.; Jakab, E. Thermal Decomposition of Black Locust and Wheat Straw Under Torrefaction. In Proceedings of the 8th International Symposium on Feedstock Recycling of Polymeric Materials (8th ISFR 2015), Leoben, Austria, 7–10 September 2015. [Google Scholar]
  31. Zheng, A.Q.; Li, L.W.; Zhao, Z.; Tian, Y.Y.; Li, H.B. Effect of Torrefaction Pretreatment on Chemical Structure and Pyrolysis Behaviors of Cellulose. In Proceedings of the 5th International Conference on Renewable Energy and Environmental Protection (ICREEP), Shenzhen, China, 23–25 October 2020; p. 012014. [Google Scholar]
  32. Lv, P.; Almeida, G.; Perré, P. Torrefaction of cellulose: Validity and limitation of the temperature/duration equivalence. Bioresources 2012, 7, 3720–3731. [Google Scholar] [CrossRef]
  33. Li, D.Q.; Li, C.; Fan, M.J.; Shao, Y.W.; Sun, Y.F.; Zhang, L.J.; Zhang, S.; Huang, Y.; Li, B.; Wang, S.; et al. Investigation of Property of Biochar in Staged Pyrolysis of Cellulose. J. Anal. Appl. Pyrolysis 2023, 172, 105999. [Google Scholar] [CrossRef]
  34. Chen, J.Z.; Lu, Z.M.; Bao, Z.Y.; Cai, J.F.; Wei, Y.X.; Yao, S.C. Char Formation During Pyrolysis of Torrefied Cellulose: Role of Potassium Catalysis and Torrefaction Pretreatment. J. Anal. Appl. Pyrolysis 2024, 181, 106644. [Google Scholar]
  35. Bennadji, H.; Khachatryan, L.; Lomnicki, S.M. Kinetic Modeling of Cellulose Fractional Pyrolysis. Energy Fuels 2018, 32, 3436–3446. [Google Scholar]
  36. Kawamoto, H. Reactions and Molecular Mechanisms of Cellulose Pyrolysis. Mokuzai Gakkaishi 2015, 61, 1–24. [Google Scholar]
  37. Ni, X.Y.; Cen, K.H.; Li, X.R.; Cui, D.X.; Liu, M.; Zhu, L.Z.; Chen, D.Y. Cellulose Upgradation by Torrefaction Pretreatment and Effect of Torrefaction Severity on the Quality of Pyrolysis Products. Ind. Crops Prod. 2025, 225, 120516. [Google Scholar] [CrossRef]
  38. GB/T 28731-2012; Proximate Analysis of Solid Biofuels. General Administration of Quality Supervision, Inspection and Quarantine of the People’s Republic of China; Standardization Administration of the People’s Republic of China: Beijing, China, 2012.
  39. Chen, D.Y.; Cen, K.H.; Gan, Z.Y.; Zhuang, X.Z.; Ba, Y.P. Comparative Study of Electric-Heating Torrefaction and Solar-Driven Torrefaction of Biomass: Characterization of Property Variation and Energy Usage with Torrefaction Severity. Appl. Energ. Combust. Sci. 2021, 9, 100051. [Google Scholar]
  40. Chen, Y.C.; Chen, W.H.; Lin, B.J.; Chang, J.S.; Ong, H.C. Impact of Torrefaction on the Composition, Structure and Reactivity of a Microalga Residue. Appl. Energy 2016, 181, 110–119. [Google Scholar]
  41. Chen, D.Y.; Gao, A.J.; Cen, K.H.; Zhang, J.; Cao, X.B.; Ma, Z.Q. Investigation of Biomass Torrefaction based on Three Major Components: Hemicellulose, Cellulose, and Lignin. Energy Conv. Manag. 2018, 169, 228–237. [Google Scholar] [CrossRef]
  42. Chen, D.Y.; Cen, K.H.; Zhuang, X.Z.; Gan, Z.Y.; Zhou, J.B.; Zhang, Y.M.; Zhang, H. Insight into Biomass Pyrolysis Mechanism based on Cellulose, Hemicellulose, and Lignin: Evolution of Volatiles and Kinetics, Elucidation of Reaction Pathways, and Characterization of Gas, Biochar and Bio-Oil. Combust. Flame 2022, 242, 112142. [Google Scholar]
  43. Mei, Y.Y.; Yang, Q.; Yang, H.P.; Li, J.S.; Zeng, K.; Chen, Y.Q.; Zhang, S.H.; Chen, H.P. Impact of cellulose Deoxidization Temperature on the Composition of Liquid Products Obtained by Subsequent Pyrolysis. Fuel Process. Technol. 2019, 184, 73–79. [Google Scholar]
  44. Martínez, M.G.; Couce, A.A.; Dupont, C.; Perez, D.D.; Thiéry, S.; Meyer, X.M.; Gourdon, C. Torrefaction of cellulose, hemicelluloses and lignin extracted from woody and agricultural biomass in TGA-GC/MS: Linking Production Profiles of Volatile Species to Biomass Type and Macromolecular Composition. Ind. Crops Prod. 2022, 176, 114350. [Google Scholar] [CrossRef]
  45. Uemura, Y.; Saadon, S.; Osman, N.; Mansor, N.; Tanoue, K. Torrefaction of oil Palm Kernel Shell in the Presence of Oxygen and Carbon Dioxide. Fuel 2015, 144, 171–179. [Google Scholar]
  46. Wang, S.R.; Dai, G.X.; Ru, B.; Zhao, Y.; Wang, X.L.; Zhou, J.S.; Luo, Z.Y.; Cen, K.F. Effects of Torrefaction on Hemicellulose Structural Characteristics And Pyrolysis Behaviors. Bioresour. Technol. 2016, 218, 1106–1114. [Google Scholar]
  47. Chen, W.H.; Zhuang, Y.Q.; Liu, S.H.; Juang, T.T.; Tsai, C.M. Product Characteristics from the Torrefaction of Oil Palm Fiber Pellets in Inert and Oxidative Atmospheres. Bioresour. Technol. 2016, 199, 367–374. [Google Scholar]
  48. Ramos, R.T.; Salas, B.V.; Alpírez, G.M.; Ortega, M.A.C.; Alvarez, M.A.C.; Camacho, O.T.; Cabarcas, M.T.B. Torrefaction under Different Reaction Atmospheres to Improve the Fuel Properties of Wheat Straw. Processes 2023, 11, 1971. [Google Scholar] [CrossRef]
  49. Salem, K.S.; Kasera, N.K.; Rahman, M.A.; Jameel, H.; Habibi, Y.; Eichhorn, S.J.; French, A.D.; Pal, L.; Lucia, L.A. Comparison and Assessment of Methods for Cellulose Crystallinity Determination. Chem. Soc. Rev. 2023, 52, 6417–6446. [Google Scholar] [CrossRef]
  50. Cao, X.B.; Zhang, J.; Cen, K.H.; Chen, F.; Chen, D.Y.; Li, Y.J. Investigation of the Relevance Between Thermal Degradation Behavior and Physicochemical Property of Cellulose Under Different Torrefaction Severities. Biomass Bioenerg. 2021, 148, 106061. [Google Scholar]
  51. Su, Y.H.; Zhang, S.P.; Liu, L.Q.; Xu, D.; Xiong, Y.Q. Investigation of Representative Components of Flue Gas used as Torrefaction Pretreatment Atmosphere and Its Effects on Fast Pyrolysis Behaviors. Bioresour. Technol. 2018, 267, 584–590. [Google Scholar] [CrossRef]
Figure 1. Differences between the values of the torrefied and raw samples: ultimate analysis.
Coatings 15 00407 g001
Figure 2. Decarbonization (DC), dehydrogenation (DH), and deoxygenation (DO) of cellulose torrefied under different situation.
Coatings 15 00407 g002
Figure 3. Van Krevelen plot of the cellulose raw material and torrefied samples.
Coatings 15 00407 g003
Figure 4. Carbon yield and energy yield of torrefied cellulose.
Coatings 15 00407 g004
Figure 5. FTIR spectra of cellulose products from non-oxidative torrefaction and oxidative torrefaction at a 15% oxygen concentration.
Coatings 15 00407 g005
Figure 6. XRD analysis of cellulose before and after torrefaction.
Coatings 15 00407 g006
Figure 7. TG and DTG curves of CE-Raw, CE-200-15, CE-250-15, and CE300-15 at a heating rate of 10 °C/min.
Coatings 15 00407 g007
Figure 8. TG and DTG curves of CE-300-0, CE-300-5, CE-300-10, and CE-300-15 at a heating rate of 10 °C/min.
Coatings 15 00407 g008
Figure 9. Distribution of products from the flash pyrolysis of cellulose torrefied at 250 °C.
Coatings 15 00407 g009
Table 1. Basic properties of the cellulose raw material and torrefied samples.
SampleUltimate Analysis (wt.%, db)O/CH/CHHV
(MJ/kg)
CHONS
CE-Raw41.296.5152.160.020.020.951.8915.22
CE-200-041.526.4751.970.020.020.941.8715.59
CE-200-541.746.4451.780.020.020.931.8515.59
CE-200-1041.846.4251.700.020.020.931.8415.60
CE-200-1541.866.3851.720.020.020.931.8315.59
CE-250-042.736.3550.870.030.020.891.7815.80
CE-250-543.956.1949.810.030.020.851.6915.83
CE-250-1044.246.0449.670.030.020.841.6415.82
CE-250-1544.396.0249.550.030.010.841.6315.83
CE-300-045.496.2348.250.020.010.801.6416.95
CE-300-548.715.7645.50.020.010.701.4216.82
CE-300-1052.475.4342.080.010.010.601.2416.76
CE-300-1553.065.3941.530.010.010.591.2216.77
Disclaimer/Publisher’s Note: The statements, opinions and data contained in all publications are solely those of the individual author(s) and contributor(s) and not of MDPI and/or the editor(s). MDPI and/or the editor(s) disclaim responsibility for any injury to people or property resulting from any ideas, methods, instructions or products referred to in the content.

