Abstract
Welded hollow ball joints are frequently utilized in spatial grid systems due to their straightforward structural design and obvious force characteristics, whereas bolted ball joints are frequently used for their ease of assembly and installation. Both hold a significant place in engineering practice. This research proposes a new type of joint node—the bolted drum-shaped spherical shell joint, which is suitable for grid structures. Based on the uniaxial mechanical performance test results of the joint, low-cycle fatigue tests were carried out, and the corresponding fatigue life curve was established, followed by a thorough evaluation of the fatigue life. Furthermore, a parametric analysis of the joints’ hysteretic behavior was performed by numerical simulations, and the seismic performance of bolted drum-shaped spherical shell joints with M20 bolts was evaluated under various influencing factors. The results of the investigation provide a theoretical basis for the application of this type of joint in practical engineering.
1. Introduction
In the assembly of steel structures, nodes are crucial components that directly influence the overall performance of the structure [1]. Additionally, the design of nodes impacts both the construction methods and the cost of the project. In recent years, an increasing number of innovative joint designs have been adopted in assembled structures [2].
The application of drum nodes in structures represents an innovative approach. Zhao He [3] conducted a finite element analysis of welded hollow drum nodes as early as 2004, exploring the feasibility of the node. Later, due to construction requirements, the Shennong Grand Theater adopted welded drum nodes in its shell steel structure, which successfully addressed construction challenges and ensured high-quality workmanship [4]. Chen Zhihua [5] and Lv Yanxia [6] carried out experimental studies on welded drum nodes at Beijing Daxing International Airport. They proposed a static load-bearing capacity formula for welded drum ball nodes and used finite element analysis to parameterize the nodes, concluding that the wall thickness is a critical factor affecting load-bearing capacity. Subsequently, Haiying Wan [7,8] introduced a hollow bolt-ball node and conducted static tests on the mesh frame, finding that the node exhibited superior mechanical properties. Shu Tingting [9] performed axial compression static tests on ribbed welded ball nodes and derived a formula for their axial compression-bearing capacity. Yu Kequan [10] established criteria for the ultimate load of welded hollow ball nodes through experiments and finite element simulations, contributing to the quantification of their static performance.
Statistical data shows that approximately 60% of steel structures sustain damage during earthquakes, with nearly a quarter of the damage occurring at the nodes [11]. The seismic performance of nodes is critical to the overall structural integrity, and low-cycle reciprocating load tests are an effective method for evaluating their seismic behavior [12]. Li Shuntao [13] and colleagues conducted low-cycle fatigue tests on the weld material of circular pipes and used finite element analysis to model the behavior of weld material in welded nodes under cyclic loading. This provided valuable support for simulating the material behavior of node welds under low-cycle fatigue. Xue-Ting Li [14] and collaborators performed ultra-low-cycle fatigue fracture tests on X-shaped coherent nodes, investigating the impact of built-in liners and weld types on fatigue performance. They found that the nodes exhibited poor deformation capacity after incorporating the built-in liner, and while no obvious surface cracks appeared before fracture, damage occurred more abruptly. The study also revealed that the type of weld (fillet versus fusion) had a less significant impact on the fatigue life and final damage morphology. Wang Xingyu [15] and colleagues conducted ultra-low-cycle fatigue tests on a full-scale bolted ball-node mesh structure, uncovering the overall damage mode and the damage mechanism of key components. Liu [16] and collaborators carried out ultra-low-cycle fatigue tests on K-nodes, proposed a damage assessment method, and identified the failure modes of these nodes. Guo Lingyun [17] performed ultra-low-cycle fatigue tests on bolt-ball node combinations under various loading conditions and observed similar damage patterns across tests. Specifically, bolt damage was prevalent, and the hysteresis curves were asymmetric and incomplete, indicating poor energy dissipation capacity and Low seismic resilience. Tong et al. [18] conducted low-cycle fatigue tests on welded steel nodes and developed a continuum damage mechanics approach to predict fracture failure. In addition, Qiu et al. [19] conducted systematic experiments on the fatigue performance of M30 high-strength bolts in bolted ball joints of lattice structures, revealing the failure mechanism of these bolts under repetitive loading. This serves as an important reference for studying the service life of connection nodes under fatigue loading. On the other hand, Hassanin et al. [20] investigated the mechanical response of steel–concrete composite beams under fatigue loading, emphasizing significant differences in the crack propagation behavior and damage accumulation mechanisms across different structural forms. Moreover, Ostash et al. [21] demonstrated how the reliability of steel under cyclic loading can be assessed by constructing crack propagation rate diagrams. The low-cycle fatigue performance of nodes is a key determinant of a structure’s seismic resilience. However, current research mainly focuses on common bolted ball and welded ball nodes.
By synthesizing the advantages of bolted ball nodes and welded ball nodes, this paper proposes a new type of connection node: the bolted drum-shaped ball shell node [22]. Unlike other steel structure nodes, the bolted drum-shaped spherical shell node has broad application potential in the fields of landscape decorative steel structures and large-span assembled steel structures. Its upper and lower spherical shells are planar, which not only satisfies the requirements for decorative leveling but also takes advantage of the hollow node characteristics. Combined with the benefits of bolt connections, this design results in a lightweight node with a low structural cost, enabling larger spans. Compared to traditional bolt connection nodes, the bolted drum-shaped spherical shell node significantly enhances fatigue performance by optimizing geometric design (such as wall thickness and ball diameter) and improving the uniformity of stress distribution. This optimization effectively reduces the likelihood of stress concentration and fatigue cracks. As this new type of connection node is increasingly used in engineering practice, it is expected to provide safer and more reliable structural solutions, particularly in terms of seismic performance. Based on an experimental study of the static load performance of this node, the paper further investigates its hysteretic performance under reciprocating loads. Nine nodes of identical size and specification were subjected to normal amplitude low-cycle fatigue tests, revealing the damage morphology and fatigue life of the nodes. These findings provide a foundation for their application in practical engineering. Additionally, a numerical simulation of the new nodes was conducted using finite element software, focusing on the hysteretic performance of bolted bulbous spherical shell nodes under low-frequency reciprocating loads. By analyzing the hysteresis curve, skeleton curve, ductility, and equivalent viscous damping coefficient of the node, the seismic performance of the node is assessed, offering theoretical support for its implementation in practical engineering.
2. Design and Composition of Joints
The bolted drum-shaped spherical shell joint is mainly composed of high-strength bolts, sleeves, curved European nuts, curved washers, hollow drum-shaped spherical shell, and related rods; the schematic diagram of the joint is shown in Figure 1.


Figure 1.
Schematic diagram of bolted drum-shaped spherical shell joints: (a) bolted drum spherical shell joint [22]; (b) curved European nuts; (c) curved washers; (d) high-strength bolt and sleeve; (e) drum-shaped spherical shell.
3. Fatigue Test Loading Device and Scheme
3.1. Test Loading Device
The same set of bolted drum-shaped spherical shell joints used in the static load test was selected for this experiment. The node connections were secured using high-strength grade 10.9 bolts. The experimental setup consisted of an MTS Landmark 370.50 electro-hydraulic servo fatigue testing machine sourced from MTS Systems Corporation in Eden Prairie, MN, USA, with a loading frequency range of 0 Hz to 60 Hz, as shown in Figure 2.

Figure 2.
Test device and specimen.
3.2. Loading Program
According to the specification in [23], a preload force is applied to the bolts at the connection joints. The relationship between the preload force (F) and the torque (T) is given by the following equation: , where k is the torque coefficient, which reflects the frictional behavior of the surfaces between fasteners; d is the nominal diameter of the threads; and F is the preload force.
In this test, k is taken as 0.13, and the preload force is 155 kN. The required torque is calculated using the formula: . High-tensile bolts are applied using a torque wrench.
To investigate the force characteristics and damage patterns of the nodes under seismic action, the nodes are subjected to reciprocating low circumferential fatigue under displacement control. The loading amplitude is maintained at a constant value using a triangular wave curve with a constant loading rate. The loading regime is shown in Figure 3 below. Two sets of tests were performed for each loading amplitude, with Δy representing the displacement corresponding to the design value of the compressive load capacity. Based on previous static loading tests, the average axial compressive ultimate load of the specimen was 116.7 kN [22], and the static load–displacement curve is shown in Figure 4. According to the “Code for Quality Inspection and Assessment of Space Frame Structures” [24], the permissible test coefficient for the specimen’s load-carrying capacity is 1.6. Therefore, the design value of the specimen’s axial compressive static load-carrying capacity is 72.5 kN on average, with the corresponding displacement being 2.4 mm. In the following, Δy represents the displacement corresponding to the design value of the compressive load capacity. To investigate the seismic performance of the nodes, we selected multiples of 2.4 mm as the loading amplitude for the experiments, ranging from 4.8 mm to 8.4 mm. This approach enabled a systematic study of the mechanical properties of the nodes at various levels of deformation [25].
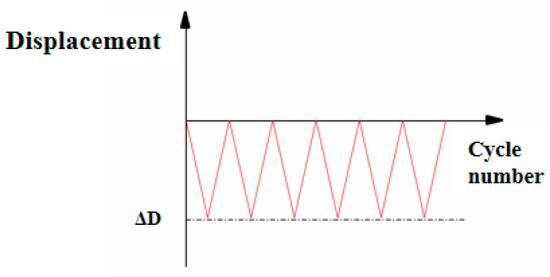
Figure 3.
Loading regime.
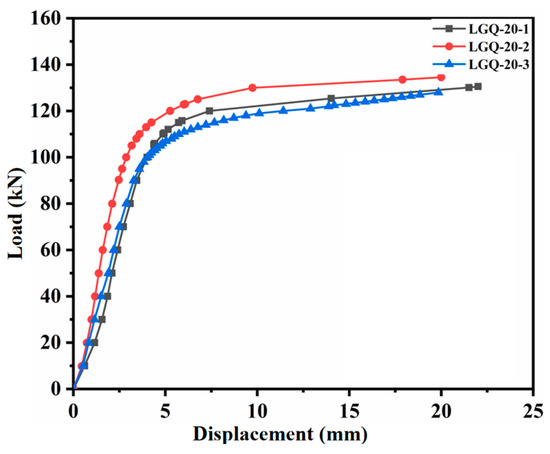
Figure 4.
The static load-deflection curve of the joints.
4. Results and Analysis
4.1. Experimental Phenomenon
Fatigue damage is deemed to occur when visible cracks appear in the specimen. Cracks typically form around bolt holes or welds, and smaller cracks are often difficult to detect. Once cracks are visible to the naked eye, they have generally progressed to the expansion stage. Additionally, as per the recommendations of the SAC-1997 specification [26], fatigue life is considered to have been reached when the load amplitude decreases to 40% of its initial value.
Under the loading conditions described above, low-cycle fatigue tests were performed on nine sets of specimen joints. The damage behavior was consistent across all specimens, although each specimen exhibited varying degrees of initial defects.
No abnormalities were observed in one set of specimens at the beginning of loading under the loading regime (3Δy). However, after the 10th cycle, the node began to emit a squeaking noise, though the exact location of the noise could not be identified. By the 40th cycle, a crack was detected at the weld between the node’s drum body and the cover plate, accompanied by the appearance of black powder on the loading platform. The crack expanded rapidly with the reciprocating cycles of the node, leading to the abortion of the test, the invalidation of the data set, and the addition of a new set of specimens for re-testing. The remaining eight sets of specimens showed no similar damage, and valid data were recorded. Figure 5 illustrates the damage observed at the nodes of this specimen.

Figure 5.
Photographs of abnormal damage to the joint.
4.2. Damage Patterns
During the loading damage process, the final damage patterns of the specimens were consistent, except for the specimens mentioned above, which experienced abnormal damage during the reciprocating tests with a 3Δy amplitude. The damage observed in specimens under different loading conditions is described below.
- (a)
- Damage patterns of two sets of specimens under loading regime II
LGQ-20-5 and LGQ-20-10 were two sets of specimens with a loading amplitude of 6 mm. During low circumferential reciprocating loading, the curved surface washers and the stressed bolt holes were initially deformed. As loading continued, cracks began to extend outward from the bolt holes. The curved Euro-nut did not deform after the test, but black powder appeared on its curved surface. On the curved washer near the stressed bolt hole, the white paint on the drum body was worn away by friction, exposing the original black-brown metal surface. Closer inspection revealed a thin layer of black powder adhering to the surface due to friction between the washer and the drum. The welded liner inside the specimen was extruded and deformed, and the friction between the curved Euro-nut and the drum surface smoothed the surface. This is illustrated in Figure 6 and Figure 7.
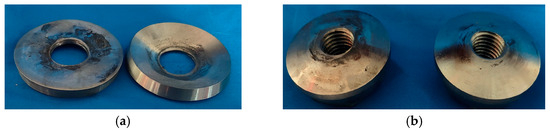
Figure 6.
Nut and bolt diagram after test: (a) curved washers; (b) curved Euro nut.
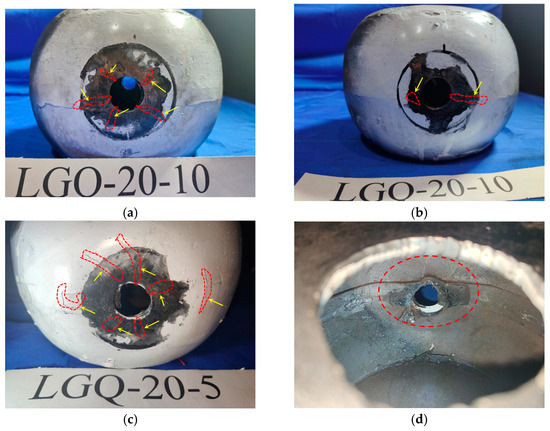
Figure 7.
Damage characteristics of specimens LGQ-20-5 and LGQ-20-10: (a,b): bolt holes for LGQ-20-10 joint; (c) bolt holes for LGQ-20-5 joint; (d) internal measurement of LGQ-20-5 node bolt holes.
- (b)
- Damage patterns of two sets of specimens under loading regime III
The LGQ-20-6 and LGQ-20-9 specimens were subjected to low-cycle reciprocating loading with a displacement amplitude of 7.2 mm (3Δy). LGQ-20-6 emitted a constant squeaking sound during the test, which was attributed to the continuous reciprocating extrusion of the curved Euro-nut and the internal welded liner. At the end of the test, internal weld slag fell out from the drum-shaped spherical shell of the node, and the liner plate at the bolt hole detached, as shown in Figure 8a below. When the fatigue termination condition was reached, the number of cracks was small, and the primary cracks radiated outward from the bolt holes, with one of the more prominent cracks in LGQ-20-9 appearing in the middle weld section of the drum body. The cause may be related to the pre-treatment of the node, where excessive smoothness requirements for the spherical surface of the drum body resulted in a thinner section in this area compared to the surrounding regions. After fatigue, both sets of nodes were subjected to large-value reciprocating damage tests, revealing that the width and depth of the cracks had worsened. Small cracks increased, and a ring-shaped crack appeared near the curved surface washer, eventually intersecting with the crack that had formed at the bolt hole.
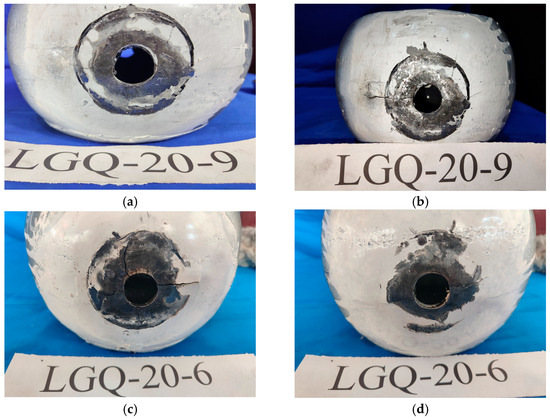
Figure 8.
Damage characteristics of specimens LGQ-20-9 and LGQ-20-6: (a,b): bolt holes for LGQ-20-9 joint; (c,d): bolt holes for LGQ-20-6 joint.
- (c)
- Damage patterns of two sets of specimens under loading regime IV
Specimens LGQ-20-7 and LGQ-20-8 underwent low-cycle reciprocating tests with a loading amplitude of (3.5Δy) 8.4 mm. During the tests, it was observed that the welded liner inside the shell cavity progressively deepened and expanded from a short crack to a full fracture as the number of cyclic loadings increased, as shown in Figure 9f below. Various degrees of extrusion deformation and partial cracking occurred within the stressed bolt holes. During the cyclic loading, the cracks initiated at the bolt holes and gradually expanded outward along the meridian, eventually intersecting with peripheral ring cracks after multiple cycles. The upper and lower stressed bolt holes exhibited varying degrees of deformation in the curved washer, resulting in different levels of fit with the curved surface of the drum body, which caused distinct white paint peeling patterns at the upper and lower bolt holes.
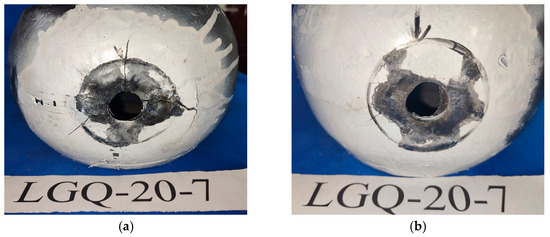
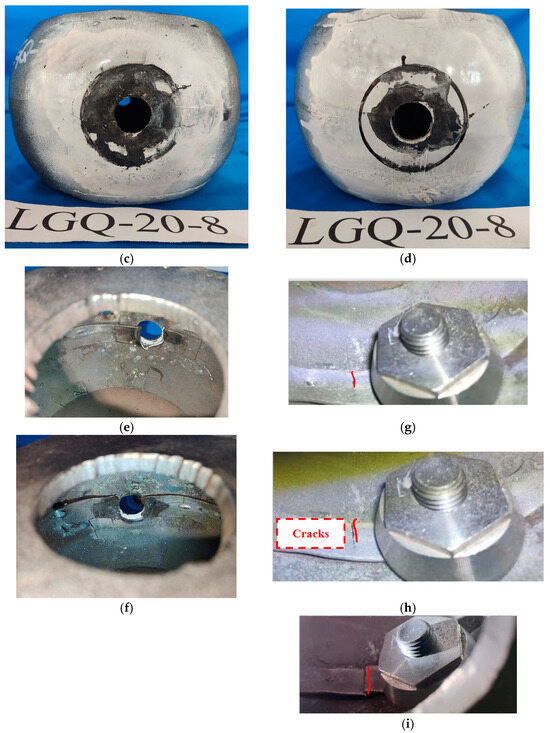
Figure 9.
Damage characteristics of specimens LGQ-20-7 and LGQ-20-8: (a,b): bolt holes for LGQ-20-7 joint; (c,d): bolt holes for LGQ-20-8 joint; (e,f) changes at internal bolt holes; (g–i) internal liner fracture process.
- (d)
- Damage patterns of two sets of specimens under loading regime I
Specimens LGQ-20-2 and LGQ-20-3 were subjected to low-cycle reciprocation with a loading amplitude of (2Δy) 4.8 mm. When the fatigue failure condition was reached, the cracks were smaller and narrower compared to the other specimens. The cracks in these specimens were dispersed from the bolt holes; two primary cracks were horizontal and occurred at the welding foot of the middle weld of the drum, as shown in Figure 10c.
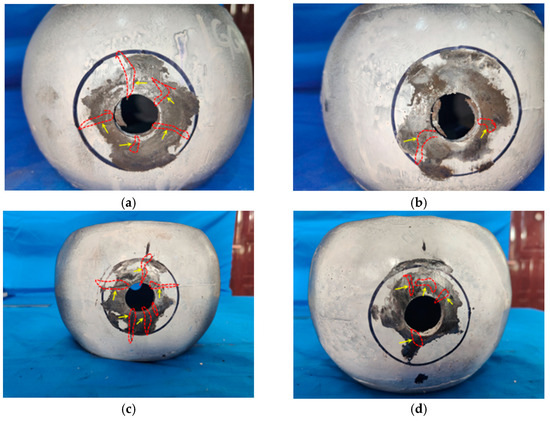
Figure 10.
Damage characteristics of specimens LGQ-20-2 and LGQ-20-3: (a,b) bolt holes for LGQ-20-2 joint; (c,d) bolt holes for LGQ-20-3 joint.
4.3. Fatigue Life
Low circumferential fatigue tests were carried out on nine bolted drum-shaped spherical shell nodes. One of the results obtained was due to weld cracking in the cover plate welding; therefore, only the eight valid test results were summarized and counted, and the results are shown in Table 1 below.

Table 1.
Low-cycle fatigue test results.
Low-cycle fatigue differs from high-cycle fatigue not only in terms of fatigue life but also in the behavior of the components throughout the fatigue process. In high-cycle fatigue, components primarily remain in the elastic phase, well below the material’s yield point. In contrast, under low-cycle fatigue, a certain amount of plastic deformation occurs in the component, also referred to as strain fatigue. The ultimate damage in this case is due to the initiation of cracks in regions subjected to repeated plastic strains, which eventually lead to fracture. High-cycle fatigue is typically analyzed by plotting the S-N curve to inform fatigue design. To facilitate comparison and design, some researchers apply concepts from high-cycle fatigue studies to low-cycle fatigue by converting relevant parameters, such as stress amplitude and displacement amplitude, for structural component analysis. Krawinkler [27] was the first to introduce displacement amplitude into the analysis of low-cycle fatigue and proposed a method for calculating fatigue life in members subjected to equal amplitude displacement.
where N represents the fatigue life, represents the displacement amplitude of plastic deformation and m and C are material constants. Since the displacement amplitude of plastic deformation is difficult to obtain experimentally, a more universal calculation method was proposed by Ballio et al. [28]. They suggested replacing the displacement amplitude of plastic deformation with the total deformation of the member (elastic deformation + plastic deformation) and transforming the above equation, resulting in the following:
The values of m and lgC can be considered as the slope and intercept of the straight line that represents the relationship between fatigue life and displacement amplitude. The test data were analyzed using the free regression method to derive the lgN-lgΔδ expression for the specimen. The expression is presented in Figure 11 below.
lgN = 4.93 − 2.24lgΔδ
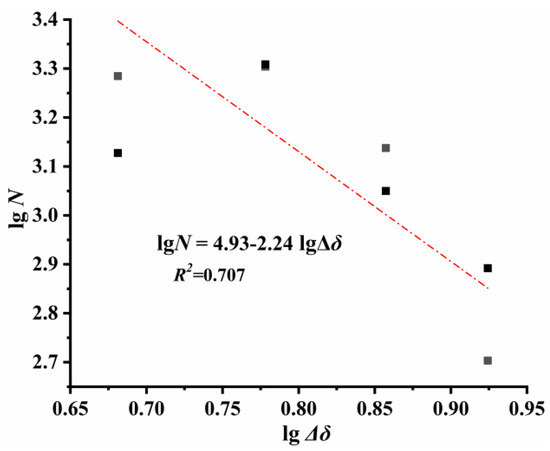
Figure 11.
lgΔδ-lgN relations by connection test: R2: correlation coefficient.
4.4. Fatigue Life Evaluation
For high-cycle fatigue tests, the overall elasticity of the component can be used to derive the stresses in the structure based on strain. In low-cycle fatigue, the stress amplitude and fatigue life are typically assessed using the nominal stress method, according to the relevant expression provided in “Standard for the design of steel structures” [23].
where C and β represent the component-connection correlation coefficients, and after transformation, β can also be expressed as the slope of the S-N curve.
The C and β values, along with the allowable stress amplitudes at two million cycles of fatigue without termination, are provided in the specification for each of the 14 connection categories, as shown in Table 2.
Table 2.
Fatigue calculation parameters of connected members.
Fatigue assessment based on the converted stress amplitude was conducted during the test. The stress amplitude corresponding to the fatigue life range of 500 to 5000 cycles is derived from the linear relationship in Equation (2). The partial S-N curves for the 14 types of components are shown in Figure 12. The drawn partial S-N curves are primarily useful for comparing the converted stress amplitudes in the following section and should not be directly compared to the stresses in the actual materials of the components.
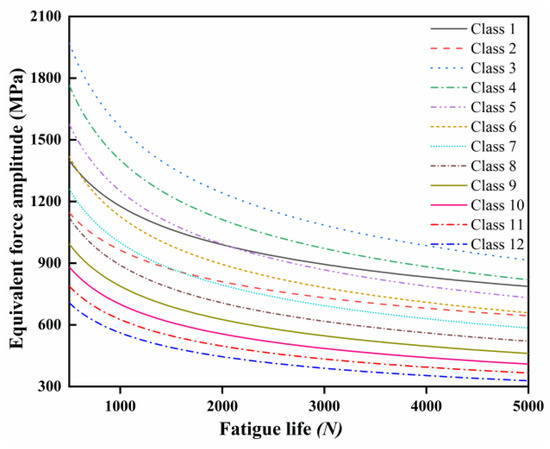
Figure 12.
Converted codified S-N curves and classifications in a range of low-cycle fatigue life.
To evaluate the low-cycle fatigue life of a component using the nominal stress method, the nominal stress amplitude must be converted into an equivalent stress amplitude. Assuming that, after the member undergoes elastic to plastic deformation, the plastic stress no longer increases and remains constant, the following relationship exists between the local strain amplitude, Δε, and the overall displacement amplitude, Δδ, of the structure:
where εy and δy represent the yield strain and yield displacement, respectively. In high circumferential fatigue, it is assumed that the stresses in the structure can be calculated using the following equation:
Additionally, when the structure is under yield stress, the yield strain can be introduced:
Substituting Equation (7) into Equation (5) yields the following:
We find that Equations (6) and (8) are related by an equivalence relation, which results in an equivalent force amplitude:
Substituting the equivalent force amplitude into the generalized equation allows it to be transformed, yielding the following equation . Therefore, the displacement amplitude from the test is substituted into Equation (9) to calculate the equivalent force amplitude. By comparing the equivalent force amplitude with the fatigue life and the S-N curves for Category 14, the results are obtained, as shown in Figure 13 below.
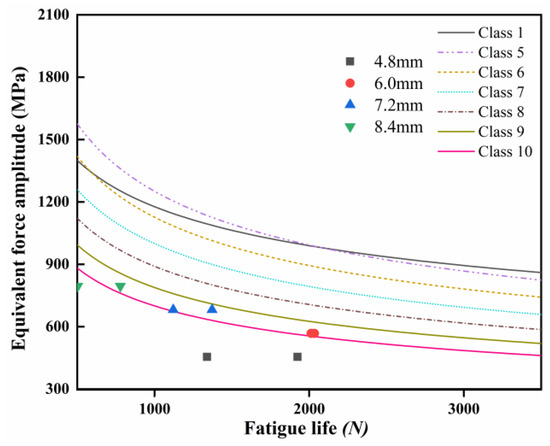
Figure 13.
Comparison of equivalent stress range-related S-N relations with codified curves.
In the figure above, it can be observed that the data points, excluding the 4.8 mm displacement amplitude, are measured on the curve for category 10 members and connected members. The distribution of the test data points aligns with the slope of the curve between categories 3 and 10, which has a slope of 3. The fatigue damage of this node can be evaluated based on the construction details for category 10.
5. Numerical Simulation
5.1. Finite Element Modeling
The new joints are primarily designed to connect the circular pipe members. Therefore, this study mainly focuses on the force performance and characteristics of the nodes under reciprocating loads, without considering the influence of the connecting members. The nodal model has the same component dimensions as the static load model. To simplify the model and improve convergence, the relative friction between the bolt and the nut is not considered, and no special requirements exist for thread modeling. All components were meshed using the C3D8R linear reduced integration cell, which exhibits good convergence under large deformation conditions. The mesh was refined at the bolt holes, where complex forces occur. During the application of preload, the upper and lower bottom surfaces of the sleeve are in close contact with the bottom surface of the bolt cap and the upper plane of the curved spacer. The interaction between the two is modeled using a friction coefficient of 0.2. Simultaneously, the upper plane of the bolt cap is taken as the reference point and coupled to establish the reference point. This reference point is then used as both the loading point and the fixed end of the load. The numerical model of the node is shown in Figure 14 below. For the fixed-end constrained bolts, both horizontal and vertical displacements are restrained, while for the loading-end constrained bolts, the horizontal displacement is restrained, and the vertical displacement is released. The specific numerical model is shown in Figure 14.
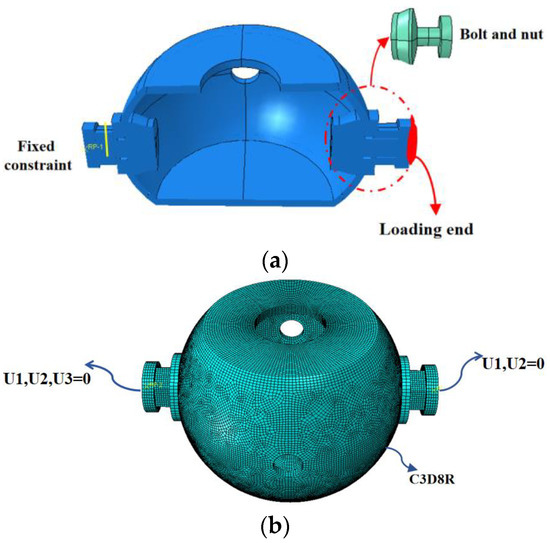
Figure 14.
Finite element model of a joint: (a) part connection, (b) meshing.
5.2. Material Properties
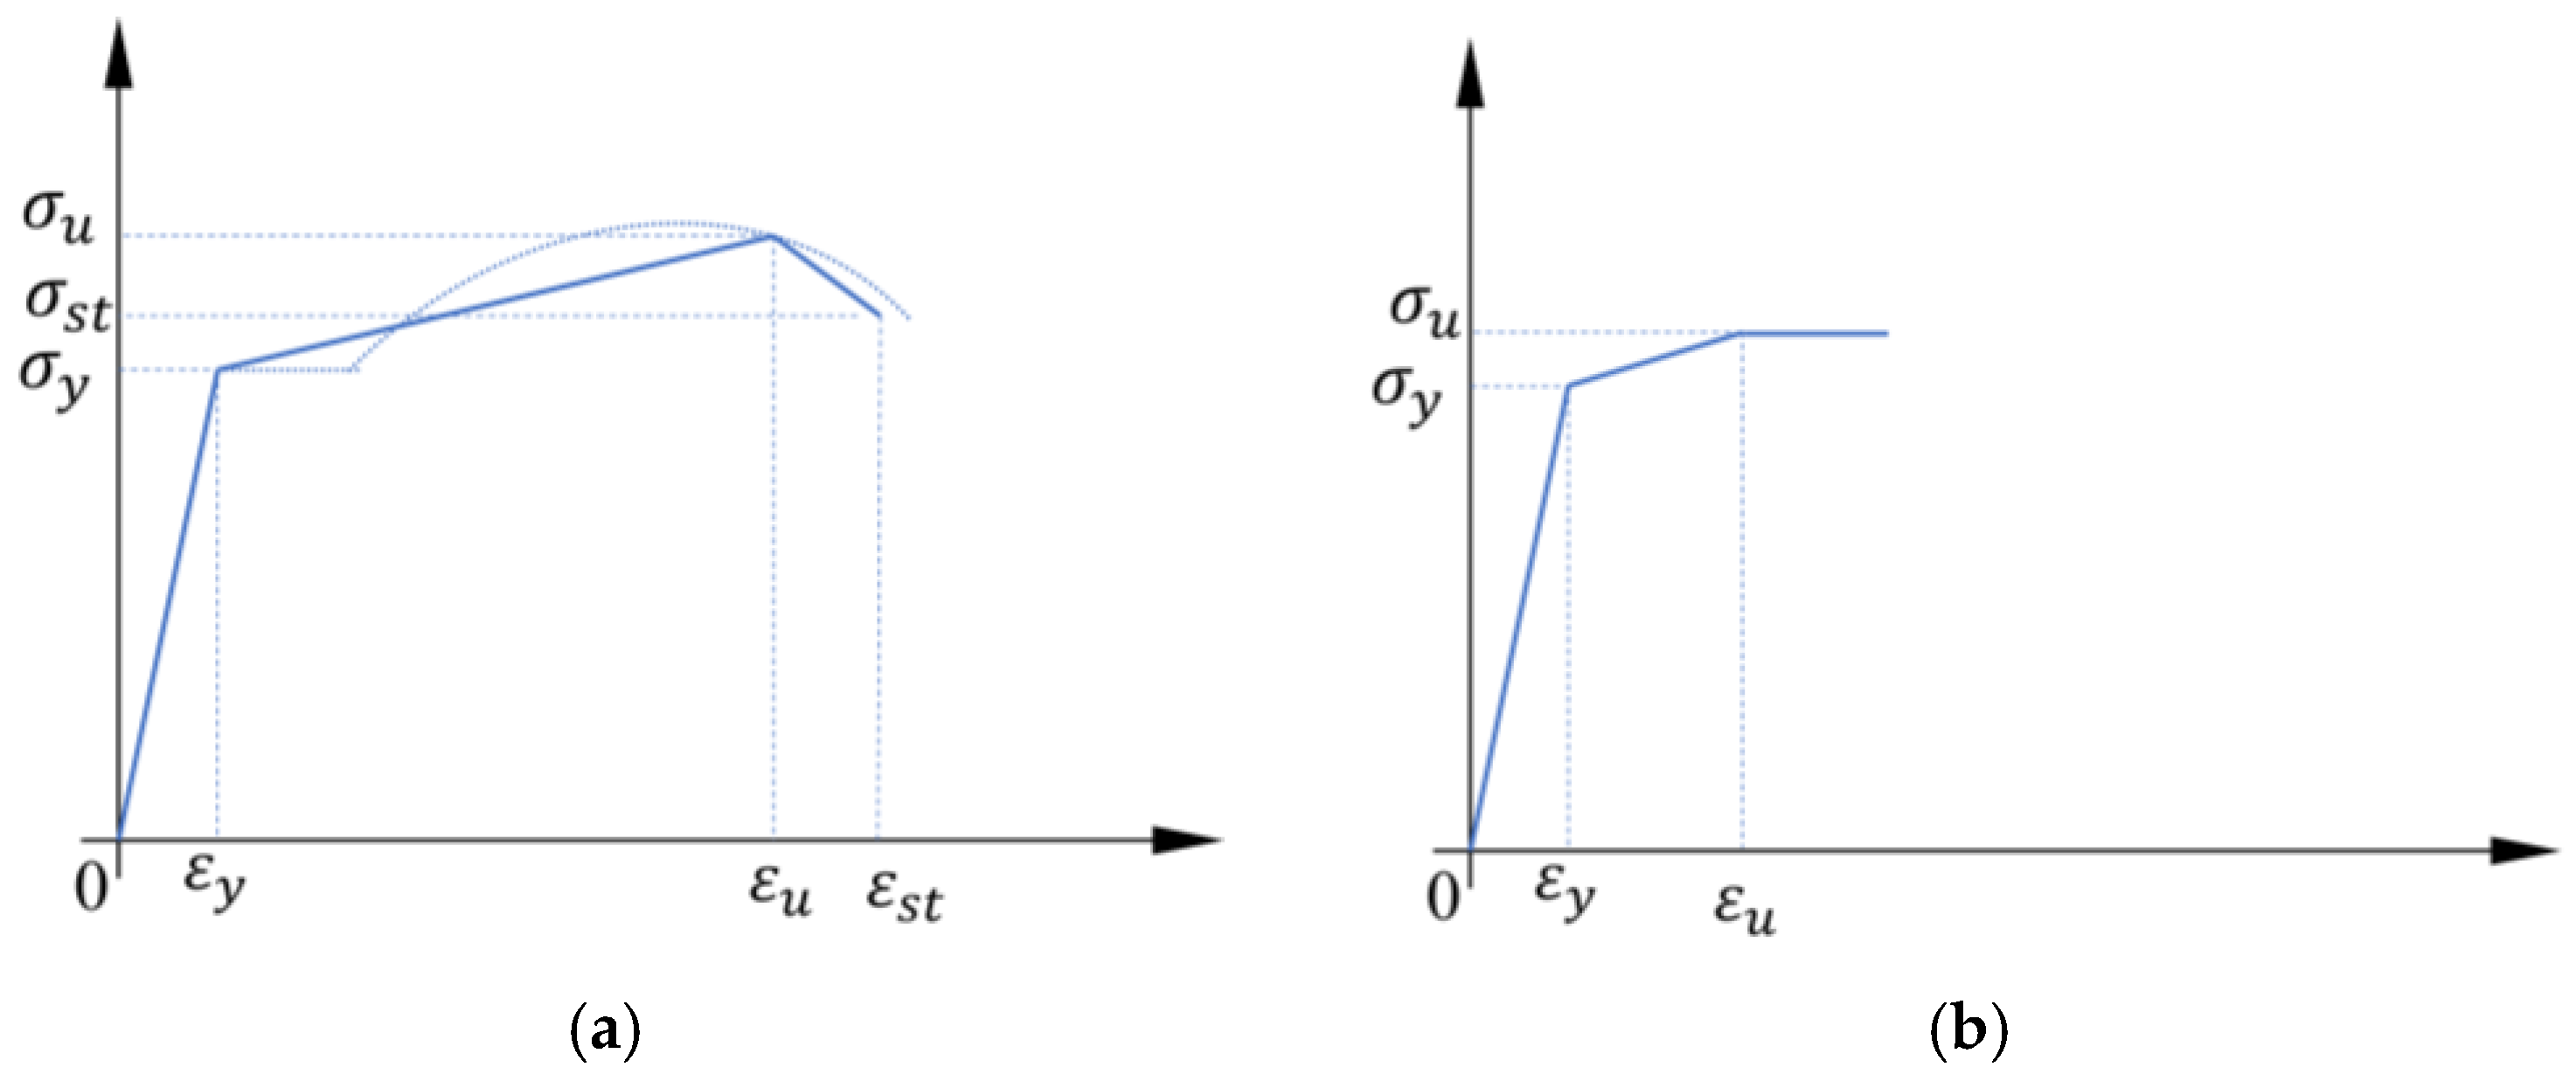
The material of the drum shell is Q345B, and the bolts are high-strength bolts of grade 10.9. The curved washers and curved Euro nuts are made of 45# steel. The steel stress–strain curve exhibits some nonlinearity. To simplify the calculation, its isomorphic relationship is generalized. Considering the Bauschinger effect that occurs under cyclic loading, a triple-fold model is used for the steel, as shown in Figure 15. As the bolt material properties test was not conducted, the determination of the principal structure was based directly on the relevant literature [29], as shown in Table 3 below.
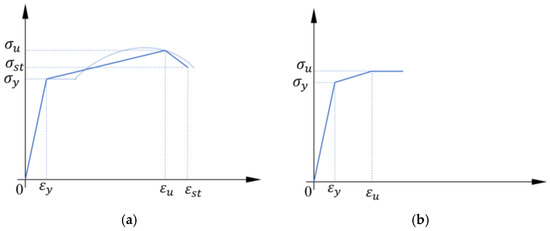
Figure 15.
Material constitutive relation: (a) steel stress–strain curve; (b) constitutive curve of high-strength bolt.
Table 3.
Material parameters.
5.3. Loading System
The development of the loading regime is essential for studying the seismic performance of the nodes. In reciprocating loading tests, displacement is primarily used for controlled loading to enhance test accuracy and safety. The experimental method for the low circumferential reciprocating down test, applicable to structural members and nodes of buildings, is outlined in the Specification for the seismic test of buildings [30].
Based on the unique characteristics of the bolted drum-shaped ball node, displacement control is applied for axial loading, and the loading system is shown in Figure 16. Through the simulation of the axial pressure using finite element analysis, the displacement loading increment is set to 0.5 mm, with each stage cycled two to three times. Since the axial tensile and compressive load-bearing capacities of the nodes vary, the corresponding yield displacement also changes. In addition, the finite element analysis does not consider relevant factors, such as weld cracking during loading.
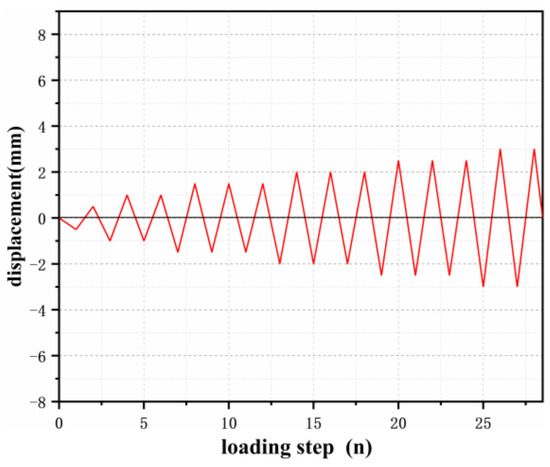
Figure 16.
Loading system.
5.4. Finite Element Simulation Results
5.4.1. Characteristics of Damage and Forces
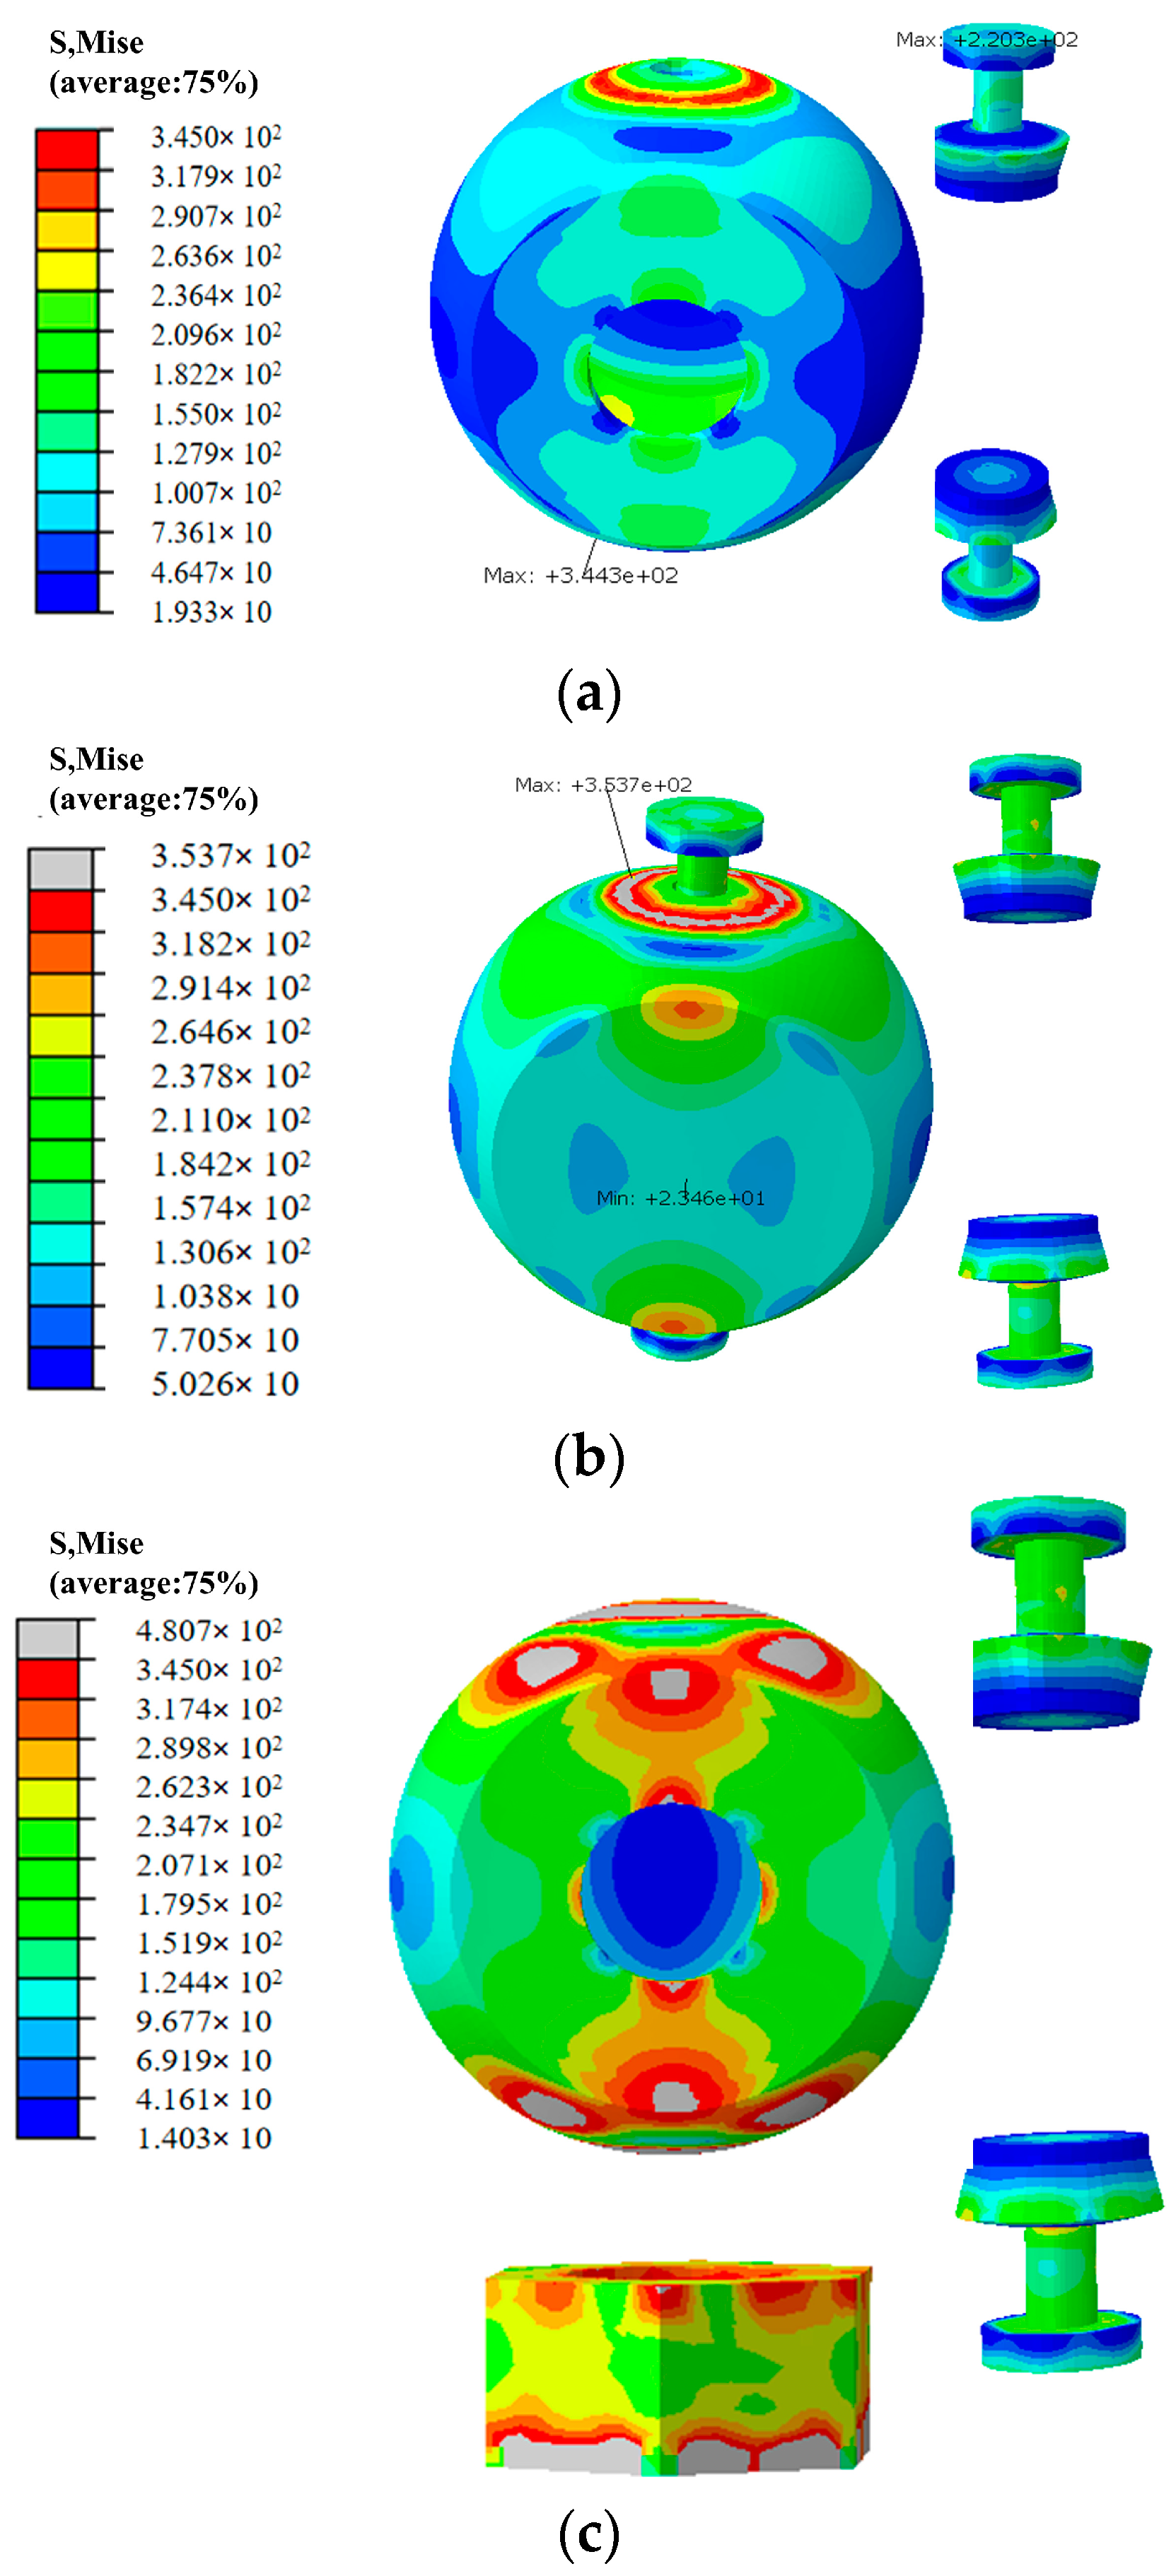
The finite element simulation of the reciprocal tension and compression in the nodes revealed stress variations in the nodes during the loading process. During the first cycle, the nodes are in an overall elastic phase. As the displacement changes, the node first enters the yielding phase, which occurs in the pressurized region of the bulbous spherical shell, near the curved washer, while the bolt remains in an elastic state. As the reciprocating load is applied, the yield region gradually expands, and the junction between the bulbous spherical shell and the cover plate in the short arch direction also enters the plastic phase. At the same time, the axial stress region of the mounting hole experiences a gradual increase in stress due to stress concentration, causing the local region to enter the yield state. The bottom end of the sleeve also enters the yielding phase and undergoes some deformation at the face-to-face junction. Figure 17 illustrates this process.
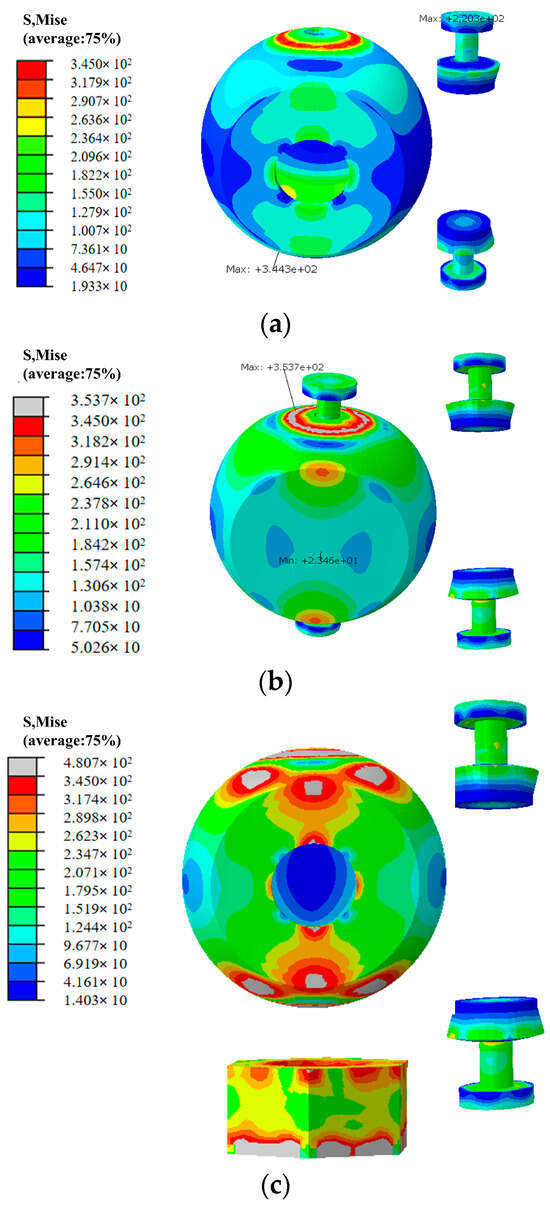
Figure 17.
Force state of joints under reciprocating loads: (a) beginning of loading; (b) interim stage of loading; (c) late stage of loading.
5.4.2. Hysteresis Curve
The hysteresis curve can be obtained by extracting the load–displacement curve of this node, as shown in Figure 18 below.
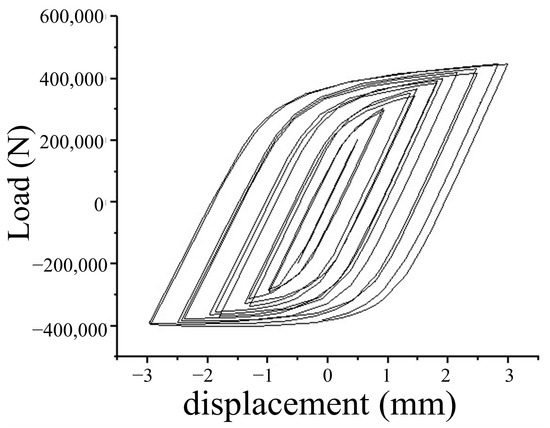
Figure 18.
Hysteresis curve.
5.4.3. Skeleton Curve
The peak points in both the positive and negative directions on the hysteresis loop are extracted and connected to form a curve, which constitutes the skeleton curve. Special attention should be given to the fact that when hysteresis loops of the same magnitude occur, the peak value on the first hysteresis curve is not necessarily selected. Additionally, material hardening of the member at the same loading amplitude may occur, resulting in a change in the peak position. The skeleton curve can roughly reflect the deformation characteristics as well as the stiffness properties of the member. The skeleton curve for the model above is shown in Figure 19 below.
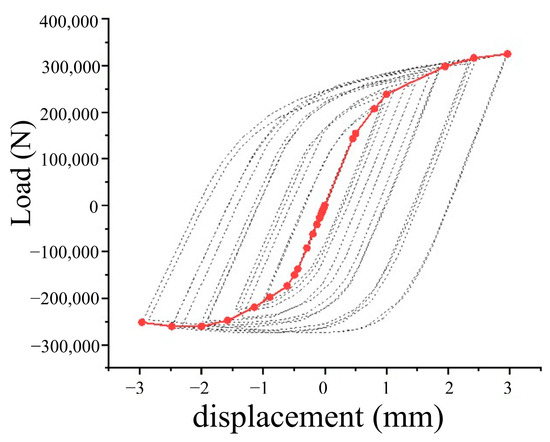
Figure 19.
Skeleton curve.
From the skeleton curves, it can be observed that the nodes go through elastic, elastoplastic, and plastic phases. When the displacement reaches the 0.5 mm level, the model is in the elastic stage, and the load–displacement relationship is linear. When the displacement cycle increases to 1.5 mm, the node pressure enters the yield stage. As the displacement increases to 2.5 mm, the node force begins to decrease, and most of the pressurized region enters the plastic region. By comparing the bearing capacity and yield point in the compression phase of the hysteresis process with the static loading curve, we found that their trends and numerical values are approximately consistent, indicating that the model can provide accurate numerical simulations.
5.5. Nodal Hysteresis Performance Parameter Analysis
The bolted hollow sphere shell node is a new type of node, similar to the welded hollow sphere node and the bolted sphere node, where variations in ball diameter and wall thickness significantly affect its performance. Using the node “LGQ-20-6-8” as a reference specimen, with a wall thickness of 6 mm and a cover plate thickness of 8 mm, a finite element analysis is conducted by varying the wall thickness and the diameter of the bulbous spherical shell under low circumferential reciprocation.
5.5.1. Effect of Wall Thickness on Performance
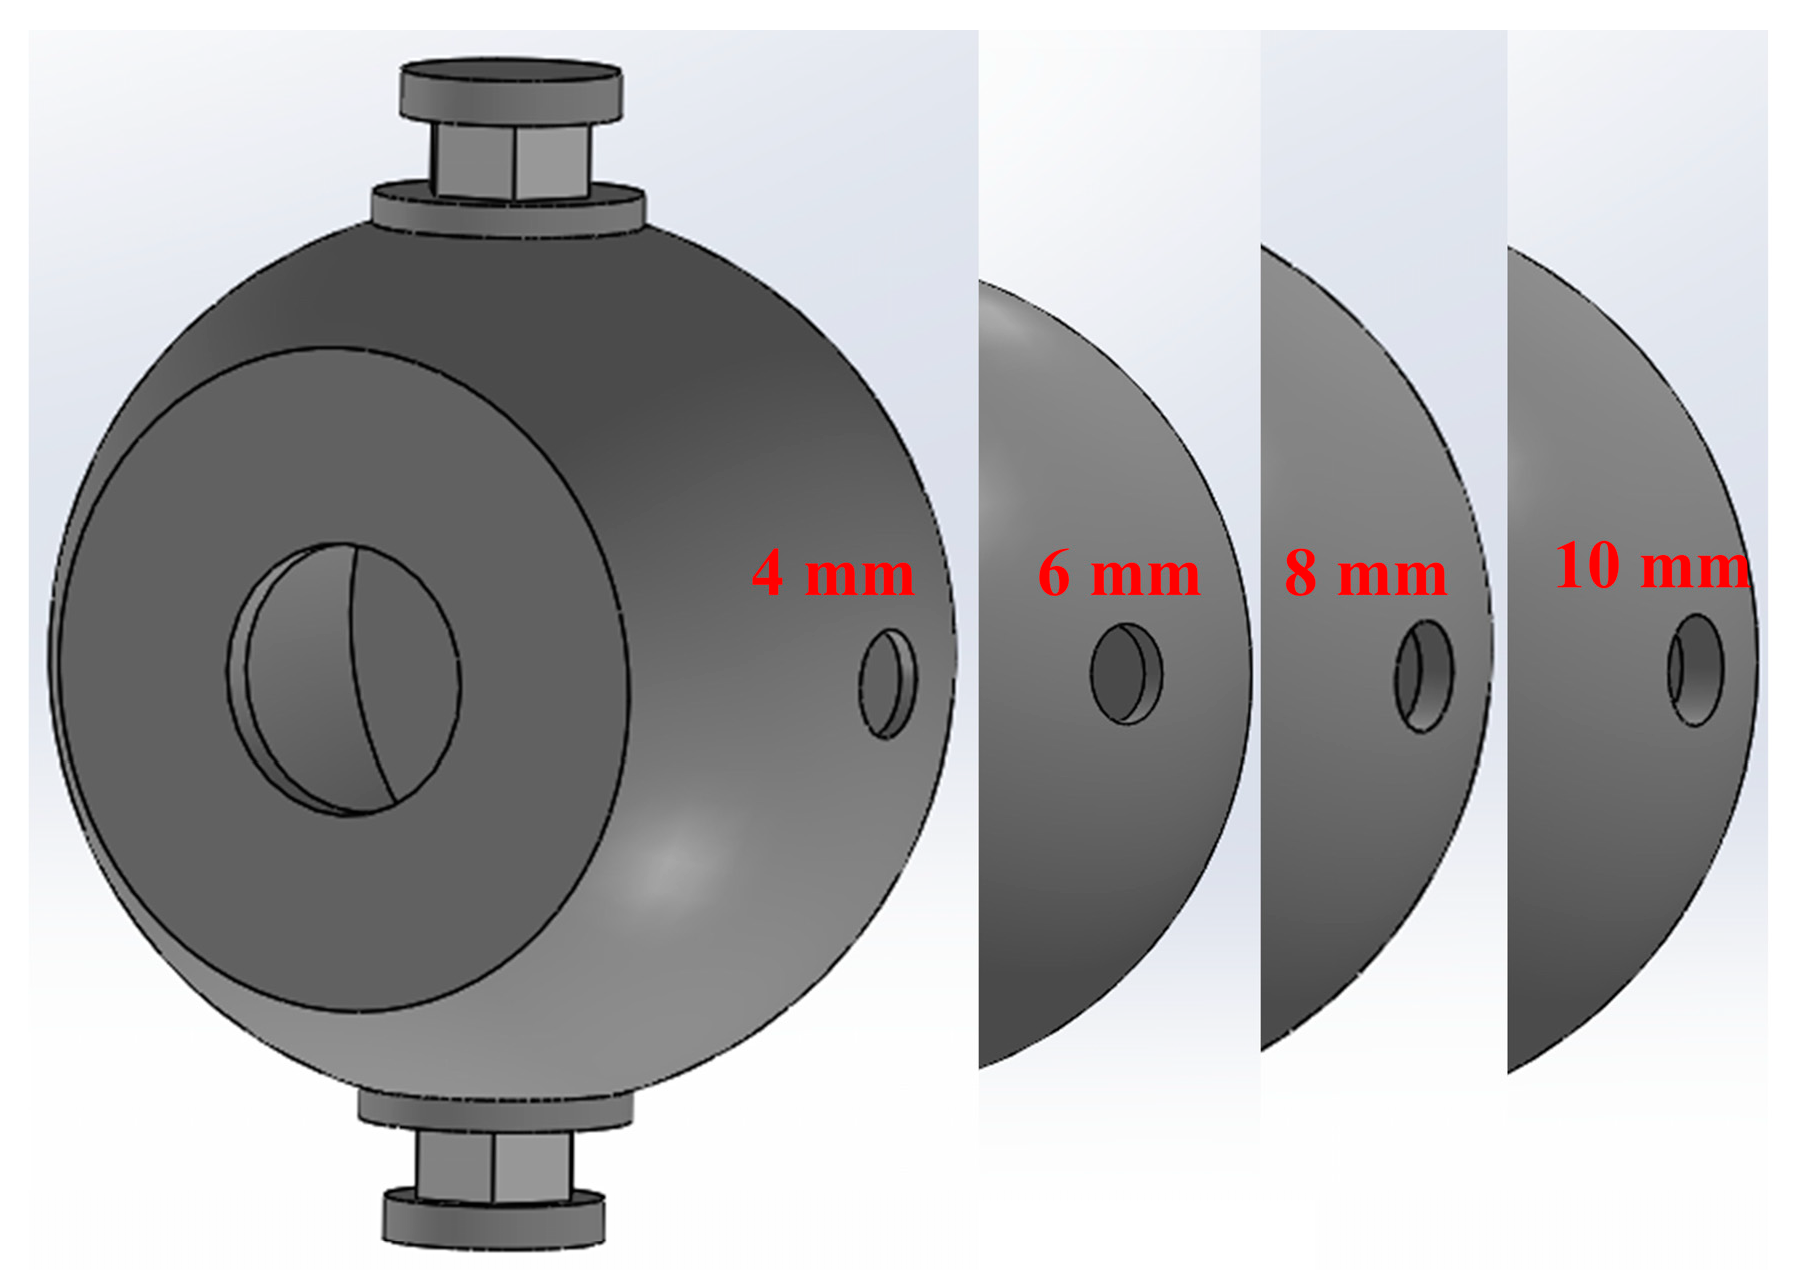
Wall thickness significantly influences the performance of the node. A parametric modeling analysis of the wall thickness of the bolted bulbous spherical shell is performed, with wall thicknesses selected as 4 mm, 6 mm, 8 mm, and 10 mm. The node schematic diagram is shown below in Figure 20.
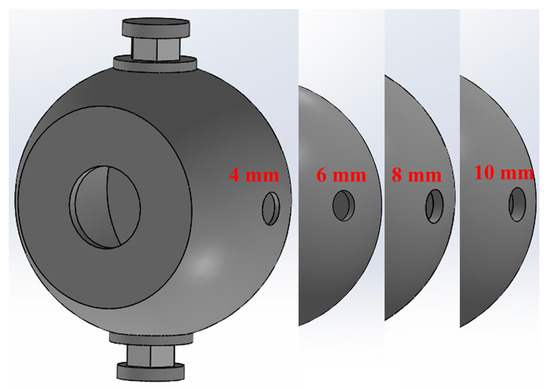
Figure 20.
Wall thickness parameterization model.
(1) Hysteresis curves
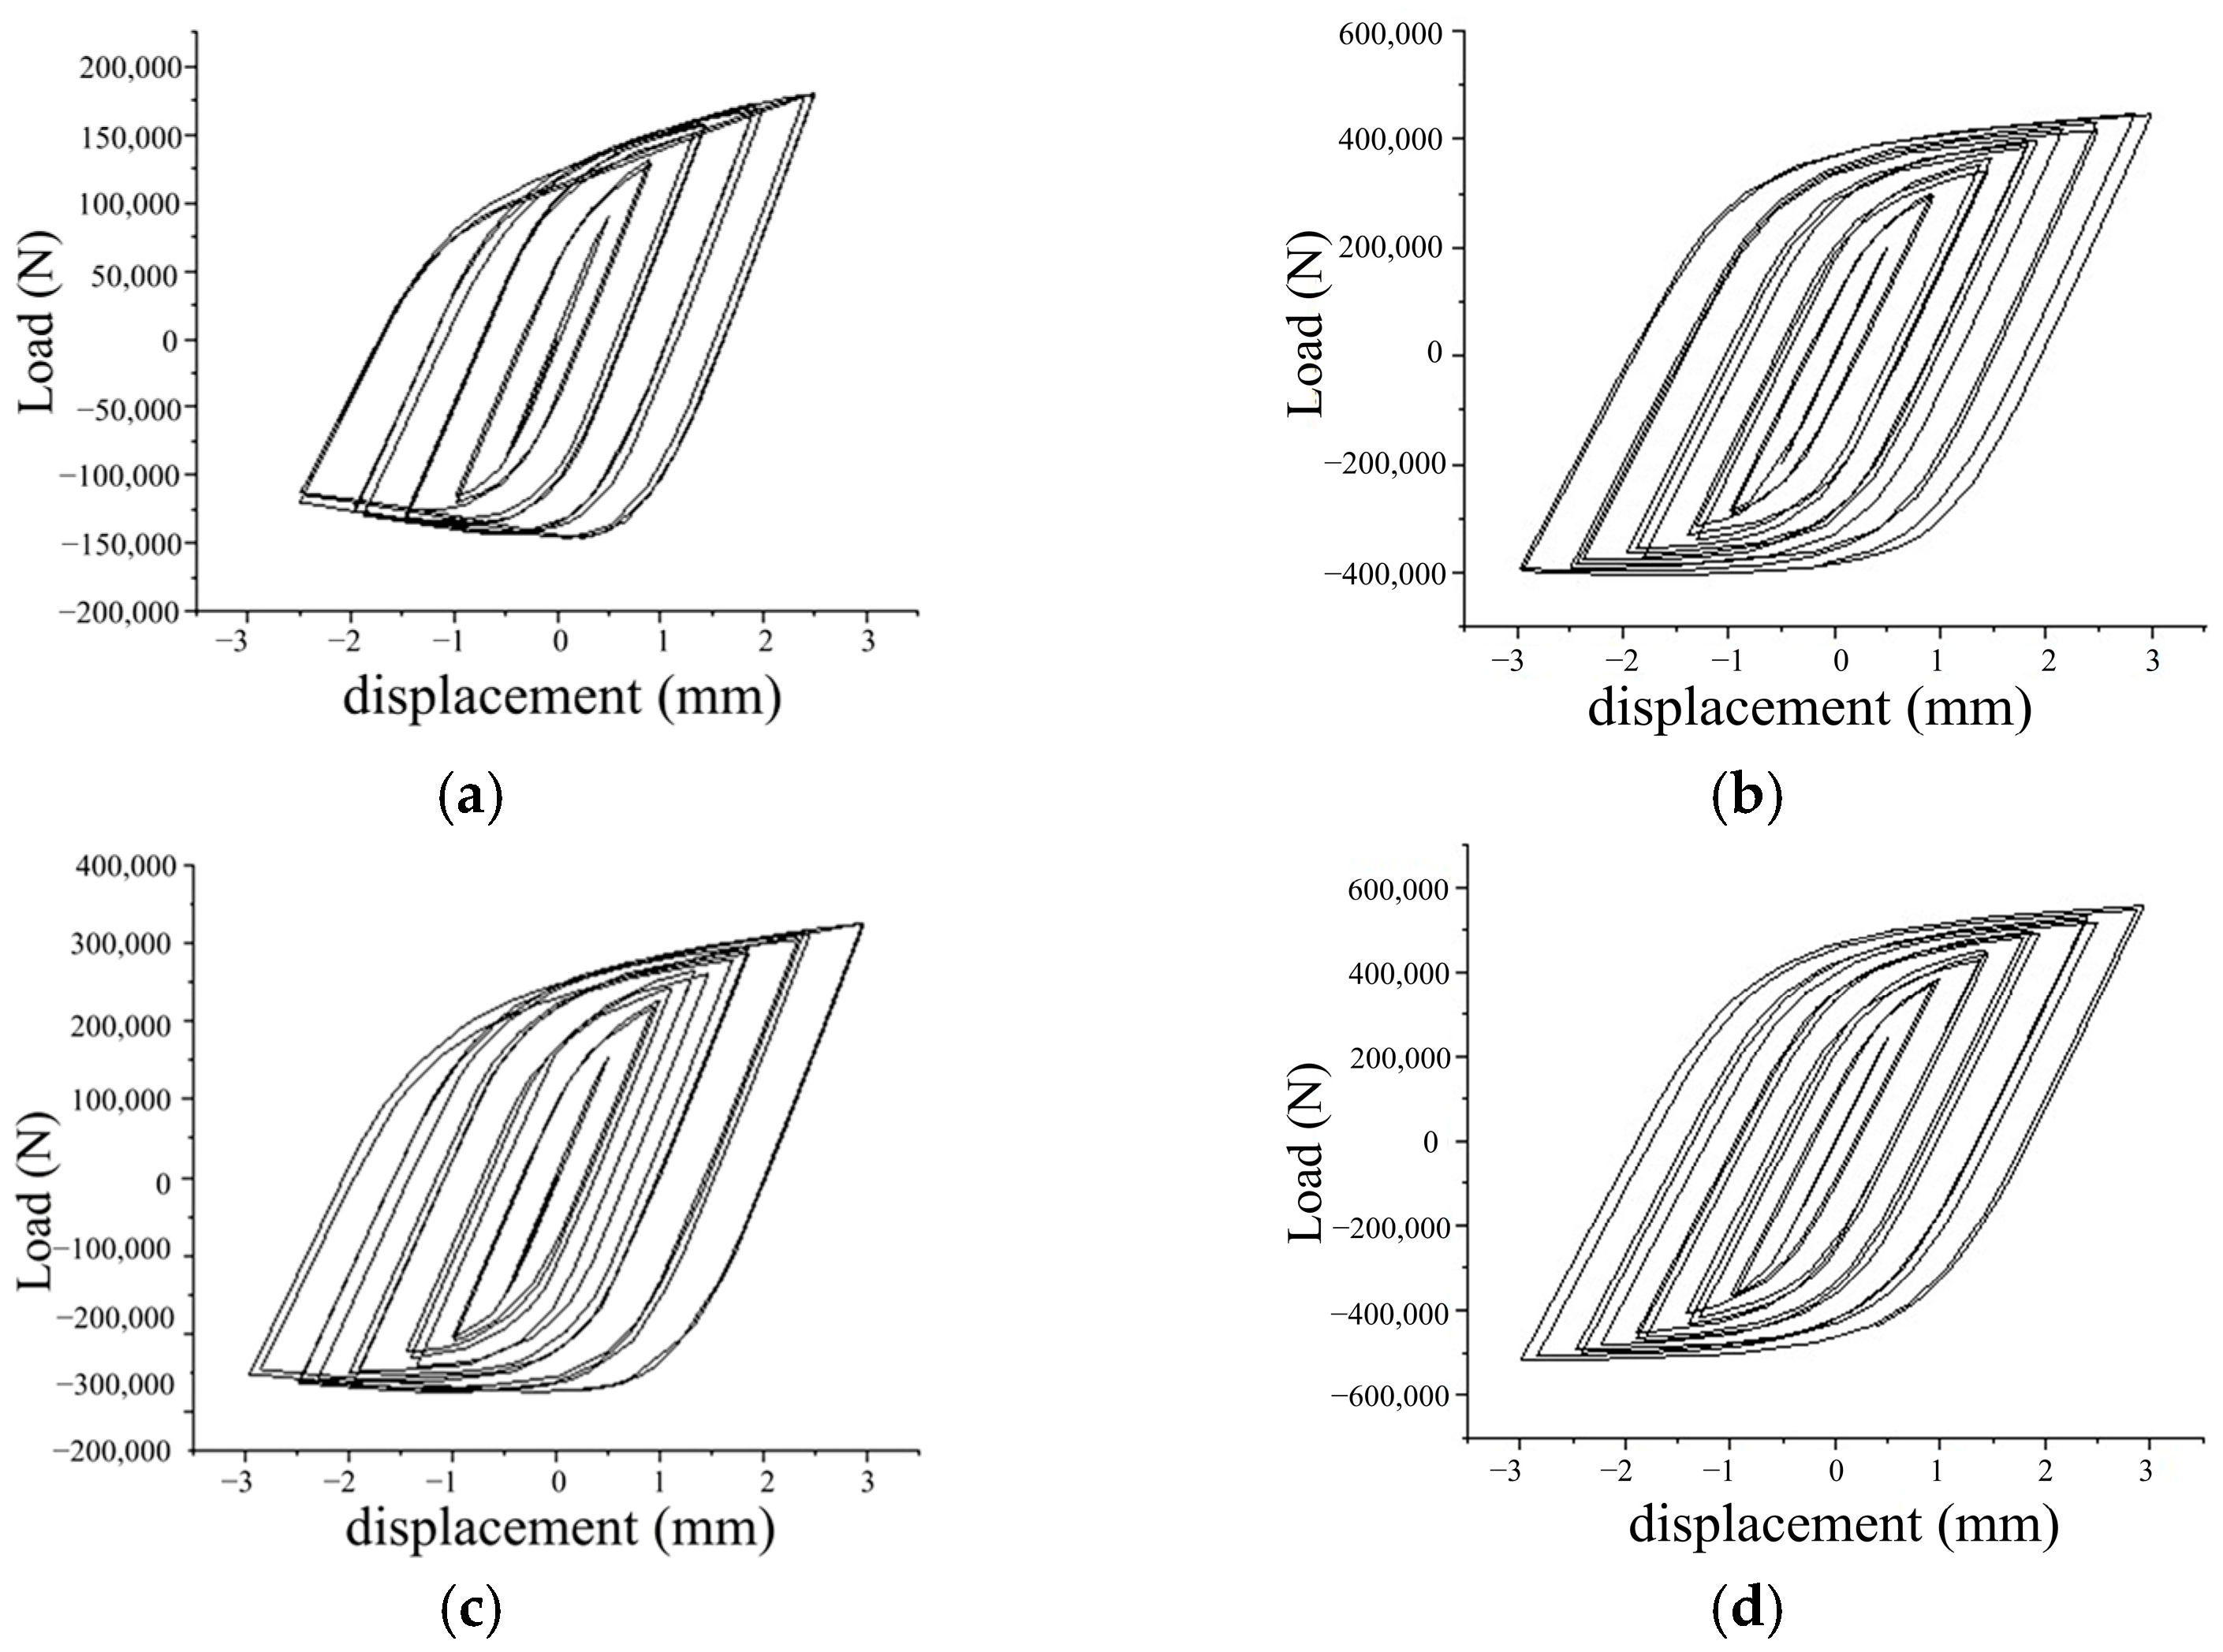
The hysteresis curves for the four nodes are shown in Figure 21 below:
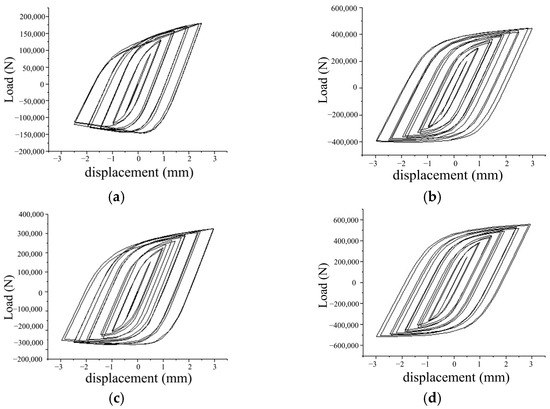
Figure 21.
Hysteresis curves for different wall thickness nodes: (a) t = 4 mm; (b) t = 6 mm; (c) t = 8 mm; (d) t = 10 mm.
From the figure, it can be observed that during the reciprocating loading process, the node with a wall thickness of 4 mm experiences plastic deformation first under axial pressure. As the loading level increases, the compressive bearing capacity gradually decreases. The hysteresis curve, while complete, exhibits asymmetry, which is attributed to the differing axial tensile and compressive stiffness of the node.
As the wall thickness increases, the compressive bearing capacity of the node gradually increases, and the tensile and compressive bearing capacities become more similar. The node enters plastic deformation at the maximum load when the wall thickness reaches 10 mm. With the increase in wall thickness, the stressed region expands sufficiently to develop plasticity, resulting in a more uniform and complete hysteresis curve.
(2) Skeleton curves
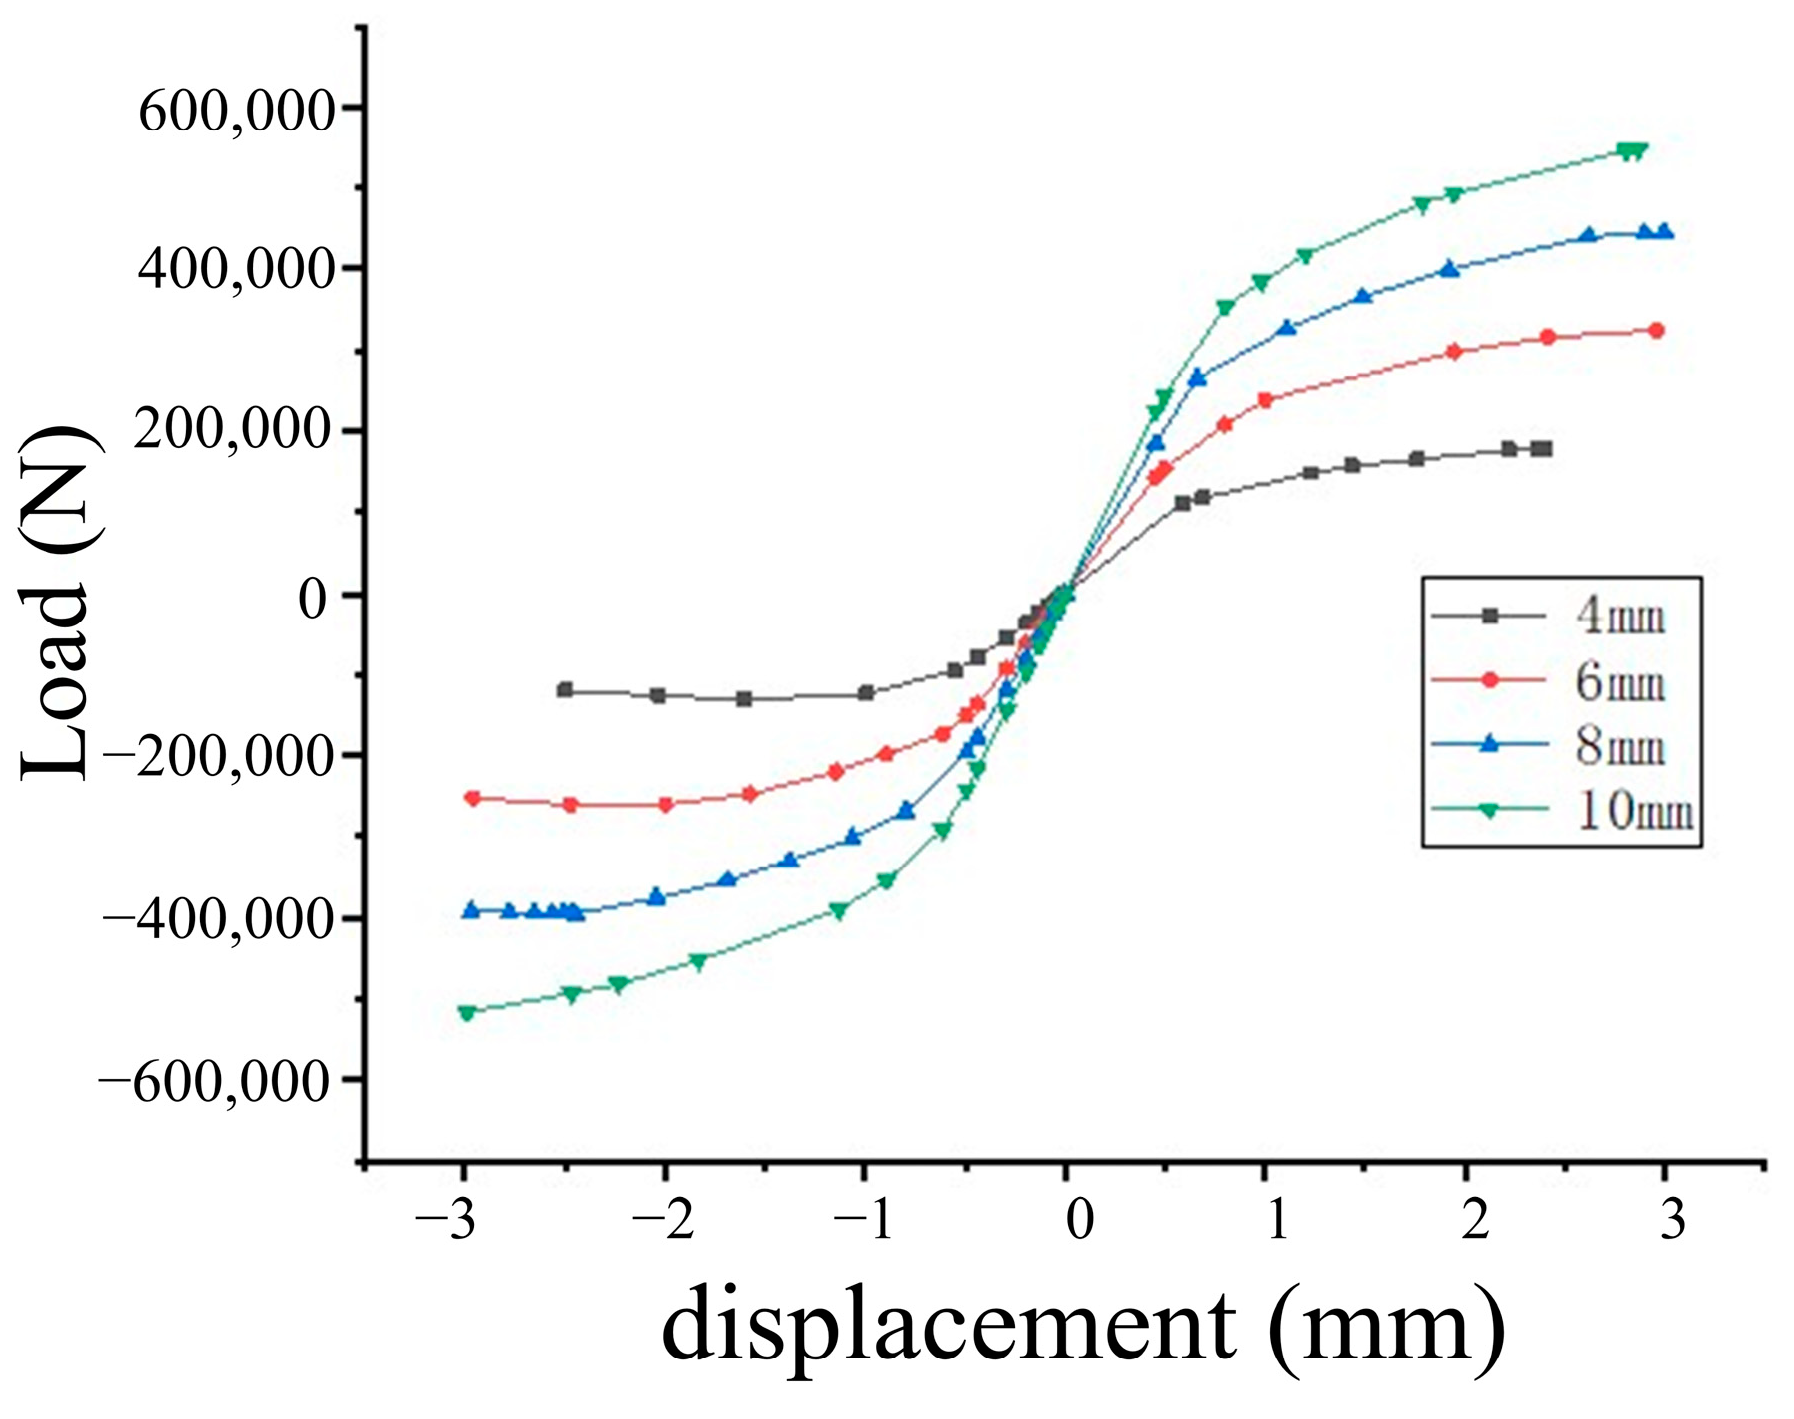
The skeleton curves for nodes with different wall thicknesses are extracted from the hysteresis curves, as shown in Figure 22 below.
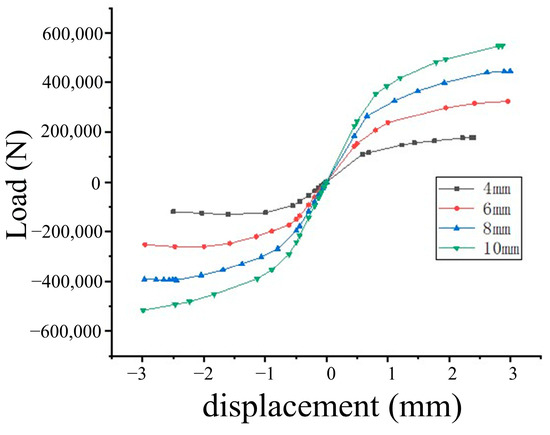
Figure 22.
Comparison of skeleton curves at different wall thicknesses.
The skeleton curves of all four nodes exhibit an “S” shape, indicating that the members undergo three stages: elasticity, elastoplasticity, and plasticity. In the early stages of loading, the drum-shaped spherical shell as a whole did not enter the yielding load–displacement curve, which followed an oblique straight line, and the skeleton curve exhibited linear growth. During the middle and later stages of loading, the yield surface around the stressed bolt holes expanded, the plastic region increased, and the slope of the skeleton curve in the compression process became nearly 0, indicating significant stiffness degradation. As the wall thickness increases, the nodal bearing capacity gradually improves. This is because, during the processes of tension and compression, the shell surface undergoes bending. The greater the thickness, the greater the force required to resist bending deformation.
(3) Energy Consumption Capacity
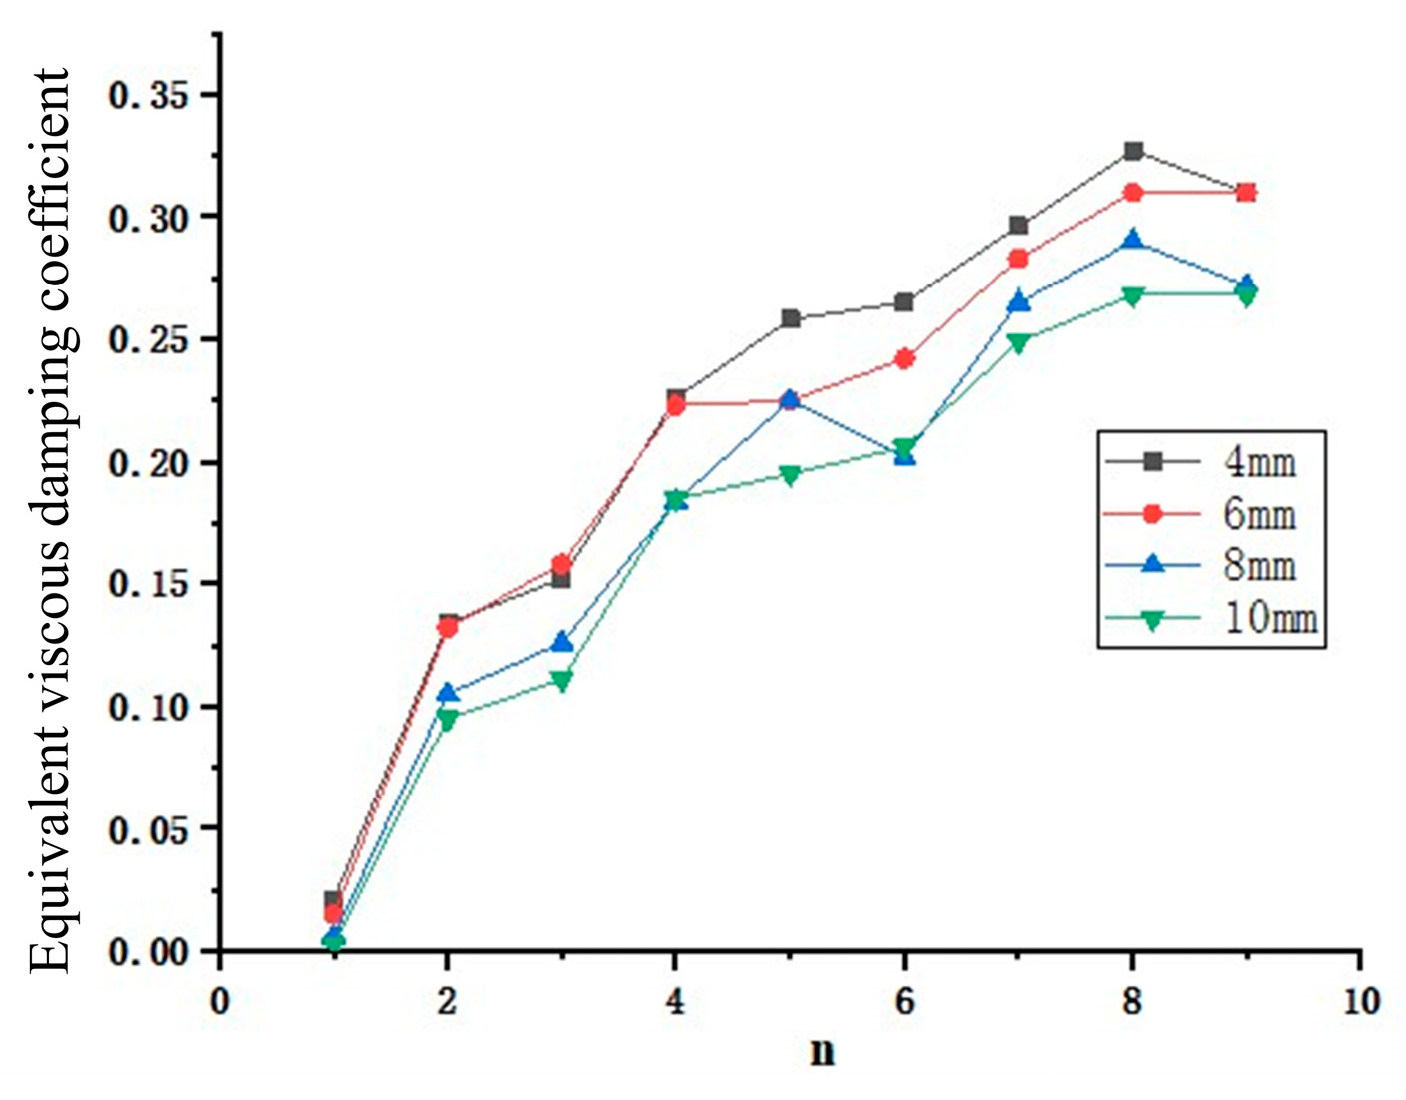
Low-period reciprocating loading of the structure simulates the seismic energy field, where the structure resists sudden external forces through its deformation under earthquake conditions. The structure’s response to external forces during the low-period reciprocating test is represented by the hysteresis curve. The area enclosed by each hysteresis loop of the curve represents the energy dissipated by the member under the action of reciprocating external forces. Two indicators, the energy dissipation coefficient, and the equivalent viscous damping coefficient, are commonly used for evaluation in the “Specification for seismic test of buildings” [30]. The equivalent viscous damping coefficients for the four types of nodes are shown in Figure 23 below.
where is the area enclosed by the hysteresis curve, represents the area of the triangle formed by the origin, the peak load point, and the horizontal displacement corresponding to the peak load during cyclic loading, as shown in Figure 24.
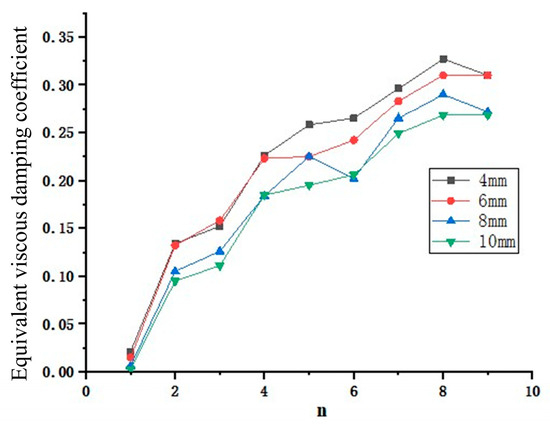
Figure 23.
Calculation of equivalent viscous damping coefficient.
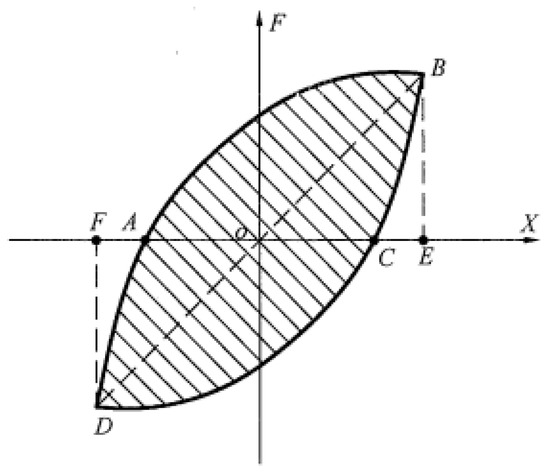
Figure 24.
Energy consumption capacity of four nodes with the same number of loading cycles.
The equivalent viscous damping coefficients of the four nodes first increase gradually with the number of cycles and then decrease. Additionally, the coefficients increase with the wall thickness, indicating that the energy dissipation capacity of the nodes gradually improves. The equivalent viscous damping coefficient in the first hysteresis loop of the four nodes is the largest, indicating that the energy dissipation capacity is greatest during the first loading cycle.
5.5.2. Effect of Diameter on Performance
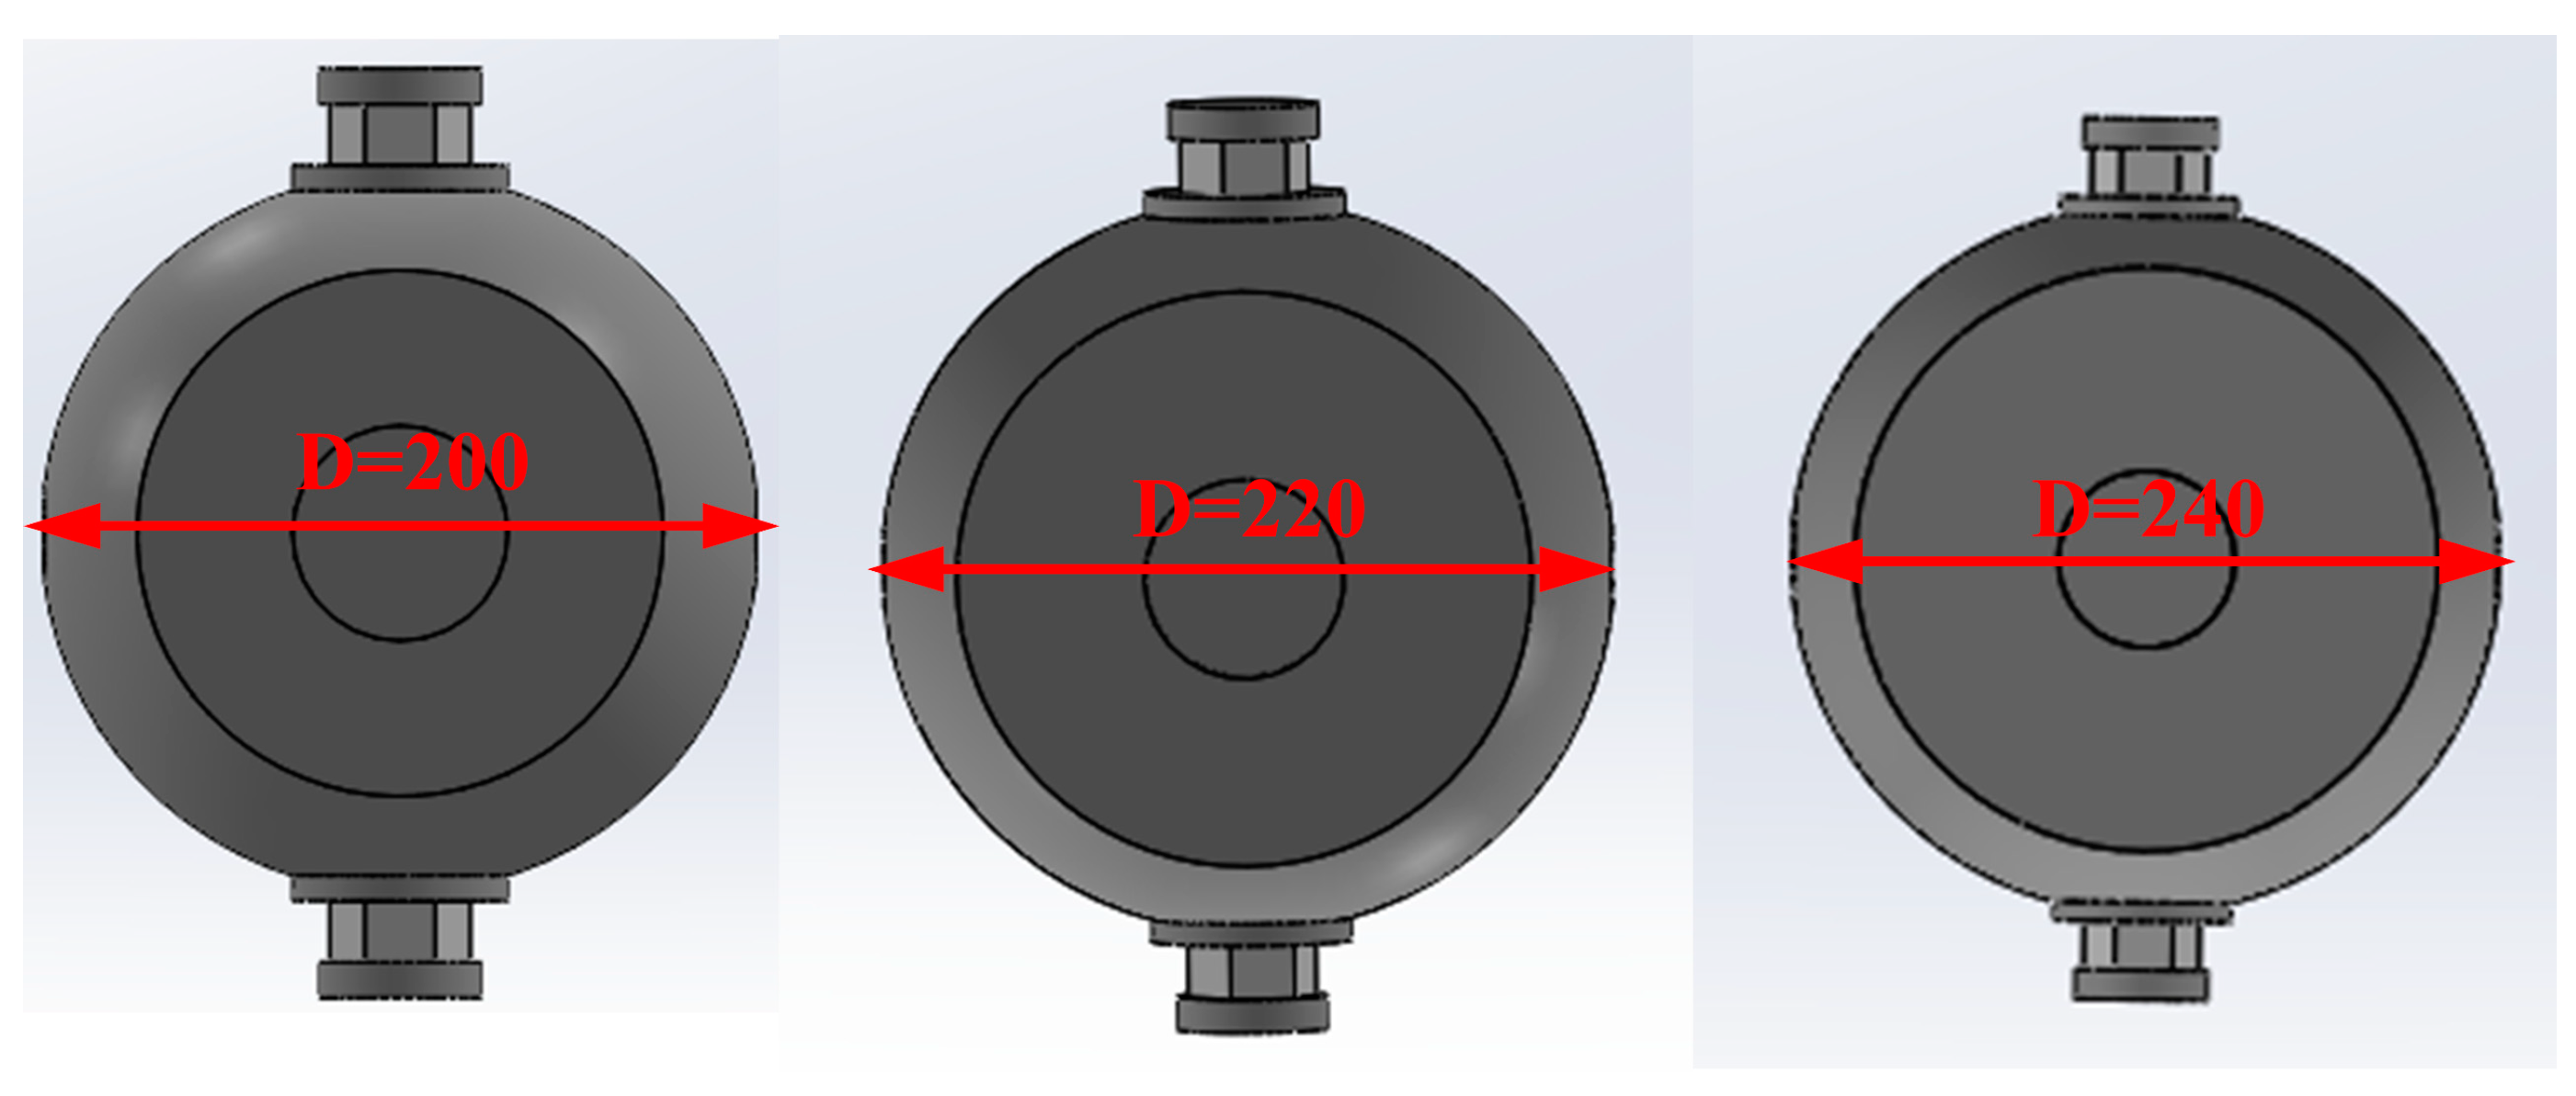
The ball diameter of the bolted drum ball node was varied to examine its effect on hysteresis performance. The wall thickness of the node is kept at 6 mm, and the thickness of the cover plate is kept at 8 mm. The outer diameter of the drum-shaped spherical shell is parametrically modeled with diameters of 200 mm, 220 mm, and 240 mm, as shown in Figure 25 below.
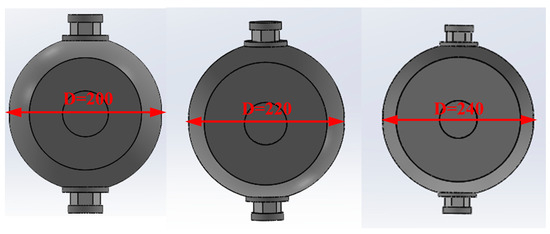
Figure 25.
Diameter parameterized model.
(1) Hysteresis curves
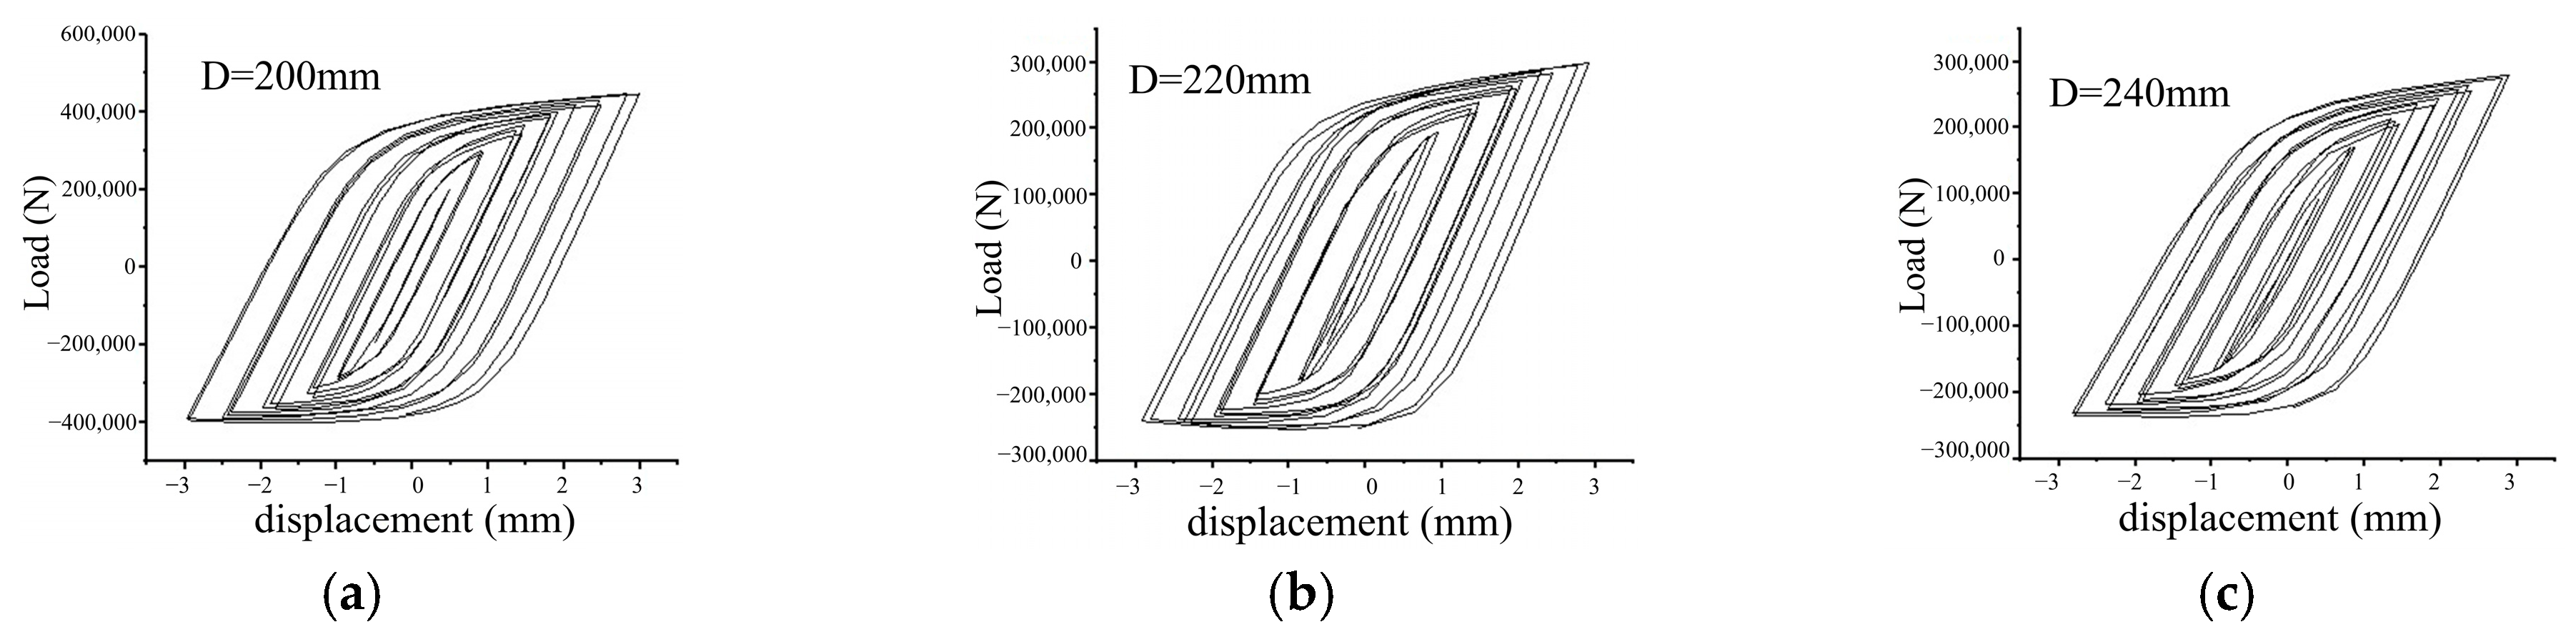
The hysteresis curves for the three nodes are presented in Figure 26 below.
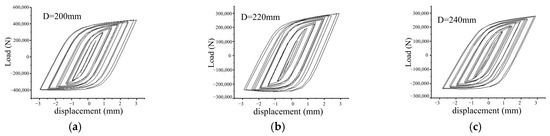
Figure 26.
Hysteresis curve comparison: (a) D = 200 mm, (b) D = 220 mm, (c) D = 240 mm.
A comparison of the hysteresis curves at the three nodes reveals that the curves become fuller, and the plasticity develops more slowly as the ball diameter increases in the pressurized zone during the later stages of the loading cycle.
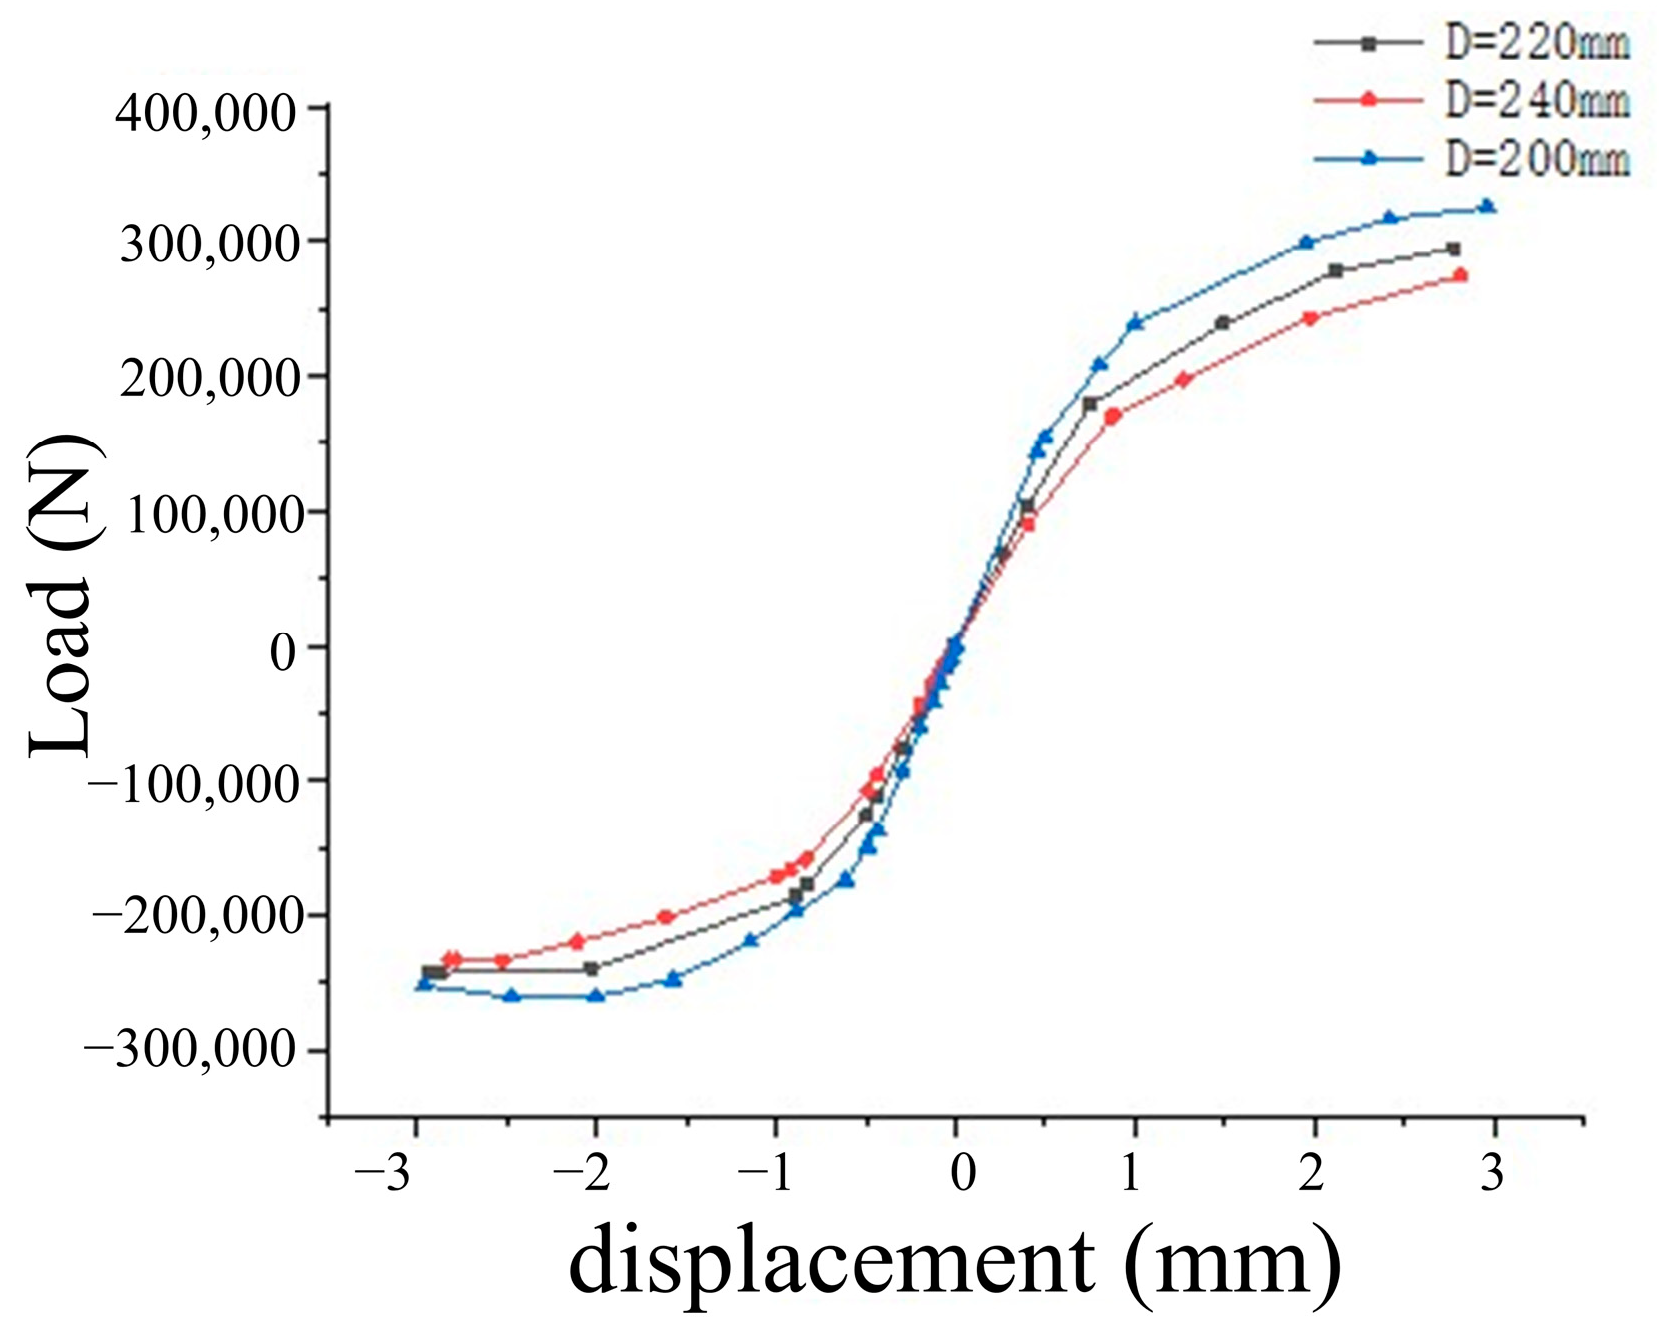
(2) Skeleton curve
As shown in Figure 27, as the ball diameter increases, the load required for the same displacement amplitude decreases. A larger ball diameter results in a smaller curvature of the drum-shaped spherical shell surface, making the curved surface of the drum body closer to a plane. Consequently, the resistance of the arched spherical shell to the deformation of the node decreases.
Figure 27.
Comparison of skeleton curves.
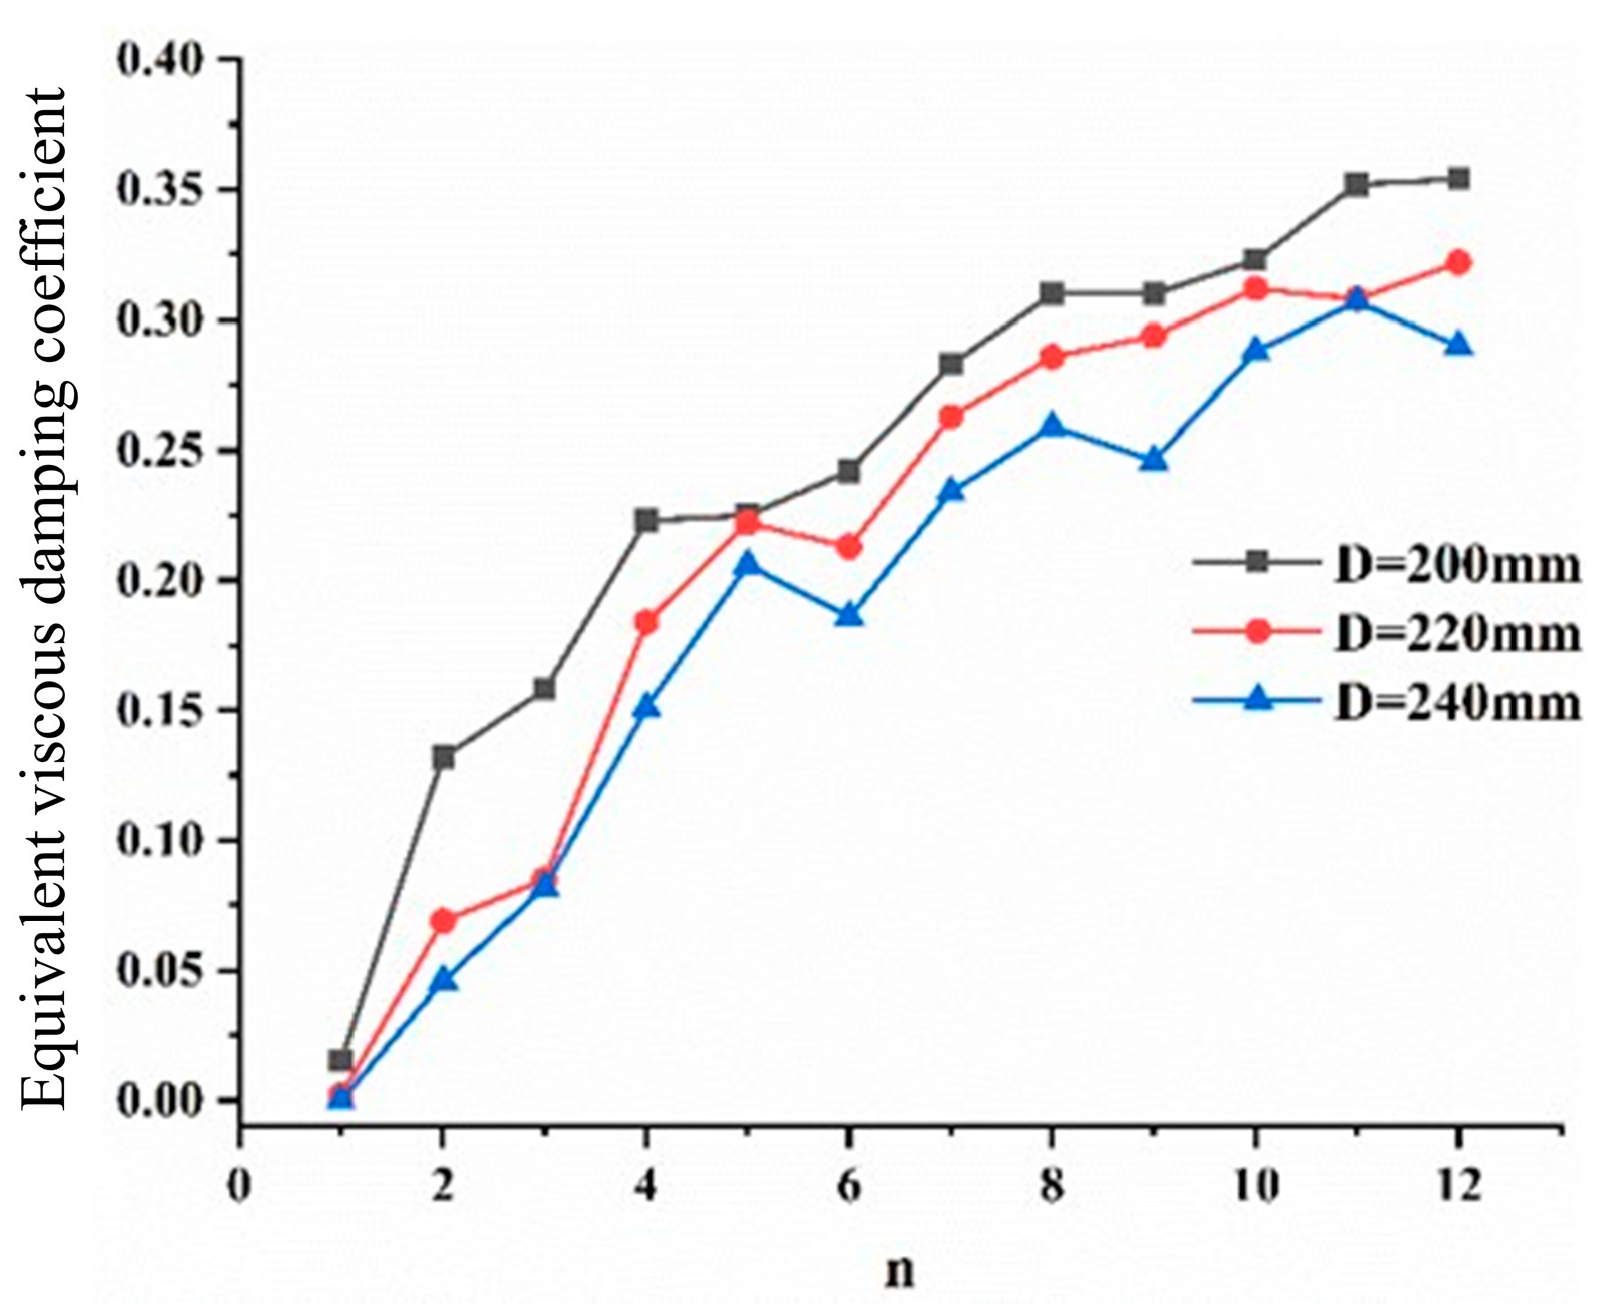
(3) Energy-consuming capacity
The energy dissipation capacity of different ball diameters under cyclic loading is compared using the equivalent viscous damping coefficient, as shown in Figure 28 below.
Figure 28.
Comparison of energy consumption capacity of joints with different ball diameters.
It is found that the energy dissipation capacity of the nodes gradually increases with the number of cycles, and the equivalent viscous damping coefficient reaches its maximum between the 11th and 12th cycles. As the diameter of the node increases, the energy dissipation factor decreases sequentially for the same number of cycles. The skeleton curves for nodes with different ball diameters convey the same information.
In summary, the hysteresis simulation of a bolted bulbous ball node with varying ball diameters and wall thicknesses is performed. The modeling method for this node under reciprocating loads is described in detail, including the intrinsic relationship, cell mesh, loading regime, and boundary conditions. A comparative analysis was performed on the hysteresis curves, skeleton curves, and energy dissipation capacities of different nodes, leading to the following conclusions: the hysteresis curve of the bolted bulbous shell node is notably full, exhibiting a stable spindle shape. This indicates that the node possesses substantial plastic deformation energy and excellent plastic performance, demonstrating its superior seismic performance. The nodes undergo three distinct stages during the hysteresis process: elasticity, elastoplasticity, and plastic damage. As the wall thickness increases, the hysteresis curve of the nodes becomes increasingly symmetric and uniform, accompanied by a gradual enhancement in energy dissipation capacity and an overall improvement in hysteresis performance. In contrast, with the increase in ball diameter, the shape of the hysteresis curve remains consistent, while the skeleton curve exhibits a gradual decline, and the enhancement in hysteresis curve performance is negligible.
6. Conclusions
As a new type of connection node, the fundamental mechanical properties of bolted drum-shaped spherical shell joints are crucial for practical engineering applications. This paper explores the basic mechanical properties of the nodes in detail through low-cycle fatigue tests, using bolted drum-shaped spherical shell nodes as the research object, and conducts finite element simulations of the nodes under reciprocating loads. Based on these studies, the following conclusions can be drawn.
- Through low-cycle fatigue tests conducted on the bolted drum-shaped spherical shell node, it was observed that the damage primarily occurs near the bolt holes. Furthermore, the rate of node damage accelerates with increasing displacement amplitude. Finally, a fatigue life formula was derived as .
- Based on the fatigue life assessment results, it is recommended to adopt Type Z10 construction details as specified in the Code for the Design of Steel Structures in engineering design. This approach will enhance the fatigue life of the nodes and improve overall structural safety.
- As analyzed by the finite element model, the hysteresis curve becomes increasingly symmetric and full with the increase in the wall thickness of the bulbous spherical shell. Furthermore, a thicker wall thickness results in a larger displacement amplitude required to induce yielding in the node under loading. For the same wall thickness, the skeleton curve decreases as the node diameter increases, leading to a reduction in bearing capacity under identical displacement amplitudes. Furthermore, increasing the wall thickness significantly enhances the seismic performance of the node, surpassing the effect of increasing the ball diameter.
Author Contributions
Conceptualization, X.M.; methodology, X.M.; software, D.L.; validation, D.L. and M.L.; investigation, M.L.; resources, D.L.; writing—original draft preparation, D.L.; writing—review and editing, X.M.; supervision, X.M. and L.L. All authors have read and agreed to the published version of the manuscript.
Funding
This research was funded by the Science and technology planning project of Henan Province, China (No: 242102320019) and the Science and technology planning project of Anyang, Henan Province, China (No: 2023C01SF197) and Start-up Funding of Postdoctoral Innovation Practice Base in Anyang Institute of Technology (No: BHJ2025001).
Institutional Review Board Statement
Not applicable.
Informed Consent Statement
Not applicable.
Data Availability Statement
Data are contained within the article.
Conflicts of Interest
The authors declare no conflicts of interest.
References
- Shu, T.; Wang, R.; Wang, Y.; Xu, X. Static performance of welded hollow sphere joints with trapezoidal ribs under both axial compression and bending moment. J. Constr. Steel Res. 2025, 226, 109298. [Google Scholar] [CrossRef]
- Li, Y.; Huang, B. Research on load-bearing performance of new fabricated steel structure beam-column joints with energy dissipating elements. Structures 2022, 38, 492–501. [Google Scholar] [CrossRef]
- Zhao, H. Load-Carrying Properties of Welded Hollow Truncated Joint in Sphere Space Grid. D.; Xi’an University of Architecture and Technology: Xi’an, China, 2004. [Google Scholar] [CrossRef]
- Wang, W.; Zhang, S.; Zhang, T.; Jiang, X.; Li, S.; Zhao, X. Design and study on joints of the steel structure for Shennong Theatre. J. Build. Struct. 2013, 43, 16–20. [Google Scholar] [CrossRef]
- Chen, Z.; Wen, S.; Liu, H.; Wang, X.; Gao, H. Mechanical properties of the drum-shaped welded hollow spherical joints of the Beijing Daxing International Airport. J. Tsinghua Univ. Sci. Technol. 2020, 60, 967–976. [Google Scholar] [CrossRef]
- Lv, Y.; Su, Y.; Yu, Z.; Gong, S.; Dai, J. Finite Element Analysis of the Ultimate Compressive Bearing Capacity of Upper Flat Welded Spherical Joints. J. Prog. Steel Build. Struct. 2021, 23, 76–83. [Google Scholar] [CrossRef]
- Wan, H.; Guo, J. Experimental Study and Application Analysis of a New Type of Hollow Bolt Spherical Joint Unit. In Proceedings of the 7th Academic Conference on Spatial Structures, Wendeng, China, November 1994; pp. 640–645. [Google Scholar]
- Guo, J.; Wan, H. Experimental Research on a New Type of Hollow Spherical Joint. CBuild. Struct. 1998, 8, 49–51. [Google Scholar] [CrossRef]
- Shu, T.; Xu, X.; Pan, W.; Huang, W.; Luo, Y. Compressive performance of welded hollow spherical joints with external triangular ribs. Eng. Struct. 2023, 280, 115717. [Google Scholar] [CrossRef]
- Yu, J.T.; Yu, K.Q.; Tang, B. Experimental and Finite Element Analysis on the Ultimate Bearing Capacity of Hollow Spherical Joints with Ribbed Stiffener. J. Ind. Constr. 2011, 41, 85–90. [Google Scholar] [CrossRef]
- Wang, F. The Role and Design of Steel Brace Joints in Earthquake Resistance. J. Ind. Constr. 1986, 10, 21–26. [Google Scholar]
- Liu, X.; Pu, S.; Xu, A.; Ni, Z.; Zhang, A.; Yang, Z. Experimental study on static and seismic performance of bolted joint in modularized multi-layer and high-rise prefabricated steel structures. J. Build. Struct. 2015, 36, 43–51. [Google Scholar] [CrossRef]
- Li, S.; Yang, W.; Hou, C. Experimental study on constitutive relation of directly-welded joints of tubular truss structures under cyclic loading. J. Build. Struct. 2020, 50, 35–41. [Google Scholar] [CrossRef]
- Li, X.; Huang, X.; Zhao, J.; Zhao, W.; Ge, J. Experimental study on ultra-low cycle fatigue fracture of X-shaped steel joints with circular hollow section braces to square hollow section chord. J. Build. Struct. 2022, 52, 86–92. [Google Scholar] [CrossRef]
- Wang, X.; Li, H.; Song, X. Experimental investigation of failure mechanism of grid structure with bolted spherical joints. J. Constr. Steel Res. 2022, 188, 107033. [Google Scholar] [CrossRef]
- Liu, J.; Yu, T.; Li, H.; Chen, X.; Li, Q. Experimental investigation of the ultra-low-cycle fatigue behaviours of RHS K-gap joints. J. Struct. 2024, 70, 107682. [Google Scholar] [CrossRef]
- Guo, L.; Li, H.; Song, X.; Zhang, J. Effect of Loading System on Low-cycle Fatigue Performance of Bolt Ball Joint Test Specimen. J. Sci. Technol. Eng. 2020, 20, 14586–14591. [Google Scholar] [CrossRef]
- Tong, L.; Huang, X.; Zhou, F.; Chen, Y. Experimental and numerical investigations on extremely-low-cycle fatigue fracture behavior of steel welded joints. J. Constr. Steel Res. 2016, 119, 98–112. [Google Scholar] [CrossRef]
- Qiu, B.; Yang, X.; Zhou, Z.; Lei, H. Experimental study on fatigue performance of M30 high-strength bolts in bolted spherical joints of grid structures. J. Eng. Struct. 2020, 205, 110123. [Google Scholar] [CrossRef]
- Hassanin, A.; Fawzy, H.; Elsheikh, A. Fatigue loading characteristic for the composite steel-concrete beams. J. Fract. Struct. Integr. 2021, 15, 110–118. [Google Scholar] [CrossRef]
- Ostash, O.; Panasyuk, V.; Andreiko, I.; Chepil’, R.; Kulyk, V.; Vira, V. Methods for the construction of the diagrams of fatigue crack growth rate of materials. J. Mater. Sci. 2007, 43, 479–491. [Google Scholar] [CrossRef]
- Yan, Y.; Liu, M.; Zhou, Z.; Ma, X. Axial Compression Bearing Capacity of Bolted Drum-Shaped Spherical Shell Joints: Experimental and Numerical Analysis. J. Coatings 2024, 14, 229. [Google Scholar] [CrossRef]
- GB 50017–2017; Standard for Design of Steel Structures. Ministry of Housing and Urban-Rural Development of the People’s Republic of China: Beijing, China, 2017.
- China Academy of Building Research. Code for Quality Inspection and Assessment of Space Frame Structures (JGJ 78–91); Ministry of Construction of the People’s Republic of China: Beijing, China, 1992. [Google Scholar]
- Sun, G.; Xiao, S.; Wu, J. Study on mechanical properties of truss cable structure under low cyclic loading. J. Build. Eng. 2022, 58, 105051. [Google Scholar] [CrossRef]
- Shepherd, R. Progress with the Sac Joint Venture Program for the Evaluation, Repair, Modification, and Design of Welded Steel Moment Frame Structures; Civil-Comp Press: Edinburgh, UK, 1997; pp. 21–26. [Google Scholar]
- Krawinkler, H.; Zohrei, M. Cumulative damage in steel structures subjected to earthquake ground motions. J. Comput. Struct. 1983, 16, 531–541. [Google Scholar] [CrossRef]
- Ballio, G.; Calado, L.; Castiglioni, C.A. Low cycle fatigue behaviour of structural steel members and connections. J. Fatigue Fract. Eng. Mater. Struct. 1997, 20, 1129–1146. [Google Scholar] [CrossRef]
- Zhang, W.; Hu, Y. Numerical simulation method for high-strength bolt connections in steel structures. J. Harbin Inst. Technol. 2014, 46, 8–14. [Google Scholar]
- JGJ/T2015; Ministry of Housing and Urban-Rural Development of the People’s Republic of China, Specification for Seismic Test of Buildings. China Architecture & Building Press: Beijing, China, 2015.


Disclaimer/Publisher’s Note: The statements, opinions and data contained in all publications are solely those of the individual author(s) and contributor(s) and not of MDPI and/or the editor(s). MDPI and/or the editor(s) disclaim responsibility for any injury to people or property resulting from any ideas, methods, instructions or products referred to in the content. |
© 2025 by the authors. Licensee MDPI, Basel, Switzerland. This article is an open access article distributed under the terms and conditions of the Creative Commons Attribution (CC BY) license (https://creativecommons.org/licenses/by/4.0/).