Article

Evaluation of Hydrogen Trapping Capability at Interfaces Between Vanadium Carbide and Vanadium Nitride Nanoprecipitates with α-Fe by Density Functional Theory

1
School of Chemical Engineering, Northwest University, Xi’an 710069, China
2
State Key Laboratory of Oil and Gas Equipment, Tubular Goods Research Institute of CNPC, Jinye 2nd Road 89, Xi’an 710077, China
3
School of Materials Science and Engineering, Nanyang Technological University, 50 Nanyang Avenue, Singapore 639, Singapore
*
Authors to whom correspondence should be addressed.
Coatings 2025, 15(4), 466; https://doi.org/10.3390/coatings15040466
Submission received: 16 March 2025 / Revised: 2 April 2025 / Accepted: 12 April 2025 / Published: 15 April 2025

Abstract

:
The interface between dispersed compound nanoprecipitates and metal substrates can act as effective hydrogen traps, impeding hydrogen diffusion and accumulation, thus mitigating the risk of hydrogen embrittlement and hydrogen-induced coating failure. In this study, we considered the precipitation of vanadium carbide (VC) and vanadium nitride (VN) nanoprecipitates on a body-centered cubic Fe (α-Fe) substrate in the Kurdjumov–Sachs (K–S) orientation relationship. To evaluate the stability and hydrogen trapping ability of the interface, we used the first-principles method to calculate the interfacial binding energy and hydrogen solution energy. The results show that the stability of the interface was related to the type and length of bonding between atoms at the interface. The interface zone and the interface-like Fe zone have the best hydrogen trapping effect. We found that hydrogen adsorption strength depends on both the Voronoi volume and the number of coordinating atoms. A larger Voronoi volume and smaller coordination number are beneficial for hydrogen capture. When a single vacancy exists around the interface region, the harder it is to form a vacancy, and the more unstable the interface becomes. In addition to the C vacancy at the Baker–Nutting relationship interface found in previous studies being a deep hydrogen trap, the Fe and V vacancies at the α-Fe/VC interface and the V and N vacancies at the α-Fe/VN interface in the K–S relationship also show deep hydrogen capture ability.

Graphical Abstract

1. Introduction

In the energy transition, high-pressure gaseous hydrogen pipelines are tasked with long-distance and large-scale hydrogen transportation, while hydrogen storage casings are responsible for safe hydrogen storage in various facilities [1]. The environments they are in are complex and harsh (such as high-concentration hydrogen, pressure fluctuations, etc.), so the anti-corrosion design of metallic materials is of utmost importance. Generally, we use coating protection to safeguard the substrate from damage. However, in some cases, the hydrogen present in the environment or within the substrate itself may deteriorate the bonding strength between the coating and the substrate. In more severe situations, it can have a significant impact on the overall performance of the material, leading to phenomena such as hydrogen embrittlement or hydrogen-induced coating failure [2,3,4,5,6].
Hydrogen embrittlement significantly affects the structural properties of metallic materials, reducing their service life and posing a significant safety hazard [7,8,9]. The mechanisms of hydrogen embrittlement have been intensively studied [10,11,12,13,14], some of which have been experimentally verified [15,16,17]. The mechanism of hydrogen-induced coating failure is also similar to that of hydrogen embrittlement, and it is mostly related to hydrogen adsorption and penetration. In severe cases, it is likely to cause local corrosion or peeling of the coating. In the meantime, endeavors have also been made to explore strategies to suppress the diffusion and accumulation of hydrogen atoms. Hirschfelder proposed the idea of hydrogen traps [18], which are specialized material structures capable of capturing and storing hydrogen atoms. They can impede the diffusion and accumulation of hydrogen atoms so that it is possible to mitigate hydrogen-related issues.
With the advancement of experimental techniques and computer simulation methods, people have begun to combine the two in scientific research in order to enhance the understanding of the physical properties of solids [19,20,21]. Through this approach, it was found that nanoprecipitates composed of carbide and nitride with NaCl-type crystal structure exhibit significant hydrogen trapping ability for capturing H atoms, and these nanoprecipitates are precipitated from steels by several heat treatment processes [22,23,24,25]. Specifically, it mainly refers to the fact that the coherent and semi-coherent interfaces between the nanoprecipitates and the steel matrix can act as effective hydrogen traps at room temperature, while non-coherent nanoprecipitates may only exhibit the ability to trap hydrogen at high temperatures [26,27].
Among numerous NaCl-type nanoprecipitates, vanadium carbides and nitrides have drawn significant attention because their precipitation can not only suppress the hydrogen embrittlement (HE) phenomenon but also enhance the material strength [28,29,30,31,32,33]. When other factors such as the chemical composition of other elements, mechanical strength, and dislocation density were excluded, Lee et al. [34] revealed the role of VC in the hydrogen embrittlement behavior of tempered martensitic steel. As the vanadium content increased, the amount of trapped hydrogen increased. However, when the vanadium content was 0.2 wt%, the material achieved the best hydrogen embrittlement resistance. Furthermore, by using atom probe tomography (APT), it was directly observed that most deuterium (D) atoms were trapped in larger VC lamellae. In addition, 3DAP analysis showed that the chemical composition of these lamellae was V 4 C 3 . The results indicate that the misfitting dislocation cores on the semi-coherent lamellae are deep trapping sites for hydrogen [35].
In previous theoretical calculations [36,37,38], after studying the hydrogen trapping characteristics of a series of nanoprecipitates (VN, TiN, NbN, VC, TiC, NbC, and NiAl) in α-Fe, it has been found that for the coherent interface between α-Fe and nanoprecipitates, the tetrahedral position is the possible hydrogen trap. The non-metallic vacancies are the dominant hydrogen traps in the nanoprecipitates. Among them, the hydrogen trapping performance of C vacancies in VC and N vacancies in TiN is particularly prominent. In addition, after exploring the relationship between atomic volume and hydrogen binding energy [39], it is found that the electronic interaction in the system is closely related to the hydrogen binding energy. The Bader volume of hydrogen is a universal descriptor for evaluating the hydrogen binding energy. In the past, simply considering the spatial volume (such as polyhedron volume and Voronoi volume) could not effectively establish a connection with the hydrogen binding energy.
Overall, NaCl-type nanoprecipitates of vanadium have a promising research prospect. In the past, most of the research on the hydrogen embrittlement resistance of VC and VN focused on orientation relationships such as the Baker–Nutting (B–N) orientation relationship [40,41,42,43,44] ( ( 100 ) M ( C N ) / / ( 100 ) α , [ 011 ] M ( C N ) / / [ 010 ] α ) and the parallel orientation relationship [45,46,47,48] ( ( 100 ) M ( C N ) / / ( 100 ) γ , [ 010 ] M ( C N ) / / [ 010 ] γ ). However, the Kurdjumov–Sachs (K–S) orientation relationship ( ( 1 1 ¯ 1 ¯ ) M ( C N ) / / ( 101 ) α , [ 0 1 ¯ 1 ] M ( C N ) / / [ 1 ¯ 11 ] α ) [49] has rarely been explored in the research of VC and VN, despite its great potential in understanding the crystallographic characteristics and interfacial properties of materials [50]. The unique crystallographic matching method of the K–S orientation makes it easier for the atoms to transform into a semi-coherent interface at the interface, providing more potential hydrogen trapping sites [51]. This may lead to hydrogen trapping and diffusion behaviors that are quite different from those of the traditional B–N orientation. By studying the K–S orientation, it is expected to discover new hydrogen embrittlement-resistant mechanisms, providing new ideas and methods for the performance optimization of materials. Given this situation, we designed an interface model in which the vanadium carbide (VC) and vanadium nitride (VN) have a Kurdjumov–Sachs (K–S) orientation relationship with body-centered cubic Fe. Using the basic principles of density functional theory (DFT) for calculations, we aimed to determine whether these interfaces with K–S orientation relationships can serve as effective traps for H immobilization, just like the interfaces with the B–N orientation relationships [50]. In addition, we also investigated the effects of different vacancies in the interface on the structural stability and the ability to capture H, to determine which element and at which position the vacancies can better immobilize hydrogen.

2. Materials and Methods

All calculations were performed using density functional theory [52,53] simulation, using the CASTEP module of the Materials Studio software package (Biovia, San Diego, CA, USA). The ion nuclei were described by an ultrasoft pseudopotential. All pseudopotentials were selected from the built-in database of CASTEP (Materials Studio version 8.0) and generated using the Perdew–Burke–Ernzerhof (PBE) functional within the generalized gradient approximation (GGA). Self-consistent periodic DFT was calculated by GGA approximation, and exchange-correlation energy was calculated by PBE approximation [54,55]. The valence electron configurations for each element are as follows: Fe ( 3 d 6 4 s 2 ), V ( 3 d 3 4 s 2 ), C ( 2 s 2 2 p 2 ), and N ( 2 s 2 2 p 3 ). Since the system is magnetic, a high-spin state is adopted, taking into account the spin properties of electrons. In this paper, the Broyden–Fletcher–Goldfarb–Shanno scheme is chosen as the minimization algorithm. After the convergence test, the K-points are set to 9 × 9 × 9 (Figure S1), the cut-off energy is set to 500 eV (Figure S2), and the self-consistent field tolerance is set to 5.0 × 10⁻⁷ eV atom−1. The optimization is completed when the energy, maximum force, maximum stress, and maximum displacement are less than 5.0 × 10⁻⁶ eV atom−1, 0.01 eV Å−1, 0.02 GPa, and 5.0 × 10⁻⁴ Å, respectively. In our study, all calculations were performed using the same parameter settings and the same computational environment was used to repeatedly calculate the same model. According to our analysis, the errors in the calculation results under these circumstances mainly stem from minor differences in numerical precision and floating-point operations. These errors typically fall within the range of numerical precision and may be on the order of 10−6 to 10−8. The impact of these errors on practical applications is negligible. Therefore, we did not include error bars in the presentation of the subsequent calculation results.
The Voronoi analysis method in the Ovito software was used to analyze the atomic volume of the H atoms in each configuration. The mathematical methods used here are mainly geometric calculation methods related to the Voronoi diagram. For a given set of points (in this case, the positions of atoms), the Voronoi diagram divides the space into multiple regions. Each region surrounds a point (atom) such that the distance from any point within this region to this particular point is less than the distance to other points.
The interface bonding strength ( E b ) is determined by the interfacial binding energy, and the calculation equation of the interfacial binding energy is shown in Equation (1) [56].
E b = ( E α F e / V M x E F e b u l k y E V M b u l k ) / 2 S
where E α F e / V M is the total energy of the interface system, and E F e b u l k and E V M b u l k are the total energy per atom in the bulk Fe and VM, respectively. x and y are the number of Fe atoms and VM atom pairs in the interface model and S is the area of the interface.
We calculated the formation enthalpy to evaluate the stability of binary compounds, defined as Equation (2) [57,58].
H f o r ( V x M y ) = E V x M y x E V y E M x + y
where E V x M y is the total energy of V–M binary compounds, and E V and E M are the total energy per atom in bulk V and bulk M, respectively.
We calculated the solution energy ( E s o l ) to characterize the solubility of H at a location in the system, defined as Equation (3) [59,60].
E s o l = E t o t a l H E t o t a l 0 1 2 E ( H 2 )
where E t o t a l H and E t o t a l 0 are the total energy of the system with and without H atoms, the system could be the bulk or interface, and E ( H 2 ) is the total energy of H2.
In addition to the solution energy of the pure interface, the vacancy stability of the vacancy-containing interfaces and the solution of hydrogen into vacancies near the interface are also considered. The former is characterized by the vacancy formation energy ( E f o r ) that is defined by Equation (4) [61].
E f o r = E t o t a l V a c E t o t a l 0 + E F e / V / C / N
where E t o t a l V a c and E t o t a l 0 are the total energy of the system with and without the Fe/V/C/N vacancy, and E F e is the energy of a single Fe atom in the bulk α-Fe. Since Fe–VC/VN alloys are usually prepared from Fe and VC/VN powders by mechanical alloying and the high-energy-rate forging process, E V is located in the range of E V M E M b u l k E V E V b u l k , where E V M is the energy of bulk VM, and E V b u l k and E M b u l k are the energy of V and M atoms in the bulk V and M (M could be C or N). Similarly, the range of E C / N is E V M E V b u l k E M E M b u l k .
To demonstrate the correlation between the vacancy formation energy and the interface binding energy, we calculated Spearman’s rank correlation coefficient ( r S ) of the two in this study. The calculation method does not rely on the specific values of the data but focuses on the relative magnitude order of the data. Its value range is between −1 and 1, and its meaning is similar to that of the Pearson correlation coefficient. The closer the value is to 1, the stronger the positive correlation. The calculation method is shown in Equation (5):
r S = 1 6 i = 1 n d i 2 n ( n 2 1 )
where di is the difference in the ranks of the ith data point in the two sets of data, and n is the number of data points.

3. Results

3.1. Geometric Structure

The α-Fe cell has a body-centered cubic (BCC) lattice structure. In the crystal structure of α-Fe, the coordination number is 8, and the space group is 186. The calculated lattice parameters are a = b = c = 2.830 Å (Figure S3), and α = β = γ = 90°, which are in good agreement with the previous results [19,20,21,43]. The bulk VC and VN show a B1 or NaCl-type structure, and in the structure, the coordination number is 6 and the space group is Fm-3 m. The calculated VC lattice parameters are a = b = c = 4.182 Å, and α = β = γ = 90°. The VN lattice parameters are a = b = c = 4.128 Å, and α = β = γ = 90° (Figure S3). Both are consistent with the experimental results [28,29,30,44] as shown in Table 1.
The interface investigated in this work is the experimentally observed K–S orientation relation formed between α-Fe (101) and VC ( 1 1 ¯ 1 ¯ )/VN ( 1 1 ¯ 1 ¯ ) crystals. We expose these surfaces by making sections. In order to better match them according to the K–S orientation relationship, we cut them into parallelograms, and the calculated values of the lattice parameters are shown in Table S1. When VC and VN form a common lattice interface with ferrite, a Bain strain [62,63] similar to the martensitic transformation occurs. Accordingly, we established four α-Fe/VM interfacial structural models with the VC/VN top-corner atoms and the body center atoms as the bond bridges, respectively, whose front and top views are shown in Figure 1.
The relative difference between the lattice parameters of the two phases at the interface, the degree of mismatch, is calculated as follows:
δ = b a a × 100 %
When the mismatch degree of the two interfacial structures is less than 5%, the elastic energy caused by a coherent interface is not very large and the coherence is considered to be possible. When the mismatch degree exceeds 25%, the lattice mismatch strain is too high and the interface can be regarded as non-coherent. The semi-coherent interface is an interface structure between the fully coherent and non-coherent interfaces. On the semi-coherent interface, most of the atoms still maintain a certain matching relationship, but there are some dislocations to accommodate the difference in lattice constants. Based on the above, the mismatch degree of the α-Fe/VC interface in the K–S orientation is 23.68%, that of the α-Fe/VN interface is 22.48%, and the mismatch degree of both interfaces is in the range of 5%~25%, so both interfaces are semi-coherent.
Since the vacuum thickness, lattice parameter, and relative position between the precipitated phase and the substrate may affect the stability of the interfacial structure to different degrees, single-variable tests of the energy were performed sequentially for the four interfacial structures with different vacuum thicknesses, lattice parameters, and relative positions (Figures S4 and S5). The optimal vacuum thickness of α-Fe/VC–C, α-Fe/VC–V, α-Fe/VN–N, and α-Fe/VN–V interfaces are 1.0, 2.0, 1.8, and 2.0 Å, and the optimal lattice parameters are 5.4, 5.3, 5.3, and 5.2 Å, respectively. The optimal relative position of the α-Fe/VC–C and α-Fe/VN–V interfaces is the original position. However, the VC block of the α-Fe/VC–V interface needs to be offset by 15% in the u-direction and 35% in the v-direction relative to α-Fe, and the VN block of the α-Fe/VN–N interface needs to be offset by 35% in the u-direction and 15% in the v-direction relative to α-Fe.
In addition to the above perfect interface, we also investigated the effect of a single vacancy on the interfaces. Considering the best trapping position of hydrogen in each perfect interface configuration, only Fe, C, N, and V vacancies within the two closest atomic layers located near the interface plane were explored here. To check the stability of vacancies more clearly, according to Equation (3), setting the chemical potential of C/N/V to E C / N / V b u l k , only the maximum formation energies of C, N, and V vacancies are plotted in Figure 2. Non-equivalent sites in the same atomic layer are also considered here to obtain the formation energy of the most stable vacancy. As shown in Figure 2, the formation energy of C vacancies near the interface between α-Fe and VC is significantly lower than that of V and Fe vacancies. Furthermore, the formation energy of C vacancies in the first layer is lower than that in the second layer. The lower the formation energy, the easier the vacancy is to form. The vacancy in the α-Fe/VN interface configuration also shows a similar pattern. The N vacancies in the first layer of the interface are the easiest to form, followed by the N vacancies in the sublayer. However, compared with the α-Fe/VC interface configuration, the formation energy of N vacancies is still much larger than that of C vacancies. The presence of vacancies also leads to a redistribution of electron positions. According to the charge density difference of different interfaces (Figures S6 and S7), the absence of Fe and V atoms leads to more electrons at the vacancy positions, whereas the absence of C and N atoms drives the local electrons to flock to the neighboring Fe or V atoms.

3.2. Stability of Different Structures

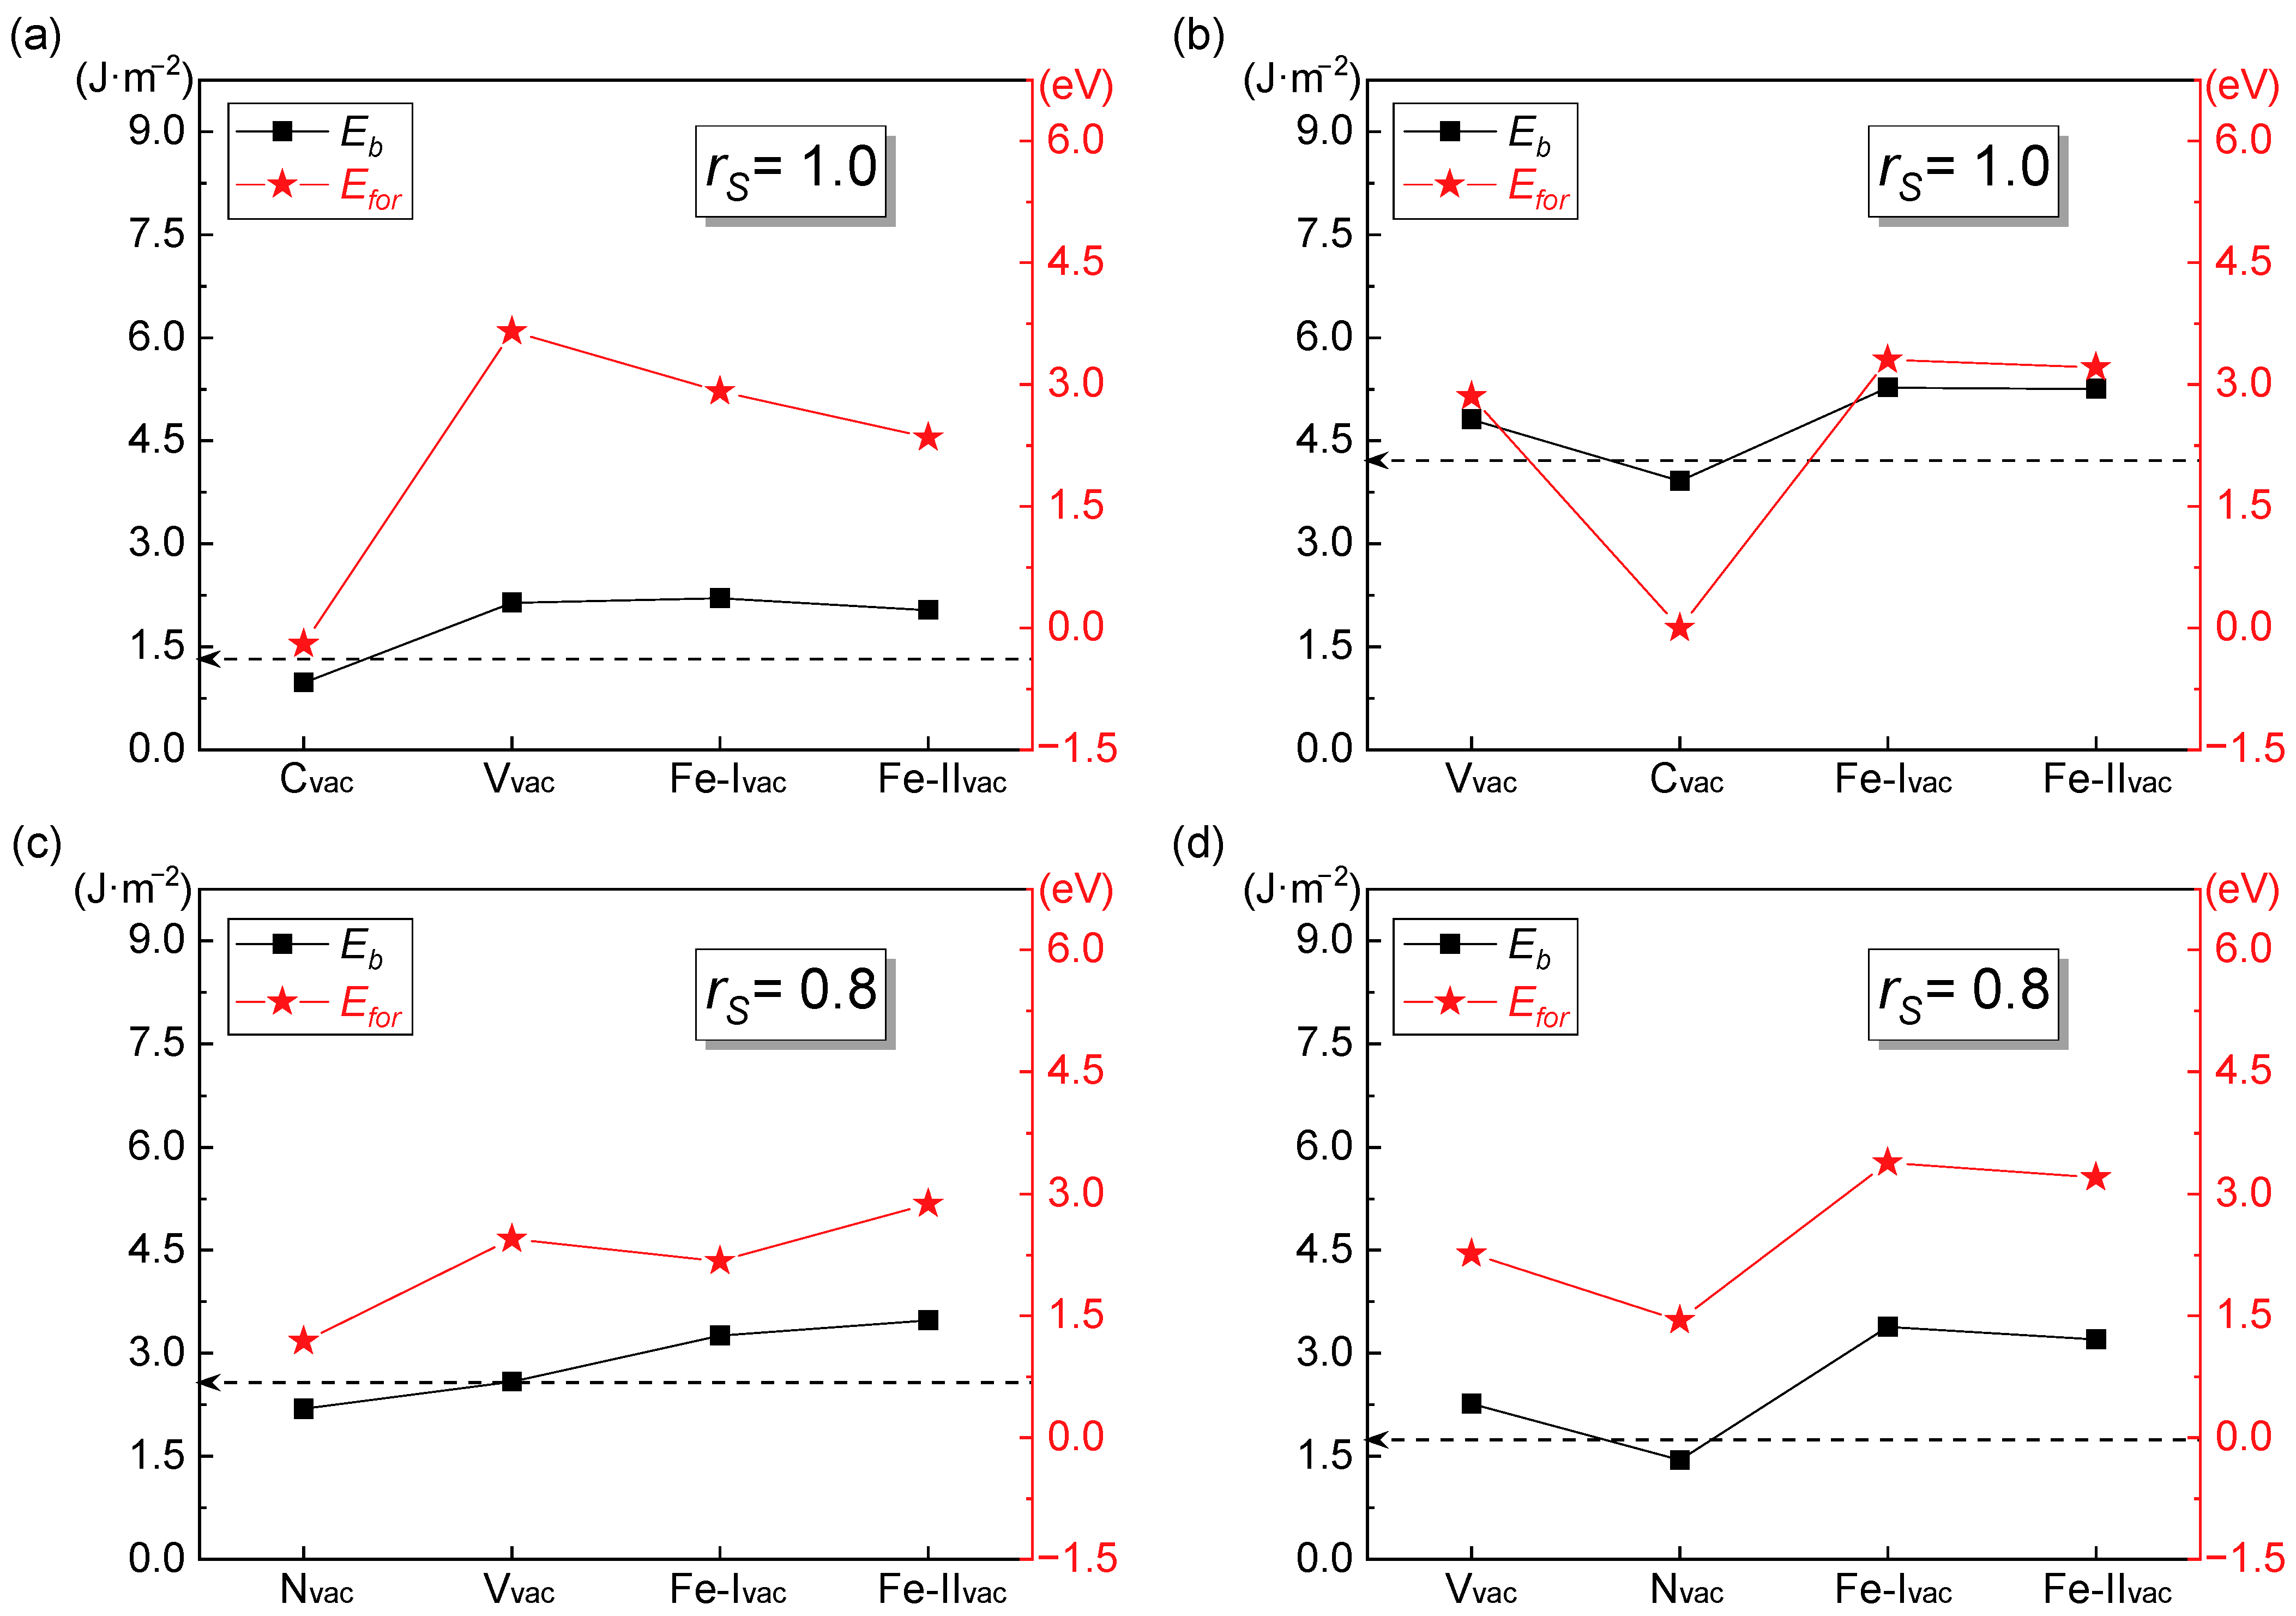
3.2.1. Formation Enthalpy

Formation enthalpy, which is used to estimate the stability of V–M binary compounds, is the energy difference between the total energy of the bulk VM and the sum of the total energies of its constituent elements and is calculated by Equation (2).
As shown in Table 2, the calculated values of VC and VN formation enthalpies in this work are −0.477 eV/atom and −1.210 eV/atom, respectively, which are in agreement with other experimental and theoretical values available in the literature [31,32,33,43,58]. The negative formation enthalpy values suggest that the compounds are thermodynamically stable.

3.2.2. Interfacial Binding Energy

The interfacial binding energy reflects the energy absorbed or released during the formation of the interface. The lower the interfacial binding energy, the smaller the energy released upon interface formation, and the more stable the resultant interface.
The interfacial binding energies of the α-Fe/VC–C, α-Fe/VC–V, α-Fe/VN–N, and α-Fe/VN–V interfaces are determined using Equation (1). Upon reviewing Table 3, it is evident that the binding energy of the α-Fe/VC–C interface, with the body-centered atom C serving as the bonding bridge, is considerably lower than that of the other three interface configurations. The interfacial binding energy is related to the type and length of the bonds between the atoms at the interface. Overall, the shorter the bond length, the smaller the interfacial binding energy and the more stable the interface is when comparing bonds of the same type (Fe–V bonds in α-Fe/VC–V and α-Fe/VN–V) or similar types (Fe–C bonds in α-Fe/VC–C and Fe–N bonds in α-Fe/VN–N). Therefore, the α-Fe/VC–C and α-Fe/VN–V interfaces have better interfacial binding performance, and the α-Fe/VC–V interface and α-Fe/VN–N interface are metastable.
In general, when there are vacancies within the interface, the interface will be less stable. To further explore the effect of vacancy on the stability of each interface, we calculated the interfacial binding energy of each interface with different vacancies (Figure 3). Then, we calculated the correlation coefficient between Eb and Efor using Equation (4). The results show that the two are positively correlated: the harder it is to form vacancies, the more likely they are to lead to unstable interfaces. Compared to the perfect interface, the presence of Fe vacancies makes the interface more unstable. The opposite is true for C/N/V vacancies, whose presence reduces the interfacial energy. This may be related to the fact that the presence of C/N/V vacancies allows the bottom Fe atoms to be embedded into the nanoprecipitated phase.

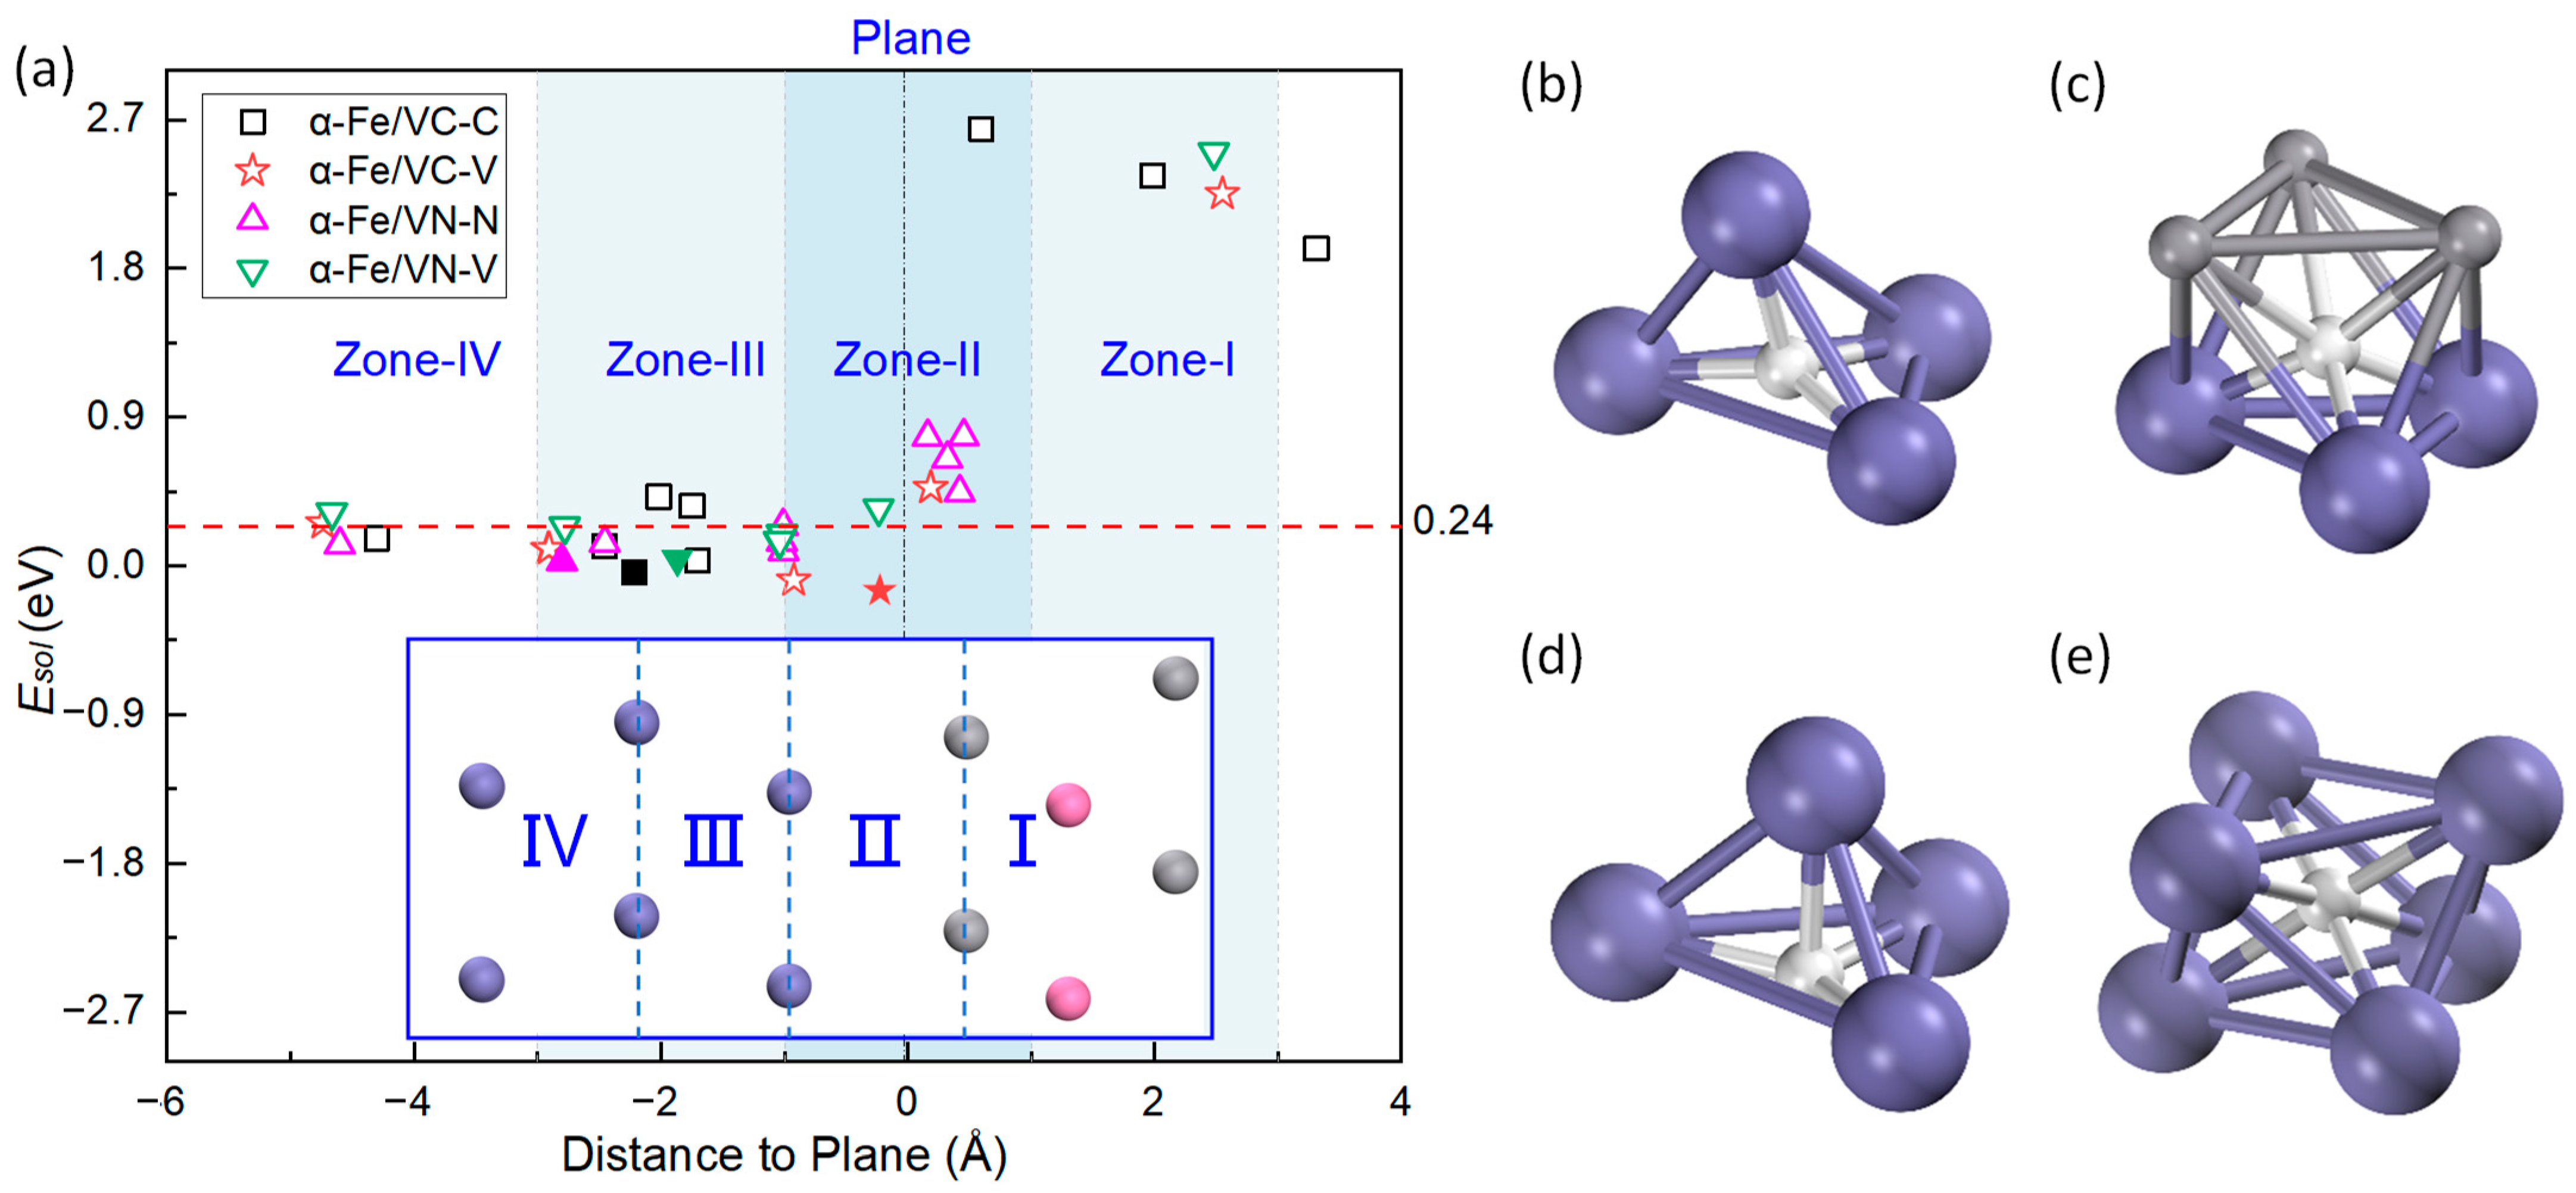
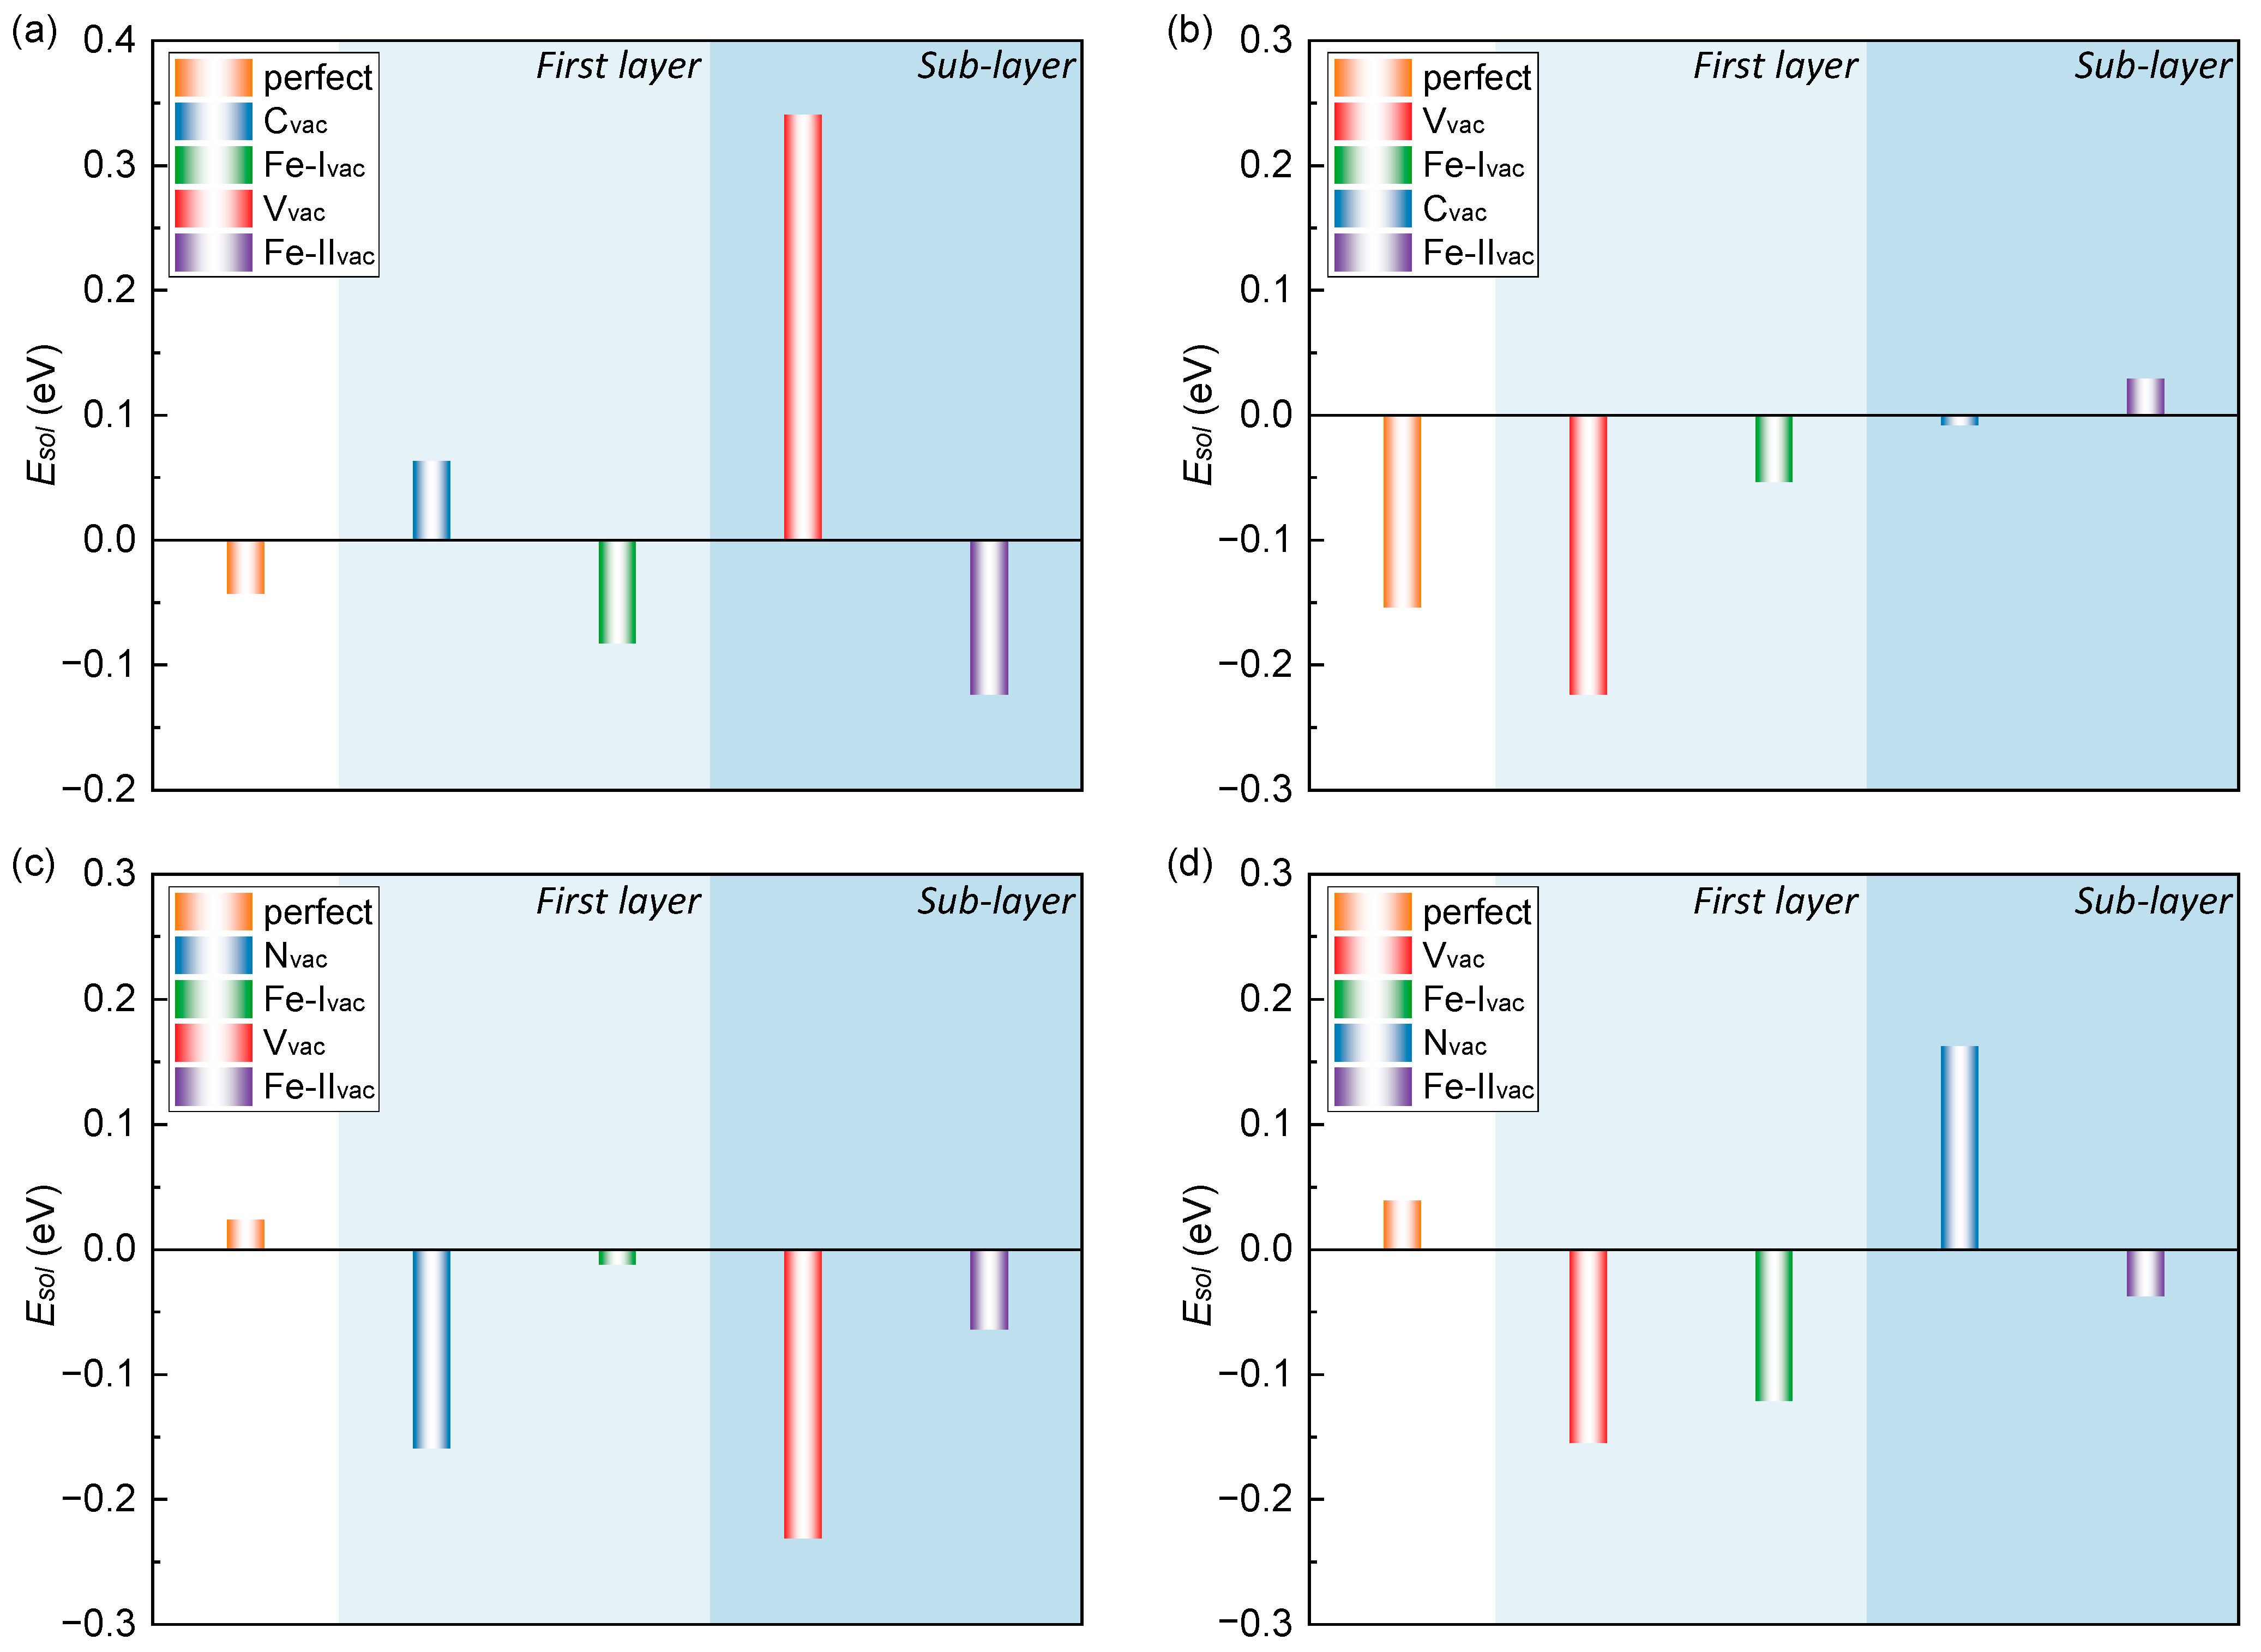
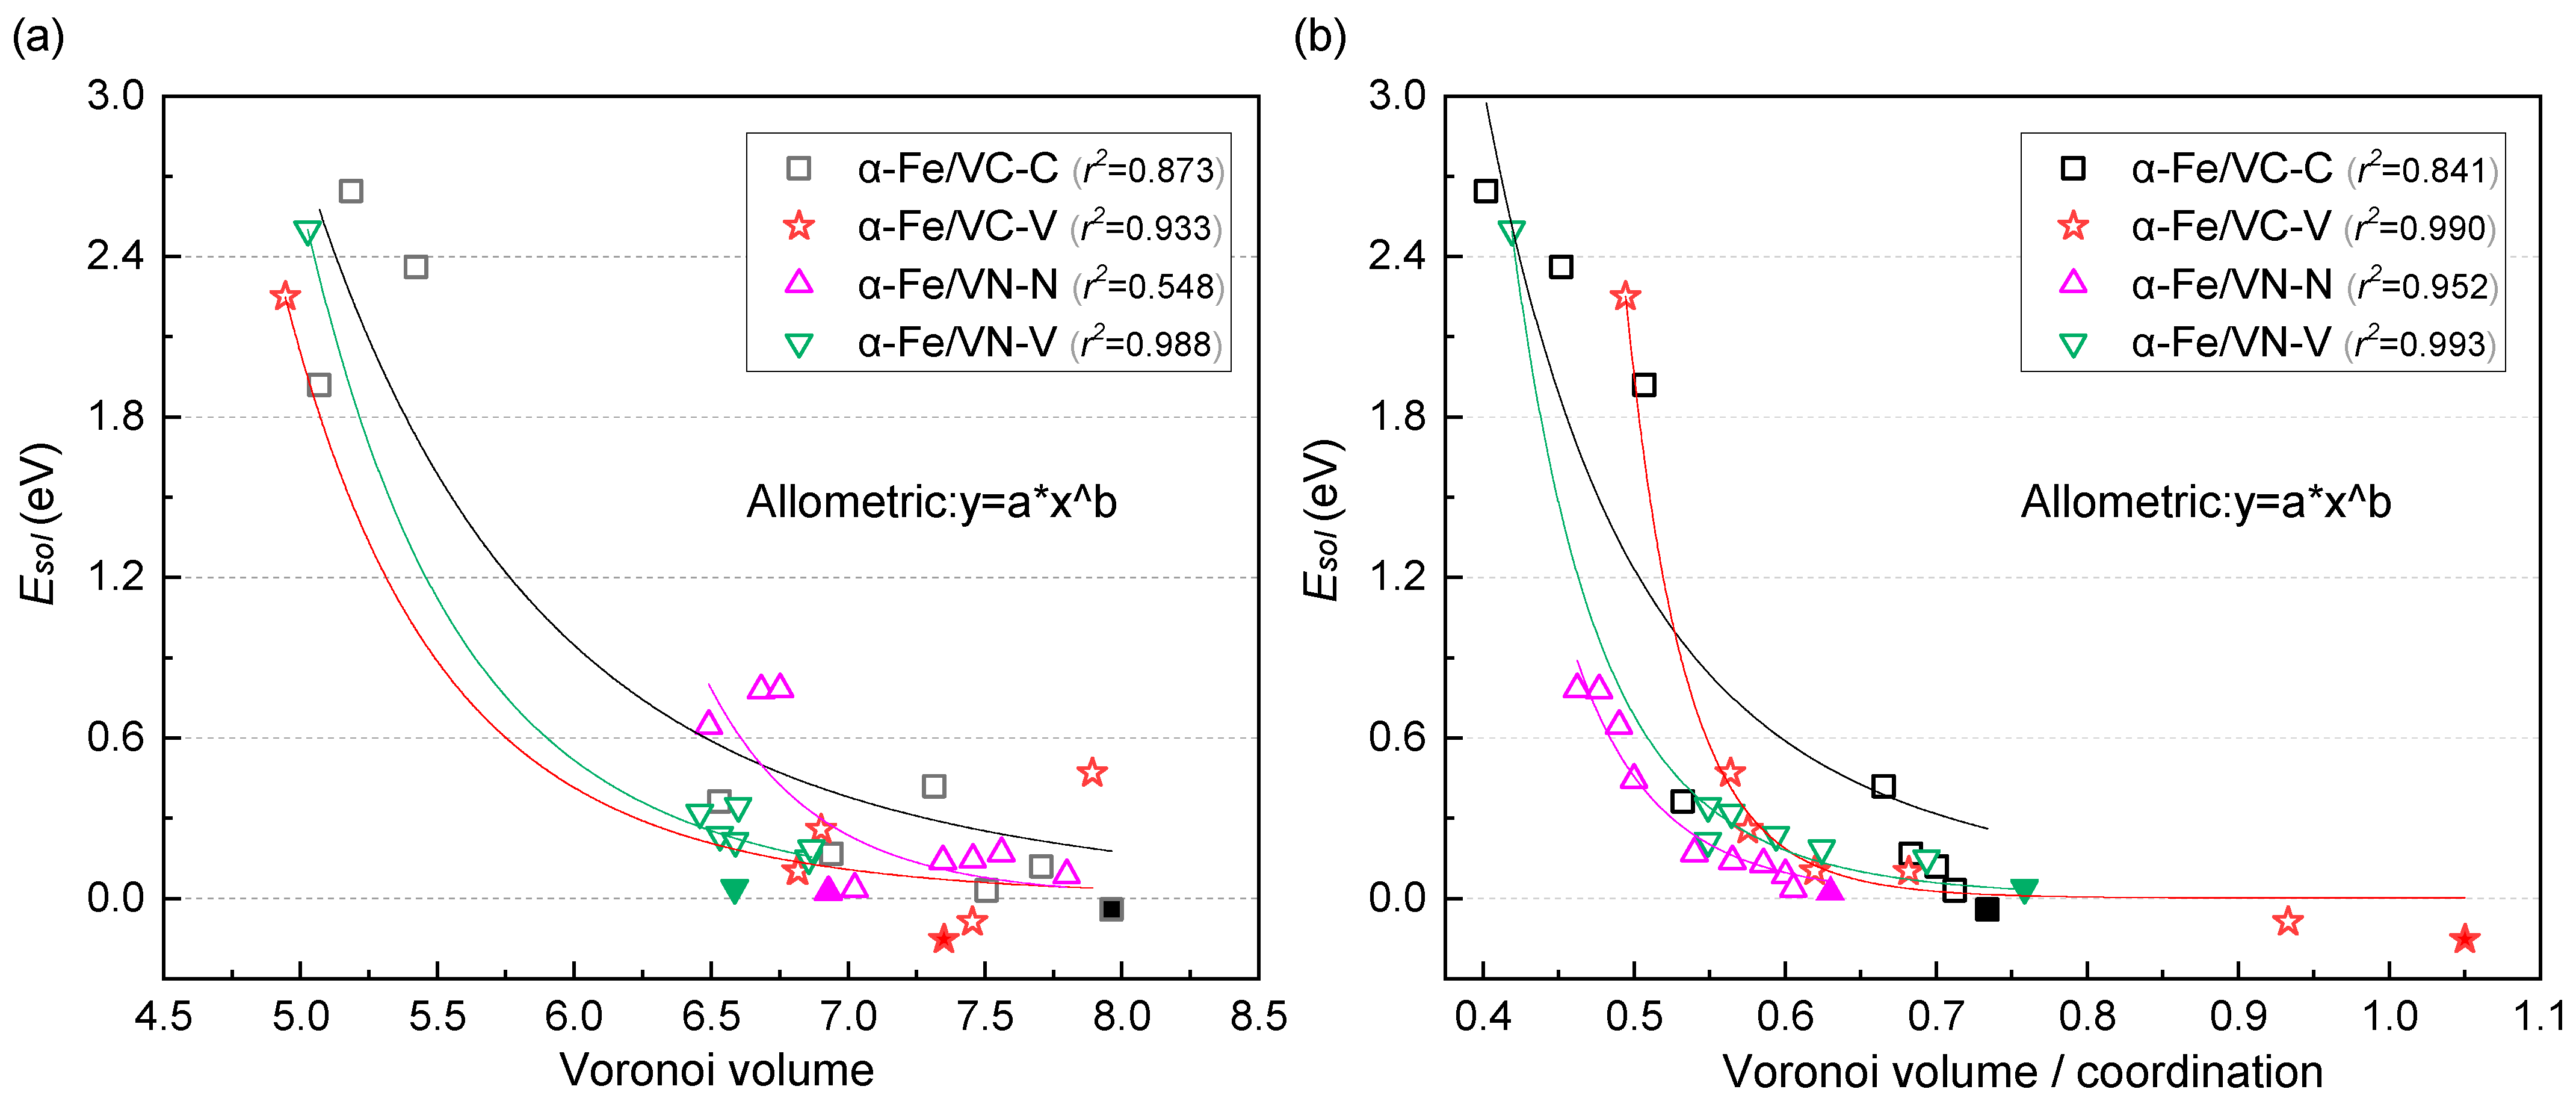
3.3. H Interaction with the Interface Solubility

To investigate the solubility of H in the bulk phase, we calculated the solution energy of H in the tetrahedral interstitial site (TIS) and octahedral interstitial site (OIS) in the α-Fe supercell containing 16 atoms and two different TISs in the VC and VN cells according to Equation (2). An OIS is an octahedron consisting of six metal atoms in the crystal structure, with the interstitial atom located at the center of the octahedron. A TIS is a tetrahedron in a crystal structure consisting of one top-corner atom of a cell and three adjacent face-centered atoms, with the interstitial atom located at the center of the tetrahedron.
According to Figure S8, H has the lowest solution energy of 0.24 eV at the TISs in α-Fe, proving that the tetrahedron is the preferred location for hydrogen adsorption. This result agrees with previous calculations [36,59,60,64,65]. Among α-Fe, VC, and VN bulk phases, H prefers to dissolve in α-Fe.
To explore the range of trapping of individual H atoms in the interface, we considered various possible gap sites along the direction perpendicular to the interface, particularly the near-interface end of the α-Fe. Figure 4a shows the solution energies of a single hydrogen atom at different locations in the four interfaces, where we set the center of the Fe–V/C/N bond at the interface to the center of the interface. According to the distance between the captured hydrogen and the interface center, the interface model can be classified into Zone I (interface-like VM zone), Zone II (interface zone), Zone III (interface-like Fe zone), and ZonE IV (bulk-like Fe zone) in the vertical direction from the plane. The solution energy of H at different positions was compared with that of H at TISs in bulk α-Fe to determine where H preferred to be captured. The calculated data show that single hydrogen atoms are more easily trapped in Zone II and Zone III. The best hydrogen trapping sites for both the α-Fe/VC–C interface and the α-Fe/VN–N interface are in the TISs between the Fe atoms of the first and second layers (Figure 4b,d), with their being −0.041 eV and 0.024 eV, respectively. The best hydrogen trapping sites for the α-Fe/VC–V interface are in the OISs between the interfaces (Figure 4c), with a solution energy of −0.154 eV. The best hydrogen trapping sites for the α-Fe/VN–V interface are in the OISs between the Fe atoms of the first and the second layers (Figure 4e), with a solution energy of 0.039 eV. Compared with the Fe/VC interfaces under the B–N orientation relationship ( E S o l T I S s : 0.067 eV; E S o l O I S s : 0.097 eV) [43] and the Fe/VN interfaces under the B–N orientation relationship ( E S o l T I S s : 0.050 eV; E S o l O I S s : 0.270 eV) [36], they exhibit better hydrogen trapping ability. In summary, the semi-coherent interface structures formed by α-Fe and VC/N have a relatively strong hydrogen trapping effect, especially the α-Fe/VC–V interface, whose hydrogen trapping effect is much better than the other three.
We similarly investigated the effect of different vacancies on the capture of hydrogen and calculated the solution energy of a single H atom at different vacancies, and the results are shown in Figure 5. Compared with the solubility of hydrogen in the perfect states of different structures, most of the vacancies show better hydrogen capture ability, and the specific situation is as follows.
In VC precipitates, when the interface is composed of C and Fe atoms, the C vacancy and V vacancy in the precipitate does not significantly enhance the hydrogen capture effect. Instead, the Fe vacancies in the matrix greatly improve the hydrogen capture ability at the interface ( E S o l F e 1 s t : −0.083 eV; E S o l F e 2 e d : −0.124 eV). When the interface is composed of V and Fe atoms, the V vacancy on the first layer exhibits a superior ability to capture hydrogen ( E S o l V 1 s t : −0.224 eV). Compared with the findings in previous literature on the B–N orientation [36], in this study, we found that the hydrogen trapping ability of the C vacancy in the precipitated phase shows a relatively weakened trend, while the hydrogen trapping ability of the V vacancy has significantly increased. It is worth noting that we have also delved into the hydrogen trapping efficiency of Fe vacancies near the surface. This area has been rarely explored in previous research, and our work has just filled this crucial gap, providing a new perspective and data support for this research direction, as well as helping to comprehensively understand the hydrogen trapping characteristics of related materials.
In VN precipitates, when the interface is composed of N and Fe atoms, the N vacancy (first layer) and V vacancy (sub-layer) have a stronger hydrogen trapping ability than Fe vacancies ( E S o l N 1 s t : −0.159 eV; E S o l V 2 e d : −0.231 eV). When the interface is composed of V and Fe atoms, the V vacancy still exhibits excellent hydrogen trapping capabilities ( E S o l V 1 s t : −0.154 eV). However, unlike the former case, the position of the vacancy is now in the first layer. Overall, in the Fe/VN interface system, whether the V vacancies are in the first layer or the sub-layer, they play a crucial role in the process of hydrogen atom capture. Notably, compared with N vacancies, V vacancies exhibit more outstanding hydrogen trapping efficiency. This unique phenomenon has never been found in previous studies on B–N-oriented interfaces.

4. Discussion

4.1. Influence of Vacancy on Interfacial Stability

Based on the findings, we conclude that the ease of vacancy formation near the interface is strongly correlated with interface stability. A higher degree in the ease of vacancy formation leads to a greater energy release during interface formation, resulting in a less stable interface. By further investigating the reasons behind the ease of vacancy formation, we could identify the key factors influencing interface instability. By analyzing the local density of states (LDOS) of different atoms (Figure 6), we find that the higher formation energy of the V vacancy stems from the d-orbital hybridization of V and neighboring Fe atoms (3d orbitals of V and Fe), indicating that V atoms had stronger interactions with Fe atoms than C/N atoms.
For the α-Fe matrix within the configuration, in accordance with the d-band center theory [66], the distinct vacancy formation energies of the first layer and sub-layer Fe atoms are predominantly associated with the value of the d-band center (see Table S2). Specifically, a larger value of the d-band center corresponded to stronger atomic adsorption, thereby rendering vacancy formation more difficult.

4.2. Segregation of H in the Interface

In the past, most research efforts were predominantly concentrated on exploring the relationship between atomic volume and hydrogen solution energy. Zhang et al. [61] found that the H atom is found to prefer adsorbing the positions with larger Voronoi volume. However, when we conducted research using the same method, we found that the size of the Voronoi volume does not directly affect the change in H solution energy (as shown in Figure 7a). Zhang et al. [39] reached a similar conclusion after their research: there is no perfect correlation found between the change in binding energy and polyhedron/Voronoi volume, and the Bader volume of hydrogen is a general descriptor.
To deepen the understanding of the principle of hydrogen trapping by interfacial structure, we take into account the combined influence of the Voronoi volume and the coordination number and have explored the relationship between the ratio of the Voronoi volume to the coordination number and the H solution energy in each configuration (Figure 7b). The further to the right the value on the horizontal axis, the larger the ratio of the Voronoi volume to the coordination number. This means that the Voronoi volume is larger and the number of coordinating atoms is smaller. Here, we used the allometric function to perform a rapid curve-fitting on the obtained data. The results show that the value of this method is closer to 1 compared to the fitting result in Figure 7a, indicating a better fitting effect and a closer match to the decreasing trend.
Therefore, when the Voronoi volume of H is larger and its coordination number is smaller, the lower its solution energy is, and the more favorable it is for hydrogen capture. In the same configuration, the smaller the coordination number of the H atom, the smaller the number of atoms in its nearest-neighbor region, and the weaker the interaction. This could be explained by the smaller interatomic repulsion, which makes it easier for the hydrogen to be adsorbed [67]. Through this method, we can observe the trend of the solution energy at different positions changing with the ratio of Voronoi volume to coordination within the same structural framework.

5. Conclusions

In this work, computational analysis of the solution energies for hydrogen dissolved within the K–S-oriented interfacial configuration indicates that, compared with the B–N-oriented interfaces in previous literature, both the interface region and the interface-adjacent zone of the α-Fe matrix under this orientation possess better hydrogen trapping ability. Moreover, the α-Fe/VC interface exhibits a stronger hydrogen trapping capacity than the α-Fe/VN interface, which correlates with the Voronoi volume and coordination of H atoms. The larger the Voronoi volume with a smaller coordination number, the more favorable it is for hydrogen trapping.
The presence of vacancies improves the hydrogen trapping capacity of the interface. Through meticulous calculations of the hydrogen solution energy, it is unequivocally demonstrated that the vacancies possess an exceptionally excellent hydrogen trapping effect, although their effect on improving the hydrogen trapping ability is slightly weaker than that of C vacancies in the B–N-oriented interfaces in previous literature. These vacancies specifically comprise the Fe vacancies within the α-Fe/VC–C configuration, the V vacancies in the α-Fe/VC–V configuration, the V vacancies and N vacancies in the α-Fe/VN–N configuration, along with the V vacancies and Fe vacancies (in the first layer) in the α-Fe/VN–V configuration. Especially, the hydrogen trapping performance of V vacancies in some individual interfacial structures is better than that of non-metal vacancies such as C/N vacancies, which is a new exploration of the hydrogen trapping properties of metal vacancies. This serves as a supplement to the experimental conclusion that C vacancies are predominantly responsible for the formation of deeper hydrogen traps and it offers reliable inferences about the origin of hydrogen traps in the K–S interface during experiments.

Supplementary Materials

The following supporting information can be downloaded at https://www.mdpi.com/article/10.3390/coatings15040466/s1: Figure S1: The energy of (a) α-Fe, (b) VC, and (c) VN that vary with the K-points setting; Figure S2: The energy of (a) α-Fe, (b) VC, and (c) VN that vary with the cut-off energy setting; Figure S3: Variation of (a) α-Fe, (b) VC, and (c) VN single-cell lattice parameters with K-points change; Figure S4: (a,b) Trends of energy variation at the α-Fe/VC–C, α-Fe/VC–V, α-Fe/VN–N, and α-Fe/VN–V interfaces with vacuum thickness; (c,d) Trends of energy variation at the α-Fe/VC–C, α-Fe/VC–V, α-Fe/VN–N, and α-Fe/VN–V interfaces lattice parameters; Figure S5: The optimum relative position between the precipitated phase and the matrix at the (a) α-Fe/VC–V, (b) α-Fe/VC–V, (c) α-Fe/VN–V, and (d) α-Fe/VN–N interfaces; Figure S6: The charge density difference of different vacancies in the (a) α-Fe/VC–C, (b) α-Fe/VC–V, (c) α-Fe/VN–N, and (d) α-Fe/VN–V interfaces. In the electron density difference map, blue indicates electron loss and red indicates electron enrichment. The white color represents regions with very small changes in electron density; Figure S7: The electron localization function of the (a) α-Fe/VC–C, (b) α-Fe/VC–V, (c) α-Fe/VN–N, and (d) α-Fe/VN–V interfaces; Figure S8: The geometric structure of a single hydrogen atom adsorbed in (a) bulk α-Fe, bulk VN, and bulk VC. (d) shows the adsorption energy of hydrogen atoms at different position; Table S1: Calculated values of the lattice parameters for VC ( 1 1 ¯ 1 ¯ ), VN ( 1 1 ¯ 1 ¯ ), and α-Fe (101); Table S2: Values of d-band centers of Fe atoms in the first and second layers.

Author Contributions

Conceptualization, S.Y. and Y.Z.; methodology, S.Y.; software, Z.C.; validation, S.Y., Y.Z. and C.W.; formal analysis, S.Y.; investigation, S.Y.; resources, J.H.; data curation, R.L.; writing—original draft preparation, S.Y.; writing—review and editing, S.Y.; visualization, R.L.; supervision, Z.C.; project administration, J.H.; funding acquisition, J.H. All authors have read and agreed to the published version of the manuscript.

Funding

This research was funded by the Science Program of Shaanxi Province, China (grant number: no. 2024JC-JCQN-19), the Basic Research and Strategic Reserve Technology Research Fund Project of CNPC (grant number: no. 2023DQ03-04), and the China Postdoctoral Science Foundation (grant number: no. 2024M752618). The APC was funded by Youth Innovation Team Research Project of Shaanxi Provincial Education Department (grant number: no. 23JP170).

Informed Consent Statement

Not applicable.

Data Availability Statement

The original contributions presented in this study are included in this article.

Conflicts of Interest

The authors declare that they have no known competing financial interests or personal relationships that could have appeared to influence the work reported in this paper.

Abbreviations

The following abbreviations are used in this manuscript:
K-SKurdjumov–Sachs
B-NBaker–Nutting
APTatom probe tomography
DFTdensity functional theory
GGAgeneralized gradient approximation
BCCbody-centered cubic
TIStetrahedral interstitial site
OISoctahedral interstitial site
LDOSlocal density of states
PDOSprojected density of states

References

  1. Bosque, A.; Fernández-Arias, P.; Vergara, D. Advancements in Hydrogen Storage Vessels: A Bibliometric Analysis. Sci 2025, 7, 21. [Google Scholar] [CrossRef]
  2. Shin, D.H.; Kim, S.J. Effect of hydrogen embrittlement on mechanical characteristics of DLC-coating for hydrogen valves of FCEVs. npj Mater. Degrad. 2024, 8, 47. [Google Scholar] [CrossRef]
  3. Sun, B.; Zhao, H.; Dong, X.; Teng, C.; Zhang, A.; Kong, S.; Zhou, J.; Zhang, X.; Tu, S. Current challenges in the utilization of hydrogen energy-a focused review on the issue of hydrogen-induced damage and embrittlement. Adv. Appl. Energy 2024, 14, 100168. [Google Scholar] [CrossRef]
  4. Meda, U.S.; Bhat, N.; Pandey, A.; Subramanya, K.N.; Raj, M.L.A. Challenges associated with hydrogen storage systems due to the hydrogen embrittlement of high strength steels. Int. J. Hydrogen Energy 2023, 48, 17894–17913. [Google Scholar] [CrossRef]
  5. Yu, H.; Díaz, A.; Lu, X.; Sun, B.; Ding, Y.; Koyama, M.; He, J.; Zhou, X.; Oudriss, A.; Feaugas, X.; et al. Hydrogen embrittlement as a conspicuous material challenge—Comprehensive review and future directions. Chem. Rev. 2024, 124, 6271–6392. [Google Scholar] [CrossRef]
  6. Meng, B.; Gu, C.; Zhang, L.; Zhou, C.; Li, X.; Zhao, Y.; Zheng, J.; Chen, X.; Han, Y. Hydrogen effects on X80 pipeline steel in high-pressure natural gas/hydrogen mixtures. Int. J. Hydrogen Energy 2017, 42, 7404–7412. [Google Scholar] [CrossRef]
  7. Dwivedi, S.K.; Vishwakarma, M. Hydrogen embrittlement in different materials: A review. Int. J. Hydrogen Energy 2018, 43, 21603–21616. [Google Scholar] [CrossRef]
  8. Giannini, L.; Razavi, N.; Alvaro, A.; Paltrinieri, N. Embrittlement, degradation, and loss prevention of hydrogen pipelines. MRS Bull. 2024, 49, 464–477. [Google Scholar] [CrossRef]
  9. Ilyushechkin, A.; Schoeman, L.; Carter, L.; Hla, S.S. Material challenges and hydrogen embrittlement assessment for hydrogen utilisation in industrial scale. Hydrogen 2023, 4, 599–619. [Google Scholar] [CrossRef]
  10. Sezgin, J.G.; Bosch, C.; Montouchet, A.; Perrin, G.; Wolski, K. Modelling of hydrogen induced pressurization of internal cavities. Int. J. Hydrogen Energy 2017, 42, 15403–15414. [Google Scholar] [CrossRef]
  11. Xie, D.; Li, S.; Li, M.; Wang, Z.; Gumbsch, P.; Sun, J.; Ma, E.; Li, J.; Shan, Z. Hydrogenated vacancies lock dislocations in aluminium. Nat. Commun. 2016, 7, 13341. [Google Scholar] [CrossRef] [PubMed]
  12. Song, J.; Curtin, W.A. Atomic mechanism and prediction of hydrogen embrittlement in iron. Nat. Mater. 2013, 12, 145–151. [Google Scholar] [CrossRef] [PubMed]
  13. Troiano, A.R. The role of hydrogen and other interstitials in the mechanical behavior of metals. Metallogr. Microstruct. Anal. 2016, 5, 557–569. [Google Scholar] [CrossRef]
  14. Li, X.; Ma, X.; Zhang, J.; Akiyama, E.; Wang, Y.; Song, X. Review of hydrogen embrittlement in metals: Hydrogen diffusion, hydrogen characterization, hydrogen embrittlement mechanism and prevention. Acta Metall. Sin. (Engl. Lett.) 2020, 33, 759–773. [Google Scholar] [CrossRef]
  15. Wang, S.; Martin, M.L.; Sofronis, P.; Ohnuki, S.; Hashimoto, N.; Robertson, I.M. Hydrogen-induced intergranular failure of iron. Acta Mater. 2014, 69, 275–282. [Google Scholar] [CrossRef]
  16. Martin, M.L.; Fenske, J.A.; Liu, G.S.; Sofronis, P.; Robertson, I.M. On the formation and Nature of quasi-cleavage fracture surfaces in hydrogen embrittled steels. Acta Mater. 2011, 59, 1601–1606. [Google Scholar] [CrossRef]
  17. Djukic, M.B.; Bakic, G.M.; Zeravcic, V.S.; Sedmak, A.; Rajicic, B. The synergistic action and interplay of hydrogen embrittlement mechanisms in steels and iron: Localized plasticity and decohesion. Eng. Fract. Mech. 2019, 216, 106528. [Google Scholar] [CrossRef]
  18. Oriani, R.A. The diffusion and trapping of hydrogen in steel. Acta Metall. 1970, 18, 147. [Google Scholar] [CrossRef]
  19. Counts, W.A.; Wolverton, C.; Gibala, R. First-principles energetics of hydrogen traps in α-Fe: Point defects. Acta Mater. 2010, 58, 4730–4741. [Google Scholar] [CrossRef]
  20. Haas, P.; Tran, F.; Blaha, P. Calculation of the lattice constant of solids with semilocal functionals. Phys. Rev. B Condens. Matter Mater. Phys. 2009, 79, 085104. [Google Scholar] [CrossRef]
  21. Davey, W.P. Precision measurements of the lattice constants of twelve common metals. Phys. Rev. 1925, 25, 753. [Google Scholar] [CrossRef]
  22. Li, M.; Zhang, H.; Henein, H.; Liu, J. Hydrogen traping in precipitates of high-strength steel: Insights into various coherent and stress conditions. Int. J. Hydrogen Energy 2024, 92, 1356–1365. [Google Scholar] [CrossRef]
  23. Wang, H.; Ren, H.; Han, L.; Jin, Z.; Sun, H. Microstructure and texture comparison of an acicular ferrite pipeline steel with different hot rolling process. Adv. Mat. Res. 2012, 399, 264–267. [Google Scholar] [CrossRef]
  24. Wei, F.G.; Hara, T.; Tsuzaki, K. Nano-Preciptates Design with Hydrogen Trapping Character in High Strength Steel. In Advanced Steels; Springer: Berlin/Heidelberg, Germany, 2011; pp. 87–92. [Google Scholar] [CrossRef]
  25. Kirchheim, R. Changing the interfacial composition of carbide precipitates in metals and its effect on hydrogen trapping. Scr. Mater. 2019, 160, 62–65. [Google Scholar] [CrossRef]
  26. Wei, F.G.; Tsuzaki, K. Quantitative analysis on hydrogen trapping of TiC particles in steel. Metall. Mater. Trans. A 2006, 37, 331–353. [Google Scholar] [CrossRef]
  27. Li, X.; Zhang, J.; Cui, Y.; Djukic, M.B.; Feng, H.; Wang, Y. Review of the hydrogen embrittlement and interactions between hydrogen and microstructural interfaces in metallic alloys: Grain boundary, twin boundary, and nano-precipitate. Int. J. Hydrogen Energy 2024, 72, 74–109. [Google Scholar] [CrossRef]
  28. Vojvodic, A.; Ruberto, C. Trends in bulk electron-structural features of rocksalt early transition-metal carbides. J. Phys. Condens. Matter Inst. Phys. J. 2010, 22, 375501. [Google Scholar] [CrossRef]
  29. Nakamura, K.; Yashima, M. Crystal structure of NaCl-type transition metal monocarbides MC (M = V, Ti, Nb, Ta, Hf, Zr), a neutron powder diffraction study. Mater. Sci. Eng. B 2008, 148, 69–72. [Google Scholar] [CrossRef]
  30. Zhukov, V.; Gubanov, V. The study of the energy band structures of TiC, VC, Ti4C3 and V4C3 by the LMTO-ASA method. J. Phys. Chem. Solids 1987, 48, 187–195. [Google Scholar] [CrossRef]
  31. Wang, B.; Liu, Y.; Ye, J. Mechanical properties and electronic structures of VC, V4C3 and V8C7 from first principles. Phys. Scr. 2013, 88, 015301. [Google Scholar] [CrossRef]
  32. Ravi, C. First-principles study of ground-state properties and phase stability of vanadium nitrides. Calphad 2009, 33, 469–477. [Google Scholar] [CrossRef]
  33. Carlson, O.N.; Smith, J.F.; Nafziger, R.H. The vanadium-nitrogen system: A review. Metall. Mater. Trans. A 1986, 17, 1647–1656. [Google Scholar] [CrossRef]
  34. Lee, J.; Lee, T.; Kwon, Y.J.; Mun, D.J.; Yoo, J.Y.; Lee, C.S. Effects of vanadium carbides on hydrogen embrittlement of tempered martensitic steel. Met. Mater. Int. 2016, 22, 364–372. [Google Scholar] [CrossRef]
  35. Takahashi, J.; Kawakami, K.; Tarui, T. Direct observation of hydrogen-trapping sites in vanadium carbide precipitation steel by atom probe tomography. Scr. Mater. 2012, 67, 213–216. [Google Scholar] [CrossRef]
  36. Ma, Y.; Shi, Y.; Wang, H.; Mi, Z.; Liu, Z.; Gao, L.; Yan, Y.; Su, Y.; Qiao, L. A first-principles study on the hydrogen trap characteristics of coherent nano-precipitates in α-Fe. Int. J. Hydrogen Energy 2020, 45, 27941–27949. [Google Scholar] [CrossRef]
  37. Sagar, S.; Sluiter, M.H.F.; Dey, P. First-Principles study of hydrogen-Carbide interaction in bcc Fe. Int. J. Hydrogen Energy 2024, 50, 211–223. [Google Scholar] [CrossRef]
  38. Hammer, P.; Romaner, L.; Razumovskiy, V.I. Hydrogen trapping in mixed carbonitrides. Acta Mater. 2024, 268, 119754. [Google Scholar] [CrossRef]
  39. Zhang, B.; Su, J.; Wang, M.; Liu, Z.; Yang, Z.; Militzer, M.; Chen, H. Atomistic insight into hydrogen trapping at MC/BCC-Fe phase boundaries: The role of local atomic environment. Acta Mater. 2021, 208, 116744. [Google Scholar] [CrossRef]
  40. Baker, T.N. Titanium microalloyed steels. Ironmak. Steelmak. 2019, 46, 1–55. [Google Scholar] [CrossRef]
  41. Chen, J.; Lü, M.; Tang, S.; Liu, Z.; Wang, G. Microstructure, mechanical properties and interphase precipitation behaviors in V-Ti microalloyed steel. Acta Metall. Sin. 2014, 50, 524–530. Available online: https://www.ams.org.cn/EN/Y2014/V50/I5/524 (accessed on 10 December 2024).
  42. Li, X.; Wang, Z. Interphase precipitation behaviors of nanometer-sized carbides in a Nb-Ti-bearing low-carbon microalloyed steel. Acta Metall. Sin. 2015, 51, 417–424. Available online: https://www.ams.org.cn/EN/Y2015/V51/I4/417 (accessed on 10 December 2024).
  43. Restrepo, S.E.; Di Stefano, D.; Mrovec, M.; Paxton, A.T. Density functional theory calculations of iron-vanadium carbide interfaces and the effect of hydrogen. Int. J. Hydrogen Energy 2020, 45, 2382–2389. [Google Scholar] [CrossRef]
  44. Hartford, J. Interface energy and electron structure for Fe/VN. Phys. Rev. B 2000, 61, 2221–2229. [Google Scholar] [CrossRef]
  45. Davenport, A.T.; Honeycomhe, R.W.K. The secondary hardening of tungsten steels. Met. Sci. 1975, 9, 201–208. [Google Scholar] [CrossRef]
  46. Wang, Y.J.; Zurob, H.S. The precipitation of NbC on dislocations in austenite. Appl. Phys. A 2002, 74, 1213–1215. [Google Scholar] [CrossRef]
  47. Van Aswegen, J.S.; Honeycombe, R.W.K.; Warrington, D.H. Precipitation on stacking faults in Cr-Ni austenitic steels. Acta Metall. 1964, 12, 1–13. [Google Scholar] [CrossRef]
  48. Eom, H.J.; Shin, J.H.; Kong, B.S.; Jeong, C.; Jang, C.; Ahn, D.; Jang, D. Dissolution of nanosized NbC precipitates in austenite matrix during elastic deformation-Deleterious effect of high number density. Mater. Sci. Eng. A 2022, 833, 142506. [Google Scholar] [CrossRef]
  49. Lee, C.; Nambu, S.; Inoue, J.; Koseki, T. Ferrite formation behaviors from B1 compounds in steels. ISIJ Int. 2011, 51, 2036–2041. [Google Scholar] [CrossRef]
  50. Shi, R.; Ma, Y.; Wang, Z.; Gao, L.; Yang, X.; Qiao, L.; Pang, X. Atomic-scale investigation of deep hydrogen trapping in NbC/α-Fe semi-coherent interfaces. Acta Mater. 2020, 200, 686–698. [Google Scholar] [CrossRef]
  51. Chai, J.; Dong, H.; Zhang, J.; Shen, K.; Yang, Z.; Chen, H. On the role of interfacial coherency and carbon in niobium segregation at ferrite/austenite interface: An atomistic study. Scr. Mater. 2024, 247, 116109. [Google Scholar] [CrossRef]
  52. Hohenberg, P.; Kohn, W. Inhomogeneous Electron Gas. Phys. Rev. 1964, 136, B864. [Google Scholar] [CrossRef]
  53. Kohn, W.; Sham, L. Self-Consistent Equations Including Exchange and Correlation Effects. Phys. Rev. 1965, 140, A1133e8. [Google Scholar] [CrossRef]
  54. Blöchl, P.E. Projector augmented-wave method. Phys. Rev. B 1994, 50, 17953. [Google Scholar] [CrossRef] [PubMed]
  55. Perdew, J.P.; Burke, K.; Ernzerhof, M. Generalized gradient approximation made simple. Phys. Rev. Lett. 1996, 77, 3865. [Google Scholar] [CrossRef]
  56. Siegel, D.J.; Hector, L.G., Jr.; Adams, J.B. First-principles study of metal-carbide/nitride adhesion: Al/VC vs. Al/VN. Acta Mater. 2002, 50, 619–631. [Google Scholar] [CrossRef]
  57. Jang, J.H.; Lee, C.H.; Heo, Y.U.; Suh, D.W. Stability of (Ti, M) C (M = Nb, V, Mo and W) carbide in steels using first-principles calculations. Acta Mater. 2012, 60, 208–217. [Google Scholar] [CrossRef]
  58. Chong, X.; Jiang, Y.; Zhou, R.; Feng, J. Electronic structures mechanical and thermal properties of V-C binary compounds. RSC Adv. 2014, 4, 44959–44971. [Google Scholar] [CrossRef]
  59. Du, Y.A.; Ismer, L.; Rogal, J.; Hickel, T.; Neugebauer, J.; Drautz, R. First-principles study on the interaction of H interstitials with grain boundaries in α-and γ-Fe. Phys. Rev. B 2011, 84, 144121. [Google Scholar] [CrossRef]
  60. Jiang, D.E.; Carter, E.A. Diffusion of interstitial hydrogen into and through bcc Fe from first principles. Phys. Rev. B Condens. Matter Mater. Phys. 2004, 70, 064102. [Google Scholar] [CrossRef]
  61. Zhang, Y.; Li, X.; Xu, Y.; Lei, Y.; Xie, Z.; Wang, X.; Fang, Q.; Liu, C.; Wu, X. Hydrogen trapping, desorption and clustering in heterophase interfaces of W-ZrC alloy. Acta Mater. 2023, 242, 118469. [Google Scholar] [CrossRef]
  62. Bowles, J.S.; Wayman, C.M. The bain strain, lattice correspondences, and deformations related to martensitic transformations. Metall. Trans. 1972, 3, 1113–1121. [Google Scholar] [CrossRef]
  63. Wang, B.; Gu, N.; Guo, S.; Ma, X. The mathematical description of the K-S mechanism and Bain correspondence. Acta Metall. Sin. 2002, 38, 474–478. Available online: https://www.ams.org.cn/CN/Y2002/V38/I5/474 (accessed on 10 December 2024).
  64. Ramasubramaniam, A.; Itakura, M.; Ortiz, M.; Carter, E. Effect of atomic scale plasticity on hydrogen diffusion in iron: Quantum mechanically informed and on-the-fly kinetic Monte Carlo simulations. J. Mater. Res. 2008, 23, 2757–2773. [Google Scholar] [CrossRef]
  65. Miwa, K.; Fukumoto, A. First-principles study on 3d transition-metal dihydrides. Phys. Rev. B 2002, 65, 155114. [Google Scholar] [CrossRef]
  66. Norsko, J.K. Chemisorption on metal surfaces. Rep. Prog. Phys. 1990, 53, 1253. [Google Scholar] [CrossRef]
  67. Christmann, K. Hydrogen adsorption on metal surfaces. In Atomistics of Fracture; Springer: Boston, MA, USA, 1983; pp. 363–389. [Google Scholar] [CrossRef]
Figure 1. The front views of (a) α-Fe/VC–C, (b) α-Fe/VC–V, (c,d) and showing the top views at the interface zones of (a,b), respectively. The system is composed of 20 Fe, 12 V, and 12 C atoms, drawn in purple, grey, and pink, respectively. α-Fe/VN–N and α-Fe/VN–V were modeled in the same way.
Coatings 15 00466 g001
Figure 2. (a) The vacancy formation energies of Fe, C, N, and V vacancies located within the nearest two atomic layers near the interface plane. The type and location of the vacancy, as well as the number of layers where the vacancy is located from the interface planes, are indicated. (b) The positions of different vacancies in different structures. The Fe atoms, V atoms, C atoms, N atoms, and vacancies are drawn in purple, grey, pink, blue, and white, respectively.
Coatings 15 00466 g002
Figure 3. The interfacial binding energies (Eb) and the vacancy formation energy (Efor) of (a) α-Fe/VC–C, (b) α-Fe/VC–V, (c) α-Fe/VN–N, and (d) α-Fe/VN–V with different vacancies, where the black dashed line represents the interfacial binding energy of the perfect interface. The correlation coefficient r S between Eb and Efor is also marked in the figure.
Coatings 15 00466 g003
Figure 4. (a) Solution energy of H at different distances to the plane for different interfaces. Place the interface model horizontally. Zones I, II, III, and IV represent the interface-like VM, interface, interface-like Fe, and bulk-like Fe zone, respectively. The lowest solution energy of each interface indicates its best trapping site (the geometric structures are shown as (be), corresponding to the α-Fe/VC–C interface, α-Fe/VC–V interface, α-Fe/VN–N interface, and α-Fe/VN–V interface, respectively, where Fe is drawn in purple, V in grey, and H in white), which is indicated by a solid marker. The black dash-dotted line represents the interface plane, and the red dashed line represents the solution energy of H at TISs in bulk α-Fe. The negative abscissa region represents the side of the Fe block.
Coatings 15 00466 g004
Figure 5. The solution energy for different vacancies at (a) α-Fe/VC–C, (b) α-Fe/VC–V, (c) α-Fe/VN–N, and (d) α-Fe/VN–V interfaces. The lowest solution energy on the perfect surface is also presented as the control data of other vacancies. The positions of the vacancies have also been marked. The light blue area represents the position of the first layer, and the blue area represents the position of the sub-layer.
Coatings 15 00466 g005
Figure 6. The LDOS of the different atoms in the (a) α-Fe/VC–C, (b) α-Fe/VC–V, (c) α-Fe/VN–N, and (d) α-Fe/VN–V interfaces.
Coatings 15 00466 g006
Figure 7. (a) The solution energies of the H atom at different Voronoi volumes; (b) the solution energies of the H atom at different ratios of Voronoi volume to coordination number. The lowest solution energy of each interface is indicated by a solid marker.
Coatings 15 00466 g007
Table 1. Calculated values of the lattice parameters for α-Fe, VC, and VN. The units are [Å].
Present WorkPrevious Works
α-Fe2.8302.830 (th.) [19]; 2.853 (expt.) [20]; 2.833 (th.) [20]; 2.858 (expt.) [21]; 2.836 (th.) [43]
VC4.1824.164 (th.) [28]; 4.163 (expt.) [29]; 4.169 (expt.) [30]
VN4.1284.130 (th.) [44]; 4.140 (expt.) [44]
Table 2. Calculated values of the formation enthalpies of bulk VC and VN. The units are [eV/atom].
Present WorkPrevious Works
VC−0.477−0.494 [31]; −0.435 [43]; −0.405 [58]
VN−1.210−1.039 [32]; −1.120 [33]
Table 3. Calculated values of the interfacial binding energy of four kinds of interfaces and the corresponding average bond length of interfacial Fe–V/M bonds.
Interface TypesInterfacial Binding Energy (J/m 2)Average Bond Length (Å)
α-Fe/VC–C1.3241.819 (Fe–C bonds)
α-Fe/VC–V4.2142.647 (Fe–V bonds)
α-Fe/VN–N2.5771.842 (Fe–N bonds)
α-Fe/VN–V1.7422.449 (Fe–V bonds)
Disclaimer/Publisher’s Note: The statements, opinions and data contained in all publications are solely those of the individual author(s) and contributor(s) and not of MDPI and/or the editor(s). MDPI and/or the editor(s) disclaim responsibility for any injury to people or property resulting from any ideas, methods, instructions or products referred to in the content.

