Article

Microstructure and Thermal Analysis Kinetics of Y2Hf2O7/Y3Al5O12 Composites Prepared by Solution Combustion Synthesis

1
Department of Materials Physics, School of Science, Xi’an University of Posts and Telecommunications, Xi’an 710121, China
2
Interdisciplinary Research Center for Flexible Electronics, Academy of Advanced Interdisciplinary Research, Xidian University, Xi’an 710071, China
3
Institute of Hydraulic Technology, Xihang University, Xi’an 710077, China
*
Authors to whom correspondence should be addressed.
Coatings 2025, 15(4), 470; https://doi.org/10.3390/coatings15040470
Submission received: 11 March 2025 / Revised: 12 April 2025 / Accepted: 14 April 2025 / Published: 15 April 2025
(This article belongs to the Special Issue Ceramic and Glass Material Coatings)

Abstract

:
With the development of high-speed and high-temperature equipment, thermal barrier materials are facing increasingly harsh service environments. The addition of YAG to Y2Hf2O7 has been proposed in order to improve its long-term high-temperature performance. In this work, Y2Hf2O7/Y3Al5O12 composite powders were synthesized by combustion synthesis with urea, glycine, EDTA, citric acid, and glucose as fuels, while hafnium tetrachloride, yttrium nitrate hexahydrate, and aluminum nitrate nonahydrate were used as raw materials. The effects of fuels on the morphology and phase composition of synthetic powders were studied. Chemical reaction kinetic parameters were established by the Kissinger, Augis and Bennett, and Mahadevan methods. Y2Hf2O7 and Y3Al5O12 are the main components in the powders synthesized with urea as fuel, while YAlO3 and Y2Hf2O7 are the main phases with the other fuels. SEM and TEM analysis reveal that the powders prepared by the solution combustion method exhibit a typical porous morphology. When urea is used as fuel, the powders show a uniform elemental distribution, distinct ceramic grain crystallization, clear grain boundaries, and a uniform distribution of alternating grains. Compared to several other fuels, urea is more suitable for the preparation of Y2Hf2O7/Y3Al5O12 composite powders. In the process of preparing powders with urea, the activation energies for the combustion reaction calculated using the three methods are 100.579, 104.864, and 109.148 kJ·mol−1, while the activation energies related to crystal formation are 120.397, 125.001, and 129.600 kJ·mol−1, respectively.

1. Introduction

In recent years, as performance requirements for aircraft engines have continued to rise, the working temperature of thermal barrier coatings has also increased [1,2]. Yttria-stabilized zirconia (6–8 wt% YSZ) is currently the most widely used material for thermal barrier coatings. However, at temperatures above 1200 °C, it becomes unstable due to phase transformation and its reduced resistance to sintering [3,4]. These issues ultimately lead to the failure of thermal barrier coating materials.
Studies have revealed that hafnates have greater melting temperatures and better phase stability than zirconates [5]. Fluorite-structured yttrium hafnate (Y2Hf2O7) is well known for its high melting point, low thermal conductivity, and superior thermal insulation capabilities [6]. Using the solution combustion synthesis (SCS) approach, Liao et al. [7] synthesized Y2Hf2O7 powder with Y(NO3)3 and HfO(NO3)2 as raw materials and glycine and urea as fuels. The research group previously used Y(NO3)3 and HfCl4 as raw materials, CH4N2O as the fuel, and employed the SCS method to prepare Y2Hf2O7 powder. Testing of the thermal protective and ablation resistance properties of Y2Hf2O7 indicates its potential as a thermal barrier coating material [8,9]. However, yttrium hafnate ceramics are prone to fracturing during preparation and long-term high-temperature service, which limits their development. Yttrium Aluminum Garnet (YAG, Y3Al5O12) is an oxide ceramic with excellent creep resistance [10]. Nd-doped YAG single crystal has become the most commonly used solid-state laser material [11]. It is a crucial ceramic material because of its excellent optical properties, thermal stability, and high strength. Research has successfully developed multi-phase ceramics containing YAG phases, significantly improving their mechanical properties compared to the original ceramics [12,13]. Therefore, YAG is proposed to enhance Y2Hf2O7, thereby expanding its high-temperature application potential.
The properties of the initial powder significantly impact the quality of the sintered ceramics. Therefore, preparing high-performance powders is a critical step in the ceramic fabrication process [14]. SCS is a technique used to rapidly synthesize oxide powders with a high surface area at relatively low temperatures [15]. It utilizes the exothermic reaction between an oxidizer (such as a metal nitrate) and organic fuels (such as urea, citric acid, and tartaric acid) to release a large amount of heat energy for synthesizing high-performance powders. The combustion reaction typically lasts several minutes, reaching temperatures as high as 2000 K [16,17]. During the combustion reaction, a significant amount of gases such as CO2, H2O, H2, N2, and CO are produced, resulting in the synthesized powder exhibiting a foamy or sponge-like porous structure [18,19]. Apart from the SCS method, other techniques for producing oxide ceramic powders include mechanical synthesis [20], a gas-phase reaction [21], the precipitation method [22], etc. Extensive ball milling is necessary for mechanical synthesis, which makes it challenging to establish a homogeneous chemical composition and means that the method is prone to the introduction of contaminants. Gas-phase methods require high temperatures for powder synthesis. Although precipitation methods can produce powders with uniform particle sizes, they are time-consuming [14]. Compared to other powder synthesis methods, SCS can rapidly produce uniform, high-purity, or evenly doped ceramic powders. It also offers the advantages of simplicity and low cost, making it widely favored for powder preparation [15,16,17,18,19,23,24]. In addition, thermal barrier coating materials are typically applied using the plasma spraying method. Existing studies have shown that, compared to the co-precipitation method, materials prepared using the SCS method for plasma spraying offer advantages in terms of their high temperature, duration of drying, and calcination [25].
It is a challenge to regulate the product’s homogeneity because of the intricacy of the SCS process and the lack of knowledge surrounding synthesis mechanisms [26]. As a result, research on the kinetic processes of SCS for powder production has started. Kumar et al. successfully synthesized pure nickel nanoparticles using nickel nitrate and glycine as raw materials via SCS [27]. Furthermore, they conducted TGA-DTA thermal analysis on their precursor and determined the activation energy of the reaction in the nickel nitrate–glycine system using the Kissinger method. Using the Merzhanov–Khaikin approach, Amirkhanyan et al. determined the activation energy of the SCS reaction in systems with nickel nitrate as the oxidizer and either glycine or hexamethylenetetramine as the fuel [26]. Activation energy is a key parameter in thermal analysis kinetics studies, reflecting the energy barrier that must be overcome for a reaction to occur [28]. It varies significantly between different substances in thermal analysis. The materials’ intrinsic characteristics, along with the type and concentration of the substances involved in the chemical reaction, all influence the reaction. Accurate thermal analysis data provides valuable information about the reaction. Experimental conditions, parameters, and analytical techniques significantly impact the calculation of the activation energy [29]. The choice of mathematical model used also plays a critical role in this calculation. Therefore, determining activation energy in thermal analysis requires the consideration of various factors. In this study, the TG-DTA thermal analysis method, combined with three classical models, was used to perform thermal and kinetic analysis in order to determine the activation energy of the chemical reaction.
In this work, urea, glycine, EDTA, glucose, and citric acid were separately used as combustion agents to synthesize Y2Hf2O7/YAG composite powders using the SCS method. Thermal analysis and Fourier-transform infrared spectroscopy (FTIR) were conducted on the precursors prepared with distinct combustion agents. The phase structure and microstructure of the powders were analyzed. Based on the above analysis, we selected the most suitable fuel for the preparation of Y2Hf2O7/YAG powders. In order to understand its reaction process and mechanism, the Kissinger, Augis and Bennett, and Mahadevan methods were used to calculate the activation energy during the combustion reaction of the optimal fuel.

2. Material and Methods

2.1. Sample Preparation

The Y2Hf2O7/YAG composite powders were prepared using the SCS method. Hafnium chloride HfCl4 (99.9%) was dissolved in deionized water and the addition of ammonium hydroxide (A.R.) resulted in the formation of a white flocculent precipitate. The solution was centrifuged for 5 min at 5000 rpm to separate the precipitate from the solvent. The precipitate was subsequently washed three times with distilled water. This operation aimed to remove chloride ions (Cl) from the solution. Then, we added an excess of nitric acid (A.R.) to dissolve the precipitate and the solution became strongly acidic. Yttrium nitrate Y(NO3)3·6H2O (99.99%) and aluminum nitrate Al(NO3)3·9H2O (A.R.) were dissolved in solution along with distinct combustion reagents. The combustion reagents included urea (A.R.), glycine (A.R.), EDTA (A.R.), glucose (A.R.), and citric acid (A.R.). The target Y2Hf2O7/YAG composite powder had a molar ratio of 1:1 between YAG and Y2Hf2O7.The mass of hafnium chloride, yttrium nitrate, and aluminum nitrate were calculated according to the stoichiometric ratio, and the masses of combustion reagent were calculated according to the total value of the oxidant and reducing agent in the redox reaction. Taking urea fuel as an example, the stoichiometric amount of urea is calculated from the combustion reaction equation as shown in Equations (1) and (2). We added the combustion agent at 1.2 times the calculated value to ensure sufficient heat release for the reaction.
3 Y ( N O 3 ) 3 + 5 A l ( N O 3 ) 3 + 20 C H 4 N 2 O Y 3 A l 5 O 12 + 20 C O 2 +   32 N 2 +   40 H 2 O
6 Y ( N O 3 ) 3 + 6 H f ( N O 3 ) 4 + 35 C H 4 N 2 O 3 Y 2 H f 2 O 7 + 35 C O 2 +   56 N 2 +   70 H 2 O
The solution was put in an oxidizing furnace preheated up to 450 °C, and was taken out after about 20 min. When the excess water was evaporated, intense combustion occurred, and fluffy powders were obtained. The specimens obtained using urea as the combustion agent were white, while the rest were black or gray in color (shown in Figure 1). The powder obtained at 450 °C was then heat-treated at 1000 °C for 2 h. Ceramic bulk was prepared by the solid-state sintering method. The mixed powders were ball-milled before being pressed. After ball milling, the composite powders were pressed to form ceramic green bodies. Finally, the ceramic green bodies were sintered without pressure at 1600 °C in air for 10 h.

2.2. Sample Characterization

The phase composition of the samples was determined by X-ray diffraction with Cu Kα radiation (XRD, D8 Advance; Bruker, Berlin, Germany). Their morphologies and microstructures were characterized by a scanning electron microscope (SEM, GeminiSEM 360; Zeiss, Jena, Germany) and a transmission electron microscope (TEM, JEM-F200; JEOL, Tokyo, Japan) equipped with energy-dispersive spectroscopy (EDS) capabilities. Before the SEM testing of the ceramics, the specimens were polished with 1 µm diamond paste and then thermally etched for 1 h at 1500 °C in air. The thermal analysis curves of the samples were measured in an oxygen atmosphere using a synchronous thermal analyzer (TG-DTA, ZRP-S; Jing Yi Gao Ke, Beijing, China) at a heating rate of 10 °C/min from room temperature to 1000 °C. For the calculation of the activation energy, the powder prepared with urea as the combustion agent was measured at heating rates of 5, 10, 15, and 20 °C/minute. During the experiment, the same batch of samples was used, with comparable masses and proportions. A Shimadzu IRTracer 100 (Kyoto, Japan) measured the Fourier-transform infrared (FTIR) spectra of the samples in the range of 400–4000 cm−1. The chemical bonds of the as-synthesized powders were identified by X-ray photoelectron spectroscopy (XPS, EscaLab Xi+; Thermo Scientific, Waltham, MA, USA). The precursors used for the thermal analysis, FTIR, and XRD tests were obtained as follows: the solution (with organic fuel added) was placed in an oven at 80 °C to remove the moisture. The obtained dry gel was used for testing. During thermal analysis, the precursor was uniformly mixed evenly with aluminum powder in equal proportions before being placed into the crucible. This made the combustion reaction less intense during the testing process. During the TG-DTA testing of precursors using different combustion agents as fuels, the specimen mass of urea as the fuel precursor was halved compared to the other samples to minimize errors caused by its more intense reactions.

2.3. Kinetic Method for Thermal Analysis

The general equation representing the “Arrhenius temperature dependence” of the rate constant in heterogeneous kinetics, when the heating rate is constant [30], is shown in Equation (3)
α T = A β e ( E a R T ) f ( α )
In the equation, α represents the conversion rate of the sample at a certain time, A is the pre-exponential factor, β ( β = T / t ) is the heating rate, T denotes the temperature in Kelvin, R is the gas constant, Ea stands for the activation energy of the reaction, and f ( α ) is the kinetic model function that describes the physicochemical or physicogeometrical mechanism of the reaction.
Based on the basic kinetic formulas mentioned above, numerous scholars have proposed many different methods for calculating the kinetics of reactions. The following methods all utilize the relationship between peak temperature (Tp) and reaction rate ( β ) in thermal analysis curves to calculate the activation energy of the reaction.

2.3.1. Kissinger Method

The formula for calculating the activation energy using the Kissinger method is given by Equation (4) [31].
ln β T p 2 = C E a R T p
where C is a constant and the curve plotted with ln β / T p 2 as the ordinate and 1 / T p as the abscissa forms a straight line with a slope of E a / R . The activation energy can be calculated from the slope of this straight line.

2.3.2. Augis and Bennett Method

According to the Augis and Bennett method [32], the formula for calculating activation energy is shown as Equation (5).
ln β T p = C E a R T p
where C is a constant. By plotting the ln ( β / T p ) ~ ( 1 / T p ) straight line based on the peak temperature and heating rate, and using the fact that the slope of the straight line is equal to E a / R , the activation energy can be obtained.

2.3.3. Mahadevan Method

In the Mahadevan method [33], the formula for calculating activation energy can be expressed as Equation (6).
ln β = C E a R T p
where C is a constant. Similarly to the previous two methods, the activation energy can be obtained from the slope of the ln β ~ ( 1 / T p ) straight line.

3. Results and Discussion

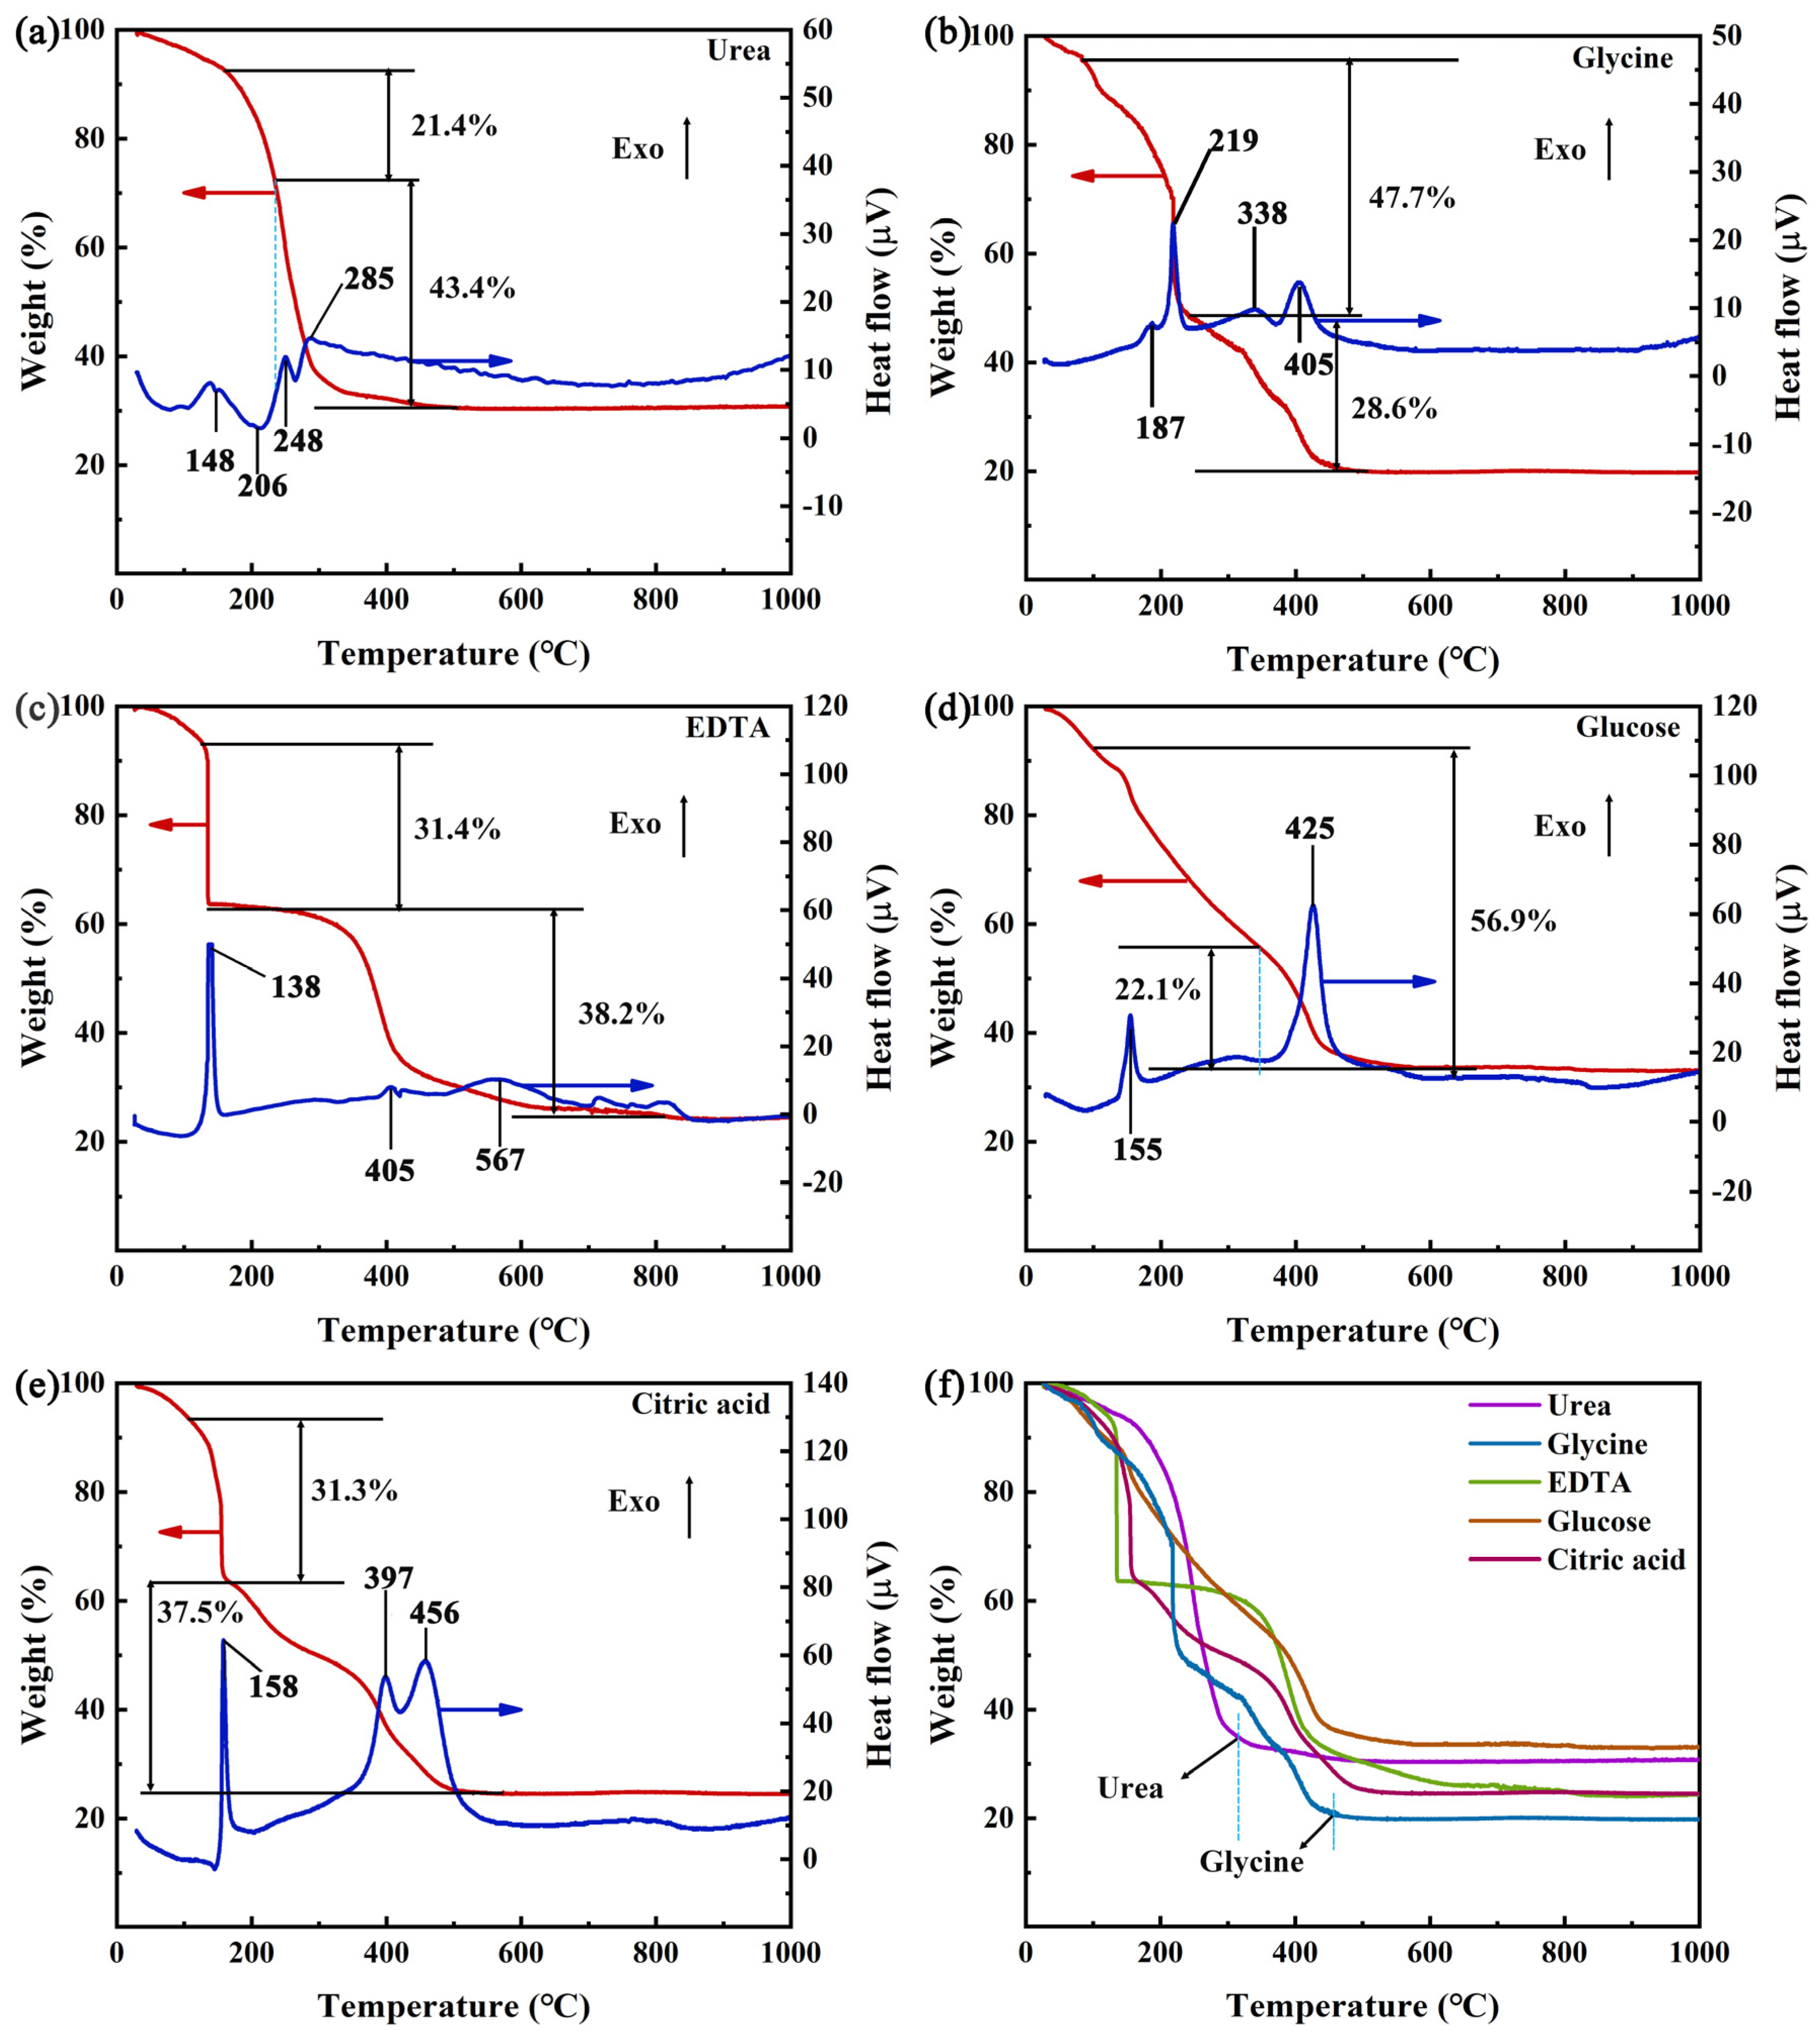
3.1. TG-DTA Analysis

Figure 2 shows the thermal analysis curves of the precursors synthesized with distinct combustion agents. The heating rate was 10 °C/min. The TG-DTA curves using urea, glycine, EDTA, glucose, and citric acid as combustion agents are shown in Figure 2a–e. The images show that the precursors with different combustion agents exhibit varying exothermic and endothermic processes. Below 110 °C, the TG curves for all the samples show a decline, which can be attributed to the evaporation of adsorbed water.
Almost all the samples exhibit exothermic peaks near 150 °C, which may be attributed to the prolonged low-temperature baking of the samples before testing. During this process, gelation and chelation reactions in the samples continue, and some fuels may also undergo decomposition.
The DTA curve with urea as the precursor shows two main endothermic peaks and two main exothermic peaks in the temperature range of 100–300 °C (Figure 2a). The endothermic event before 120 °C is likely due to the melting and volatilization of urea crystals, while the endothermic peak near 206 °C corresponds to the decomposition of the precursor’s organic compounds. Following these two endothermic peaks, a significant weight loss of about 21.4% is observed on the TG curve. The exothermic peaks at 248 °C and 285 °C represent the latent heat of crystallization released during the oxidation and crystallization of the precursor organic compounds, accompanied by a mass loss of 43.4%. The remaining mass at the end of the exothermic reaction, at around 410 °C, is very close to the final remaining mass, indicating that the combustion reaction is essentially complete by this temperature. The TG-DTA curve of the glycine group showed a distinct exothermic peak near 219 °C, accompanied by a mass loss of approximately 47.7% (Figure 2b). This was attributed to the exothermic reaction involving gelation and chelation. During this stage, carbon and nitrogen gas compounds were produced, along with some amorphous ceramic phases. The exothermic peaks around 338 °C and 405 °C correspond to a redox reaction, which was accompanied by a 28.6% mass loss. At this stage, additional amorphous phases formed, and weak endothermic reactions, associated with the decomposition of organic matter, occurred between the exothermic peaks.
The TG-DTA curve with citric acid as the combustion agent shows three distinct exothermic peaks (Figure 2e). A mass loss of approximately 31.3% occurs during the gelation process before 200 °C. The exothermic process at 397 °C can be attributed to the decarboxylation reaction between citrate and air, the volatilization of volatile components such as NO3 ions, and the thermal decomposition and spontaneous combustion of the gel, which releases a large amount of carbon and nitrogen oxides [34]. The exothermic process at 456 °C may result from the secondary combustion of the solution, accompanied by the release of latent heat from crystallization. The two exothermic peaks exhibit overlapping thermal effects, resulting in a mass loss of approximately 37.5%. The TG-DTA curve with EDTA as a combustion agent is similar to that of citric acid, showing two weak exothermic peaks at 405 °C and 567 °C with a mass loss of 38.2% (Figure 2c). These two main exothermic peaks are mainly attributed to the decomposition of free EDTA and chelates, respectively.
In the DTA curve with glucose as a combustion agent, exothermic peaks are observed at 155 °C and 425 °C (Figure 2d). The former peak is likely due to the exothermic gelation process and the degradation of glucose to maltose, during which CO gas is released [35]. The latter, more pronounced exothermic peak results from the oxidation of organic matter, accompanied by significant mass loss and the production of CO, NO, NO2, and other matter.
According to the TG-DTA results, except for in the urea group, obvious exothermic reaction and weightlessness occurred after 300 °C, indicating that the oxidants and reducing agents have not fully reacted in the other reactions. Moreover, as shown in Figure 2, among the five combustion agent groups, the mass losses associated with the exothermic peak dominated by combustion are 43.4% (urea), 47.7% (glycine), 38.2% (EDTA), 22.1% (glucose), and 37.5% (citric acid), respectively. The urea group also shows a steeper curve, indicating that the sample reacts more violently during the combustion process (Figure 2a). In the actual process of the solution combustion method, the urea group has the longest combustion duration and the most intense combustion, while other groups, especially the glucose group, have weak combustions, which may be caused by the insufficient formation of energetic chelates. Overall, the samples prepared with the five distinct combustion agents experienced considerable mass changes, with total weight loss ranging from 67% to 80%. It can be seen that the remaining mass of the urea group is the first to remain constant, followed by the glycine group (Figure 2f). The urea group completes its combustion reaction first and burns more completely. At 450 °C, the combustion reactions of the precursors prepared with the five combustion agents were nearly complete. Therefore, 450 °C was chosen as the synthesis temperature for the composite powders.

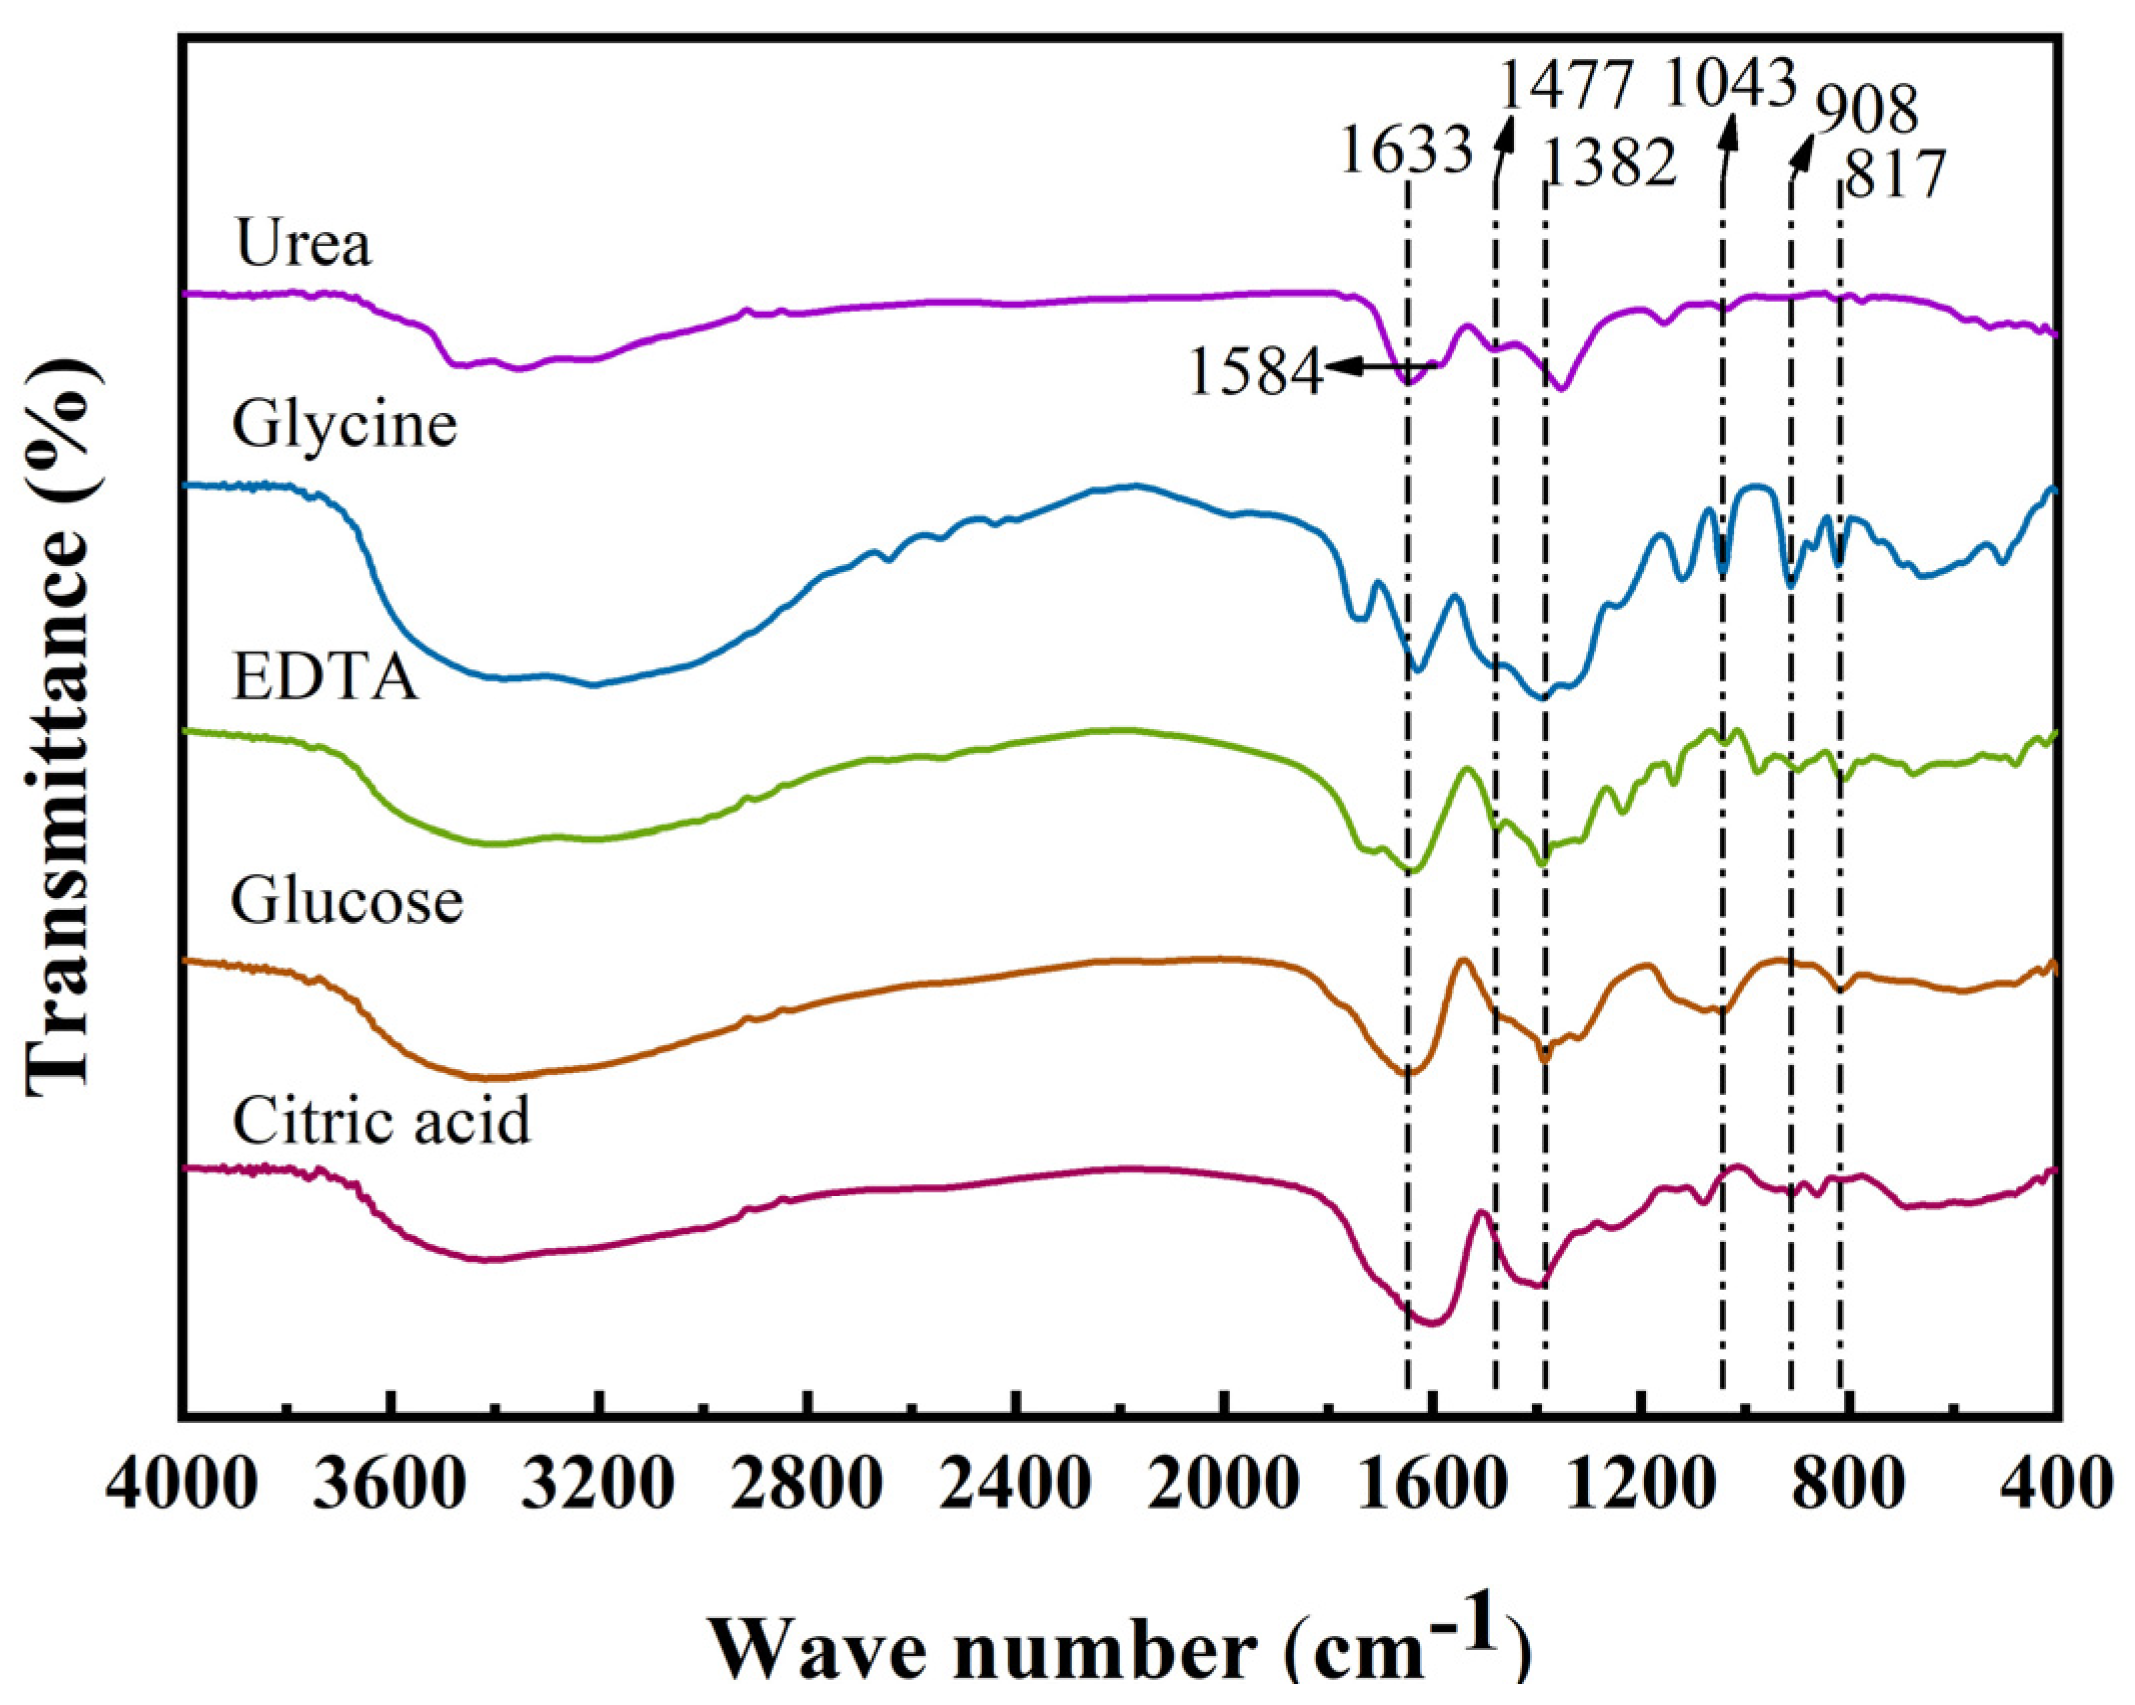
3.2. Analysis of Fourier-Transform Infrared Spectroscopy

The FTIR spectra of precursors prepared with distinct combustion agents are shown in Figure 3. The spectra indicate that some peaks of the five precursors are quite similar, suggesting that their functional group compositions are closely related. The strong and broad absorption peaks observed between 3000 and 3600 cm−1 in the FTIR spectra of the five precursors are most likely caused by the vibration of O-H bonds [36,37]. The peaks between 400 and 600 cm−1 may arise from chemical bonds formed between metals and oxygen in the precursor materials [19]. The peak at 1633 cm−1 may be related to the C=O bond in the fuel [38]. The absorption bands at 1382, 1043, 908, and 817 cm−1 are most likely generated by the presence of NO3 [19,38]. Furthermore, the peaks at 1633 cm−1 and 1382 cm−1 in the spectra obtained using glycine, EDTA, and citric acid as combustion agents may also be associated with the antisymmetric and symmetric stretching vibrations of COO [18,39]. The small absorption peak at 1477 cm−1 in the FTIR spectra using urea, glycine, and EDTA as combustion agents may be attributed to the presence of C-N bonds [38,40]. The absorption peak at 1584 cm−1 in the precursor with urea as a combustion agent may be related to NH2 [41].

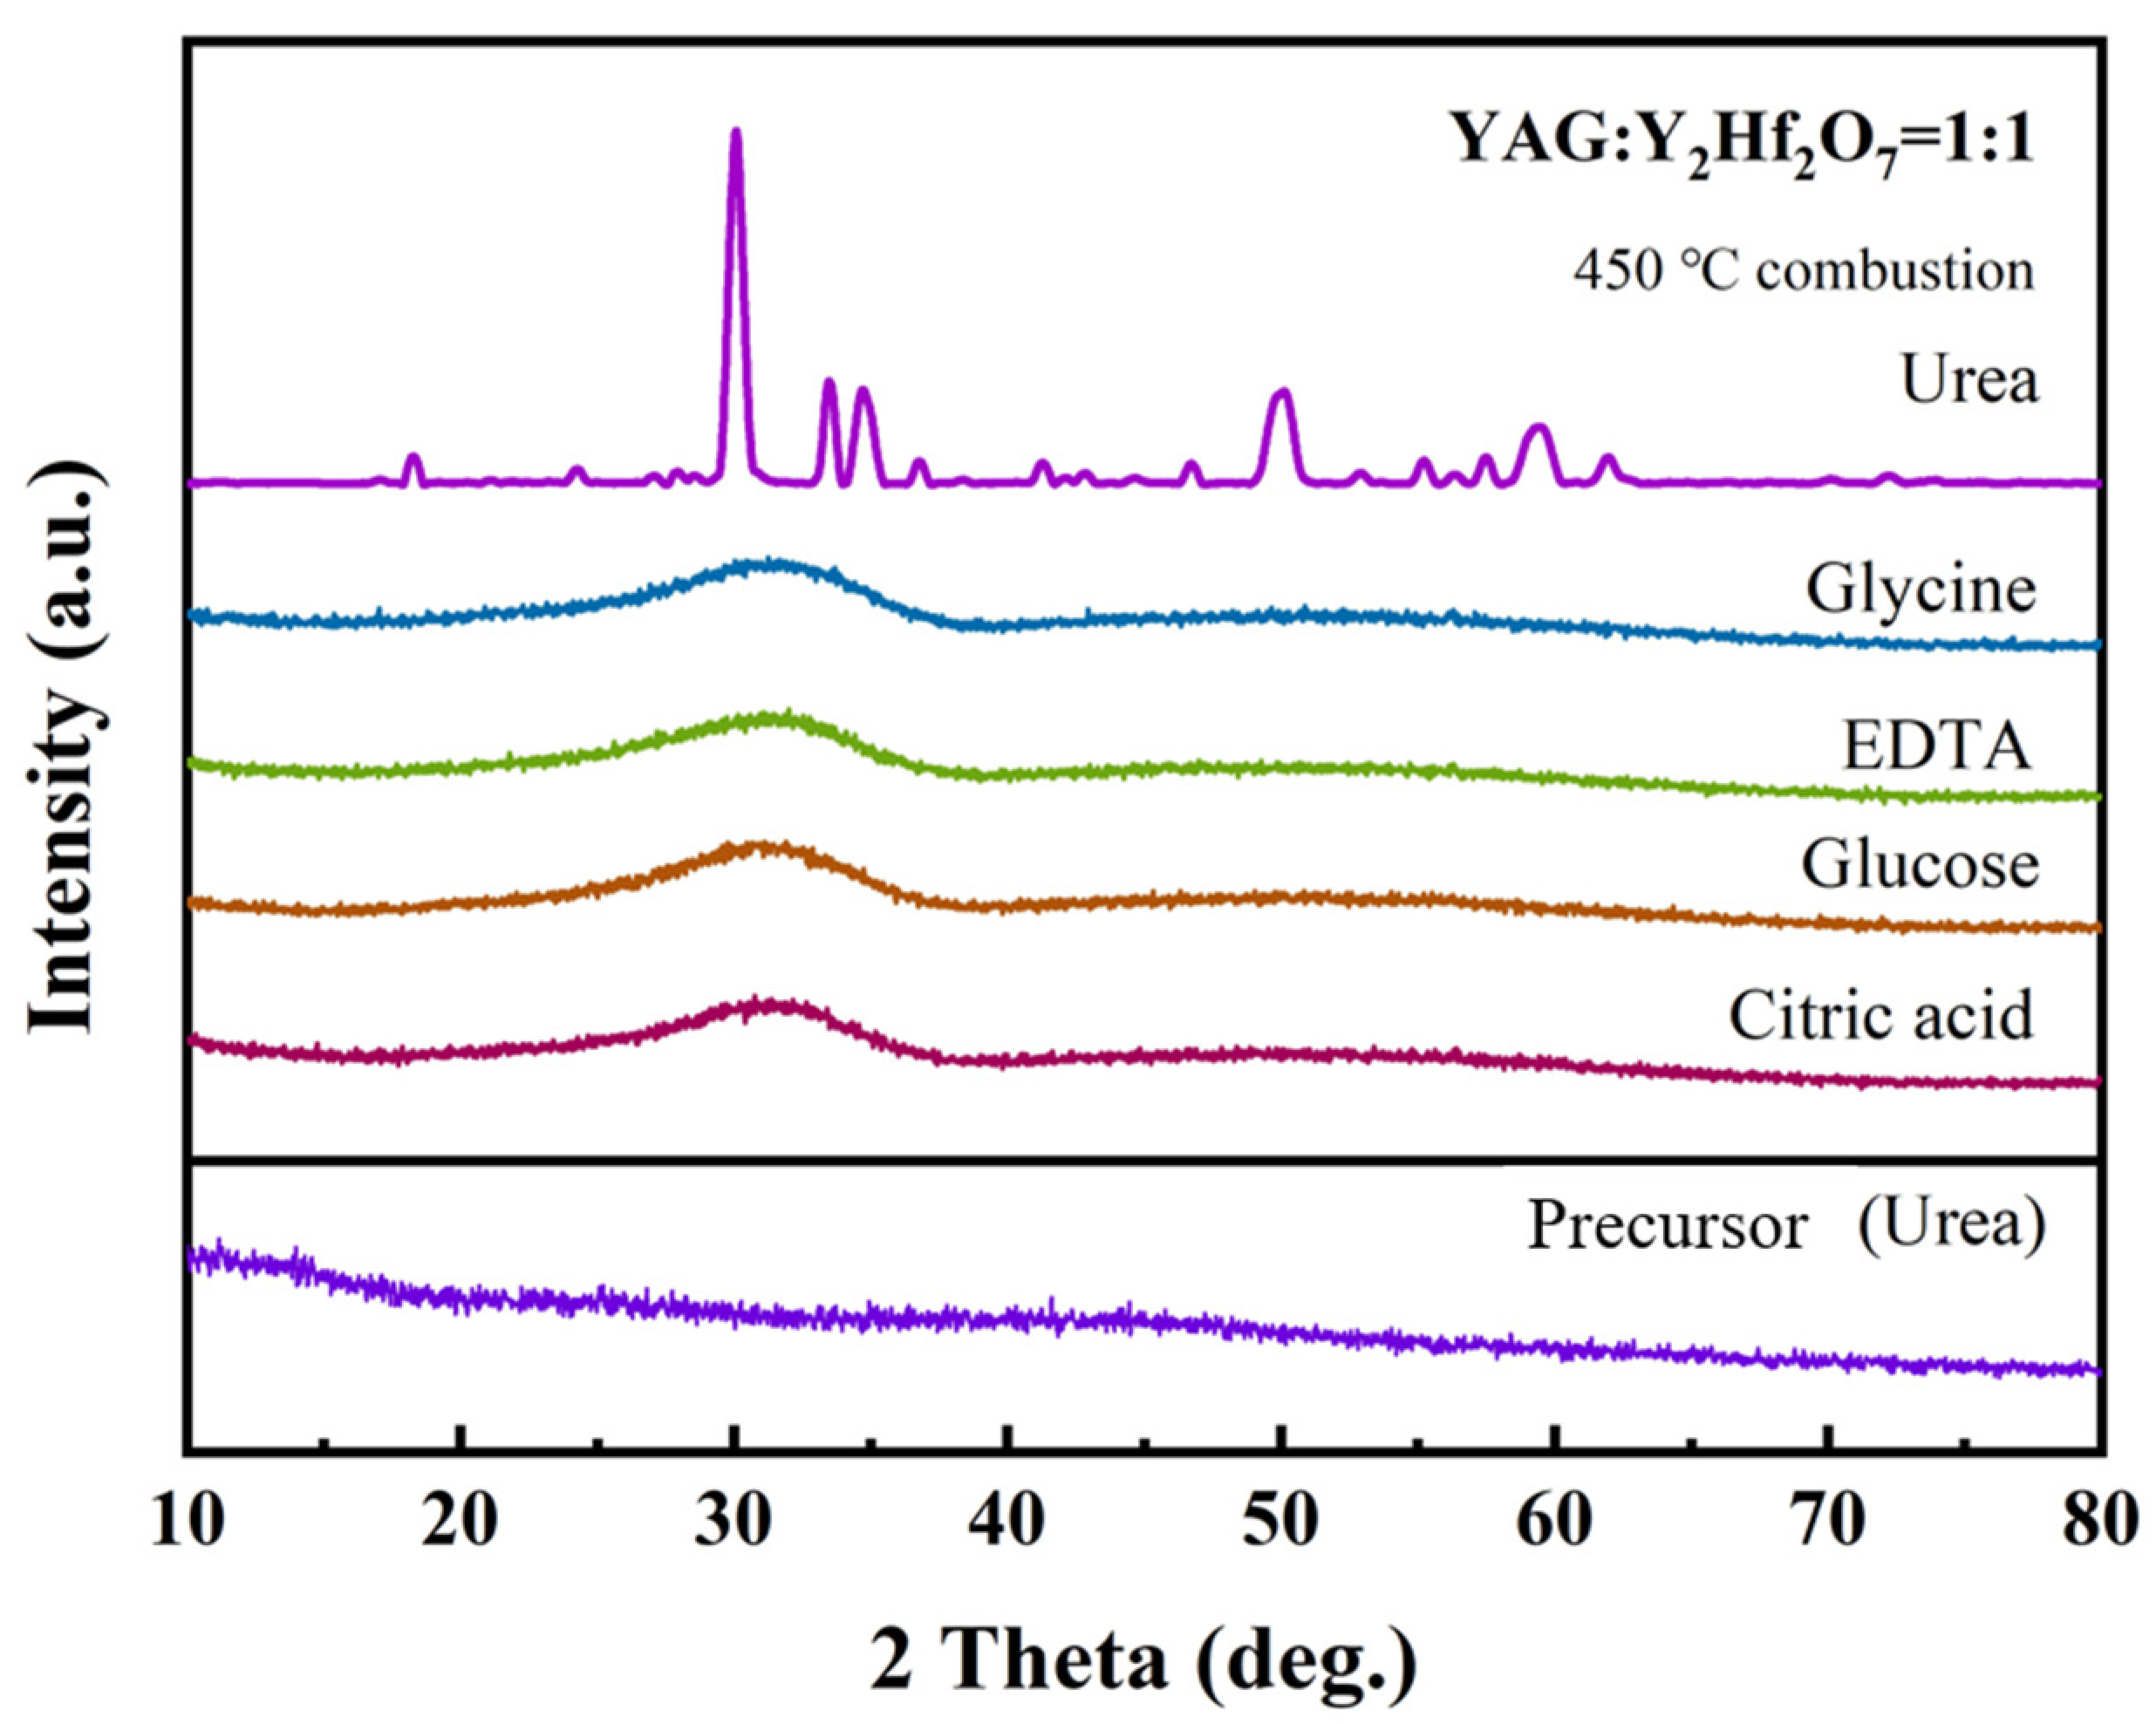
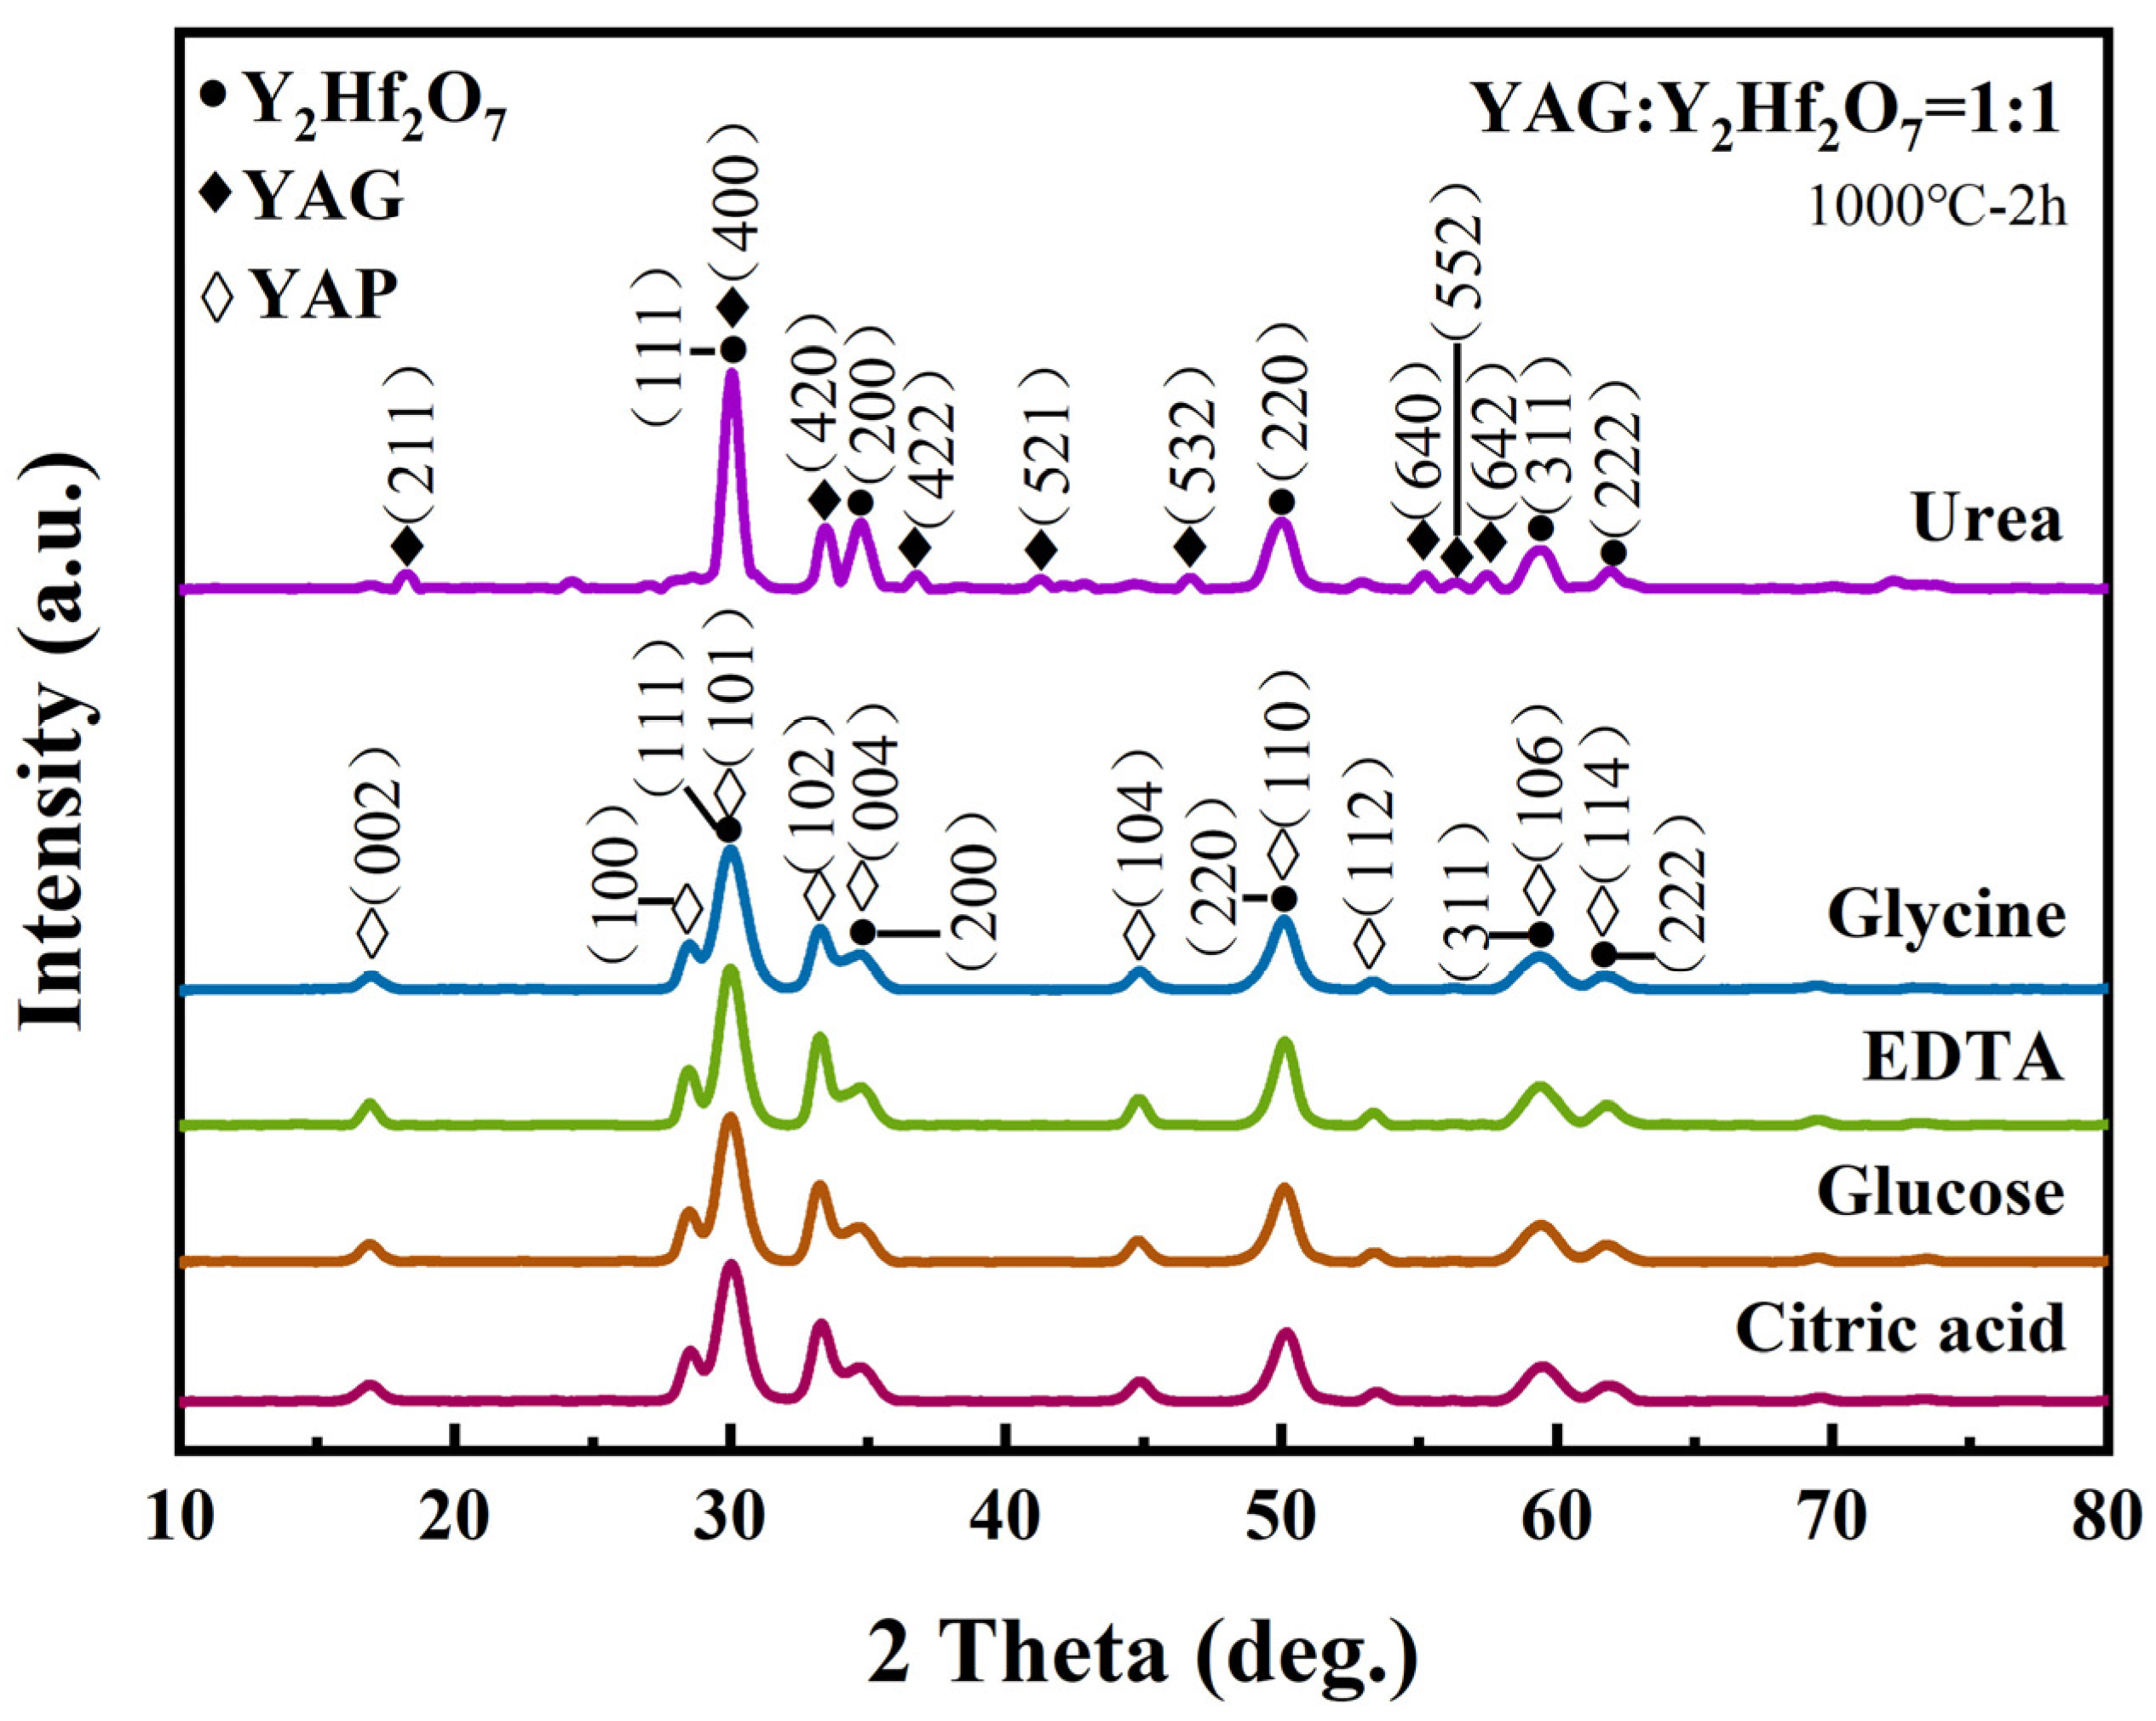
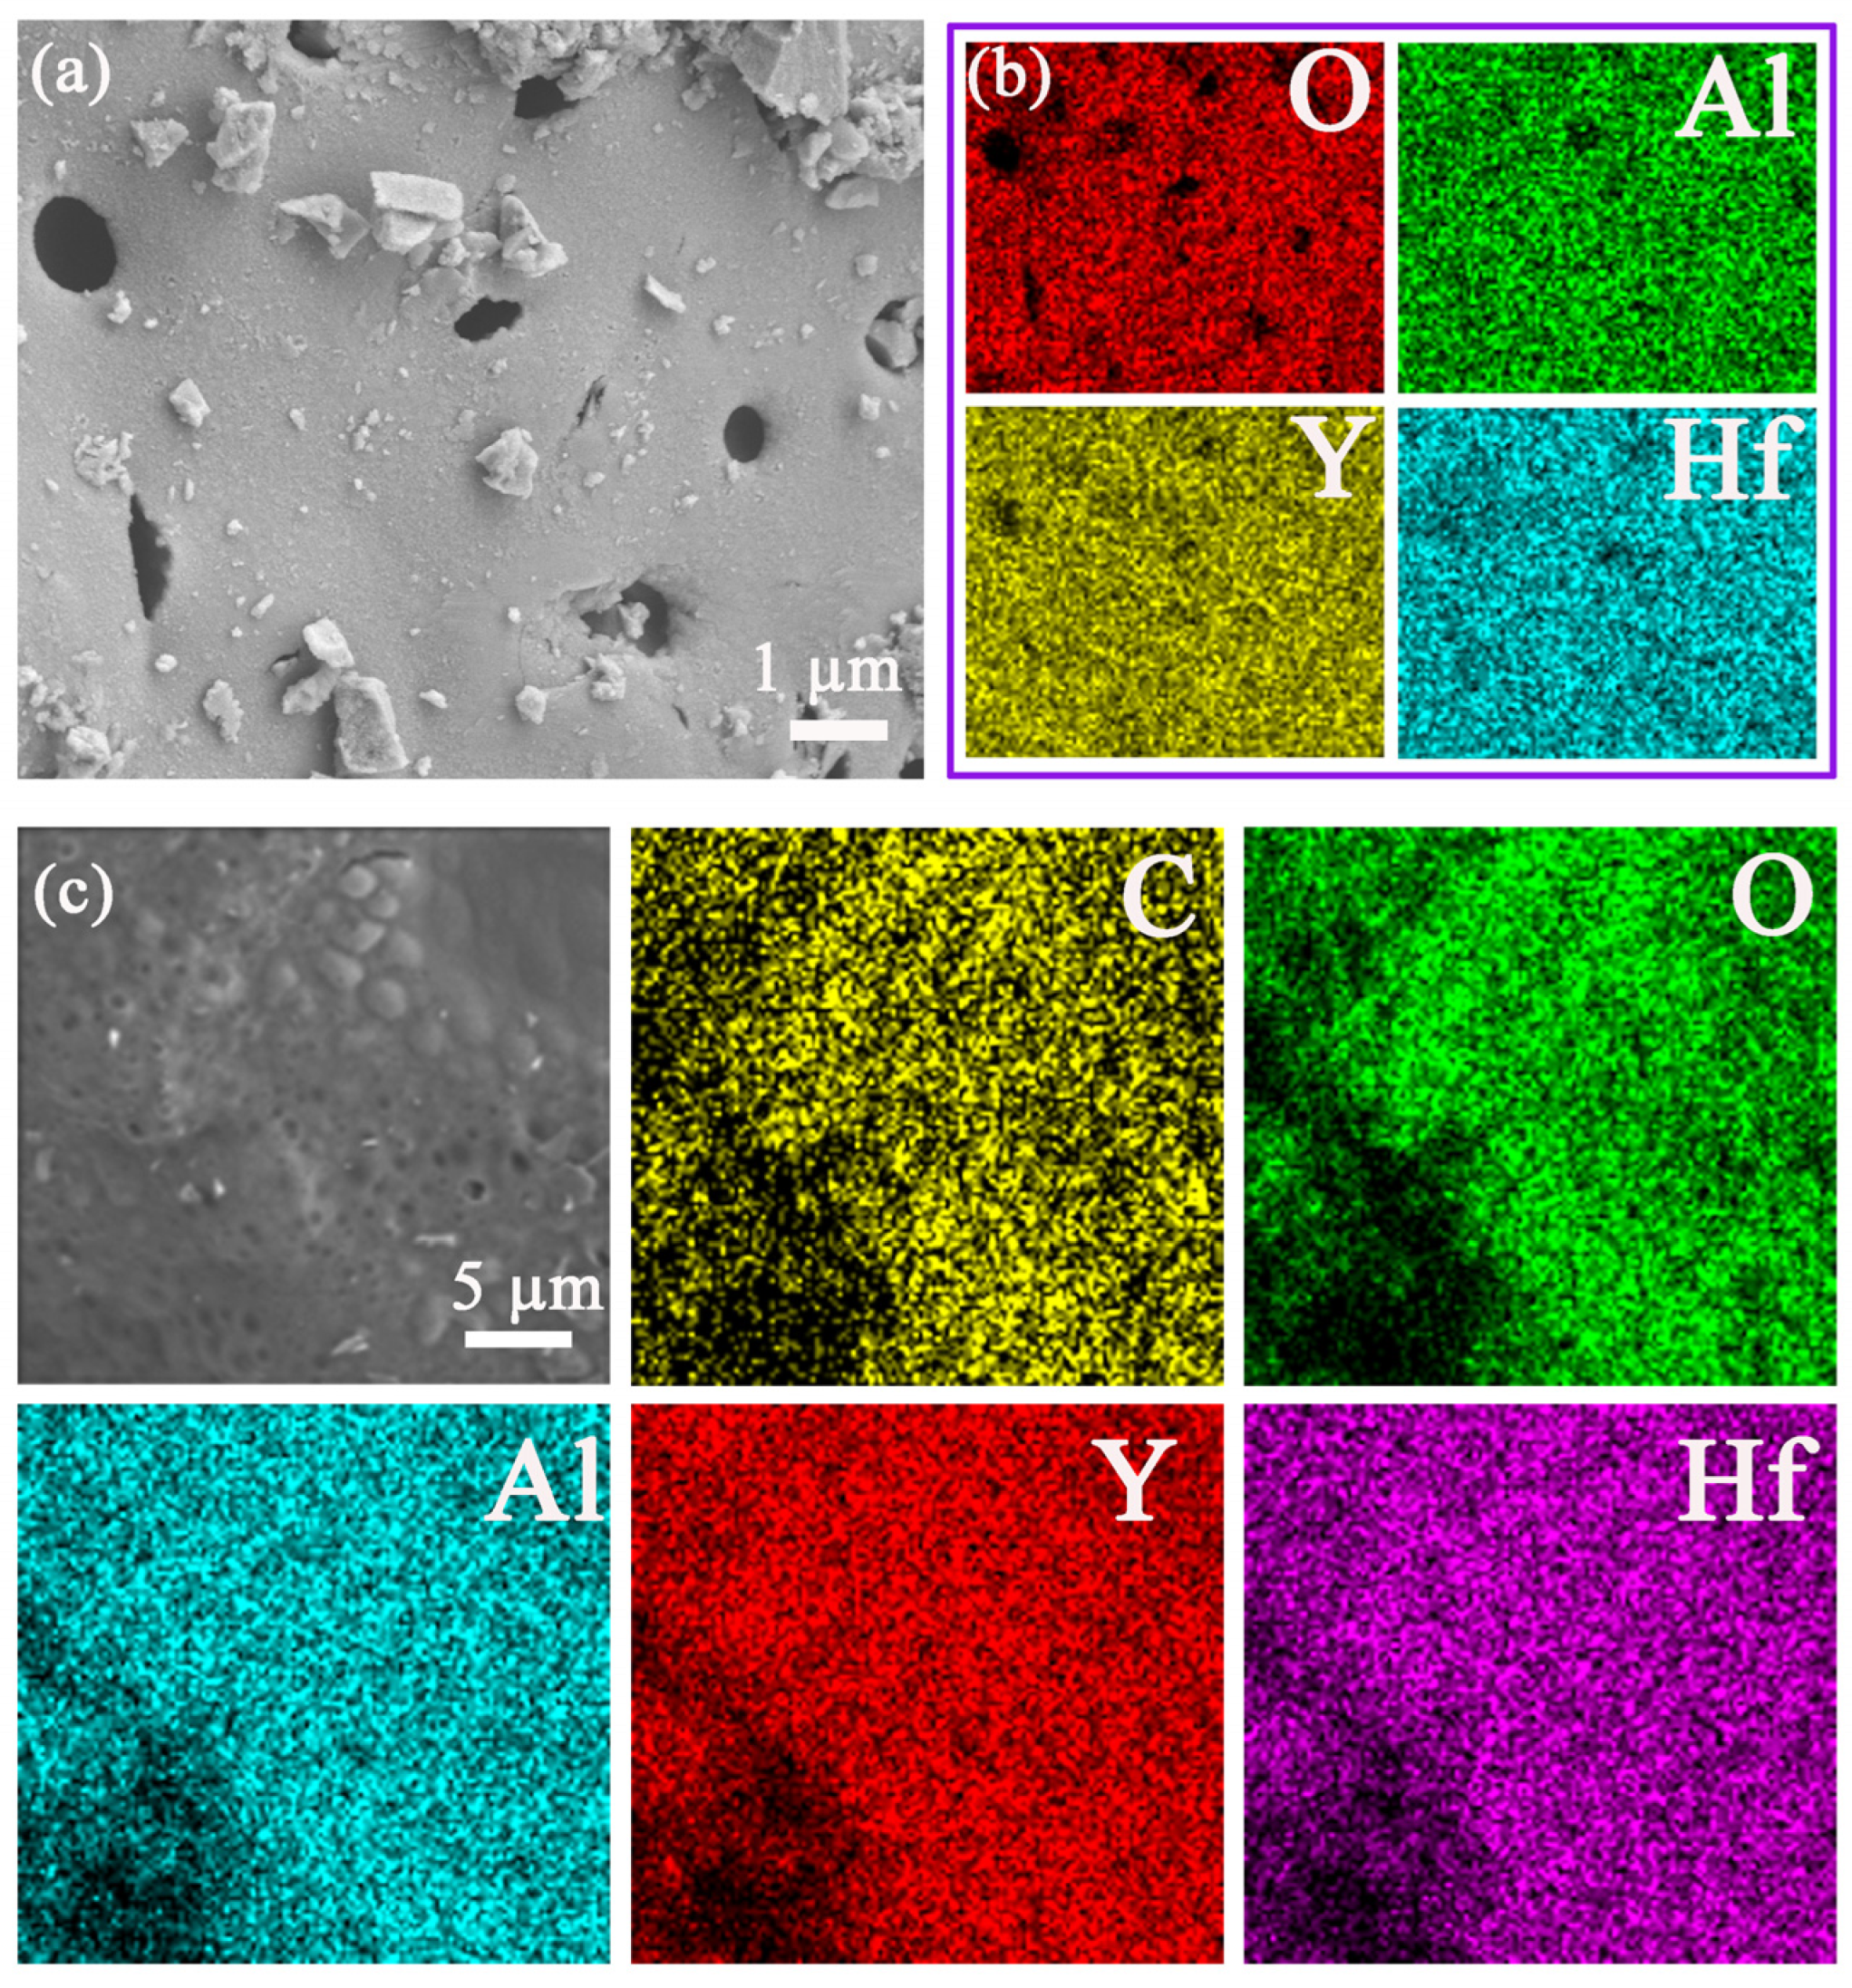
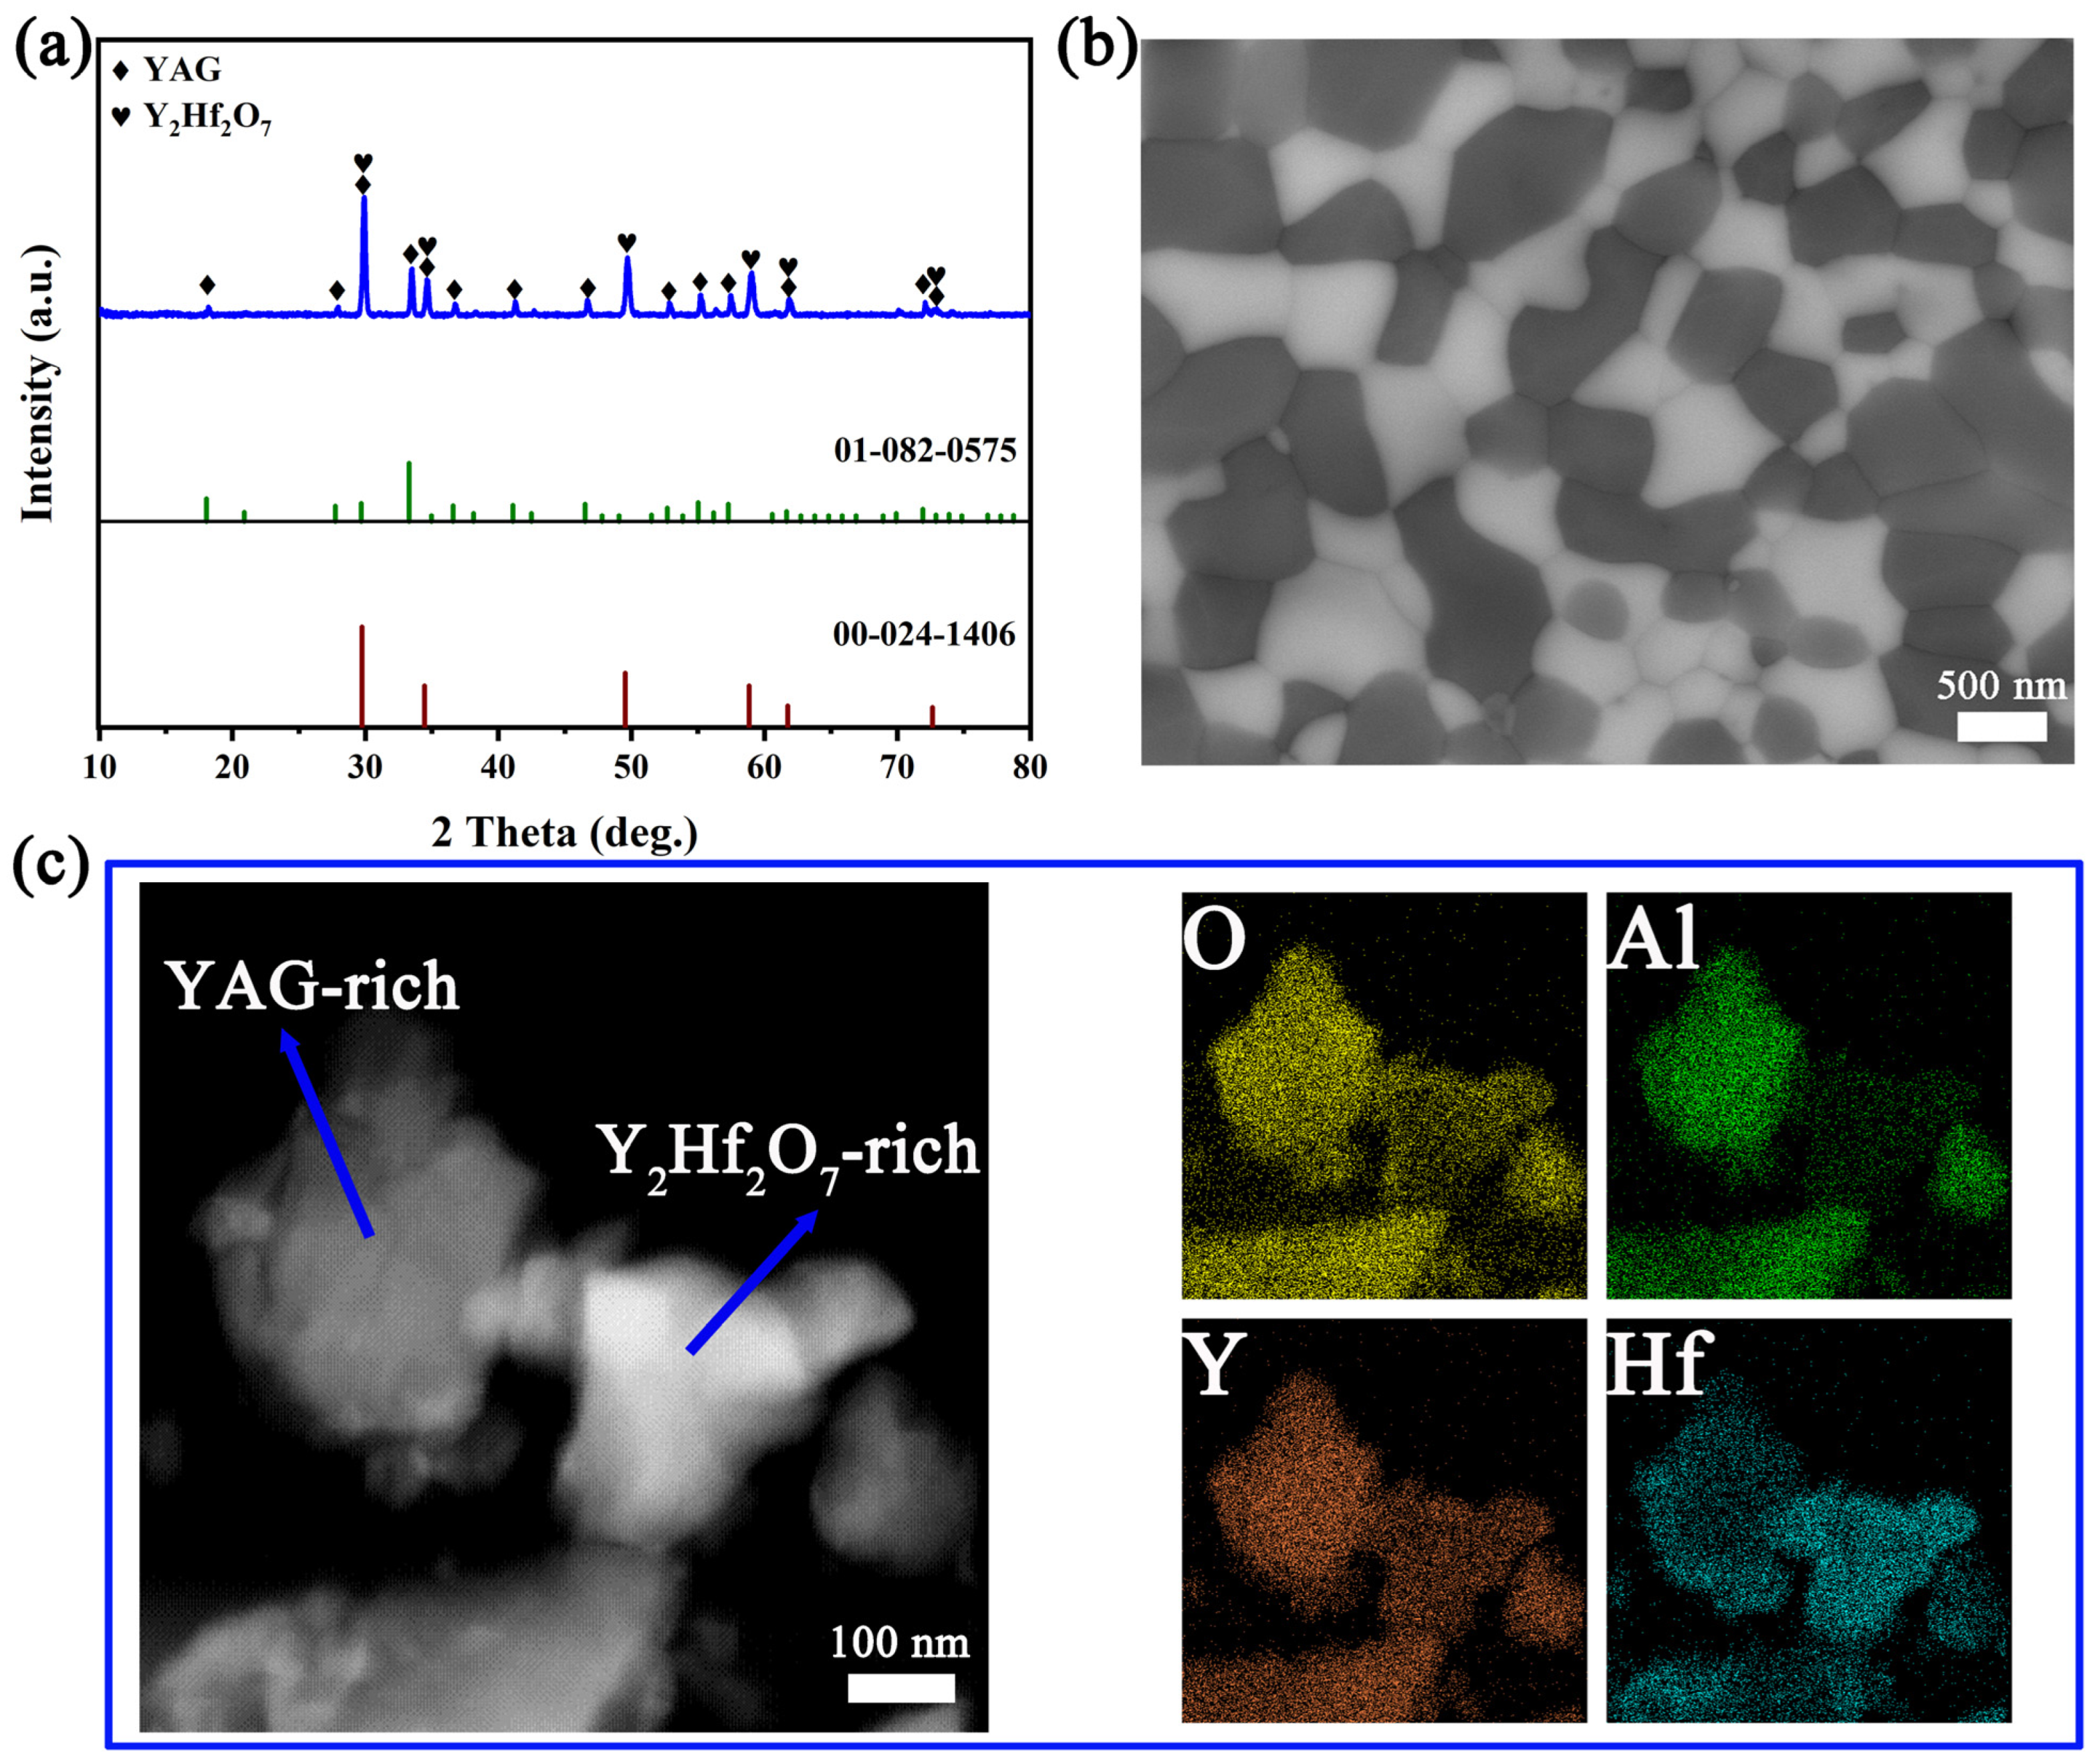
3.3. Analysis of Microstructure and Morphology

Figure 4 depicts the XRD patterns of the precursor with urea and the as-synthesized samples prepared with various combustion agents at 450 °C. As shown in the diagram, the precursor obtained with urea as a fuel exhibits an amorphous form, and the powders synthesized at 450 °C show strong diffraction information. Except for urea, the other diffraction patterns show broad peaks in the 25–35° range. This amorphous signal may result from the superposition of amorphous carbon and amorphous ceramics. The results show that all products, except for that with urea as its combustion agent, are amorphous. This indicates that urea has a higher combustion heat, providing more energy for precursor crystallization.
Figure 5 shows the XRD patterns of powders formed at 450 °C using fuels (urea, glycine, EDTA, glucose, and citric acid) following 1000 °C heat treatment. In comparison with Figure 4, all the powders show distinct diffraction peaks after heat treatment. The samples’ phases were detected using the search match tool X’Pert HighScore Plus (Philips, Eindhoven, The Netherlands) for XRD patterns. The peaks appearing in the prepared powder (urea fuel) can be well indexed to Yttrium Hafnium Oxide (Y2Hf2O7, 00-024-1406) and Yttrium Aluminum Oxide (Y3Al5O12, 01-072-1315). The peaks observed in the other prepared powders (glycine, EDTA, glucose, citric acid fuels) can be well associated with Yttrium Hafnium Oxide (Y2Hf2O7, 00-024-1406) and Yttrium Aluminum Oxide (YAlO3, 01-074-1334). Based on the XRD patterns, the crystalline grain size (D) of the powders with urea, glycine, EDTA, glucose, and citric acid as fuels were calculated as 20.5, 6.6, 7.8, 7.2, and 7.2 nm, respectively, utilizing the Scherrer equation (Equation (7)) [42].
D = K λ β cos θ
Some investigations have demonstrated that YAG precursors can create intermediary phases such as YAlO3 (YAP) and Y4Al2O9 (YAM) during the calcination process before transforming into the YAG phase via particular processes. It has also been found that increasing the calcination temperature can increase the content of the YAG phase while reducing the content of the YAP phase. When the temperature is raised to 1200 °C, pure-phase YAG powder can be obtained [43,44]. Based on the above literature and the XRD patterns (Figure 4 and Figure 5), it can be concluded that when urea is used as a combustion fuel to synthesize the powder at 450 °C, a considerable amount of heat is generated. This combustion reaction releases significant heat, potentially causing the temperature to exceed 1200 °C. In contrast, the powders synthesized at 450 °C with other fuels were amorphous, indicating that the combustion reactions released significantly less heat compared to urea as a fuel.
Figure 6a–e shows the SEM images of the Y2Hf2O7/YAG powders before and after heat treatment at 1000 °C. Among them, the SEM images after heat treatment are shown within the black boxes. The images show that the powders synthesized using these five types of combustion agents all exhibit the typical porous morphology of powders synthesized by SCS. During the synthesis process, the combustion reaction is rapid and intense, producing a considerable amount of heat and releasing significant amounts of gases such as CO2, H2O, and N2, thereby forming fine porous particles. A comparison of the microstructures before and after heat treatment reveals that the powders manufactured with urea as a combustion agent exhibit no discernible changes. However, when powders are manufactured using the other combustion agents, the agglomerated particles become loose and porous, and the particle size drops dramatically after heat treatment. This is related to the oxidation and release of residual carbon during the heat treatment process, resulting in particle structure change. The EDS data of the powders synthesized with different fuel after heat treatment are shown in Figure 6f–j. The spectra indicate the presence of four elements in all the powders—O, Al, Y, and Hf—with no other impurities detected. Figure 7 shows the high-resolution SEM images and EDS compositional mappings of the powders prepared at 450 °C. The images show that the powders prepared by the solution combustion method have a uniform distribution of elements.
The microstructures and compositional uniformity of the specimens were analyzed by a TEM. The TEM images of the Y2Hf2O7/YAG composite powders synthesized at 450 °C with urea and glycine as fuels are presented in Figure 8a,b. The electron diffraction pattern (Figure 8b attachment) shows a diffuse scattering halo, which is characteristic of typical amorphous materials. This verifies that the composite powder is amorphous, which is supported by the XRD investigation (Figure 4). The EDS mapping images of the powder synthesized using urea at 450 °C (Figure 8c) clearly show that various elements are evenly distributed in the sample. Figure 8d,e show high-resolution TEM images of the powders synthesized using urea and glycine as fuels after heat treatment at 1000 °C. The heat-treated powders exhibit a periodic lattice structure. In the powder using urea as fuel (Figure 8d), the lattice spacings of 0.305 nm and 0.178 nm correspond to the (111) and (220) crystal planes of Yttrium Hafnium Oxide (Y2Hf2O7, 00-024-1406), and the lattice spacings of 0.494 nm and 0.267 nm correspond to the (211) and (420) crystal faces of Yttrium Aluminum Oxide (Y3Al5O12, 01-072-1315), respectively. The lattice spacings of 0.306 nm and 0.259 nm in the powder using glycine as fuel (Figure 8e) closely match the (111) and (200) crystal planes of Yttrium Hafnium Oxide (Y2Hf2O7, 00-024-1406). The lattice spacings of 0.534 nm, 0.311 nm, and 0.270 nm have a strong match with the (002), (100), and (102) crystal planes of Yttrium Aluminum Oxide (YAlO3, 01-074-1334), respectively. The conclusions from the high-resolution TEM images are consistent with the results of the XRD spectra analysis (Figure 5).
The XRD, SEM, and TEM images of the ceramics prepared from the powder obtained with urea as fuel are shown in Figure 9. As shown in Figure 9a, the peaks observed in the ceramics can be accurately indexed to Yttrium Hafnium Oxide (Y2Hf2O7, 00-024-1406) and Yttrium Aluminum Oxide (Y3Al5O12, 01-082-0575). And no diffraction peaks of impurity phases were observed. In Figure 9b, the ceramic grains exhibit excellent crystallization and well-defined grain boundaries. It can also be clearly seen from the figure that the YAG grains (black) and Y2Hf2O7 grains (white) are distributed very uniformly. Figure 9c presents the TEM images of the composite ceramic along with the corresponding EDS data. The EDS images reveal the segregation of elements between different phases. Based on the previous analysis, it is evident that the regions with higher Al contents correspond to YAG-rich areas, while regions with higher Hf contents correspond to Y2Hf2O7-rich areas.

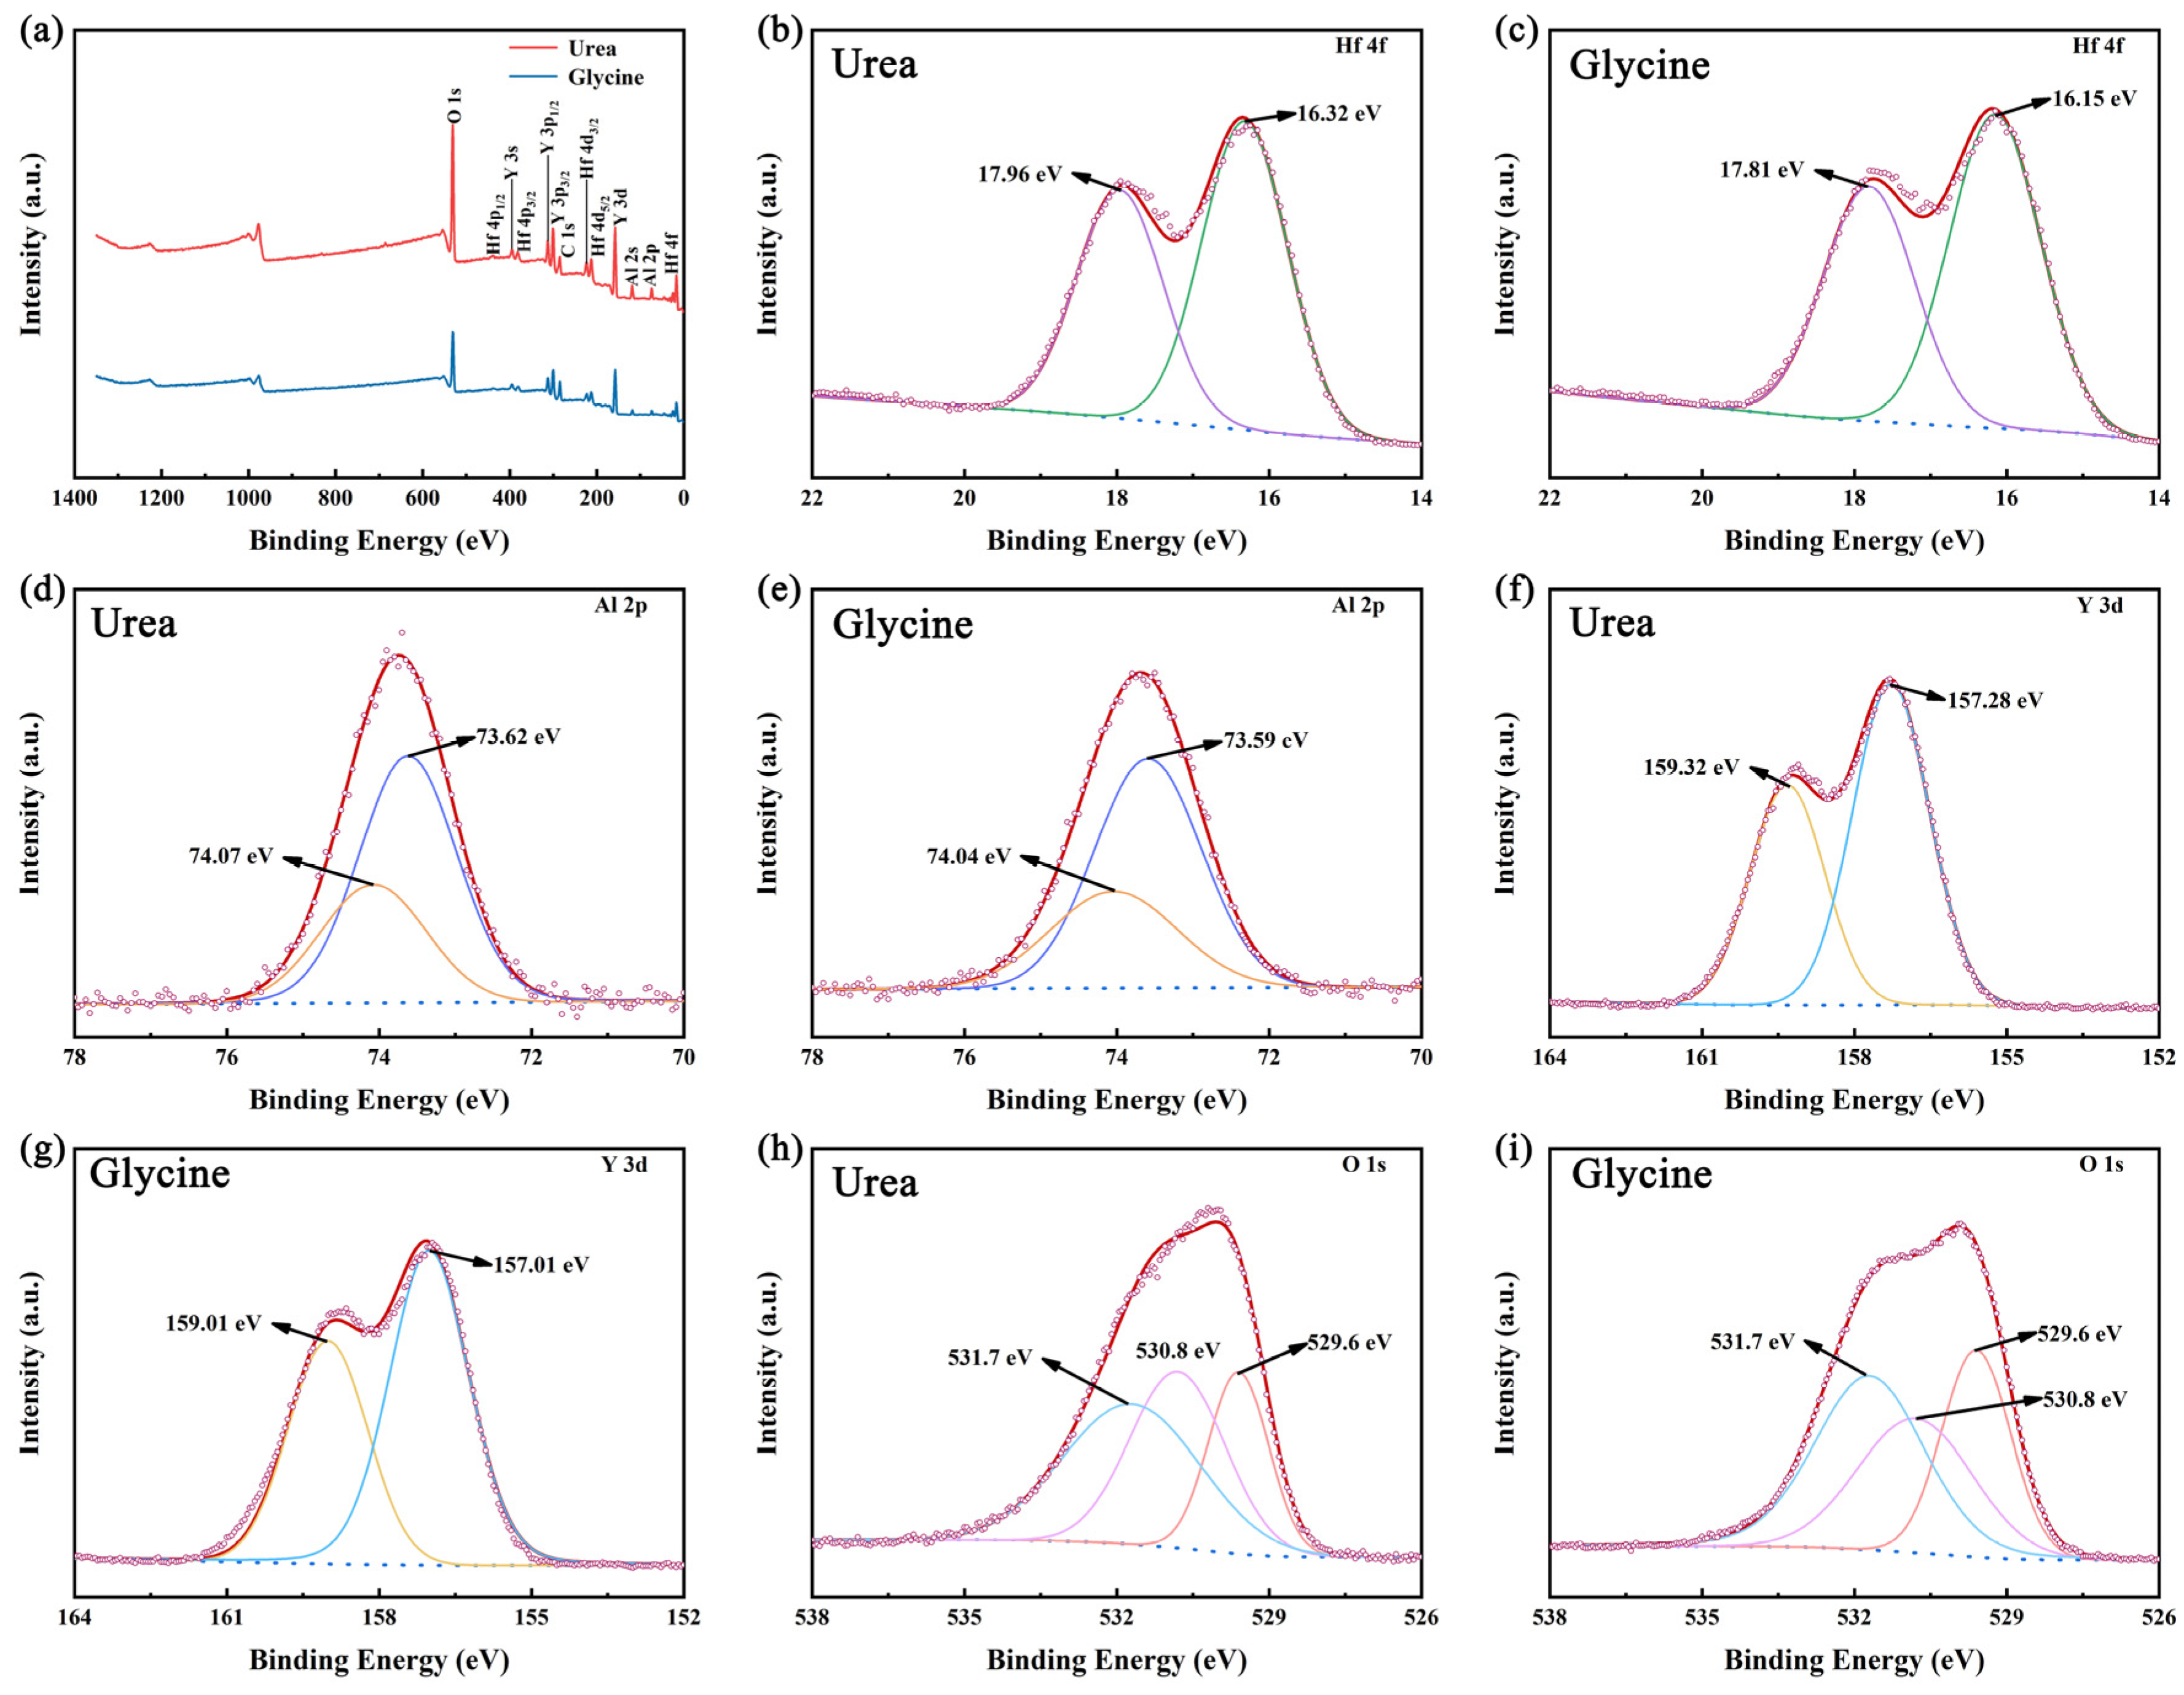
3.4. Analysis of X-Ray Photoelectron Spectroscopy

The chemical compositions of the samples synthesized using urea and glycine at 450 °C after heat treatment at 1000 °C were analyzed with XPS. Figure 10a shows the wide survey scan of the samples. The results show that, in addition to the adventitious carbon, there are four other elements present: Hf, Al, Y, and O. Detailed information on those compounds was obtained after the analysis of the Hf 4f, Al 2p, Y 3d, and O 1s regions (Figure 10b–i).
The XPS spectra of Hf 4f exhibits a double peak due to spin–orbit coupling. The binding energies of Hf 4f7/2 and Hf 4f5/2 for the samples synthesized using urea and glycine as combustion agents are 16.32 eV and 17.96 eV and 16.15 eV and 17.81 eV, respectively. The spin–orbit splitting energy of Hf 4f for both samples is approximately 1.6 eV, and the area ratio of Hf 4f7/2 to Hf 4f5/2 is 4:3. The Hf 4f characteristic peaks of the powders prepared using these two types of fuels are similar to the characteristic peaks of HfO2 [45,46]. The Al 2p spectral line splits into two lines due to the spin–orbit interaction of Al 2p3/2 and Al 2p1/2. The binding energies of the samples synthesized using urea and glycine as combustion agents for Al 2p3/2 and Al 2p1/2 are 73.62 eV and 74.07 eV and 73.59 eV and 74.04 eV, respectively. The splitting energy of both samples is 0.45 eV, and the area ratio of Al 2p3/2 to Al 2p1/2 is 2:1. The Al 2p characteristic peaks of the powders prepared with these two types of combustibles are quite similar to the characteristic peaks of Al2O3 [47]. The Y 3d spectral line splits into two lines due to spin–orbit interaction, namely betwen Y 3d5/2 and Y 3d3/2. The binding energies of the samples synthesized using urea and glycine as combustion agents for Y 3d5/2 and Y 3d3/2 are 157.28 eV and 159.32 eV and 157.01 eV and 159.01 eV, respectively. The area ratio of the split Y 3d5/2 and Y 3d3/2 for the two samples is 3:2, and the characteristic spectral lines are similar to those of Y2O3 [47,48]. The O 1s spectra of the powders prepared using urea and glycine as combustion agents can be deconvoluted into three peaks. Among them, the O 1s peak at 529.6 eV corresponds to the Hf-O bond [49], the O 1s peak at 530.8 eV corresponds to the Al-O bond [50], and the O 1s peak at 531.7 eV corresponds to the Y-O bond [48]. The XPS results of the composite powders synthesized using urea and glycine as fuel are quite similar. YAG and YAP are both bonded by different ratios of Y2O3 and Al2O3. Y2Hf2O7 is a solid solution formed by the incorporation of HfO2 into the lattice of Y2O3. Therefore, characteristic peaks of HfO2, Al2O3, and Y2O3 appeared in the XPS spectra.

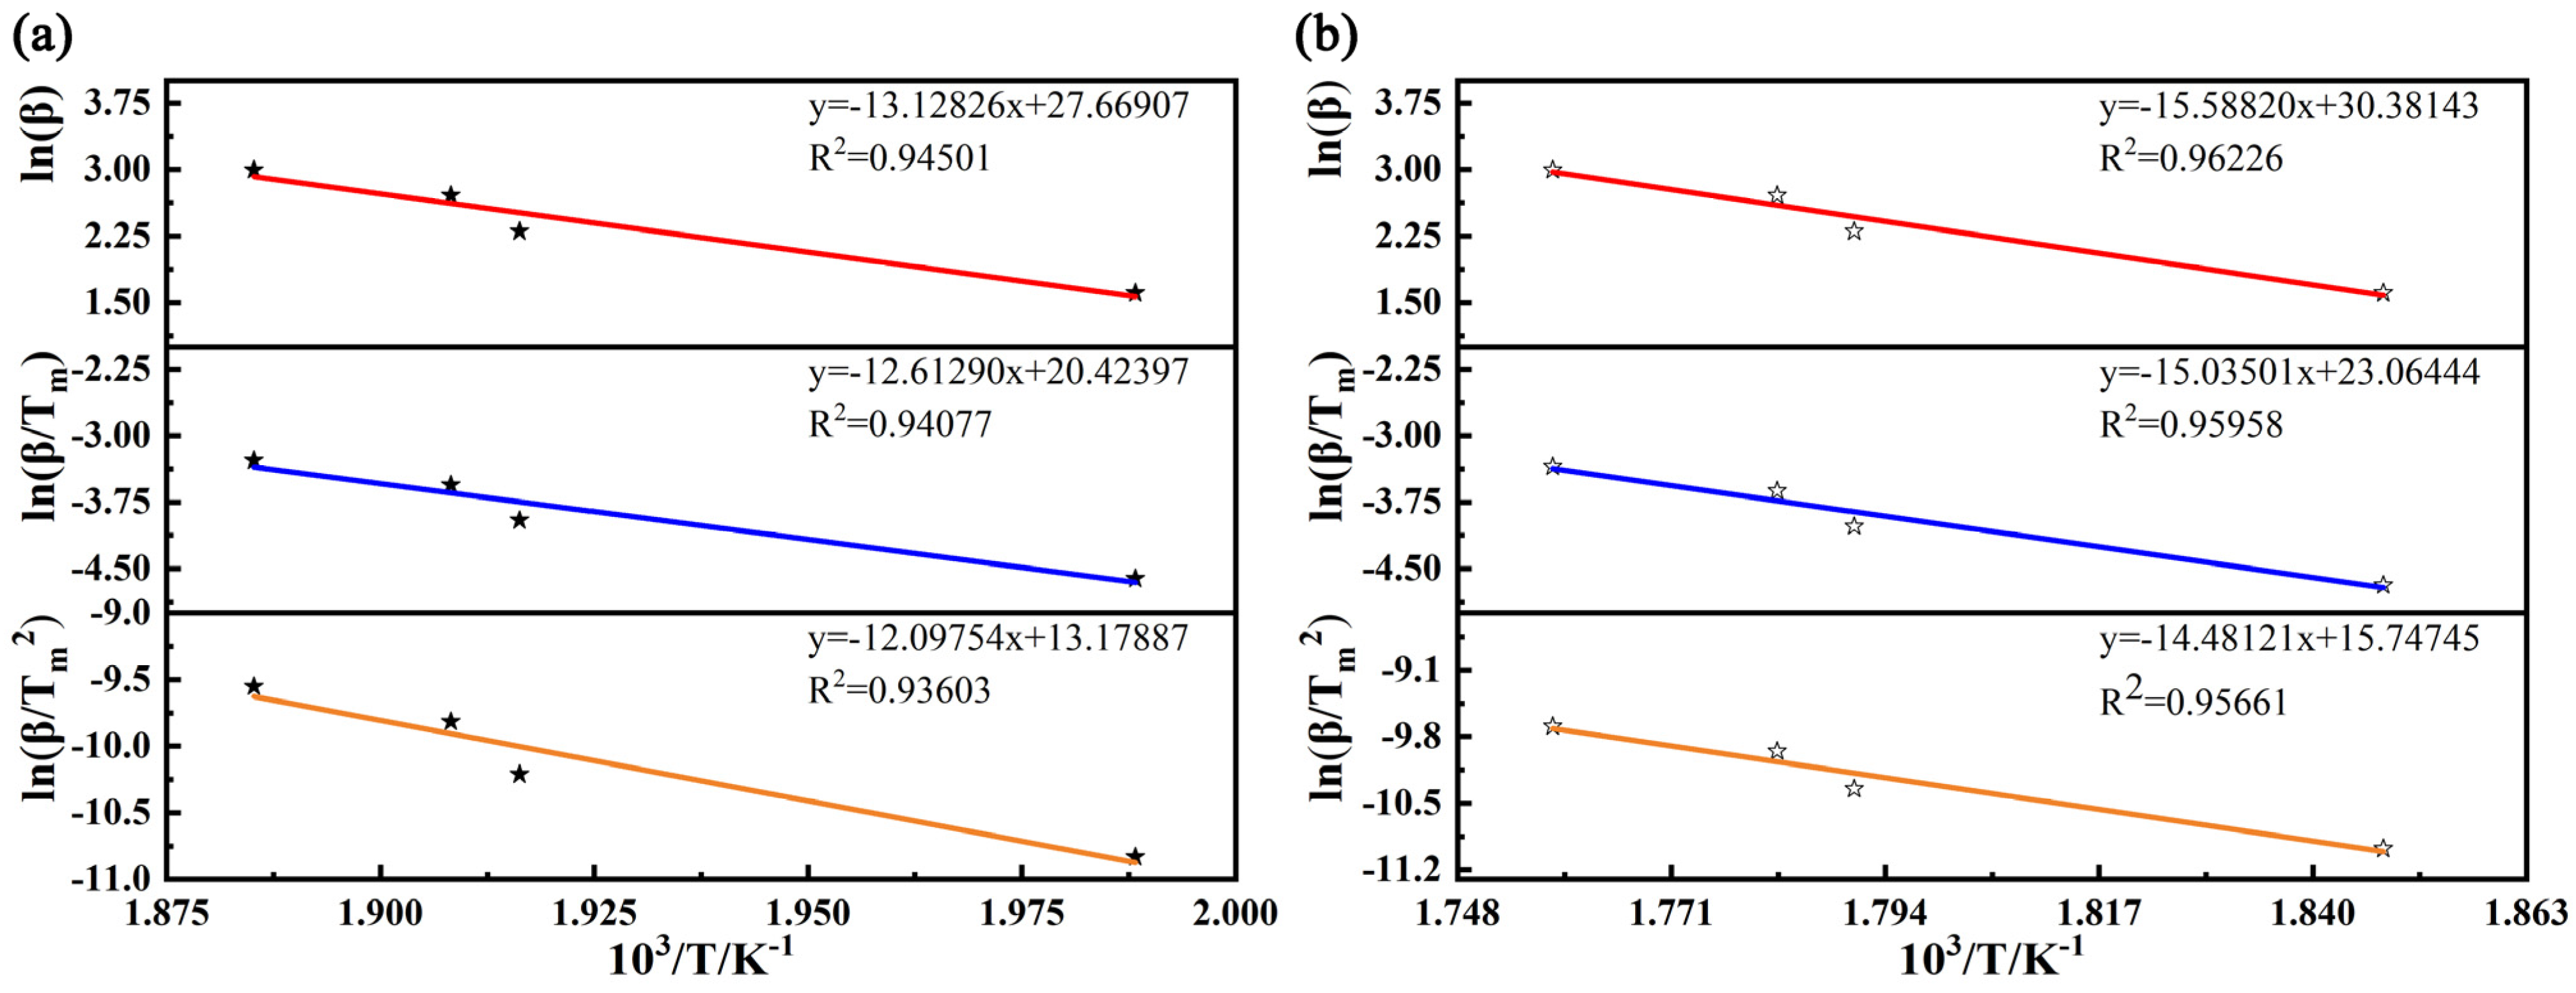
3.5. Determination of Activation Energy

Based on the aforementioned research, it was found that using urea as a combustion agent allows for the synthesis of Y2Hf2O7/YAG composite powders with low impurity contents at relatively low temperatures. Additionally, the two ceramic phases are homogeneously mixed. In order to analyze its chemical reaction mechanism, the activation energy was studied by the thermal analysis method. The precursor synthesized using urea as the combustion agent was subjected to thermal analysis with different linear heating rates of 5, 10, 15, and 20 °C·min−1. Given the strong dependence of the peak temperature on the sample mass, great care was taken to ensure that the same mass of the sample was used in all the experiments.
The DTA curves at different heating rates as a function of temperature are shown in Figure 11. As the heating rate increases, the temperature corresponding to the exothermic peak also rises, causing the entire curve to shift to the right. This phenomenon, known as thermal hysteresis, occurs because the exothermic reaction takes place at higher temperatures when the heating rate is accelerated. Table 1 presents the kinetic characteristics of two exothermic peaks at various heating rates, as calculated from the corresponding graph. The activation energy model variables’ temperature dependency was examined by the use of the Kissinger, Augis and Bennett, and Mahadevan technique, as seen in Figure 12. The activation energy of the two exothermic peaks was determined using the three approaches’ calculation formulas and taking into account the slope of the fitted lines in Figure 12. Table 2 shows a comparison of the data obtained with several kinetic approaches. The activation energies for the first exothermic peak obtained using the Kissinger, Augis and Bennett, and Mahadevan methods are 100.579, 104.864, and 109.148 kJ·mol−1, respectively. For the second exothermic peak, the activation energies are 120.397, 125.001, and 129.600 kJ·mol−1, respectively, using the same methods. The activation energies calculated by the three methods differ. Nevertheless, all three methods indicate that the crystallization activation energies of YAG and Y2Hf2O7 crystals are higher than the activation energy of the combustion reaction in the process of preparing Y2Hf2O7/YAG composite powders with urea as fuel. It can be seen from Figure 2a and Figure 11 that crystal crystallization occurs shortly after the combustion reaction. This may be due to the heat released by the combustion reaction, which raises the ambient temperature and accelerates crystal formation.

4. Conclusions

Y2Hf2O7/YAG composite powders were synthesized using the SCS method with fuels such as urea, glycine, EDTA, glucose, and citric acid. TG-DTA and FTIR analyses were conducted on the precursors. Additionally, we characterized the prepared Y2Hf2O7/YAG composite powders or ceramics using XRD, a SEM, a TEM, and XPS. The powders synthesized with distinct fuels all exhibited the typical porous morphology. The XPS results indicate that the powders prepared using glycine and urea as fuels are HfO2-Al2O3-Y2O3 systems after heat treatment. XRD and TEM analyses reveal that only the powder produced with urea as the fuel forms a composite of Y2Hf2O7 and YAG phases. The powders produced with the other fuels are all made up of Y2Hf2O7 and YAP phases. When urea is used as the fuel, the powdered elements are evenly distributed, the ceramic grains crystallize well, the grain boundaries are clearly defined, and the two phases, YAG and Y2Hf2O7, are uniformly interspersed. Compared to several other combustion agents, urea has been found to be the most effective fuel for synthesizing Y2Hf2O7/YAG composite powders. The TG-DTA curve of the precursor using urea as its combustion agent displays two exothermic peaks. The first peak is likely attributed to the combustion reaction, while the second peak may be linked to the crystallization process. The values of the activation energy for the first exothermic peak calculated using the Kissinger, Augis and Bennett, and Mahadevan methods are 100.579, 104.864, and 109.148 kJ·mol−1, respectively. For the second exothermic peak, the activation energies are 120.397, 125.001, and 129.600 kJ·mol−1, respectively. It is evident that there are differences in the activation energies obtained through these three methods. However, all the methods indicate that the activation energy for the combustion reaction is lower than that required for crystal formation.

Author Contributions

Conceptualization, R.L., S.G., and L.C.; Data Curation, R.L., Q.Z., and L.C.; Formal Analysis, R.L., S.G., Q.Z., and L.C.; Funding Acquisition, S.G., B.X., R.Y., and Y.Z.; Investigation, S.G., Y.G., B.X., Q.Z., R.Y., and Y.Z.; Methodology, R.Y.; Resources, Y.G.; Supervision, Y.G., B.X., Q.Z., and Y.Z.; Visualization, S.G.; Writing—Original Draft, R.L., and S.G.; Writing—Review and Editing, R.L., S.G., Y.G., B.X., R.Y., L.C., and Y.Z. All authors have read and agreed to the published version of the manuscript.

Funding

This work was supported by the National Natural Science Foundation of China (Grant Nos. 52002316), Natural Science Basic Research Program of Shaanxi (2023-JC-QN-0492, 2024JC-YBQN-0571), Xi’an Science and Technology Bureau (23GXFW0088), and open access funding provided by XUPT.

Institutional Review Board Statement

Not applicable.

Informed Consent Statement

Not applicable.

Data Availability Statement

Data are contained within the article.

Conflicts of Interest

The authors declare that they have no known competing financial interests or personal relationships that could have appeared to influence the work reported in this paper.

References

  1. Zhang, H.; Chen, Y.; Li, L.; Yang, D.; Liu, X.; Huang, A.; Zhang, X.; Lu, J.; Zhao, X. Unraveling the CMAS corrosion mechanism of APS high-yttria-stabilized zirconia thermal barrier coatings. J. Eur. Ceram. Soc. 2024, 44, 5154–5165. [Google Scholar] [CrossRef]
  2. Liu, Z.; Shen, Z.; Liu, G.; He, L.; Mu, R.; Xu, Z. Sm-doped Gd2Zr2O7 thermal barrier coatings: Thermal expansion coefficient, structure and failure. Vacuum 2021, 190, 110314. [Google Scholar] [CrossRef]
  3. Yu, B.; Shen, Z.; Luo, Y.; Liu, G.; Mu, R.; He, L. Effects of A site content on the phase structure and thermal property of (La1−xGdx)2Zr2O7 ceramics. Ceram. Int. 2024, 51, 8192–8196. [Google Scholar] [CrossRef]
  4. Wu, J.; Wang, H.; Xu, J.; Liu, Y.; Feng, X.; Fan, F.; Wang, X.; Gao, F. Enhanced thermophysical and mechanical properties of gadolinium zirconate ceramics via non-stoichiometric design. J. Eur. Ceram. Soc. 2024, 44, 116790. [Google Scholar] [CrossRef]
  5. Kutty, K.G.; Rajagopalan, S.; Mathews, C.; Varadaraju, U. Thermal expansion behaviour of some rare earth oxide pyrochlores. Mater. Res. Bull. 1994, 29, 759–766. [Google Scholar] [CrossRef]
  6. Zhong, D.; Quansheng, W.; Zhuang, M.; Yunkai, L.; Yanbo, L. Thermal property of Y2Hf2O7 ceramic for thermal barrier coatings. Rare Met. Mater. Eng. 2011, 40, 268–270. [Google Scholar]
  7. Liao, Y.K.; Jiang, D.Y.; Ji, Y.M.; Shi, J.L. Combustion synthesis of nanosized Y2Hf2O7 and Lu2Hf2O7 powders. Key Eng. Mater. 2004, 280, 643–646. [Google Scholar]
  8. Gu, S.; Zhang, S.; Liu, F.; Li, W. New anti-ablation candidate for carbon/carbon composites: Preparation, composition and ablation behavior of Y2Hf2O7 coating under an oxyacetylene torch. J. Eur. Ceram. Soc. 2018, 38, 5082–5091. [Google Scholar] [CrossRef]
  9. Gu, S.; Zhang, S.; Liu, F.; Liang, Y.; Li, W. Microstructure and thermal shock performance of Y2Hf2O7 coating deposited on SiC coated C/C composite. Appl. Surf. Sci. 2018, 455, 849–855. [Google Scholar] [CrossRef]
  10. Corman, G. Creep of yttrium aluminium garnet single crystals. J. Mater. Sci. Lett. 1993, 12, 379–382. [Google Scholar] [CrossRef]
  11. Li, J.; Liu, W.; Jiang, B.; Zhou, J.; Zhang, W.; Wang, L.; Shen, Y.; Pan, Y.; Guo, J. Synthesis of nanocrystalline yttria powder and fabrication of Cr, Nd: YAG transparent ceramics. J. Alloys Compd. 2012, 515, 49–56. [Google Scholar] [CrossRef]
  12. Bučevac, D.; Omerašević, M.; Egelja, A.; Radovanović, Ž.; Kljajević, L.; Nenadović, S.; Krstić, V. Effect of YAG content on creep resistance and mechanical properties of Al2O3-YAG composite. Ceram. Int. 2020, 46, 15998–16007. [Google Scholar] [CrossRef]
  13. He, L.; Cao, S.; Li, W.; Dong, Q.; Sun, W. YAG/Al2O3/ZrO2 composite fibers of core-shell structure prepared by electrospinning. J. Asian Ceram. Soc. 2021, 9, 1046–1054. [Google Scholar] [CrossRef]
  14. Hassanzadeh-Tabrizi, S.; Taheri-Nassaj, E.; Sarpoolaky, H. Synthesis of an alumina–YAG nanopowder via sol–gel method. J. Alloys Compd. 2008, 456, 282–285. [Google Scholar] [CrossRef]
  15. Varma, A.; Mukasyan, A.S.; Rogachev, A.S.; Manukyan, K.V. Solution combustion synthesis of nanoscale materials. Chem. Rev. 2016, 116, 14493–14586. [Google Scholar] [CrossRef] [PubMed]
  16. Deshpande, K.; Mukasyan, A.; Varma, A. Direct synthesis of iron oxide nanopowders by the combustion approach: Reaction mechanism and properties. Chem. Mater. 2004, 16, 4896–4904. [Google Scholar] [CrossRef]
  17. Nersisyan, H.H.; Lee, J.H.; Ding, J.-R.; Kim, K.-S.; Manukyan, K.V.; Mukasyan, A.S. Combustion synthesis of zero-, one-, two-and three-dimensional nanostructures: Current trends and future perspectives. Prog. Energy Combust. Sci. 2017, 63, 79–118. [Google Scholar] [CrossRef]
  18. Sa-nguanprang, S.; Phuruangrat, A.; Thongtem, T.; Thongtem, S. Synthesis of ZnO nanoparticles by tartaric acid solution combustion and their photocatalytic properties. Russ. J. Inorg. Chem. 2020, 65, 1102–1110. [Google Scholar] [CrossRef]
  19. Marand, N.A.; Masoudpanah, S.; Bafghi, M.S. Solution combustion synthesis of nickel sulfide composite powders. Ceram. Int. 2018, 44, 17277–17282. [Google Scholar] [CrossRef]
  20. Kondo, A.; Kozawa, T.; Ishikawa, T.; Naito, M. Rapid synthesis of YAG phosphor by facile mechanical method. Int. J. Appl. Ceram. Technol. 2021, 19, 681–687. [Google Scholar] [CrossRef]
  21. Vallejos, S.; Di Maggio, F.; Shujah, T.; Blackman, C. Chemical vapour deposition of gas sensitive metal oxides. Chemosensors 2016, 4, 4. [Google Scholar] [CrossRef]
  22. Yang, J.; Li, J.; Kang, J.; Liu, W.; Kuang, Y.; Tan, H.; Yu, Z.; Yang, L.; Yang, X.; Yu, K. Preparation of Ce-MnOx Composite Oxides via Coprecipitation and Their Catalytic Performance for CO Oxidation. Nanomaterials 2023, 13, 2158. [Google Scholar] [CrossRef]
  23. Sherikar, B.N.; Sahoo, B.; Umarji, A.M. Effect of fuel and fuel to oxidizer ratio in solution combustion synthesis of nanoceramic powders: MgO, CaO and ZnO. Solid State Sci. 2020, 109, 106426. [Google Scholar] [CrossRef]
  24. Sangeetha, A.; Ambli, A.; Nagabhushana, B.; Murugendrappa, M. Green color emitting pure cubic zirconia nano phosphor synthesized by solution combustion technique. J. Nanoparticle Res. 2024, 26, 18. [Google Scholar] [CrossRef]
  25. Heleena, M.; Kumar, S.S.; Balaji, N.; Aruna, S.T. Solution combustion synthesized micron sized yttrium aluminum garnet (Y3Al5O12) powder: A promising feedstock source for plasma spraying. Ceram. Int. 2022, 48, 35740–35749. [Google Scholar] [CrossRef]
  26. Amirkhanyan, N.; Kharatyan, S.; Manukyan, K.; Aprahamian, A. Thermodynamics and kinetics of solution combustion synthesis: Ni(NO3)2+fuels systems. Combust. Flame 2020, 221, 110–119. [Google Scholar] [CrossRef]
  27. Kumar, A.; Wolf, E.; Mukasyan, A. Solution combustion synthesis of metal nanopowders: Nickel—Reaction pathways. Am. Inst. Chem. Eng. J. 2011, 57, 2207–2214. [Google Scholar] [CrossRef]
  28. Vyazovkin, S.; Popescu, C. Notes on workshop on kinetics/ESTAC-10, Rotterdam. J. Therm. Anal. Calorim. 2011, 105, 931. [Google Scholar] [CrossRef]
  29. Budrugeac, P. On the use of oxidative stability measurements for short-term thermal endurance characterization of polymeric materials. Polym. Degrad. Stab. 2000, 68, 289–293. [Google Scholar] [CrossRef]
  30. Bamford, C.H.; Tipper, C.F.H.; Compton, R.G. Comprehensive Chemical Kinetics; Elsevier: Amsterdam, The Netherlands, 1969. [Google Scholar]
  31. Kissinger, H.E. Reaction kinetics in differential thermal analysis. Anal. Chem. 1957, 29, 1702–1706. [Google Scholar] [CrossRef]
  32. Augis, J.; Bennett, J. Calculation of the Avrami parameters for heterogeneous solid state reactions using a modification of the Kissinger method. J. Therm. Anal. Calorim. 1978, 13, 283–292. [Google Scholar] [CrossRef]
  33. Mahadevan, S.; Giridhar, A.; Singh, A. Calorimetric measurements on as-sb-se glasses. J. Non-Crystalline Solids 1986, 88, 11–34. [Google Scholar] [CrossRef]
  34. Jain, D.; Sudarsan, V.; Patra, A.K.; Sastry, P.U.; Tyagi, A.K. Effect of local ordering around Th4+ ions in glycine-nitrate precursor gel on the powder characteristic of gel-combusted ThO2. J. Nucl. Mater. 2019, 527, 151826. [Google Scholar] [CrossRef]
  35. Subohi, O.; Shastri, L.; Kumar, G.S.; Malik, M.M.; Kurchania, R. Study of Maxwell–Wagner (M–W) relaxation behavior and hysteresis observed in bismuth titanate layered structure obtained by solution combustion synthesis using dextrose as fuel. Mater. Res. Bull. 2014, 49, 651–656. [Google Scholar] [CrossRef]
  36. Liu, W.; Liu, X.; Zhang, P.; Wang, Z.; Li, X.; Hu, M. Nano-sized plate-like alumina synthesis via solution combustion. Ceram. Int. 2019, 45, 9919–9925. [Google Scholar] [CrossRef]
  37. Rabbani, M.; Rahimi, R.; Ghadi, H.F. Photocatalytic application of BiFeO3 synthesized via a facile microwave-assisted solution combustion method. J. Sol-Gel Sci. Technol. 2018, 87, 340–346. [Google Scholar] [CrossRef]
  38. Golsheikh, M.M.; Arabi, A.M.; Afarani, M.S. Microwave assisted combustion synthesis of photolumiescent ZnAl2O4: Eu nano powders. Mater. Res. Express 2019, 6, 125052. [Google Scholar] [CrossRef]
  39. Terpugov, E.L.; Kondratyev, M.S.; Degtyareva, O.V. Light-induced effects in glycine aqueous solution studied by Fourier transform infrared-emission spectroscopy and ultraviolet-visible spectroscopy. J. Biomol. Struct. Dyn. 2020, 39, 108–117. [Google Scholar] [CrossRef]
  40. Grdadolnik, J.; Maréchal, Y. Urea and urea–water solutions—An infrared study. J. Mol. Struct. 2002, 615, 177–189. [Google Scholar] [CrossRef]
  41. Keuleers, R.; Desseyn, H.; Rousseau, B.; Van Alsenoy, C. Vibrational analysis of urea. J. Phys. Chem. A 1999, 103, 4621–4630. [Google Scholar] [CrossRef]
  42. Shang, Z.; Yu, Y.; Yang, H.; Yang, Z.; Xiao, Y.; Wang, X. One-step solution combustion synthesis of micro-nano-scale porous Cu/CeO2 with enhanced photocatalytic properties. J. Rare Earths 2023, 41, 250–258. [Google Scholar] [CrossRef]
  43. Tachiwaki, T.; Yoshinaka, M.; Hirota, K.; Ikegami, T.; Yamaguchi, O. Novel synthesis of Y3Al5O12 (YAG) leading to transparent ceramics. Solid State Commun. 2001, 119, 603–606. [Google Scholar] [CrossRef]
  44. Li, J.-G.; Lee, J.-H.; Mori, T.; Yajima, Y.; Takenouchi, S.; Ikegami, T. Crystal phase and sinterability of wet-chemically derived YAG powders. J. Ceram. Soc. Jpn. 2000, 108, 439–444. [Google Scholar] [CrossRef]
  45. Renault, O.; Samour, D.; Damlencourt, J.-F.; Blin, D.; Martin, F.; Marthon, S.; Barrett, N.; Besson, P. HfO2/SiO2 interface chemistry studied by synchrotron radiation X-ray photoelectron spectroscopy. Appl. Phys. Lett. 2002, 81, 3627–3629. [Google Scholar] [CrossRef]
  46. Wang, X.; Zhou, D.; Li, S.; Liu, X.; Zhao, P.; Sun, N.; Ali, F.; Wang, J. Ferroelectric yttrium doped hafnium oxide films from all-inorganic aqueous precursor solution. Ceram. Int. 2018, 44, 13867–13872. [Google Scholar] [CrossRef]
  47. Talik, E.; Kruczek, M.; Zarek, W.; Kusz, J.; Wójcik, K.; Sakowska, H.; Szyrski, W. XPS characterization of YAlO3: Co single crystals. Cryst. Res. Technol. J. Exp. Ind. Crystallogr. 2007, 42, 1341–1347. [Google Scholar] [CrossRef]
  48. Lee, J.-S.; Kim, W.-H.; Oh, I.-K.; Kim, M.-K.; Lee, G.; Lee, C.-W.; Park, J.; Lansalot-Matras, C.; Noh, W.; Kim, H. Atomic layer deposition of Y2O3 and yttrium-doped HfO2 using a newly synthesized Y(iPrCp)2(N-iPr-amd) precursor for a high permittivity gate dielectric. Appl. Surf. Sci. 2014, 297, 16–21. [Google Scholar] [CrossRef]
  49. Tang, L.; Maruyama, H.; Han, T.; Nino, J.C.; Chen, Y.; Zhang, D. Resistive switching in atomic layer deposited HfO2/ZrO2 nanolayer stacks. Appl. Surf. Sci. 2020, 515, 146015. [Google Scholar] [CrossRef]
  50. Kainbayev, N.; Sriubas, M.; Bockute, K.; Virbukas, D.; Laukaitis, G. E-beam deposition of scandia-stabilized zirconia (ScSZ) thin films co-doped with Al. Coatings 2020, 10, 870. [Google Scholar] [CrossRef]
Figure 1. Visual representation of powders obtained from combustion using distinct combustion agents at 450 °C. (a,b) Urea, (c) glycine, (d) EDTA, (e) glucose, and (f) citric acid.
Coatings 15 00470 g001
Figure 2. Thermal analysis curves of precursors synthesized with distinct combustion agents. (ae) TG-DTA curves using urea, glycine, EDTA, glucose, and citric acid as combustion agents, respectively, and (f) TG curves using urea, glycine, EDTA, glucose, and citric acid as combustion agents.
Coatings 15 00470 g002
Figure 3. FTIR spectra of precursors prepared with distinct combustion agents.
Coatings 15 00470 g003
Figure 4. XRD patterns of precursor with urea and as-synthesized samples prepared with distinct combustion agents at 450 °C.
Coatings 15 00470 g004
Figure 5. XRD patterns of samples obtained with different fuels after heat treatment at 1000 °C for 2 h.
Coatings 15 00470 g005
Figure 6. SEM images and EDS data of Y2Hf2O7/YAG powders. (a,f) Urea; (b,g) glycine; (c,h) EDTA; (d,i) glucose; (e,j) citric acid. (ae) Before (main) and after (inset, black border) heat treatment. (fj) EDS spectra of blue squares in (ae).
Coatings 15 00470 g006
Figure 7. SEM images and EDS compositional mappings of powders before heat treatment. (a,b) Urea and (c) glucose.
Coatings 15 00470 g007
Figure 8. TEM images of Y2Hf2O7/YAG powders and EDS compositional mappings with urea and glycine. (a,c,d) Urea; (b,e) glycine; (ac) before heat treatment; (d,e) after heat treatment.
Coatings 15 00470 g008
Figure 9. XRD (a), SEM (b), and TEM (c) images of Y2Hf2O7/YAG ceramics from powder obtained with urea as fuel.
Coatings 15 00470 g009
Figure 10. XPS spectra of samples synthesized using urea and glycine after heat treatment at 1000 °C. (b,d,f,h) Urea; (c,e,g,i) glycine; (a) survey; (b,c) Hf 4f; (d,e) Al 2p; (f,g) Y 3d; and (h,i) O 1s.
Coatings 15 00470 g010
Figure 11. The DTA curves with different heating rates as functions of temperature.
Coatings 15 00470 g011
Figure 12. Temperature dependence of model variables pertaining to activation energy found by using Kissinger, Augis and Bennett, and Mahadevan methods. (a) Peak1 and (b) Peak2.
Coatings 15 00470 g012
Table 1. The kinetic parameters of the two endothermic peaks under different heating rates.
β
(K·min−1)
Tm
(K)
1/Tm
(10−3·K−1)
ln(β/Tm2)ln(β/Tm)ln(β)
Peak15502.951.988−10.832−4.6111.609
10521.851.916−10.212−3.9552.303
15524.051.908−9.815−3.5542.708
20530.451.885−9.552−3.2782.996
Peak25541.251.848−10.978−4.6841.609
10558.451.791−10.348−4.0232.303
15561.051.782−9.952−3.6222.708
20568.751.758−9.691−3.3482.996
Table 2. A comparison of the results obtained from different methods of dynamic analysis.
MethodsE1/(kJ·mol−1)E2/(kJ·mol−1)
Kissinger100.579120.397
Augis and Bennett104.864125.001
Mahadevan109.148129.600
Disclaimer/Publisher’s Note: The statements, opinions and data contained in all publications are solely those of the individual author(s) and contributor(s) and not of MDPI and/or the editor(s). MDPI and/or the editor(s) disclaim responsibility for any injury to people or property resulting from any ideas, methods, instructions or products referred to in the content.

