Article

Study of Gd2O3-Doped La2(Zr0.7Ce0.3)2O7 Thermal Barriers for Coating Ceramic Materials for CMAS Resistance

1
School of Rare Earth Industry, Inner Mongolia University of Science and Technology, Baotou 014020, China
2
Inner Mongolia Key Laboratory of Advanced Ceramic Material and Devices, Inner Mongolia University of Science and Technology, Baotou 014010, China
3
Key Laboratory of Green Extraction & Efficient Utilization of Light Rare-Earth Resources, Inner Mongolia University of Science and Technology, Ministry of Education, Baotou 014010, China
4
School of Materials Science and Engineering, Inner Mongolia University of Science and Technology, Baotou 014010, China
5
Beijing Aeronautical Materials Research Institute, Beijing 100095, China
*
Authors to whom correspondence should be addressed.
Coatings 2025, 15(4), 483; https://doi.org/10.3390/coatings15040483
Submission received: 21 March 2025 / Revised: 28 March 2025 / Accepted: 3 April 2025 / Published: 18 April 2025
(This article belongs to the Section Corrosion, Wear and Erosion)

Abstract

:
The stability of thermal barrier coating (TBC) materials during service is a prerequisite for the normal operation of aircraft engines. The high-temperature corrosion of CaO–MgO–Al2O3–SiO2 (CMAS) is an important factor that affects the stability of TBCs on turbine blades and causes premature engine failure. For traditional 6-8 YSZ, at temperatures of more than 1200 °C, the thermal insulation performance is significantly reduced, which makes it necessary to find new, alternative materials. La2Zr2O7 has good thermal physical properties; the addition of Ce4+ improves its mechanical properties, while adding Gd2O3 affects its corrosion resistance. Herein, high-temperature corrosion studies of (La1−xGdx)2(Zr0.7Ce0.3)2O7 (L-GZC) (x = 0, 0.3, 0.5, 0.7) ceramic TBC were conducted using CMAS glass at 1250 °C. The results indicate that CMAS rapidly dissolves L-GZC and separates the (La, Gd)8Ca2(SiO4)6O2 apatite phase, ZrO2, and other crystalline phases. These products form a crystalline layer at the contact boundary, which can inhibit further CMAS reactions. Among the coatings examined, the L-GZC ceramic (x = 0.7) exhibits better corrosion resistance, and the penetration depth is <200 μm after high-temperature corrosion at 1250 °C for 5, 10, and 20 h. The failure mechanism and potential risk of CMAS were also analyzed and discussed. The L-GZC ceramic material has good thermal corrosion resistance and is expected to replace the traditional YSZ to better meet the high-temperature working requirements of gas turbines and aircraft engines.

Graphical Abstract

1. Introduction

With the upgrading of aviation technology, the development of engines with high thrust to weight ratios has been achieved. Furthermore, a continuous increase in combustion chamber operating temperatures has caused the front-end temperatures of engine turbines to reach the bearing limit of most advanced high-temperature alloys [1,2]. Thermal barrier coatings (TBCs) can effectively and considerably reduce the surface temperature of turbine blades, increase the operating temperature of critical front-end parts, and resist high temperatures and corrosion. Consequently, the engine’s service life and efficiency are improved and energy loss is reduced [3,4,5].
Currently, in traditional materials, 6–8 wt% yttrium partially stabilized zirconia (YSZ) is widely used in TBCs owing to its low thermal conductivity and thermal expansion rate [6,7]. However, the long-term use of YSZ coatings at high temperatures can lead to their premature failure. At temperatures > 1200 °C, these coatings encounter issues such as high-temperature phase transformation and sintering [8,9]. To address these issues, oxide ceramics with low thermal conductivity and high thermal stability and corrosion resistance, such as zirconates [10], silicates [11] and perovskites [12], are used as alternatives. The corrosion at high temperatures of environmental sediments, such as calcium magnesium aluminum silicon (CaO–MgO–Al2O3–SiO2, CMAS), has a significant effect on the service life of TBCs, and this issue has attracted increasing attention from scholars. Large particles around the turbine air inlet can be filtered; however, small particles, such as dust, sand and volcanic ash, accumulate around the air inlet, transforming into molten glass as the temperature increases. When the temperature exceeds 1200 °C, surface adsorbates penetrate the coating surface of the engine components, such as the inlet duct, forming a CMAS flowing melt [13]. This melt then penetrates the ceramics via the capillary action and rapidly solidifies during cooling. Therefore, pores and microcracks in ceramics are filled with solid CMAS, destroying its porous structure, reducing internal stress, and shortening the service life. In addition, CMAS reacts with TBCs to form products such as apatite and ZrO2, decreasing its strain tolerance. As glass and ceramics have different coefficients of thermal expansion, a mismatch in thermal stress is created, which affects the widespread use of TBCs.
Among the materials replacing traditional TBC, La2(Zr0.7Ce0.3)2O7(LZC) ceramics are considered potential candidates due to their high anti-sintering properties, low thermal conductivity, and high thermal expansion coefficient (TEC). LZC coatings do not shrink even after heating at 1400 °C for 15 h, showing good sintering resistance. LZ7C3 ceramics were also shown not to undergo phase changes after 144 h of long-term annealing at 1300 °C, and their thermal conductivity and TEC were about 0.87 W/(m·K) and 10.66 × 10⁻⁶ K−1, respectively [14,15,16]. Cao et al. [17] found that, for La2(Zr1−xCex)2O7(LZC) ceramic materials, when x = 0.3, LZC has a stable pyrochite structure, higher sintering resistance, good phase stability, and a higher thermal expansion coefficient than 6-8YSZ, and it has been initially applied to aircraft engines. Gd2Zr2O7 (GZ) exhibits good thermal stability, low thermal conductivity (k~1.6 W/mK), and high operating temperatures [18]. Schulz [19] compared the corrosion depth of the La2Zr2O7 (LZ) and GZ coatings, revealing that the corrosion depth of LZ (~100 μm) is slightly higher than that of GZ. Cheng [20] discussed the La2Zr2O7 LZ/YSZ composite double ceramic layer and found that 5YSZ/LZ TBCs have a long lifespan of over 2200 cycles. Wright [21] proposed that different concentrations of cubic-phase stabilizers and the optical basicity can affect the grain-boundary corrosion behavior of CMAS. Bahamirian [22] found that, compared with conventional YSZ, Gd8Ca2 (SiO4)6 formed by the reaction of GZ with CMAS can effectively inhibit the penetration of CMAS particles and improve the corrosion resistance of TBCs. Herein, Gd2O3 was doped into La2 (Zr0.7Ce0.3)2O7 (LZC) to improve its corrosion resistance, and the corrosion degree was compared at 1250 °C for 5, 10, and 20 h. Scanning electron microscopy (SEM) and energy dispersive X-ray spectroscopy (EDS) analyses were performed to further determine the corrosion mechanism.

2. Experimental Procedure

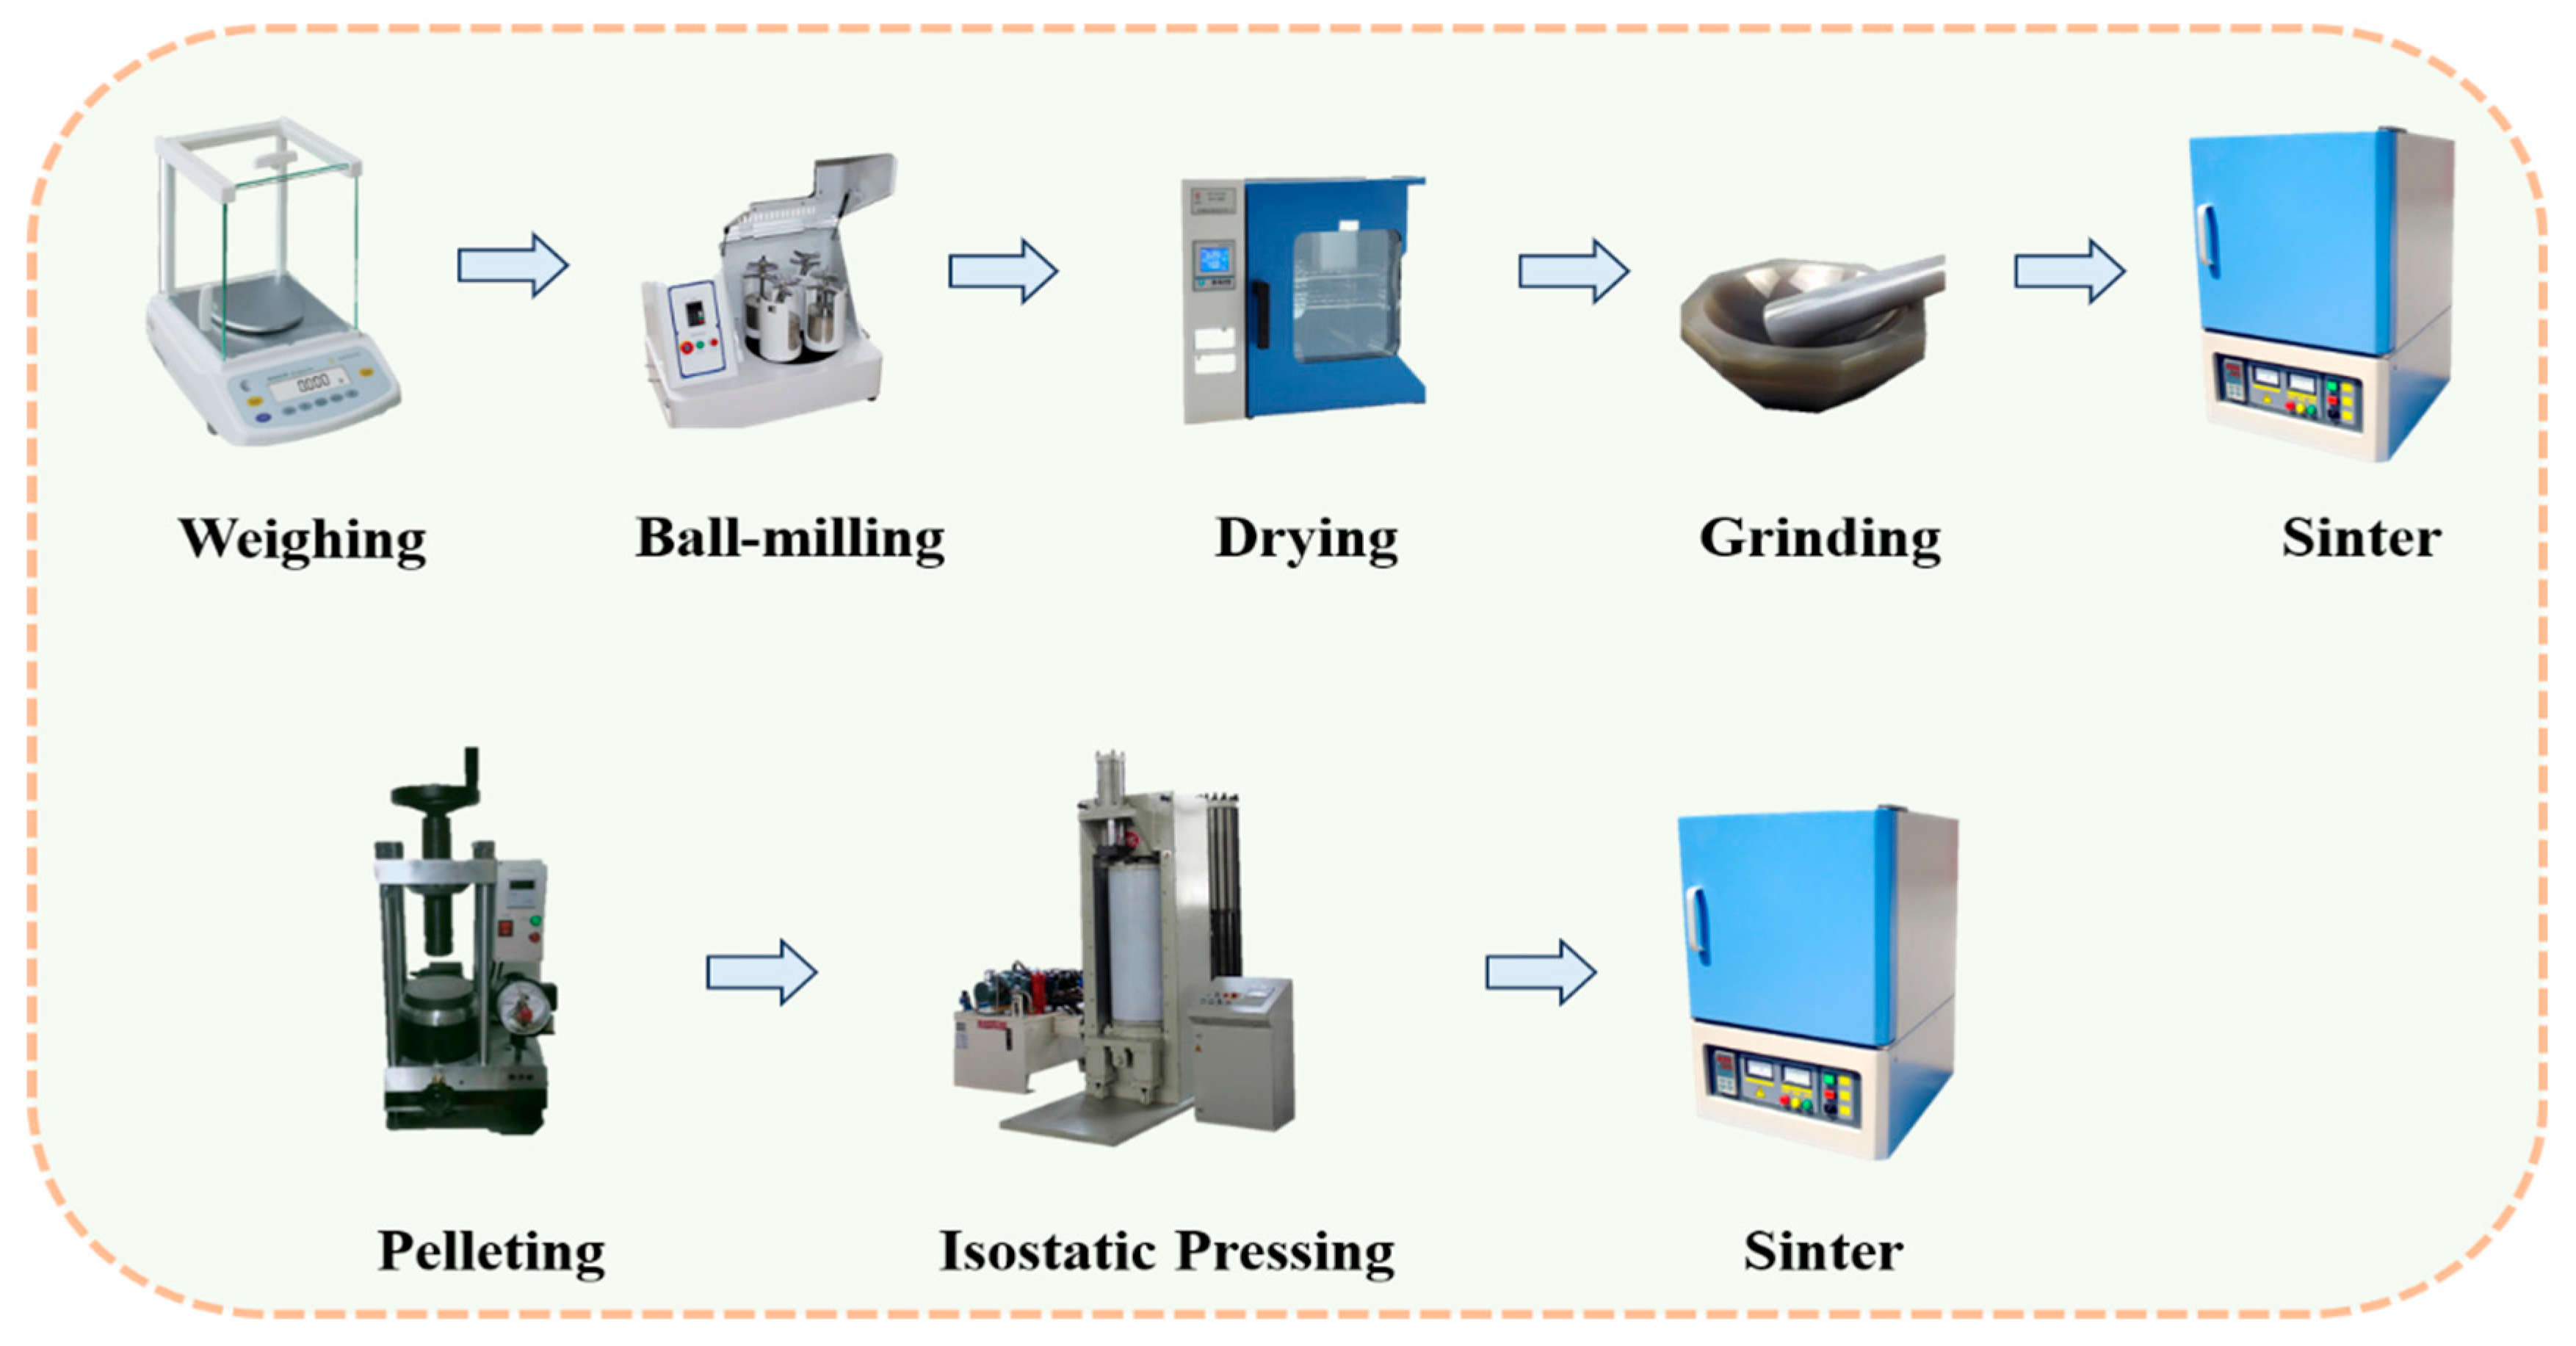
2.1. Sample Preparation

(La1−xGdx)2(Zr0.7Ce0.3)2O7 (L-GZC) (x is the content of Gd2O3) was synthesized using a high-temperature solid-phase method. The raw materials used were La2O3, Gd2O3, CeO2, and ZrO2 (99.9%, Inner Mongolia Baogang Rare-Earth International Trade Co., BaoTou, China) and anhydrous ethanol (analytically pure, Tianjin Yongda Chemical Reagent Co., TianJin, China). These raw materials were ground in a planetary mill (450 rpm) for 24 h and thoroughly mixed in alcohol. The mixed slurry was dried for 24 h and ground. It was then passed through an 80-mesh sieve and calcined in a muffle furnace at 1500 °C for 6 h to obtain L-GZC powder; this powder was ball-milled twice, suppressed into ceramic blocks of 15 mm diameter and 1.5 mm thickness, and passed through the 80-mesh sieve. After vacuum treatment, these blocks were subjected to cold isostatic pressing at 200 MPa. Finally, dense ceramic blocks were obtained via sintering at 1600 °C for 8 h in the muffle furnace. Figure 1 shows the flowchart of the synthesis.

2.2. CMAS Powder Preparation and Ceramic Corrosion

The CMAS powder contained 33% CaO, 6.5% Al2O3, 9% MgO, and 45% SiO2 (C33M9Al13Si45), reflecting the average composition of CMAS in different regions to some extent; its melting point was ~1210 °C. CaO, MgO, Al2O3 and SiO2 (98%, Shanghai Maclin Biochemical Technology Co., Shanghai, China) were used as raw materials and weighed as per the stoichiometric ratio. These were then mixed at 450 rpm for 24 h, followed by drying and calcining at 1500 °C for 1 h. The melted CMAS was then mixed with deionized water and rapidly cooled to form CMAS glass. The glass was subsequently crushed and filtered through the 80-mesh filter. The resulting CMAS powder was used for the subsequent corrosion experiments. Before the hot corrosion test, the area of a small ceramic piece (sample) was calculated using a Vernier caliper, and the required amount of CMAS powder was weighed. The concentration of CMAS was 15 mg/cm2, and the corrosion powder was evenly distributed on the entire surface of the ceramic sample. Ceramic samples coated with the CMAS corrosion powder were subjected to hot corrosion at 1250 °C for 5, 10, and 20 h. The resulting corroded samples were embedded, roughly ground, polished, and treated for structural analysis.

2.3. Characterisation

A microstructural analysis of the corroded ceramic surfaces and cross-sections was performed using SEM (TESCAN AMBER, Warrendale, PA, USA). The operating parameters of SEM are as follows: voltage 10–15 kV and current 60 μA. The corrosion products were characterized via EDS (Genesis XM2, Blue Bell, PA, USA). The EDS analysis was performed on five regions of each sample. The average grain size was calculated using Nano Measure software 1.2 version, and 100–300 grains were selected for the statistical analysis. The phase composition of the surface corrosion products was analyzed via X-ray diffraction (XRD, D8 Advanced, Bruker, Germany) using Cu Kα radiation at a scan range of 20–80° and a scan rate of 5°/min. A Raman spectrometer (LabRAM HR Evolution, Villeneuve-d’Ascq, VdA, France) was used to study the molecular vibrations and structure of the ceramic materials. The laser source was an Nd-YAG laser(Pessac, PC, France) with a wavelength of 532 nm, spot size of 2 μm, standard objective lens magnification ×50, and test range of 100~1000 cm−1. The melting point and glass transition temperature of the synthesized CMAS powder were measured via DSC (NETZSCH STA449C, Selb, Germany). The test temperature was 30–1300 °C, and the heating rate was 10 °C/min.

3. Results and Discussion

3.1. Experimentail Data Characterization

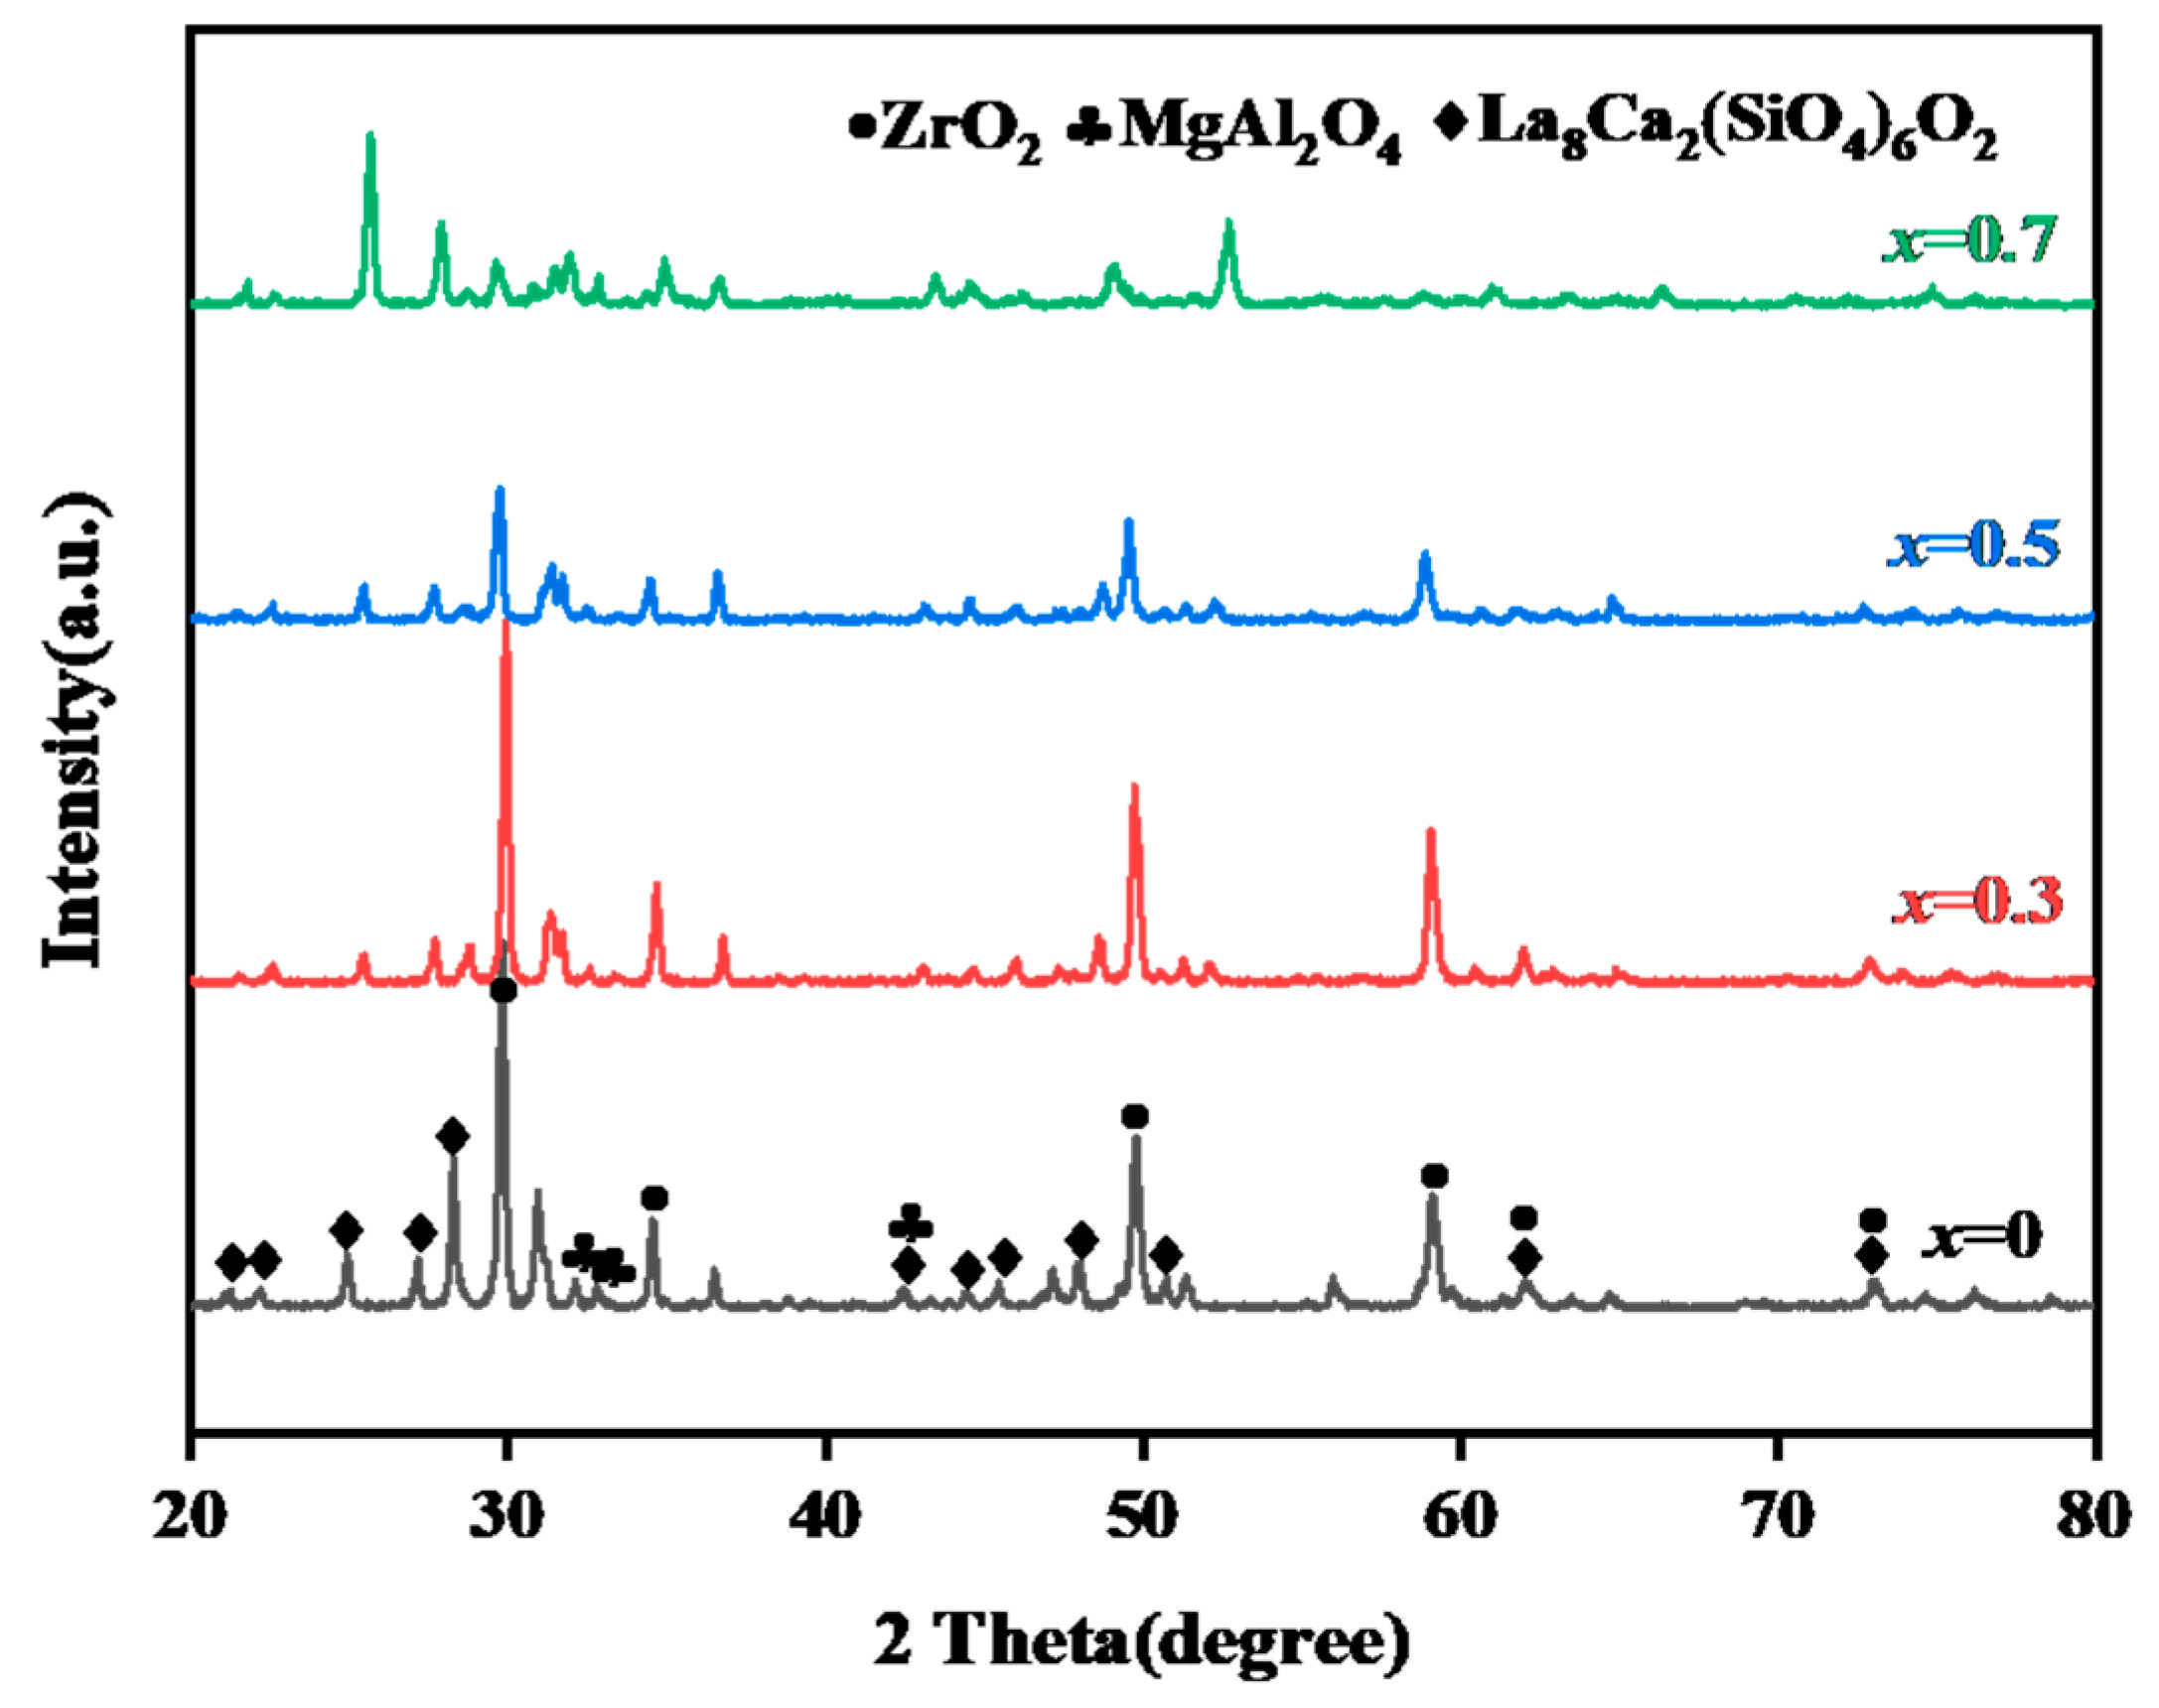
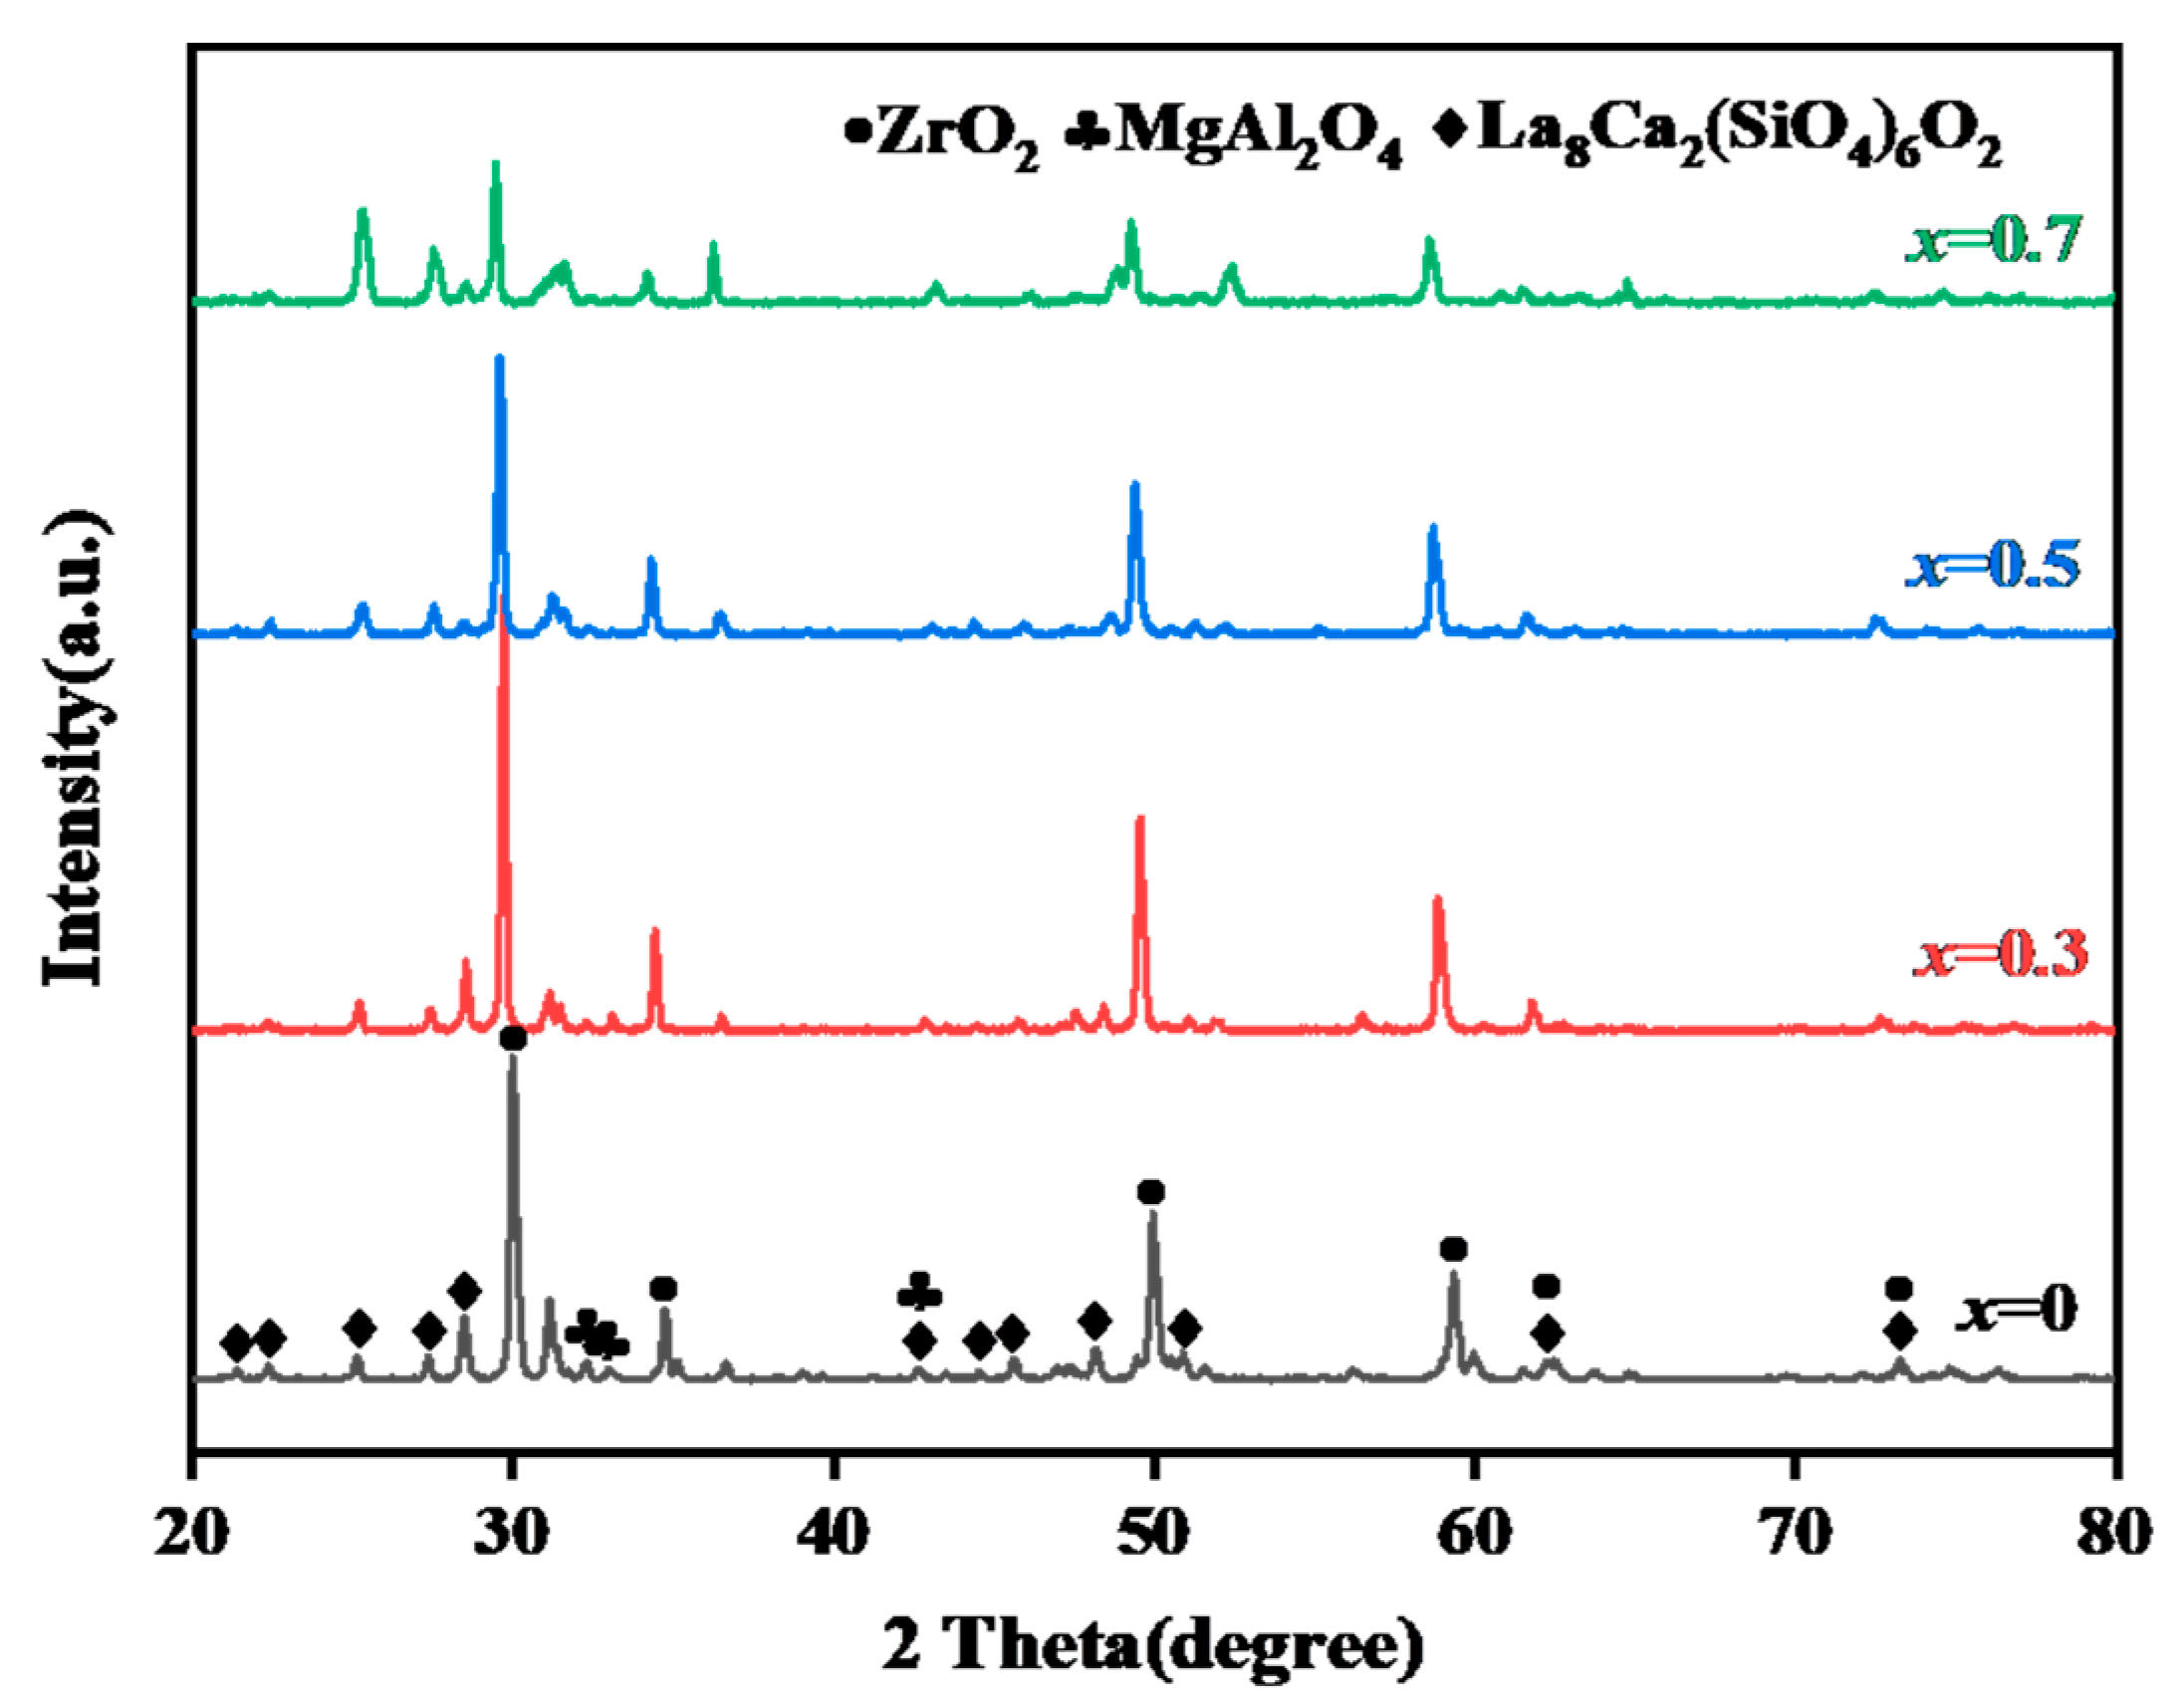
3.1.1. Characterization of Original Sintered Ceramics

Figure 2 shows the phase structure of the sintered, dense L-GZC ceramics. The obtained diffraction peaks show consistency with the standard-card diffraction peak of La2Zr2O7, indicating that the sintered sample has a pyrochlore structure and a tendency to transform into a fluorite structure. Compared with those of LZC, the diffraction peaks of the L-GZC sample exhibits a slight right shift due to Gd3+ having a smaller radius (r = 93.8 pm) than La3+ (r = 106.1 pm), which reduces the crystal surface spacing and lattice parameters.
The phase composition of the ceramic samples was determined via Raman spectroscopy. The Raman spectra of the L-GZC ceramics are shown in Figure 3, wherein the four characteristic peaks correspond to the pyrochlore structure. Raman characteristic peaks below 200 cm−1 are often attributed to disordered vibration inside the material, and those with values more than 800 cm−1 may indicate distortion inside the charoite, which can be ignored. A wave value at 319 cm−1 represents the Eg vibration mode of a B-O6 bending vibration, and a wave value near 400 cm−1 represents the B-O’ vibration of F2g. A wave value of 500 cm−1 represents the O-B-O bending vibration mode of A1g, while 590 cm−1 can be interpreted as the A-O tensile vibration of the F2g mode, which accords with the characteristic peak of the pyrochoritic structure; these findings are consistent with the XRD results. As the doping content of Gd2O3 increases, the peak intensity gradually decreases and the diffraction band gradually broadens. It may be that the vacancy and defect caused by the doping disturb the symmetry of the lattice, and other phonons affect the optical vibration spectrum, resulting in the transition of the crystal to disorder and the broadening of the peak shape [23].
Figure 4A–D shows the microstructure of the polished L-GZC ceramic surface. It can be seen by magnifying it 1000 times that the grain boundary is clear with fewer pores, and the grain size gradually decreases. The maximum and minimum average grain sizes are 1.3 and 0.5 μm, respectively.
Table 1 shows the cell parameters of (La1−xGdx)2(Zr0.7Ce0.3)2O7 ceramic materials. The cell parameters of the ceramic materials gradually decrease as the Gd3+ doping amount increases. The density of the materials is good, and the relative density is above 95%.

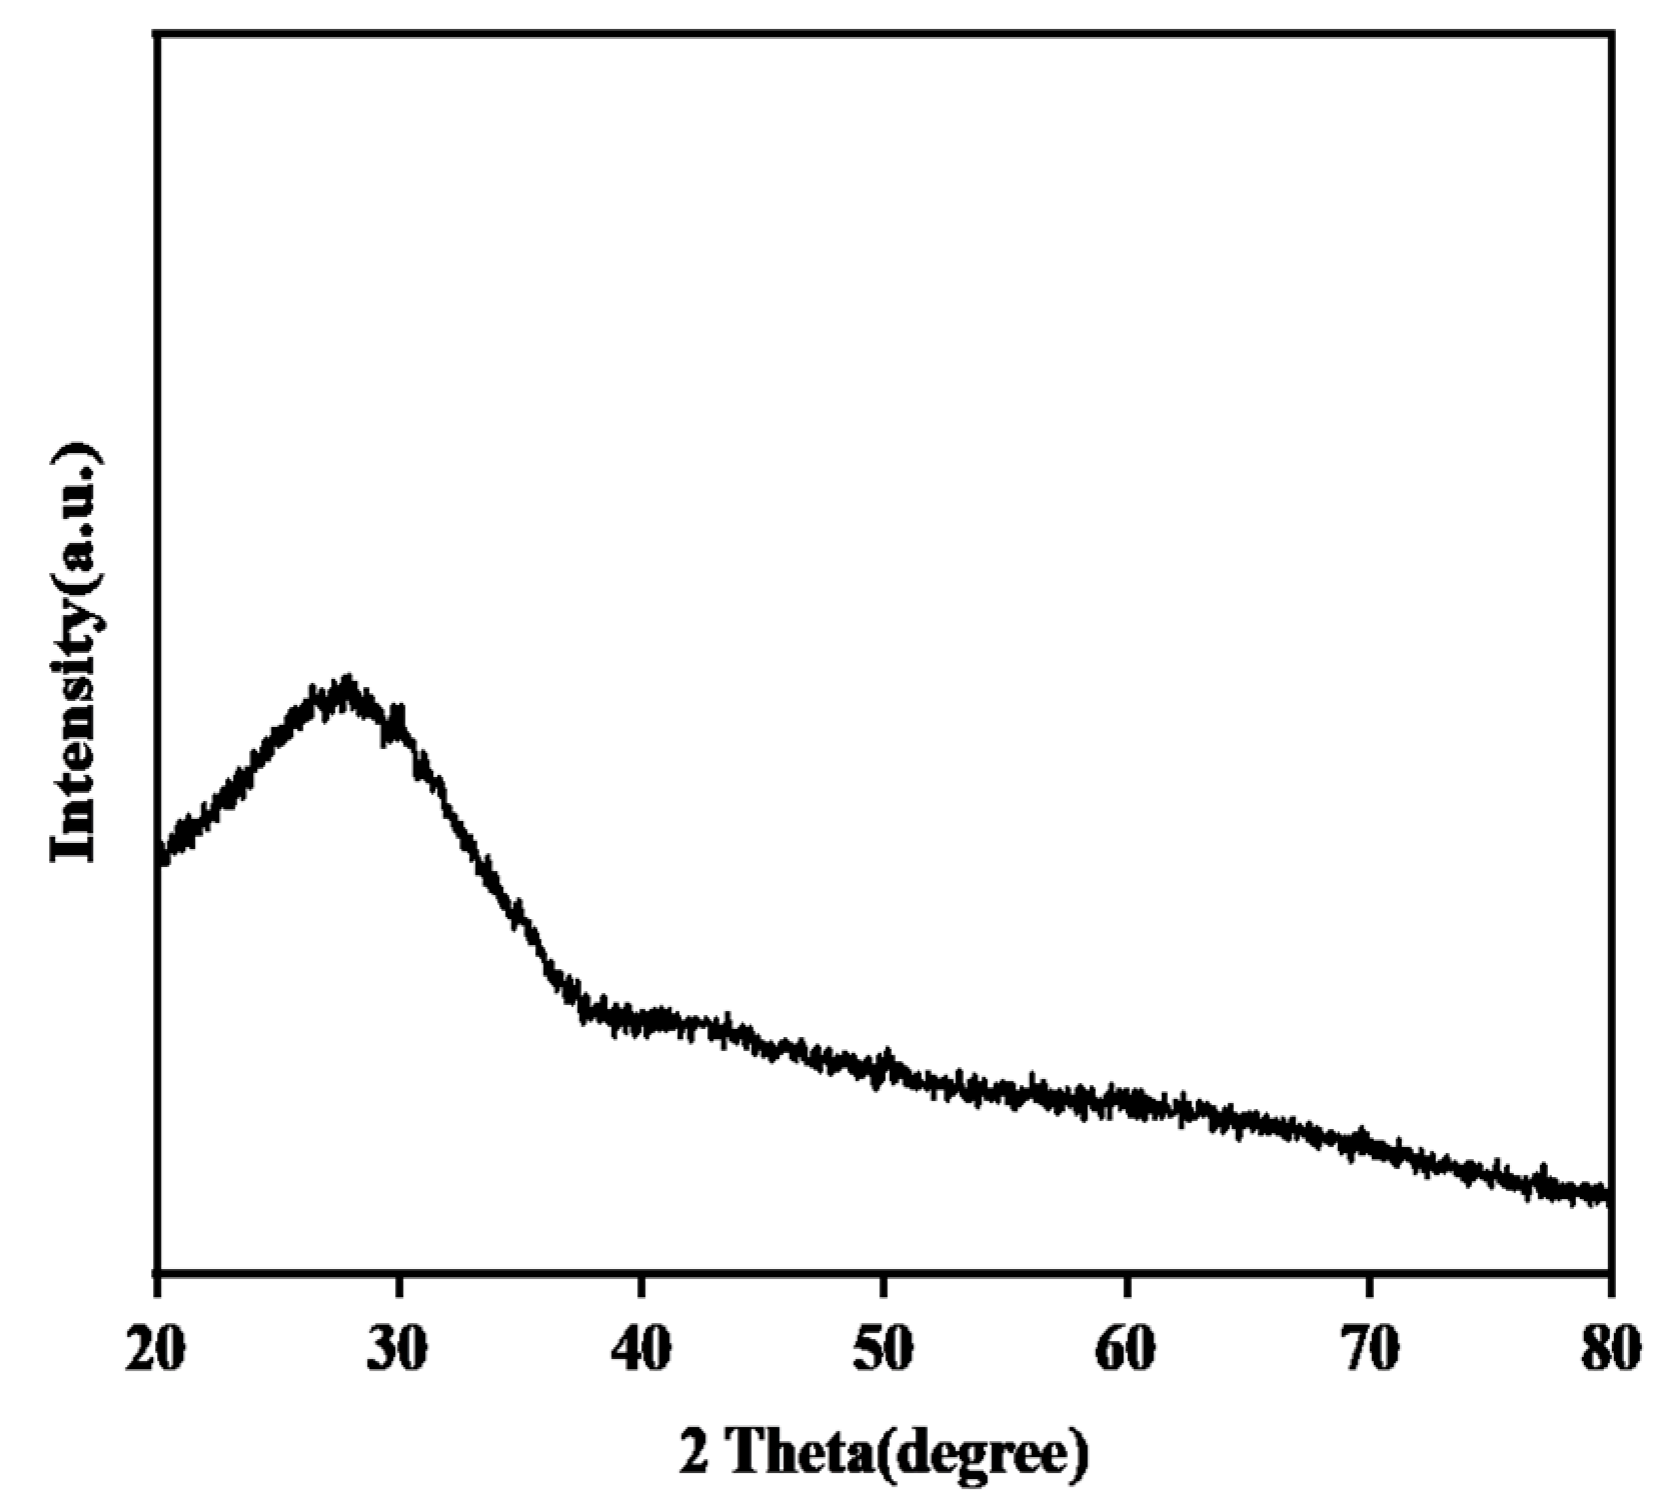
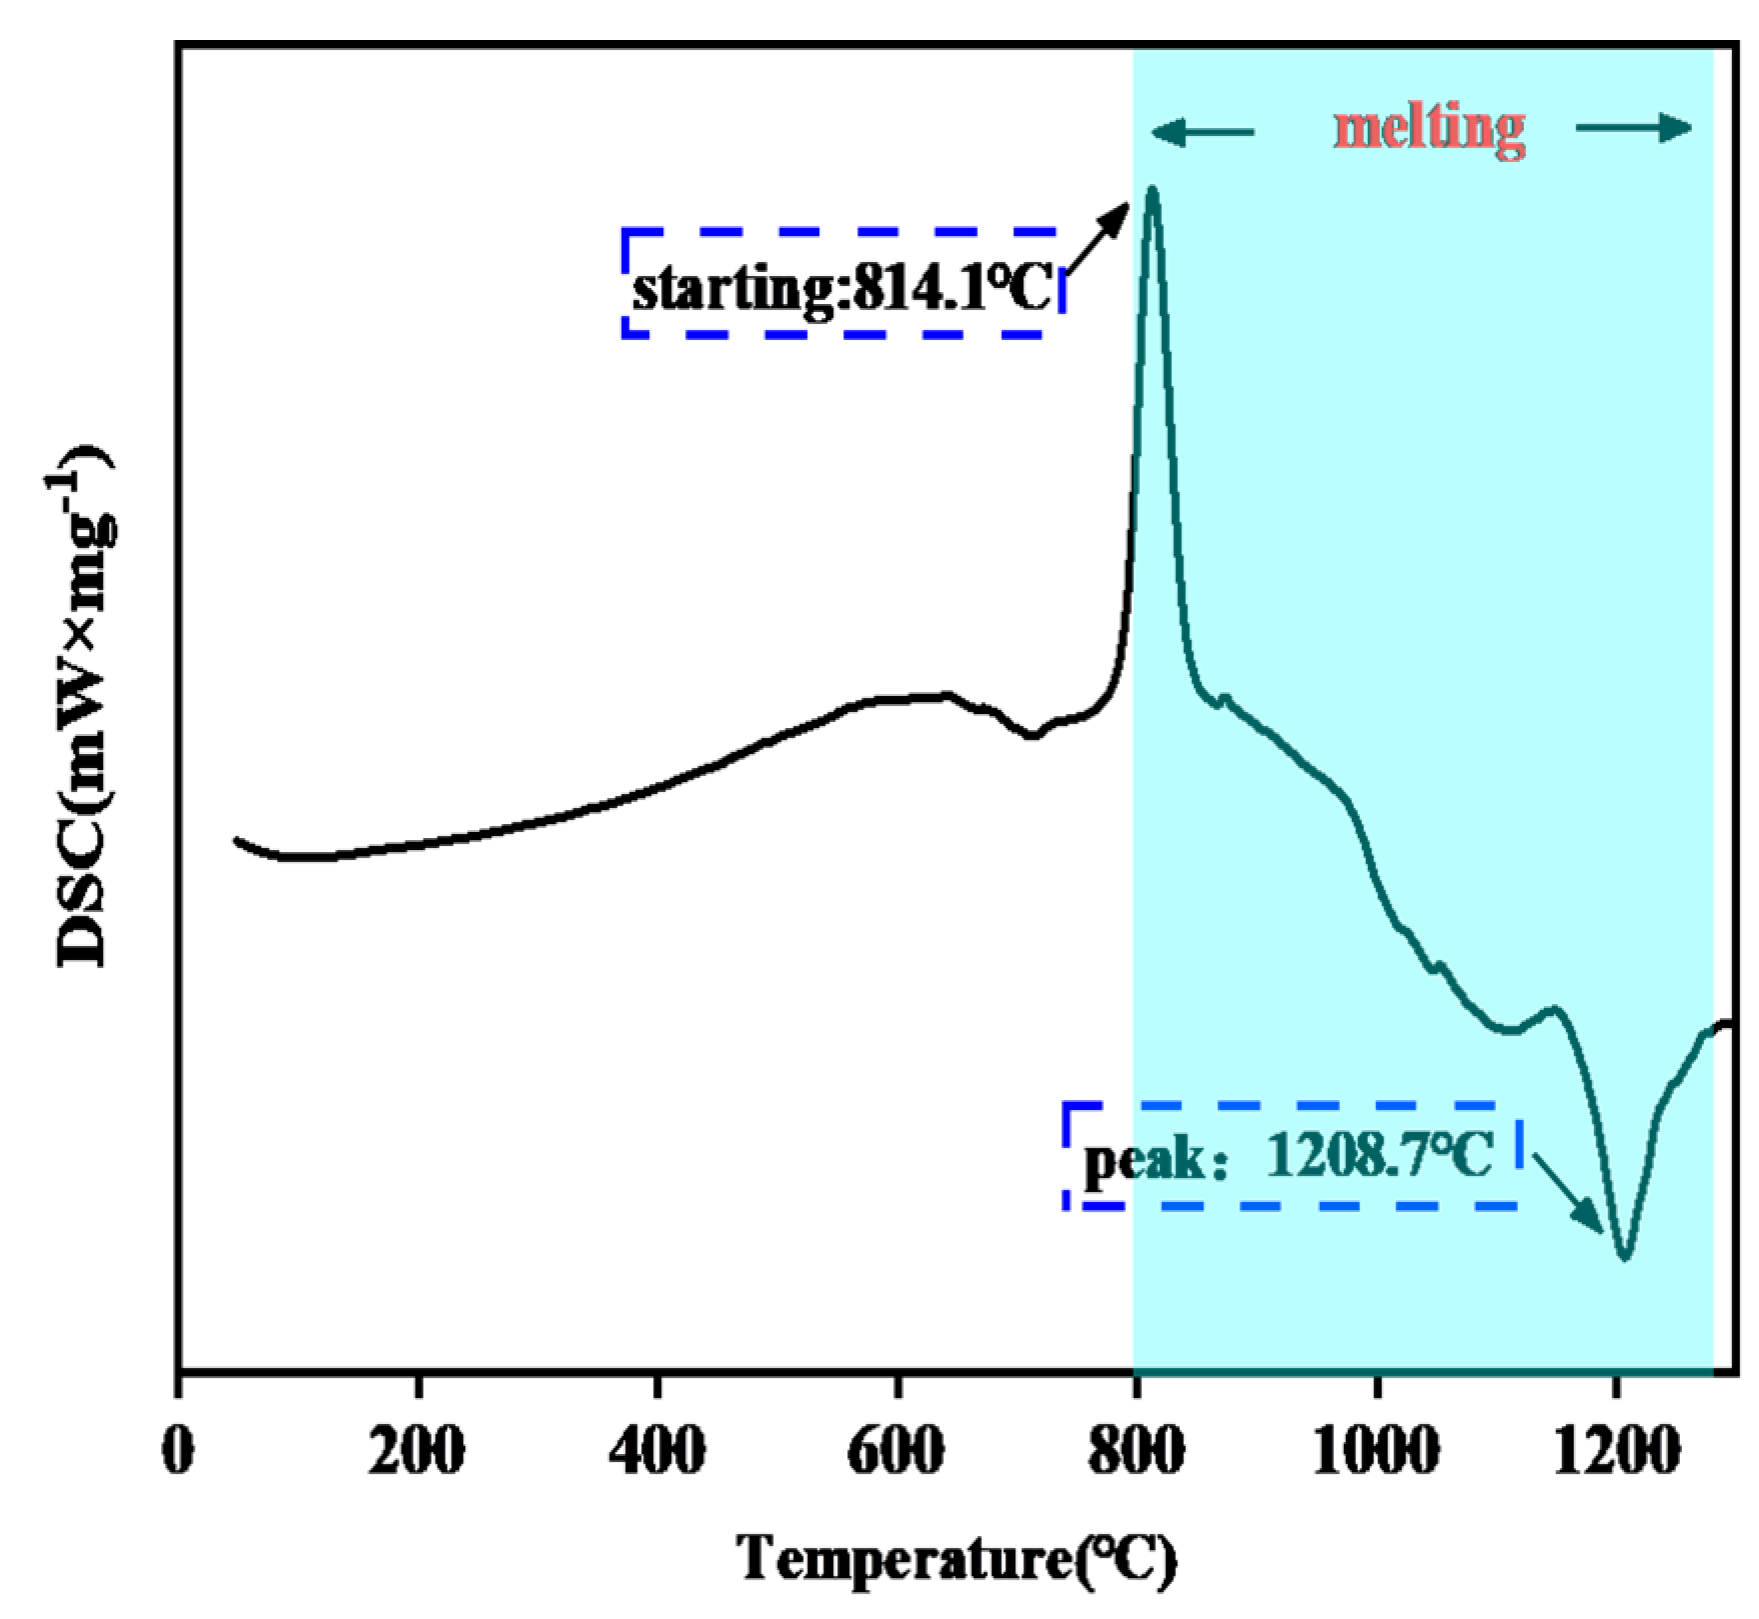
3.1.2. Phase Structure and DSC of the CMAS Powder

Figure 5 shows the XRD spectrum of the CMAS powder sintered at 1500 °C for 1 h. The results demonstrate that a peak similar to the ‘Mantou’ peak appears at 2θ = 30°, with typical amorphous diffraction characteristics. This indicates that the prepared CMAS powder is glassy.
Figure 6 shows the differential scanning calorimetry (DSC) curve of the obtained CMAS powder between room temperature and 1300 °C. The curve exhibits a clear exothermic peak near 814 °C corresponding to the glass-transition temperature of CMAS. The DSC curve peaks at 1208 °C, indicating the melting point of CMAS, which is close to its reported melting point [24]. Therefore, the temperature was set to 1250 °C for the CMAS corrosion experiment to study the corresponding corrosion behavior of the ceramics.

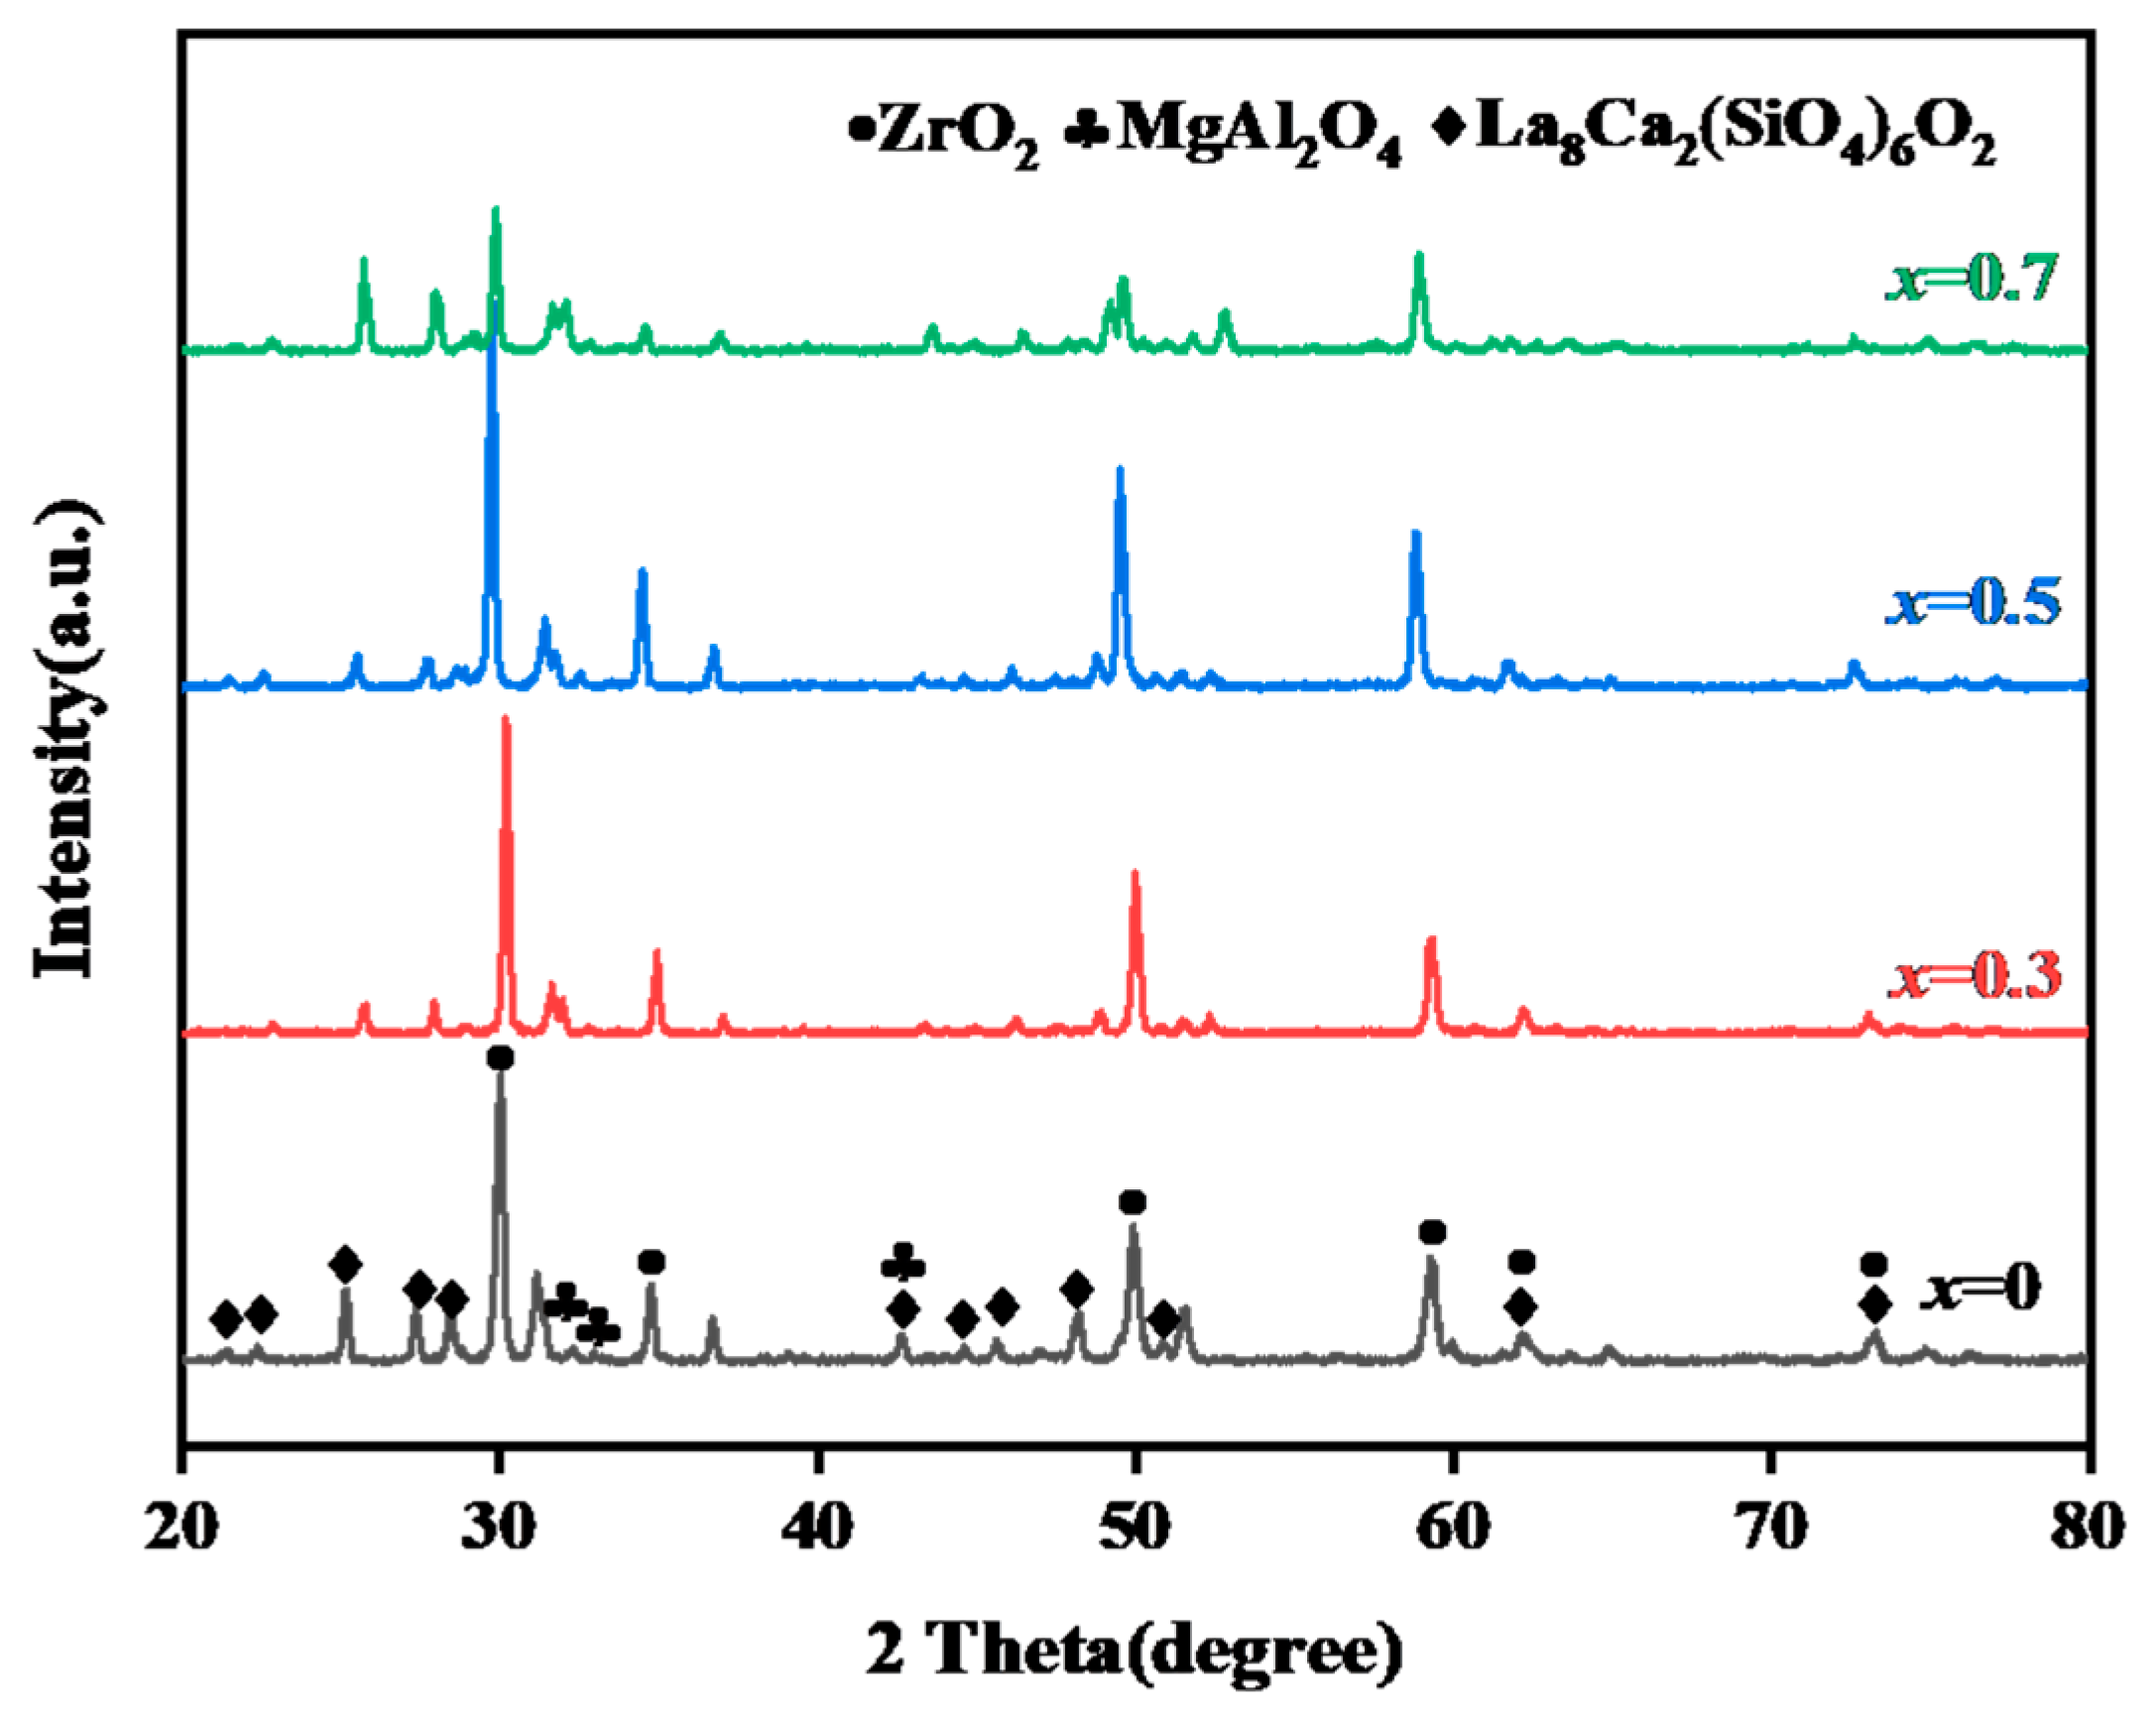
3.2. Characterization of Corrosive Ceramics

Figure 7 depicts the cross-sectional SEM image of the ceramic corroded at 1250 °C for 5 h. With an increase in the Gd3+ doping content, the corrosion depth gradually becomes shallower. This may be because Gd2O3 first reacts with Ca and Si in CMAS to generate Gd2Ca8 (SiO4)6O2; this compound can effectively resist CMAS corrosion and inhibit further reactions. To further analyze the reaction mechanism, the corroded ceramic surface was observed.
The surface SEM morphology of bulk L-GZC ceramics with different doping levels corroded by CMAS is shown in Figure 8. Three main corrosion products precipitated from the surface are polygonal-block-shaped materials, spherical particles, and rod-shaped materials. According to the XRD and EDS energy analysis, point A primarily consisted of Mg and Al, consistent with the initial CMAS composition. Point B is mainly composed of Zr, rare-earth elements and cubic zirconia at high temperatures; it transforms into monoclinic zirconium after cooling to room temperature. Point C is primarily composed of Ca, Si, and La (a rare-earth element). As rare-earth elements dissolve in CMAS and combine with Ca and Si to form apatite compounds, the corrosion products corresponding to points A, B and C are MgAl2O4, m-ZrO2 and La2Ca8(SiO4)6O2, respectively. The EDS point scan results are shown in Table 2, the corrosion products can be identified by XRD and surface morphology.
The XRD patterns of the corroded surfaces are shown in Figure 9. After the corrosion test, the L-GZC pyrochlore structure disappears, while ZrO2 and apatite appear. In addition, a relatively low content of the MgAl2O4 phase is observed in the corroded reaction layer. The silicate apatite structure has high chemical variability and a wide range of solid solutions. Excess Ca is replaced by nine-fold coordinated RE, and vacancies are generated in the ionic O lattice [25]. The composition of apatite is CaxRE(10−x)(SiO4)6O3−x/2. Based on the elemental composition analysis, the main reaction between L-GZC and CMAS is as follows:
C M A S + ( 10 x ) 2 Re 2 Z r 2 O 7 Re 10 x C a x ( S i O 4 ) 6 O 2 + Z r O 2 + M g A l 2 O 4
As the corrosion time increases, the number of corrosion products generated increases, especially in the apatite phase. Under the same experimental conditions, when x = 0.7, fewer corrosion products are generated. Gd3+ reacts with CMAS to form a reaction layer on its surface, which inhibits further corrosion reactions.
CMAS is a silicate melt with a three-dimensional network structure, containing Ca2+ and Si4+ at high temperatures. The Ca/Si ratio is highly important in terms of the corrosion behavior of CMAS, and the initial Ca/Si ratio is 0.73. As CMAS spreads on ceramic materials and reacts with them, the ratio of Ca to Si decreases and apatite begins to form. Due to the extension of time and further reactions, the apatite phase gradually stabilizes. As the ionic radius is smaller, the reaction rate with CMAS is faster. After doping Gd3+, the apatite reaction layer can be formed faster to effectively protect the matrix material [26].
Figure 10 shows the SEM images of the L-GZC block cross section after 5 h of corrosion using CMAS at 1250 °C. A relatively dense reaction layer is formed between CMAS glass and the bulk ceramic, in addition to some spherical particles and adherent crystals. This indicates that the ceramics can be corroded in a relatively short time. As the Gd3+ doping content increases, the corrosion depth decreases, and the further penetration of the CMAS melt is prevented through the formed reaction layer. Some of the CMAS on the surface disappears; however, a subpermeable glass phase is observed in the gap between the apatite and ZrO2. In addition, many small vertical cracks appear below the reaction layer. More importantly, as the Gd3+ content increases, the number of small cracks decreases. The observed CMAS corrosion in the ceramics is consistent with that reported in previous studies, indicating that Gd3+ doping inhibits CMAS corrosion and prolongs the TBC service life [27]. This behavior of reacting to protect the substrate is worth noting. Thus, comparative studies on cyclic corrosion tests are worth performing in the future.
Figure 11b is a partial expansion of Figure 11a,c,d, depicting the EDS maps of the marked points A and B. Figure 11c and the surface corrosion products indicate that the needle–rod structure at point A is mainly composed of Gd, Si, Ca, and La, as well as small amounts of Zr. Owing to the presence of rare-earth elements, the chemical formula of apatite does not have a fixed stoichiometry, and its composition changes within a certain range. Combined with the XRD images, it can be determined that the needle–rod-shaped product in the reaction layer is apatite Gd2Ca8(SiO4)6O2/La2Ca8(SiO4)6O2. Similarly, the spherical product at point B is primarily composed of Zr, with small amounts of Ca, Mg, Al, and Si that are completely dissolved. The XRD images reveal that the spherical corrosion product is ZrO2. According to the principle of dissolution and re-precipitation, the melted CMAS is dissolved in the ceramic sheet surface. Moreover, Gd and La in the ceramic react with CaO and SiO2 in CMAS to form Gd2Ca8(SiO4)6O2/La2Ca8(SiO4)6O2. CaO and SiO2 in CMAS are continuously consumed, while MgO and Al2O3 aggregate to form MgAl2O4. The EDS energy spectrum is shown in Figure 12.
In order to further determine the products and corresponding contents after corrosion, XRF element analysis was carried out on the La2(Zr0.7Ce0.3)2O7 ceramic material corroded by CMAS at 1250 °C for 5. The results are listed in Table 3. Compared with the undoped Gd material, the content of CaO and SiO2 elements is higher after corrosion, indicating the formation of an apatite reaction layer.
Figure 13 shows the XPS diagram of the ceramic material CMAS corroded for 5 h. The more cluttered lines are the original data, which has been fitted by Origin software. According to the analysis of the test results, it mainly contains Ca, Si, Zr, and other elements, which is consistent with the results of a previous study, and the product can be basically identified as Gd2Ca8(SiO4)6O2/La2Ca8(SiO4)6O2. Mg and Al may not be well reflected due to the short reaction time or micro-zone selection.
Figure 14 shows the SEM diagram of the section of the (La1−xGdx)2(Zr0.7Ce0.3)2O7 ceramic material corroded by CMAS for 10 h at 1250 °C. The section morphology is basically the same as that of the material corroded for 5 h, showing the residual part of CMAS, the reaction part of the corrosion, and the ceramic matrix from top to bottom. A large number of black blocks appear in the middle of the reaction layer, and the corrosion layer became significantly thicker over time, which may be due to the further reaction of CMAS with ceramic materials. The apatite was detected via EDS spectroscopy.
A comparison of the XRD patterns of ceramics corroded at 1250 °C for 10 h (Figure 15) and 20 h (Figure 16) shows that, as the corrosion time increases, the amount of corrosion products also increases; however, the amount of ZrO2 decreases considerably. This is due to the formation of a dense Gd2Ca8(SiO4)6O2 reaction layer that inhibits further reactions.
Compared with the XRD peak before corrosion, after 5 h of corrosion, the three-strong peak value of the LZC ceramic material shows a gradually weakening trend, and a new corrosion product, the peak value of apatite La/Gd2Ca8(SiO4)6O2, begins to appear. This indicates that, in the process of corrosion, the structure of the LZC ceramic material is gradually destroyed, and new substances are formed at the same time. With the extension of the corrosion time, after 10 h of corrosion, the original three-strong peak of the ceramic material essentially disappeared, but the peak of the corrosion products increased. This further shows that the structural damage of the LZC ceramic materials during the corrosion process is continuous and serious, and the original characteristic peak of the material is replaced by the peak of the corrosion product. When the corrosion time reaches 20 h, the original three strong peaks of LZC ceramic materials completely disappear, leaving only the peak of corrosion products, and, at this time, the peak strength of apatite reaches the highest. This shows that the structure of the LZC ceramic material was completely destroyed under the action of long-term corrosion, and a large number of corrosion products (i.e., apatite) has replaced it. This process clearly demonstrates the mechanism by which corrosion destroys the material structure and the formation of new substances.
The cross-sectional corrosion depth maps of the L-GZC ceramics at 10 and 20 h are shown in Figure 17 and Figure 18, respectively. At the lowest Gd3+ doping content, the corrosion depth of L-GZC is the deepest. Similarly, the depth is the lowest. This proves that the developed Gd2O3-doped ceramic has higher corrosion resistance than the original LZC ceramic.
The crystal phases of the CMAS corrosion products on the L-GZC ceramics are monoclinic ZrO2 and Ca2Re8(SiO4)6O2 apatite (Re = La and Gd). Figure 19 shows the ternary phase diagram of CaO-Al2O3-SiO2, it can explain the reaction process of CMAS and ceramic materials at high temperature. At 1250 °C, the Ca and Si in the CMAS melt react with the ceramics to form crystalline phases, changing the composition of the melt. First, calcium feldspar is formed, and Ca2Re8(SiO4)6O2-type limestone (Re = La and Gd) is generated, with the considerable consumption of Ca and Si in CMAS. After a series of component transfers, aluminum feldspar is formed, which cannot crystallize under high-temperature conditions and cannot prevent further corrosion [28]. At high temperatures, a small amount of diopside is generated due to the spiral dislocation nuclei of diopside. The crystallization rate of diopside is higher than that of aluminum feldspar.
According to the analysis of the sample surface morphology and product types of the (La1−xGdx)2(Zr0.7Ce0.3)2O7 ceramic materials corroded at 1250 °C for different times, the corrosion process of CMAS can be divided into three stages:
(1)
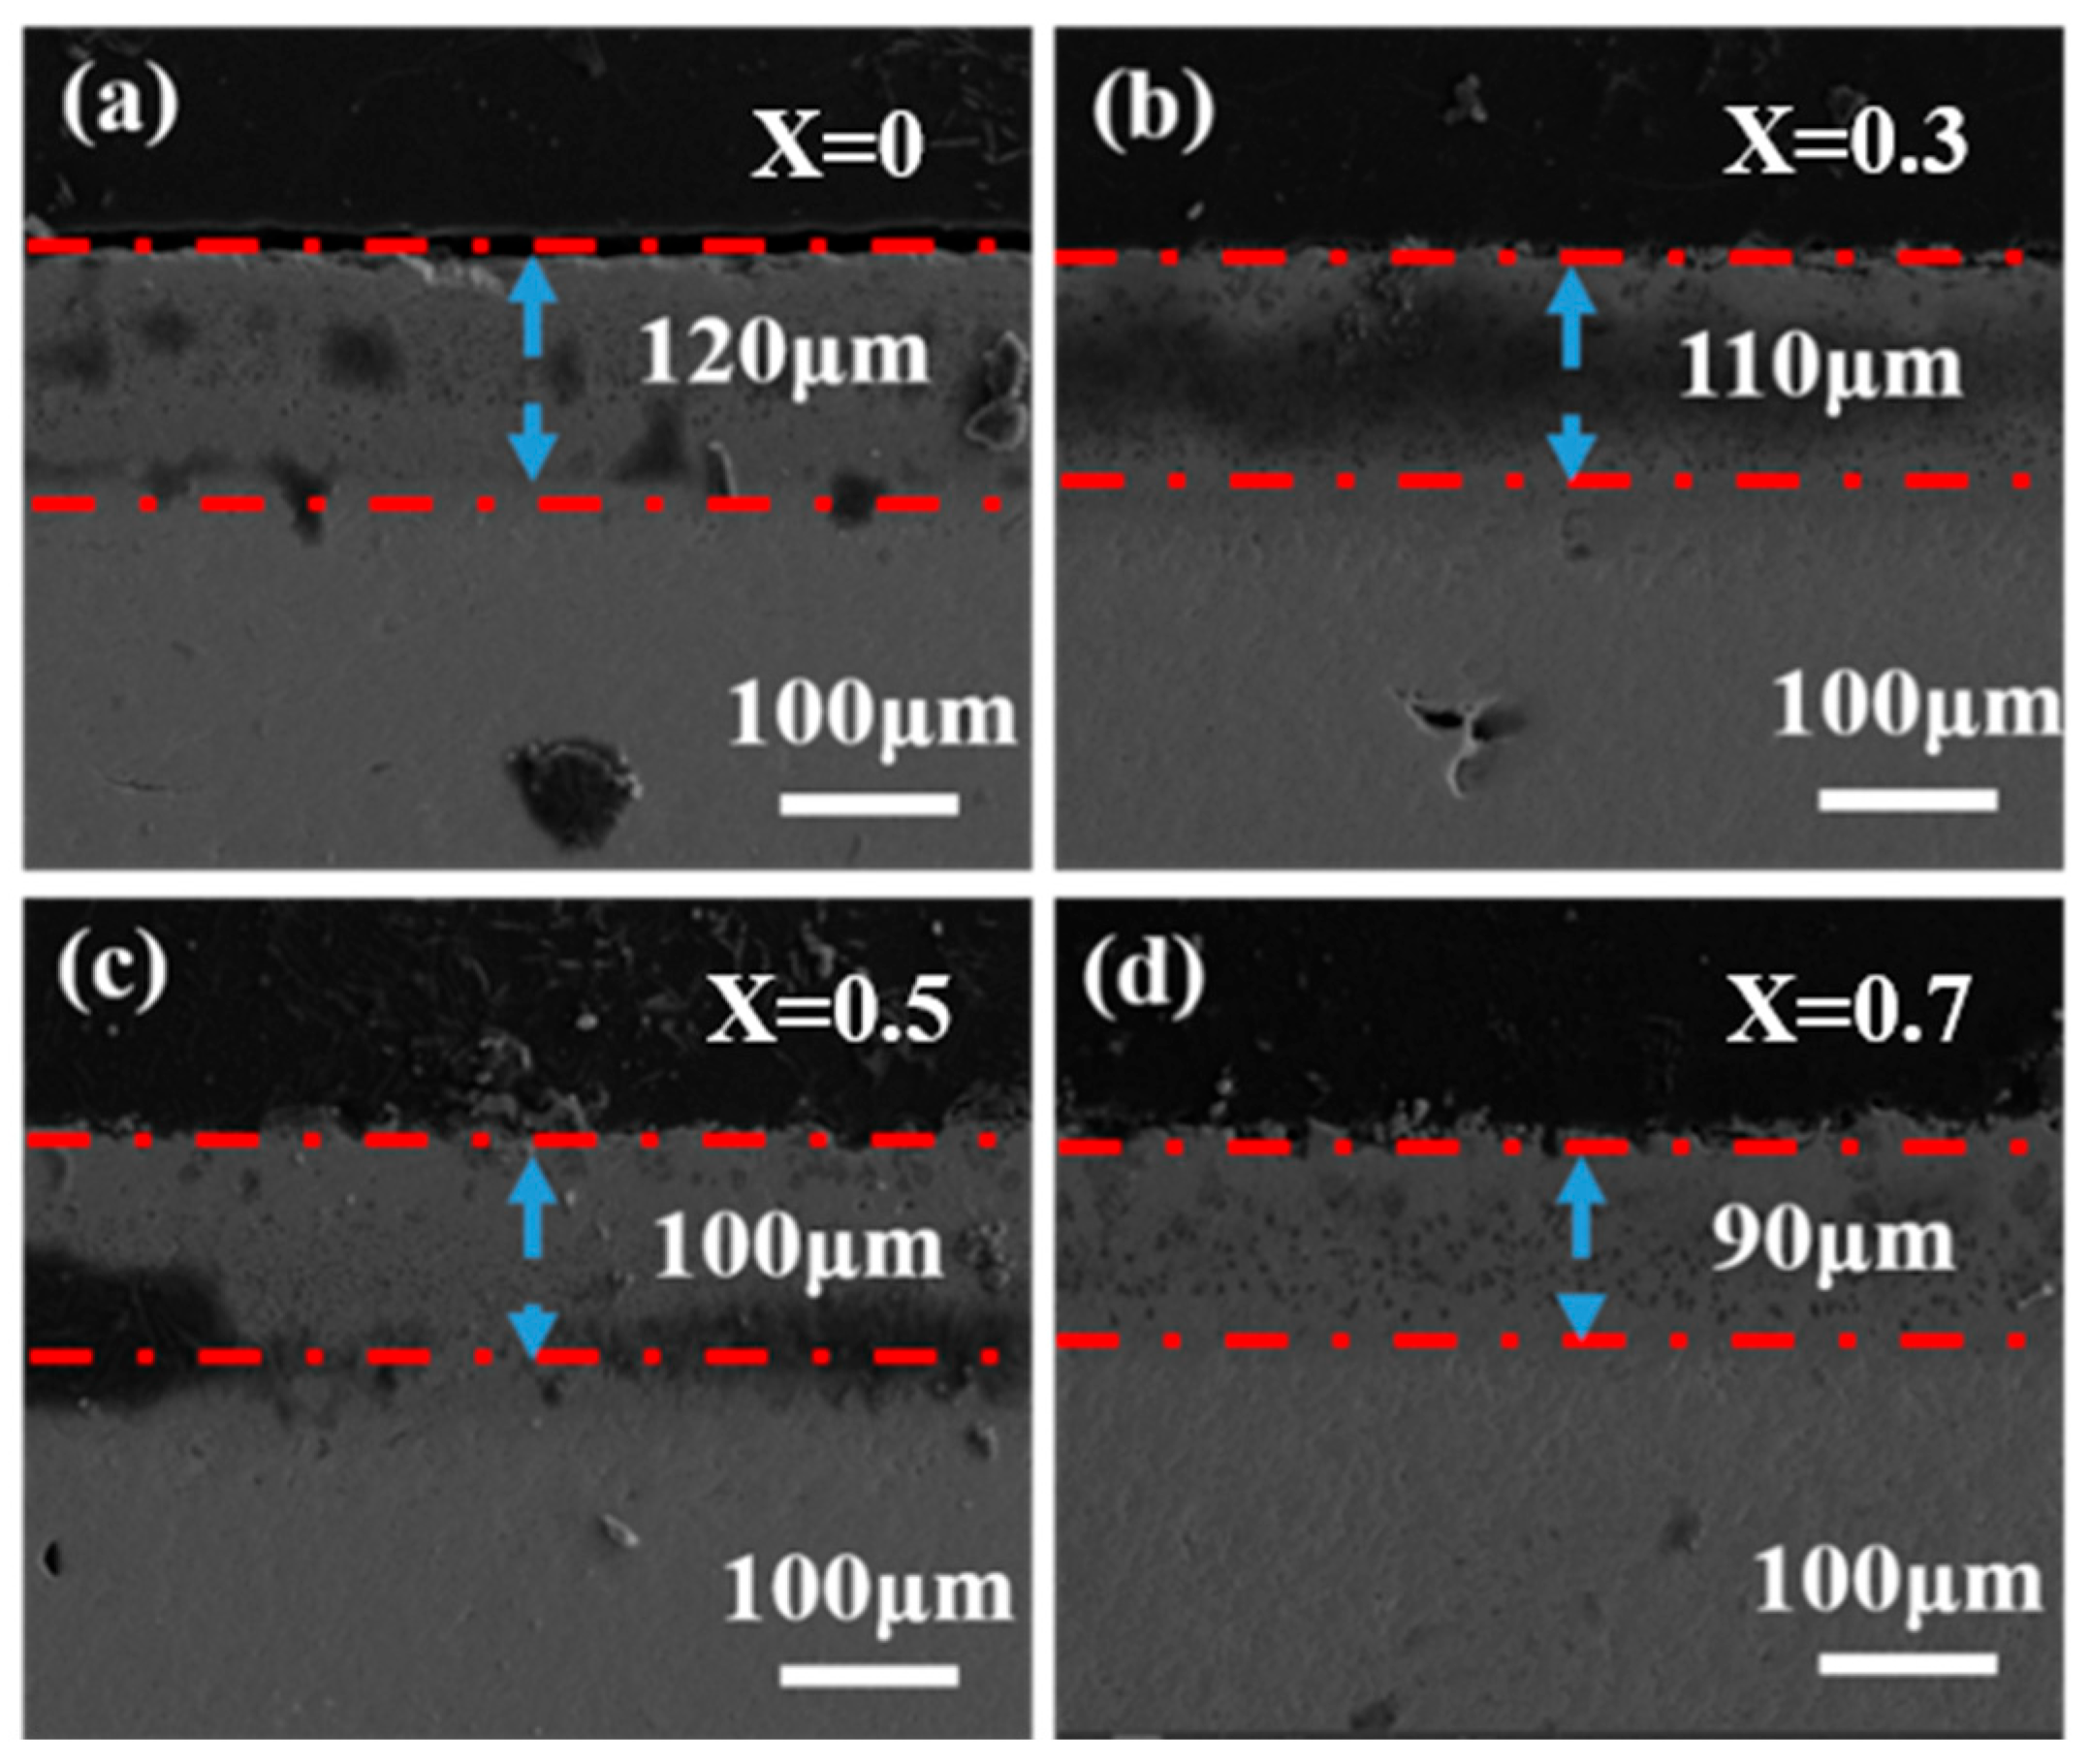
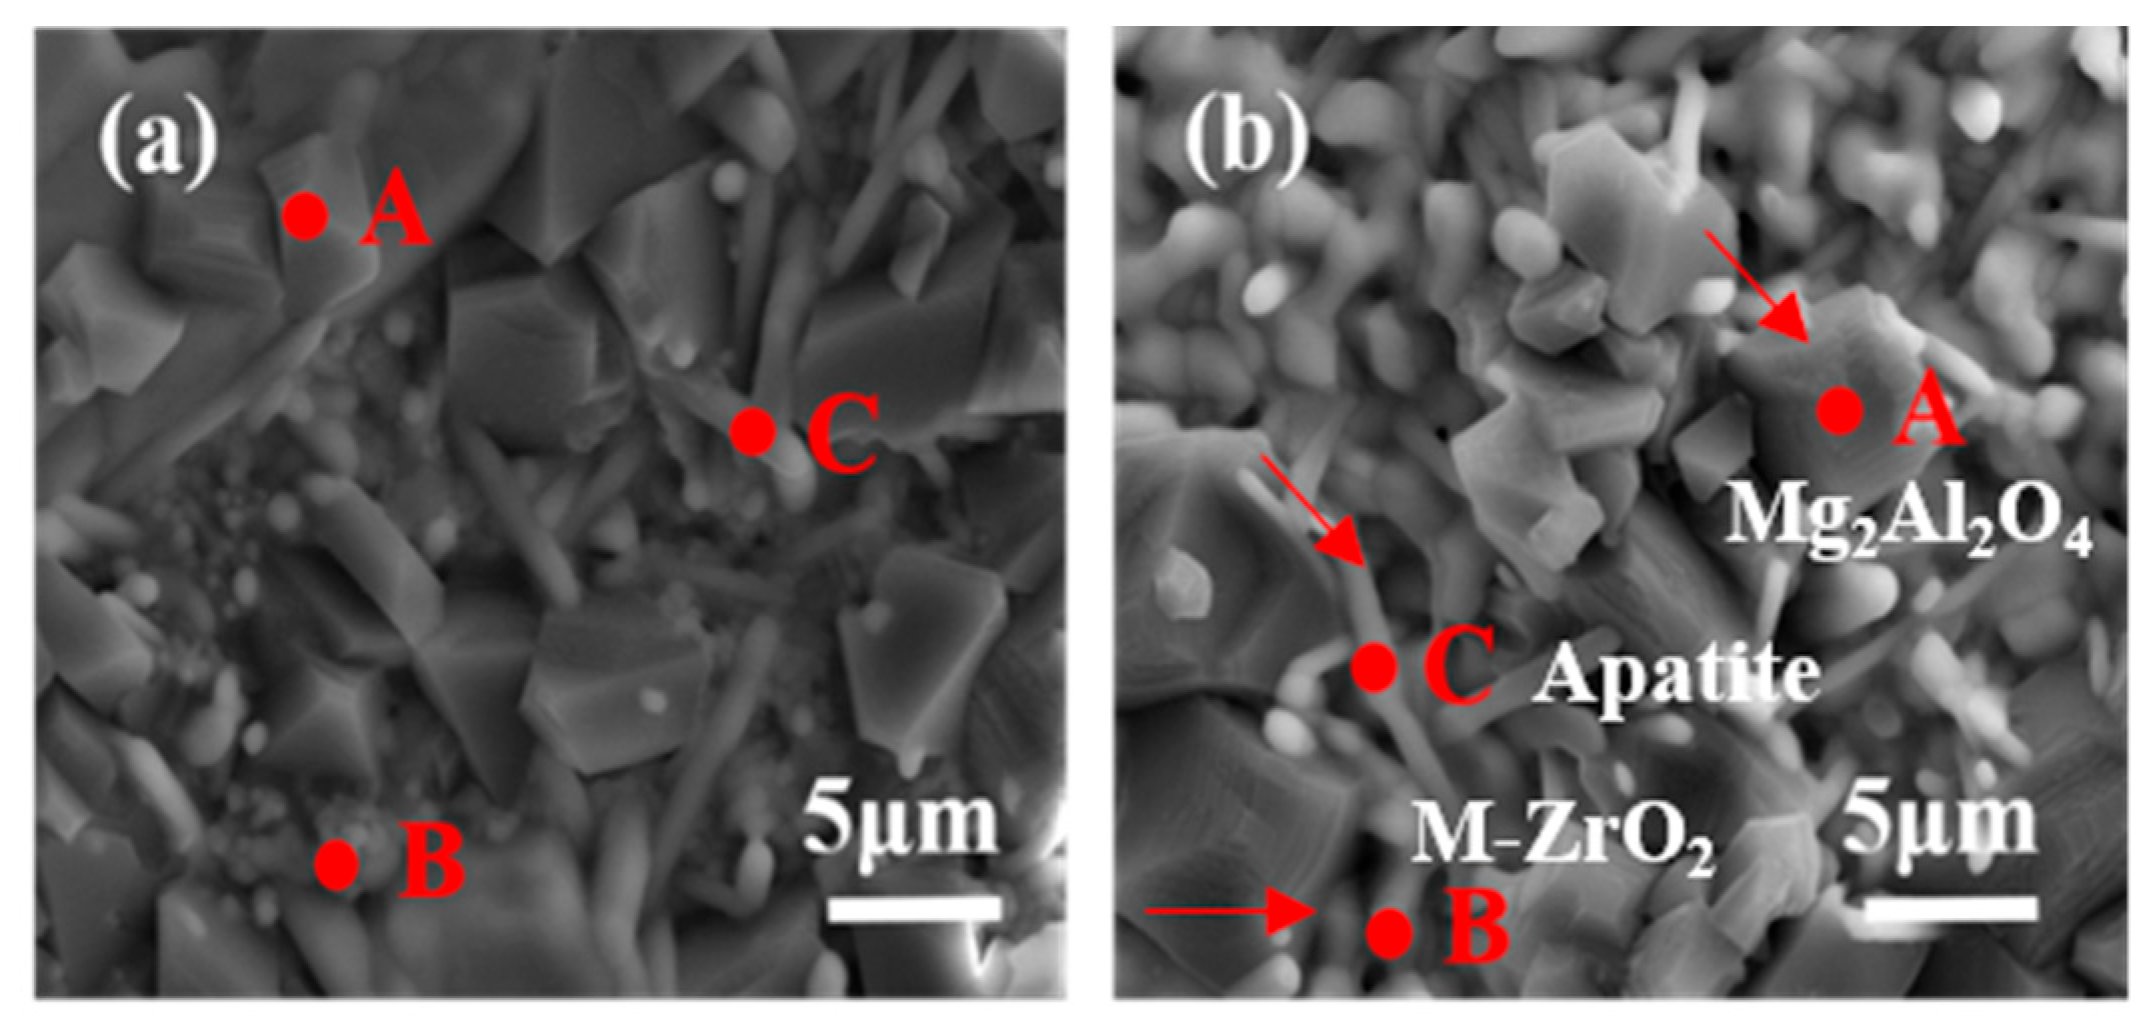
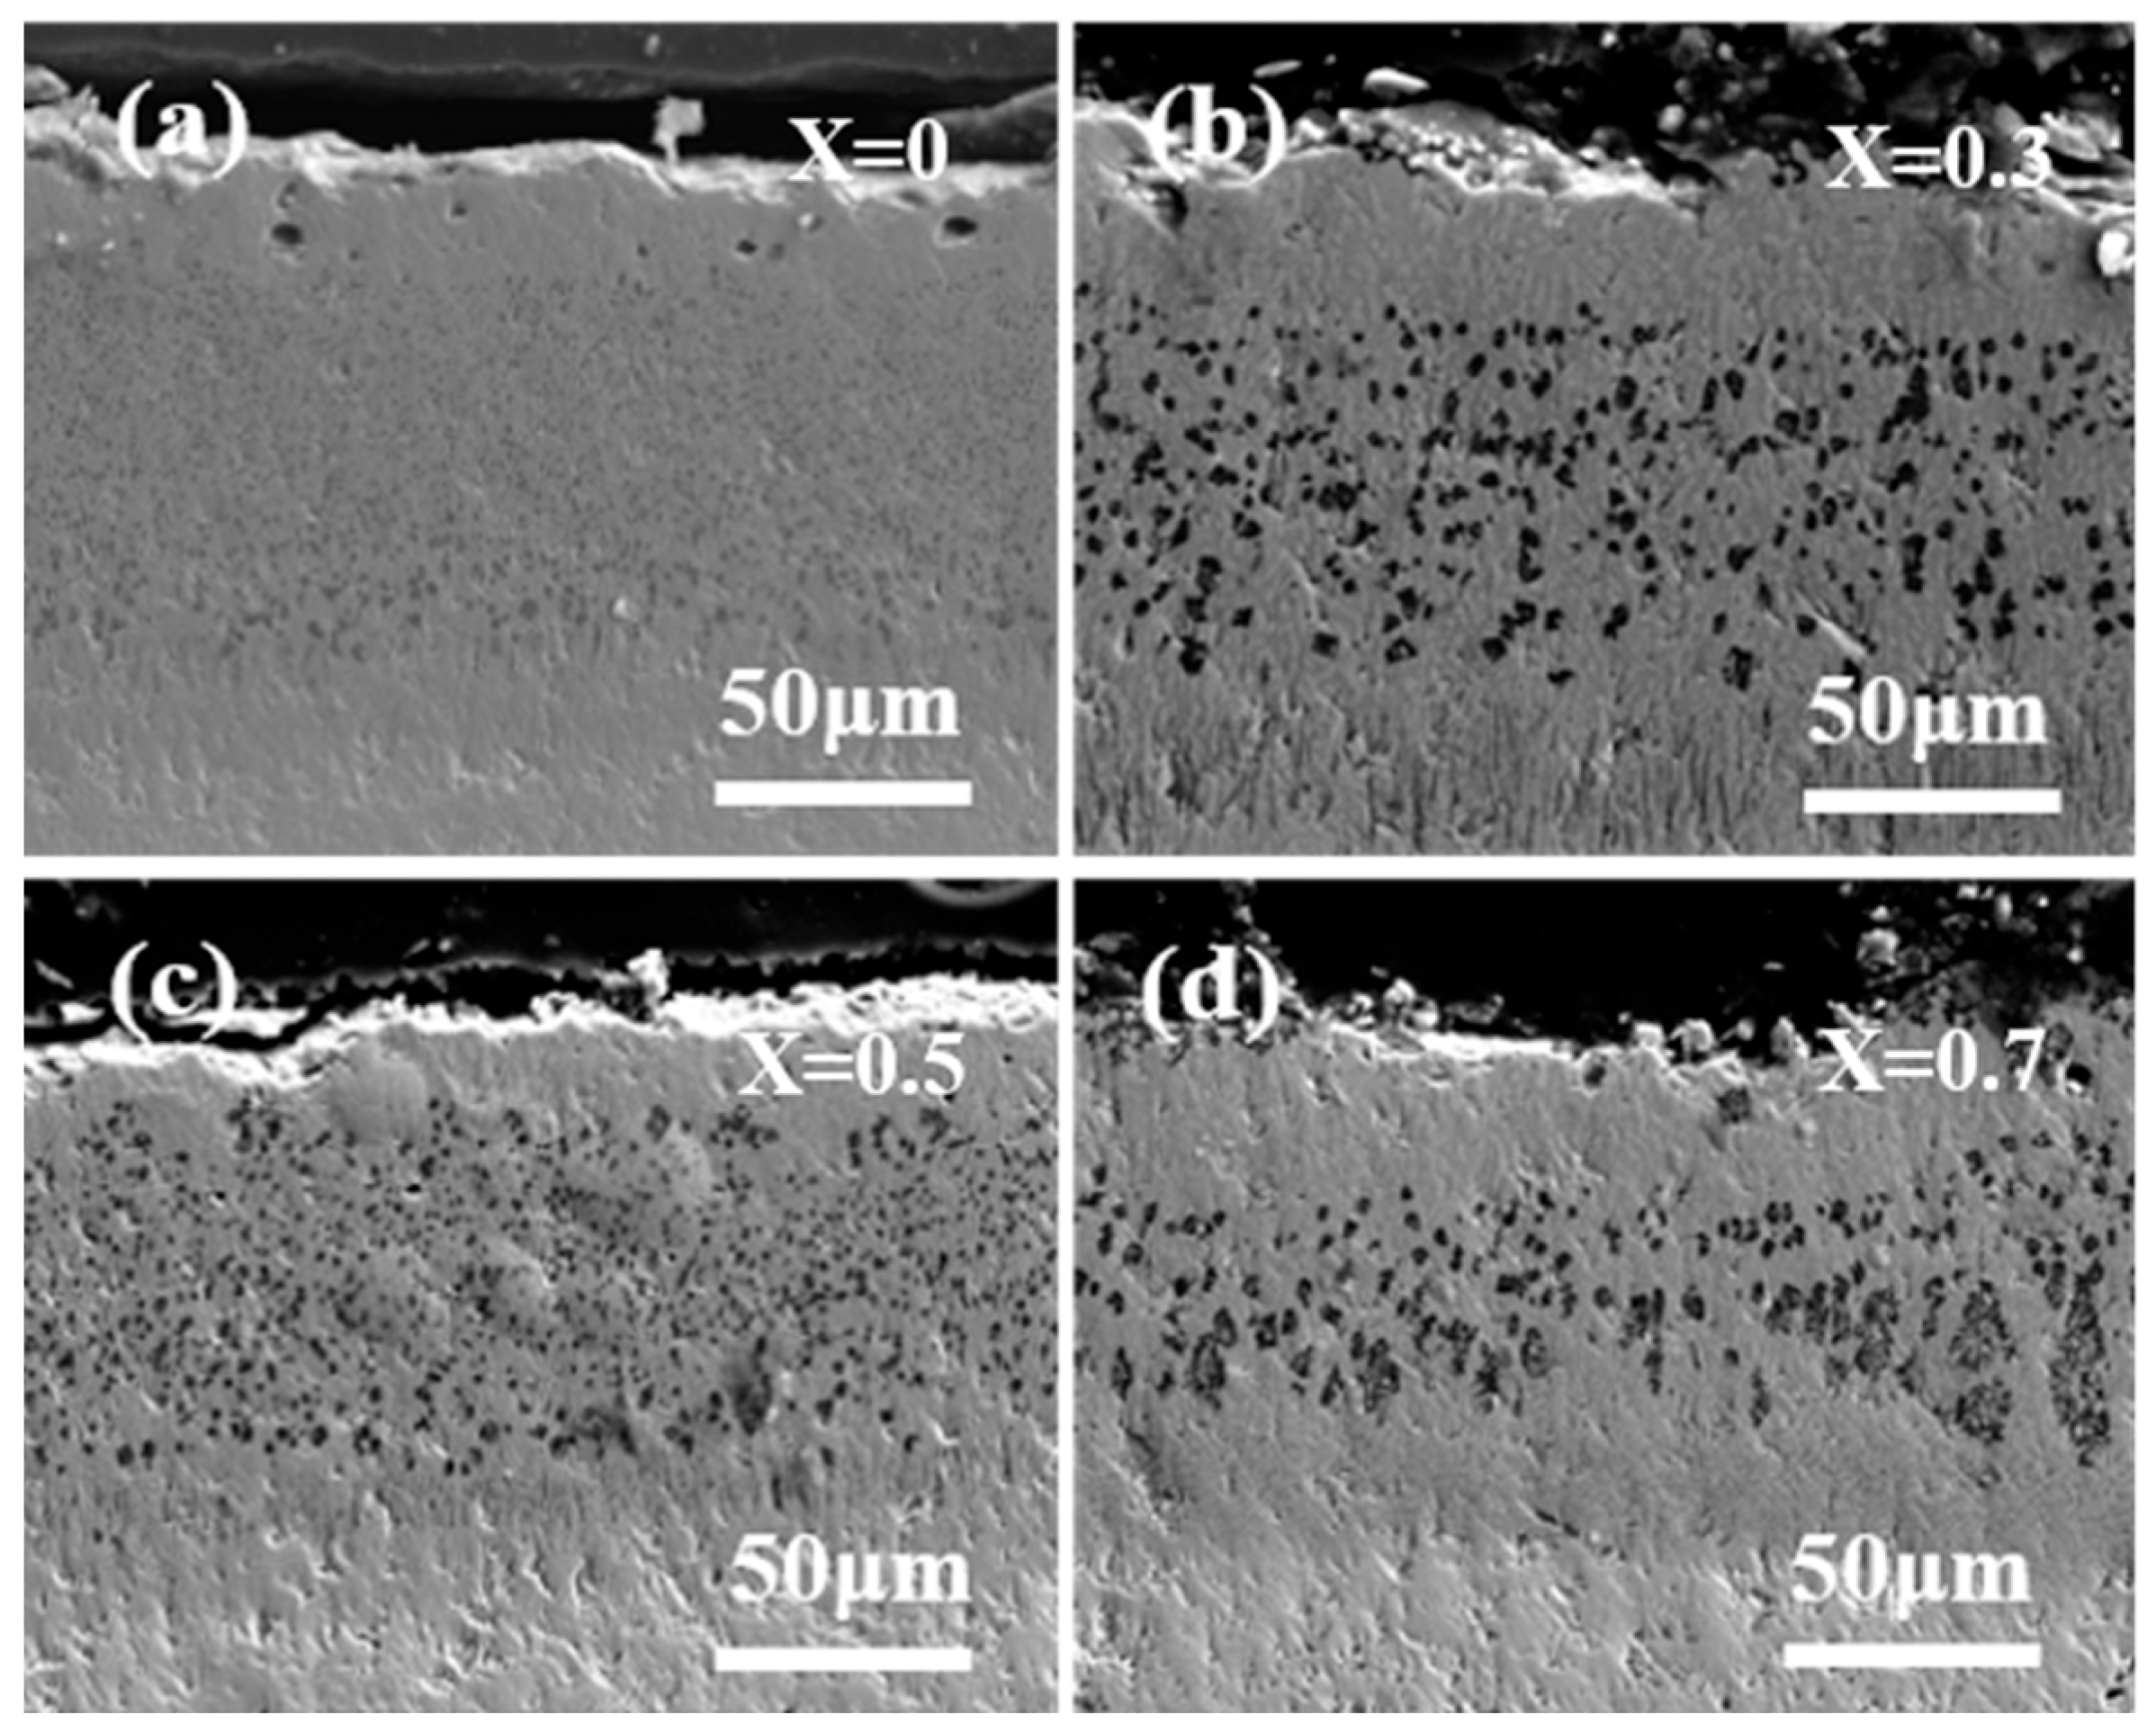
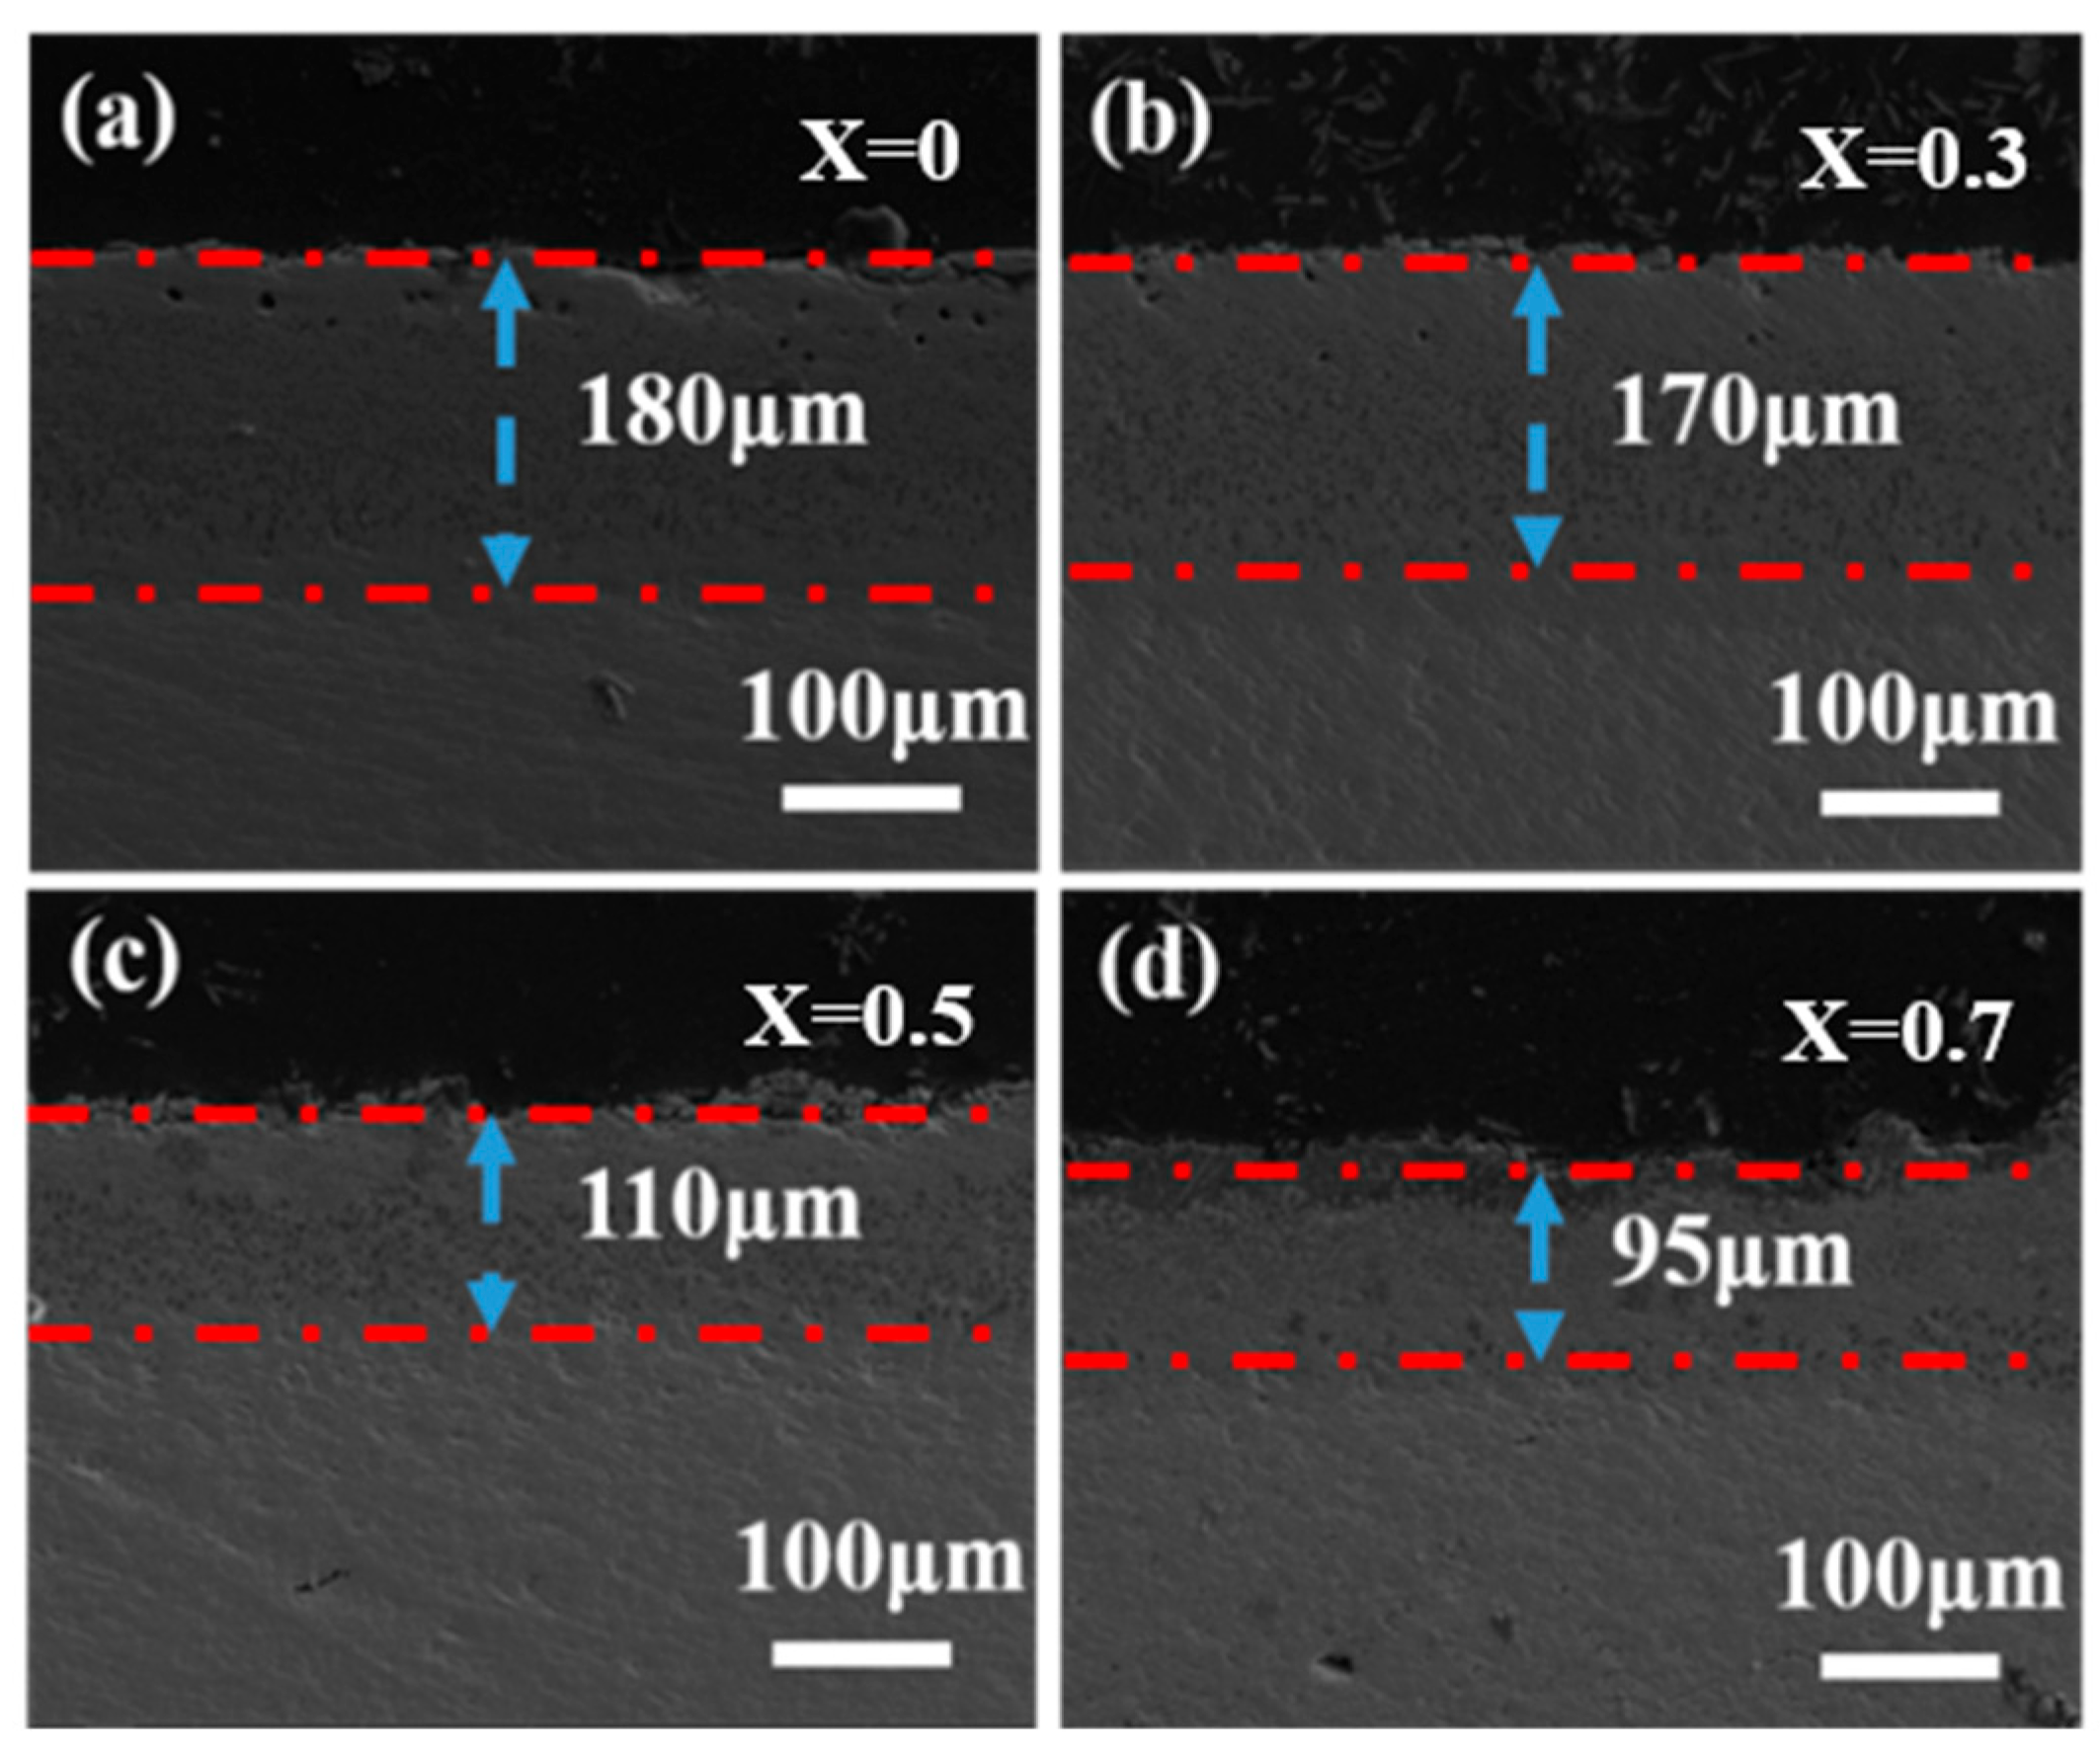
In the first stage, the molten CMAS spreads out on the specimen surface and permeates continuously into the high-entropy ceramic. The section diagram for 5 h shows that an intermediate reaction layer is initially formed between CMAS and the high-entropy ceramics, and the average thickness of the corrosion at 1250 °C for 5 h is about 100 μm. Combined with the surface topography images at 1250 °C for 5 h and the surface and XRD patterns of the CMAS corrosion samples at different times, white apatite precipitates from the surface of CMAS. This indicates that the ceramics decompose when encountering CMAS, and the rare-earth elements in the ceramics diffuse into the CMAS melt.
(2)
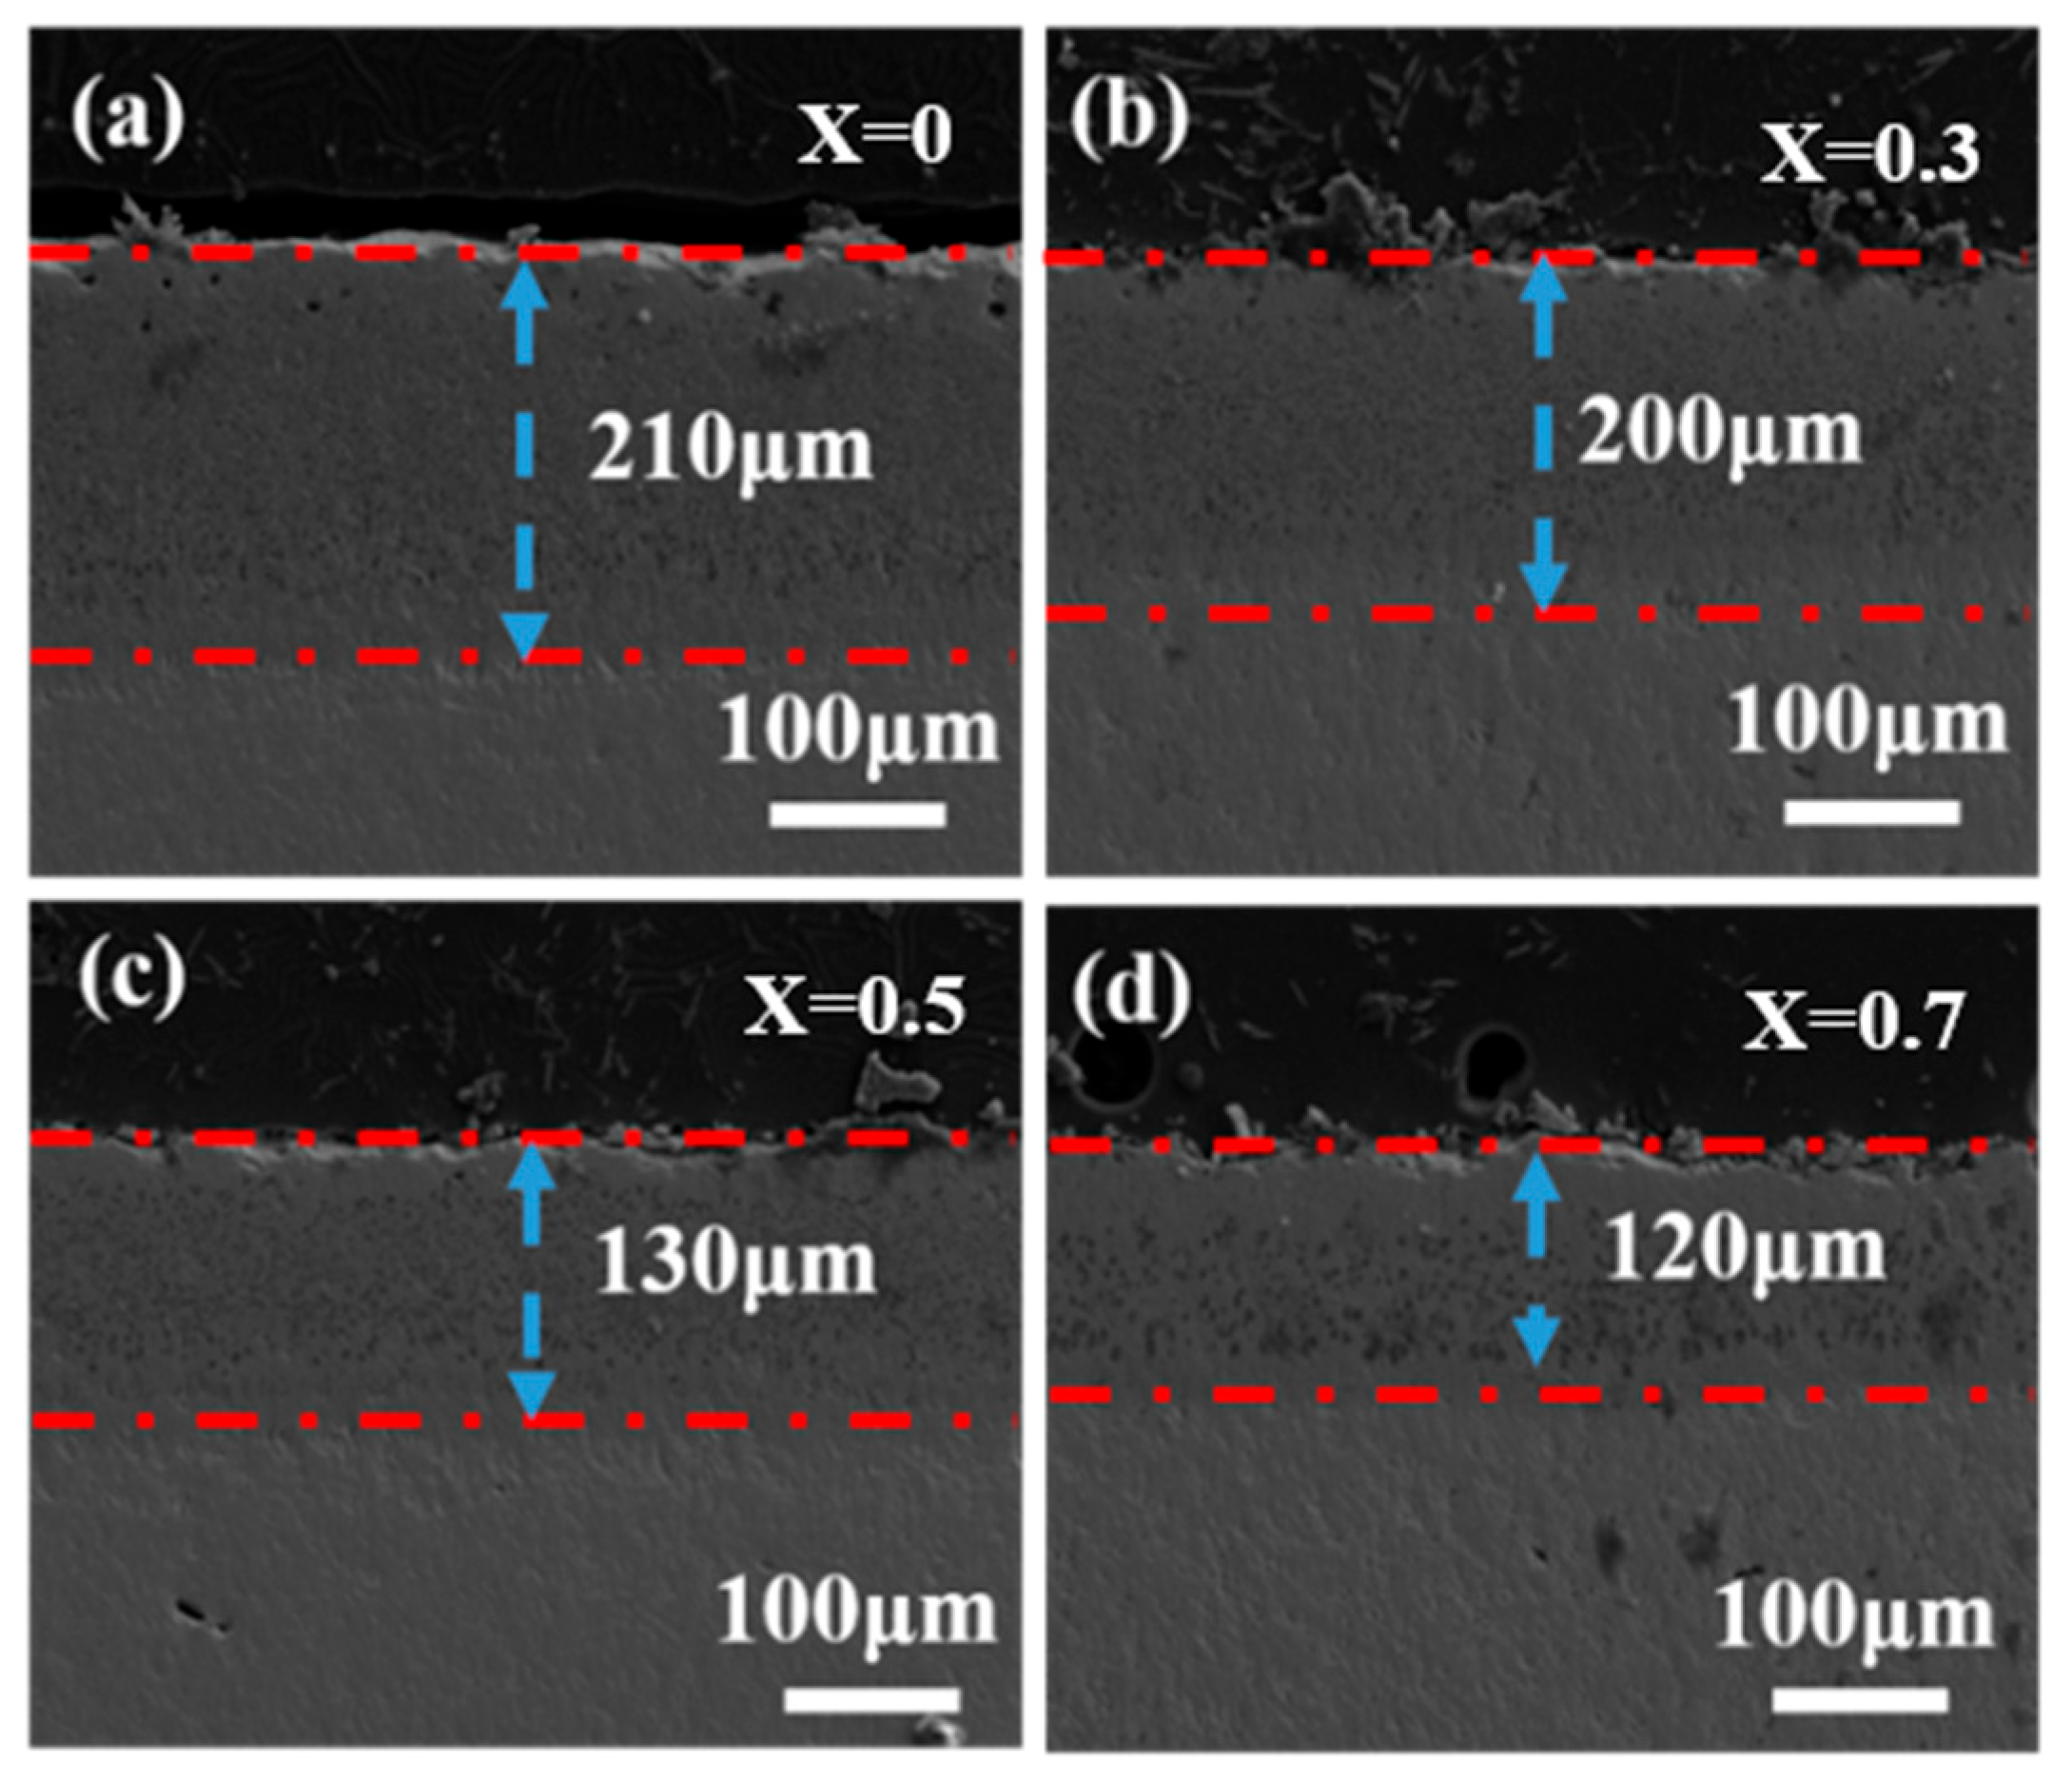
In the second stage, with the increase in the reaction time, Ca and Si in the CMAS are continuously consumed, and a large amount of apatite and MgAl2O4, formed partly by MgO and Al2O3, exist at the top of the sample section, with only a small amount of CMAS remaining on the surface. The results show that molten CMAS has essentially penetrated into the ceramic layer, and this stage mainly shows the process of CMAS infiltration and reaction with ceramics to form apatite and precipitate RE(Ca)-ZrO2 with a fluorite structure.
(3)
In the third stage, the CMAS vitreous body completely permeates into the ceramic. In the long-term high-temperature environment, the grain size increases in the reaction layer, and some of the CMAS reacts with the apatite to continuously form stable apatite. As shown in the CA-Si-Al ternary phase diagram in the figure, with the continuous reduction of the Ca and Si components in CMAS, the residual CMAS forms a yellow feldspar Ca2Al2SiO7 sediment with a higher melting point, so it cannot continue to penetrate into the ceramic interior.

4. Conclusions

Herein, we found that doped rare-earth zirconate ceramics exhibited considerably better behavior than LZC ceramics during high-temperature CMAS corrosion. (1) Compared with the XRD of the initial synthesis with pyrochlore-structure LZC, the peaks of pyrochlore gradually weaken after corrosion and disappear with the prolongation of the corrosion time. Many miscellaneous peaks appear, which are determined to be the products of corrosion apatite and zirconia after detection. (2) Based on the analysis of the SEM results, when the Gd2O3 content was at its maximum (x = 0.7), the L-GZC ceramics demonstrated the smallest number of vertical cracks and the shallowest corrosion depth. Gd2O3 apatite containing multiple rare-earth elements precipitated ZrO2, and the precipitated ZrO2 had a cubic structure, forming a dense reaction layer. The corrosion depth was <200 μm, indicating that L-GZC is an ideal candidate material for TBC in terms of corrosion resistance. (3) According to the EDS results, the specific types of corrosion products were defined according to the distribution of each element.

Author Contributions

Conceptualization, M.X.; methodology, X.S. (Xiwen Song); software, X.S. (Xiaowei Song); validation, Y.Z.; formal analysis, R.M.; investigation, X.Q.; resources, M.X.; data curation, X.S. (Xiwen Song); writing—original draft preparation, X.S. (Xiaowei Song); writing—review and editing, M.X.; visualization, Y.Z.; supervision, M.X.; project administration, X.S. (Xiwen Song); funding acquisition, M.X. All authors have read and agreed to the published version of the manuscript.

Funding

National Natural Science Foundation of China, No. 52372062; Inner Mongolia Youth Science and Technology Talent Development Project of Higher Education Institutions, No. NJYT23008; Inner Mongolia University Scientific Research Project (NJZZ23055); Northern Rare Earth Research Project (BFXT-2022-D-0053); Inner Mongolia Natural Science Foundation Project 2024MS05021; Basic Research Funds for Universities directly under the Inner Mongolia Autonomous Region (2023QNJS023).

Institutional Review Board Statement

Not applicable.

Informed Consent Statement

Written informed consent has been obtained from the patient(s) to publish this paper.

Data Availability Statement

Data are contained within the article.

Conflicts of Interest

The authors declare no conflict of interest.

References

  1. Barwinska, I.; Kopec, M.; Kukla, D.; Senderowski, C.; Kowalewski, Z.L. Thermal Barrier Coatings for High-Temperature Performance of Nickel-Based Superalloys: A Synthetic Review. Coatings 2023, 13, 769. [Google Scholar] [CrossRef]
  2. Bogdan, M.; Peter, I. A Comprehensive Understanding of Thermal Barrier Coatings (TBCs): Applications, Materials, Coating Design and Failure Mechanisms. Metals 2024, 14, 575. [Google Scholar] [CrossRef]
  3. Chellaganesh, D.; Adam Khan, M.; Winowlin Jappes, J.T. Thermal Barrier Coatings for High Temperature Applications: A Short Review. Mater. Today 2021, 45, 1529. [Google Scholar] [CrossRef]
  4. Song, J.; Wang, L.; Yao, J.; Dong, H. Multi-Scale Structural Design and Advanced Materials for Thermal Barrier Coatings with High Thermal Insulation: A Review. Coatings 2023, 13, 343. [Google Scholar] [CrossRef]
  5. Ariharan, S.; Parchovianský, M.; Singh, P. Hot Corrosion Behavior of La2Ce2O7-Based Plasma-Sprayed Coating. High Temp. Corros. Mater. 2024, 101, 779–788. [Google Scholar] [CrossRef]
  6. Bakan, E.; Vaßen, R. Ceramic Top Coats of Plasma-Sprayed Thermal Barrier Coatings: Materials, Processes, and Properties. J. Therm. Spray Technol. 2017, 26, 992. [Google Scholar] [CrossRef]
  7. Ajay, A.; Raja, V.S.; Sivakumar, G.; Joshi, S.V. Hot Corrosion Behavior of Solution Precursor and Atmospheric Plasma Sprayed Thermal Barrier Coatings. Corros. Sci. 2015, 98, 271. [Google Scholar]
  8. Huang, Y.; Shen, Y.; Zeng, Y.; Song, X.; Guo, S. EBSD Analysis of Microstructure Changes in YSZ Coatings During Thermal Cycling. Ceram. Int. 2020, 47, 5559. [Google Scholar] [CrossRef]
  9. Gildersleeve, J.; Sampath, S. Process-Geometry Interplay in the Deposition and Microstructural Evolution of 7YSZ Thermal Barrier Coatings by Air Plasma Spray. J. Therm. Spray Technol. 2020, 29, 560. [Google Scholar]
  10. Li, F.; Zhou, L.; Liu, J. High-Entropy Pyrochlores with Low Thermal Conductivity for Thermal Barrier Coating Materials. J. Adv. Ceram. 2019, 8, 76–582. [Google Scholar]
  11. Zhao, H.; Richards, B.T.; Levi, C.G.; Wadley, H.N. Molten silicate reactions with plasma sprayed ytterbium silicate coatings. Surf. Coat. Technol. 2016, 288, 151–162. [Google Scholar] [CrossRef]
  12. Jarligo, M.; Mack, D.; Mauer, G. Atmospheric Plasma Spraying of High Melting Temperature Complex Perovskites for TBC Application. J. Therm. Spray Technol. 2010, 19, 303–310. [Google Scholar] [CrossRef]
  13. Zaleski, E.M.; Ensslen, C.; Levi, C.G. Melting and Crystallization of Silicate Systems Relevant to Thermal Barrier Coating Damage. J. Am. Ceram. Soc. 2015, 98, 1642–1649. [Google Scholar] [CrossRef]
  14. Cao, X.Q.; Vassen, R.; Tietz, F.; Stoever, D. New double-ceramic-layer thermal barrier coatings based on zirconiaerare earth composite oxides. J. Eur. Ceram. Soc. 2006, 26, 247–251. [Google Scholar]
  15. Levi, C.G. Emerging materials and processes for thermal barrier systems. Curr. Opin. Solid State Mater. Sci. 2004, 8, 77–91. [Google Scholar]
  16. Xu, Z.; He, L.; Zhong, X.; Mu, R.D.; He, S.M.; Cao, X.Q. Thermal barrier coating of lanthanum-zirconium-cerium composite oxide made by electron beamphysical vapor deposition. J. Alloys Comp. 2009, 478, 168–172. [Google Scholar]
  17. Cao, X.Q.; Li, J.; Zhong, X.; Zhang, J.F.; Zhang, Y.F.; Vassen, R.; Stoever, D. La2(Zr0.7Ce0.3)2O7-a new oxide ceramic material with high sintering resistance. Mater. Lett. 2008, 62, 2667–2669. [Google Scholar]
  18. Vaßen, R.; Jarligo, M.; Steinke, T.; Mack, D.; Stöver, D. Overview on Advanced Thermal Barrier Coatings. Surf. Coat. Technol. 2010, 205, 938–942. [Google Scholar]
  19. Schulz, U.; Braue, W. Degradation of La2Zr2O7 and Other Novel EB-PVD Thermal Barrier Coatings by CMAS (CaO–MgO–Al2O3–SiO2) and Volcanic Ash Deposits. Surf. Coat. Technol. 2013, 235, 165. [Google Scholar]
  20. Cheng, B.; Wang, Y.; Zhang, X.; An, G.; Chu, Q.; Zhang, X.; He, D.; Zhai, H.; Li, W. Sintering Governing the Cracking Behaviors of Different La2Zr2O7/YSZ Ceramic Layer Combination TBCs at 1150 °C. Surf. Coat. Technol 2021, 428, 127910. [Google Scholar] [CrossRef]
  21. Wright, A.; Huang, C.; Walock, M.; Ghoshal, A.; Murugan, M. Sand Corrosion, Thermal Expansion, and Ablation of Medium- and High-Entropy Compositionally Complex Fluorite Oxides. J. Am. Ceram. Soc. 2020, 104, 448–462. [Google Scholar]
  22. Bahamirian, M. Nanostructured Gd2Zr2O7: A Promising Thermal Barrier Coating with High Resistance to CaO–MgO–Al2O3–SiO2 Corrosion. J. Aust. Ceram. Soc. 2023, 59, 165–177. [Google Scholar]
  23. Tong, Y.P. Study on Preparation, Structure and Catalytic Properties of Pyrochrite Type Rare Earth Zirconates. Ph.D. Thesis, Nanjing University of Science and Technology, Nanjing, China, 2008. [Google Scholar]
  24. Levi, C.G.; Hutchinson, J.W.; Vidal-Sétif, M.-H.; Johnson, C.A. Environmental Degradation of Thermal-Barrier Coatings by Molten Deposits. MRS Bull. 2012, 37, 932–941. [Google Scholar]
  25. Zhou, X.; Zou, B.; He, L.; Xu, Z.; Xu, J.; Mu, R.; Cao, X. Hot Corrosion Behaviour of La2(Zr0.7Ce0.3)2O7 Thermal Barrier Coating Ceramics Exposed to Molten Calcium Magnesium Aluminosilicate at Different Temperatures. Corros. Sci. 2015, 100, 566–578. [Google Scholar]
  26. Liu, Y.; Liu, Y.W.; Zhuang, L.; Yu, H.L.; Chu, Y.H. Composition-driven superior CMAS corrosion resistance of high-entropy rare-earth disilicates. Corros. Sci. 2024, 233, 112108. [Google Scholar]
  27. Guo, L.; Li, G.; Gan, Z. Effects of surface roughness on CMAS corrosion behavior for thermal barrier coating applications. Adv. Ceram. 2021, 10, 472–481. [Google Scholar]
  28. Deng, W.Z.; Fergus, J.W. Effect of CMAS composition on hot corrosion behavior of gadolinium zirconate thermal barrier coating materials. Electrochem. Soc. 2017, 164, 526. [Google Scholar]
  29. Krämer, S.; Yang, J.; Levi, C.G.; Johnson, C.A. Thermochemical interaction of thermal barrier coatings with molten CaO–MgO–Al2O3–SiO2 (CMAS) deposits. J. Am. Ceram. Soc. 2006, 89, 3167–3175. [Google Scholar]
Figure 1. Ceramic sample preparation.
Coatings 15 00483 g001
Figure 2. XRD pattern of L-GZC ceramics sintered at 1600 °C for 8 h.
Coatings 15 00483 g002
Figure 3. Raman spectra of L-GZC ceramics.
Coatings 15 00483 g003
Figure 4. SEM micrographs of L-GZC heat-treated at 1600 °C for 8 h (x = 0, 0.3, 0.5, and 0.7 correspond to (A), (B), (C), and (D), respectively).
Coatings 15 00483 g004
Figure 5. XRD pattern of CMAS powder.
Coatings 15 00483 g005
Figure 6. Melting point and glass-transition temperature of CMAS powder.
Coatings 15 00483 g006
Figure 7. SEM image of the cross section of the L-GZC ceramic material corroded at 1250 °C for 5 h (x = 0, 0.3, 0.5, and 0.7).
Coatings 15 00483 g007
Figure 8. Micromorphology of the ceramic surface corroded at 1250 °C for 5 h (x = 0 and 0.5).
Coatings 15 00483 g008
Figure 9. XRD patterns of ceramic material corroded at 1250 °C for 5 h.
Coatings 15 00483 g009
Figure 10. SEM images of ceramics after corrosion with CMAS at 1250 °C for 5 h.
Coatings 15 00483 g010
Figure 11. Cross-sectional micromorphology of L-GZC ceramics corroded at 1250 °C for 5 h (x = 0.7) Figure (b) is a local enlargement of the selected area in Figure (a) and an EDS spectrum corresponding to the local amplification map ((c) point A and (d) point B).
Coatings 15 00483 g011
Figure 12. Cross-section micromorphology and EDS energy profiles of the L-GZC ceramic corroded at 1250 °C for 5 h (a-original drawings and elements that may exist after corrosion).
Coatings 15 00483 g012
Figure 13. XPS spectra of (La0.5Gd0.5)2(Zr0.7Ce0.3)2O7 ceramic materials after CMAS corrosion for 5 h.
Coatings 15 00483 g013
Figure 14. SEM cross-section of (La1−xGdx)2(Zr0.7Ce0.3)2O7 ceramic material corroded by CMAS for 10 h at 1250 °C.
Coatings 15 00483 g014
Figure 15. XRD patterns of ceramics corroded at 1250 °C for 10 h.
Coatings 15 00483 g015
Figure 16. XRD patterns of ceramics corroded at 1250 °C for 20 h.
Coatings 15 00483 g016
Figure 17. Corrosion depth map of the ceramic cross section after CMAS corrosion at 1250 °C for 10 h.
Coatings 15 00483 g017
Figure 18. Corrosion depth map of the section after CMAS corrosion at 1250 °C for 20 h.
Coatings 15 00483 g018
Figure 19. Ternary phase diagram of CaO–Al2O3–SiO2 (wt%) showing component points in the C33M9A13S45 phase diagram [29].
Coatings 15 00483 g019
Table 1. Cell parameters of (La1−xGdx)2(Zr0.7Ce0.3)2O7 ceramic materials.
Theoretical Density/g·cm3Bulk Density/g·cm3Relatie Density/%
x = 010.82416.02595.988396.19
x = 0.310.75376.17276.026795.47
x = 0.510.72096.23156.162896.90
x = 0.710.70206.35826.201595.92
Table 2. EDS spectra corresponding to points A, B, and C of each component of the ceramic material.
PositionComponentZr (at.%)La (at.%)Ce (at.%)Gd (at.%)
ALa(Zr0.7Ce0.3)2O70.461.150.270.00
(La0.7Gd0.3)2(Zr0.7Ce0.3)2O70.081.000.500.18
(La0.5Gd0.5)2(Zr0.7Ce0.3)2O70.000.040.020.17
(La0.3Gd0.7)2(Zr0.7Ce0.3)2O70.000.150.120.14
BLa(Zr0.7Ce0.3)2O710.583.090.970.00
(La0.7Gd0.3)2(Zr0.7Ce0.3)2O711.141.482.471.96
(La0.5Gd0.5)2(Zr0.7Ce0.3)2O713.971.473.333.64
(La0.3Gd0.7)2(Zr0.7Ce0.3)2O76.221.091.974.08
CLa(Zr0.7Ce0.3)2O70.814.172.660.00
(La0.7Gd0.3)2(Zr0.7Ce0.3)2O70.004.551.411.76
(La0.5Gd0.5)2(Zr0.7Ce0.3)2O72.664.72.013.97
(La0.3Gd0.7)2(Zr0.7Ce0.3)2O70.902.782.016.30
PositionComponentCa(at.%)Mg(at.%)Al(at.%)Si(at.%)Results
ALa(Zr0.7Ce0.3)2O70.4511.0519.321.08MgAL2O4
(La0.7Gd0.3)2(Zr0.7Ce0.3)2O70.6110.1119.180.61
(La0.5Gd0.5)2(Zr0.7Ce0.3)2O70.1610.4719.590.05
(La0.3Gd0.7)2(Zr0.7Ce0.3)2O70.0811.8422.680.17
BLa(Zr0.7Ce0.3)2O71.323.535.962.34ZrO2
(La0.7Gd0.3)2(Zr0.7Ce0.3)2O71.580.250.100.68
(La0.5Gd0.5)2(Zr0.7Ce0.3)2O71.970.310.641.94
(La0.3Gd0.7)2(Zr0.7Ce0.3)2O71.971.202.063.94
CLa(Zr0.7Ce0.3)2O75.023.174.618.60RexCay(SiO4)6O2
(La0.7Gd0.3)2(Zr0.7Ce0.3)2O73.030.230.179.70
(La0.5Gd0.5)2(Zr0.7Ce0.3)2O73.470.440.967.90
(La0.3Gd0.7)2(Zr0.7Ce0.3)2O73.961.442.139.08
Table 3. XRF elemental analysis of the 5 h corrosion of La2(Zr0.7Ce0.3)2O7 ceramic material CMAS.
La2(Zr0.7Ce0.3)2O7 Corroded After 5 hElement Content(La0.3Gd0.7)2(Zr0.7Ce0.3)2O7 After Corrosion for 5 hElement Content
Al2O339.53%Al2O318.66%
ZrO234.29%ZrO230.40%
SiO210.43%SiO218.24%
La2O37.20%La2O33.00%
CeO23.82%CeO23.87%
CaO3.72%CaO8.20%
Gd2O38.57%
Disclaimer/Publisher’s Note: The statements, opinions and data contained in all publications are solely those of the individual author(s) and contributor(s) and not of MDPI and/or the editor(s). MDPI and/or the editor(s) disclaim responsibility for any injury to people or property resulting from any ideas, methods, instructions or products referred to in the content.

