
Parametric Study and Improvement of Anti-Corona Structure in Stator Bar End Based on Finite Element Analysis


Abstract
:1. Introduction
2. Materials and Methods
2.1. Anti-Corona Technique of Stator Bar
2.2. Corona Protection Material of Stator Bar
2.3. Primary Methods for Adjusting the Electric Field at the Ends of Electrical Machinery
3. Results
3.1. Wire Bar Corner
3.2. Length of Anti-Corona Coating
4. Discussion
4.1. Electrical Resistivity Setting
4.2. Nonlinearity Coefficient Analysis
5. Conclusions
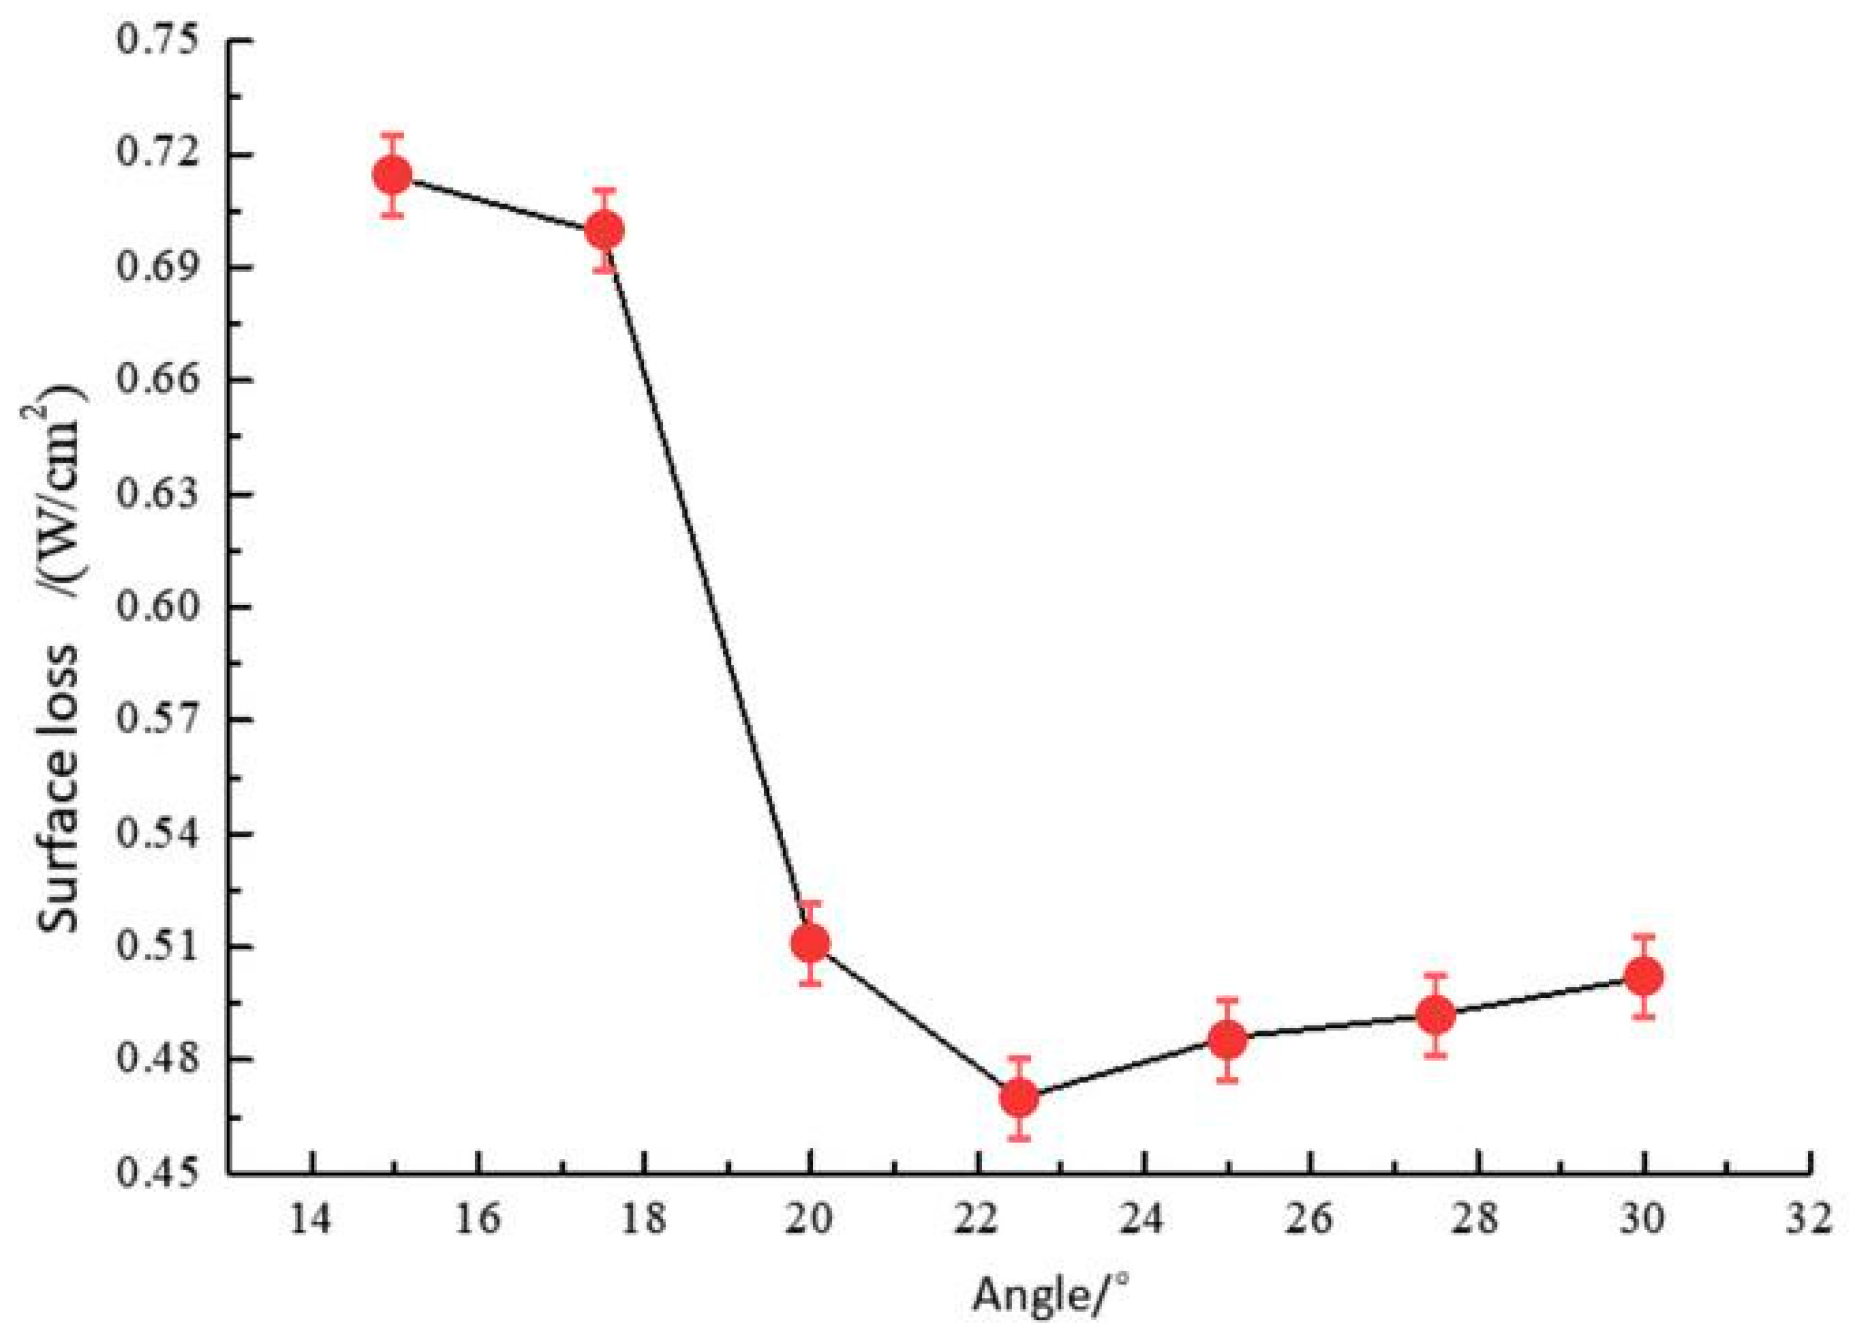
- When the corner angle was set to 22.5°, the electric field distribution was the most uniform, exhibiting the lowest maximum electric field value, which was 13.8% lower than that for the 15° corner angle;
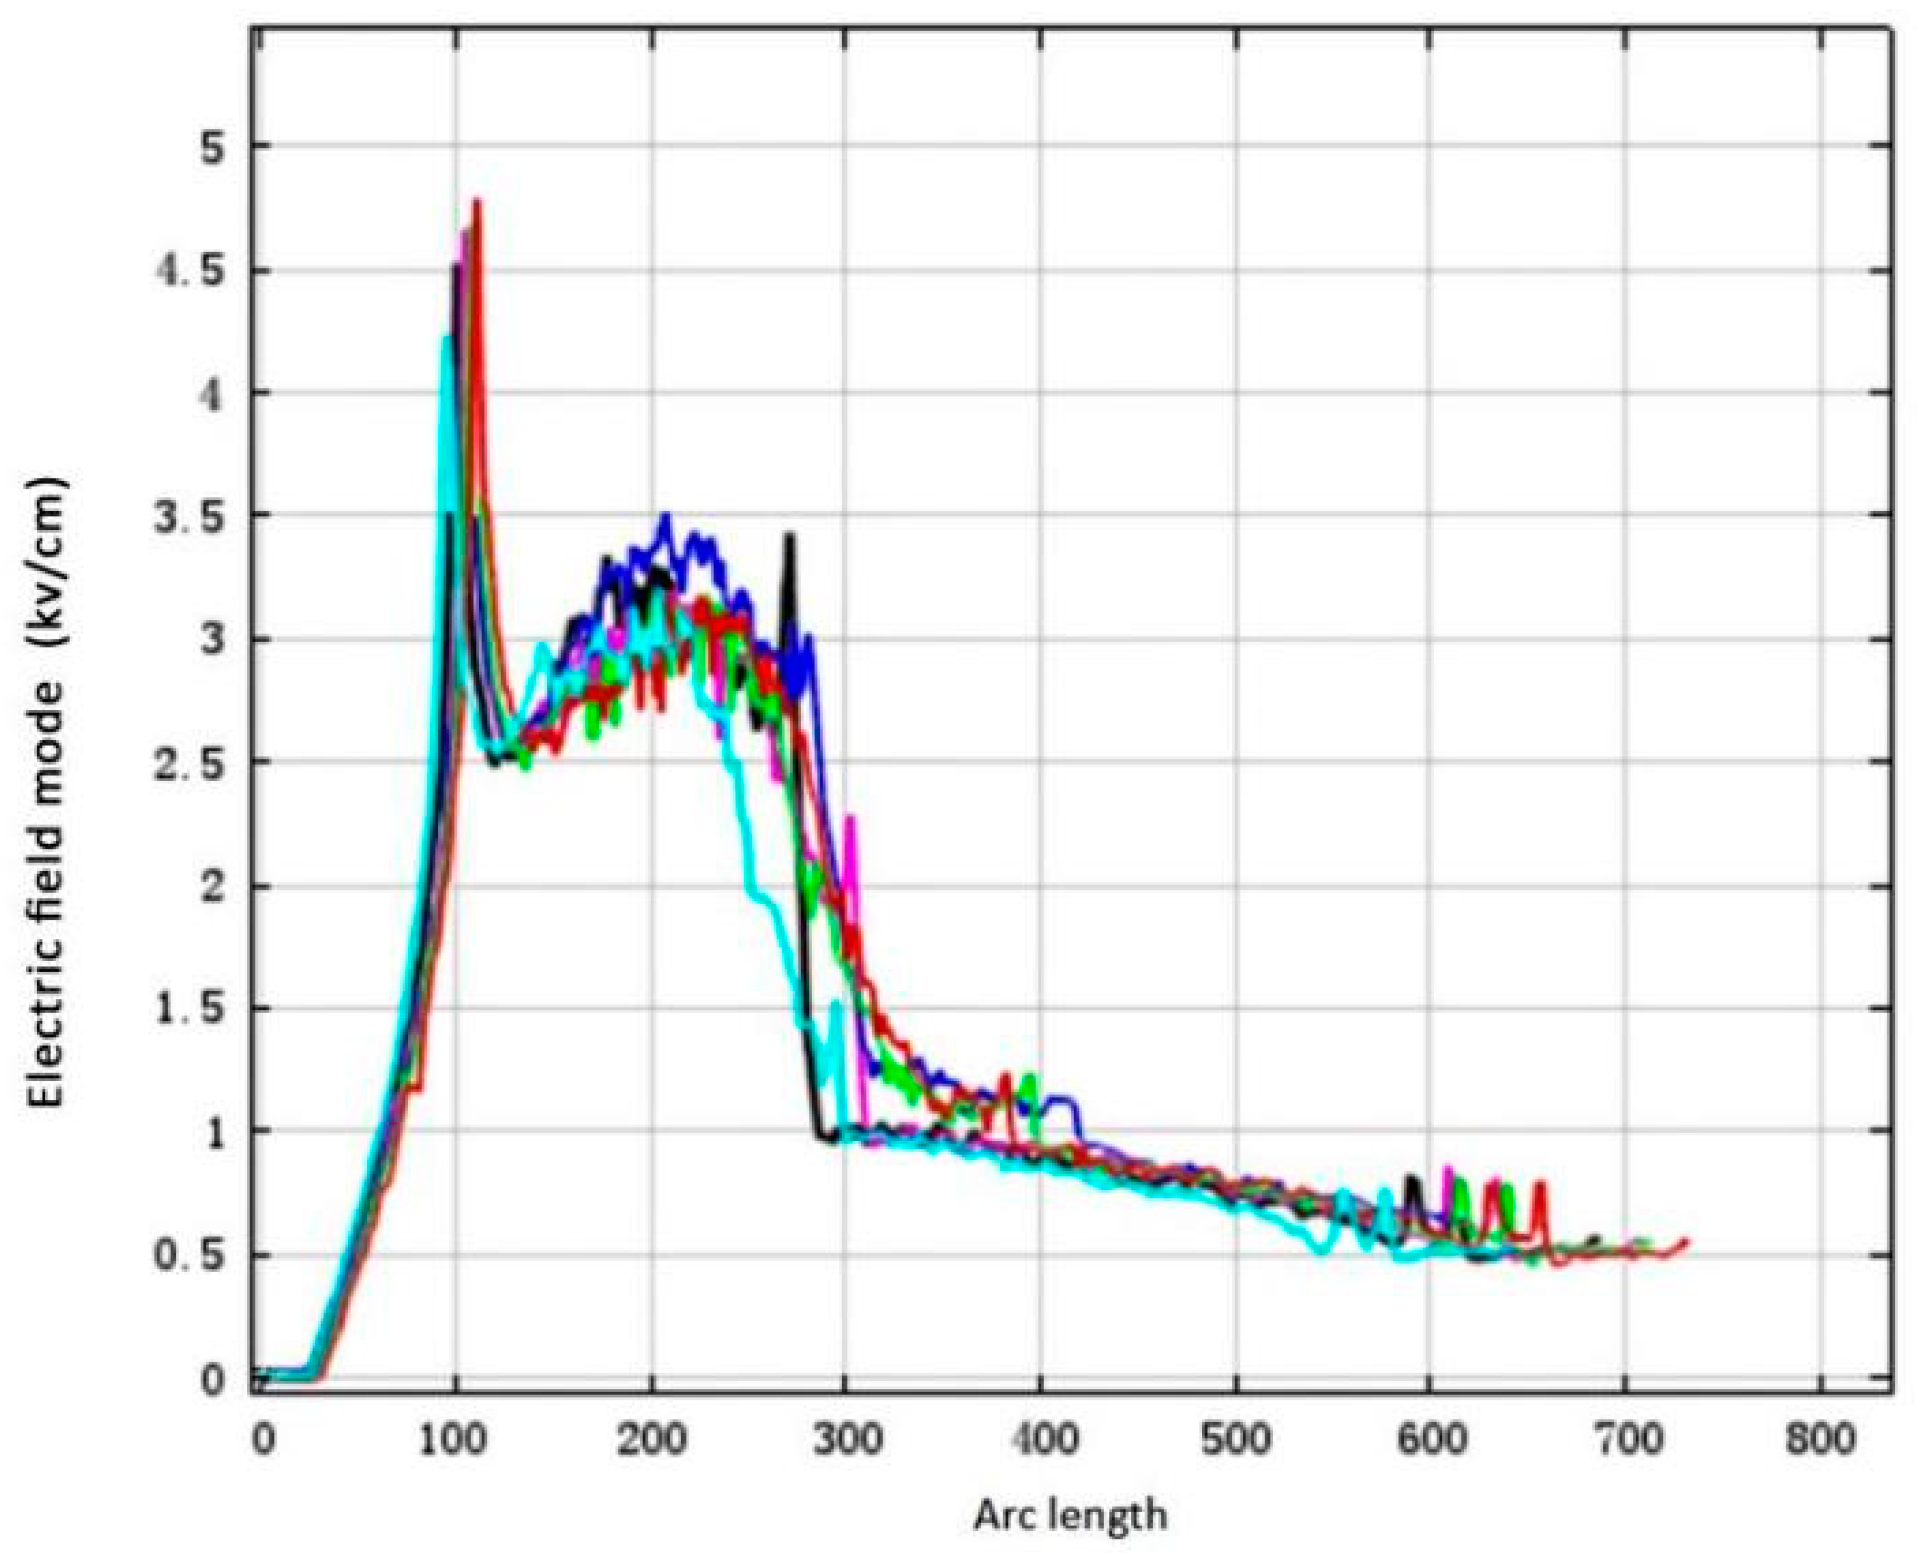
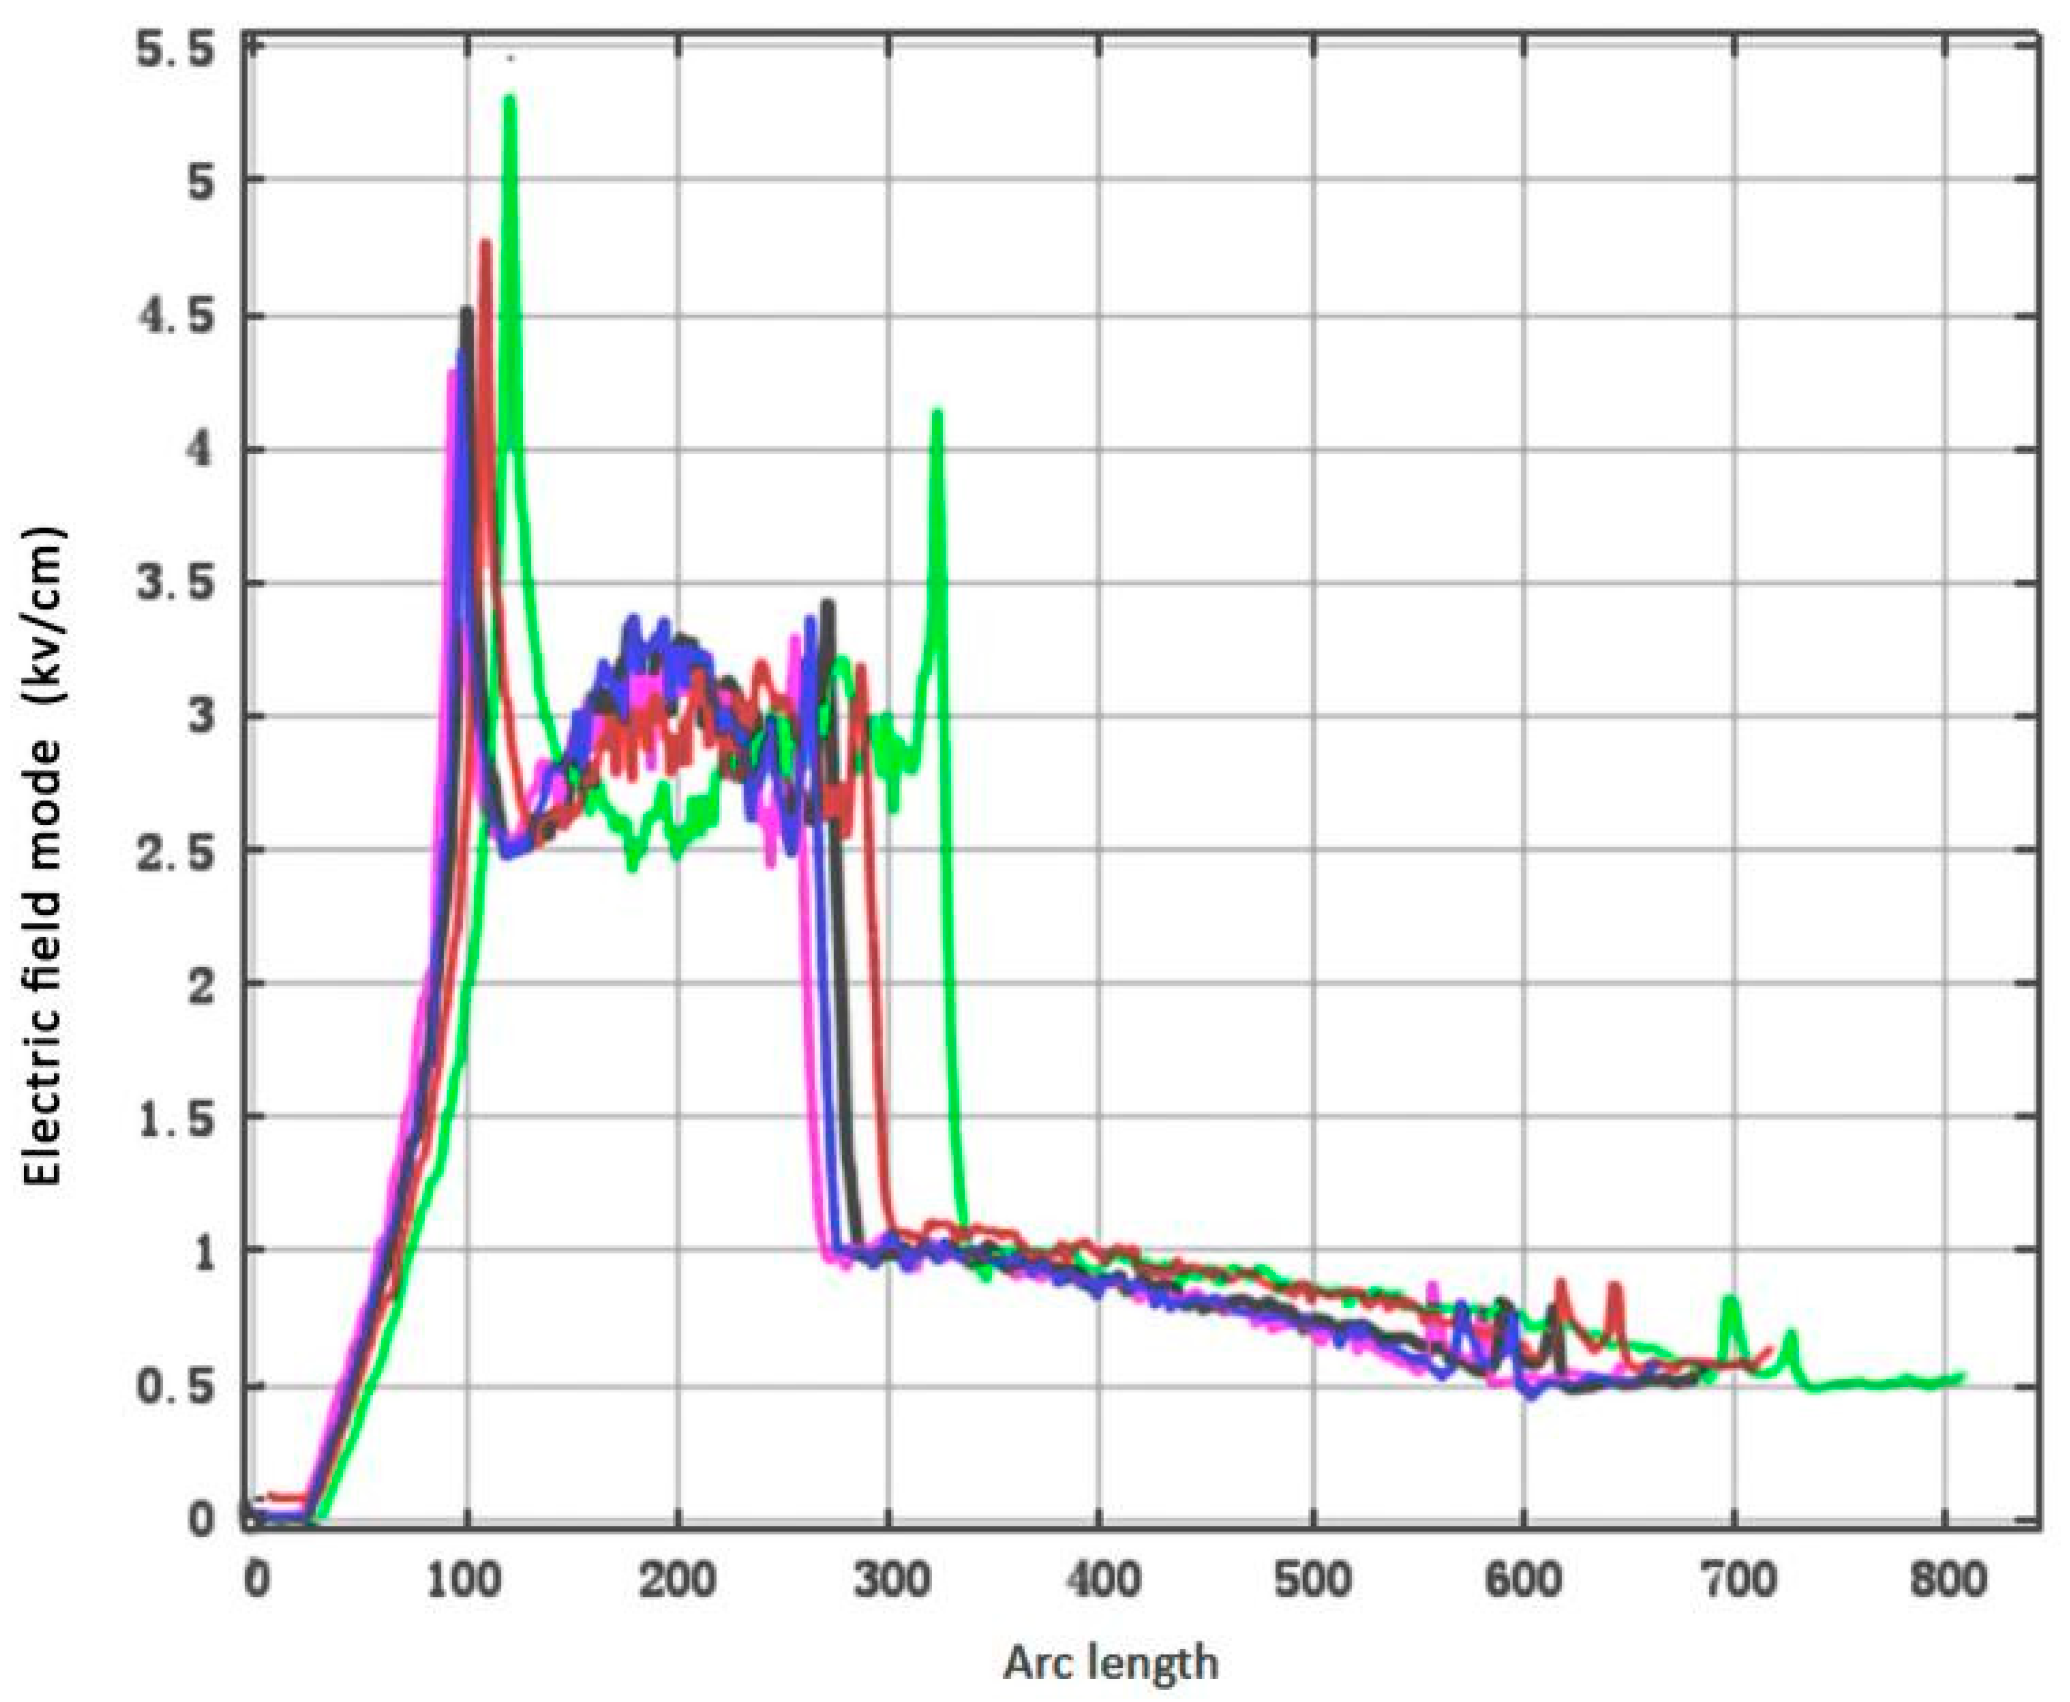
- A sudden change in the electric field occurred at the junction between the medium resistance and medium-high resistance layers. Through comparative analysis, the optimal length distribution of the anti-corona coating was identified. For the best anti-corona effect, the three-dimensional electric field value of the anti-corona coating was identified to be approximately 2.58 kV/cm, while the corresponding one-dimensional electric field value was 4.22 kV/cm;
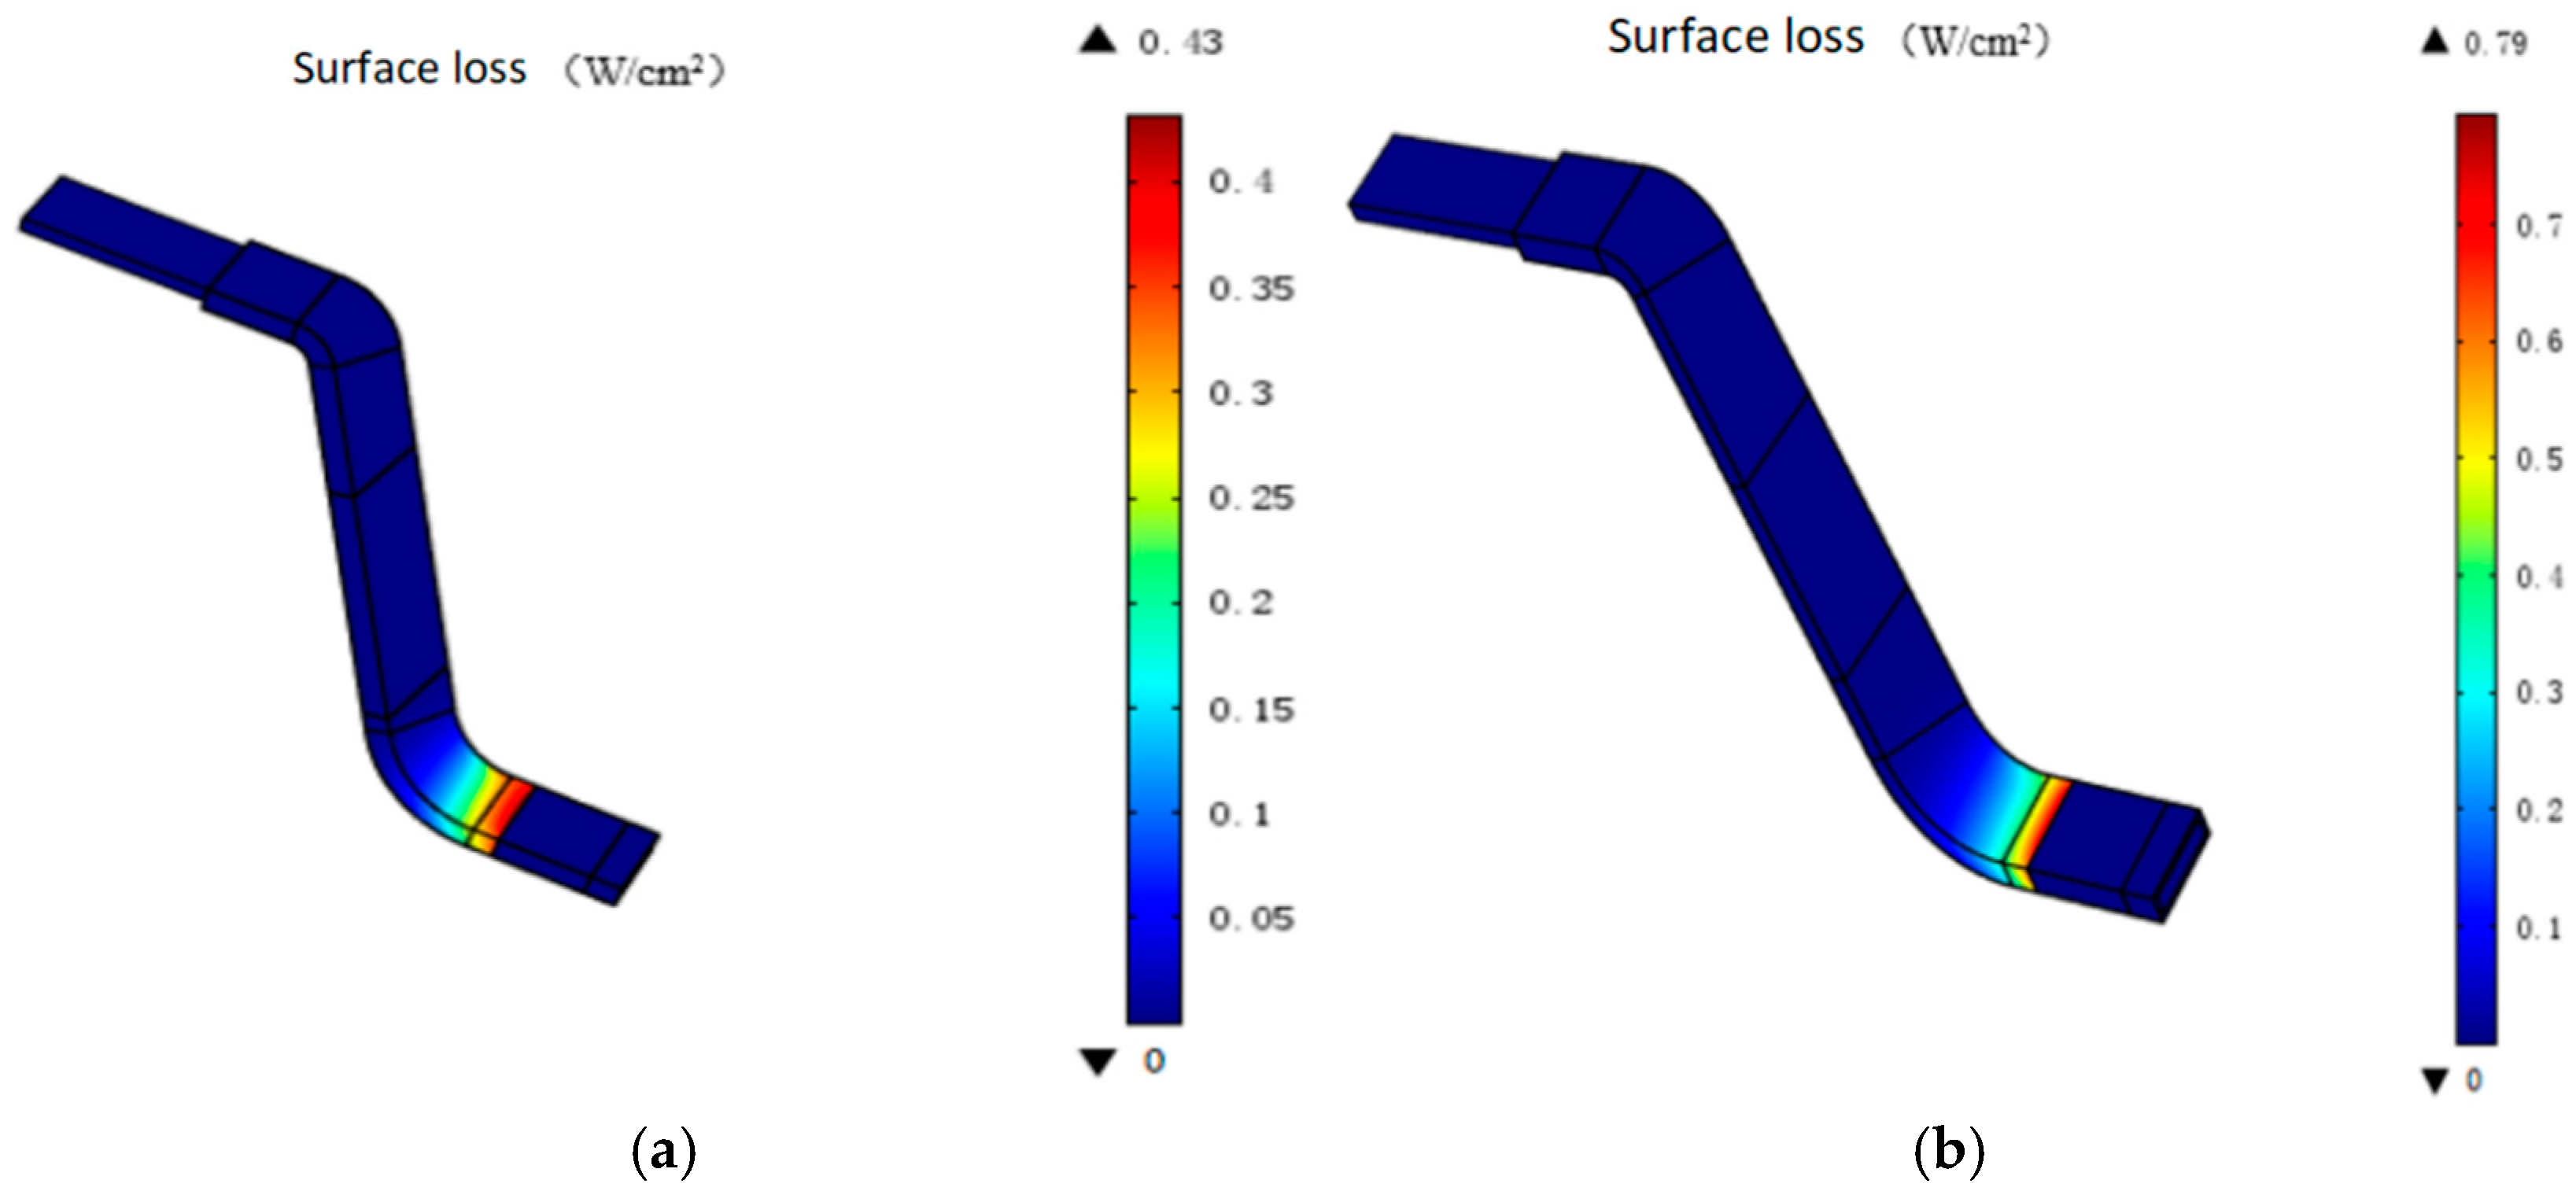
- The effects of the surface resistivity and nonlinearity coefficient of anti-corona materials on the electric potential and electric field distribution at the end of the wire bar were explored. Test results indicated that the surface resistivity in adjacent anti-corona segments should differ by one order of magnitude, with the medium resistance selected from the 107 order of magnitude. This reduced the loss to 0.430 W/cm2. By adjusting the nonlinearity coefficient, the optimal value range for the nonlinearity coefficient was identified.
Author Contributions
Funding
Institutional Review Board Statement
Informed Consent Statement
Data Availability Statement
Conflicts of Interest
References
- Ramkumar, M.P.; Ramasamy, G.; Azees, M.; Sakthi, U. FACVSPO: Fractional anti corona virus student psychology optimization enabled deep residual network and hybrid correlative feature selection for distributed denial-of-service attack detection in cloud using spark architecture. Int. J. Adapt. Control Signal Process. 2022, 36, 1647–1669. [Google Scholar]
- Larrea, A.M.; De La Hoz, M.; Etxegarai, A.; Mazon, A.J.; Aranzabal, I. Design of an anti-corona device for HVAC substation connectors. Energies 2022, 15, 5781. [Google Scholar] [CrossRef]
- Saviour, M.P.A.; Samiappan, D. IPFS based storage Authentication and access control model with optimization enabled deep learning for intrusion detection. Adv. Eng. Softw. 2023, 176, 103369. [Google Scholar] [CrossRef]
- Debnath, A.; Rao, K.S.; Das, P.P. A multi-modal lecture video indexing and retrieval framework with multi-scale residual attention network and multi-similarity computation. Signal Image Video Process. 2024, 18, 1993–2006. [Google Scholar] [CrossRef]
- Hernandez-Montero, W.W.; Itzmoyotl-Toxqul, A.; Zuniga-Islas, C. Effect of thermodynamic parameters on properties of silicon-carbon films prepared by radio-frequency plasma-enhanced chemical vapor deposition for anti-reflective and photo-luminescent coatings. J. Vac. Sci. Technol. B 2021, 39, 042203. [Google Scholar] [CrossRef]
- Joksimovic, G.; Melecio, J.I.; Tuohy, P.M.; Djurovic, S. Towards the optimal’ slot combination’ for steady-state torque ripple minimization: An eight-pole cage rotor induction motor case study. Electr. Eng. 2020, 102, 293–308. [Google Scholar] [CrossRef]
- Zhang, L.L.; Liang, Y.P. A new four-row integral transposition method of stator windings and circulating current loss reduction in large turbo generators. IET Electr. Power Appl. 2023, 17, 124–133. [Google Scholar] [CrossRef]
- Aoyama, M.; Mizuta, T.; Ito, K. Verification of effect of secondary conductor bar on starting characteristics in line-star type self-excited wound-field synchronous motor. IET Electr. Power Appl. 2021, 14, 2818–2831. [Google Scholar] [CrossRef]
- Zhou, Y.; Zhang, Q.L.; Duan, J.G. Dynamical characteristics and influencing factors of stator end-windings of a turbine generator analyzed via heterogeneous element fusion modeling. Energy Rep. 2022, 7, 658–672. [Google Scholar] [CrossRef]
- Mahmoudian, Y.; Izadfar, H.R.; Foroud, A.A. Introduction of a modified thermal model for squirrel cage induction motor based on calculation of rotor bars’ current. Electr. Eng. 2023, 105, 141–150. [Google Scholar] [CrossRef]
- Keller, M.; Petri, T.; Waldhof, M.; Schuller, F.; Maier, M.; Parspour, N. Modeling the dynamic voltage distribution in electric traction motor windings and its application on hv optimal winding design. IEEE Trans. Ind. Appl. 2024, 60, 3820–3829. [Google Scholar] [CrossRef]
- Maurer, F.; Noland, J.K. A differential strand-slot inductance model for improved compensation of circulating currents in the core part of large AC machines. IEEE Trans. Energy Convers. 2022, 37, 1346–1357. [Google Scholar] [CrossRef]
- Ghods, M.; Faiz, J.; Rashipour, E.; Bazrafshan, M.A.; Besmi, M.R. Design of a non-ferromagnetic spoke array Vernier permanent magnet generator with iron-bar based on enhanced equivalent magnetic network model. IET Electr. Power Appl. 2023, 17, 392–408. [Google Scholar] [CrossRef]
- Martinez-Roman, J.; Puche-Panadero, R.; Sapena-Bano, A.; Terron-Santiago, C.; Burriel-Valencia, J.; Pineda-Sanchez, M. Analytical model of induction machines with multiple cage faults using the winding tensor approach. Sensors 2021, 21, 5076. [Google Scholar] [CrossRef] [PubMed]
- Bian, X.; Sun, Y.T.; Zou, J.B.; Li, J.Z. Study on the fluid-solid coupling heat transfer in the stator of large synchronous condenser considering complex transposition structure. IEEE Access 2024, 12, 26110–26118. [Google Scholar] [CrossRef]
- Tian, P.F.; Guerrero, J.M.; Mahtani, K.; Platero, C.A. Instantaneous specific protection method against faulty synchronizations of synchronous machines. IEEE Access 2021, 9, 88868–88878. [Google Scholar] [CrossRef]
- Ye, C.; Li, W.; Yang, J.; Chang, S.; Zhi, G.; Xiang, Y.; Zhu, D. Development and analysis of a novel cascaded brushless self-excited air-core compensated pulsed alternator with squirrel-cage rotor winding. IEEE Trans. Ind. Electron. 2021, 68, 5571–5581. [Google Scholar] [CrossRef]
- Hu, H.T.; Zhang, X.H.; Liu, Y.L.; Guo, L.J.; Gao, J.G. Optimization of the Electric Field Distribution at the End of the Stator in a Large Generator. Energies 2018, 11, 2510. [Google Scholar] [CrossRef]
- Yuan, P.; Wang, H. Design and Simulation Analysis of Anti-Corona Structure at the End of the Stator Bar of Large Hydrogenerators. In Proceedings of the International Conference on Electronic Technology, Communication and Information (ICETCI), Changchun, China, 27–29 August 2021; pp. 77–83. [Google Scholar]
- Liao, Z.H.; Xu, J.L.; Wan, B.Q. Finite element analysis of total electric field distribution on the roof of flat-roofed buildings near HVDC lines. Electr. Eng. 2023, 105, 1153–1162. [Google Scholar] [CrossRef]
- Zhang, J.H.; Shi, J.L.; Zhang, J. Analysis of the surface electric field distribution of a 10kv faulty composite insulator. Electronics 2022, 11, 3740. [Google Scholar] [CrossRef]
- Johri, P.; Reddy, C.C.; Kumar, C. Electric field dynamics in PILC side of dry type MV heat-shrink transition joints. IEEE Trans. Power Delivery 2022, 37, 1888–1896. [Google Scholar] [CrossRef]
- Han, W.X.; Yang, G. A data-driven model of cable insulation defect based on convolutional neural networks. Appl. Sci. 2022, 12, 8374. [Google Scholar] [CrossRef]
- Ciuprina, G.; Sabariego, R.V. Numerical stability of dual full-wave formulations with electric circuit element boundary conditions. IEEE Trans. Magn. 2024, 60, 7401504. [Google Scholar] [CrossRef]
- Gyftakis, K.N.; Platero, C.A.; Noland, J.K. Multi-Parametric Condition Monitoring of Medium-Power Generators with Brushless Exciters under Mechanical Faults. IEEE Trans. Ind. Appl. 2024, 60, 93–100. [Google Scholar] [CrossRef]
- Azouzi, K.; Boudinar, A.H.; Aimer, F.A.; Bendiabdellah, A. Use of a Combined SVD-Kalman Filter Approach for Induction Motor Broken Rotor Bars Identification. J. Microw. Optoelectron. Electromagn. Appl. 2018, 17, 85–101. [Google Scholar] [CrossRef]
- Agah, G.R.; Rahideh, A.; Khodadadzadeh, H.; Khoshnazar, S.M.; Kia, S.H. Broken Rotor Bar and Rotor Eccentricity Fault Detection in Induction Motors Using a Combination of Discrete Wavelet Transform and Teager-Kaiser Energy Operator. IEEE Trans. Energy Convers. 2022, 37, 2199–2206. [Google Scholar]
- Chehaidia, S.E.; Cherif, H.; Alraddadi, M.; Mosaad, M.I.; Bouchelaghem, A.M. Experimental Diagnosis of Broken Rotor Bar Fault in Induction Motors at Low Slip via Hilbert Envelope and Optimized Subtractive Clustering Adaptive Neuro-Fuzzy Inference System. Energies 2022, 15, 6746. [Google Scholar] [CrossRef]
- Guo, N.; Dong, Y.Z.; Wang, J.W.; Hu, H.T.; Gao, J.G. Modulation of Anti-corona Properties by ZnO Nanoparticles and SiO2 Nanoparticles. J. Mater. Sci. Mater. Electron. 2024, 35, 1529. [Google Scholar] [CrossRef]
- Shizad, E. Analytical Model for Double-Sides Linear Permanent Magnet Inner Armature Synchronous Machine with Slot-Less Stator at on-Load in Different Patterns of Magnetization. Electr. Eng. 2024, 106, 1533–1547. [Google Scholar] [CrossRef]
- Yu, G.; Cheng, Y.J. Hydro Generator Stator Bar Modeling and Simulation Based on Finite Element Simulation. Coatings 2024, 14, 1499. [Google Scholar] [CrossRef]


| Anticorona Coating | Medium Resistance Section (mm) | Medium-High Resistance Section (mm) | High Resistance Section (mm) | Color | |
|---|---|---|---|---|---|
| Groups | |||||
| Original length | 170.48 | 183.13 | 232.58 | Black | |
| 1 | 192.03 | 161.58 | 232.58 | Pink | |
| 2 | 213.57 | 140.04 | 232.58 | Blue | |
| 3 | 235.18 | 118.49 | 232.58 | Green | |
| 4 | 256.66 | 96.95 | 232.58 | Red | |
| 5 | 278.21 | 75.40 | 232.58 | Cyan | |
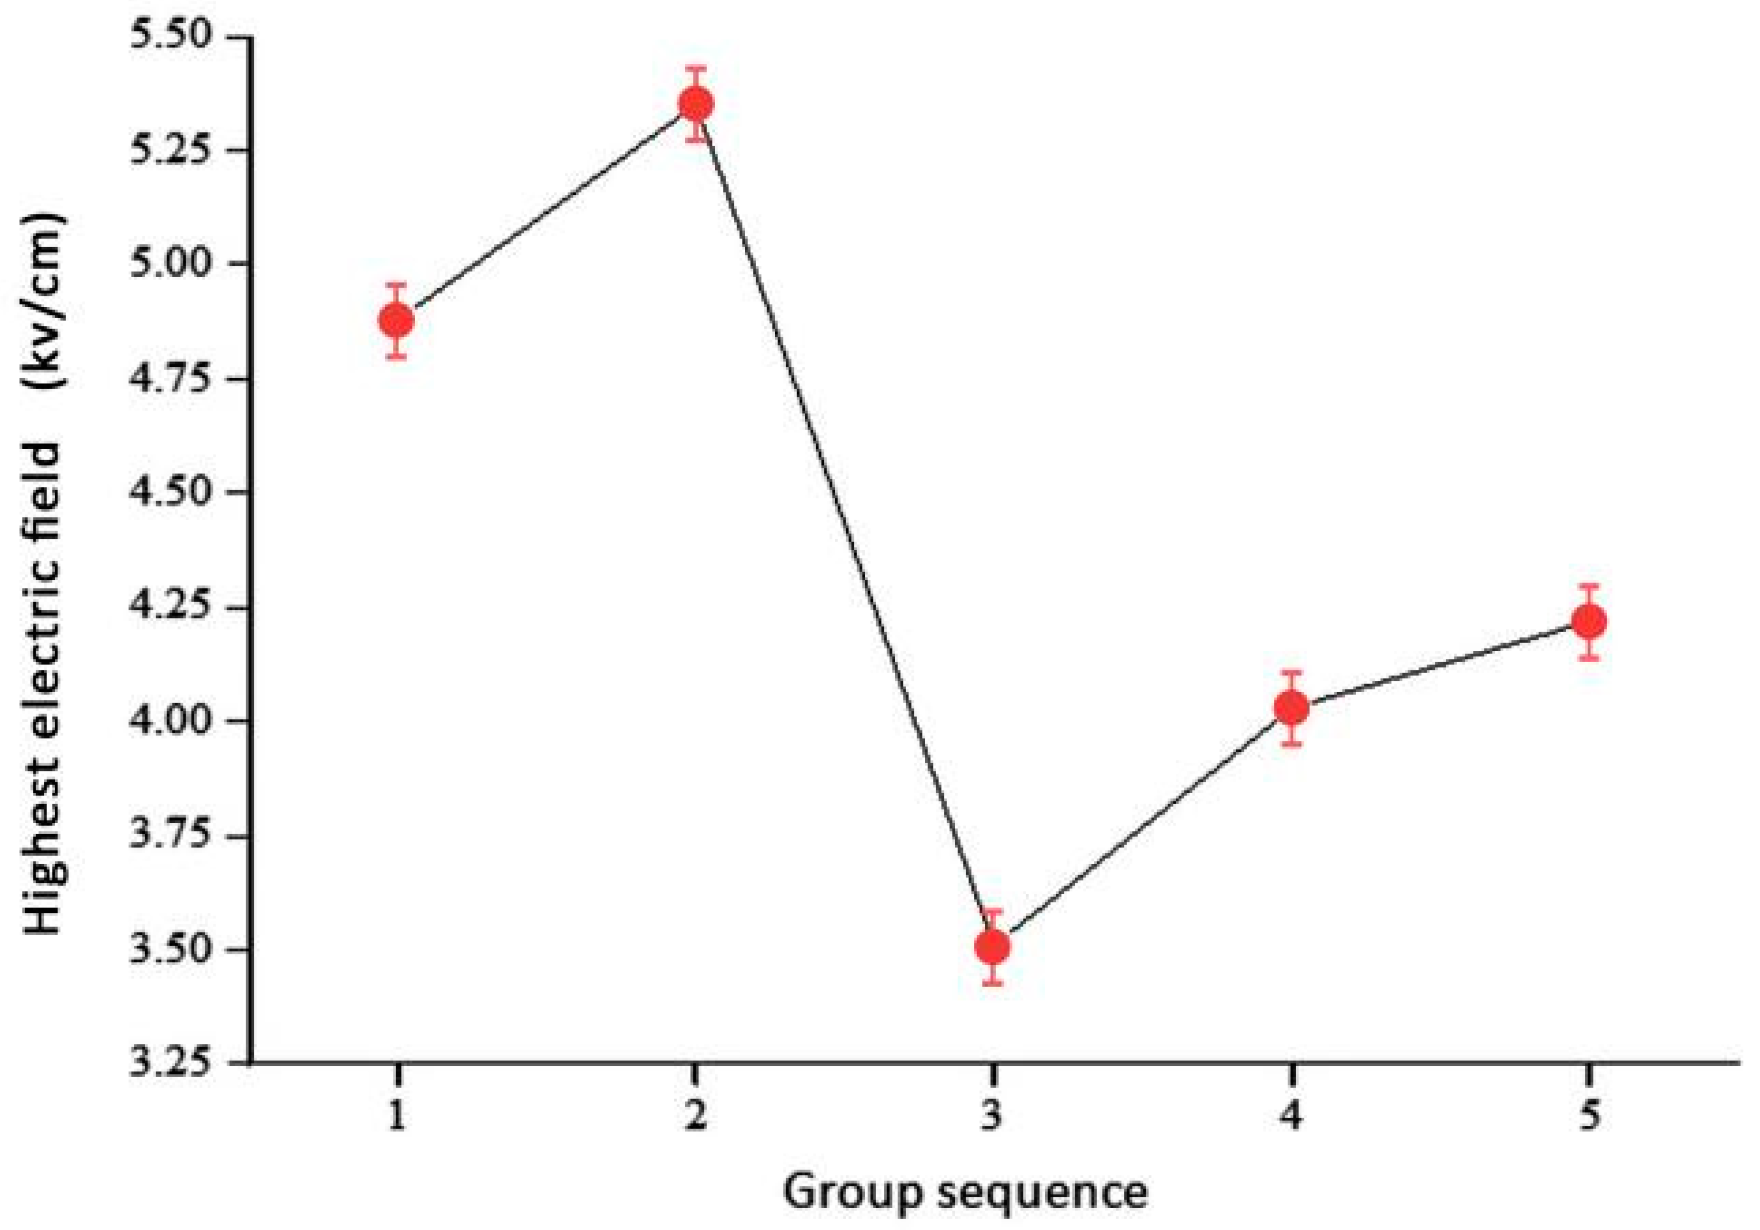
| Groups | Original Length | 1 | 2 | 3 | 4 | 5 |
|---|---|---|---|---|---|---|
| Highest electric field values (kV/cm) | 4.51 | 4.65 | 4.05 | 4.70 | 4.76 | 4.22 |
| Anti-Corona | Medium Resistance Section (mm) | Medium-High Resistance Section (mm) | High Resistance Section (mm) | Color | |
|---|---|---|---|---|---|
| Coating Groups | |||||
| Original length | 170.48 | 183.13 | 232.58 | Black | |
| 6 | 170.48 | 204.67 | 211.04 | Pink | |
| 7 | 170.48 | 226.22 | 189.50 | Green | |
| 8 | 170.48 | 247.76 | 167.75 | Red | |
| 9 | 170.48 | 269.30 | 146.40 | Cyan | |
| Groups | Original Length | 6 | 7 | 8 | 9 |
|---|---|---|---|---|---|
| Highest electric field values (kV/cm) | 4.49 | 4.28 | 5.33 | 4.74 | 4.40 |
| Parameters | Medium Resistance Section | Medium-High Resistance Section | High Resistance Section |
|---|---|---|---|
| Length (mm) | 213.57 | 204.67 | 167.95 |
| Anti-Corona Coating | Medium Resistance Section (Ω·m) | Medium-High Resistance Section (Ω·m) | High Resistance Section (Ω·m) | |
|---|---|---|---|---|
| Groups | ||||
| 1 | 8 × 10⁶ | 5 × 10⁷ | 1 × 10⁸ | |
| 2 | 8 × 10⁶ | 5 × 10⁸ | 1 × 10¹⁰ | |
| 3 | 8 × 10⁶ | 5 × 10⁹ | 1 × 10¹² | |
| 4 | 8 × 10⁷ | 5 × 10⁸ | 1 × 10⁹ | |
| 5 | 8 × 10⁷ | 5 × 10⁹ | 1 × 10¹¹ | |
| 6 | 8 × 10⁷ | 5 × 10¹⁰ | 1 × 10¹³ | |
| 7 | 8 × 10⁸ | 5 × 10⁹ | 1 × 10¹⁰ | |
| 8 | 8 × 10⁸ | 5 × 10¹⁰ | 1 × 10¹² | |
| 9 | 8 × 10⁸ | 5 × 10¹¹ | 1 × 10¹⁴ | |
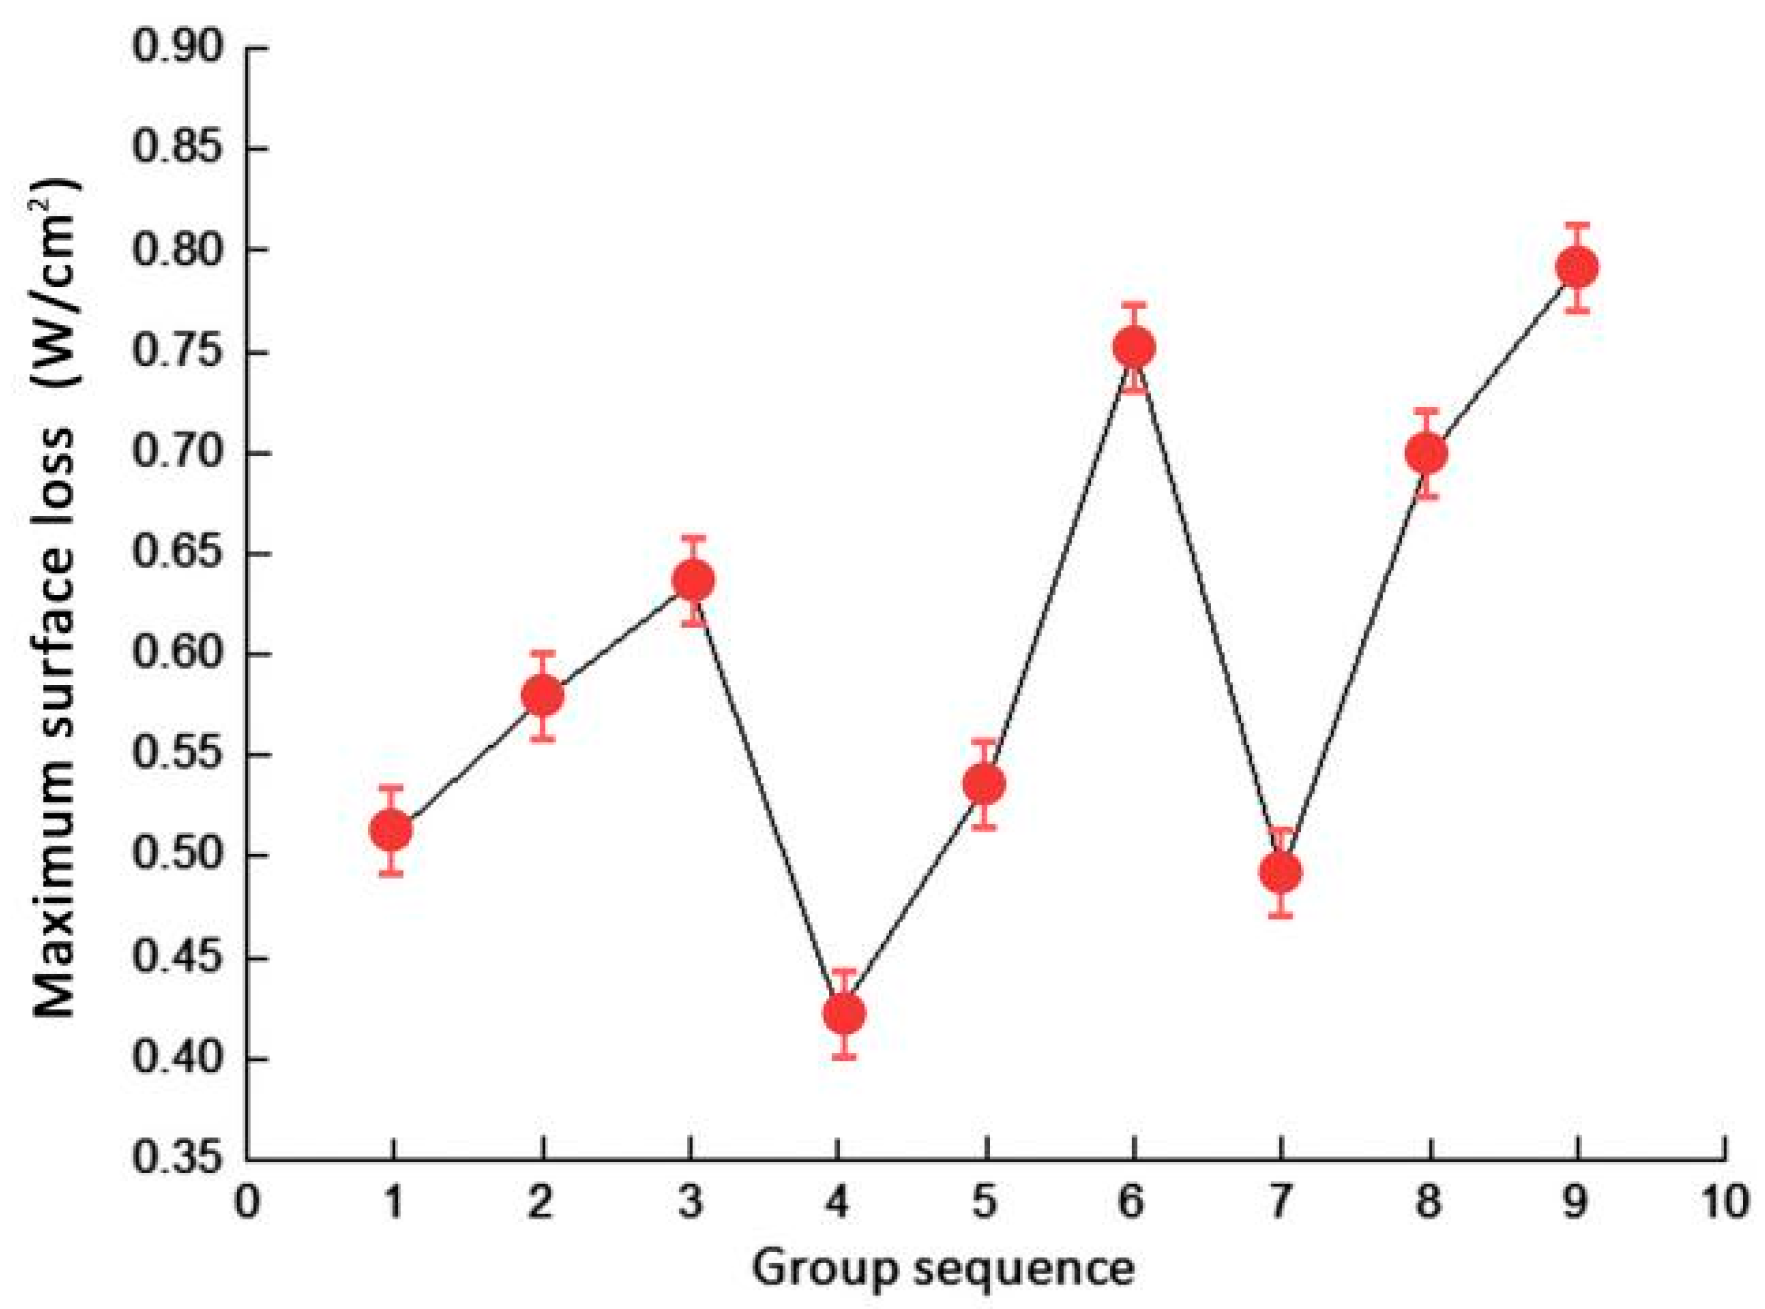
| Groups | 1 | 2 | 3 | 4 | 5 | 6 | 7 | 8 | 9 |
|---|---|---|---|---|---|---|---|---|---|
| Maximum value of surface loss (W/cm2) | 0.511 | 0.578 | 0.635 | 0.430 | 0.536 | 0.752 | 0.492 | 0.699 | 0.792 |
| Groups | Medium Resistance Coating (cm/kV) | Medium-High Resistance Coating (cm/kV) | High Resistance Coating (cm/kV) | Color |
|---|---|---|---|---|
| 1 | 0.6 | 0.8 | 1.0 | Pink |
| 2 | 0.7 | 0.9 | 1.1 | Gray |
| 3 | 0.8 | 1.0 | 1.2 | Red |
| 4 | 0.9 | 1.1 | 1.3 | Green |
| 5 | 1.0 | 1.2 | 1.4 | Blue |
Disclaimer/Publisher’s Note: The statements, opinions and data contained in all publications are solely those of the individual author(s) and contributor(s) and not of MDPI and/or the editor(s). MDPI and/or the editor(s) disclaim responsibility for any injury to people or property resulting from any ideas, methods, instructions or products referred to in the content. |
© 2025 by the authors. Licensee MDPI, Basel, Switzerland. This article is an open access article distributed under the terms and conditions of the Creative Commons Attribution (CC BY) license (https://creativecommons.org/licenses/by/4.0/).
Share and Cite
Cheng, Y.; Yu, G. Parametric Study and Improvement of Anti-Corona Structure in Stator Bar End Based on Finite Element Analysis. Coatings 2025, 15, 484. https://doi.org/10.3390/coatings15040484
Cheng Y, Yu G. Parametric Study and Improvement of Anti-Corona Structure in Stator Bar End Based on Finite Element Analysis. Coatings. 2025; 15(4):484. https://doi.org/10.3390/coatings15040484
Chicago/Turabian StyleCheng, Yujia, and Guang Yu. 2025. "Parametric Study and Improvement of Anti-Corona Structure in Stator Bar End Based on Finite Element Analysis" Coatings 15, no. 4: 484. https://doi.org/10.3390/coatings15040484
APA StyleCheng, Y., & Yu, G. (2025). Parametric Study and Improvement of Anti-Corona Structure in Stator Bar End Based on Finite Element Analysis. Coatings, 15(4), 484. https://doi.org/10.3390/coatings15040484