Abstract
This study aims to investigate the effects of different fluoride salts added in the PEO bath on the corrosion resistance and morphology of AZ31 magnesium alloy coatings. The PEO process was performed using a bipolar cycle with varying durations (4 and 30 min) in baths containing different fluoride salts (NaF, LiF, Na2SiF6) and a reference bath without fluoride. The coatings were characterised using SEM-EDS, XRD, and electrochemical impedance spectroscopy (EIS) to assess their morphology, chemical composition, and corrosion resistance. The results indicate that the presence of fluorides significantly influences the coating properties. NaF and Na2SiF6 coatings exhibited better corrosion resistance and more compact microstructures compared to LiF and the fluoride-free reference. The study highlights the importance of the fluoride counter ion in the PEO bath, demonstrating that NaF and Na2SiF6 provide superior protection against corrosion, making them suitable for biomedical applications where both porosity and corrosion resistance are critical.
1. Introduction
In modern times, various factors can lead to bone fractures. When the fracture is minor, a cast can suffice, allowing the bone to heal naturally without movement. However, for more severe or displaced fractures, an implant may be necessary. Unfortunately, the current consolidation technique involves two surgeries: a first one to place the implant and a second one to remove it. In addition, the screws used to fix the implant can provoke stress shielding. Stress shielding refers to the reduction in bone density due to the removal of typical bone stresses by an implant. Magnesium is a good compromise, as its modulus of elasticity is close to that of bone (41–45 GPa). Therefore, there is a need to explore alternatives that consolidate the bone without resorting to two surgical procedures or compromising the bone strength [1].
Furthermore, the advantage of using metallic biomaterials is that they consolidate bone without compromising its strength. Metallic biomaterials are an ideal option, offering both superior durability and fracture resistance compared to polymeric and ceramic biomaterials [2].
Pure magnesium exhibits low mechanical strength, with a tensile strength of approximately 20 MPa. However, alloying it with other materials enhances its properties, enabling tailored characteristics for specific applications. These alloys achieve improved mechanical strength while retaining features like lightness, a Young’s modulus of 44 GPa, high thermal conductivity, machinability, and recyclability [3,4]. Magnesium alloys in the AZ family, containing aluminium and zinc, find widespread use across various applications. However, impurities like iron (Fe) or copper (Cu) can compromise their corrosion resistance. By adding manganese (Mn), intermetallic particles are formed, effectively trapping impurities and enhancing the corrosion resistance [5,6]. However, the formation of these intermetallic particles will also weaken the α-Mg matrix and causes microgalvanic corrosion [7].
In recent research, scientists have tackled various challenges related to magnesium materials. Over the past few years, advancements have been made in surface treatments, including coatings, plasma electrolytic oxidation, and the use of alloys containing calcium (Ca), aluminium (Al), and zinc (Zn). These alloy-based treatments enhance the corrosion resistance, which has traditionally been a weakness for magnesium substrates [8,9].
Plasma electrolytic oxidation (PEO), also known as micro-arc oxidation (MAO), is a quite novel surface treatment process that produces thick, dense metal oxide coatings—especially on light metals—to enhance wear and corrosion resistance. During PEO, high electric voltages are applied to the light alloy, resulting in the formation of a protective ceramic-like layer. The process uses environmentally friendly weak alkaline electrolytes [9]. Various researchers have studied the morphology of the PEO layer on magnesium. The coating consists of three different layers: a porous outer layer, a dense and thick intermediate layer, and a thin and compact inner layer. The latter acts as a barrier layer, while the outer layer provides the coating’s mechanical properties [10]. Special attention should be given to the protective anodic layers produced on Mg, where it has formed a layer consisting of MgO and species from the electrolyte and substrate, producing coatings of significant thickness and compactness and offering improved performance in terms of corrosion and wear [11]. In plasma electrolytic oxidation (PEO), the most extensively studied electrolyte baths contain PO43− ions, silicon, and/or F− ions. Research by Mirdamadi et al. demonstrated that PEO coatings exhibit greater corrosion resistance when produced in phosphate-based electrolytes compared to silicate-based coatings. However, the silicate-coated surface tends to be rougher. The authors concluded that the final stress is lower in the silicate bath, which reduces the size of the pores formed during the process [12]. Yang et al. investigated the impact of bath additives on micro-arc oxidation coatings. They found that adding NaF led to a more compact microstructure and improved corrosion resistance, in contrast to Na3PO4 [13]. Liang et al. [14] reported that potassium fluoride increased layer compactness and bath conductivity. They demonstrated that the reduction in pore size and surface roughness was due to the presence of MgF2.
A study by H. Soliman and A. S. Hamdy demonstrated that fluoride significantly affects the hardness of ceramic layers produced through plasma electrolytic oxidation (PEO) and influences their corrosion resistance. Another study conducted by A.B. Rogov and V.R. Shayapov revealed that the counter ions present in the electrolyte bath plays a crucial role in shaping the PEO ceramic layer. The results reveal that the electrical and optical characteristics of the PEO process are influenced by the chemical nature of the cations. The most interesting baths are those containing NaOH and KOH. Indeed, it can reduce the roughness, increase the thickness of the dense layer and its uniformity, increase the average microhardness, reduce the porosity, and improve the adhesion of the coating [15,16].
The fluorine content has been found to influence the properties of the PEO coatings but based on our knowledge, the impact and the comparison of different fluorine species added in the bath has not been systematically investigated. This study aims to investigate and compare the effect of the counter ion of the fluoride salt added in the PEO bath and the corrosion resistance of each substrate and the morphology of the layers.
2. Materials and Methods
All coatings were developed on AZ31 magnesium alloy which is composed of 2.5–3.5 wt.% Al, 1.6–1.4 wt.% Zn, <0.3 wt.% Si, <0.2 wt.% Mn, and balanced Mg. The shape of the sample is rectangular with dimensions of 50 mm × 40 mm × 2 mm.
Pre-treatment to remove oxide from the alloy was performed by chemical treatment. The samples were immersed in a 2 M HNO3 bath and in a second step in 0.25 M HNO3 solution [17].
The PEO process was performed using a Power Pulse-Micronics. The PEO was applied using a bipolar cycle made of an anode cycle of 400 V for 5 ms, a cathode cycle of −30 V for 5 ms, and a Toff of 5 ms. The frequency and the duty cycle were 67 Hz and 66.7%, respectively. Two different durations were tested, 4 and 30 min, and the current density was 175 mA/cm2.
The analyses were performed on the samples for the different PEO bath compositions (Table 1) respecting the same fluoride concentration and a similar conductivity.

Table 1.
Composition of the different baths, pH, and conductivity.
The samples were characterised by various techniques to study their corrosion resistance, and to determine their layer thickness and morphology, chemical composition, average pore size, and microhardness. Layer morphology and chemical composition were investigated by scanning electron microscopy and energy dispersive spectroscopy (SEM-EDS) with a Hitachi SU8020 (Hitachi, Tokyo, Japan). Average pore size was characterised by Image-J (Java 1.8.0_172, software Image-J 1.53K) [18]. X-ray diffraction (Malvern Panalytical Empyrean) was carried out undertaken in grazing incidence mode (ω = 1°) to minimise the effect of the substrate on diffraction patterns (copper anti-cathode, λ = 1.54 Å), step size (0.01°), and time per step (3 s). Grazing incidence diffraction XRD was used to analyse the crystalline structure of the coating.
Corrosion resistance was studied using electrochemical impedance spectroscopy with a Biologic SP-300 (BioLogic, Grenoble, France) device. Electrochemical impedance spectroscopy (EIS) was employed to assess the corrosion protection conferred by the coating using a three-electrode cell housed in a faraday cage. The three electrodes were the sample as the working electrode, a platinum counter electrode, and an Ag/AgCl/KCl 3 M reference electrode. A circular area of 1 cm2 was exposed to the electrolytic solution. Two different electrolytes were used: 0.1 M NaCl saturated with Mg(OH)2 and PBS (Phosphate Buffered Saline). The specific electrolyte (0.1 M NaCl saturated with Mg(OH)2) was selected to minimise pH variations and highlight its barrier characteristics [17]. The PBS used was composed of various inorganic molecules: 8 g/L NaCl; 0.2 g/L KCl; 1.2 g/L Na2HPO4; 0.2 g/L KH2PO4. The pH of the PBS was buffered at 7.43. For 0.1 M NaCl, due to saturation with Mg(OH)2, it was buffered at 9.96. Before the EIS test, the open circuit potential was measured for 15 min. The EIS spectra were obtained using a signal voltage amplitude of 10 mV rms and a frequency range of 100 kHz to 100 mHz at two immersion times (2 h, 24 h).
3. Results and Discussion
3.1. Coating Characterisations
3.1.1. SEM Analysis
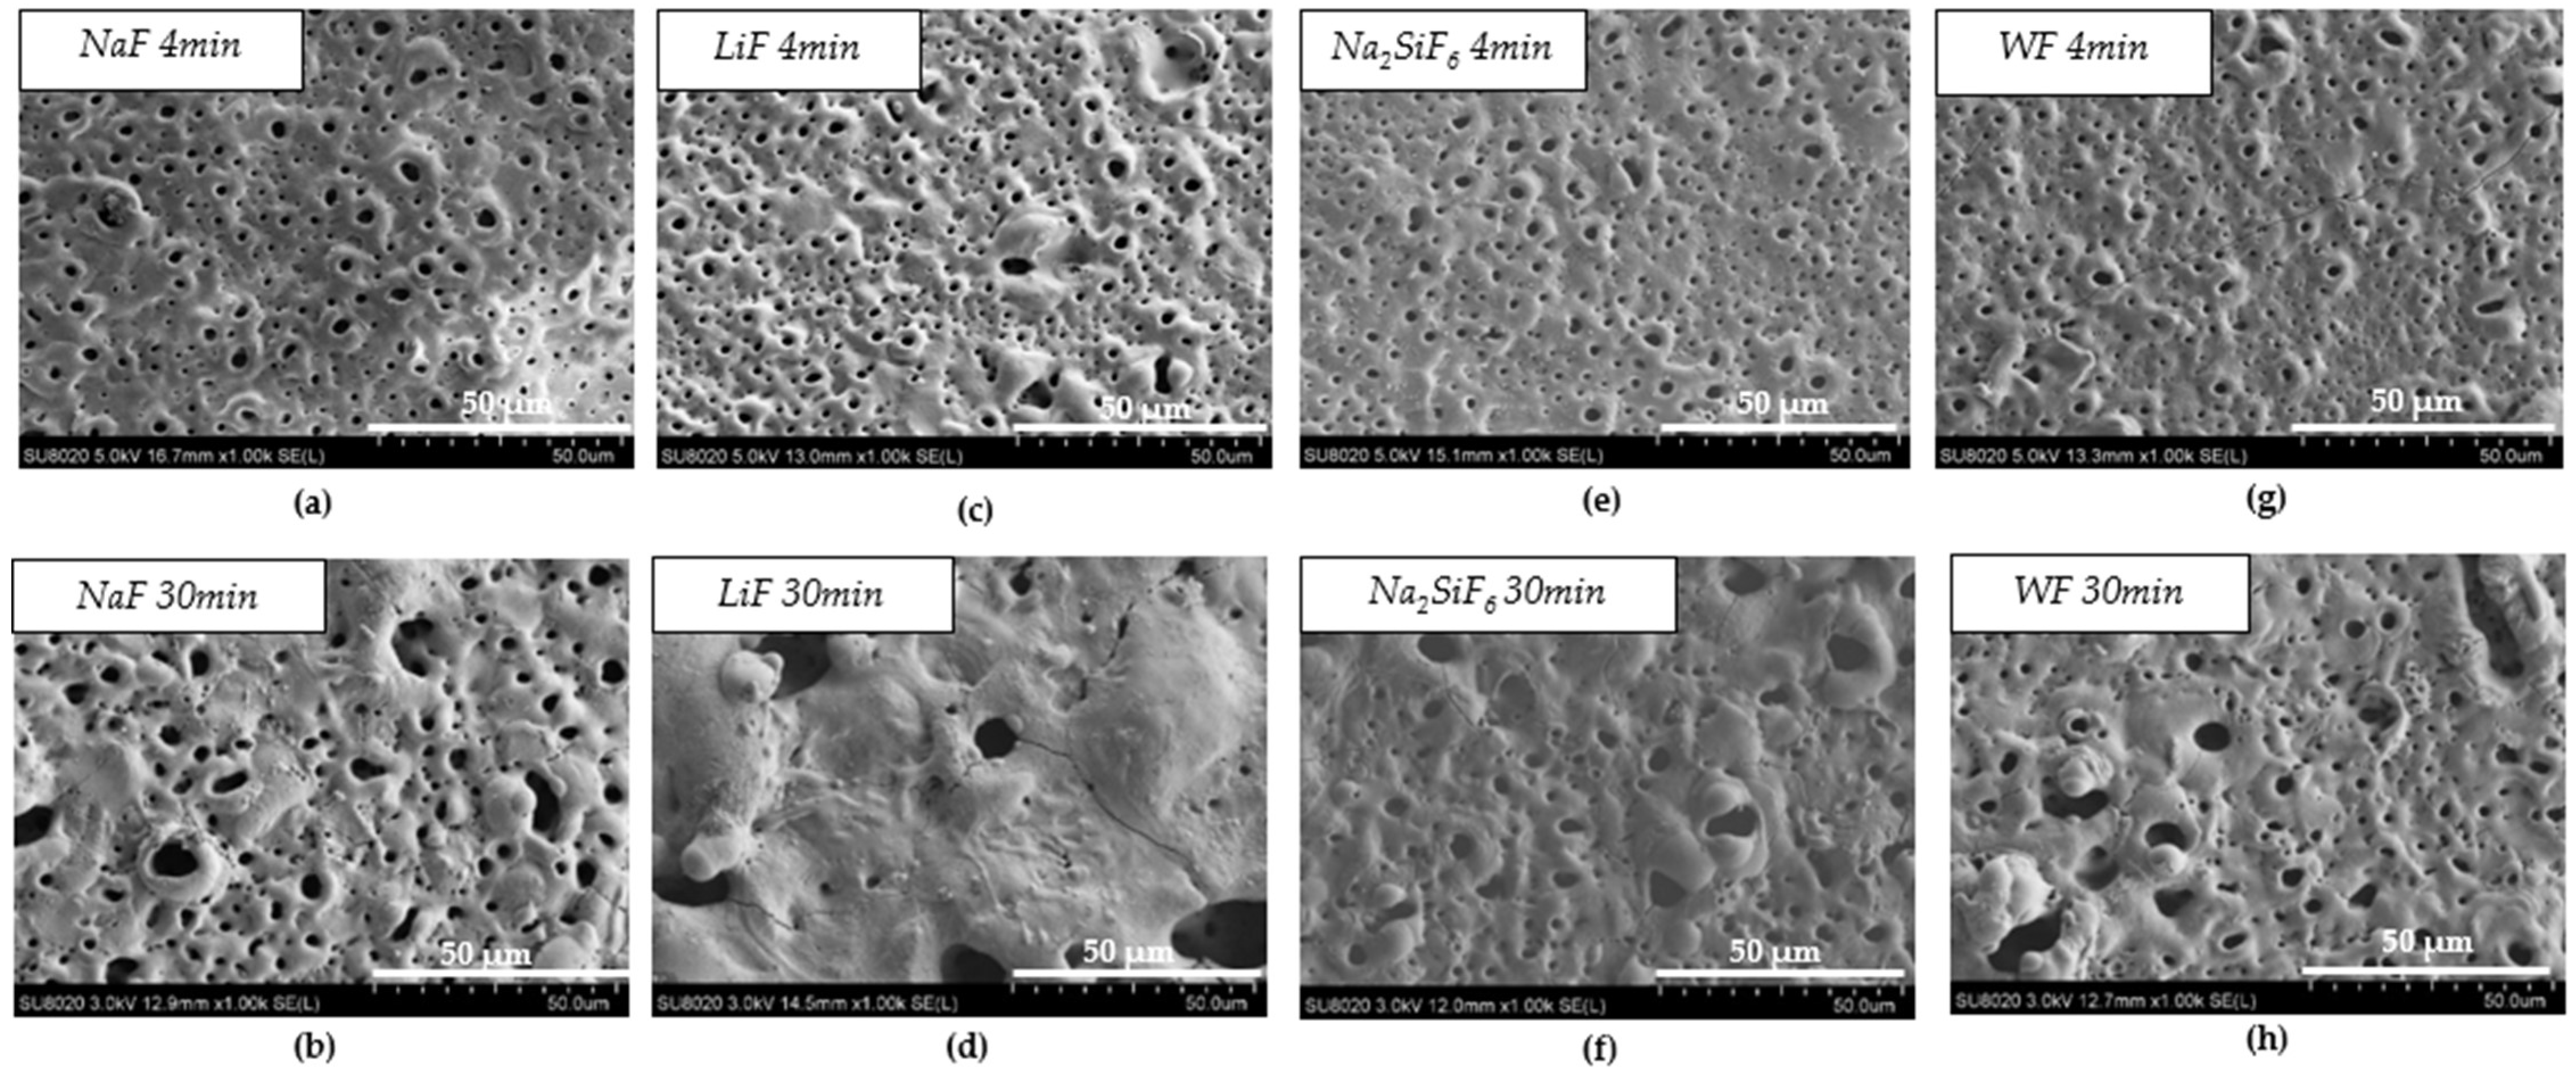
Figure 1 and Table 2 show the morphology of the layer surface and its porosity. The presence of pores is due to the discharges generated by the PEO process. Melting and cooling around the pores are also due to the discharge regime. In biomedical applications, the presence of pores is advantageous since they facilitate osseointegration, i.e., the attachment of tissues and cells to the implant [19]. The average pore size was larger for the 30 min PEO deposits than for the 4 min deposits. Moreover, after 4 min, the highest average pore size was observed in the electrolyte containing LiF with a value of 3.05 µm. However, when comparing Figure 1a,c,e,g, there are no significant visual differences. After 30 min, Figure 1d, on the other hand, indicates a different morphology compared to the other samples. In fact, fewer pores were observed for LiF, but the pore size was larger. In this case, the arcs generated during PEO were of higher intensity and were more localised, resulting in a smaller but larger pore size. Moreover, the difference between LiF and the others is probably due to the high local temperature generated by the intense sparks [20,21].
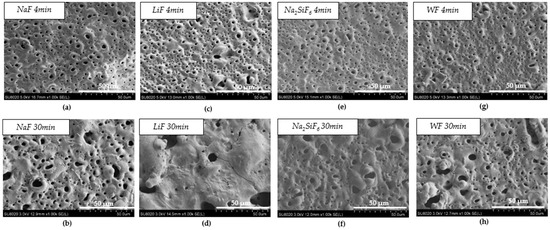
Figure 1.
Surface morphology of PEO coating: (a) NaF 4 min PEO deposit; (b) NaF 30 min PEO deposit; (c) LiF 4 min PEO deposit; (d) LiF 30 min PEO deposit; (e) Na2SiF6 4 min PEO deposit; (f) Na2SiF6 30 min PEO deposit; (g) WF 4 min PEO deposit; (h) WF 30 min PEO deposit.
Table 2.
Average pore size and pore density.
Furthermore, when comparing the pore density on the surface (Table 2), it is interesting to note that the percentage pore density is divided by two with the 30 min PEO deposit time. For LiF, however, the pore density decreased considerably. The surface was not homogeneous due to the high intensity of the sparks, which caused the pores to be much larger and less distributed on the surface [22,23].
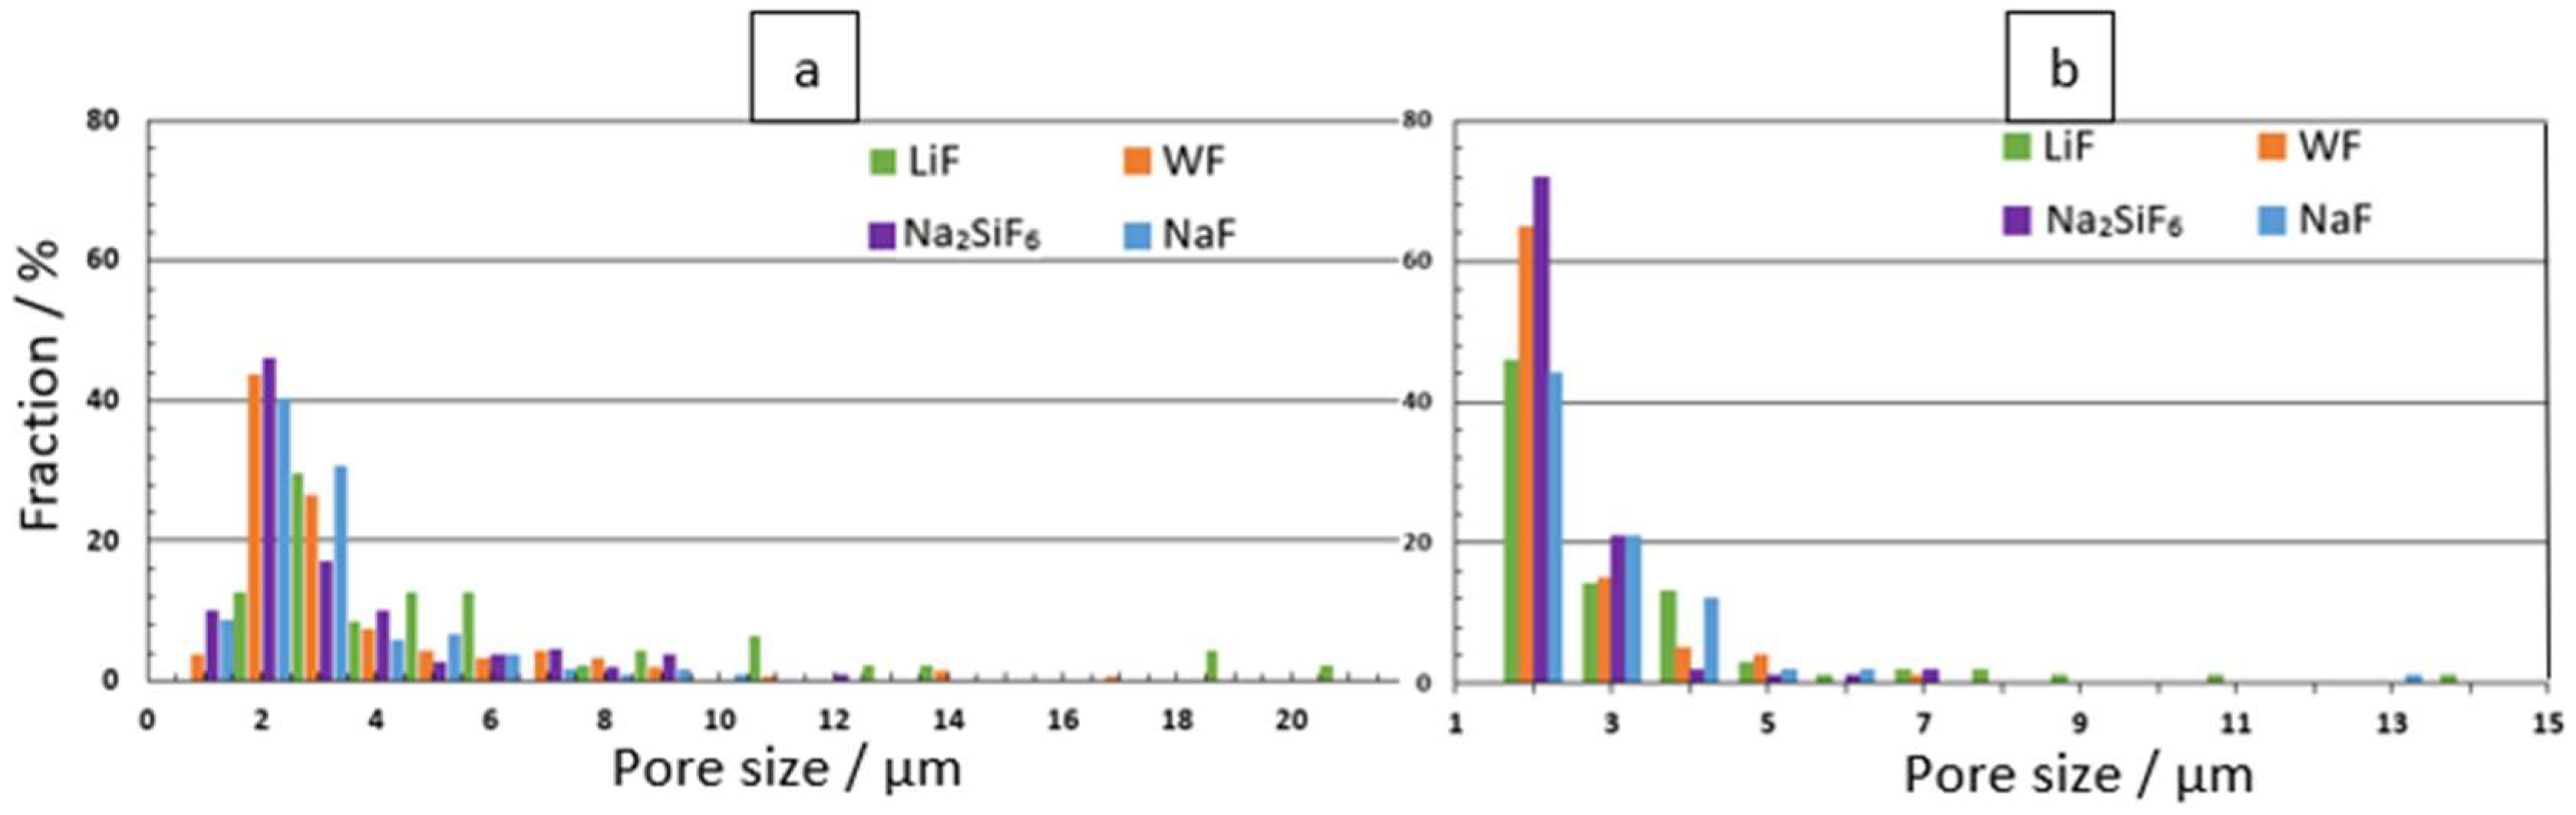
Figure 2 shows the pore size distribution for each substrate at the 4 min and 30 min deposition times. Figure 2a shows that the morphology of the coating at the 4 min deposition time in the LiF bath is significantly different from the other electrolytes. The average pore size for LiF samples is 4.53 μm. The largest pore size for LiF samples is 18 μm, compared to 15 μm for WF samples. The average pore sizes for the other samples range from 2.50 to 2.92 μm (Table 2). Figure 2b shows that pore size is mainly distributed between 0.5 μm and 1.5 μm for each electrolyte. However, LiF samples can reach pore sizes up to 13 μm.
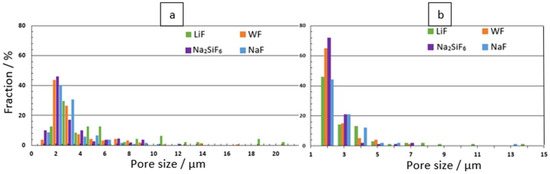
Figure 2.
Pore size distribution for: (a) 4 min and (b) 30 min PEO deposits.
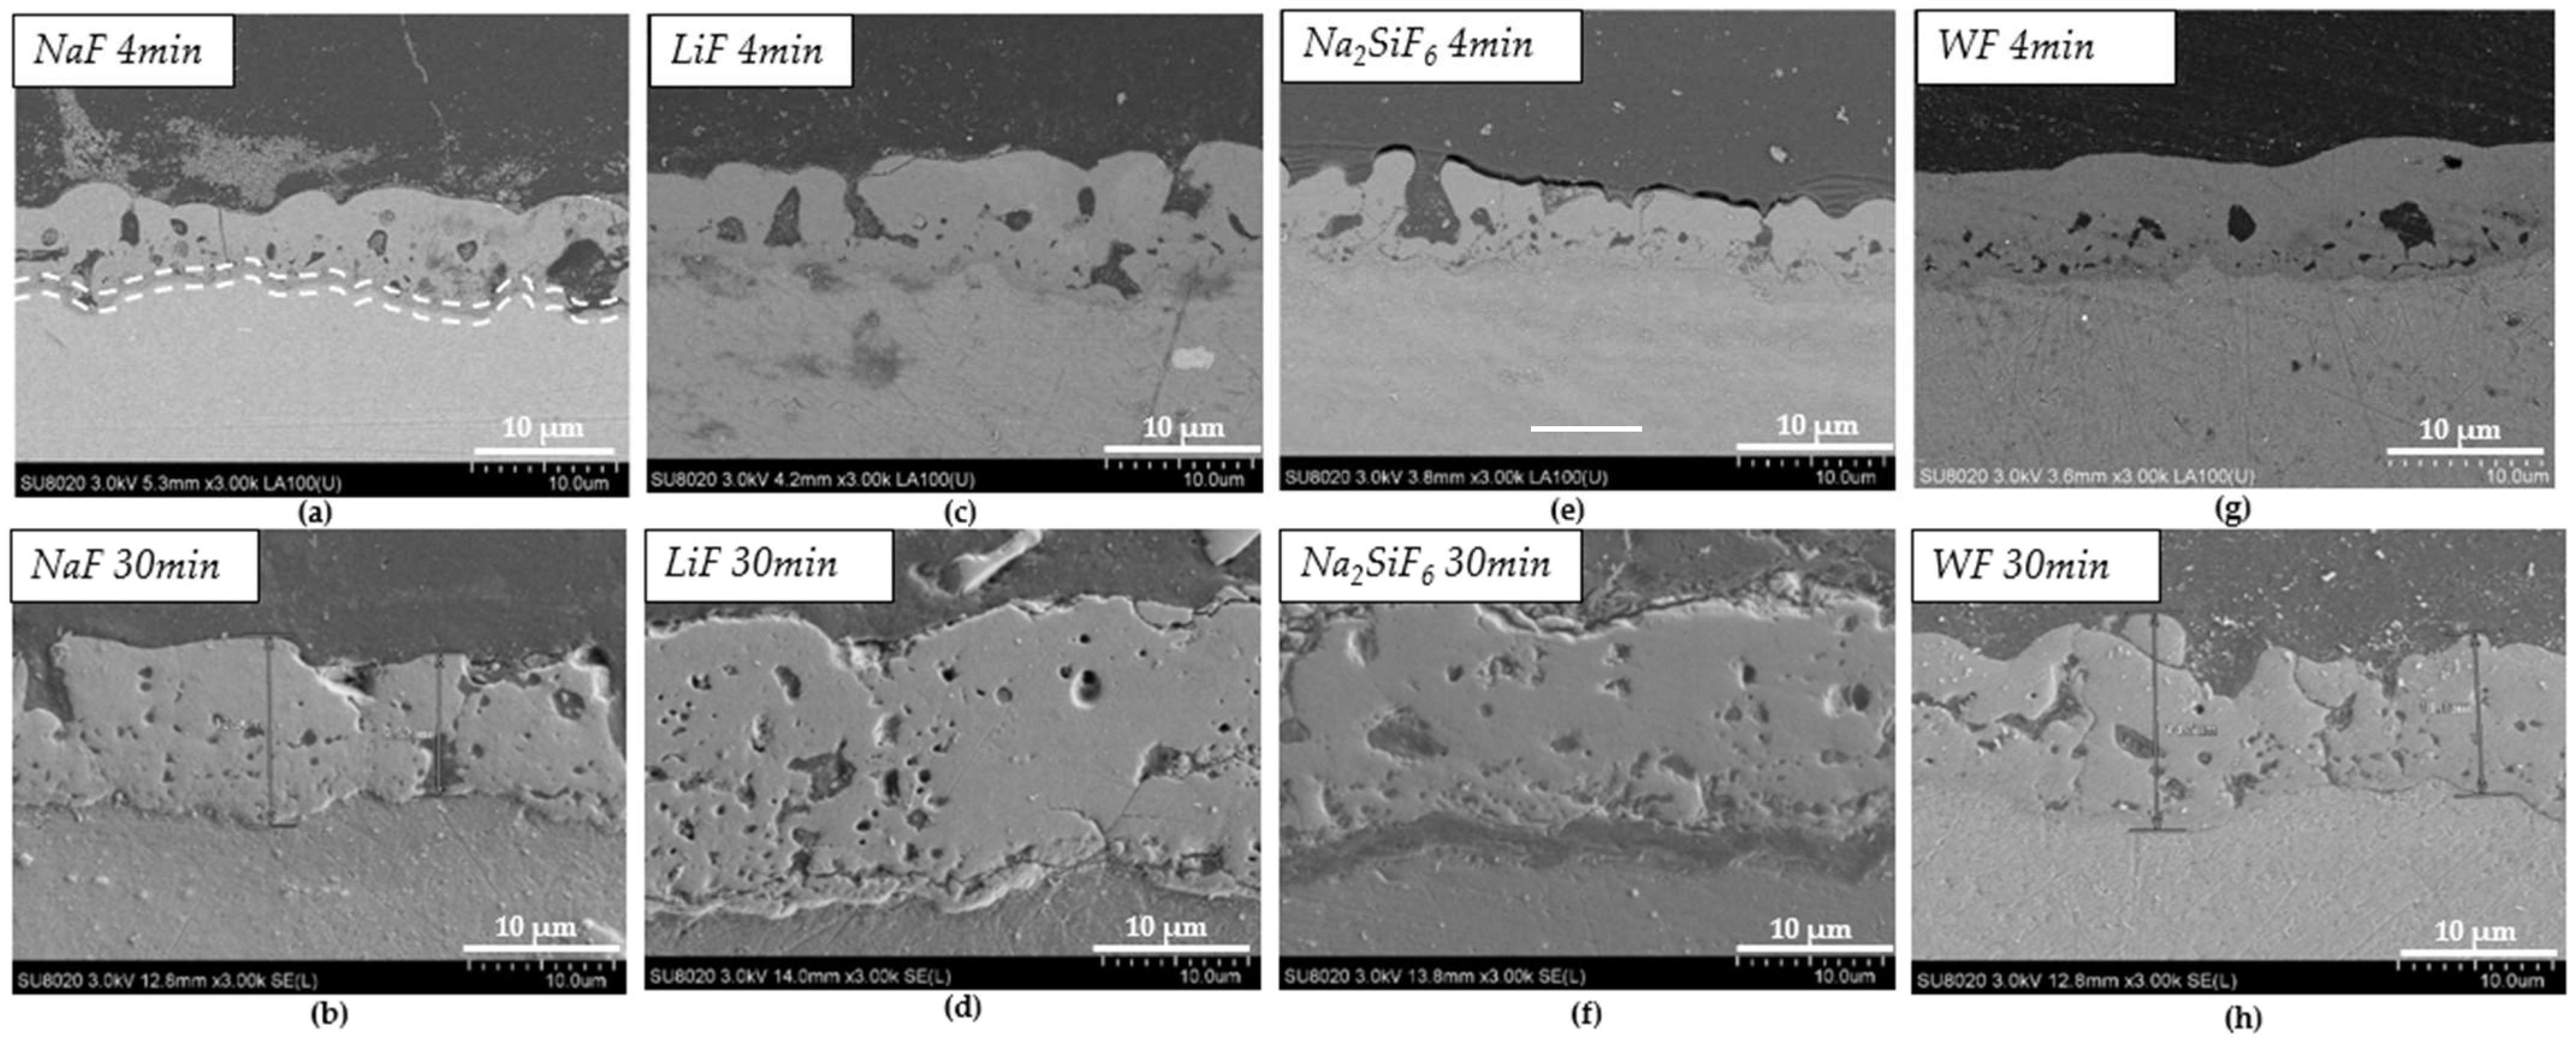
Figure 3 shows the cross-sections after PEO treatment for the different samples: NaF, Na2SiF6, LiF, and WF. The addition of fluoride ions promotes the formation of the inner layer, as these ions migrate preferentially to the substrate interface, creating a fluoride-containing nanolayer [24]. The cross-sections of the layers varied significantly between 4 and 30 min of deposition. Indeed, after 4 min of deposition, the thickest layer is obtained in a bath without fluoride (WF) with the value of 8.5 µm (Table 3 and Figure 3g), while after 30 min, the thinnest layer is observed in these conditions (WF) with a value of 11.8 µm (Table 3 and Figure 3h). After 30 min, the thickest layer is from LiF with the value 25.5 µm (Table 3 and Figure 3f). Based on morphology, the counter ion has an impact not only on the layer thickness but also on the surface porosity. The layer thickness is not proportional to the deposit time. However, in some cases, such as with the LiF electrolyte, the deposit time increases the regime of micro-arcs [21]. Faqih et al. studied different deposition times on AZ61 and demonstrated that a longer deposition time resulted in increased layer thickness and homogenization. This is what can be observed for the different samples studied. Faqih et al. studied different deposition times on AZ61 and showed that a longer deposition time increased the thickness of the layer and homogenised it [25]. This can be observed for the different samples studied on the cross-sections for 30 min depositions. However, on the surfaces, the homogenisation is found only in the 4 min deposition samples.

Figure 3.
SEM images of cross-sections after deposition: (a) NaF 4 min PEO deposit; (b) NaF 30 min PEO deposit; (c) LiF 4 min PEO deposit; (d) LiF 30 min PEO deposit; (e) Na2SiF6 4 min PEO deposit; (f) Na2SiF6 30 min PEO deposit; (g) WF 4 min PEO deposit; (h) WF 30 min PEO deposit.
Table 3.
Average coating thickness (measured on SEM cross-sections).
3.1.2. EDS Determination
Energy dispersive spectroscopy was used to determine the coating composition. Coatings after 4 min and 30 min of deposition are mostly composed of silicon, oxygen, magnesium, and fluoride. As the deposit time increases, the atomic percentage of the elements (see Table 4) evolves. The atomic percentage of fluorides increases with deposit time, while the atomic percentage of silicon decreases. It is interesting to note that the fluoride atomic percentage for the LiF sample is the lowest for both deposits. This means that more fluoride is deposited in the layer obtained in the PEO bath containing NaF and Na2SiF6 than for LiF.
Table 4.
Atomic percentage of elements contained in the PEO layer after 4 min and 30 min.
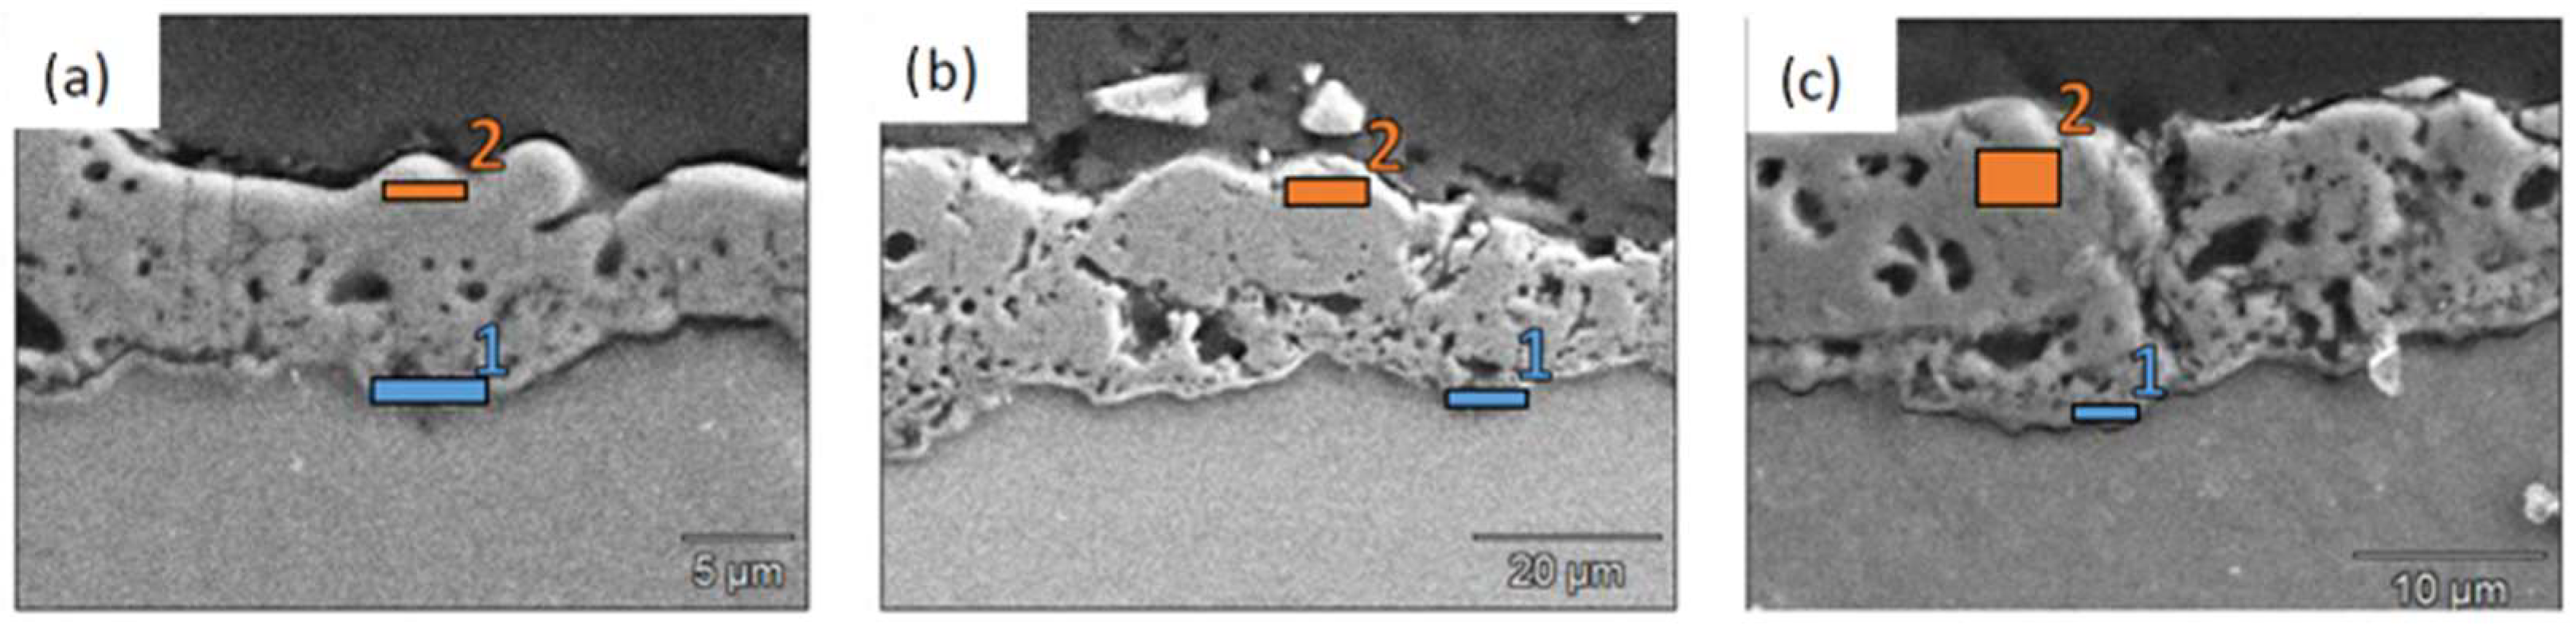
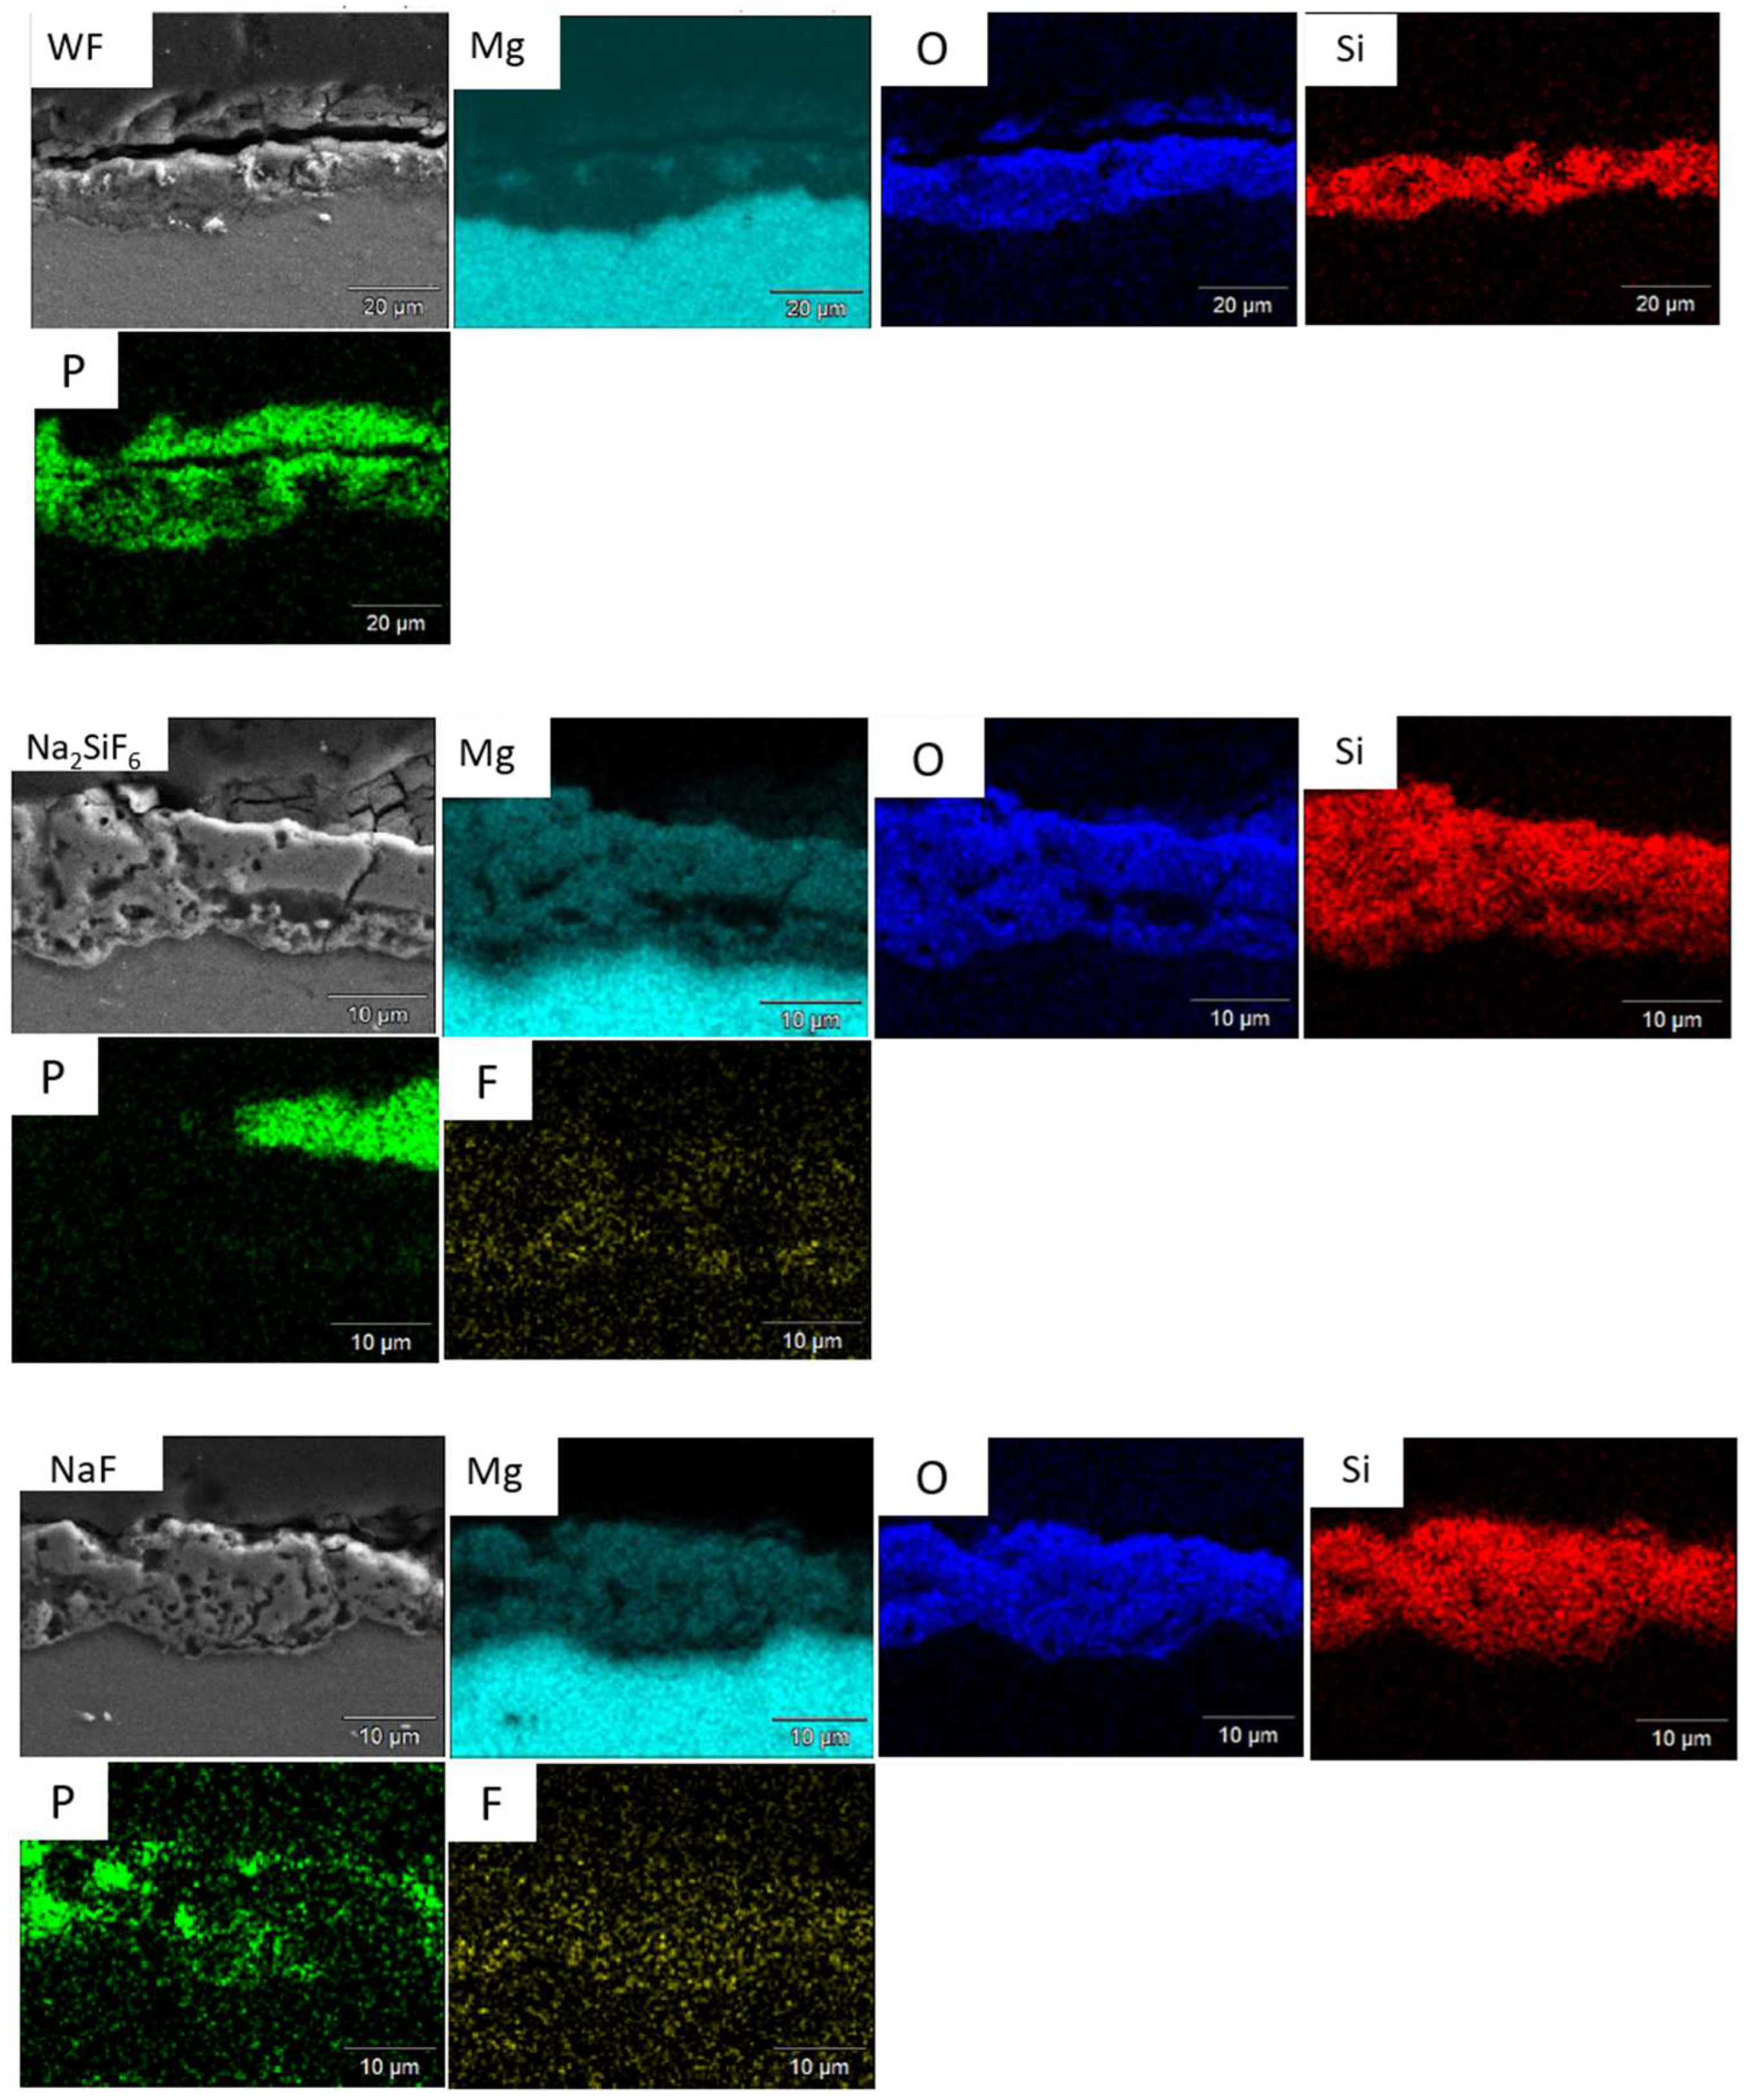
A more comprehensive study was made of the samples with a 30 min deposit time. Local analyses between the outer and the inner layers were performed to study the mass percentage of the various elements and, above all, to verify the presence of fluorides in the layer (see Table 5, Figure 4). For each fluorinated sample, the atomic percentage composition is higher for fluorine at the coating/substrate interface than in the outer layer. This proves that fluorides have a greater impact on the barrier layer. In the case of Na2SiF6, analyses show that despite the presence of silicon in the SiF62− ion, no more silicon can be detected at the interface. It is noteworthy that at the surface of the PEO layer with a 30 min deposition time for LiF, no fluoride is present for lithium salt. This is of significant importance from a biomedical perspective, as fluoride intake must be limited in the body [26].
Table 5.
Atomic composition (at. %) of the barrier and outer layer of NaF, LiF, Na2SiF6 samples.
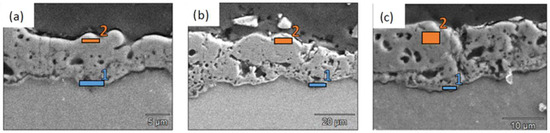
Figure 4.
EDS points of the barrier (1) and outer (2) layers of (a) NaF, (b) LiF, and (c) Na2SiF6.
3.1.3. XRD Analysis
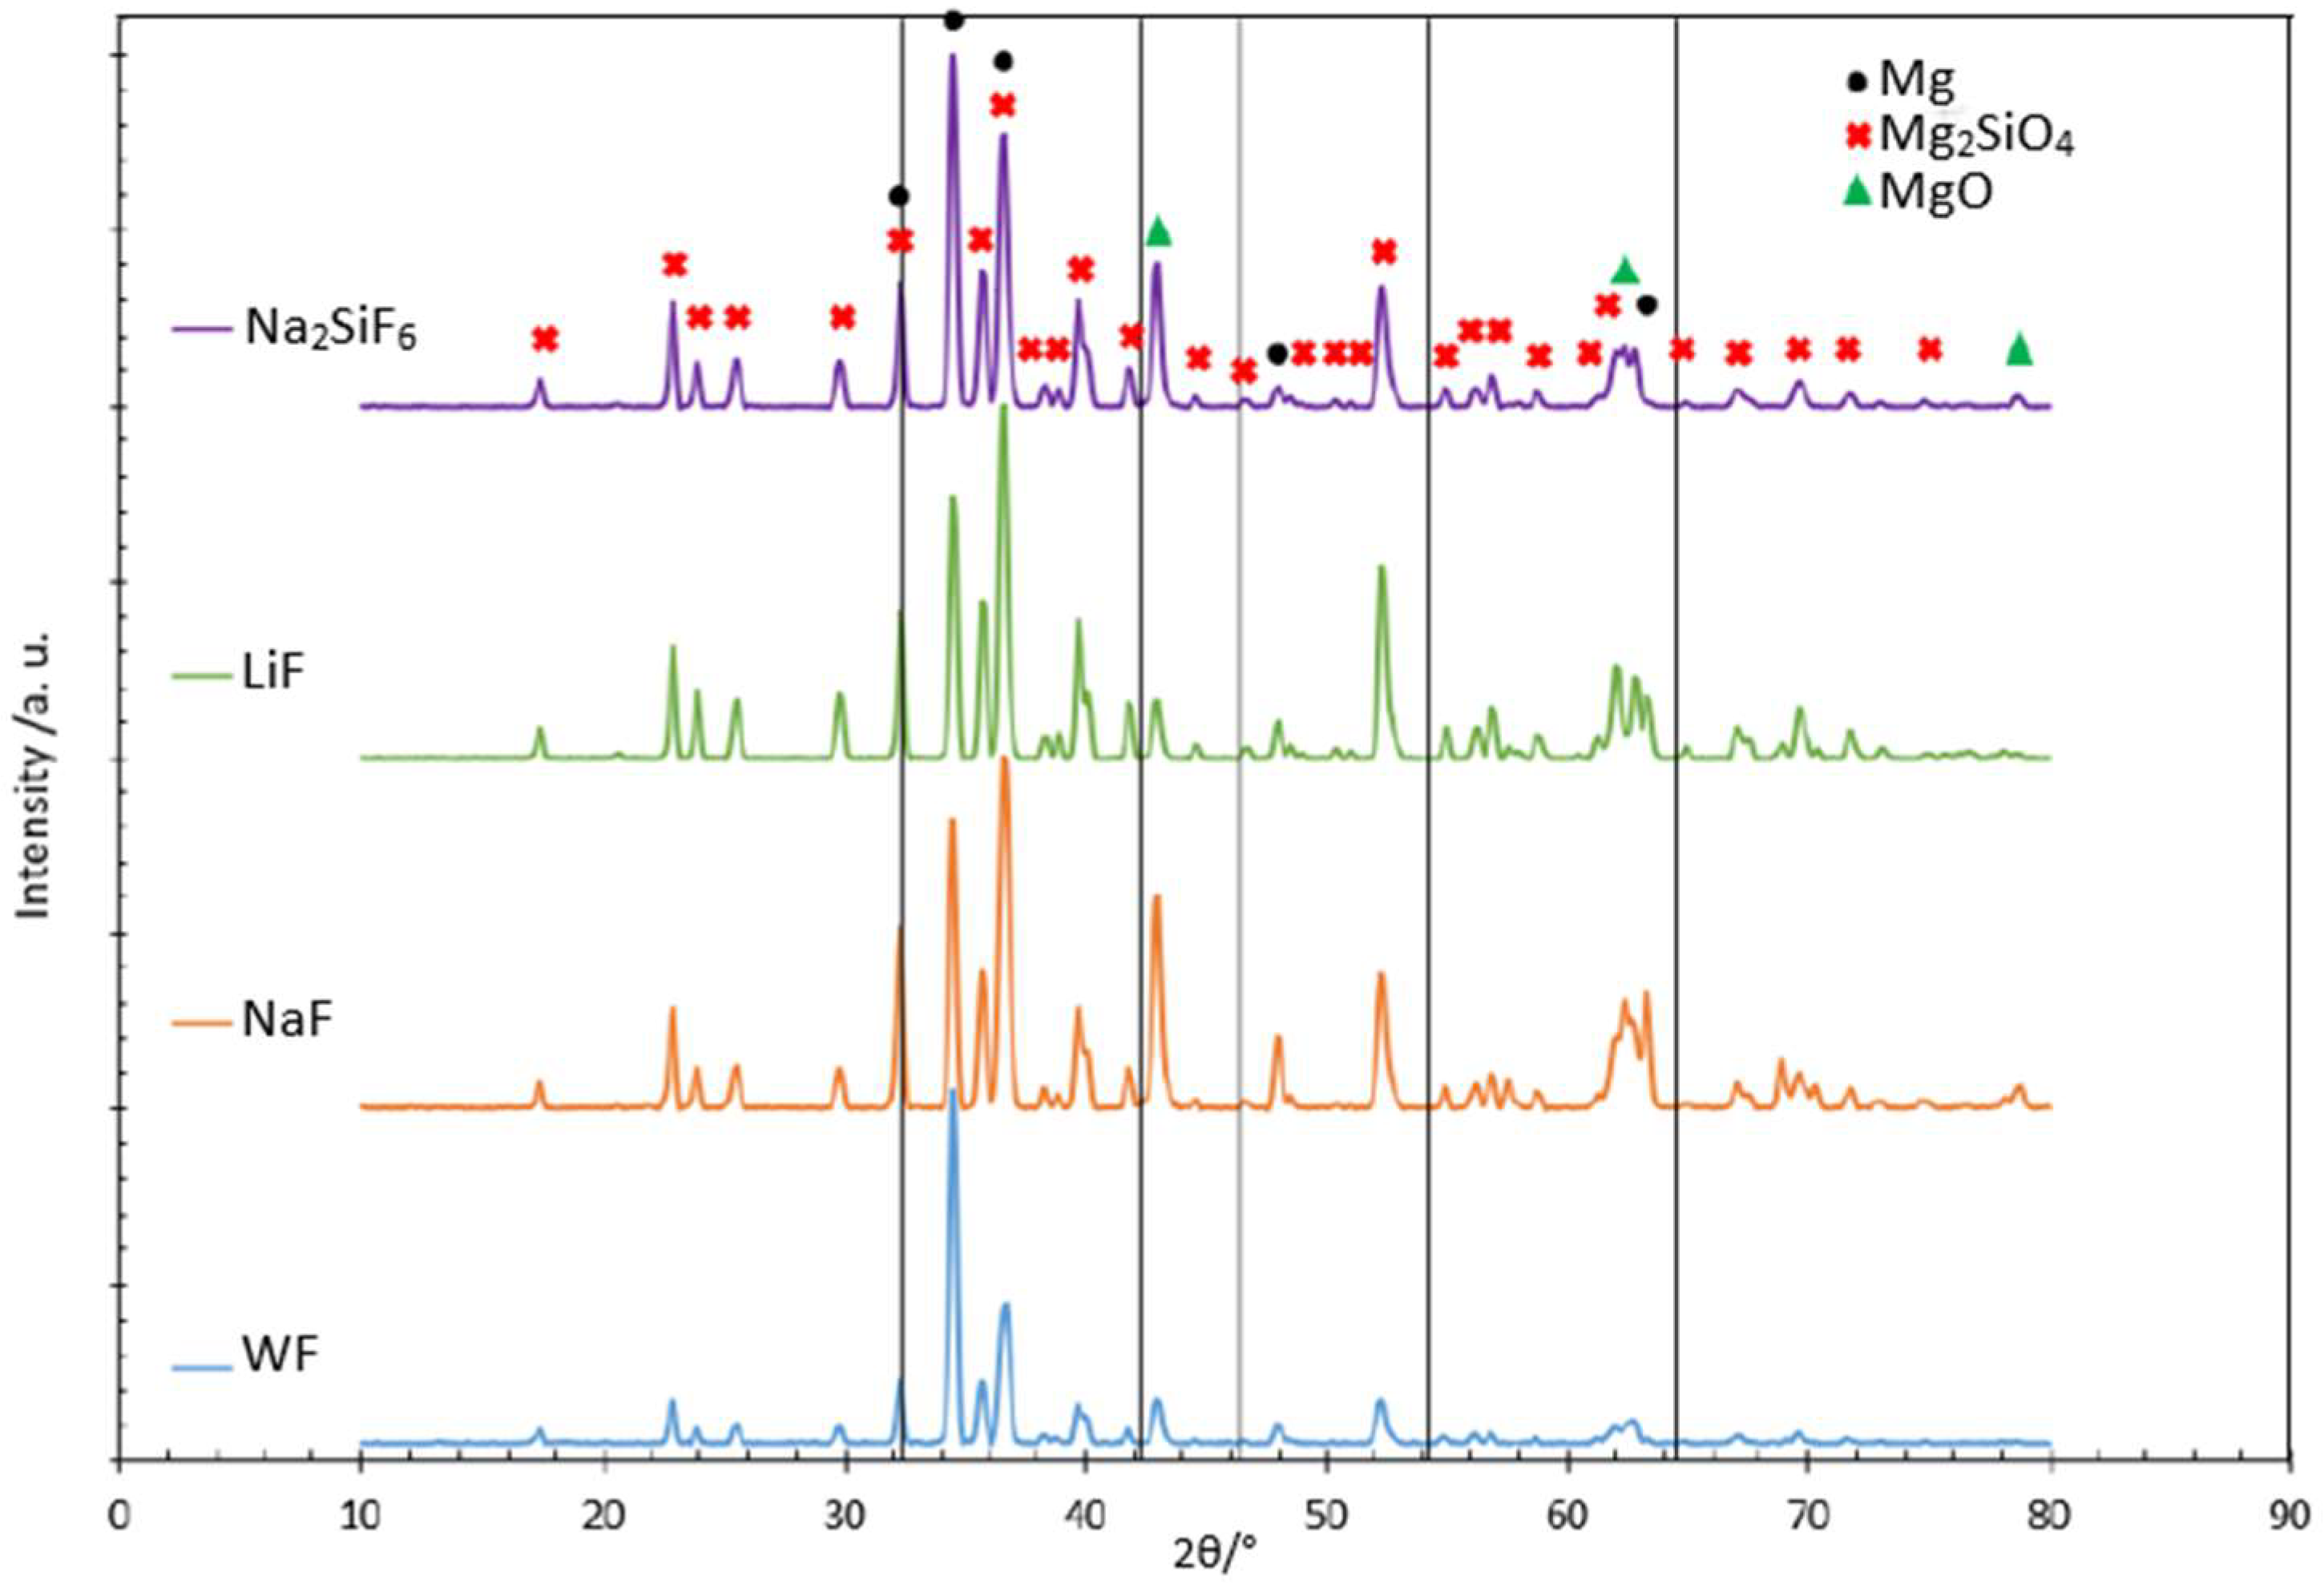
XRD was also performed to identify the crystalline structure obtained for each investigated condition and the appearance of MgF2 peaks also mentioned in some articles [27]. XRD was only studied for the samples obtained after 30 min of the process, as the PEO layer thickness was very thin (6 microns) after 4 min and did not allow the detection of any phase other than the substrate. As can be seen in the amount of F in the 4 min deposit, in all cases it is around 3 wt.% (Table 4), which is too low to be detected by XRD, as this technique has a detection limit of around 5 wt.%. The 30 min deposit coatings were analysed. The coatings are mainly composed of magnesium silicate and magnesium oxide (Figure 5). However, the crystalline MgF2 phase expected for fluoride samples was not detected. The 2θ values for MgF2 were located at 42.23° and 54.20° (as shown by the black lines in Figure 5). Two hypotheses can therefore be established: the crystalline MgF2 phase is not present, or it is present, but quantities are too small to be detected. Comparing the graphs together, the peaks are in the same positions for each sample. However, the peak intensities representing Mg2SiO4 are proportionally higher than for MgO in the fluoride-containing samples. For the LiF sample, the peaks representing MgO are less intense, which may explain why this phase is present in smaller quantities. The literature shows that to form MgO, it is necessary to attain a high temperature (104 K) [23]. From the SEM images we learned that more localised intense discharges appeared to have formed on the LiF sample during the PEO process. As a result, the temperature may have been inhomogeneous over the sample and less MgO crystalline phase was formed.
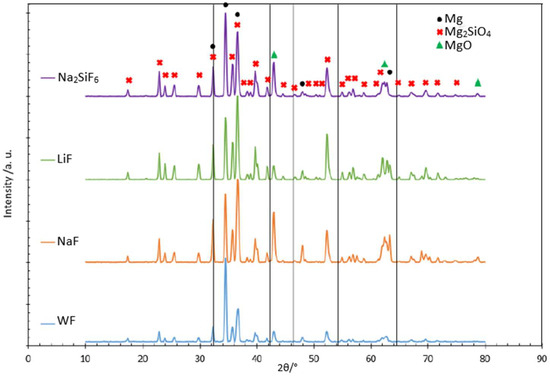
Figure 5.
Diffractograms of different samples with and without fluorides in the PEO 30 min deposit coating.
3.2. Electrochemical Behaviour
The aim of this study is to determine the corrosion resistance of the different samples as a function of the fluoride contribution with its counter ion and the PEO deposit time.
The equivalent circuits (Figure 6) used to interpret the EIS results include Rs (solution resistance), CPEouter/Router (attributed to the capacitive and resistive behaviour of the PEO outer layer), CPEinter/Rinter (attributed to the capacitive and resistance behaviour of the inner layer in the PEO coating), and CPEdl/inner/Rct/inner (related to electrochemical activity at substrate/surface interface). Constant-phase elements (CPE) were used instead of ideal capacitors to compensate for surface roughness and heterogeneity. CPE is defined by the following formula:
- ZCPE is the impedance;
- Q0 is an admittance constant;
- j is the imaginary unit;
- ω is the angular frequency;
- n is the phase exponent.
If n equals 1, the CPE behaves like an ideal capacitor, while if n is 0, it acts like a pure resistor. The circuits developed are in accordance with various articles studied [17,24,28].
Initially, the study focused on a PEO deposit time of 4 min (Figure 7). The samples were immersed in 30 mL of 0.1 M NaCl saturated with Mg(OH)2 (Figure 7). This study was carried out after 2 h (Figure 7a) and 24 h of immersion (Figure 7b). From the Bode diagram (Figure 7b), it can be determined that for all samples coated with or without fluorine, there are three time constants at high, medium, and low frequencies. Regarding these time constants, high frequency represents the porous-external part of the coating, while medium and low frequencies correspond to the intermediate and barrier layers of the PEO coatings, respectively. Based on this information (Figure 7) and the values obtained from the equivalent circuits (Table 6), we proceed to analyse and discuss the data obtained.
First, when comparing the coatings with and without fluorine, it is generally observed that all resistance values are lower for the sample without fluorine compared to the samples with fluorine (Table 6). This suggests that the addition of fluoride significantly impacts the strength of the oxide layer, potentially due to the formation of MgF2 in the barrier layer, as previously discussed in other studies. Then, it can be observed that, in general, the Rinner of all coatings is higher than Router, suggesting that the barrier layer for all coatings is responsible for the system’s protection. This could mainly be due to the formation of MgF2, as mentioned above, and the presence of high external and intermediate porosity in all coatings (Figure 3a,c,e,g) [29]. This porosity facilitates the entry of corrosive species from the medium, causing permeation and degradation of the PEO layer, thus resulting in reduced resistance values in these two parts. This is consistent with the high CPEouter values and n values around 0.7–0.8, suggesting porous and inhomogeneous coatings [24]. Comparing the fluorine-containing coatings after 2 and 24 h of immersion, it can be observed that the Rinner value (as it is responsible for the system’s protection) results in the following protection ranking (see Figure 8): NaF > Na2SiF6 > LiF. This could be attributed to the higher thickness and compactness of the barrier layer observed in Figure 3a compared to the other coatings. The resistance values decrease with the immersion time. This is mainly due to the pores in the PEO layers, which allow corrosive species to easily access the substrate. As a result, the barrier layer is directly impacted by Cl− ions. The aggressive solution penetrates through the pores of the PEO layer, degrades the layer and reaches the barrier layer [30].
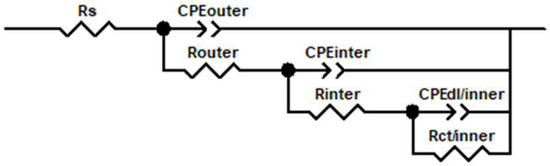
Figure 6.
Circuit equivalent for all PEO coatings.
Figure 6.
Circuit equivalent for all PEO coatings.
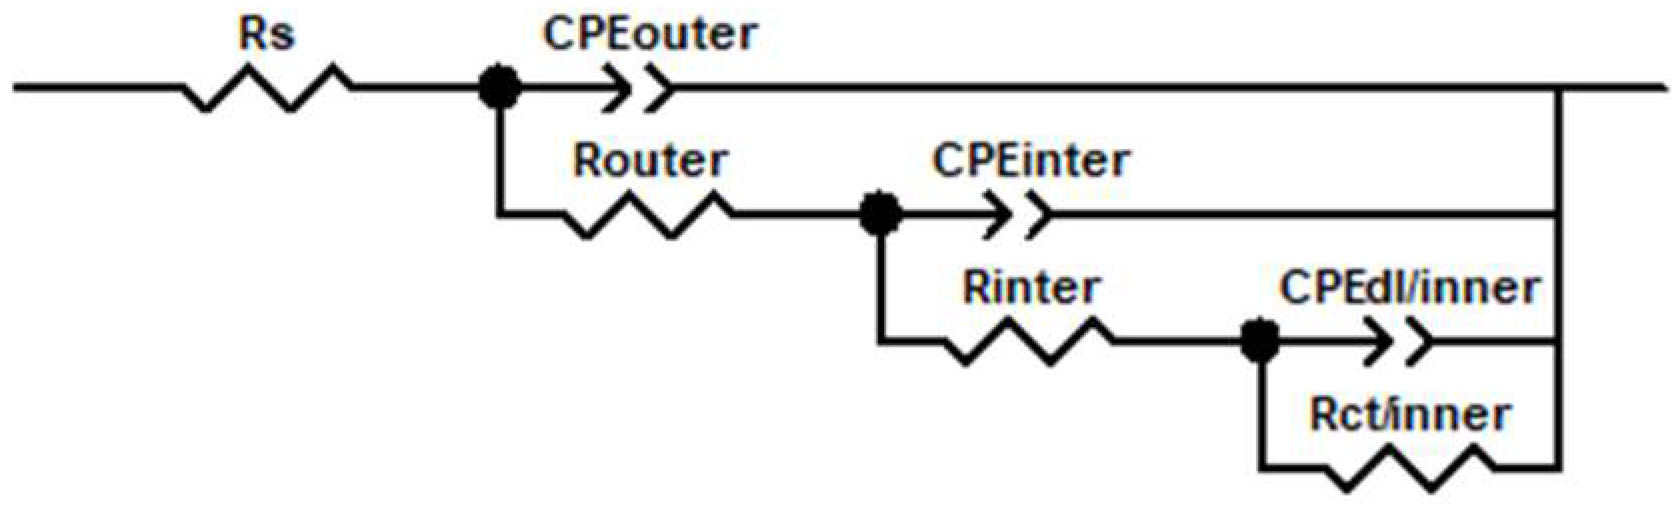

Figure 7.
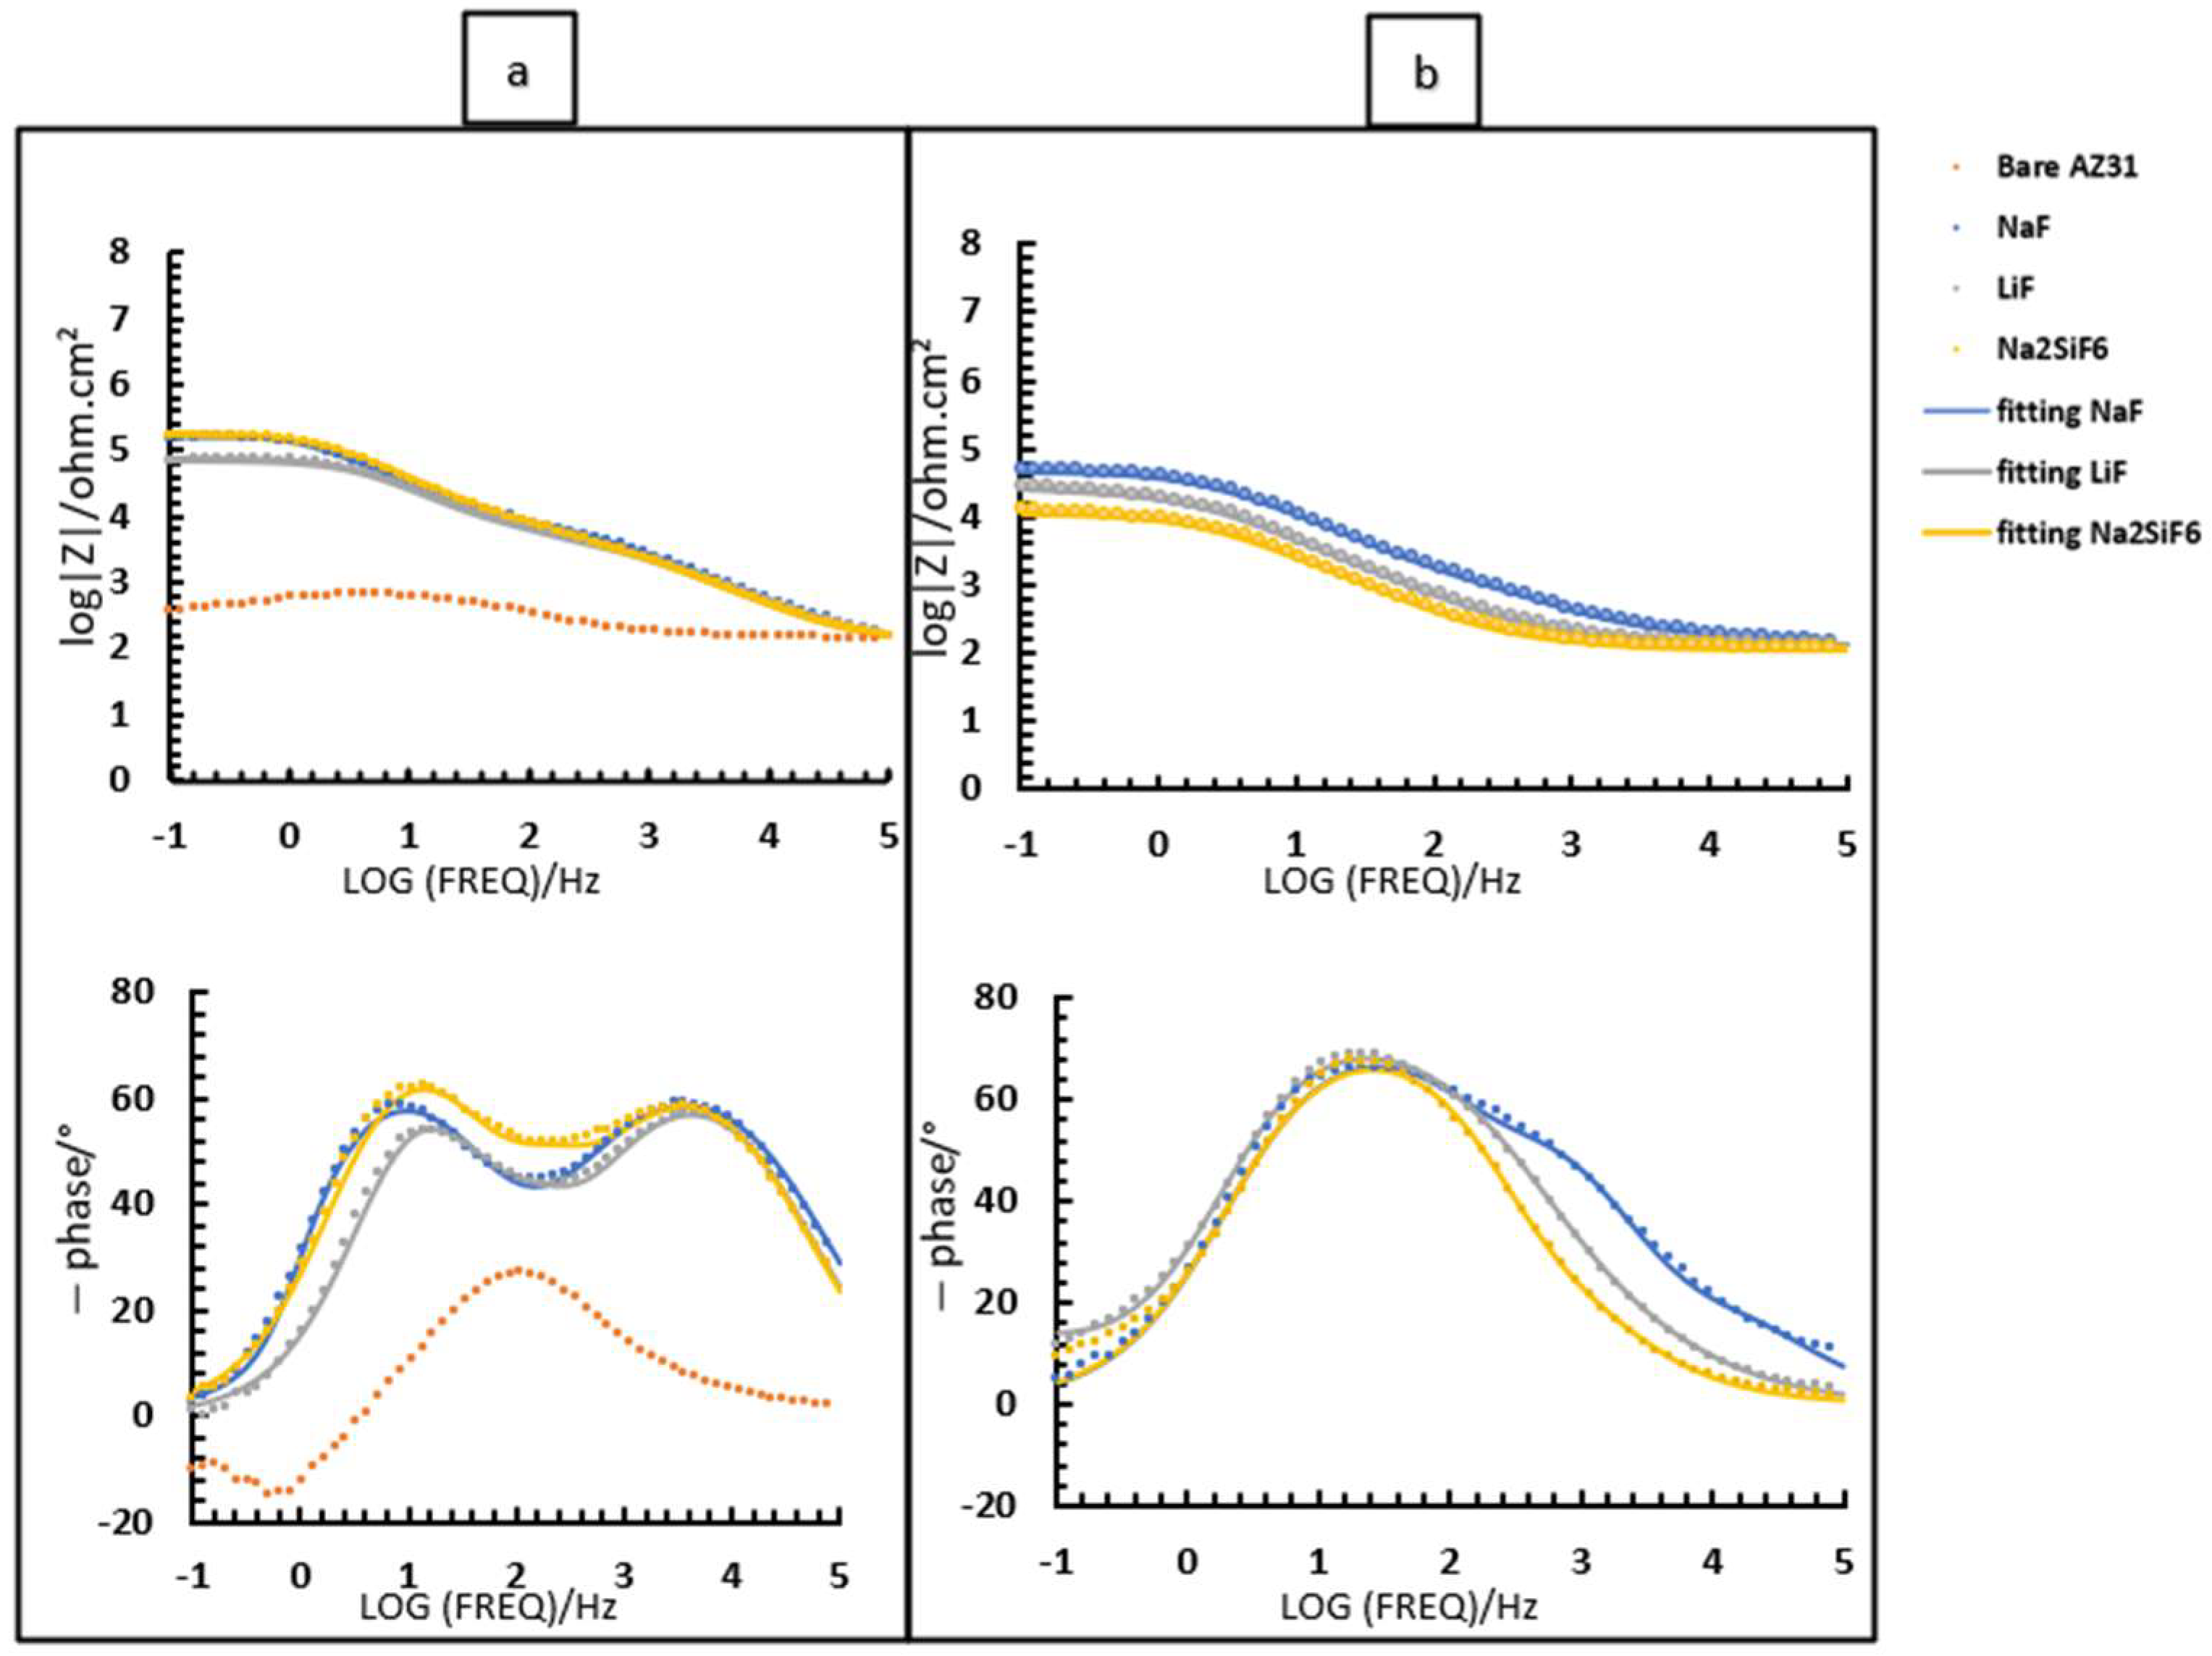
Bode diagram of fluoride and non-fluoride samples with 4 min of PEO deposit after (a) 2 h immersion; (b) 24 h immersion in 0.1 M NaCl saturated with Mg(OH)2.
Figure 7.
Bode diagram of fluoride and non-fluoride samples with 4 min of PEO deposit after (a) 2 h immersion; (b) 24 h immersion in 0.1 M NaCl saturated with Mg(OH)2.
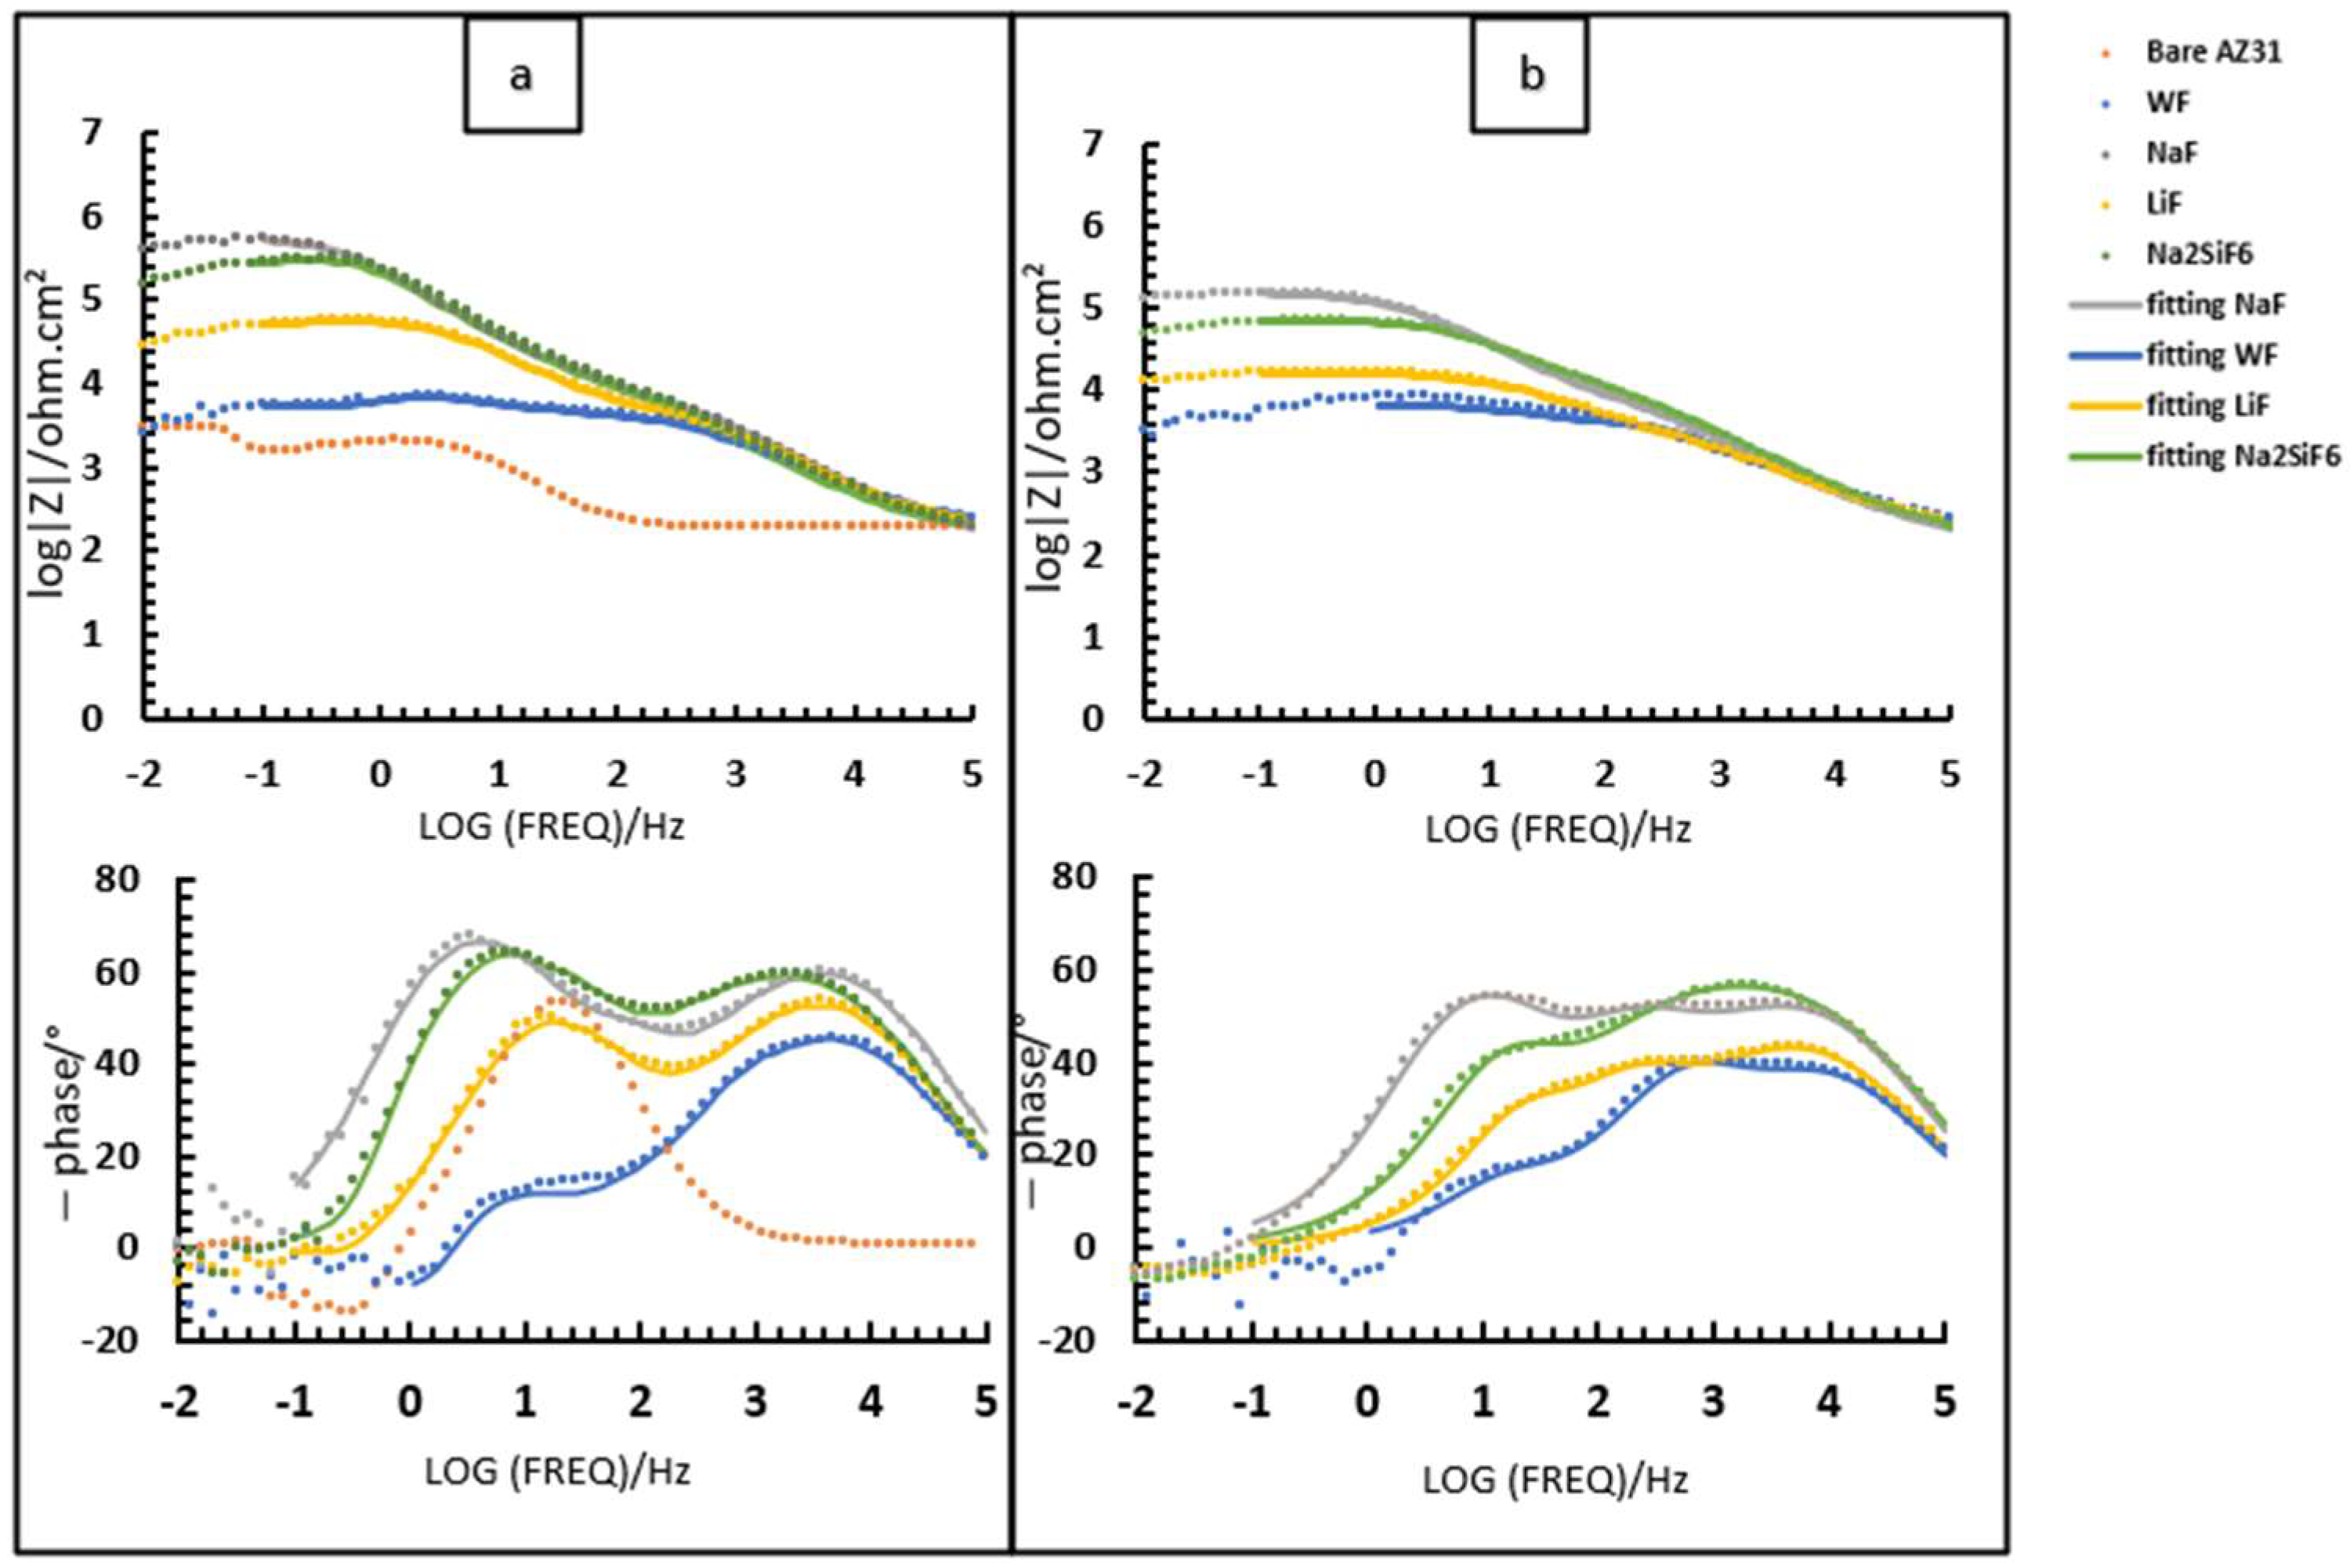
Table 6.
Values of the different elements of the equivalent electrical circuit of WF, NaF, LiF, and Na2SiF6 samples with 4 min PEO deposit 2 h and 24 h in 0.1 M NaCl saturated Mg(OH)2.
Table 6.
Values of the different elements of the equivalent electrical circuit of WF, NaF, LiF, and Na2SiF6 samples with 4 min PEO deposit 2 h and 24 h in 0.1 M NaCl saturated Mg(OH)2.
| Sample | Rs (Ohm·cm2) | Router (Ohm·cm2) | Q0oxide(CPE outer) (sn/(Ohm·cm2)) | nouter (CPEouter) (-) | Rinter(Ohm·cm2) | Q0d(CPEinter) (sn/(Ohm·cm2)) | Ninter (CPEcor) (-) | Q0d/inl(CPEdl/in) (sn/(Ohm·cm2)) | nin (CPEdl) (-) | Rct/in (Ohm·cm2) |
|---|---|---|---|---|---|---|---|---|---|---|
| 2 h 0.1 M NaCl saturated Mg(OH)2 | ||||||||||
| WF | 198.6 | 2839 | 4.34 × 10⁻⁷ | 0.76 | 1752 | 1.34 × 10⁻⁷ | 0.95 | 92.7 × 10⁻⁷ | 0.90 | 1951 |
| NaF | 147.7 | 10,193 | 2.68 × 10⁻⁷ | 0.79 | 34,328 | 2.17 × 10⁻⁷ | 0.95 | 2.48 × 10⁻⁷ | 0.95 | 513,000 |
| LiF | 184.1 | 6567 | 4.09 × 10⁻⁷ | 0.77 | 44,605 | 9.19 × 10⁻⁷ | 0.86 | 9.15 × 10⁻⁷ | 0.90 | 10,526 |
| Na2SiF6 | 170.5 | 19,472 | 4.68 × 10⁻⁷ | 0.76 | 275,000 | 2.63 × 10⁻⁷ | 0.91 | 1.02 × 10⁻⁷ | 0.90 | 142,000 |
| 24 h 0.1 M NaCl saturated Mg(OH)2 | ||||||||||
| WF | 206.6 | 2082 | 7.04 × 10⁻⁷ | 0.71 | 2082 | 1.98 × 10⁻⁷ | 0.92 | 73.9 × 10⁻⁷ | 0.9 | 2621 |
| NaF | 153.8 | 6310 | 4.93 × 10⁻⁷ | 0.74 | 21,584 | 1.54 × 10⁻⁷ | 0.88 | 3.39 × 10⁻⁷ | 0.92 | 128,000 |
| LiF | 181.6 | 3703 | 9.33 × 10⁻⁷ | 0.69 | 6164 | 3.69 × 10⁻⁷ | 0.90 | 0.014 × 10⁻⁷ | 0.97 | 6537 |
| Na2SiF6 | 161.5 | 20,578 | 5.84 × 10⁻⁷ | 0.72 | 19,444 | 1.61 × 10⁻⁷ | 0.95 | 4.21 × 10⁻⁷ | 0.95 | 35,353 |
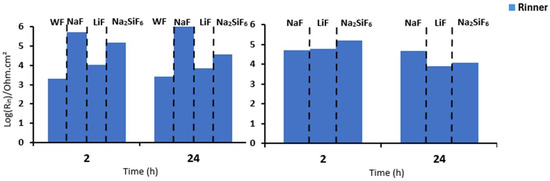
Figure 8.
Comparison of the Rinner of PEO parts at 2 and 24 h in (a) NaCl 0.1 M saturated with Mg(OH)2 and (b) PBS for 4 min PEO deposit.
Figure 8.
Comparison of the Rinner of PEO parts at 2 and 24 h in (a) NaCl 0.1 M saturated with Mg(OH)2 and (b) PBS for 4 min PEO deposit.

Figure 9 and Table 7 depict the bode diagrams of the 4 min PEO deposit samples immersed in PBS for 2 and 24 h. The behaviour of the samples in PBS is similar to that in NaCl medium (Figure 7). The coatings have three time constants at low, medium, and high frequencies. As seen previously, the values for all resistances of the fluorine-free coatings are lower than those of the fluorine-containing coatings. In this case, the Rinner is higher than for the other resistances for all samples. This is also due to the formation of MgF2 in the barrier layer. The resistance values agree with the high CPE values (external and intermediate) and the n values around 0.8, suggesting that the coatings are porous and inhomogeneous. As in NaCl, LiF has poorer resistance over time than NaF and Na2SiF6 (see Figure 8). This could be due to the increased protection of the barrier layer because of the greater thickness and compaction in NaF.
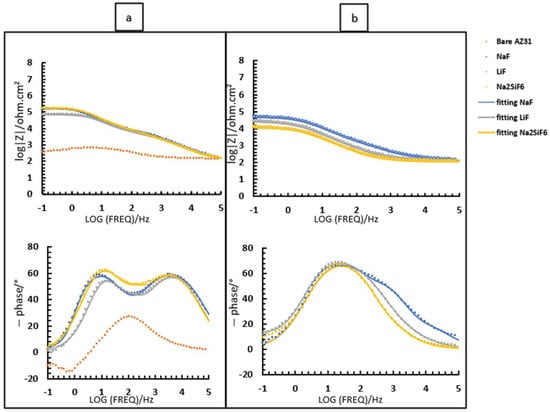
Figure 9.
Bode diagram of fluoride and non-fluoride samples after 4 min of PEO deposit: (a) 2 h immersion; (b) 24 h immersion in PBS.
Table 7.
Values of the different elements of the equivalent electrical circuit of WF, NaF, LiF, and Na2SiF6 samples with 4 min PEO deposit 2 h and 24 h in PBS.
As expected, with increasing immersion time, the resistance values decrease due to easier access of corrosive species to the barrier layer. This agrees with the values of CPE inner which, with increasing immersion time, indicate the absorption of Cl− ions into the coating. It should be said that the Router and Rinter values are similar, which is in line with the overlapping time constants observed in Figure 9b. This is because the medium is so aggressive that it is no longer possible to distinguish the two layers initially visible over time.
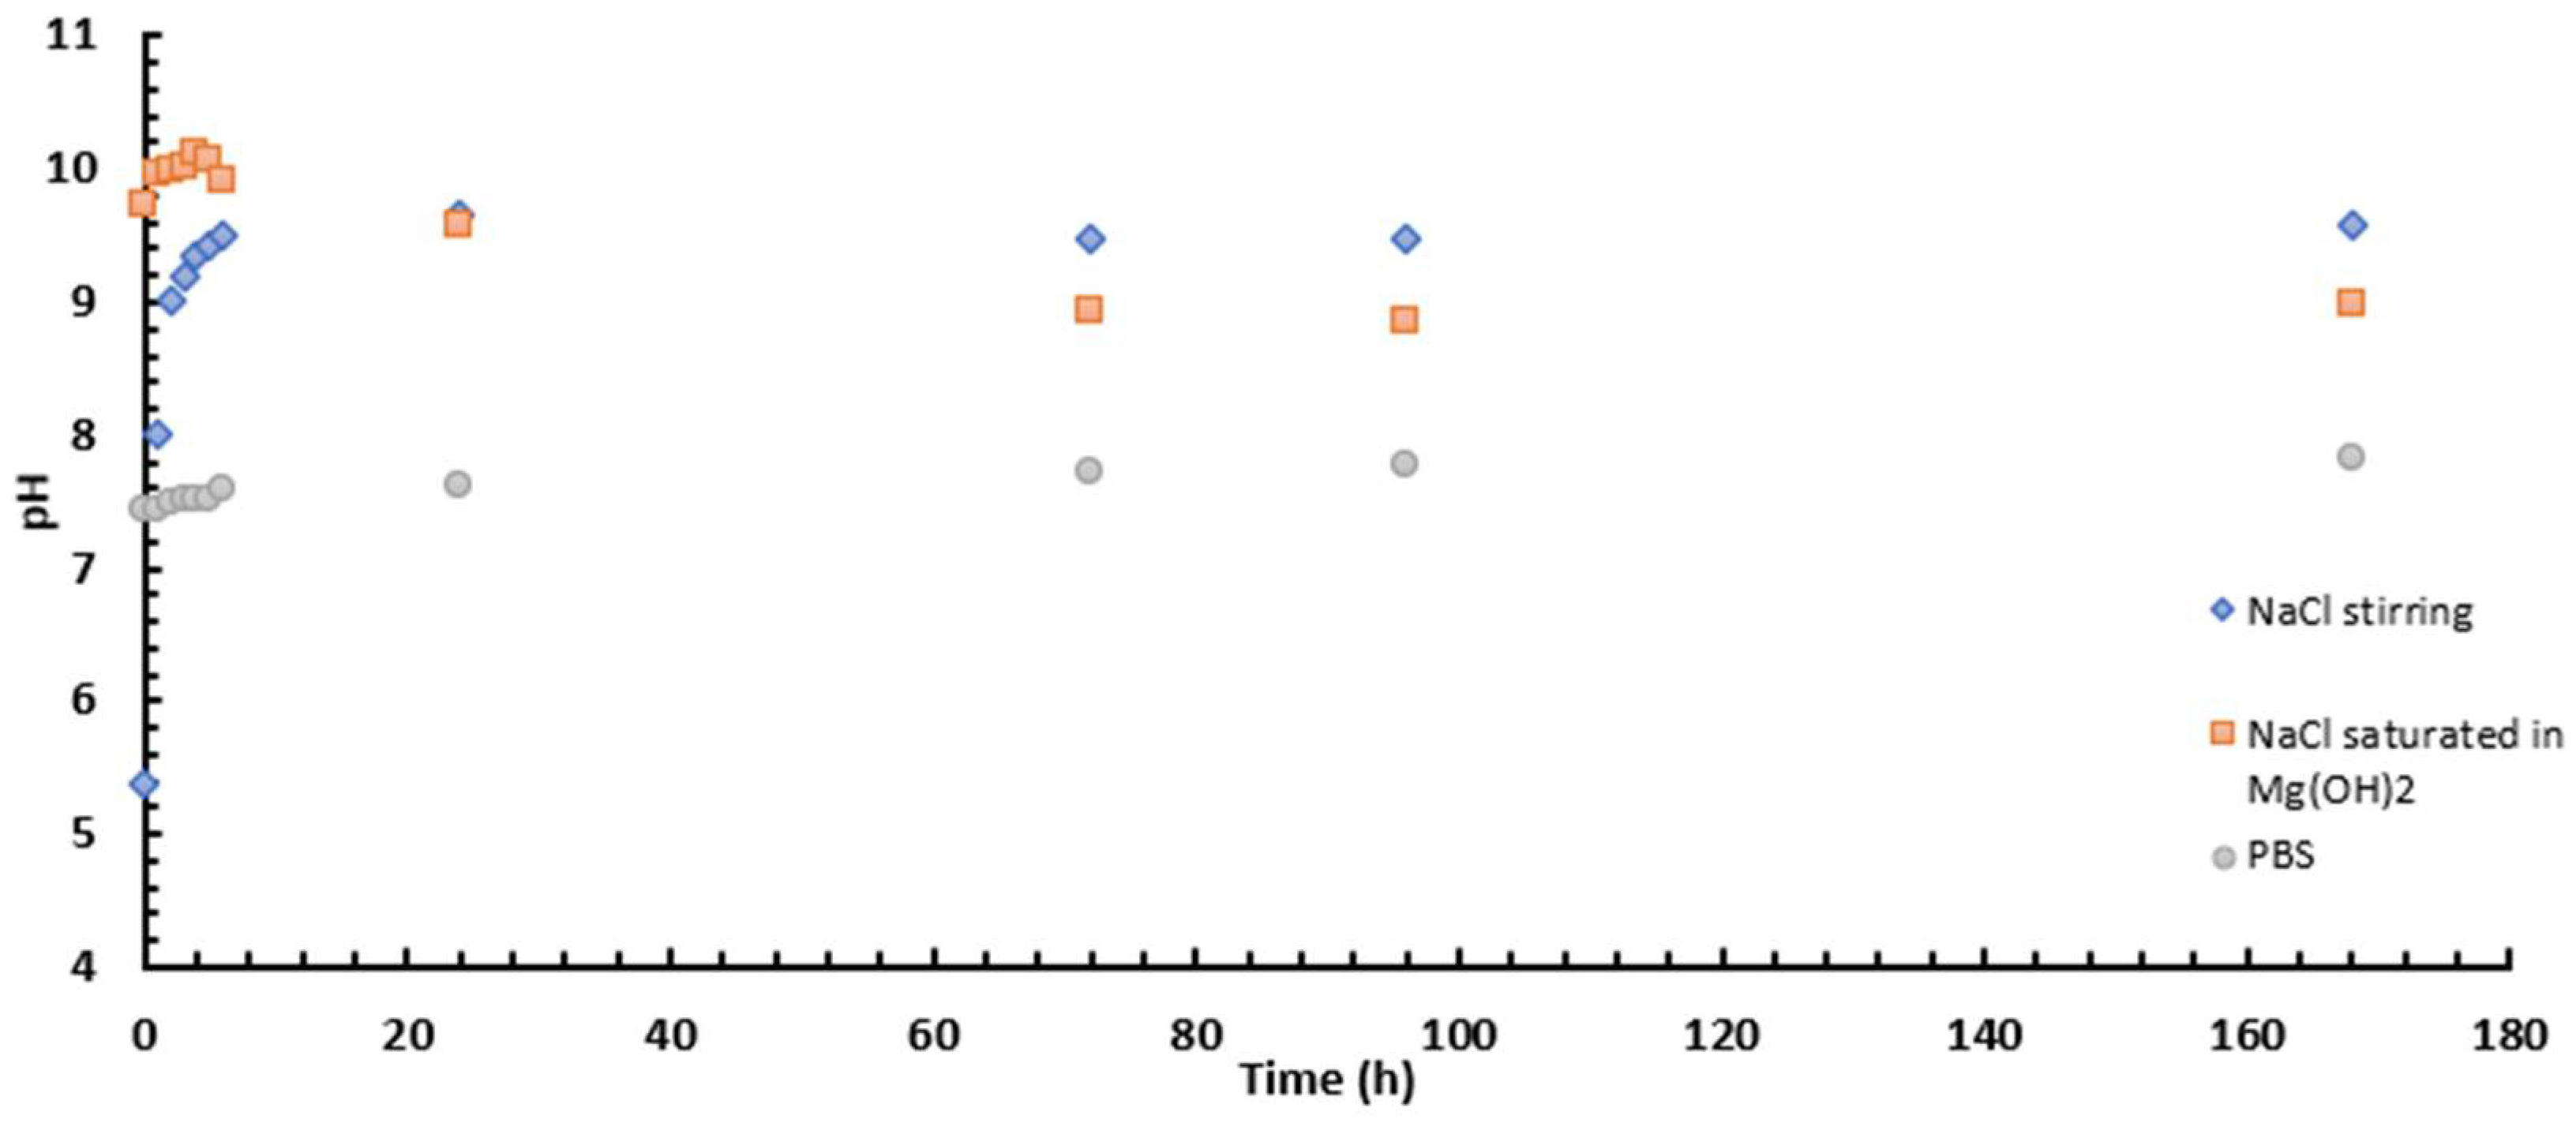
Finally, when comparing the two media (Figure 7 and Figure 9 and Table 6 and Table 7), it is interesting to note that after 2 h of immersion, the Z-modulus values are like each other. This behaviour is because the external and intermediate parts are porous and, whatever the medium, allow corrosive species to penetrate, which favours the progression of corrosion. The behaviour changes after 24 h immersion, but remains better in NaCl than in PBS, due to the aggressive medium of PBS and its pH of around 6 (Figure 12). Figure 12 shows that the pH of the medium with unsaturated NaCl rises rapidly to stabilise at pH 11. It is important to note that to avoid this evolution, which could be problematic for impedance analysis, it was decided to saturate the medium with Mg(OH)2. Furthermore, PBS, buffered at 6, does not allow the formation of corrosion products or protective compounds that would slow down the progression of magnesium corrosion, as we have seen above.
The electrochemical impedance on the 30 min samples were carried out in 0.1 M NaCl saturated with Mg(OH)2 and in PBS to compare their relative behaviour in both electrolytes (Figure 10). The equivalent circuit (Figure 6) studied in this section is based on various articles. The equivalent circuit (a) represents samples with a PEO coating and the equivalent circuit [31,32].
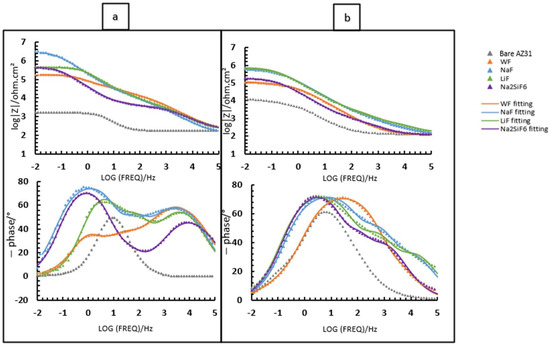
Figure 10.
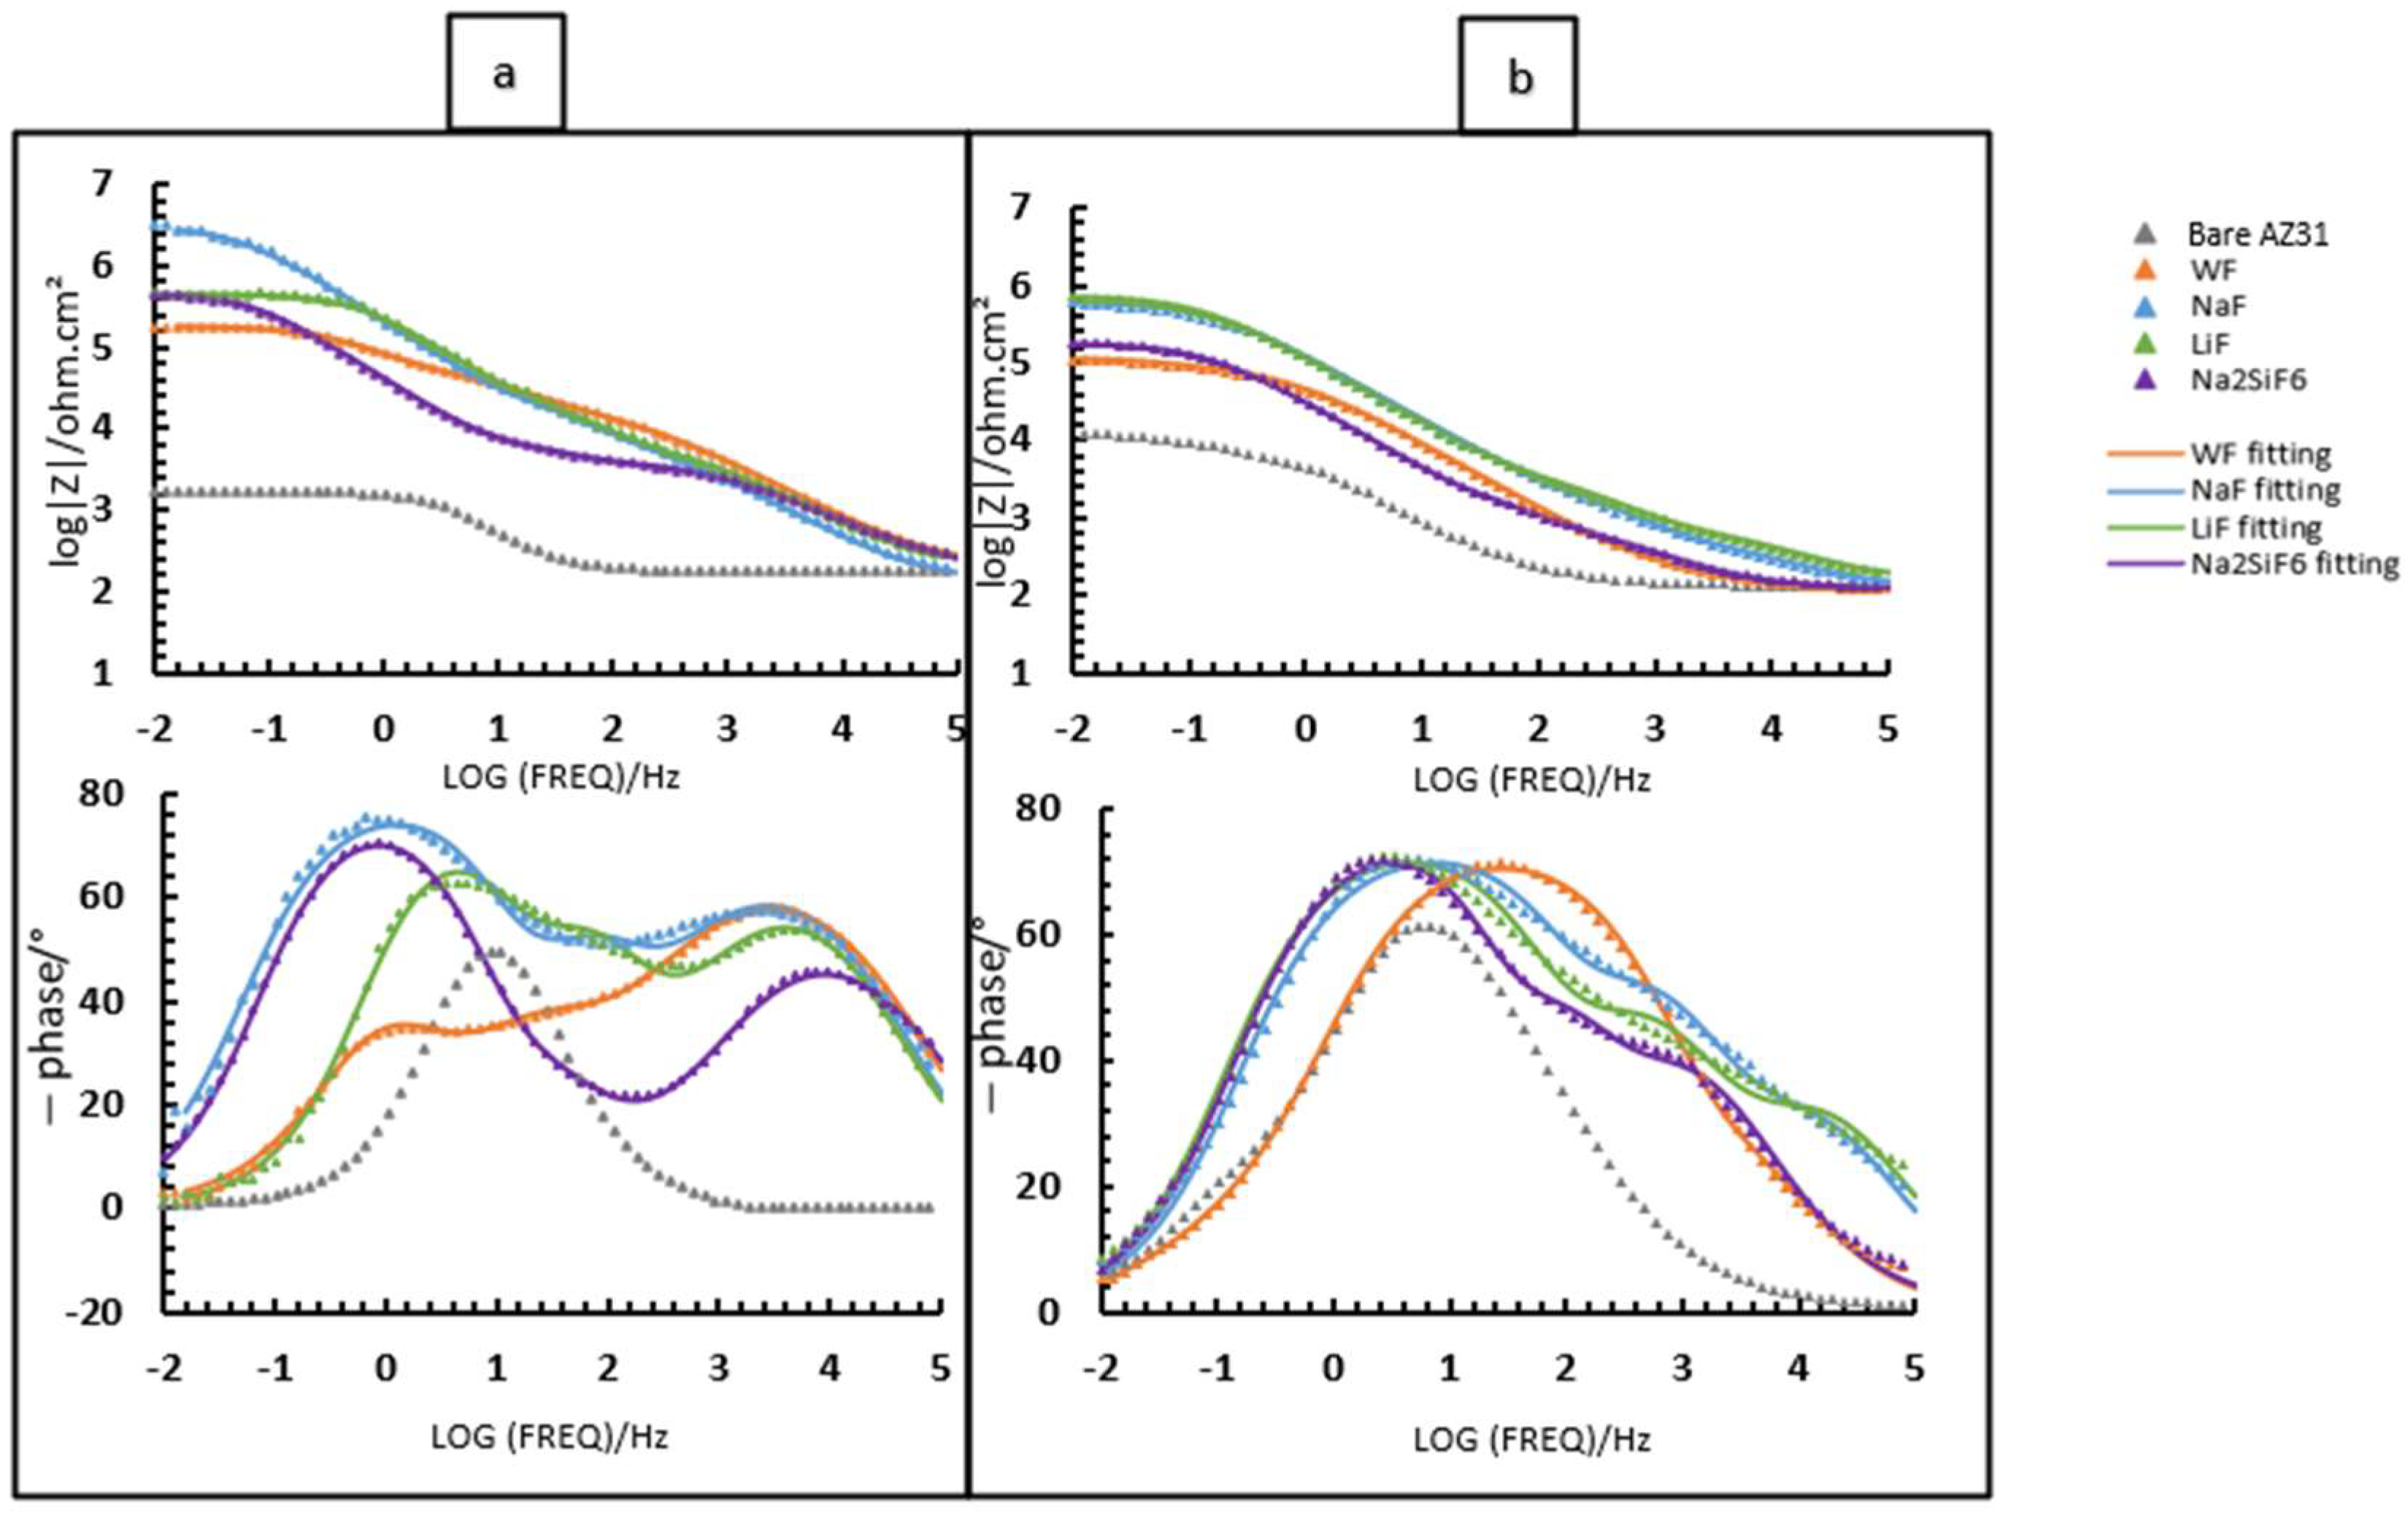
Bode diagram of fluoride and non-fluoride samples after 30 min PEO deposit: (a) 24 h immersion in NaCl 0.1 M saturated in Mg(OH)2; (b) 24 h immersion in PBS.
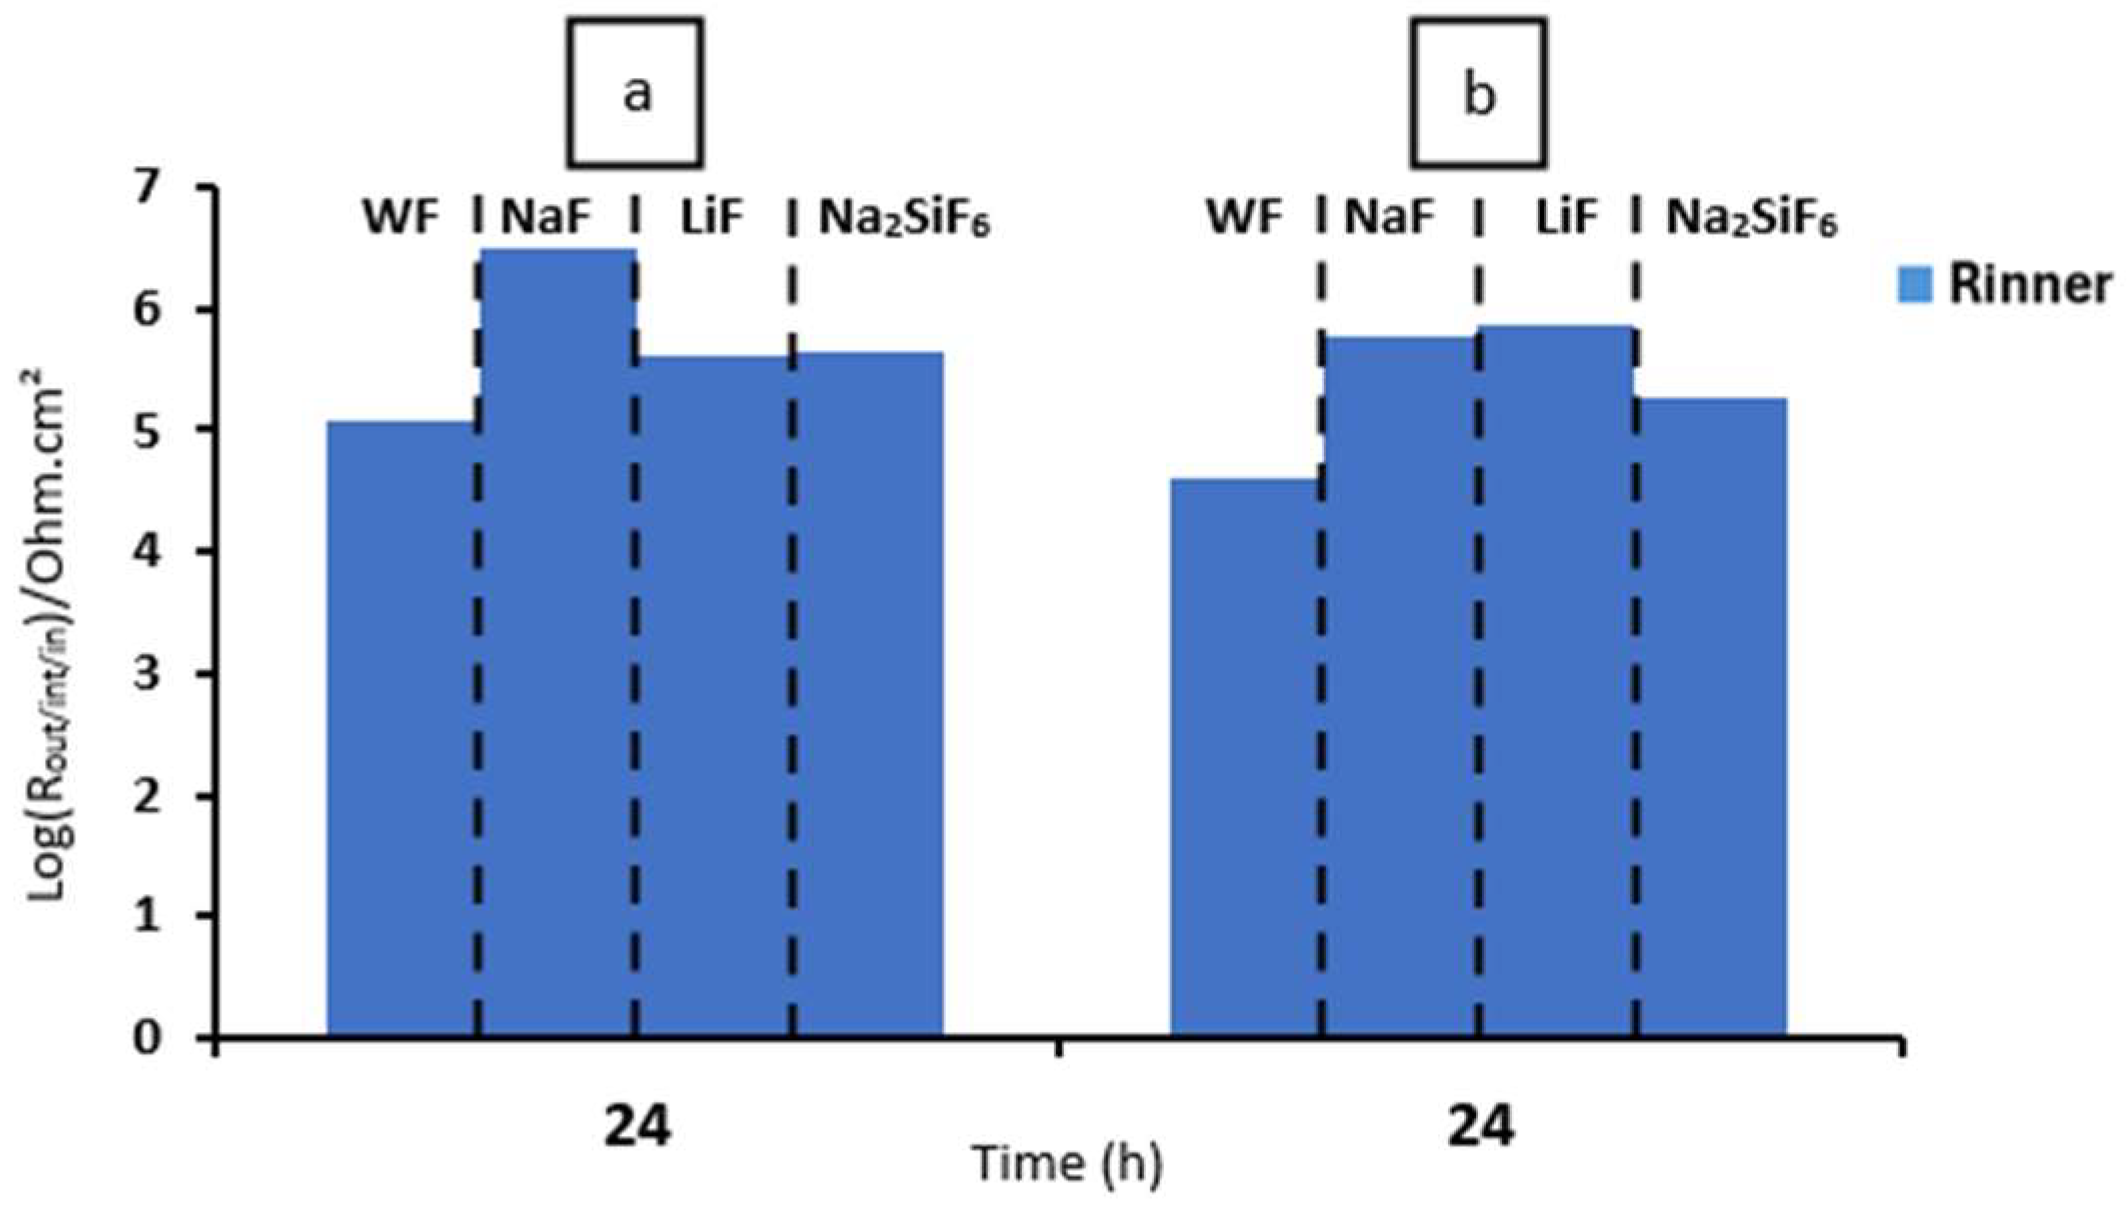
For samples exposed to 0.1 M NaCl saturated with Mg(OH)2, two time constants are visible in the bode diagram, but the behaviour is similar to that for 4 min of deposits, as there is an overlap of the barrier layer and the intermediate layer due to the fact that the layer is thicker and more compact (see Figure 3b,d,f,h). Comparing Figure 8a and Figure 11a, the highest Rin remains for the NaF sample. We also note that after 24 h for the 30 min deposit, the Na2SiF6 sample has the same Rin as LiF, unlike after the 4 min deposition. This means that deposition time has a significant impact on corrosion resistance, thanks to the presence of fluorides. This hypothesis is also confirmed with fluoride-free samples (WF): according to Table 8, WF has an Rin value of 117,000 Ohm·cm2, in contrast to Table 6, where WF has a value of only 1951 Ohm·cm2 [15]. Lingxia Fu et al. have also demonstrated the importance of fluorides in PEO baths and their increased corrosion resistance [33]. Comparing the phase diagrams for either the 4 min or 30 min deposition, two time constants are visible for each sample. There are three time constants which are not visible for 30 min PEO deposits, since the intermediate and inner layers overlap which, in the case of the 4 min PEO deposits, can be seen after 24 h in the aggressive medium (see Figure 7b).
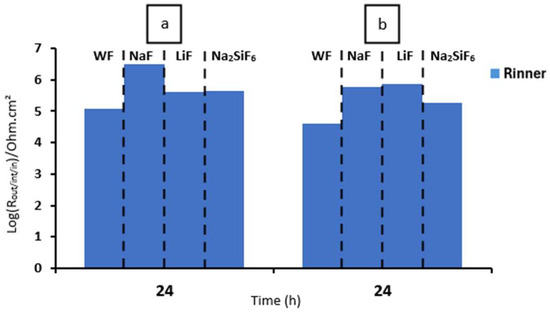
Figure 11.
Comparison of the Rinner at 2 and 24 h with different samples in (a) NaCl 0.1 M saturated with Mg(OH)2 and (b) PBS for 30 min PEO deposit.
Table 8.
Values of the different elements of the equivalent electrical circuit of bare AZ31, WF, NaF, LiF, and Na2SiF6 samples with 24 h in 0.1 M NaCl saturated Mg(OH)2 and PBS for 30 min PEO deposit.
Comparing the Rin of samples immersed in PBS (Figure 8b and Figure 11b), the deposition time also affects the corrosion resistance of the coating as well as the presence of fluoride. After the 30 min deposition, the LiF-containing sample has a higher Rin than Na2SiF6. The NaF sample, on the other hand, remains the most interesting, since it remains protective at both lower and higher deposition times. For phase diagrams, comparing Figure 9b and Figure 10b, even though the medium is more aggressive than 0.1 M NaCl, two time constants are still visible for 30 min deposits. However, the NaF sample has the same phase diagram for both deposition times.
In conclusion, the NaF sample has a higher Rin resistance than the others. During the PEO process, F− ions from NaF probably diffuse more easily and provide a more homogeneous barrier layer than other ions. This is probably because LiF has a lower solubility than NaF (0.134 g/100 mL at 20 °C for LiF and 4.3 g/100 mL at 20 °C for NaF) [34,35], and the SiF62− ion is larger than the F− ion [30]. Moreover, a review explains that sodium ions (Na+) can enhance the electrochemical properties during the PEO process and promote the formation of a dense oxide layer. The facilitation of enhanced electrochemical processes is achieved by these ions, thereby enabling the electric current to flow more efficiently in a single direction during the oxidation process. This results in a more uniform and controlled growth of the oxide layer. Furthermore, the presence of cations has been demonstrated to facilitate the crystallization of the oxide layer, thereby enhancing its resistance to corrosion [29].
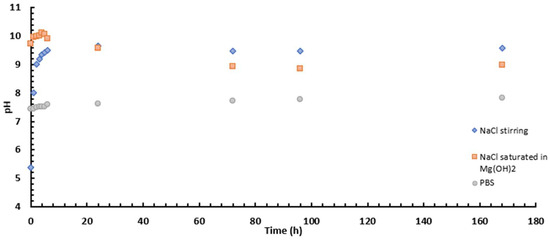
Figure 12.
pH evolution versus immersion time for NaCl medium with a stirrer/NaCl medium saturated in Mg(OH)2 and PBS medium.
Figure 12.
pH evolution versus immersion time for NaCl medium with a stirrer/NaCl medium saturated in Mg(OH)2 and PBS medium.
Finally, corrosion protection efficiency (P.E.) was performed to compare the protection of PEO deposits with that of bare AZ31 (Table 9). To do this, we used the following equation [36]:
where Rct represents the coating’s charge transfer resistance, while represents the bare AZ31’s charge transfer resistance. WF has a lower corrosion protection efficiency than fluoride samples. For LiF, after the 4 min deposit for both media, a lower P.E. is observed. However, after 30 min deposition, the results are conclusive for all layers, including LiF and WF.
Table 9.
Corrosion protection efficiency of different fluoride contributions for different deposition times in different electrolyte media.
3.3. Eudiometry
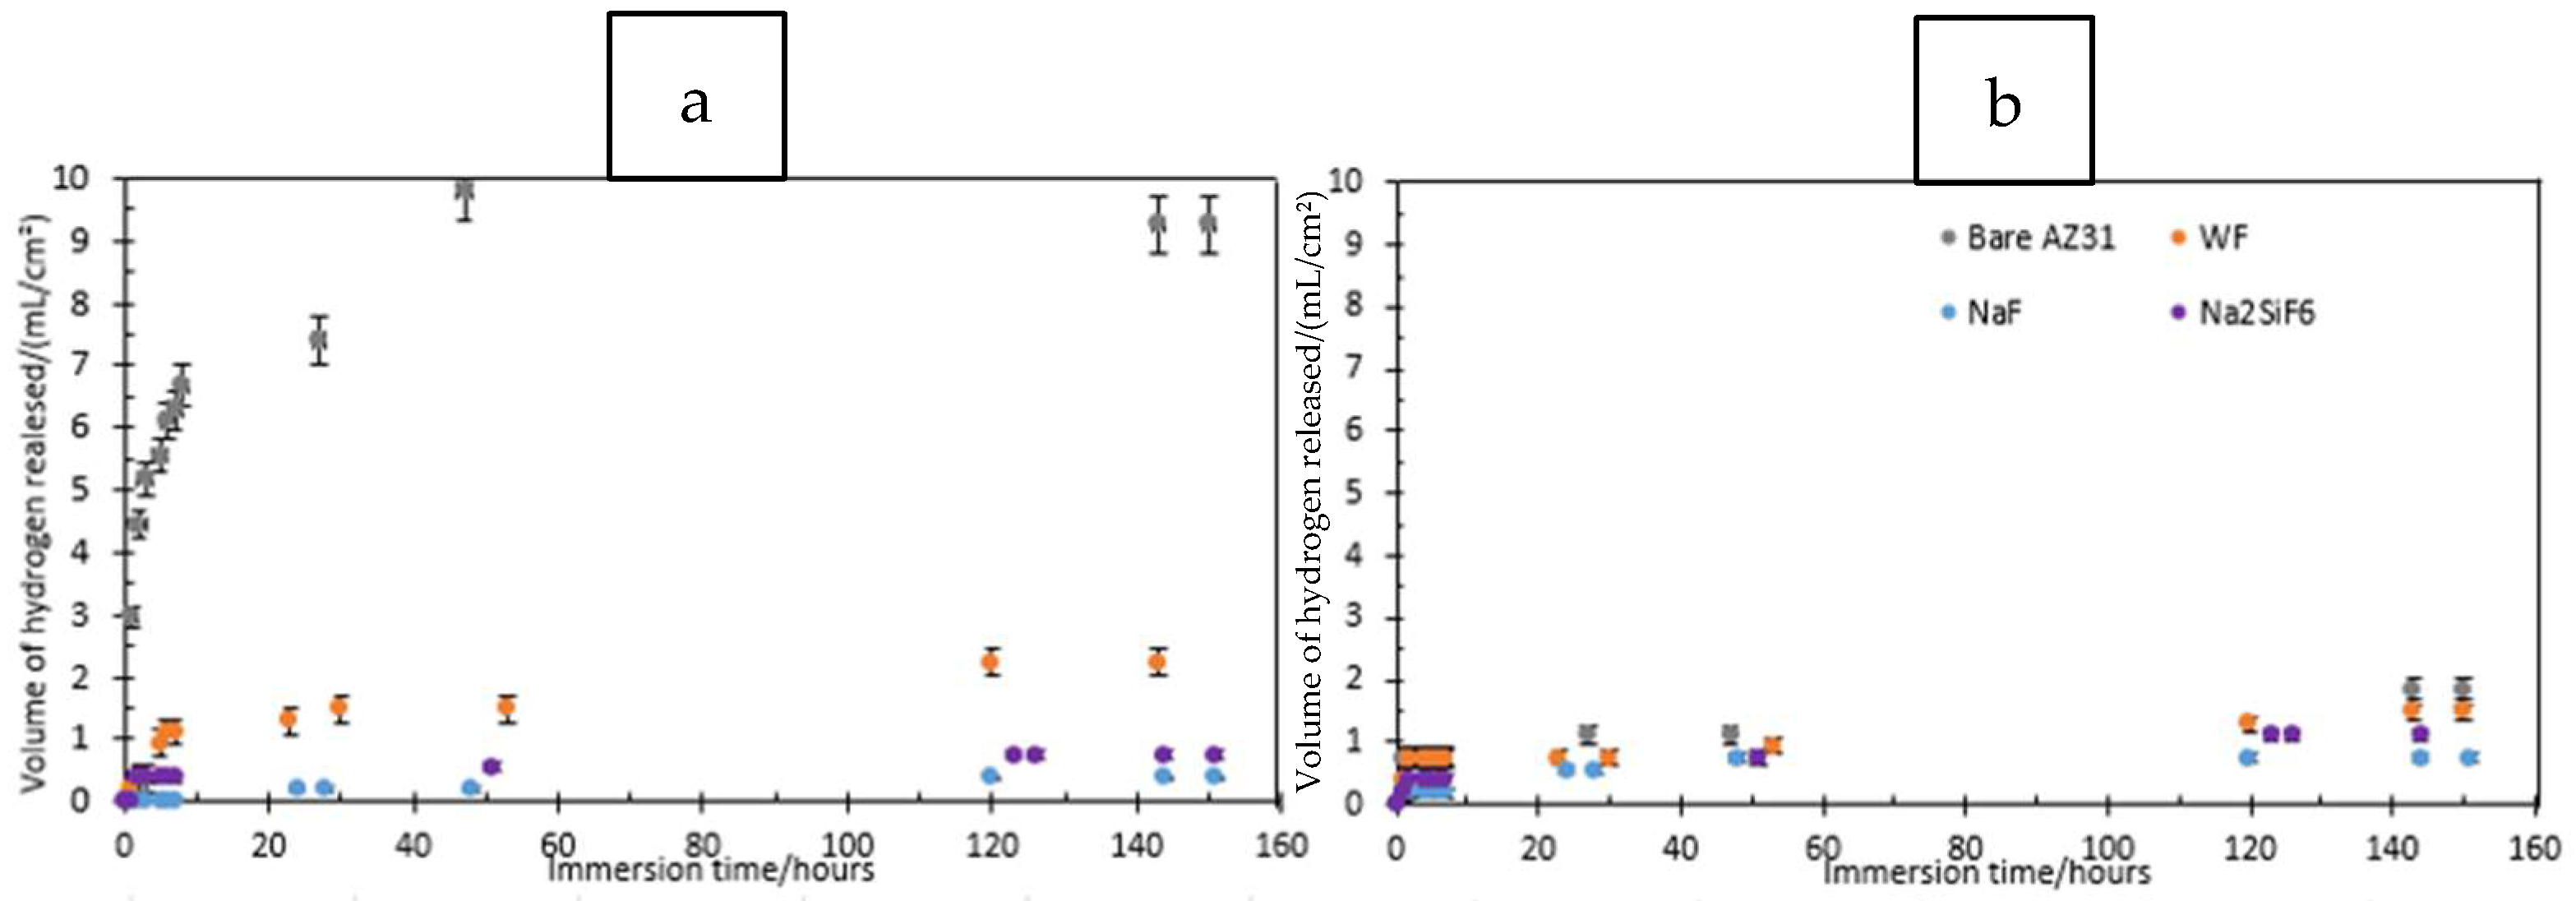
The volume of gas released during eudiometry tests offers insights into sample corrosion. These tests were conducted on three types of magnesium: bare magnesium, coated magnesium without fluorides, and coated magnesium with the two most effective fluorides from the impedance measurements—NaF and Na2SiF6. Figure 13 illustrates how the volume of hydrogen released changes over time during immersion in either 0.1 M NaCl or PBS. In Mg(OH)2-saturated 0.1 M NaCl (Figure 13a), bare Mg is the sample that releases the most H2. This is perfectly consistent with the fact that it has no coating to protect the substrate. The WF sample (without fluorides) also releases more H2 than NaF and Na2SiF6, demonstrating the impact of fluorides on the PEO layer. For the two samples with fluorides, the release of hydrogen is quite similar. Indeed, the presence of MgF2 at the substrate/coating interface produces a barrier layer which increases the corrosion resistance of the PEO coating [30]. Moreover, the corrosion rate is below 0.5 mm/year for the fluorinated samples while it is 1.41 for the WF sample and 5.86 for the bare magnesium (Table 10). Figure 14a,b show that after 6 days of immersion, the bare AZ31 surface is covered by corrosion product: Mg(OH)2 (see Figure 15). However, with a layer of PEO, the surface has almost none left. However, some articles explain that the corrosion product can be located between the PEO layer and the substrate itself or in the pores of the latter. This can also block the passage of hydrogen bubbles [37].
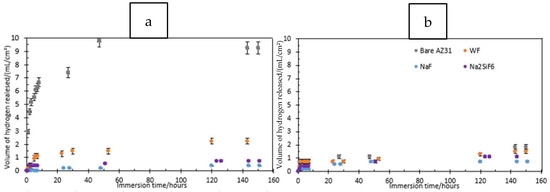
Figure 13.
Volume of hydrogen released as a function of time for bare AZ31, NaF, and Na2SiF6 samples immersed in (a) 0.1 M NaCl and (b) PBS for 30 min PEO deposit.
Table 10.
Corrosion rate after a period of 150 h of immersion in 0.1 M NaCl saturated in Mg(OH)2 or PBS for bare AZ31, WF, NaF, and Na2SiF6 samples.
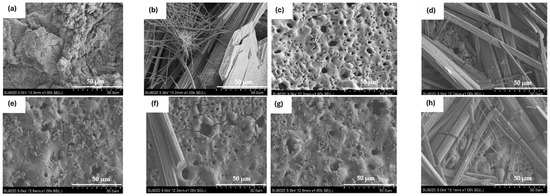
Figure 14.
SEM images of surfaces of (a,b) bare AZ31 samples, (c,d) WF, and (e,f) NaF and (g,h) Na2SiF6 samples after 6 days in 0.1 M NaCl (left) and PBS (right).
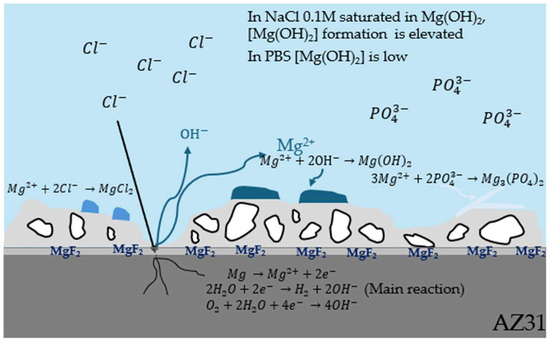
Figure 15.
Corrosion process of PEO-coated AZ31 in an aggressive environment.
In the case of PBS (Figure 13b), the H2 release produced on bare AZ31 is like those with coatings as also indicated by the corrosion rate which is about 5 times less important after 150 h of immersion (Table 10). This can be explained by the formation of Mg3(PO4)2 crystals on the bare AZ31 surface (Figure 14a) blocking the passage of gas bubbles.
As shown in Figure 14, crystals form on the surface of the samples. Bare AZ31 has a much larger crystal distribution than PEO layers. However, fluoride-free coating (Figure 14c,d) has more crystals on its surface than fluoride-containing coatings. This is due to the Mg2+ released during corrosion, which precipitates with the phosphate (shown Figure 15). The more phosphate crystals there are, the more corroded the sample [38]. Furthermore, Figure 16 shows the distribution of phosphate in the cross-section showing that the phosphates are located where the electrolyte can pass through. This means that H2 bubbles are blocked not only by the PEO layer, but also by the phosphate crystals.
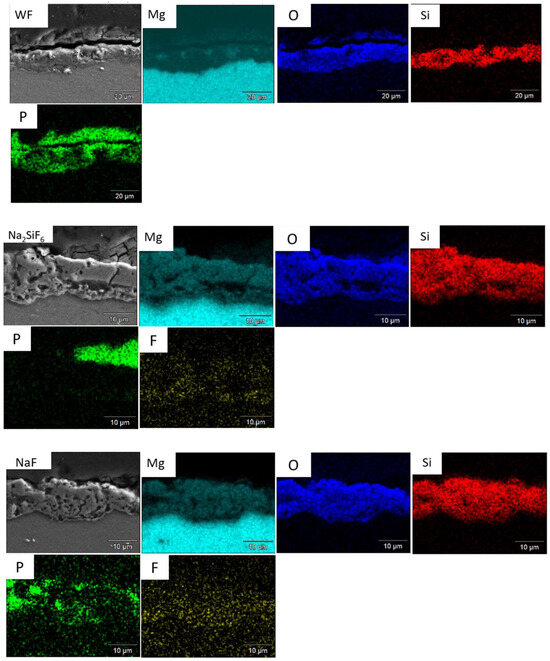
Figure 16.
Cross-section of WF, Na2SiF6, and NaF samples after 6 days in PBS.
Similarly, the corrosion of the WF sample seems lower in PBS than in 0.1 M NaCl saturated with Mg(OH)2, which can be explained by the fact that both the PEO layer and the corrosion products, which are produced more rapidly in PBS than in 0.1 M NaCl, block the gas bubbles released by the substrate as it corrodes. However, for NaF and Na2SiF6, H2 release is greater in PBS than in Mg(OH)2-saturated 0.1 M NaCl. Finally, fluoride-containing layers are more resistant than fluoride-free ones.
4. Conclusions
SEM analysis of PEO deposits revealed significant differences in layer morphology and porosity as a function of deposit time and the electrolyte used. Deposits over 30 min had larger average pore sizes than those over 4 min, with pore density reduced by half. In particular, the LiF-containing electrolyte showed larger but fewer pores after 30 min of the process, probably due to the high temperatures generated by the intense sparks.
EDS analysis showed that layer composition varied with deposit time. The atomic proportion of fluorine increased with deposit time, while that of silicon decreased. Samples containing LiF showed a lower proportion of fluorine, suggesting less fluoride incorporation than other electrolytes.
XRD analyses revealed that the layers are mainly composed of magnesium silicate and magnesium oxide. However, the expected MgF2 crystalline phase was not detected, probably due to its low quantity. Mg2SiO4 peaks were proportionally higher in fluoride-containing samples, while MgO peaks were less intense in the LiF sample, suggesting inhomogeneous formation of this phase due to intense localised discharges.
Electrochemical studies showed that the addition of fluorides improves the corrosion resistance of PEO layers. Samples with NaF and Na2SiF6 showed improved corrosion resistance compared to samples without fluorides or with LiF. Bode diagrams revealed that PEO layers with fluorides exhibit distinct time constants, indicating better corrosion protection.
Eudiometry tests confirmed that fluoride-containing layers were more resistant to corrosion than those without fluorides. Samples with NaF and Na2SiF6 showed lower hydrogen release, indicating better corrosion protection.
In conclusion, despite LiF’s interesting morphological characteristics, NaF offers better corrosion protection, which is crucial for biomedical applications. The choice of electrolyte and the duration of PEO deposition remain essential parameters for optimising the properties of the resulting layers.
Author Contributions
I.T.-D.: Writing—original draft, Methodology, Investigation, Funding acquisition, Formal analysis, Conceptualisation. C.P.: Validation, Investigation. A.M.: Validation, Investigation, Formal analysis. L.D.: Validation, Investigation. M.-G.O.: Writing—review and editing, Validation, Supervision, Methodology, Funding acquisition, Conceptualisation. All authors have read and agreed to the published version of the manuscript.
Funding
This research received no external funding.
Data Availability Statement
Data will be made available on request.
Conflicts of Interest
The authors declare that they have no known competing financial interests or personal relationships that could have appeared to influence the work reported in this paper.
Abbreviations
The following abbreviations are used in this manuscript:
| PEO | Plasma Electrolytic Oxidation |
| WF | Without Fluoride |
References
- Reina, N.; Laffosse, J.M. Biomécanique de l’Os, Application Au Traitement et à La Consolidation Des Fractures. Colloids Surfaces A Physicochem. Eng. Asp. 2014, 9, 1–17. [Google Scholar] [CrossRef]
- Uppal, G.; Thakur, A.; Chauhan, A.; Bala, S. Magnesium Based Implants for Functional Bone Tissue Regeneration—A Review. J. Magnes. Alloy. 2021, 10, 356–386. [Google Scholar] [CrossRef]
- King, J.F. Materials Perspective Magnesium: Commodity or Exotic? Mater. Sci. Technol. 2007, 23, 1–14. [Google Scholar] [CrossRef]
- Esmaily, M.; Svensson, J.E.; Fajardo, S.; Birbilis, N.; Frankel, G.S.; Virtanen, S.; Arrabal, R.; Thomas, S.; Johansson, L.G. Fundamentals and Advances in Magnesium Alloy Corrosion. Prog. Mater. Sci. 2017, 89, 92–193. [Google Scholar] [CrossRef]
- Taheri, M.; Kish, J.R.; Birbilis, N.; Danaie, M.; McNally, E.A.; McDermid, J.R. Towards a Physical Description for the Origin of Enhanced Catalytic Activity of Corroding Magnesium Surfaces. Electrochim. Acta 2014, 116, 396–403. [Google Scholar] [CrossRef]
- Asmussen, R.M.; Binns, W.J.; Partovi-Nia, R.; Jakupi, P.; Shoesmith, D.W. The Stability of Aluminum-Manganese Intermetallic Phases under the Microgalvanic Coupling Conditions Anticipated in Magnesium Alloys. Mater. Corros. 2016, 67, 39–50. [Google Scholar] [CrossRef]
- Ballerini, G.; Bardi, U.; Bignucolo, R.; Ceraolo, G. About Some Corrosion Mechanisms of AZ91D Magnesium Alloy. Corros. Sci. 2005, 47, 2173–2184. [Google Scholar] [CrossRef]
- Barati Darband, G.; Aliofkhazraei, M.; Hamghalam, P.; Valizade, N. Plasma Electrolytic Oxidation of Magnesium and Its Alloys: Mechanism, Properties and Applications. J. Magnes. Alloy 2017, 5, 74–132. [Google Scholar] [CrossRef]
- Hornberger, H.; Virtanen, S.; Boccaccini, A.R. Acta Biomaterialia Biomedical Coatings on Magnesium Alloys—A Review. Acta Biomater. 2012, 8, 2442–2455. [Google Scholar] [CrossRef]
- Roknian, M.; Fattah-alhosseini, A.; Gashti, S.O. Plasma Electrolytic Oxidation Coatings on Pure Ti Substrate: Effects of Na3PO4 Concentration on Morphology and Corrosion Behavior of Coatings in Ringer’s Physiological Solution. J. Mater. Eng. Perform. 2018, 27, 1343–1351. [Google Scholar] [CrossRef]
- Hussein, R. Plasma Process Control for Improved PEO Coatings on Magnesium Alloys. Ph.D. Thesis, University of Windsor, Windsor, ON, Canada, 2015. [Google Scholar]
- Matykina, E.; Garcia, I.; Arrabal, R.; Mohedano, M.; Mingo, B.; Sancho, J.; Merino, M.C.; Pardo, A. Role of PEO Coatings in Long-Term Biodegradation of a Mg Alloy. Appl. Surf. Sci. 2016, 389, 810–823. [Google Scholar] [CrossRef]
- Monetta, T.; Parnian, P.; Acquesta, A. Recent Advances in the Control of the Degradation Rate of PEO Treated Magnesium and Its Alloys for Biomedical Applications. Metals 2020, 10, 907. [Google Scholar] [CrossRef]
- Cui, X.; Lin, X.; Liu, C.; Yang, R.; Li, M. Microstructure and Properties of MAO Coatings for AZ91D Magnesium Alloy in Varies Work Mode. Mater. Sci. Forum 2013, 747–748, 178–183. [Google Scholar] [CrossRef]
- Liang, J.; Guo, B.; Tian, J.; Liu, H.; Zhou, J.; Xu, T. Effect of Potassium Fluoride in Electrolytic Solution on the Structure and Properties of Microarc Oxidation Coatings on Magnesium Alloy. Appl. Surf. Sci. 2005, 252, 345–351. [Google Scholar] [CrossRef]
- Soliman, H.; Hamdy, A.S. Effect of Fluoride Ions Modifier and Ceramic Al2O3 Particles Additives on Plasma Electrolytic Oxidation of AZ31. Surf. Eng. 2017, 33, 767–772. [Google Scholar] [CrossRef]
- Rogov, A.B.; Shayapov, V.R. The Role of Cathodic Current in PEO of Aluminum: Influence of Cationic Electrolyte Composition on the Transient Current-Voltage Curves and the Discharges Optical Emission Spectra. Appl. Surf. Sci. 2017, 394, 323–332. [Google Scholar] [CrossRef]
- Prince, L.; Noirfalise, X.; Paint, Y.; Olivier, M. Corrosion Mechanisms of AZ31 Magnesium Alloy: Importance of Starting PH and Its Evolution. Mater. Corros. 2022, 3, 1615–1630. [Google Scholar] [CrossRef]
- Sharma, S.; Sangal, S.; Mondal, K. On the Optical Microscopic Method for the Determination of Ball-on-Flat Surface Linearly Reciprocating Sliding Wear Volume. Wear 2013, 300, 82–89. [Google Scholar] [CrossRef]
- Rendenbach, C.; Fischer, H.; Kopp, A.; Schmidt-Bleek, K.; Kreiker, H.; Stumpp, S.; Thiele, M.; Duda, G.; Hanken, H.; Beck-Broichsitter, B.; et al. Improved in Vivo Osseointegration and Degradation Behavior of PEO Surface-Modified WE43 Magnesium Plates and Screws after 6 and 12 Months. Mater. Sci. Eng. C 2021, 129, 112380. [Google Scholar] [CrossRef]
- Ralls, A.M.; Daroonparvar, M.; Menezes, P.L. Spark Plasma Sintering of Mg-Based Alloys: Microstructure, Mechanical Properties, Corrosion Behavior, and Tribological Performance. J. Magnes. Alloy 2024, 12, 405–442. [Google Scholar] [CrossRef]
- Zhang, W.; Xin, S.; Huang, Q.; Jiao, H. Study on the Thermal Control Performance of Mg-Li Alloy Micro-Arc Oxidation Coating in High-Temperature Environments. Surfaces 2024, 7, 969–978. [Google Scholar] [CrossRef]
- Simchen, F.; Sieber, M.; Kopp, A.; Lampke, T. Introduction to Plasma Electrolytic Oxidation-an Overview of the Process and Applications. Coatings 2020, 10, 628. [Google Scholar] [CrossRef]
- Pezzato, L.; Brunelli, K.; Gross, S.; Magrini, M.; Dabalà, M. Effect of Process Parameters of Plasma Electrolytic Oxidation on Microstructure and Corrosion Properties of Magnesium Alloys. J. Appl. Electrochem. 2014, 44, 867–879. [Google Scholar] [CrossRef]
- Lujun, Z.; Hongzhan, L.; Qingmei, M.; Jiangbo, L.; Zhengxian, L. The Mechanism for Tuning the Corrosion Resistance and Pore Density of Plasma Electrolytic Oxidation (PEO) Coatings on Mg Alloy with Fluoride Addition. J. Magnes. Alloy 2023, 11, 2823–2832. [Google Scholar] [CrossRef]
- Purniawan, A.; Faqih, M.A.A.; Wuryantoro, A.; Wicaksono, S.T.; Susanti, D.; Rasyida, A.; Ardhyananta, H. The Influence of Voltage and Time Variation on Plasma Electrolytic Oxidation (PEO) on the Morphology and Degradation Rate of AZ61 Magnesium Alloy. Available online: https://papers.ssrn.com/sol3/papers.cfm?abstract_id=5196304 (accessed on 24 March 2025).
- Taher, M.K.; Momoli, F.; Go, J.; Hagiwara, S.; Ramoju, S.; Hu, X.; Jensen, N.; Terrell, R.; Hemmerich, A.; Krewski, D. Systematic Review of Epidemiological and Toxicological Evidence on Health Effects of Fluoride in Drinking Water. Crit. Rev. Toxicol. 2024, 54, 2–34. [Google Scholar] [CrossRef]
- Wang, L.; Chen, L.; Yan, Z.; Wang, H.; Peng, J. Effect of Potassium Fluoride on Structure and Corrosion Resistance of Plasma Electrolytic Oxidation Films Formed on AZ31 Magnesium Alloy. J. Alloys Compd. 2009, 480, 469–474. [Google Scholar] [CrossRef]
- Hou, R.; Victoria-Hernandez, J.; Jiang, P.; Willumeit-Römer, R.; Luthringer-Feyerabend, B.; Yi, S.; Letzig, D.; Feyerabend, F. In Vitro Evaluation of the ZX11 Magnesium Alloy as Potential Bone Plate: Degradability and Mechanical Integrity. Acta Biomater. 2019, 97, 608–622. [Google Scholar] [CrossRef]
- Thanaa, T.T.; Fattah-alhosseini, A.; Alkaseem, M.; Kaseem, M. Improving the Surface Properties of Mg Based-Plasma Electrolytic Oxidation (PEO) Coatings under the Fluoride Electrolytes: A Review. Inorg. Chem. Commun. 2024, 170, 113163. [Google Scholar] [CrossRef]
- Castellanos, A.; Altube, A.; Vega, J.M.; García-Lecina, E.; Díez, J.A.; Grande, H.J. Effect of Different Post-Treatments on the Corrosion Resistance and Tribological Properties of AZ91D Magnesium Alloy Coated PEO. Surf. Coatings Technol. 2015, 278, 99–107. [Google Scholar] [CrossRef]
- Bordbar Khiabani, A.; Rahimi, S.; Yarmand, B.; Mozafari, M. Electrophoretic Deposition of Graphene Oxide on Plasma Electrolytic Oxidized-Magnesium Implants for Bone Tissue Engineering Applications. Mater. Today Proc. 2018, 5, 15603–15612. [Google Scholar] [CrossRef]
- Fu, L.; Yang, Y.; Zhang, L.; Wu, Y.; Liang, J.; Cao, B. Preparation and Characterization of Fluoride-Incorporated Plasma Electrolytic Oxidation Coatings on the AZ31 Magnesium Alloy. Coatings 2019, 9, 826. [Google Scholar] [CrossRef]
- National Center for Biotechnology Information Lithium Fluoride. Available online: https://pubchem.ncbi.nlm.nih.gov/compound/Lithium-fluoride (accessed on 12 April 2025).
- Information National Center for Biotechnology Sodium Fluoride. Available online: https://pubchem.ncbi.nlm.nih.gov/compound/Sodium-Fluoride (accessed on 11 April 2025).
- Yang, H.; Dong, Y.; Li, X.; Gao, Y.; He, W.; Liu, Y.; Mu, X.; Zhao, Y. Anti-Corrosion Superhydrophobic Micro-GF/Micro-TiB2/Nano-SiO2 Based Coating with Braid Strengthening Structure Fabricated by a Single-Step Spray Deposition. J. Alloys Compd. 2024, 1008, 176725. [Google Scholar] [CrossRef]
- Moreno, L.; Mohedano, M.; Arrabal, R.; Matykina, E. Screening of Fluoride-Free PEO Coatings on Cast Mg3Zn0.4Ca Alloy for Orthopaedic Implants. Surf. Coatings Technol. 2024, 476, 130184. [Google Scholar] [CrossRef]
- Peng, H.; Wang, W.; Jiang, H.; Zan, R.; Sun, Y.; Yu, S.; Ni, J.; Wang, W.; Wang, T.; Wang, J.; et al. Effect of Galvanic Corrosion on the Degradability of Biomedical Magnesium. Front. Mater. 2021, 8, 767179. [Google Scholar] [CrossRef]


Disclaimer/Publisher’s Note: The statements, opinions and data contained in all publications are solely those of the individual author(s) and contributor(s) and not of MDPI and/or the editor(s). MDPI and/or the editor(s) disclaim responsibility for any injury to people or property resulting from any ideas, methods, instructions or products referred to in the content. |
© 2025 by the authors. Licensee MDPI, Basel, Switzerland. This article is an open access article distributed under the terms and conditions of the Creative Commons Attribution (CC BY) license (https://creativecommons.org/licenses/by/4.0/).