
Assistance to Determine the Stability State of a Reactive Sputtering Process Based on the Analytical Solution of the Classical Berg Model


Abstract
1. Introduction
2. Materials and Methods
3. Results
3.1. Modeling the Reactive Sputtering Process
3.2. Effect of Bias
4. Conclusions
Supplementary Materials
Author Contributions
Funding
Institutional Review Board Statement
Informed Consent Statement
Data Availability Statement
Acknowledgments
Conflicts of Interest
Appendix A

| αt = αs | 0.107 |
| Ym | 2.09 |
| Yc | 0.006 |
| X | 166 |
| ry | 0.003 |
| Ar | 1.5 |
| P | 1–3.8 |
| S | 0.004–0.016 |
| Symbol | Meaning |
|---|---|
| Qin | Oxygen flow rate |
| p | Oxygen partial pressure |
| s | Pumping speed for the reactive gas |
| kB | Boltzmann constant |
| T | Temperature inside of the chamber |
| αt | Sticking coefficient on the target |
| αs | Sticking coefficient on the substrate |
| At | Surface area of the target |
| As | Collecting area |
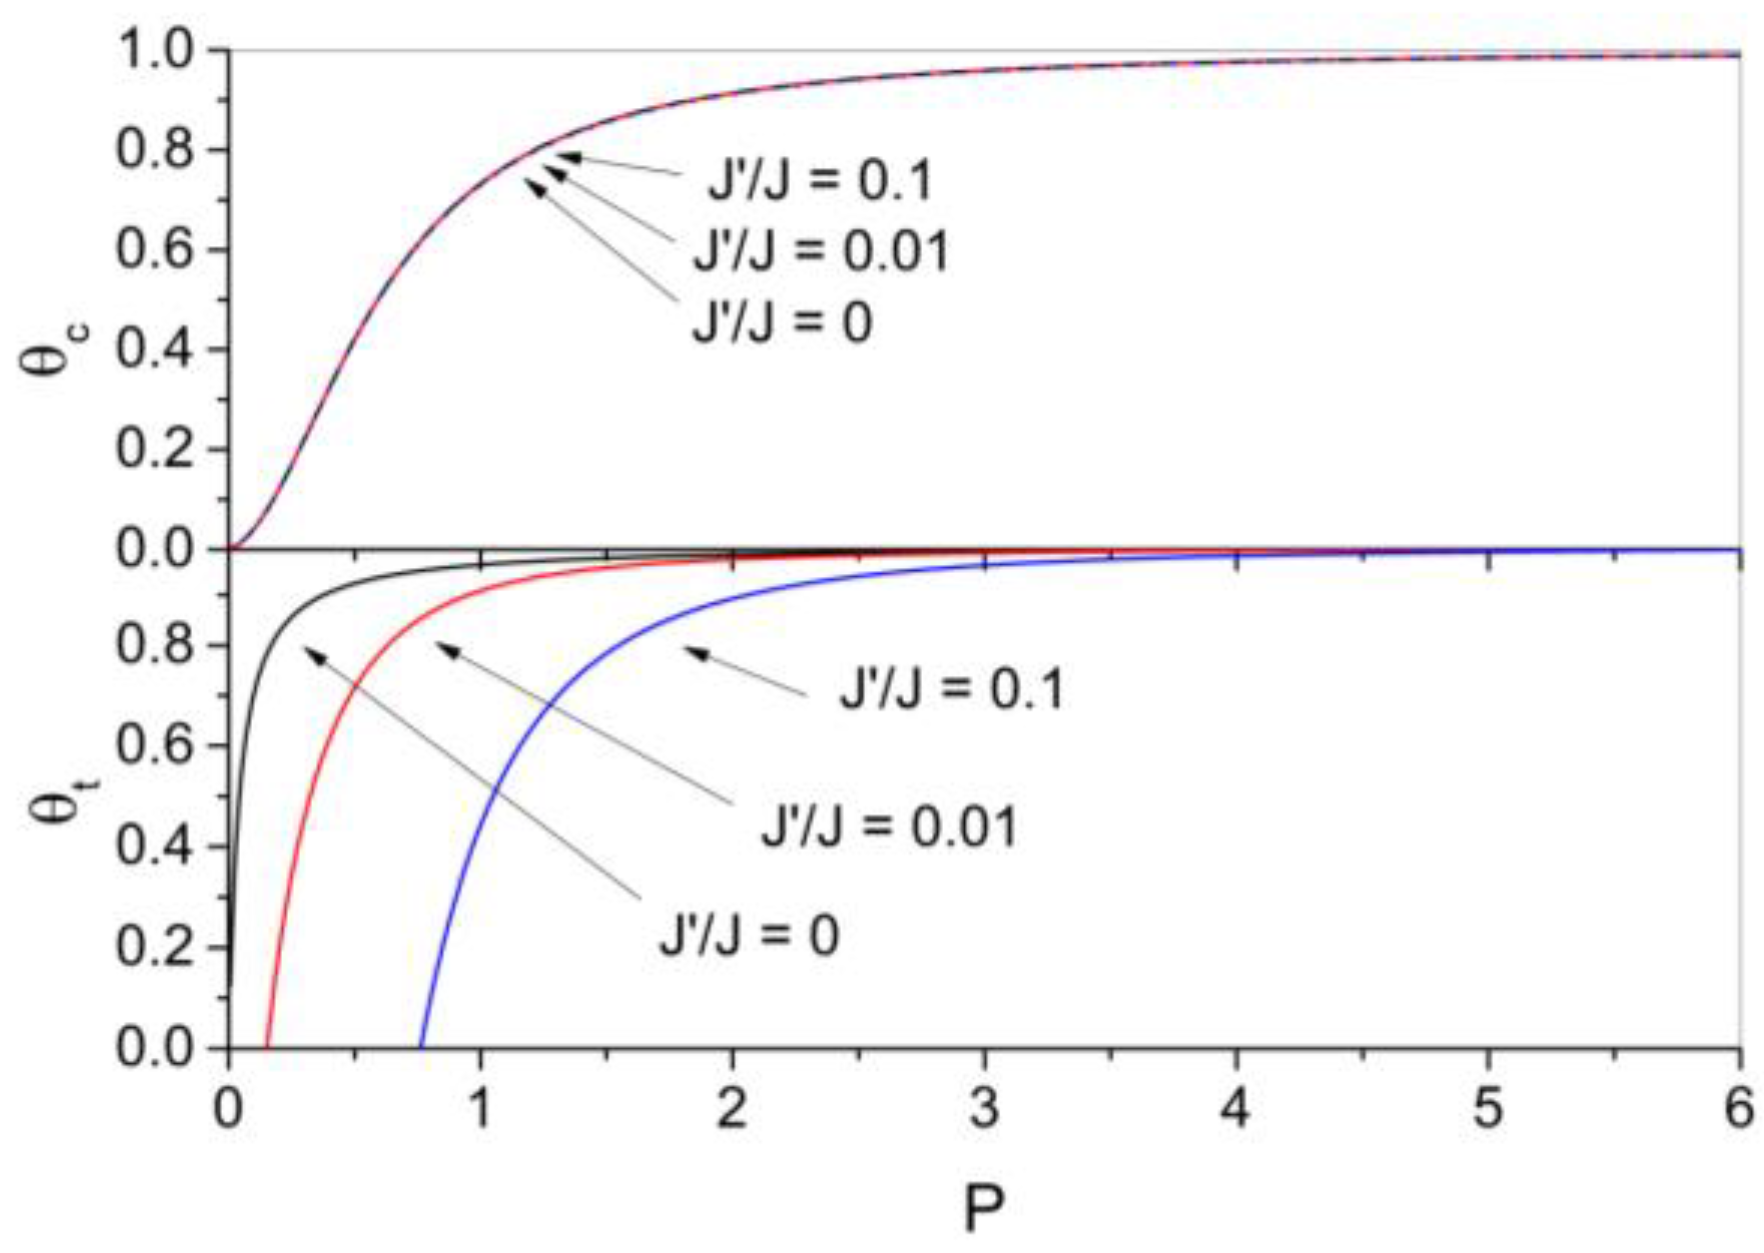
| θt | Surface coverage of the target |
| θs | Surface coverage of the substrate |
| F | Reactive gas flux |
| m | Mass of the reactive gas molecule |
| J | Ion current density of the target |
| z | Stoichiometry ratio |
| e | Elementary charge |
| Ym | Sputtering yield of the metal |
| Yc | Sputtering yield of the compound |
| Ar | Surface area ratio (Equation (5)) |
| X | 1/Yc (Equation (5)) |
| ry | Sputtering yield ratio (Equation (5)) |
| S | Dimensionless pumping speed (Equation (5)) |
| P | Dimensionless pressure (Equation (5)) |
| τ | e/JAt (Equation (5)) |
| c1 | 2αtX/z (Equation (10)) |
| c2 | 2αsAr/z (Equation (10)) |
| 2αt/(zryc2) (Equation (10)) | |
| M | 1 + ry (2αtPX/z + 2αsPXAr/z (2αtPX/z + 1)) (Equation (10)) |
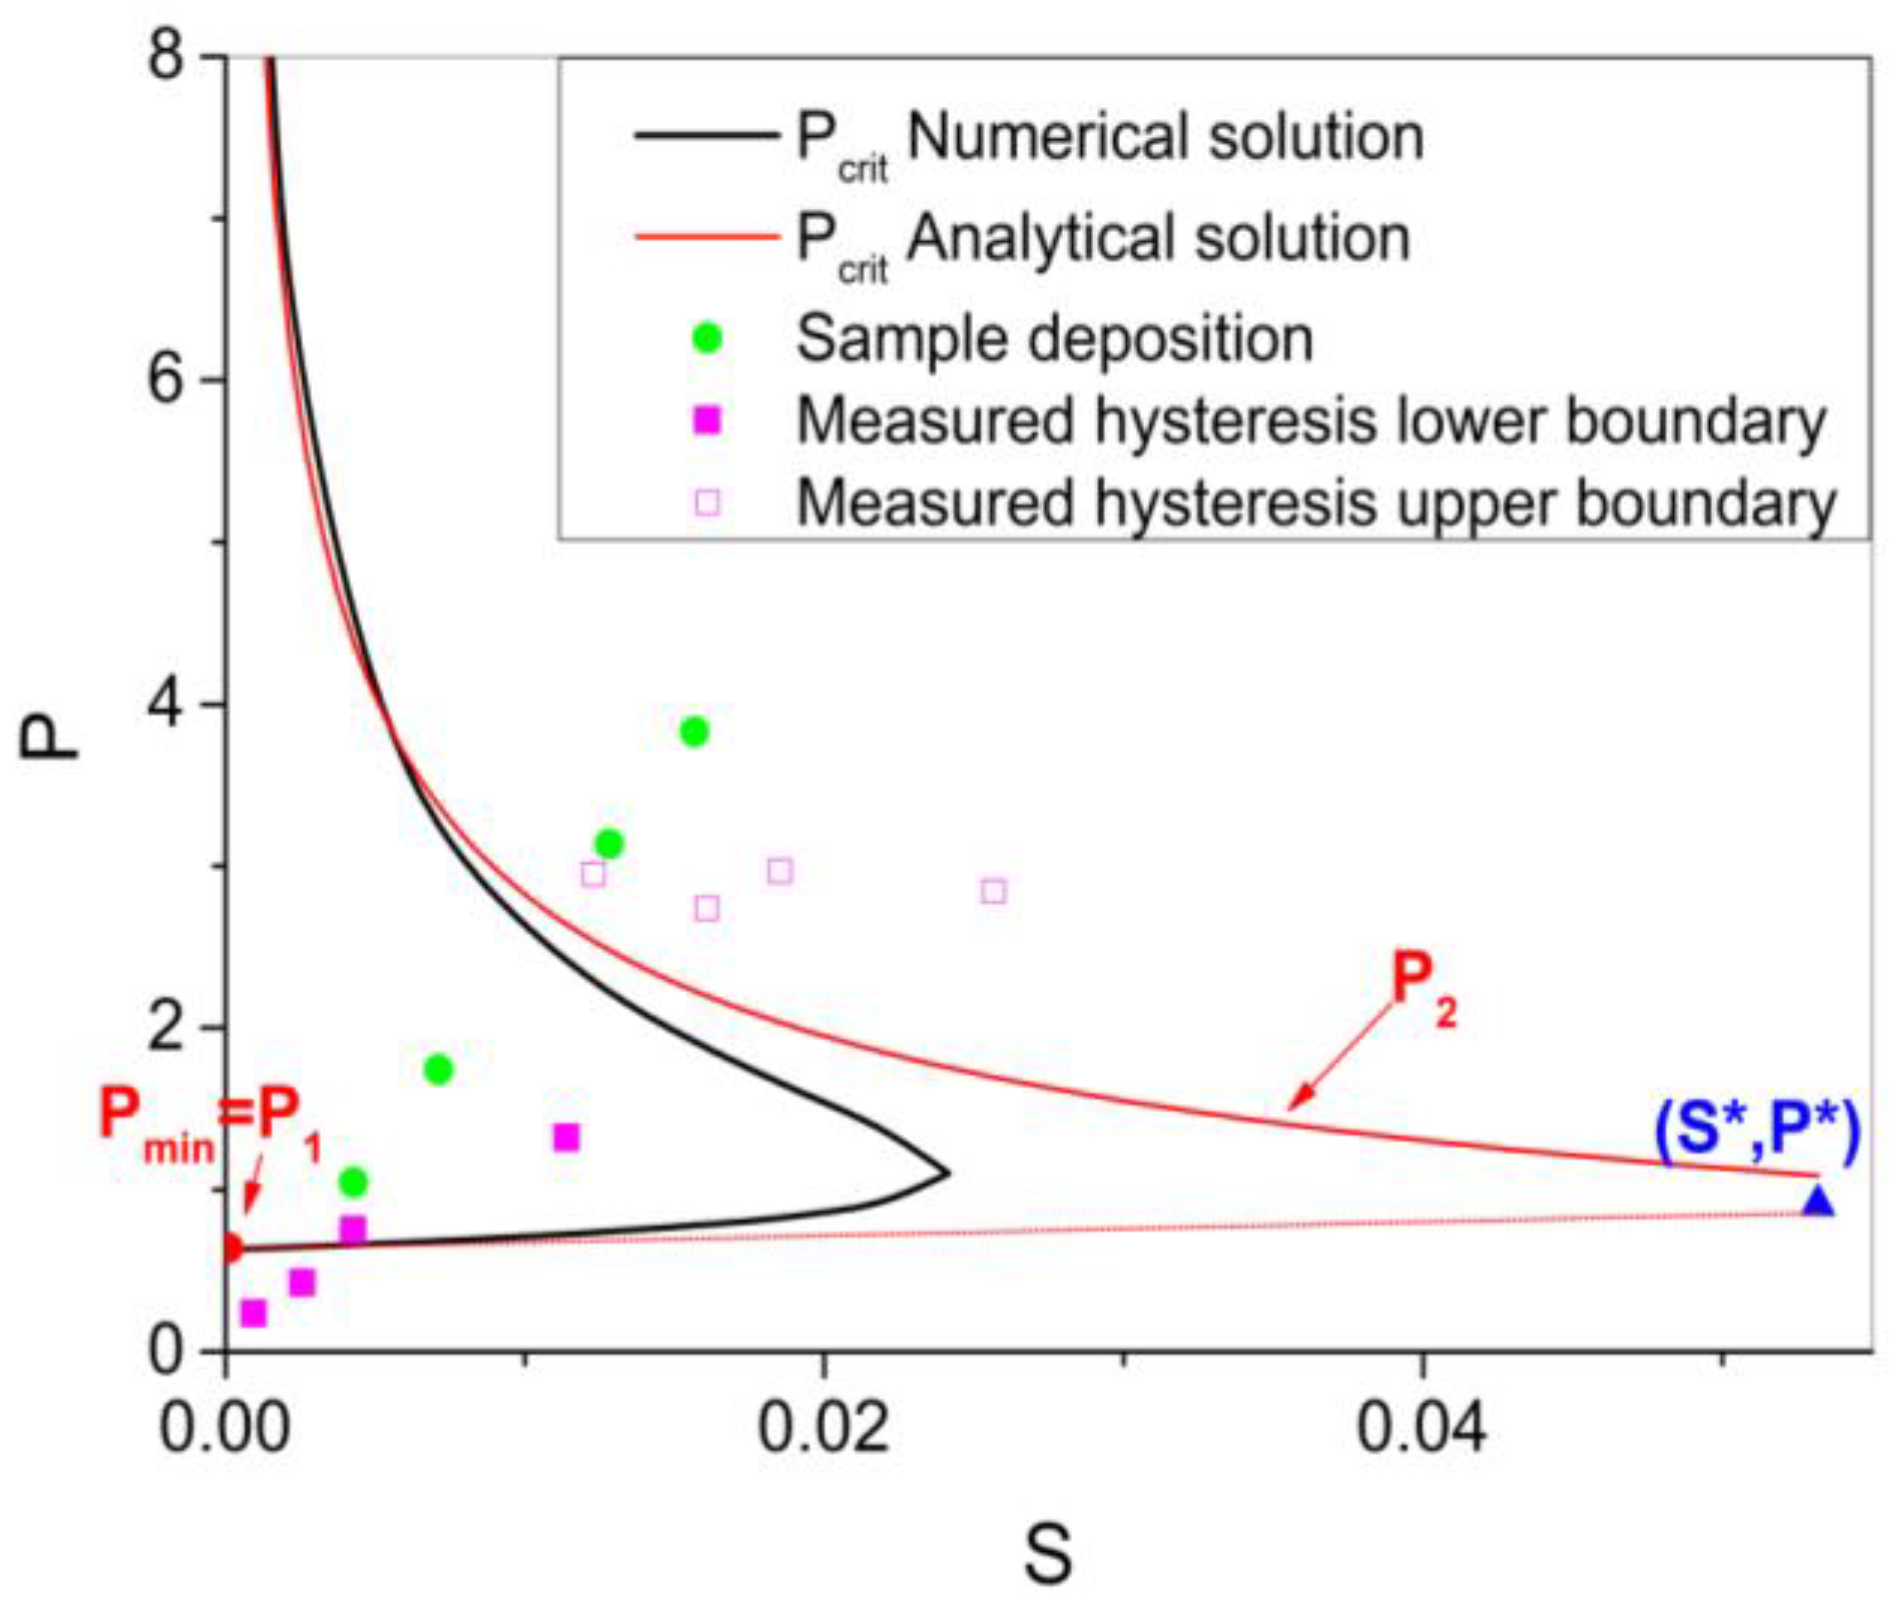
| Pmin | Lower estimate of the boundary of the hysteresis region |
| S* | Dimensionless pumping speed for which only one solution of Equation (18) exists |
| P* | Root of Equation (18) for S = S* (critical pressure) |
| P1 and P2 | Solutions of Equation (18) for S < S* (critical pressures) |
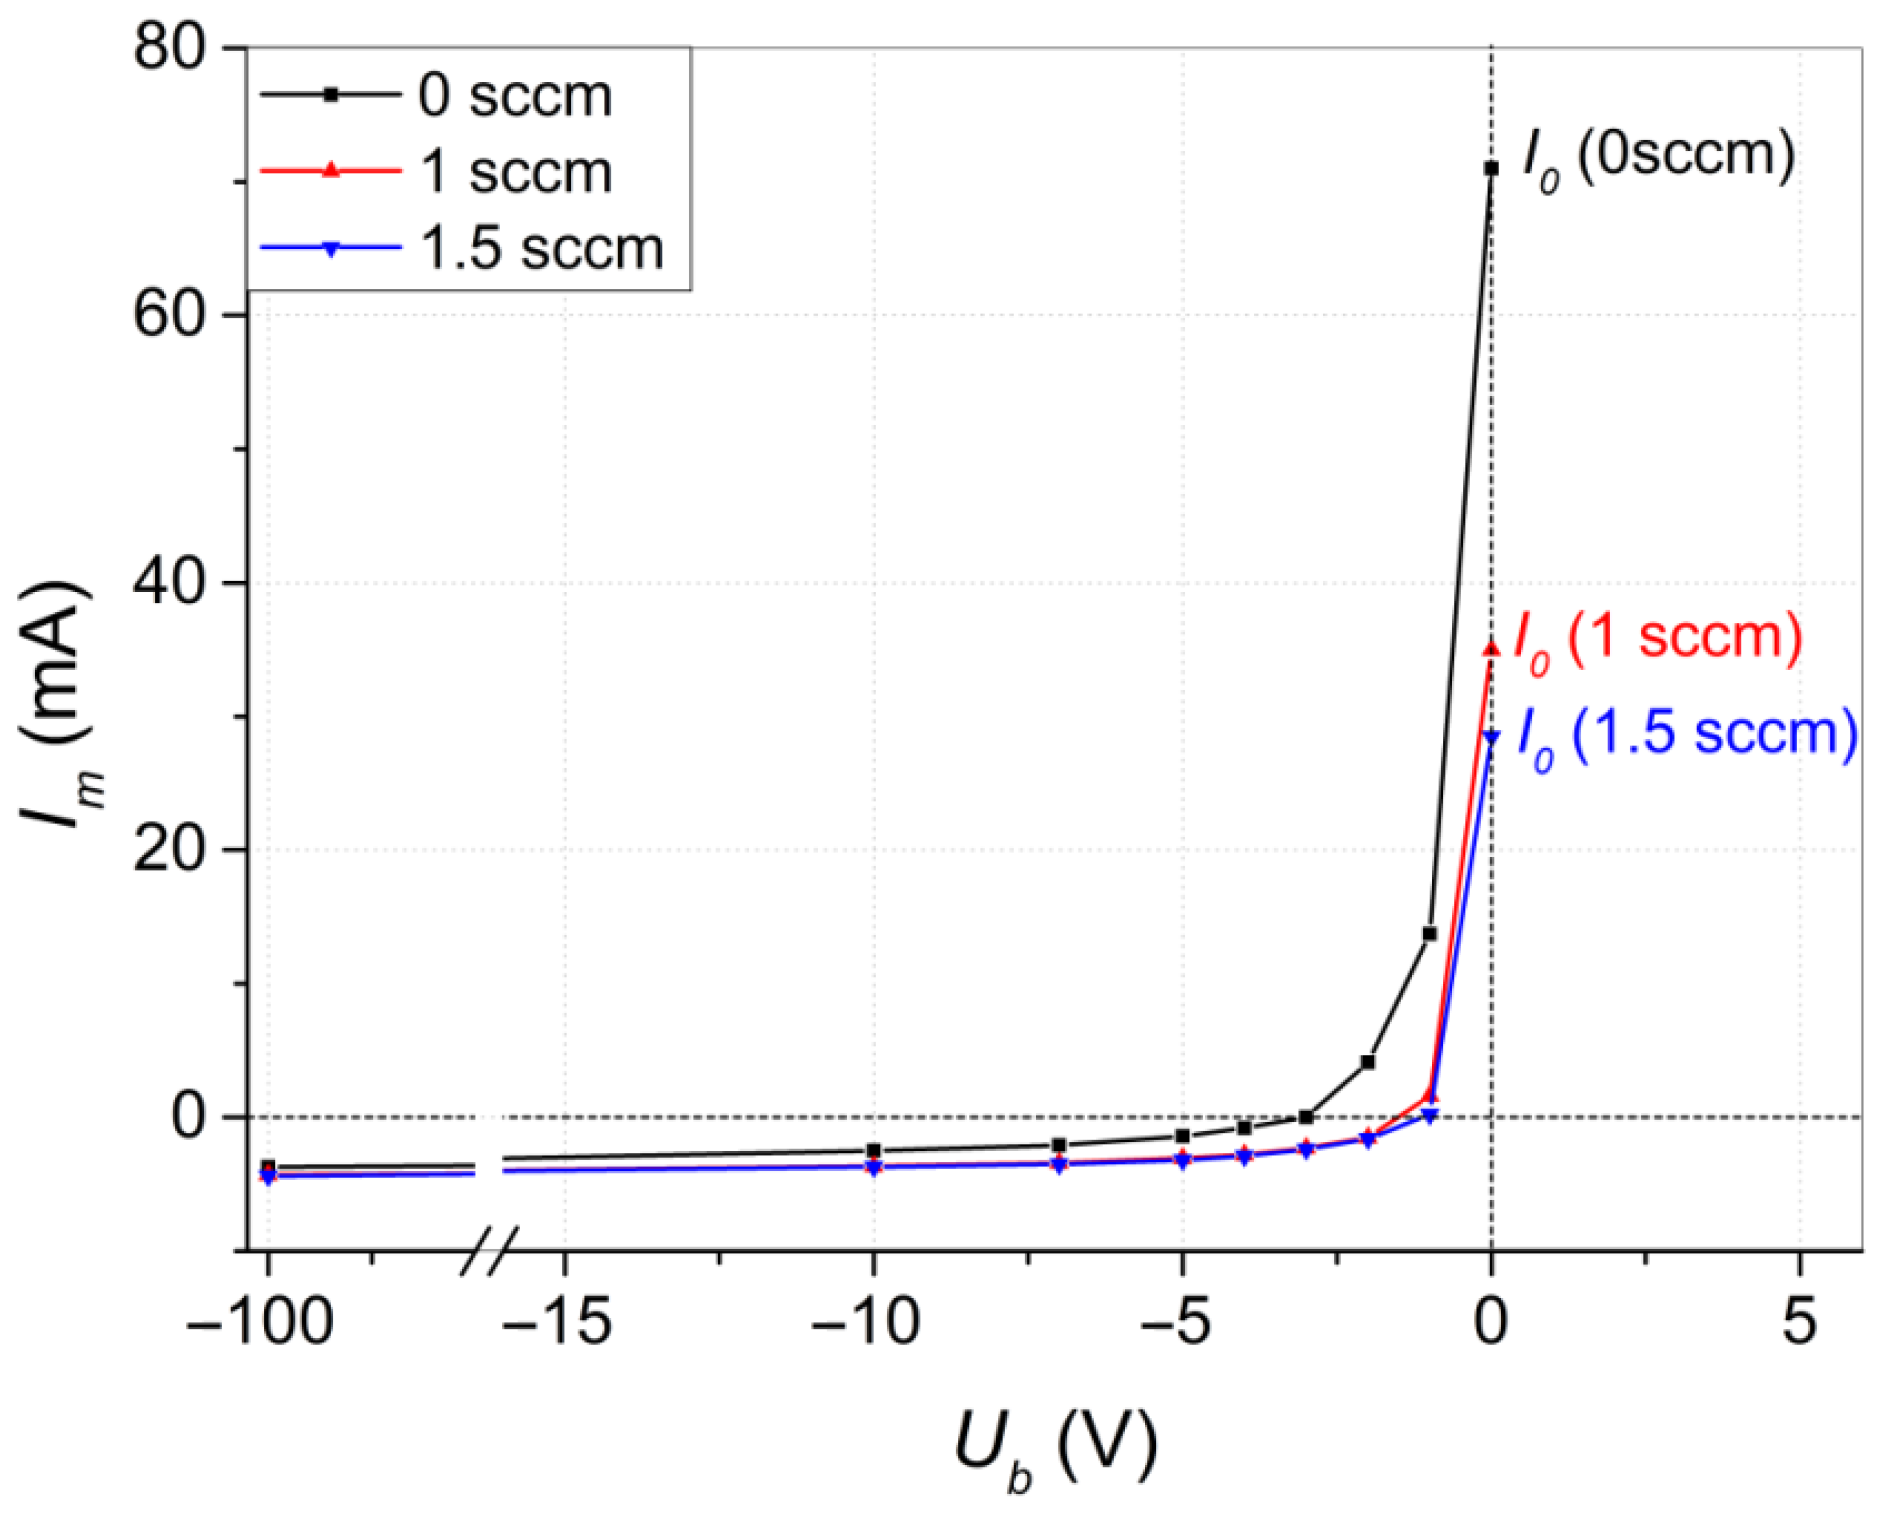
| Im | DC bias current |
| I0 | Bias current measured at the short circuit |
| Ub | Substrate bias voltage |
| I’ | Ion current at the substrate |
| J’ | Ion current density at the substrate |
| ∆V | Difference between the target voltages (∆V) when using an unbiased and a biased substrate |
References
- Kadlec, S.; Musil, J.; Vyskocil, H. Hysteresis Effect in Reactive Sputtering: A Problem of System Stability. J. Phys. D Appl. Phys. 1986, 19, L187. [Google Scholar] [CrossRef]
- Berg, S.; Nyberg, T. Fundamental Understanding and Modeling of Reactive Sputtering Processes. Thin Solid Film. 2005, 476, 215–230. [Google Scholar] [CrossRef]
- Strijckmans, K.; Schelfhout, R.; Depla, D. Tutorial: Hysteresis during the Reactive Magnetron Sputtering Process. J. Appl. Phys. 2018, 124, 241101. [Google Scholar] [CrossRef]
- Berg, S.; Särhammar, E.; Nyberg, T. Upgrading the “Berg-Model” for Reactive Sputtering Processes. Thin Solid Film. 2014, 565, 186–192. [Google Scholar] [CrossRef]
- Li, C.; Hsieh, J.-H. Stability Analysis of Reactive Sputtering Process with Variable Sticking Coefficients. Thin Solid Film. 2005, 475, 102–108. [Google Scholar] [CrossRef]
- Depla, D.; Heirwegh, S.; Mahieu, S.; De Gryse, R. Towards a More Complete Model for Reactive Magnetron Sputtering. J. Phys. D Appl. Phys. 2007, 40, 1957. [Google Scholar] [CrossRef]
- Strijckmans, K.; Leroy, W.P.; De Gryse, R.; Depla, D. Modeling Reactive Magnetron Sputtering: Fixing the Parameter Set. Surf. Coat. Technol. 2012, 206, 3666–3675. [Google Scholar] [CrossRef]
- Bartzsch, H.; Frach, P. Modeling the Stability of Reactive Sputtering Processes. Surf. Coat. Technol. 2001, 142–144, 192–200. [Google Scholar] [CrossRef]
- Särhammar, E.; Strijckmans, K.; Nyberg, T.; Van Steenberge, S.; Berg, S.; Depla, D. A Study of the Process Pressure Influence in Reactive Sputtering Aiming at Hysteresis Elimination. Surf. Coat. Technol. 2013, 232, 357–361. [Google Scholar] [CrossRef]
- Depla, D.; Mahieu, S.; De Gryse, R. Magnetron Sputter Deposition: Linking Discharge Voltage with Target Properties. Thin Solid Film. 2009, 517, 2825–2839. [Google Scholar] [CrossRef]
- Wang, Q.; Fang, L.; Liu, Q.; Chen, L.; Wang, Q.; Meng, X.; Xiao, H. Target Voltage Hysteresis Behavior and Control Point in the Preparation of Aluminum Oxide Thin Films by Medium Frequency Reactive Magnetron Sputtering. Coatings 2018, 8, 146. [Google Scholar] [CrossRef]
- Musil, J.; Baroch, P.; Vlček, J.; Nam, K.H.; Han, J.G. Reactive Magnetron Sputtering of Thin Films: Present Status and Trends. Thin Solid Film. 2005, 475, 208–218. [Google Scholar] [CrossRef]
- van Emmerik, C.I.; Hendriks, W.A.P.M.; Stok, M.M.; de Goede, M.; Chang, L.; Dijkstra, M.; Segerink, F.; Post, D.; Keim, E.G.; Dikkers, M.J.; et al. Relative Oxidation State of the Target as Guideline for Depositing Optical Quality RF Reactive Magnetron Sputtered Al2O3 Layers. Opt. Mater. Express OME 2020, 10, 1451–1462. [Google Scholar] [CrossRef]
- Stauder, B.; Perry, F.; Frantz, C. Chemical and Structural Analysis of Aluminium-Oxygen Coatings Obtained by d.c. Magnetron Reactive Sputtering: Some Features of the Process. Surf. Coat. Technol. 1995, 74–75, 320–325. [Google Scholar] [CrossRef]
- Koski, K.; Hölsä, J.; Juliet, P. Deposition of Aluminium Oxide Thin Films by Reactive Magnetron Sputtering. Surf. Coat. Technol. 1999, 116–119, 716–720. [Google Scholar] [CrossRef]
- Chiba, Y.; Abe, Y.; Kawamura, M.; Sasaki, K. Effects of Total Gas Flow Rate and Sputtering Power on the Critical Condition for Target Mode Transition in Al–O2 Reactive Sputtering. Vacuum 2009, 84, 629–632. [Google Scholar] [CrossRef]
- Rose, M.; Bartha, J.W.; Endler, I. Temperature Dependence of the Sticking Coefficient in Atomic Layer Deposition. Appl. Surf. Sci. 2010, 256, 3778–3782. [Google Scholar] [CrossRef]
- Asnin, L.D.; Chekryshkin, Y.S.; Fedorov, A.A. Calculation of the Sticking Coefficient in the Case of the Linear Adsorption Isotherm. Russ. Chem. Bull. 2003, 52, 2747–2749. [Google Scholar] [CrossRef]
- Choi, D. The Critical Role of Substrate Bias for the Sputter Deposition of Molybdenum Thin Films. Microelectron. Eng. 2019, 216, 111084. [Google Scholar] [CrossRef]
- Khánh, N.Q.; Radó, J.; Horváth, Z.E.; Soleimani, S.; Oyunbolor, B.; Volk, J. The Effect of Substrate Bias on the Piezoelectric Properties of Pulse DC Magnetron Sputtered AlN Thin Films. J. Mater. Sci. Mater. Electron. 2020, 31, 22833–22843. [Google Scholar] [CrossRef]
- Yang, Z.-H.; Wu, P.-C.; Chuang, T.-H. Effects of Substrate Bias on the Sputtering of High Density (111)-Nanotwinned Cu Films on SiC Chips. Sci. Rep. 2022, 12, 15408. [Google Scholar] [CrossRef] [PubMed]
- Sobolewski, M.A. Measuring the Ion Current in Electrical Discharges Using Radio-Frequency Current and Voltage Measurements. Appl. Phys. Lett. 1998, 72, 1146–1148. [Google Scholar] [CrossRef]
- Sobolewski, M.A. Sheath Model for Radio-Frequency-Biased, High-Density Plasmas Valid for All ω/ωi. Phys. Rev. E 2000, 62, 8540–8553. [Google Scholar] [CrossRef] [PubMed]
- Sezemsky, P.; Stranak, V.; Kratochvil, J.; Cada, M.; Hippler, R.; Hrabovsky, M.; Hubicka, Z. Modified High Frequency Probe Approach for Diagnostics of Highly Reactive Plasma. Plasma Sources Sci. Technol. 2019, 28, 115009. [Google Scholar] [CrossRef]
- Leroy, W.P.; Mahieu, S.; Persoons, R.; Depla, D. Quantification of the Incorporation Coefficient of a Reactive Gas on a Metallic Film during Magnetron Sputtering: The Method and Results. Thin Solid Film. 2009, 518, 1527–1531. [Google Scholar] [CrossRef]

| Qin (sccm) | O/Al at. Conc. Ratio |
|---|---|
| 0.5 | 24/76 |
| 0.75 | 42/58 |
| 1.5 | 57/43 |
| 2 | 57/43 |
Disclaimer/Publisher’s Note: The statements, opinions and data contained in all publications are solely those of the individual author(s) and contributor(s) and not of MDPI and/or the editor(s). MDPI and/or the editor(s) disclaim responsibility for any injury to people or property resulting from any ideas, methods, instructions or products referred to in the content. |
© 2025 by the authors. Licensee MDPI, Basel, Switzerland. This article is an open access article distributed under the terms and conditions of the Creative Commons Attribution (CC BY) license (https://creativecommons.org/licenses/by/4.0/).
Share and Cite
Gajdics, M.; Hegedűs, N.; Olasz, D.; Serényi, M. Assistance to Determine the Stability State of a Reactive Sputtering Process Based on the Analytical Solution of the Classical Berg Model. Coatings 2025, 15, 499. https://doi.org/10.3390/coatings15050499
Gajdics M, Hegedűs N, Olasz D, Serényi M. Assistance to Determine the Stability State of a Reactive Sputtering Process Based on the Analytical Solution of the Classical Berg Model. Coatings. 2025; 15(5):499. https://doi.org/10.3390/coatings15050499
Chicago/Turabian StyleGajdics, Marcell, Nikolett Hegedűs, Dániel Olasz, and Miklós Serényi. 2025. "Assistance to Determine the Stability State of a Reactive Sputtering Process Based on the Analytical Solution of the Classical Berg Model" Coatings 15, no. 5: 499. https://doi.org/10.3390/coatings15050499
APA StyleGajdics, M., Hegedűs, N., Olasz, D., & Serényi, M. (2025). Assistance to Determine the Stability State of a Reactive Sputtering Process Based on the Analytical Solution of the Classical Berg Model. Coatings, 15(5), 499. https://doi.org/10.3390/coatings15050499