Abstract
Industrial hemp (Cannabis sativa L.) was investigated as a sustainable biosorbent for removing Congo Red (CR) and Remazol Brilliant Blue R (RBBR) from wastewater. The unmodified hemp biosorbent exhibited moderate but practically relevant sorption capacities (4.47 mg/g for CR; 2.44 mg/g for RBBR), outperforming several agricultural waste materials. Kinetic studies revealed rapid uptake, with CR following pseudo-first-order kinetics (t1/2 < 15 min) and RBBR fitting the Elovich model, indicating heterogeneous surface interactions. Equilibrium data showed CR adsorption was best described by the Temkin isotherm (R2 = 0.983), while RBBR followed the Langmuir model (R2 = 0.998), reflecting their distinct binding mechanisms. Thermodynamic analysis confirmed spontaneous (ΔG° < 0), exothermic (ΔH° ≈ −2 kJ/mol), and entropy-driven processes for both dyes. Molecular docking elucidated the structural basis for performance differences: CR’s stronger binding (−7.5 kcal/mol) involved weak noncovalent interaction arising from partial overlap between the π-electron cloud of an aromatic ring and σ-bonds C-C or C-H (π-σ stacking) and hydrogen bonds with cellulose, whereas RBBR’s weaker affinity (−5.4 kcal/mol) relied on weak intermolecular interaction between a hydrogen atom (from a C-H bond) and the π-electron system of an aromatic ring (C-H∙∙∙π interactions). This work establishes industrial hemp as an eco-friendly alternative for dye removal, combining renewable sourcing with multi-mechanism adsorption capabilities suitable for small-scale water treatment applications.
1. Introduction
The textile industry extensively employs toxic chemicals in fabric preparation, dyeing, and finishing processes—particularly industrial dyes prized for their intense coloration and durability [1]. Globally, approximately 7 × 10⁵ tons of synthetic dyes are produced annually, with over 10,000 tons used in the textile industry alone [2]. Due to their toxicity and resistance to degradation, synthetic dyes pose significant environmental challenges, impairing the esthetic quality of aquatic ecosystems, reducing light penetration, inhibiting photosynthesis in algae and plants, and entering the food chain, potentially causing toxicity, mutagenicity, and carcinogenicity [3]. Azo dyes, which account for over 60% of textile dyes, are particularly problematic as they can degrade into toxic intermediates, such as aromatic amines, posing risks to aquatic organisms and humans [4]. Congo Red (CR) is an azo dye that is widely used for dyeing cotton and other cellulose fibers, while Remazol Brilliant Blue R (RBBR), an anthraquinone dye, provides intense blue shades. Both dyes form covalent bonds with fibers, making them highly durable but resistant to natural degradation. The presence of CR and RBBR in wastewater represents a serious ecological and health concern due to their persistence, toxicity, and negative impact on aquatic ecosystems. Various methods are employed to remove dyes from wastewater, including physical (adsorption, filtration, coagulation) [5,6], chemical (advanced oxidation, electrochemical depollution) [7,8,9,10] and biological methods (microbial degradation, phytoremediation) [2,11,12]. Activated carbon adsorption and advanced oxidation are frequently used due to their high efficiency, while biological methods offer an eco-friendly approach [13]. Biosorbents—natural materials derived from plant, animal, or microbial sources—provide an eco-friendly and cost-effective alternative for removing pollutants (e.g., heavy metals, dyes, organic compounds) from wastewater [6,14,15]. Their advantages include low cost, green technology, broad applicability, and regeneration potential [6,16]. Biological sorbents, such as lignocellulosic waste, algae, or microorganisms, have shown high potential for dye removal [17,18]. Different preparation methods include pyrolysis [19] and drying with grinding (pulverization) [20]. This approach not only offers a sustainable waste management solution but also reduces treatment costs by utilizing waste biomass as a cheap and efficient sorption material [21]. Industrial hemp (Cannabis sativa L.) is a versatile plant used in various industrial and environmental applications. Unlike marijuana varieties, it contains very low levels of tetrahydrocannabinol (THC) (<0.3%). Its fibers are ideal for textiles, paper, construction materials, and biocomposites; its seeds (rich in proteins and essential fatty acids) are used in food and oil production; and cannabidiol (CBD) extracted from flowers has medicinal applications. The woody parts of the stalk are used for biofuels, construction materials, and other eco-friendly products, making hemp a key resource for sustainable development. However, hemp cultivation generates biological waste (e.g., stalks and leaves), which can be repurposed as an effective and eco-friendly biosorbent due to its cellulose-, lignin-, and hemicellulose-rich structure. Several studies confirm its high affinity for various ionic species, including copper (Cu) [22], zinc (Zn) [23], and industrial dyes [24]. In this study, the potential of hemp-derived biosorbent for removing CR and RBBR from aqueous solutions was investigated through experimental and theoretical modeling. Cellulose fibers and lignin components exhibit a high affinity for organic molecules (e.g., dyes) due to functional groups (–OH, –C=O) which can form hydrogen bonds or other interactions with contaminants.
2. Materials and Methods
2.1. Biosorbent Preparation
Industrial hemp was cultivated near Banja Luka, Bosnia and Herzegovina. The stalks were air-dried for four weeks, then milled and thoroughly washed with a natural soap solution (sodium salts of fatty acids) and sodium carbonate as a cleaning aid. The washing procedure involved soaking 10 g of hemp material in a solution of 25 g natural soap and 5 g Na2CO3 at 80 °C for 4 h, repeated rinsing with distilled water (10 × 100 mL) until neutral pH, and final drying at 309 K.
2.2. Biosorbent Characterization
The biosorbent was comprehensively characterized using multiple analytical techniques. Elemental composition (CHNS/O) was determined using an Elementar Vario EL III analyzer. Surface morphology was examined by scanning electron microscopy (SEM; JEOL JSM-IT200) with images captured at progressive magnifications (200×, 750×, 1000×, and 2000×). Chemical functional groups were identified via Fourier-transform infrared spectroscopy (FTIR; Thermo Scientific Nicolet SUMMIT, Thermo Fisher Scientific, Madison, WI, USA) employing transmission mode (4000–400 cm−1 spectral range).
2.3. Sorption Experiments
Batch tests were performed in aqueous solutions of CR and RBBR (50–750 mg/L) at an unadjusted pH of 5 under static conditions with magnetic stirring (300 rpm). All experiments were conducted in triplicate, and the results were statistically processed, with the standard error of the mean (SEM) calculated using Microsoft Excel. Figure 1 presents photographic documentation of the experiment, showing the initial dye solutions at varying concentrations in Erlenmeyer flasks (left) alongside the hemp biosorbent following sorption (right). A pronounced color transition is evident, with the biosorbent changing from its original light brown coloration to deep red (CR) or blue (RBBR), visually demonstrating successful dye uptake.
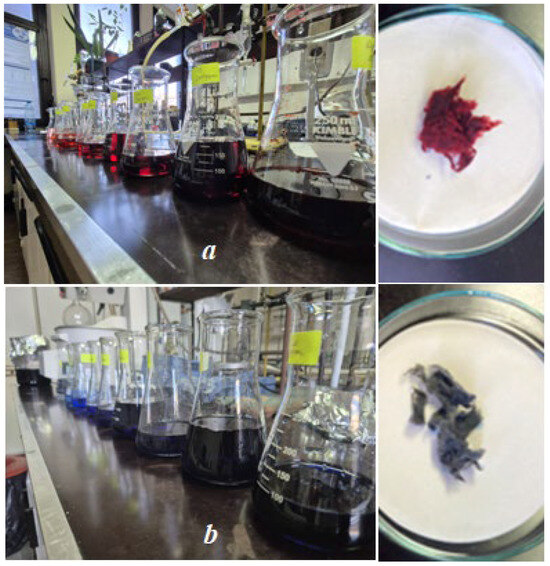
Figure 1.
Visual documentation of dye sorption: (a) Congo Red (CR) and (b) Remazol Brilliant Blue R (RBBR) solutions at initial concentrations (50–750 mg/L) before treatment (left) and hemp biosorbent after dye uptake showing concentration-dependent color changes (right).
Kinetic tests were performed using 0.25 g of sorbent in 50 mL of dye solution (100 mg/L concentration) at pH 5 and 298 K, with sampling at different time intervals: 2, 5, 15, 30, 90, and 180 min.
Isothermal tests were conducted over 60 min using 0.1 g of sorbent in 20 mL of dye solutions at varying concentrations (50–750 mg/L), at pH 5 and 298 K.
Thermodynamic tests were performed over 60 min using 0.1 g of sorbent in 20 mL of dye solution at pH 5 under controlled temperature conditions (298 K, 308 K, and 318 K), with a standardized initial concentration (C0 = 100 mg/L). This experimental setup followed established practices in adsorption thermodynamics [25,26,27], with the assumption that thermodynamic parameters were concentration-independent within the tested range.
Changes in dye concentration before and after sorption were monitored using colorimetric analysis. The absorbance of the samples was measured using a Thermo Scientific Multiskan SkyHigh (Thermo Fisher Scientific, Singapore) microplate spectrophotometer. Calibration curves were constructed using 10 standard dye solutions (25–1000 ppm) for both CR and RBBR. Full-spectrum scans (200–800 nm) were performed to confirm the characteristic absorption peaks, with targeted measurements taken at λₘₐₓ = 530 ± 2 nm (CR) and λₘₐₓ = 231 ± 2 nm (RBBR). All measurements were conducted in triplicate at each time point. The absorbance data were processed in Microsoft Excel, and the slope of the linear regression (R2 > 0.998 for both dyes) was used to quantify unknown sample concentrations.
The sorption capacity (Qₑ, mg/g), representing the quantitative dye uptake efficiency, was calculated using the mass balance equation:
where:
- Ci— initial concentration (mg/L)
- C—residual dye concentration in solution (mg/L)
- V—solution volume (L)
- m—biosorbent mass (g)
2.4. Theoretical Analysis of Sorption
The sorption mechanism was thoroughly investigated using kinetic, equilibrium, and thermodynamic analyses, complemented by molecular modeling studies [28,29]. Kinetic data were assessed with four models: the Pseudo-First Order (PFO, Equation (2)), Pseudo-Second Order (PSO, Equation (3)), Elovich (Equation (4)), and Intraparticle Diffusion (IPD, Equation (5)) models:
where Qe (mg/g) and Qt (mg/g) are the amounts of sorbed ions at equilibrium and at time t,
where ae is initial sorption rate (mg·g−1·min−1 ili mmol·g−1·min−1), be is a parameter related to surface coverage, influenced by the activation energy of chemisorption (g·mg−1 or g·mmol−1),
where Qe (mg/g) and Qt (mg/g) are the amounts of sorbed ions at equilibrium and at time t, respectively, αe = Qt/Qe is fractional attainment of equilibrium, Kp is the film diffusion rate constant, DF is the parameter of the linear driving force, kid is the intraparticle diffusion coefficient (µmol g−1 min−0.5), t is the time, and Cid is a constant, related to the thickness of the boundary layer.
Adsorption isotherms are mathematical models that describe the distribution of adsorbate molecules between liquid and solid phases at equilibrium. The Langmuir isotherm model assumes monolayer adsorption on a homogeneous surface with no interaction between adsorbed molecules. The Freundlich isotherm describes adsorption on heterogeneous surfaces with a non-uniform distribution of adsorption heat and is applicable to multilayer adsorption processes. The Temkin isotherm model takes into account the effects of indirect adsorbate-adsorbate interactions on the adsorption process and assumes that the heat of adsorption decreases linearly with coverage due to these interactions. These isotherm models are essential tools for analyzing equilibrium adsorption data, providing insights into adsorption mechanisms, surface properties of adsorbents, and the affinity between adsorbates and adsorbents.
For equilibrium data analysis, the Langmuir (Equation (6)) [30], Freundlich (Equation (7)) [31] and Temkin (Equation (8)) [32] isotherm models were used:
where Qmax (mg/g) is the maximum adsorption capacity in the Langmuir model, KL (L/mg) is the Langmuir equilibrium constant, KF (Ln mg1−n/g) and n are the Freundlich constant and isotherm exponent, respectively, KT (L/mg) is the Temkin equilibrium binding constant, bT (mg/L) is the Temkin isotherm constant related to adsorption heat, R is the gas constant (8.314 J/mol K) and T is the absolute temperature (K). The efficiency of the adsorption process can be evaluated using the dimensionless Langmuir equilibrium parameter RL (Equation (9)):
Thermodynamic parameters provide crucial insights into the nature, feasibility, and spontaneity of adsorption processes. The Gibbs free energy change (ΔG) indicates the spontaneity of the adsorption process, with negative values confirming spontaneous adsorption. It is calculated using the Equation (10)
where K is the thermodynamic equilibrium constant.
The enthalpy change (ΔH) reveals whether the adsorption process is exothermic (negative ΔH) or endothermic (positive ΔH). The magnitude of ΔH also provides information about the adsorption mechanism: values below 60 kJ/mol typically indicate physisorption, while values above 200 kJ/mol suggest chemisorption. The entropy change (ΔS) reflects the degree of randomness at the solid–liquid interface during adsorption, with positive values indicating increased randomness and affinity of the adsorbent for the adsorbate. Thermodynamic parameters (ΔH, ΔS) are typically calculated using the Van ’t Hoff equation, derived from the slope and intercept of a linear Van ’t Hoff plot (lnK vs. 1/T) (Equation (11))
where K = Langmuir constant (L/mol), R = gas constant (8.314 J/mol·K), and T = temperature (K). In this study, thermodynamic parameters including enthalpy change (ΔH), entropy change (ΔS), and Gibbs free energy (ΔG) were determined through Van ’t Hoff analysis across the temperature range of 298–328 K.
The fundamental binding interactions governing sorption were investigated at the molecular level through computational approaches. The molecular structures of CR and RBBR were retrieved from the PubChem database [33] and energy-minimized using YASARA Structure software (version 20.12.24) [34] to obtain stable, low-energy conformations suitable for docking. The expanded α-cellulose structure was downloaded from PolySac3DB [35] and similarly subjected to energy minimization in YASARA to achieve a stable conformation for docking simulations. Molecular docking was performed in YASARA Structure using the AutoDock Vina algorithm in default mode [36], applying standard parameters as implemented in the software. The docking site was defined as a region extending 5 Å around the cellulose structure to allow flexible binding exploration. Each dye was docked individually to the cellulose target, with multiple docking runs conducted to ensure reproducibility and to identify the most favorable binding poses. The resulting docked complexes were analyzed using Discovery Studio Visualizer to examine the interactions between the dyes and the cellulose structure. Binding affinities and docking scores generated by YASARA were evaluated to determine the most stable complexes and to compare the binding strength of each compound.
3. Results and Discussion
3.1. Elemental Analysis
Industrial hemp comprises 55%–76% cellulose, 8%–19% hemicellulose, and 2%–6% lignin [37]. Elemental analysis of the plant material sample indicated a predominance of oxygen (52.03%), followed by carbon (41.018%), hydrogen (6.05%), trace nitrogen (0.474%), and sulfur (0.428%). These results are consistent with the typical composition of natural lignin-cellulose-hemicellulose polymers in plant biomass. The low nitrogen content suggests only minimal protein residues, likely derived from residual plant cells or enzymatic activity, while the trace sulfur may originate from sulfur-containing amino acids (e.g., methionine, cysteine) or inorganic sulfates.
3.2. SEM Analysis
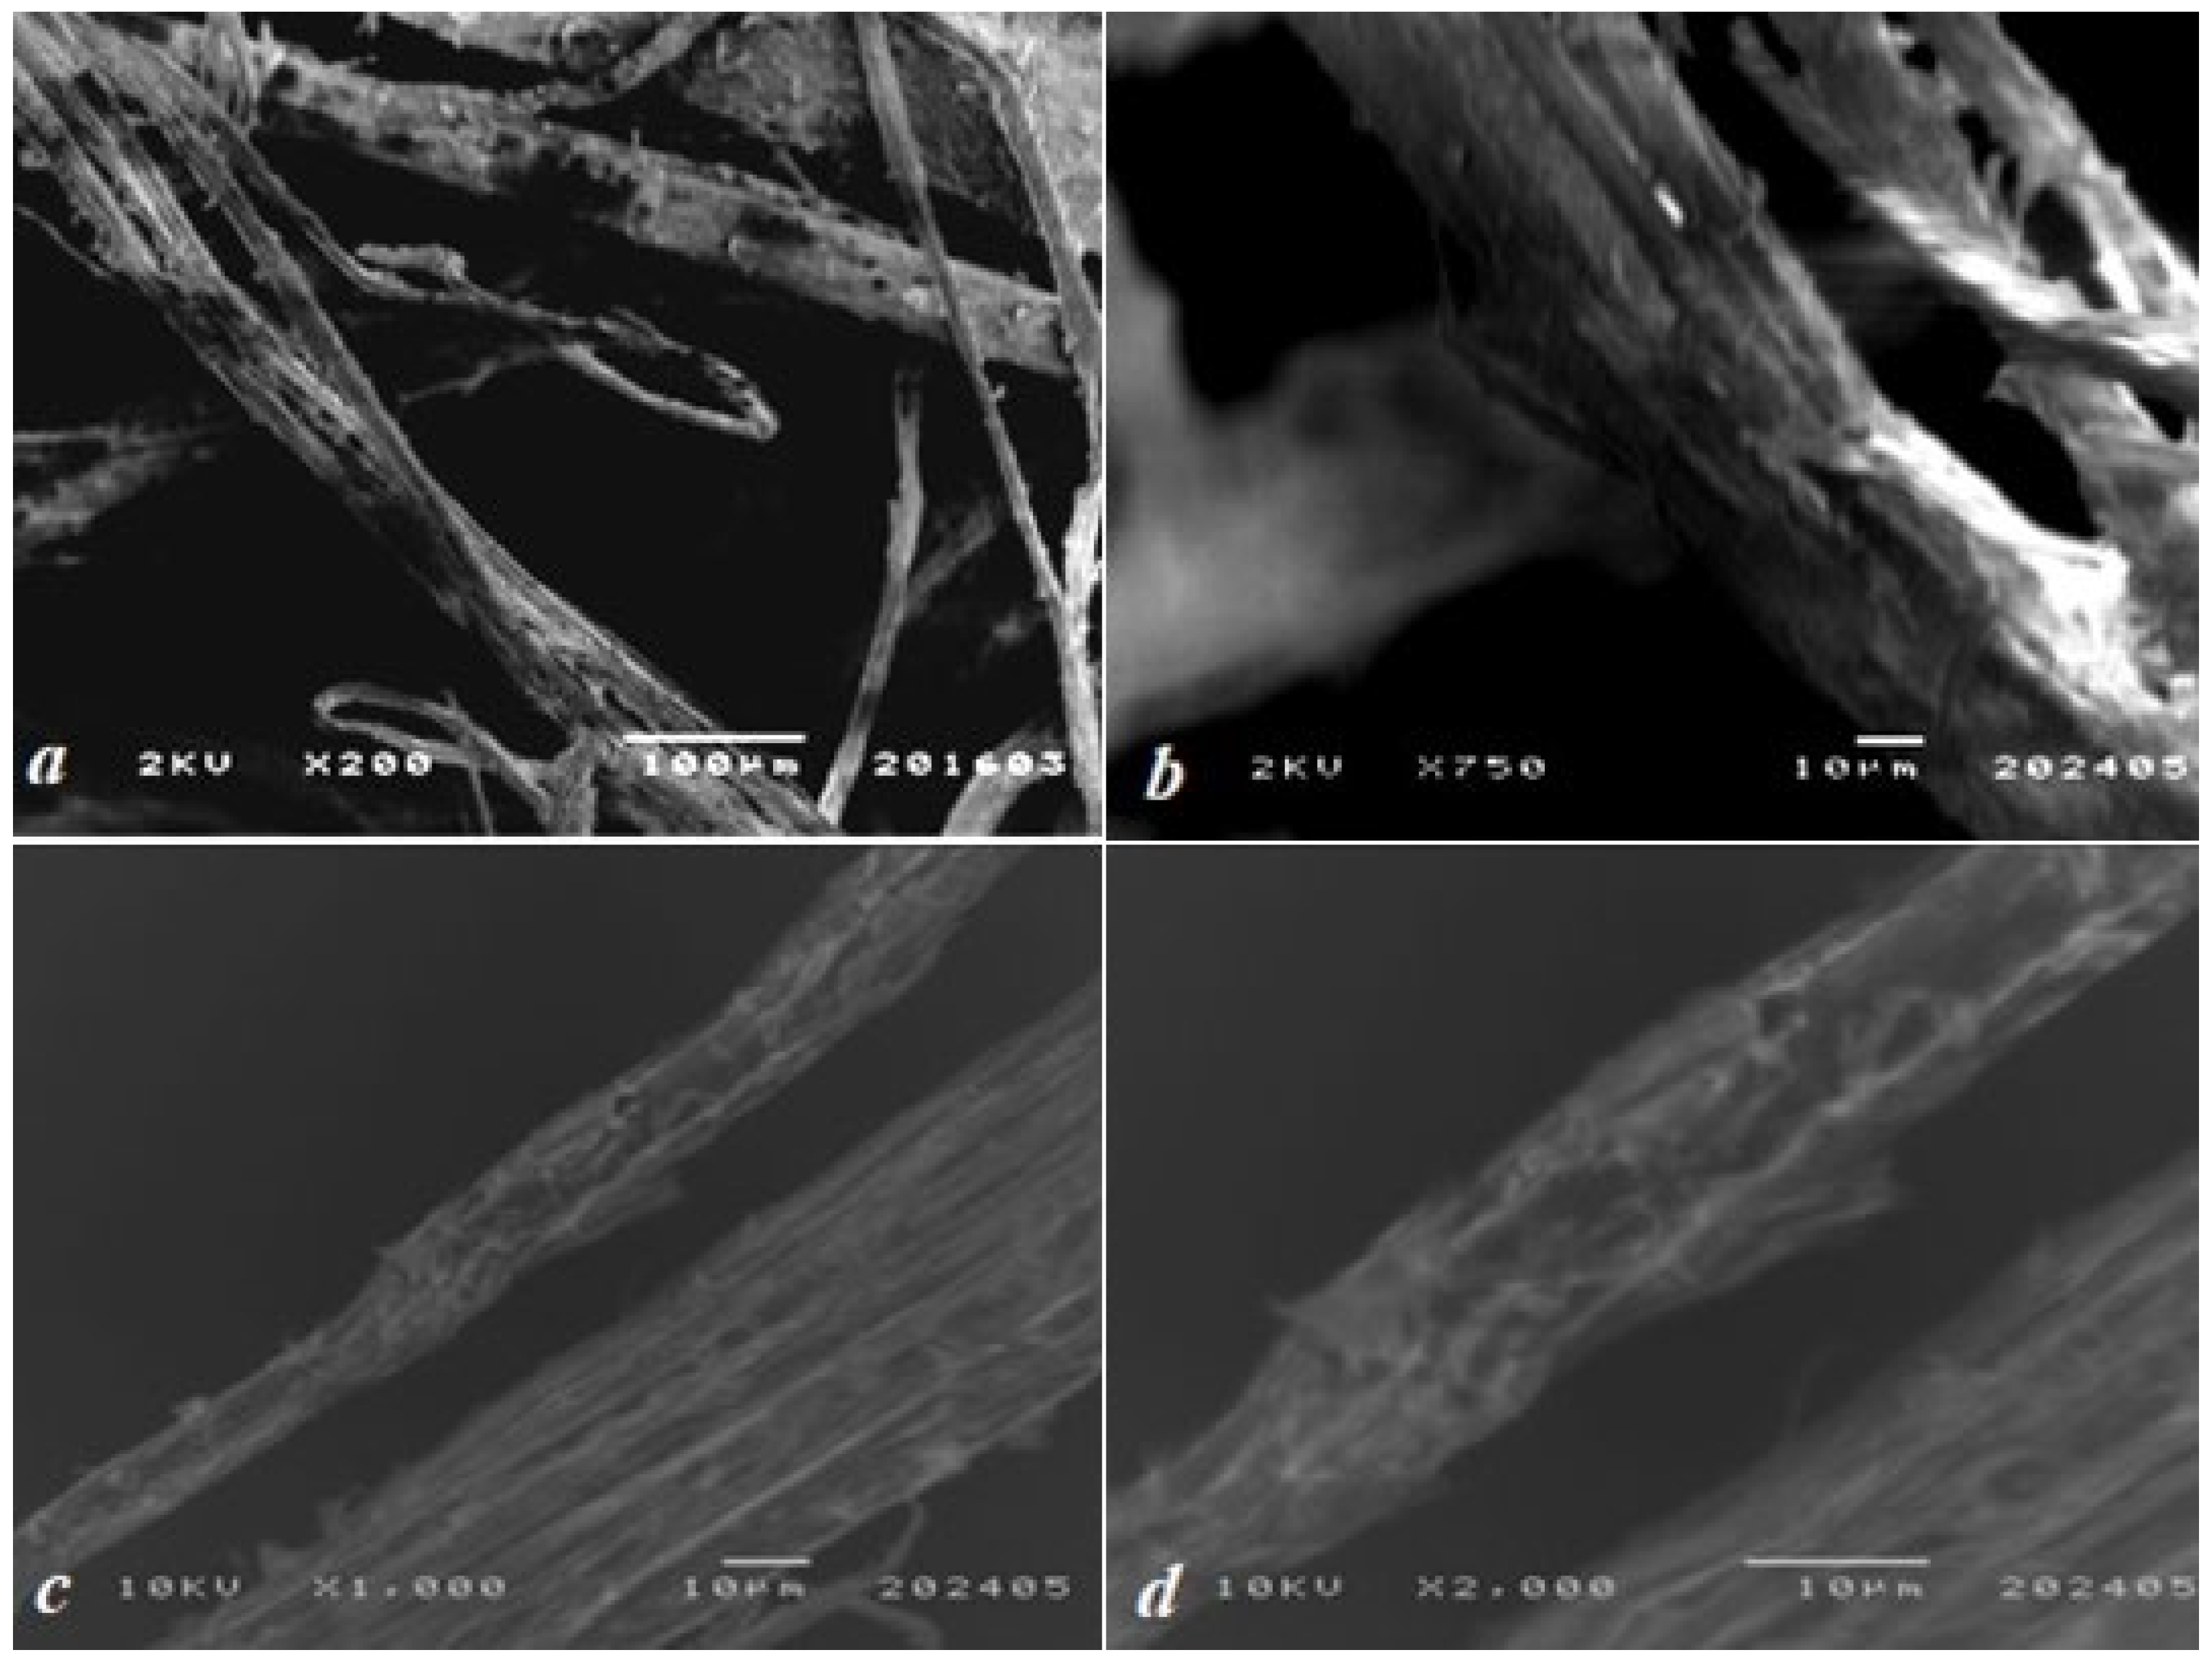
Scanning electron microscopy (SEM) images (Figure 2) revealed a fibrillar morphology characteristic of cellulose-rich natural materials. The fibers were randomly oriented, with diameters averaging ~100 μm, reflecting the coarse structure typical of unprocessed plant biomass. The interwoven fiber network formed a porous architecture with abundant voids, a critical feature for sorption applications as it maximizes specific surface area. Surface roughness observed at higher magnifications (200× to 2000×) further enhances the material’s active surface area. Hemp lignin exhibited a heterogeneous, rough-porous morphology with pore diameters ranging from 0.1 to 5 μm and anisotropic fiber entanglement, confirming the presence of cellulose-lignin complexes.

Figure 2.
SEM micrographs of the biosorbent’s surface at magnifications of (a) 200×, (b) 750×, (c) 1000×, and (d) 2000×.
3.3. FTIR Analysis
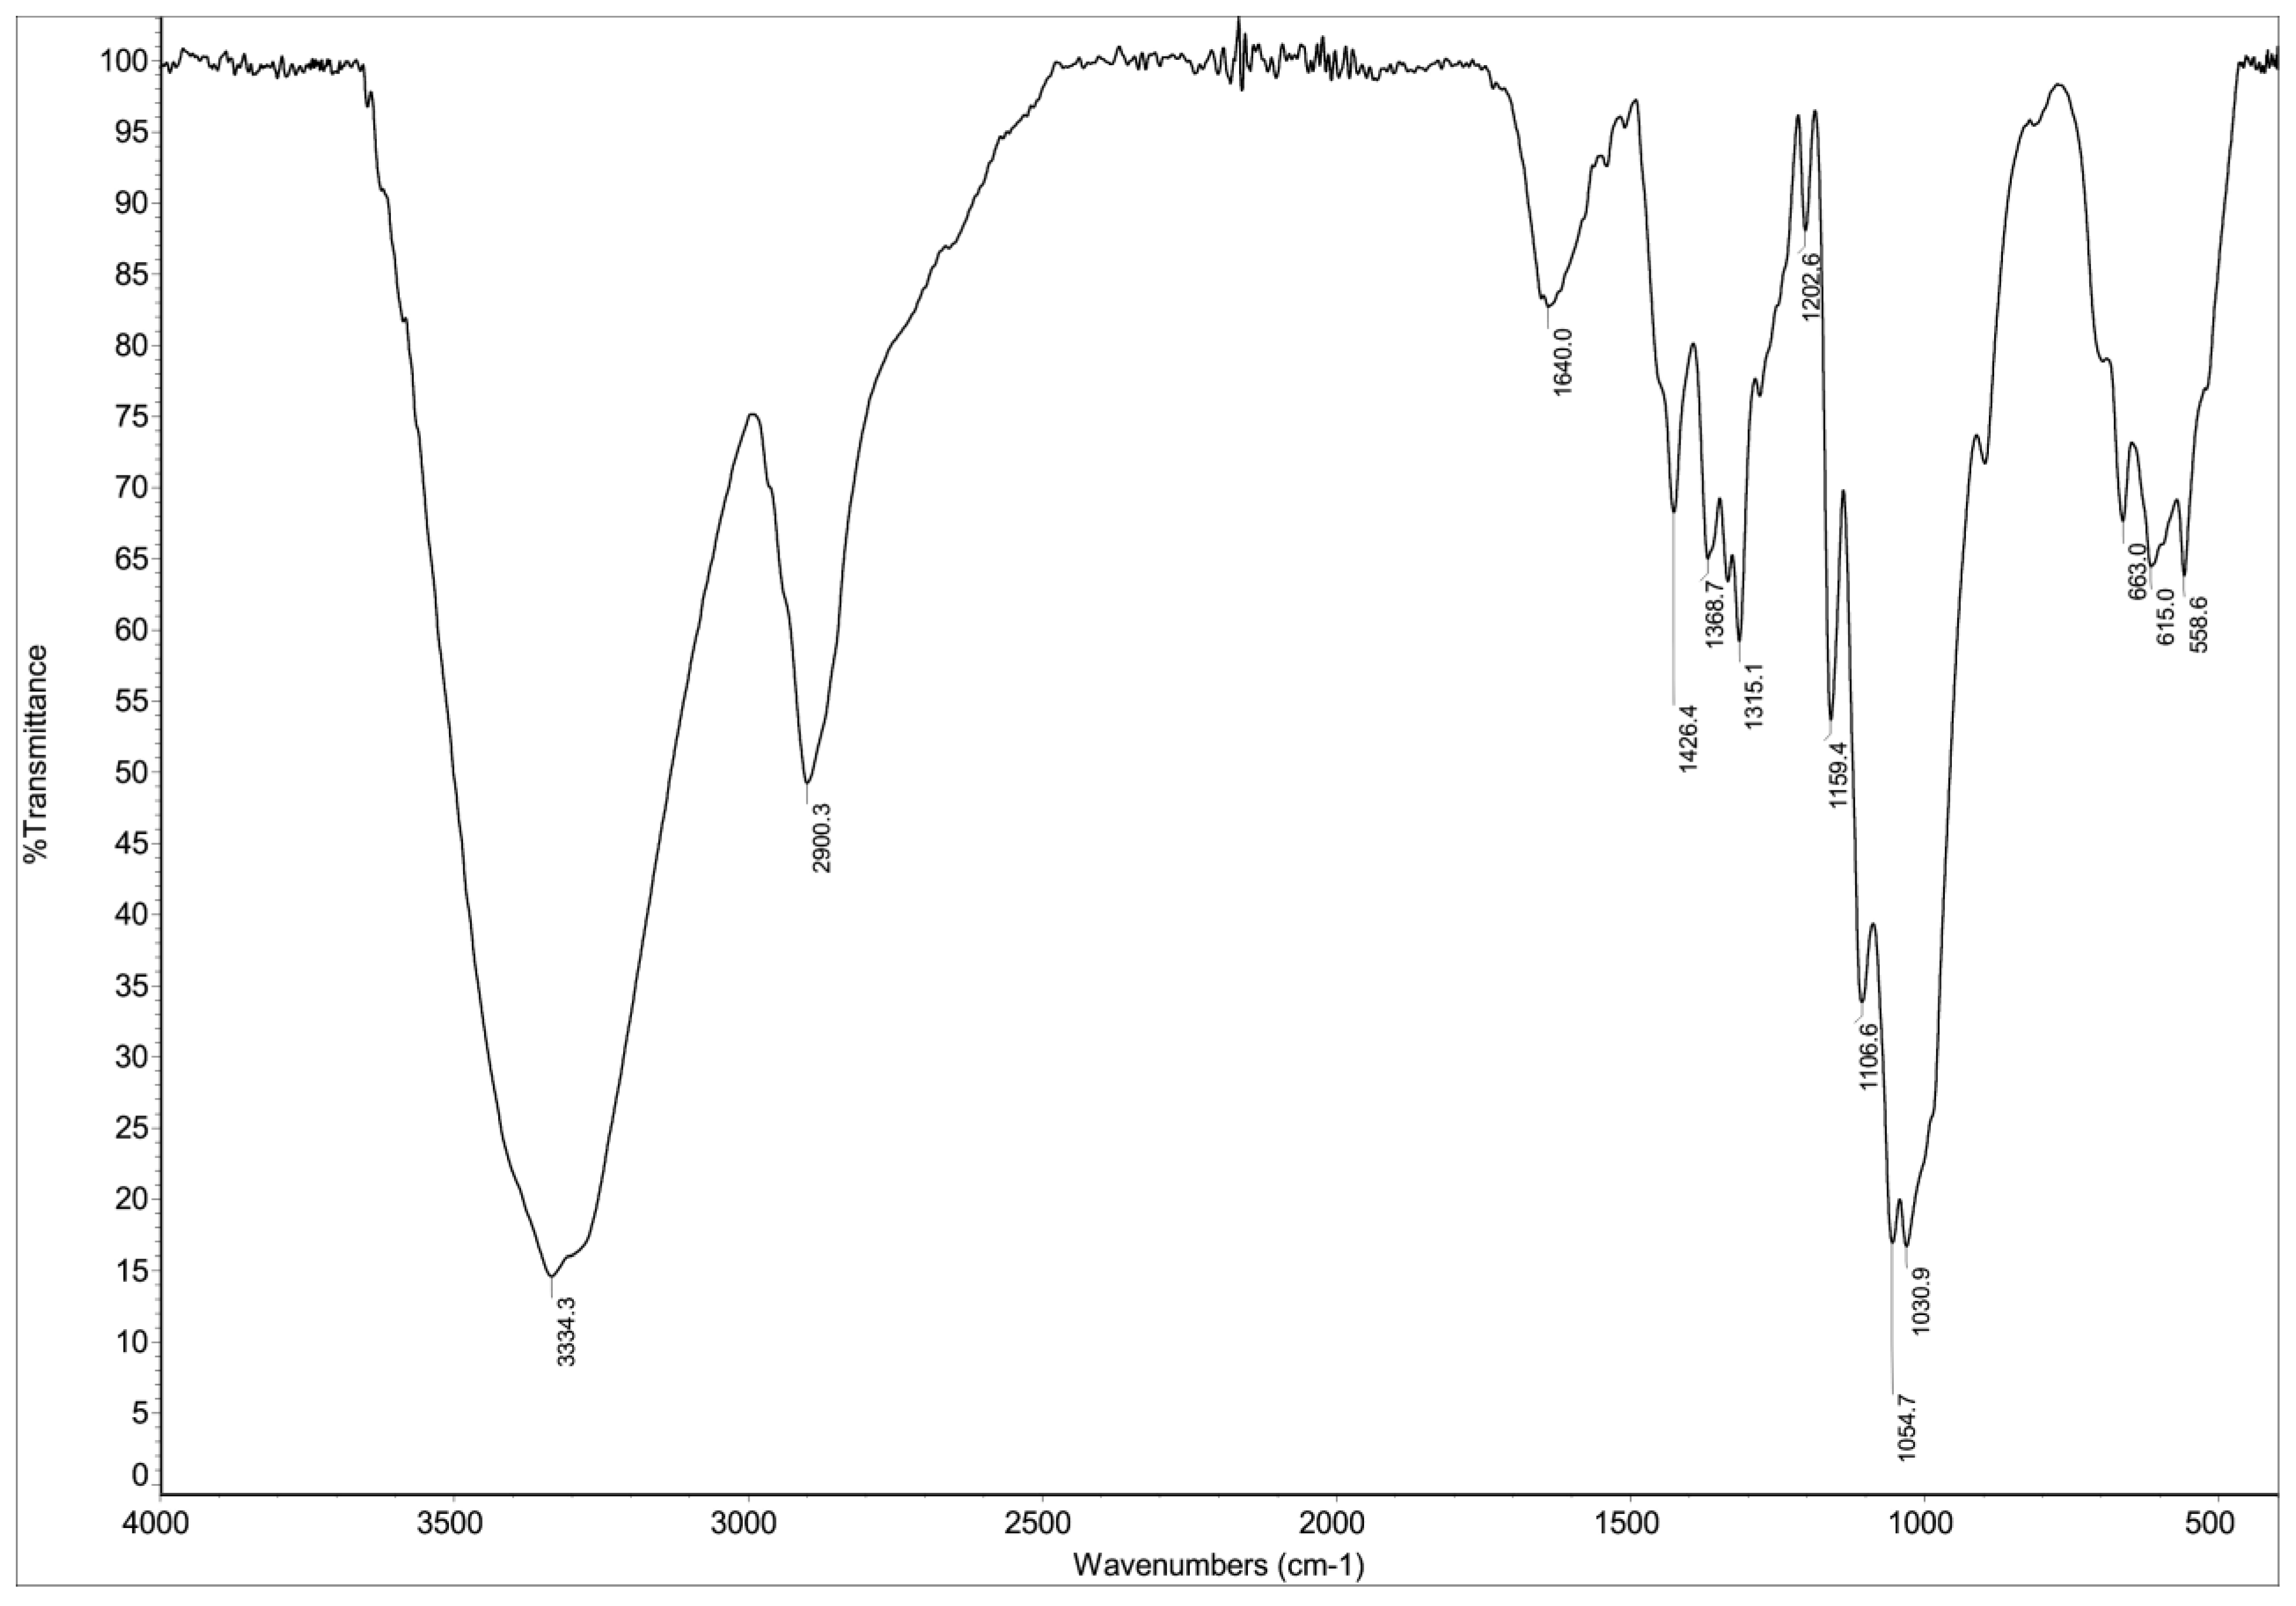
As shown in Figure 3, the FTIR spectrum of the biosorbent reveals characteristic absorption bands associated with its lignocellulosic structure. The spectral features, consistent with previous reports [38], demonstrate distinct vibrational modes. The high-frequency region is dominated by a broad O-H stretching band at 3349 cm−1, indicative of phenolic and alcoholic hydroxyl groups in lignin and cellulose, alongside aliphatic C-H stretching at 2934 cm−1 from methyl/methylene groups in hemicellulose and lignin side chains. The presence of conjugated C=O stretching at 1684 cm−1 suggests ester linkages between lignin and hemicellulose. In the fingerprint region, the aromatic skeletal vibrations at 1513–1519 cm−1 (with stronger guaiacyl than syringyl intensity) and C-H in-plane deformation at 1427 cm−1 are diagnostic of lignin’s aromatic rings, while the band at 1315 cm−1 corresponds to aromatic C-O stretching in lignin’s methoxylated phenylpropane units. Additional features include phenolic OH and aliphatic C-H bending (1380 cm−1), guaiacyl-specific aromatic C-H deformation (1150 cm−1), and C-O deformations in secondary alcohols/ethers (1031–1081 cm−1), the latter reflecting interactions between lignin’s aliphatic side chains and hemicellulose’s polysaccharide network. This vibrational profile collectively demonstrates the intertwined lignin-cellulose-hemicellulose matrix typical of plant-derived biosorbents.

Figure 3.
FTIR spectrum of hemp biosorbent showing characteristic functional groups involved in dye sorption.
3.4. Sorption Experiments
3.4.1. Kinetic Analysis
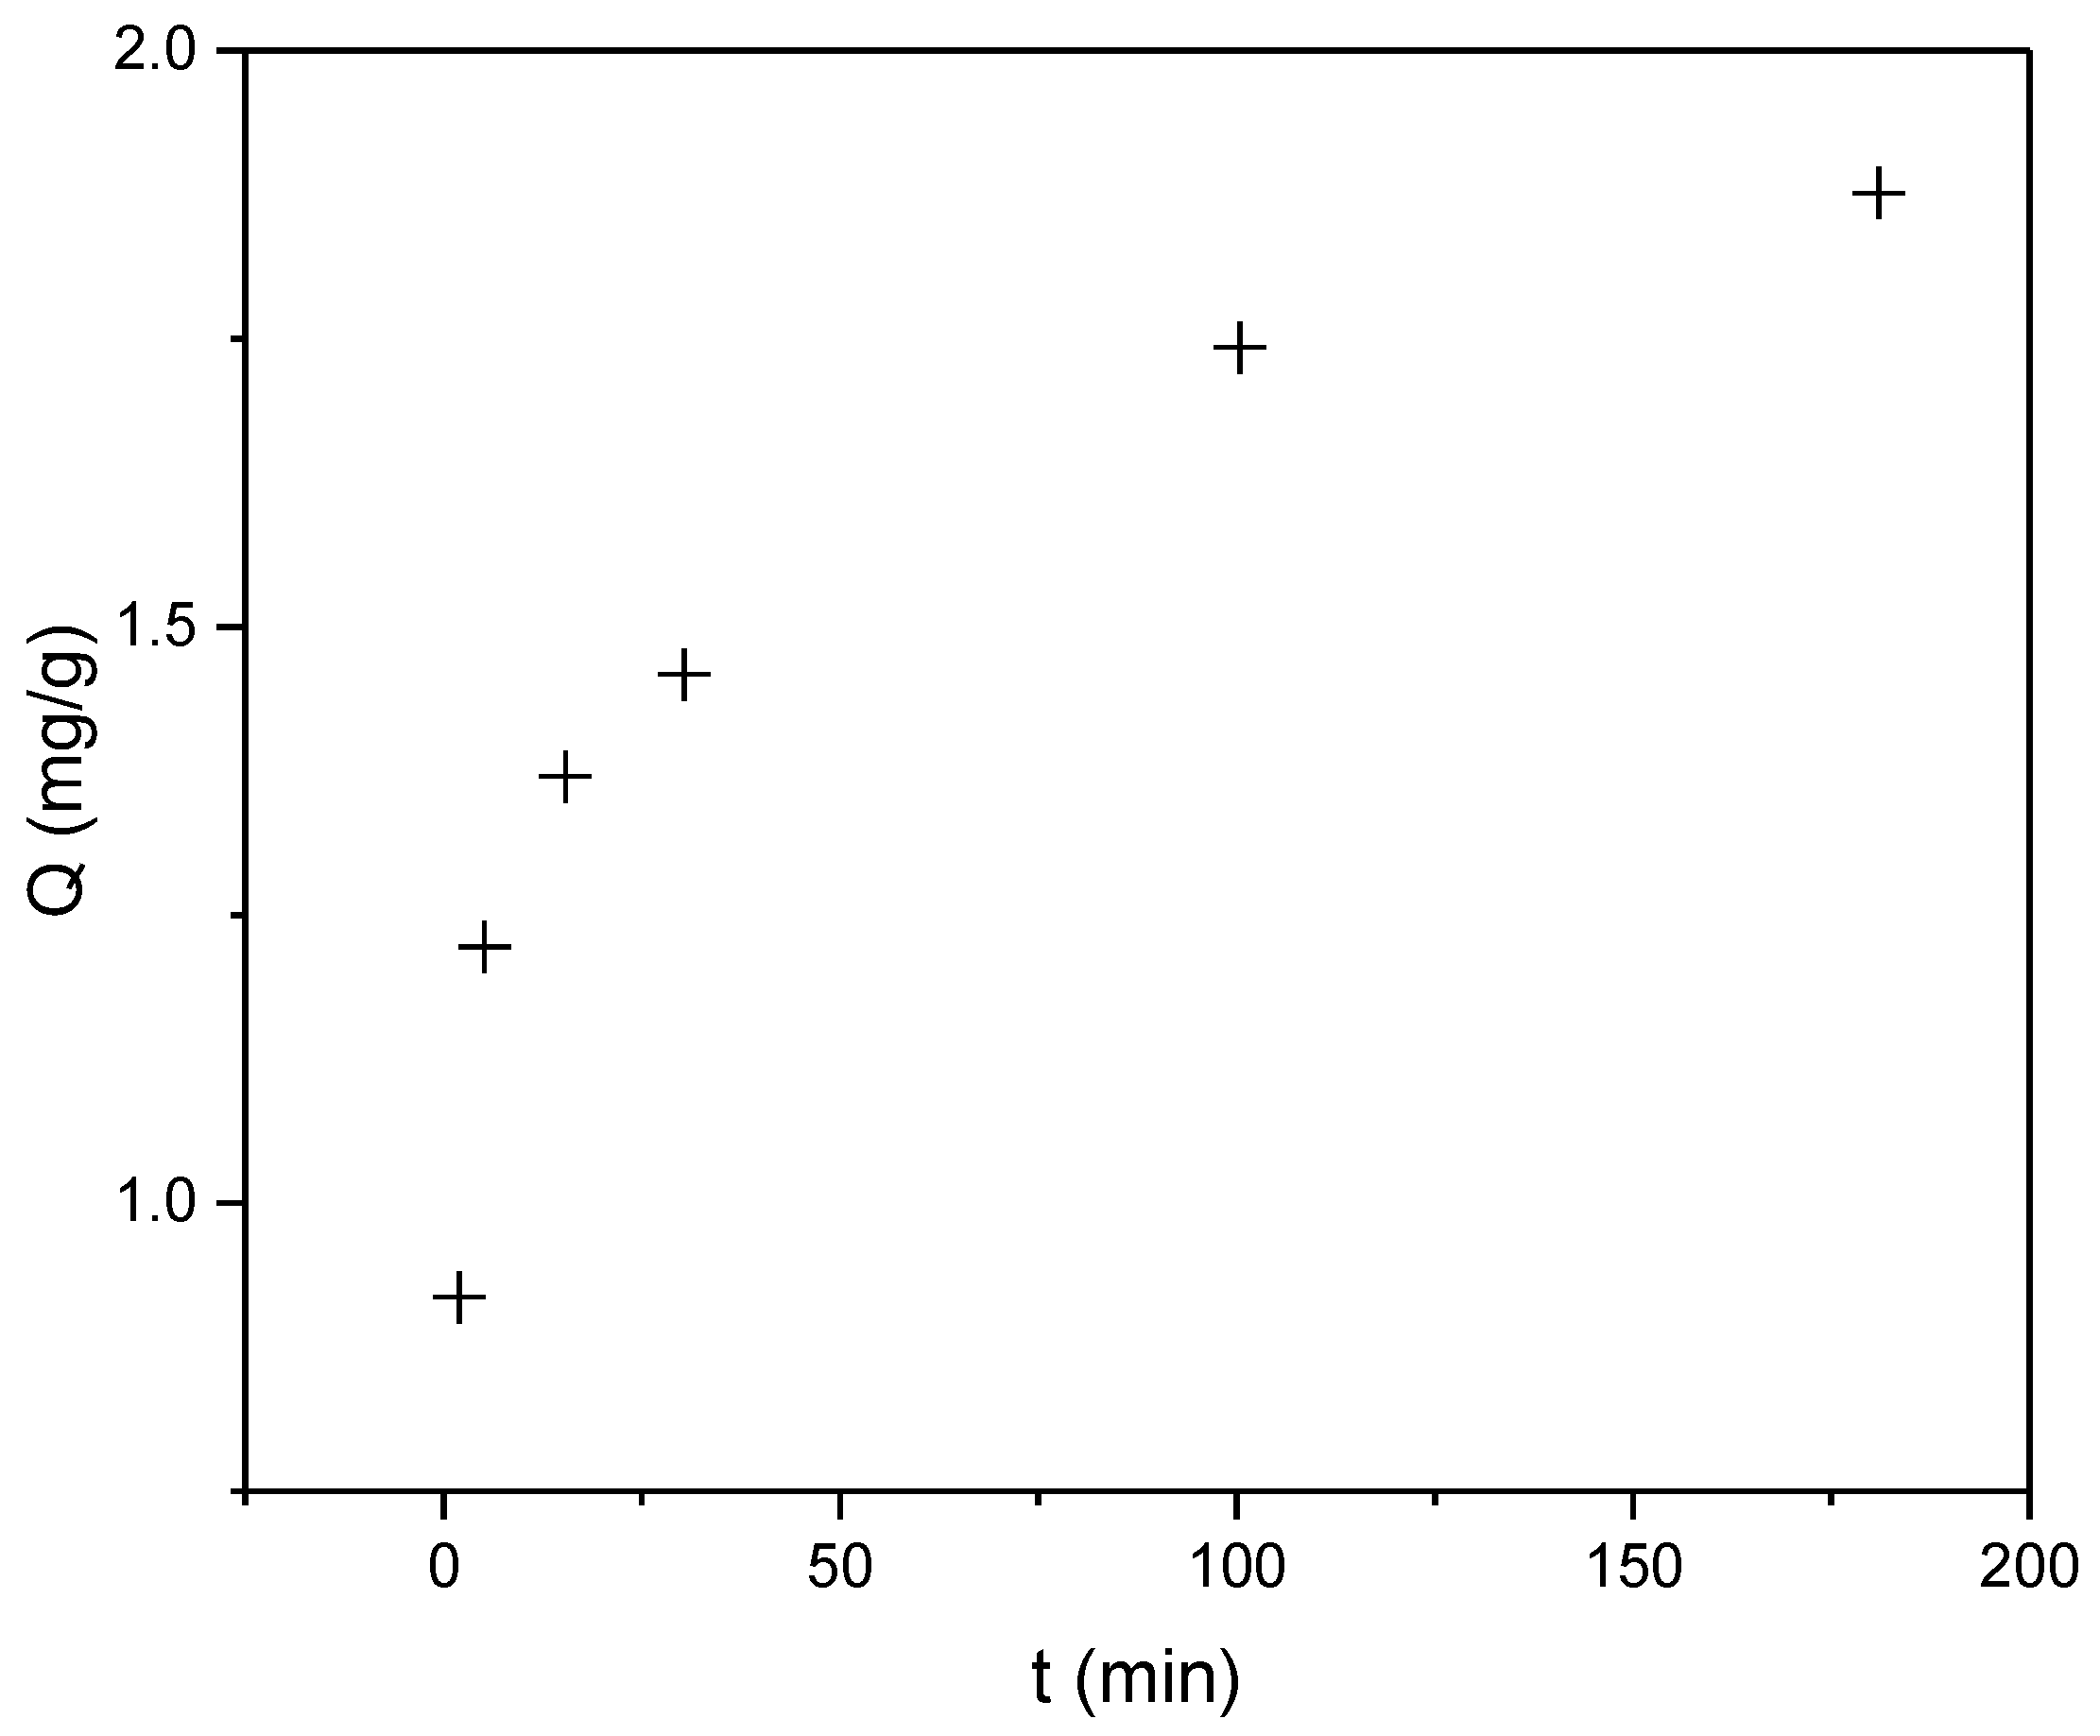
The kinetic studies revealed that the sorption of CR and RBBR dyes onto the biosorbent was a rapid process. For CR dye, the half-sorption time (t1/2)—the time required to achieve 50% of the maximum sorption capacity—was less than 15 min. Notably, 85% of Qmax (2.56 mg/g) was achieved within the first 15 min. Figure 4 shows the dependence of sorption capacity (Q) on contact time for CR dye removal by the biosorbent.
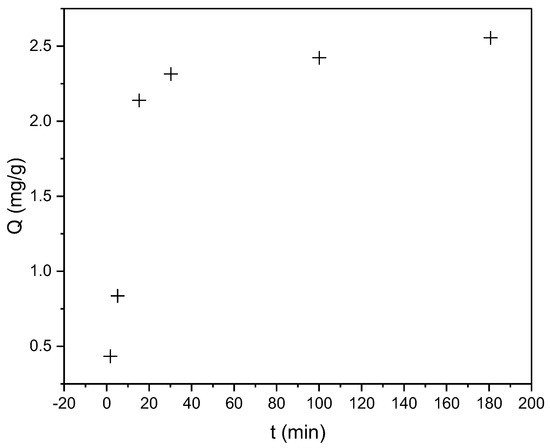
Figure 4.
Time-dependent sorption capacity (Q, mg/g) of CR on hemp biosorbent (pH = 5, biosorbent dosage = 0.25 g, initial concentration: 100 mg/L, T = 298 K).
Based on Figure 5 showing the Q versus time dependence for RBBR dye, the biosorbent demonstrates slightly lower efficiency for RBBR compared to CR, with a maximum sorption capacity (Qmax) of 1.88 mg/g. However, the sorption process remains extremely rapid, with a half-sorption time (t1/2) of approximately 2 min. More than 70% of (Qmax) was achieved within the first 15 min of contact time, indicating favorable kinetic properties despite the reduced overall capacity. The observed difference in sorption performance between the two dyes may be attributed to variations in their molecular structures and interactions with the biosorbent surface.

Figure 5.
Time-dependent sorption capacity (Q, mg/g) of RBBR dye on industrial hemp biosorbent (pH = 5, biosorbent dosage = 0.25 g, initial concentration: 100 mg/L, T = 298 K).
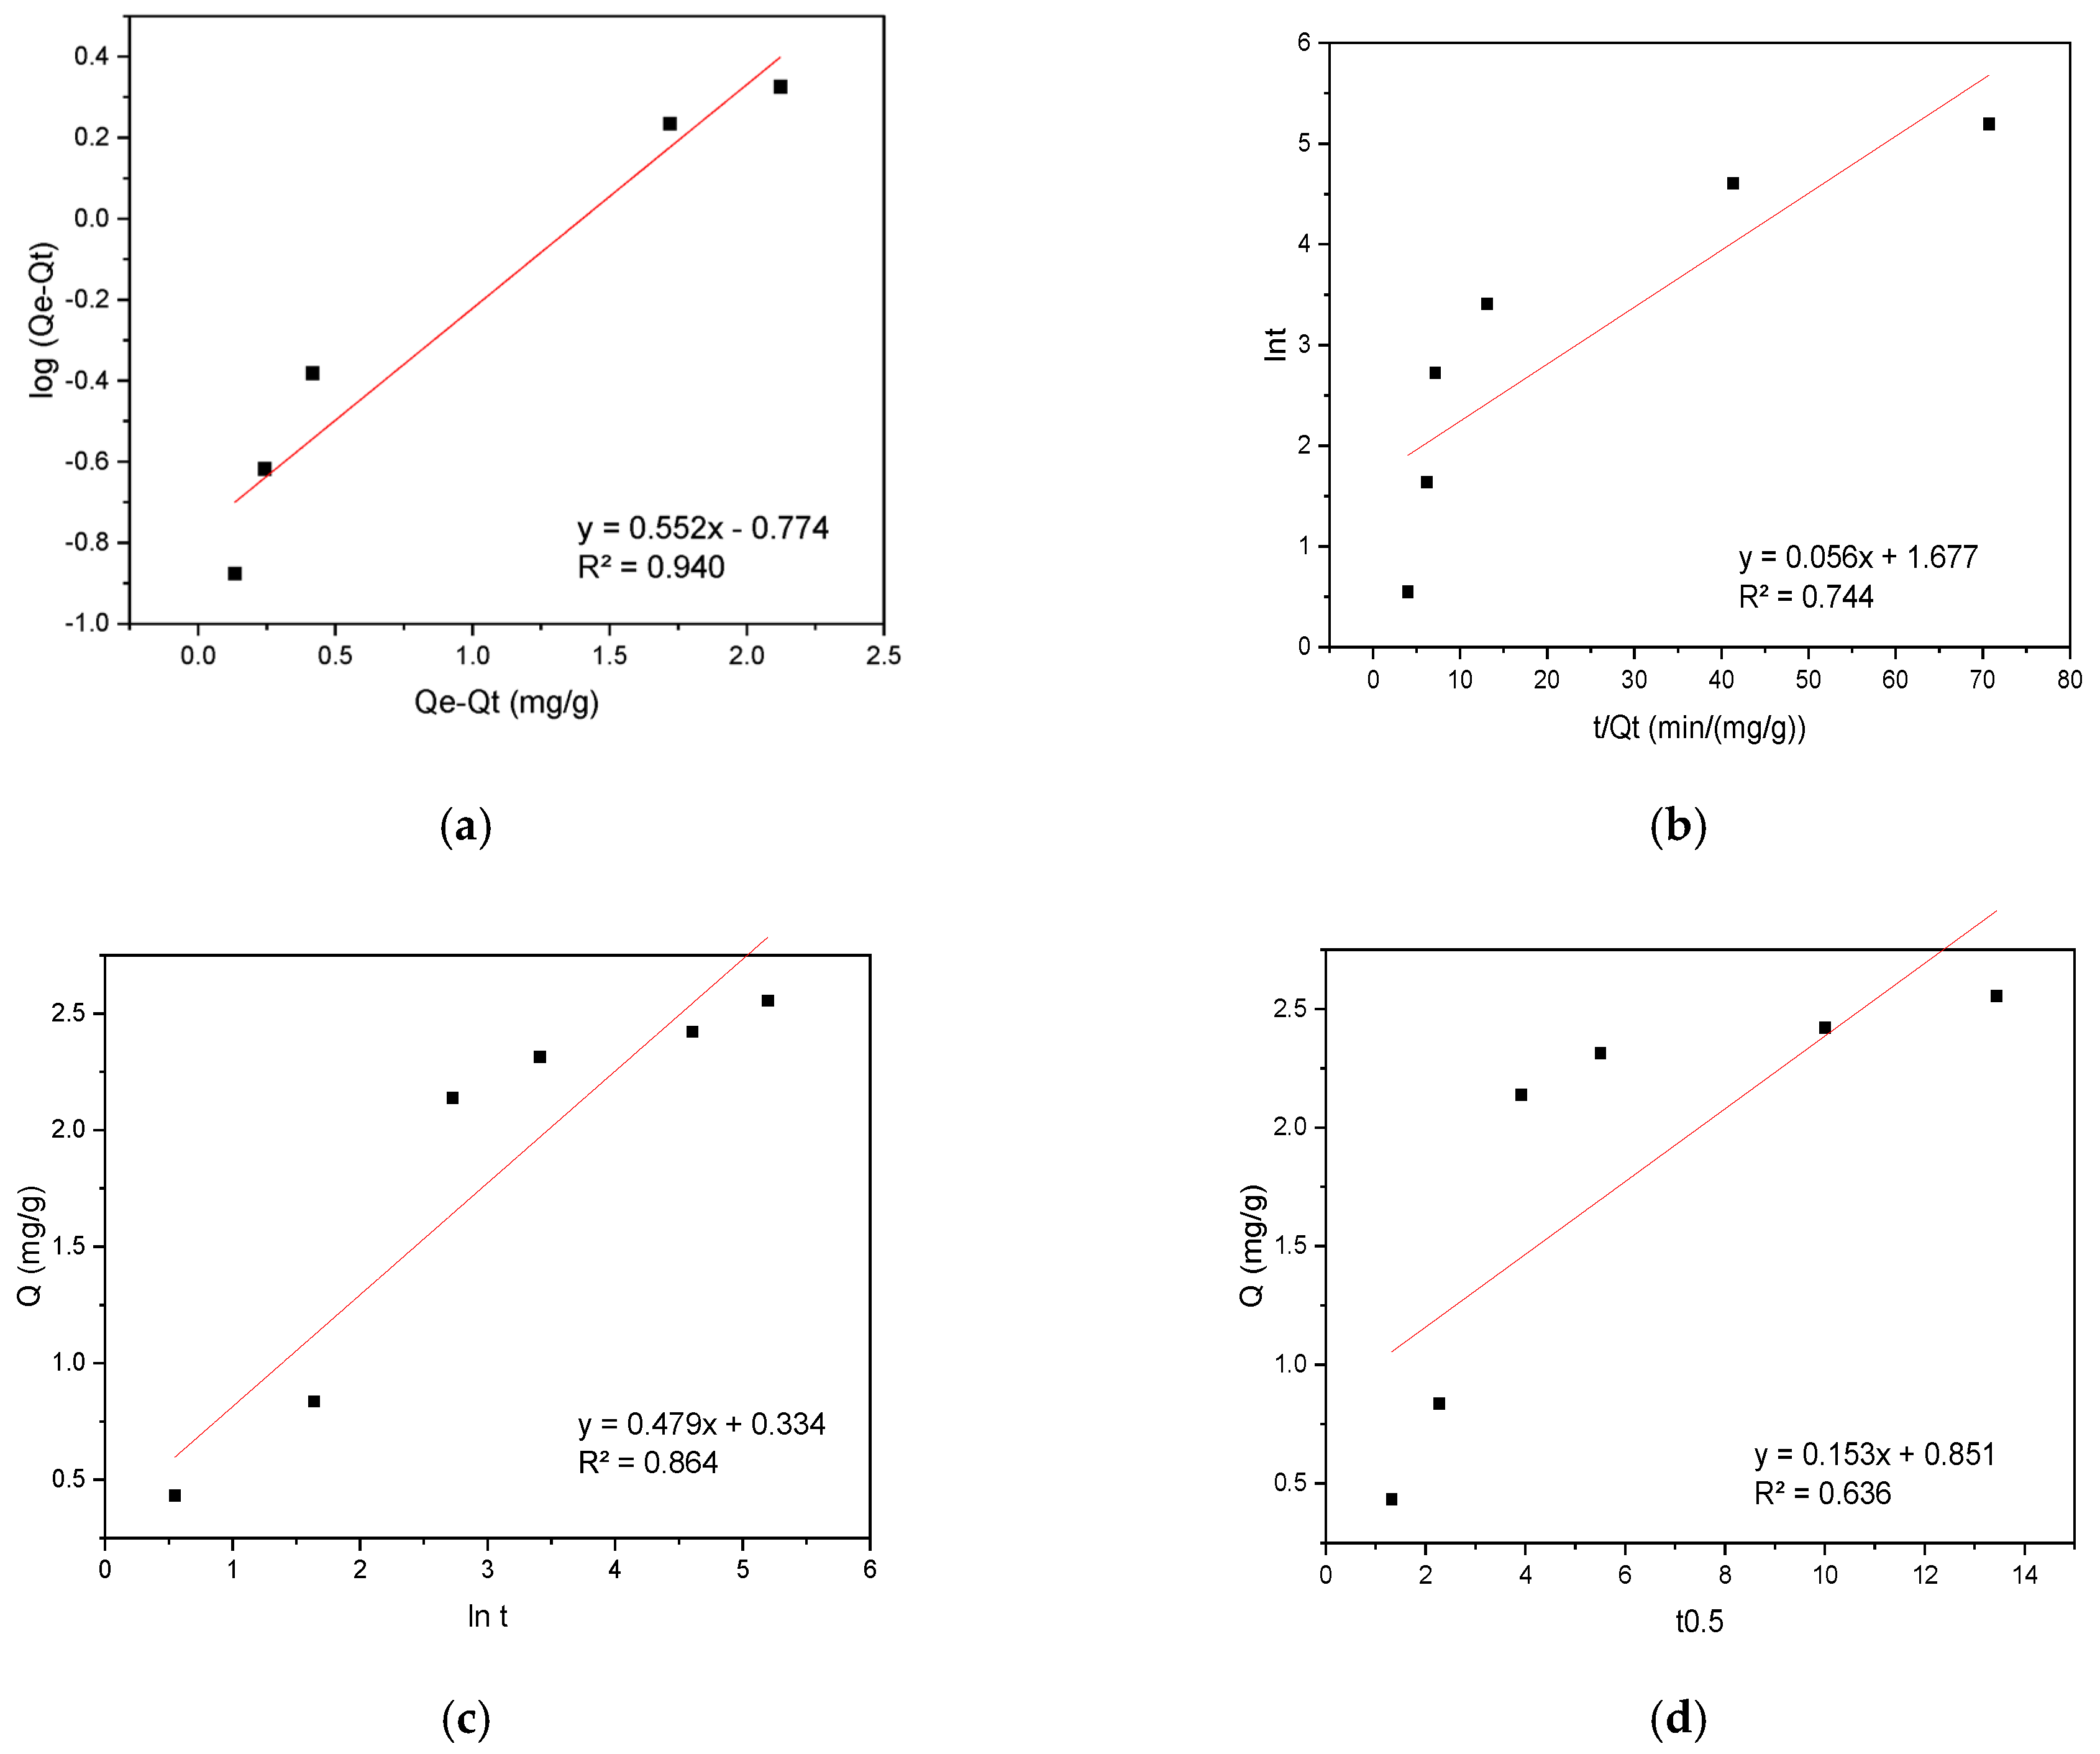
The experimental data were analyzed using kinetic models including pseudo-first-order (PFO), pseudo-second-order (PSO), Elovich, and intraparticle diffusion (IPD) to elucidate the sorption mechanism. The results are presented in Figure 6 for CR sorption on the biosorbent.
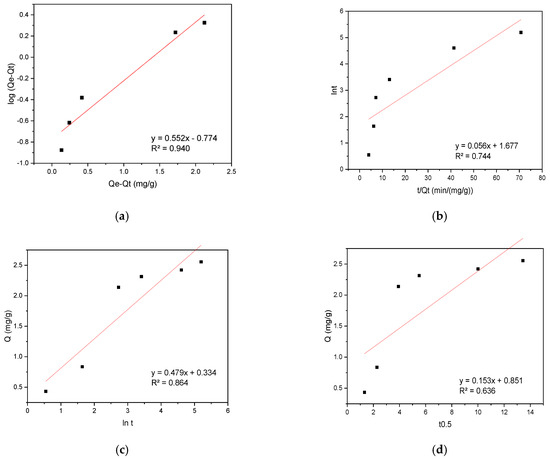
Figure 6.
(a) PFO, (b) PSO, (c) Elovich, and (d) IPD kinetic plots for CR sorption onto hemp biosorbent from aqueous solutions.
The sorption of CR onto the biosorbent was best described by the PFO kinetic model, exhibiting a high correlation coefficient (R2 = 0.940). This suggests the sorption rate depends primarily on dye concentration, while other factors remain constant or negligible. The PFO model effectively describes the initial sorption phase (0–30 min), where rapid uptake is dominated by solute accessibility to surface-active sites. However, it fails to account for later-stage diffusion limitations. In contrast, the IPD model aligned perfectly with experimental data between 30–180 min, indicating pore diffusion becomes rate-limiting after surface-site saturation. The sorption process exhibited a distinct two-phase mechanism: An initial rapid phase (0–15 min) achieved 85% of maximum capacity (Qₘₐₓ) through instantaneous CR binding to surface-active sites, followed by a slower diffusion-controlled phase (>30 min) governed by CR molecule penetration into the biosorbent’s porous matrix. The consistency with IPD model kinetics confirmed this pore-filling mechanism.
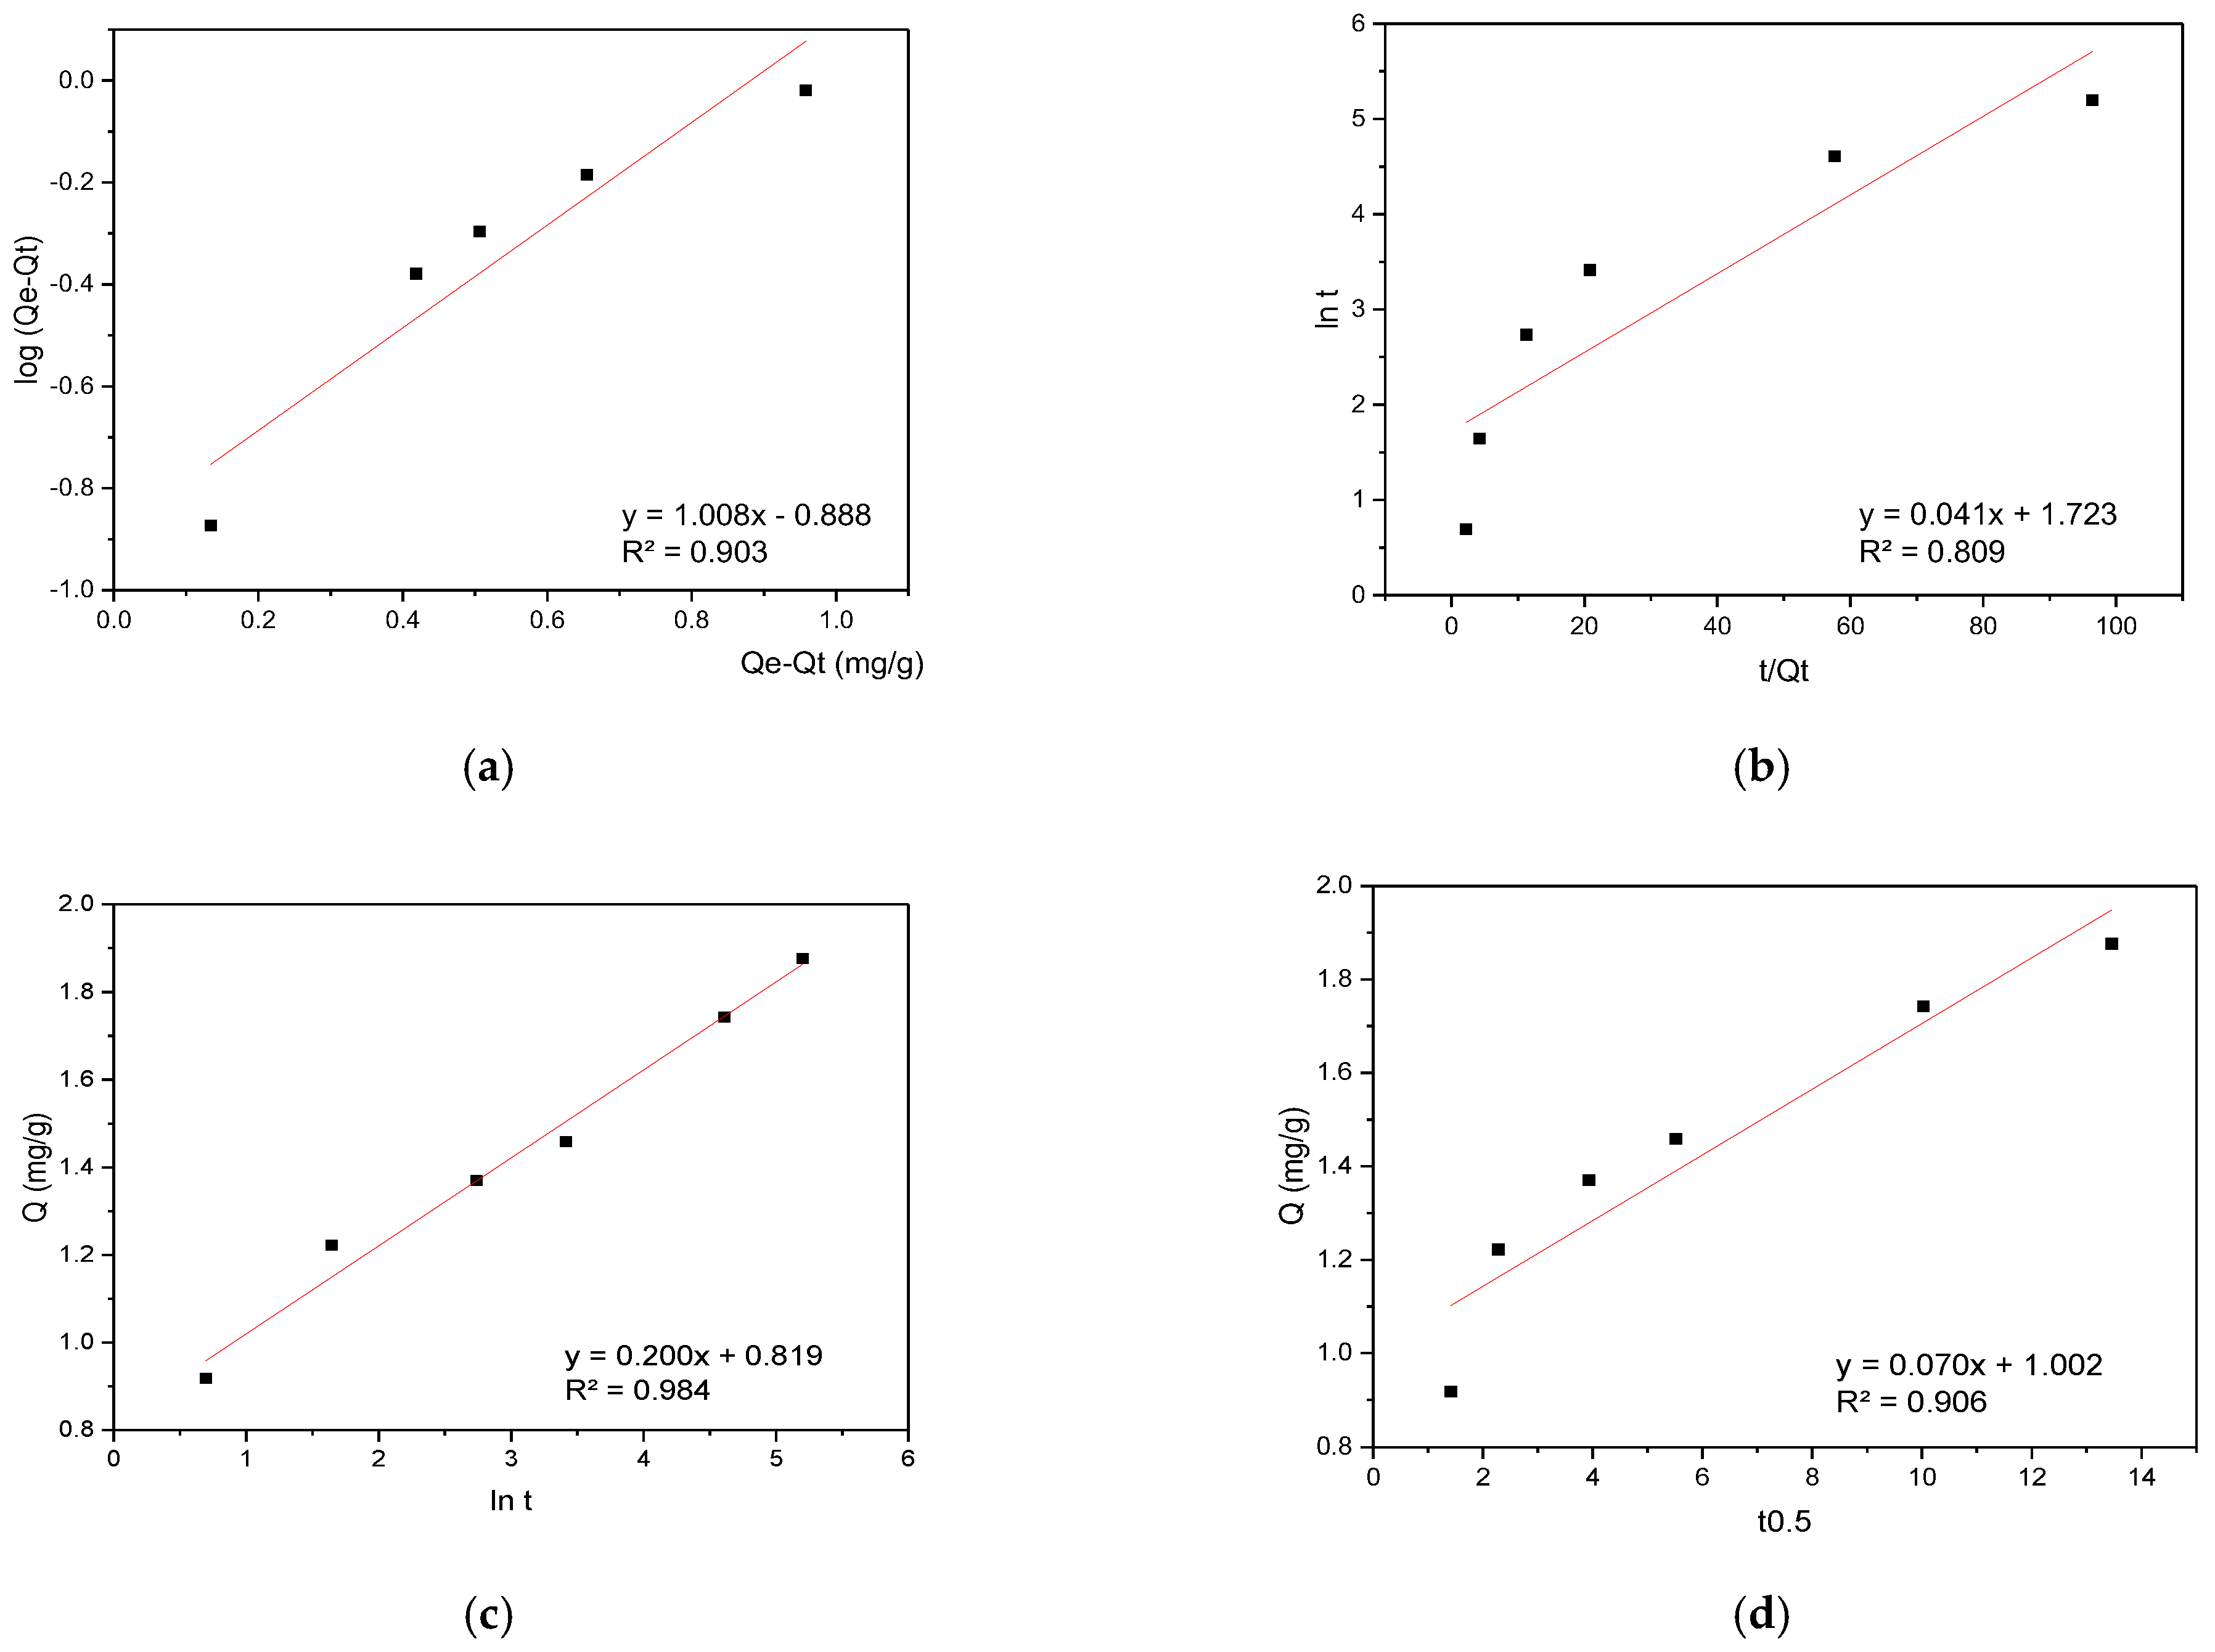
The RBBR sorption data were analyzed using the same modeling approach, with kinetic results presented in Figure 7.
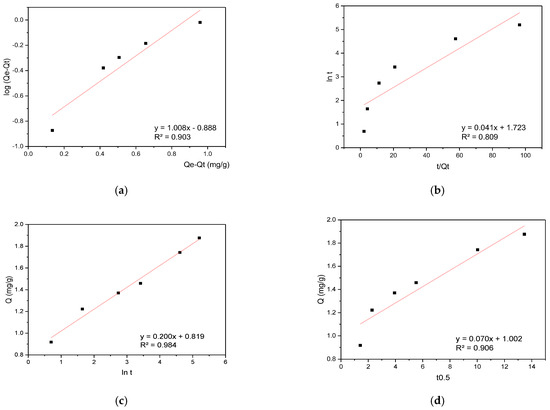
Figure 7.
(a) PFO, (b) PSO, (c) Elovich, and (d) IPD kinetic plots for RBBR sorption onto hemp biosorbent from aqueous solutions.
The kinetic analysis of RBBR sorption revealed a different mechanism compared to CR. While CR followed pseudo-first-order kinetics, RBBR sorption was best described by the Elovich model with a high determination coefficient (R2 = 0.984), indicating heterogeneous surface interactions with multiple energy sites. After the initial 5 min, the process transitioned to being dominated by intraparticle diffusion, suggesting a shift from surface binding to pore-controlled sorption. This two-stage behavior demonstrates that RBBR interacts with diverse active sites on the biosorbent surface before diffusing into the porous matrix, contrasting with CR’s predominantly surface-driven mechanism. The difference likely stems from RBBR’s larger molecular size and stronger affinity for specific functional groups in the lignocellulosic structure.
While the literature indicates that the pseudo-second-order (PSO) model is typically used to describe dye adsorption on materials such as activated carbon or chitosan where chemisorption dominates [39,40], in the case of unmodified cellulose-based materials (the biosorbent examined here), adsorption kinetics are frequently diffusion-limited due to pore heterogeneity and solution diffusion. Our experimental results support this observation, demonstrating that while the pseudo-first-order (PFO) model showed satisfactory fitting for CR (R2 = 0.94), the residual analysis indicated an equally significant contribution from diffusion processes. Moreover, in certain cases—including our RBBR adsorption results—alternative models such as the Elovich equation, which is more appropriate for heterogeneous surfaces, provided more precise fitting [41]. These kinetic findings consequently emphasize that model selection must account for both the adsorbent’s physical characteristics and the dye’s molecular properties.
3.4.2. Adsorption Isotherm Analysis
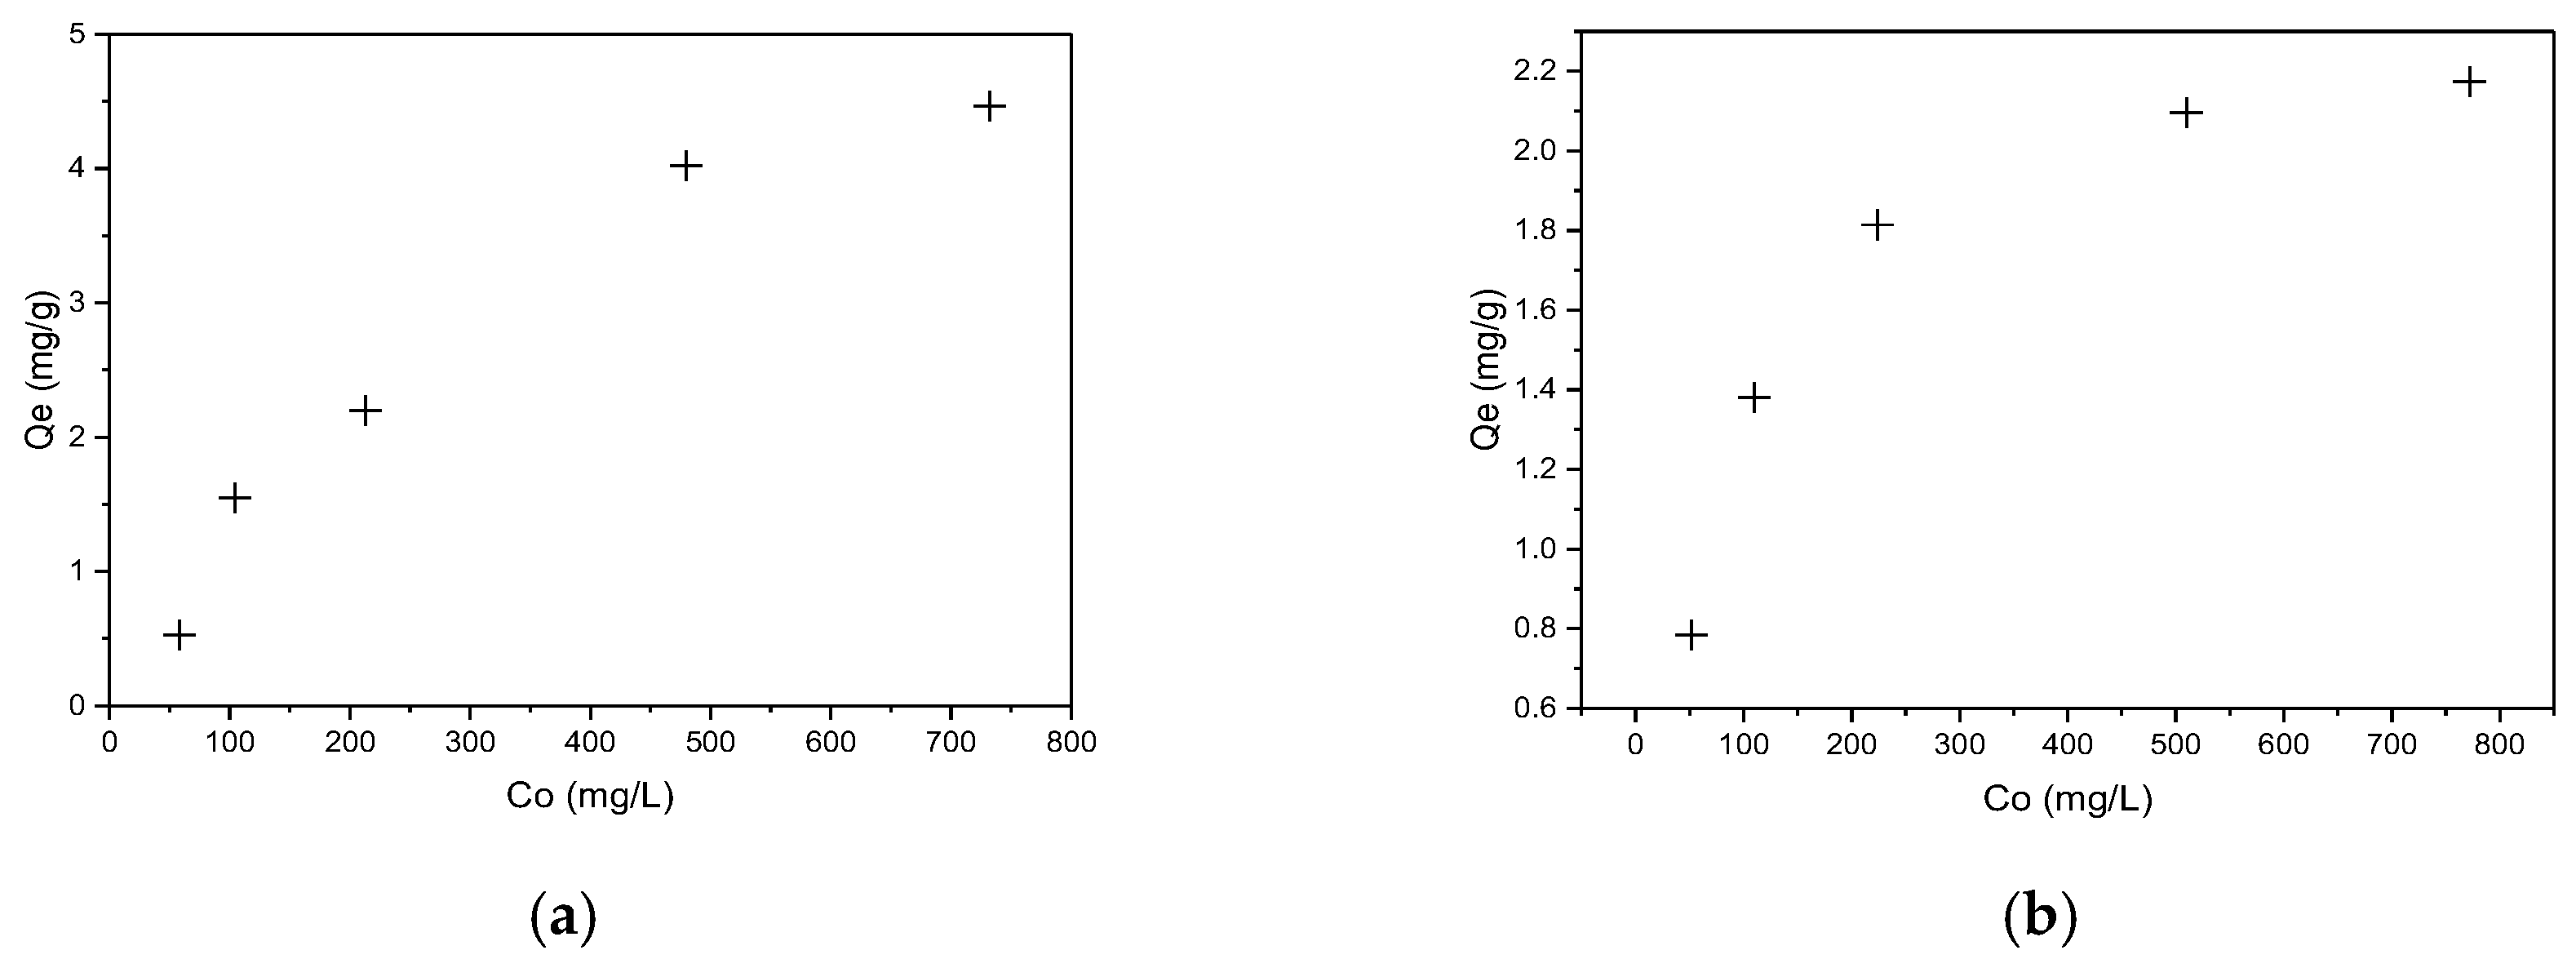
The effect of initial dye concentration (50–750 mg/L) on biosorbent sorption capacity was investigated at room temperature and atmospheric pressure, as detailed in the experimental section. The results are graphically presented in Figure 8a for CR and Figure 8b RBBR dyes, respectively.
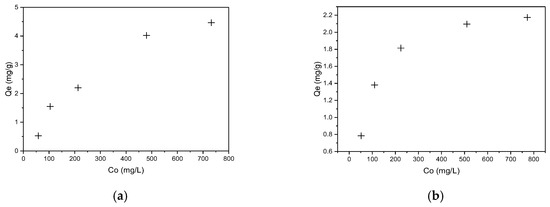
Figure 8.
Equilibrium adsorption capacity of hemp biosorbent as a function of initial concentration: (a) CR and (b) RBBR (pH = 5, biosorbent dosage = 0.1 g, T = 298 K, t = 60 min).
The adsorption isotherm studies revealed a clear dependence of sorption capacity (Qe) on initial dye concentration, with increasing concentration enhancing uptake due to the greater driving force for mass transfer. At lower concentrations (50–200 mg/L), rapid uptake occurred as active sites on the biosorbent surface were readily accessible, while at higher concentrations (>500 mg/L), the system approached maximum capacity (Qmax) as surface sites became saturated.
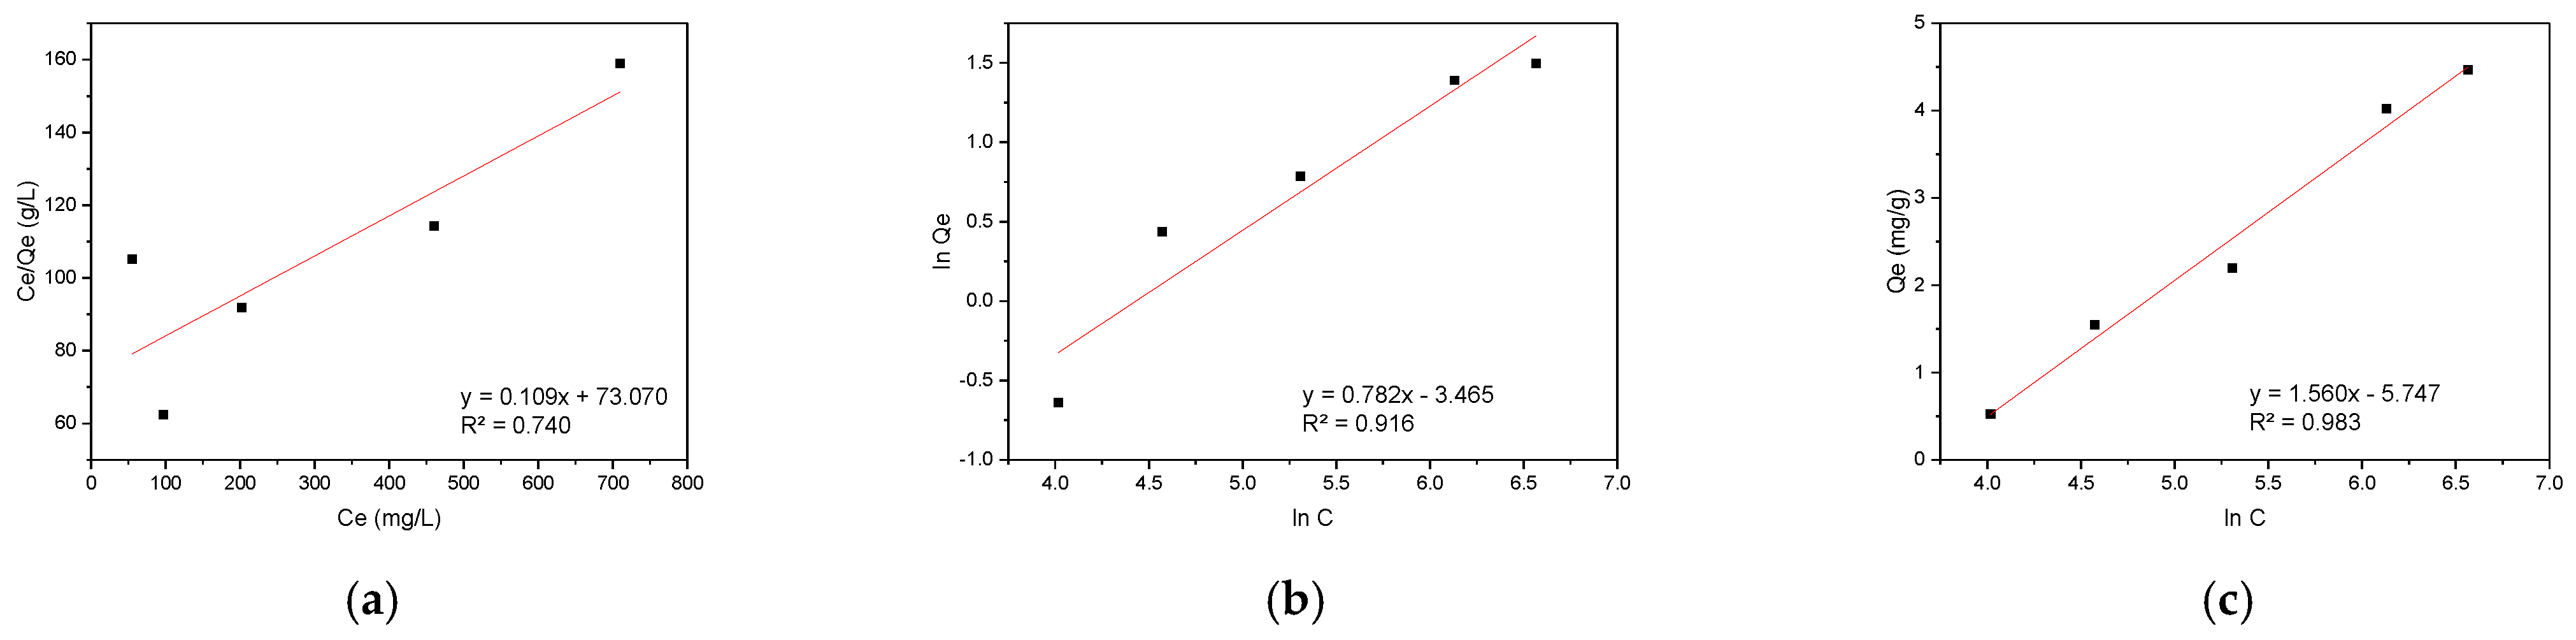
The experimental data were further analyzed using three isotherm models: the Langmuir model for monolayer adsorption on homogeneous surfaces, the Freundlich model for multilayer adsorption on heterogeneous surfaces, and the Temkin model accounting for adsorbate-adsorbate interactions. The linearized plots of these models for CR adsorption are presented in Figure 9, demonstrating the applicability of each approach to the experimental data.
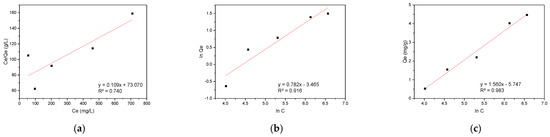
Figure 9.
Adsorption isotherm models for CR on hemp biosorbent: (a) Langmuir, (b) Freundlich, and (c) Temkin.
The Temkin isotherm provided the best fit for the CR adsorption data (R2 = 0.983), demonstrating the importance of surface heterogeneity and adsorption energetics in the process. The hemp biosorbent’s lignocellulosic composition created varied binding sites with different energy states, as evidenced by the Temkin parameter value of 1.588 kJ/mol. This energetic diversity stems from the presence of multiple functional groups (hydroxyl, carboxyl, and aromatic rings) and the non-uniform distribution of active sites throughout the fibrous structure. The adsorption occurred through a gradual process where CR molecules first occupied the most favorable high-affinity sites before binding to less favorable locations. The excellent agreement with the Temkin model confirms the complex nature of the adsorption system, which cannot be adequately described by simpler monolayer adsorption models. The results highlight the crucial role of both chemical heterogeneity and physical structure in determining the adsorption behavior of CR on hemp-derived biosorbents.
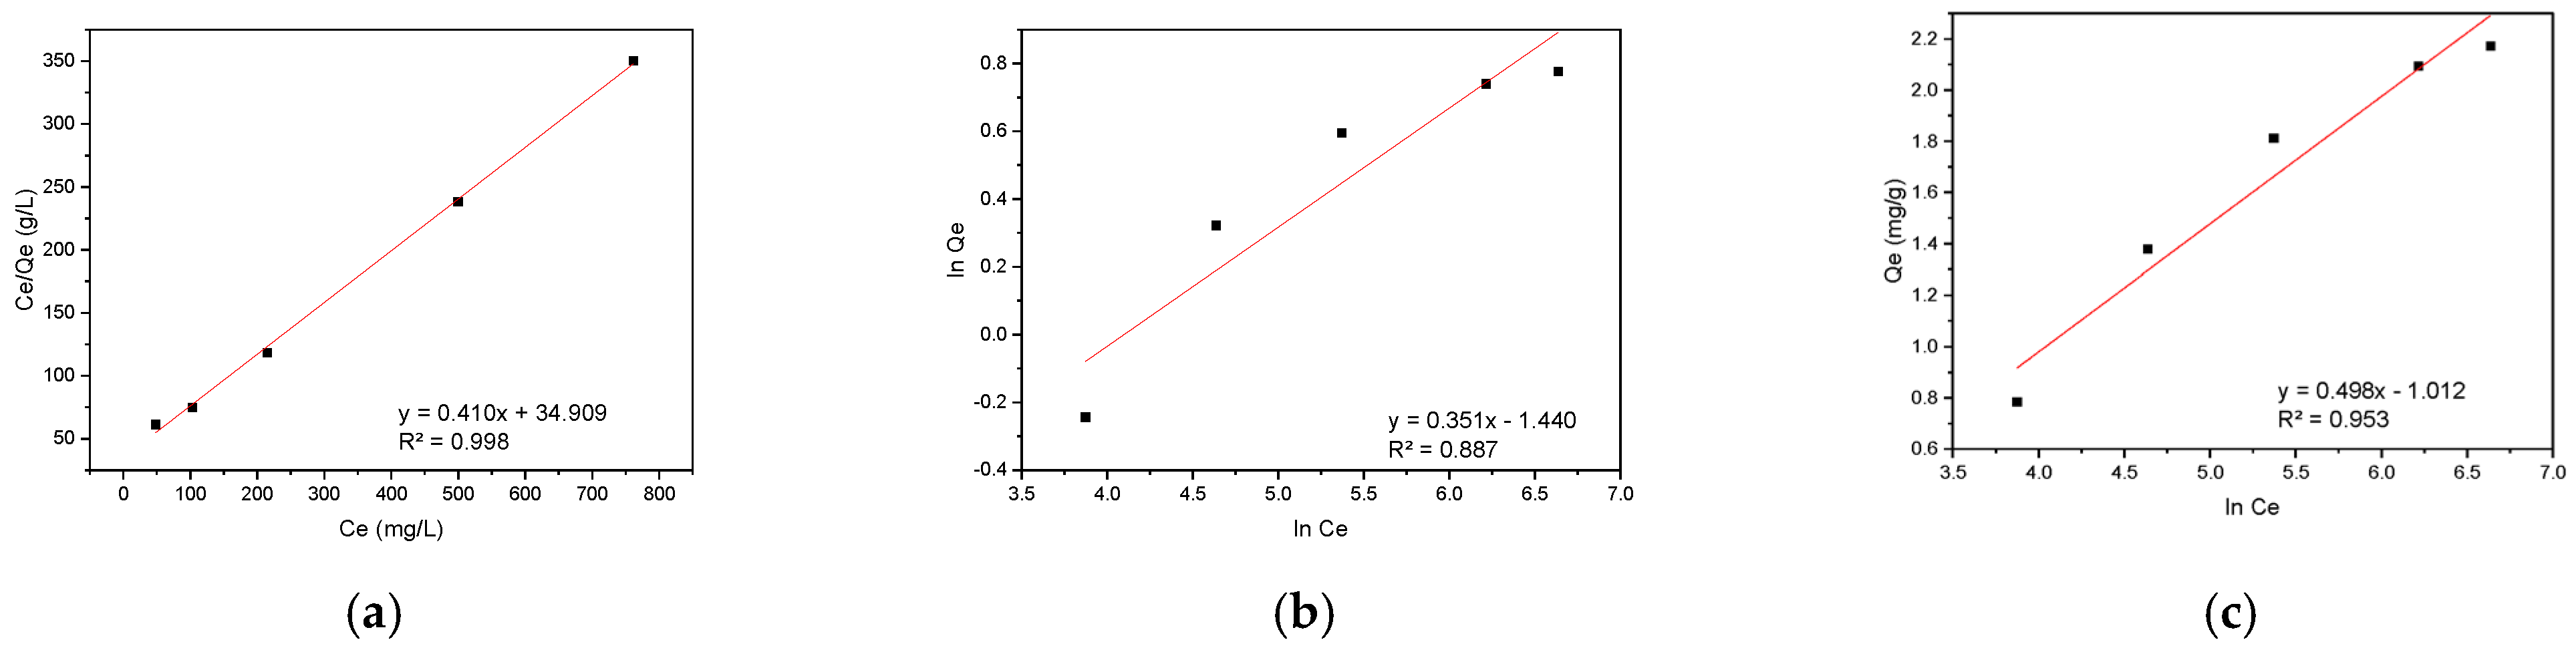
The equilibrium adsorption data for RBBR on hemp biosorbent were modeled using the same three isotherm approaches as before (Langmuir, Freundlich, and Temkin), with the results presented in Figure 10.
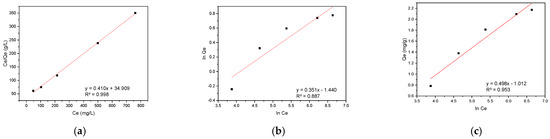
Figure 10.
Adsorption isotherm models for RBBR on hemp biosorbent: (a) Langmuir, (b) Freundlich, and (c) Temkin.
The adsorption behavior of RBBR on hemp biosorbent reveals an interesting mechanistic transition between kinetic and equilibrium phases. While the biosorbent’s surface is inherently heterogeneous due to its lignocellulosic composition, the Langmuir isotherm provides the best description of equilibrium adsorption data. This apparent paradox can be understood through the adsorption process dynamics.
During the initial phase, RBBR molecules preferentially bind to high-affinity sites with the lowest energy, particularly targeting lignin’s aromatic domains through π-π interactions and cellulose’s hydroxyl groups via hydrogen bonding. This heterogeneous binding behavior is well-captured by the Elovich model (R2 = 0.984), which accounts for the varying energy states of surface sites. As the system approaches equilibrium, the progressive saturation of diverse binding sites leads to a more uniform distribution of RBBR molecules across the biosorbent surface, effectively creating homogeneous-like conditions that are best described by the Langmuir isotherm (Qmax = 2.44 mg/g, R2 = 0.998).
The molecular structure of RBBR, featuring an anthraquinone core with sulfonate groups, plays a crucial role in this process. The dye molecules initially concentrate on lignin’s electron-rich domains but subsequently redistribute to cellulose and hemicellulose sites as adsorption progresses. This redistribution, coupled with the eventual monolayer coverage at equilibrium, explains why the Langmuir model successfully describes the final equilibrium state despite the surface’s inherent heterogeneity. The transition from heterogeneous kinetics to effectively homogeneous equilibrium conditions highlights the importance of considering both kinetic and equilibrium data for a complete understanding of adsorption mechanisms, as equilibrium measurements alone may obscure important details about the initial binding processes.
Table 1 summarizes the key parameters derived from linearized forms of Langmuir, Freundlich, and Temkin isotherm models for CR and RBBR adsorption on the hemp biosorbent, along with their respective determination coefficients (R2).

Table 1.
Characteristic isotherm parameters for CR and RBBR adsorption on hemp biosorbent (T = 298 K, P = 101.3 kPa, t = 60 min, pH = 5).
The Freundlich exponent (1/n) reveals fundamentally different behaviors: CR shows near-linear adsorption (1/n = 1.28), indicating homogeneous pore filling and electrostatic interactions, while RBBR exhibits extreme heterogeneity (1/n = 2.85) due to multi-mechanism binding. This arises from RBBR’s anthraquinone group driving π–π stacking with lignin’s high-energy aromatic domains, followed by gradual pore diffusion into hemicellulose’s amorphous low-energy regions. In contrast, CR’s smaller size and sulfonate groups favor uniform electrostatic attraction and pore penetration, explaining its Langmuir-like behavior despite the biosorbent’s structural complexity. Hemp biosorbent shows balanced performance for both dyes, with CR adsorption (4.47 mg/g) relying on cellulose accessibility, while RBBR removal (2.44 mg/g) benefits from lignin’s π-π stacking. Though outperformed by pineapple leaf powder for RBBR (7.48 mg/g) and banana peel for CR (18.2 mg/g), hemp offers superior cost-effectiveness and sustainability for mixed-dye systems, making it ideal for small-scale wastewater treatment where eco-friendliness outweighs absolute capacity needs. Table 2 presents the equilibrium adsorption parameters for CR and RBBR on various biosorbents.
Table 2.
Comparative analysis of equilibrium sorption parameters for CR and RBBR onto lignocellulosic biosorbents.
3.4.3. Thermodynamic Analysis
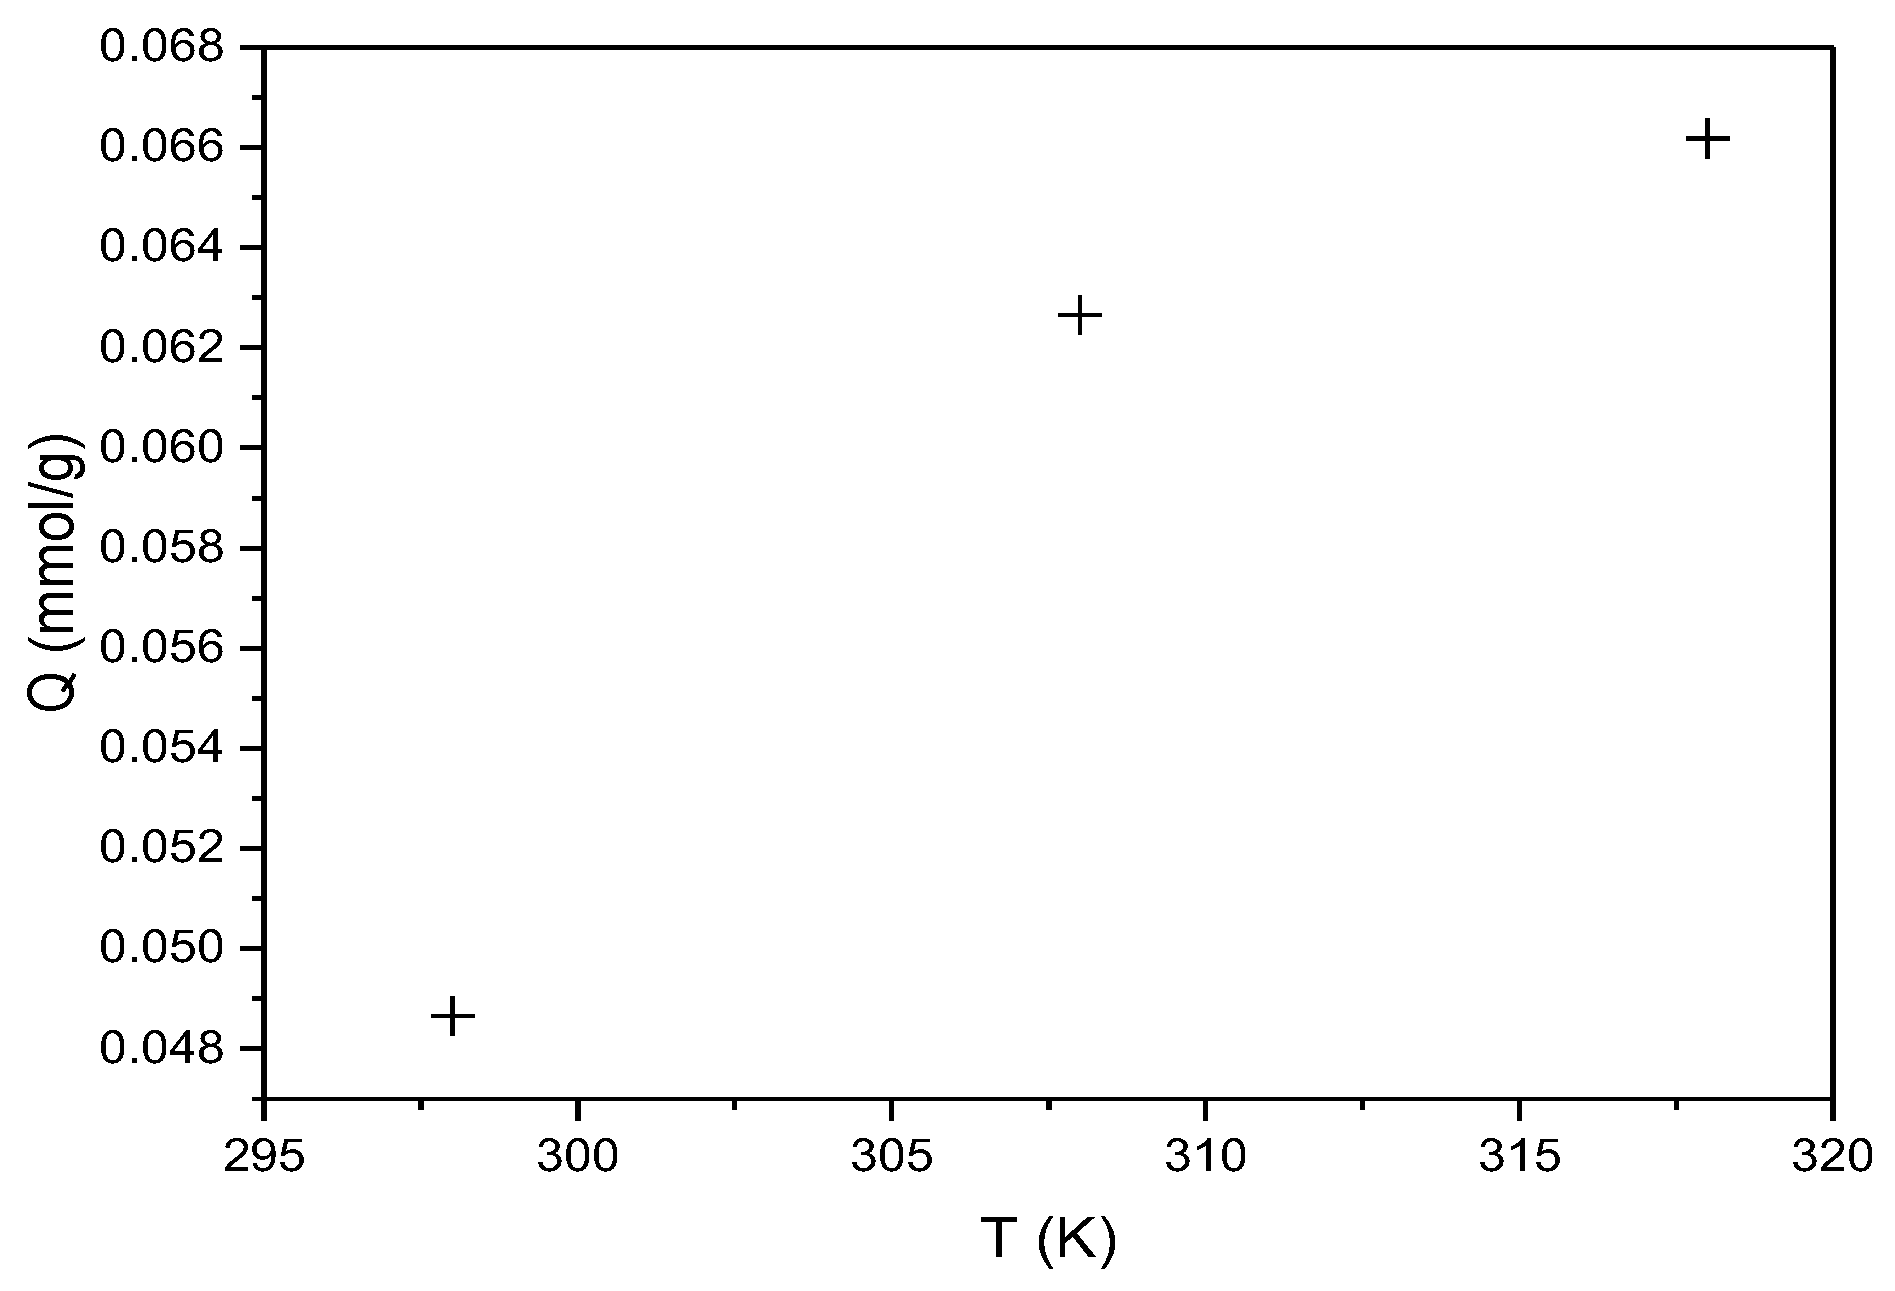
The effect of temperature (298, 308, and 318 K) on the sorption capacity of the biosorbent for CR and RBBR dyes was investigated, as previously described. The experimental results are graphically presented in Figure 11 for CR.
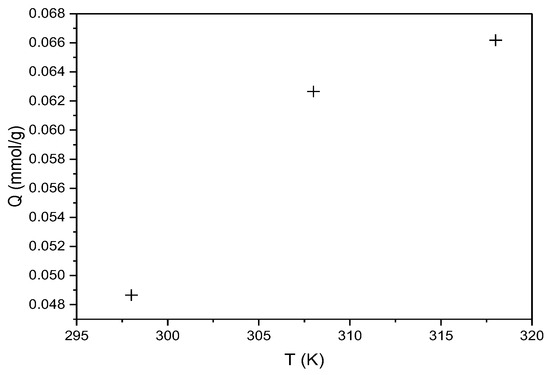
Figure 11.
Effect of temperature on the sorption capacity of hemp biosorbent for CR (expressed in mmol/g; pH = 5, biosorbent dosage = 0.1 g, Ci = 100 mg/L, t = 60 min).
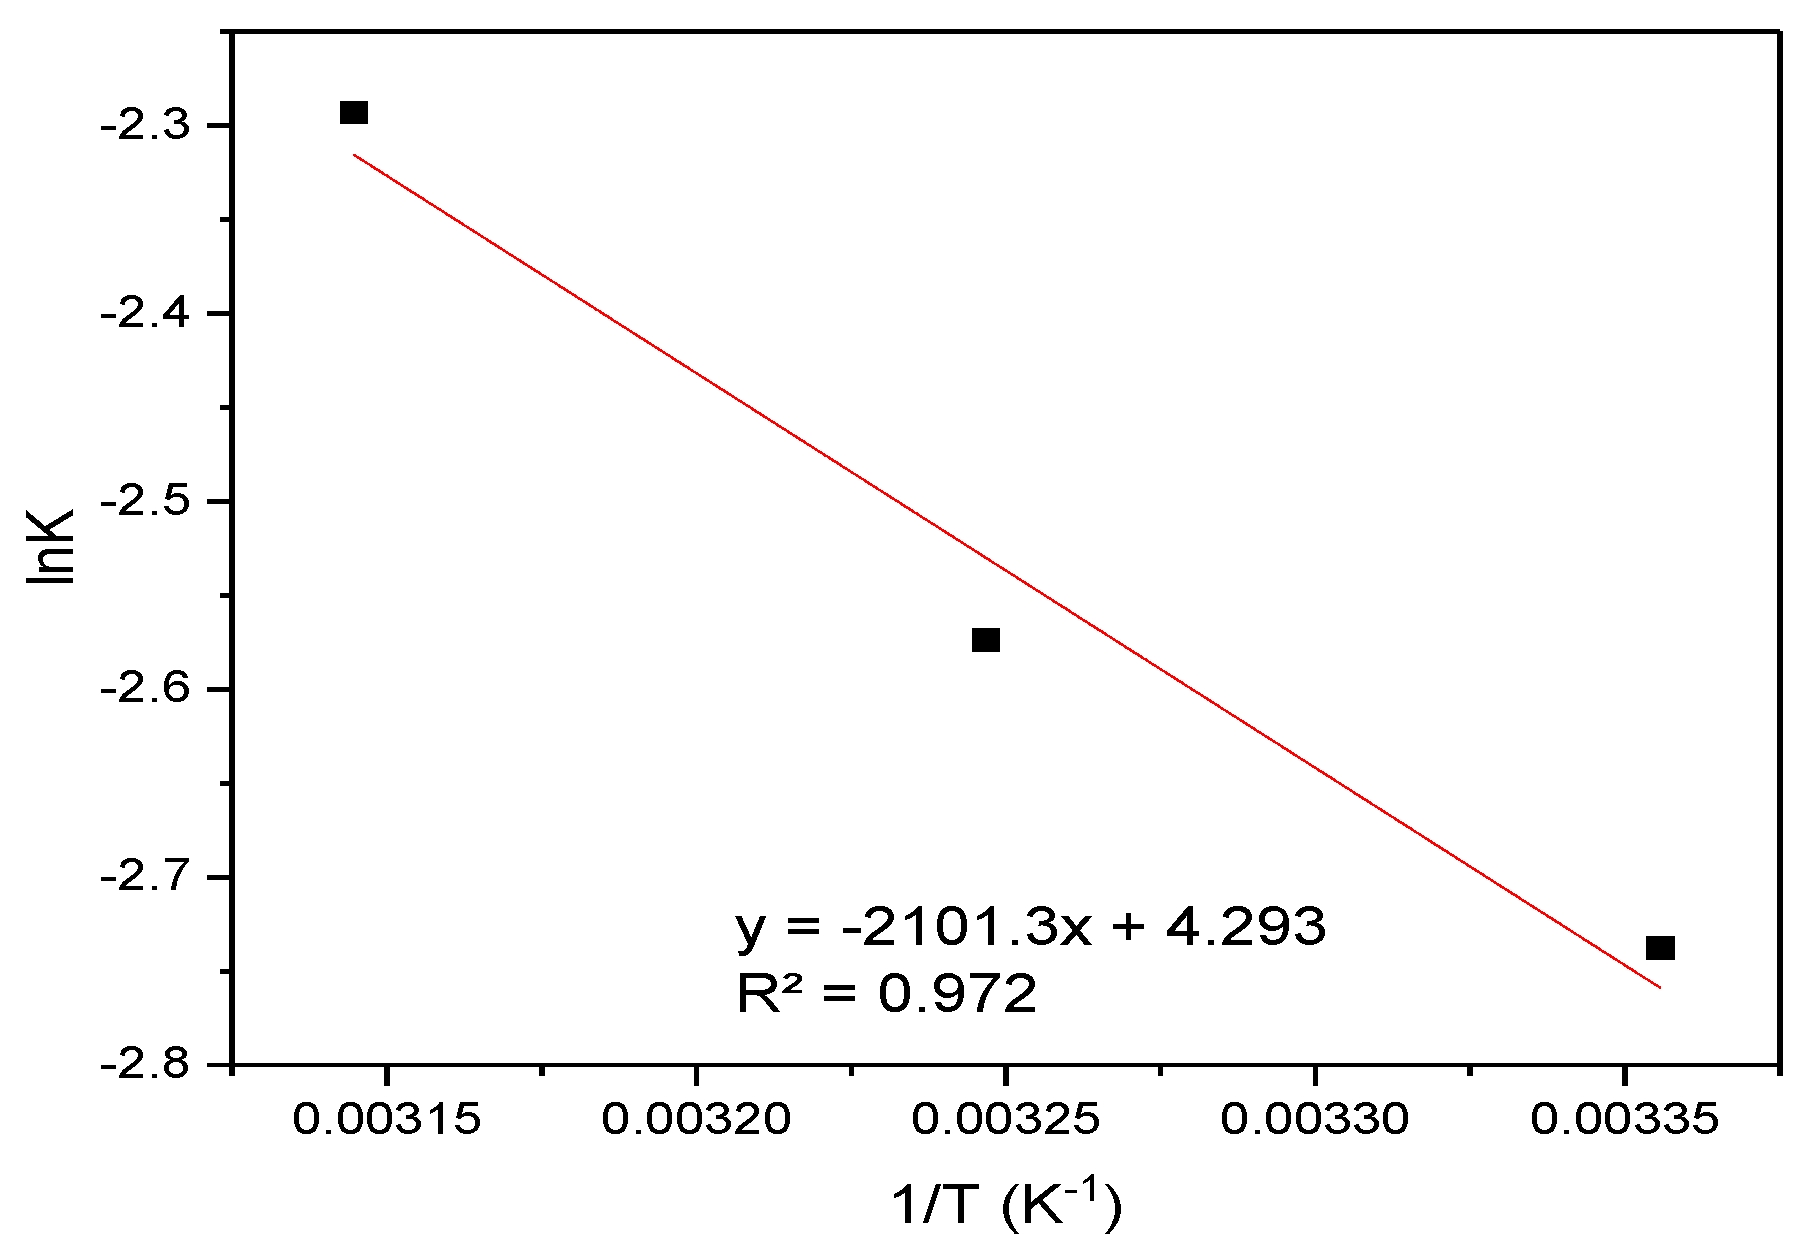
The Van ’t Hoff analysis (lnK vs. 1/T) in Figure 12 yielded thermodynamic parameters for the sorption process: a standard enthalpy change (ΔH) of −1.65 kJ mol−1 (exothermic) and entropy change (ΔS) of +2.85 J mol−1 K−1, derived from the slope and intercept of the linear fit, respectively.
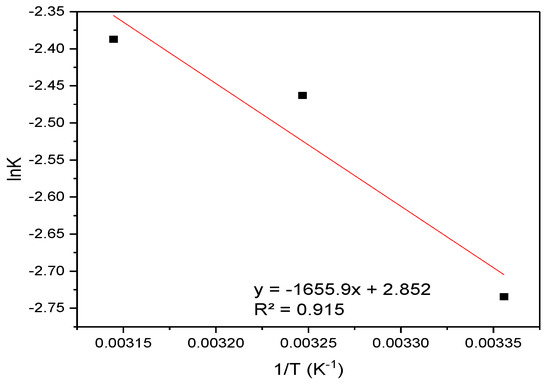
Figure 12.
Van ’t Hoff analysis: Plot of lnK vs. 1/T for the sorption of CR onto hemp biosorbent.
These values were subsequently applied to calculate the temperature-dependent Gibbs free energy change (ΔG = ΔH − TΔS) across the experimental temperature range. The thermodynamic parameters for CR adsorption are presented in Table 3.
Table 3.
Thermodynamic parameters for CR adsorption on hemp biosorbent (pH = 4; Ci = 100 mg/L, P = atm).
The Gibbs free energy values (ΔG = −2.50 to −2.56 kJ/mol) confirm the spontaneous nature of the adsorption process across all studied temperatures (298–318 K). The negative enthalpy change (ΔH = −1.65 kJ/mol) indicates an exothermic process, while the positive entropy change (ΔS = 2.85 J/mol·K) suggests increased disorder at the solid-liquid interface during adsorption. These thermodynamic characteristics are consistent with physical adsorption mechanisms dominated by electrostatic interactions between CR’s sulfonate groups and protonated surface sites on the biosorbent. The slight increase in spontaneity with temperature (more negative ΔG° values at higher temperatures) reflects the entropy-driven nature of the process, likely due to water molecule displacement and increased mobility of adsorbed CR molecules. The weak enthalpy change further supports the predominance of physisorption rather than chemical bonding in the adsorption mechanism. These results were derived from Van ’t Hoff plots (lnK vs. 1/T) showing excellent linear correlation (R2 > 0.98), confirming the thermodynamic consistency of the adsorption process. The observed thermodynamic behavior aligns with the known composition of hemp biosorbent and its interaction mechanisms with anionic dyes.
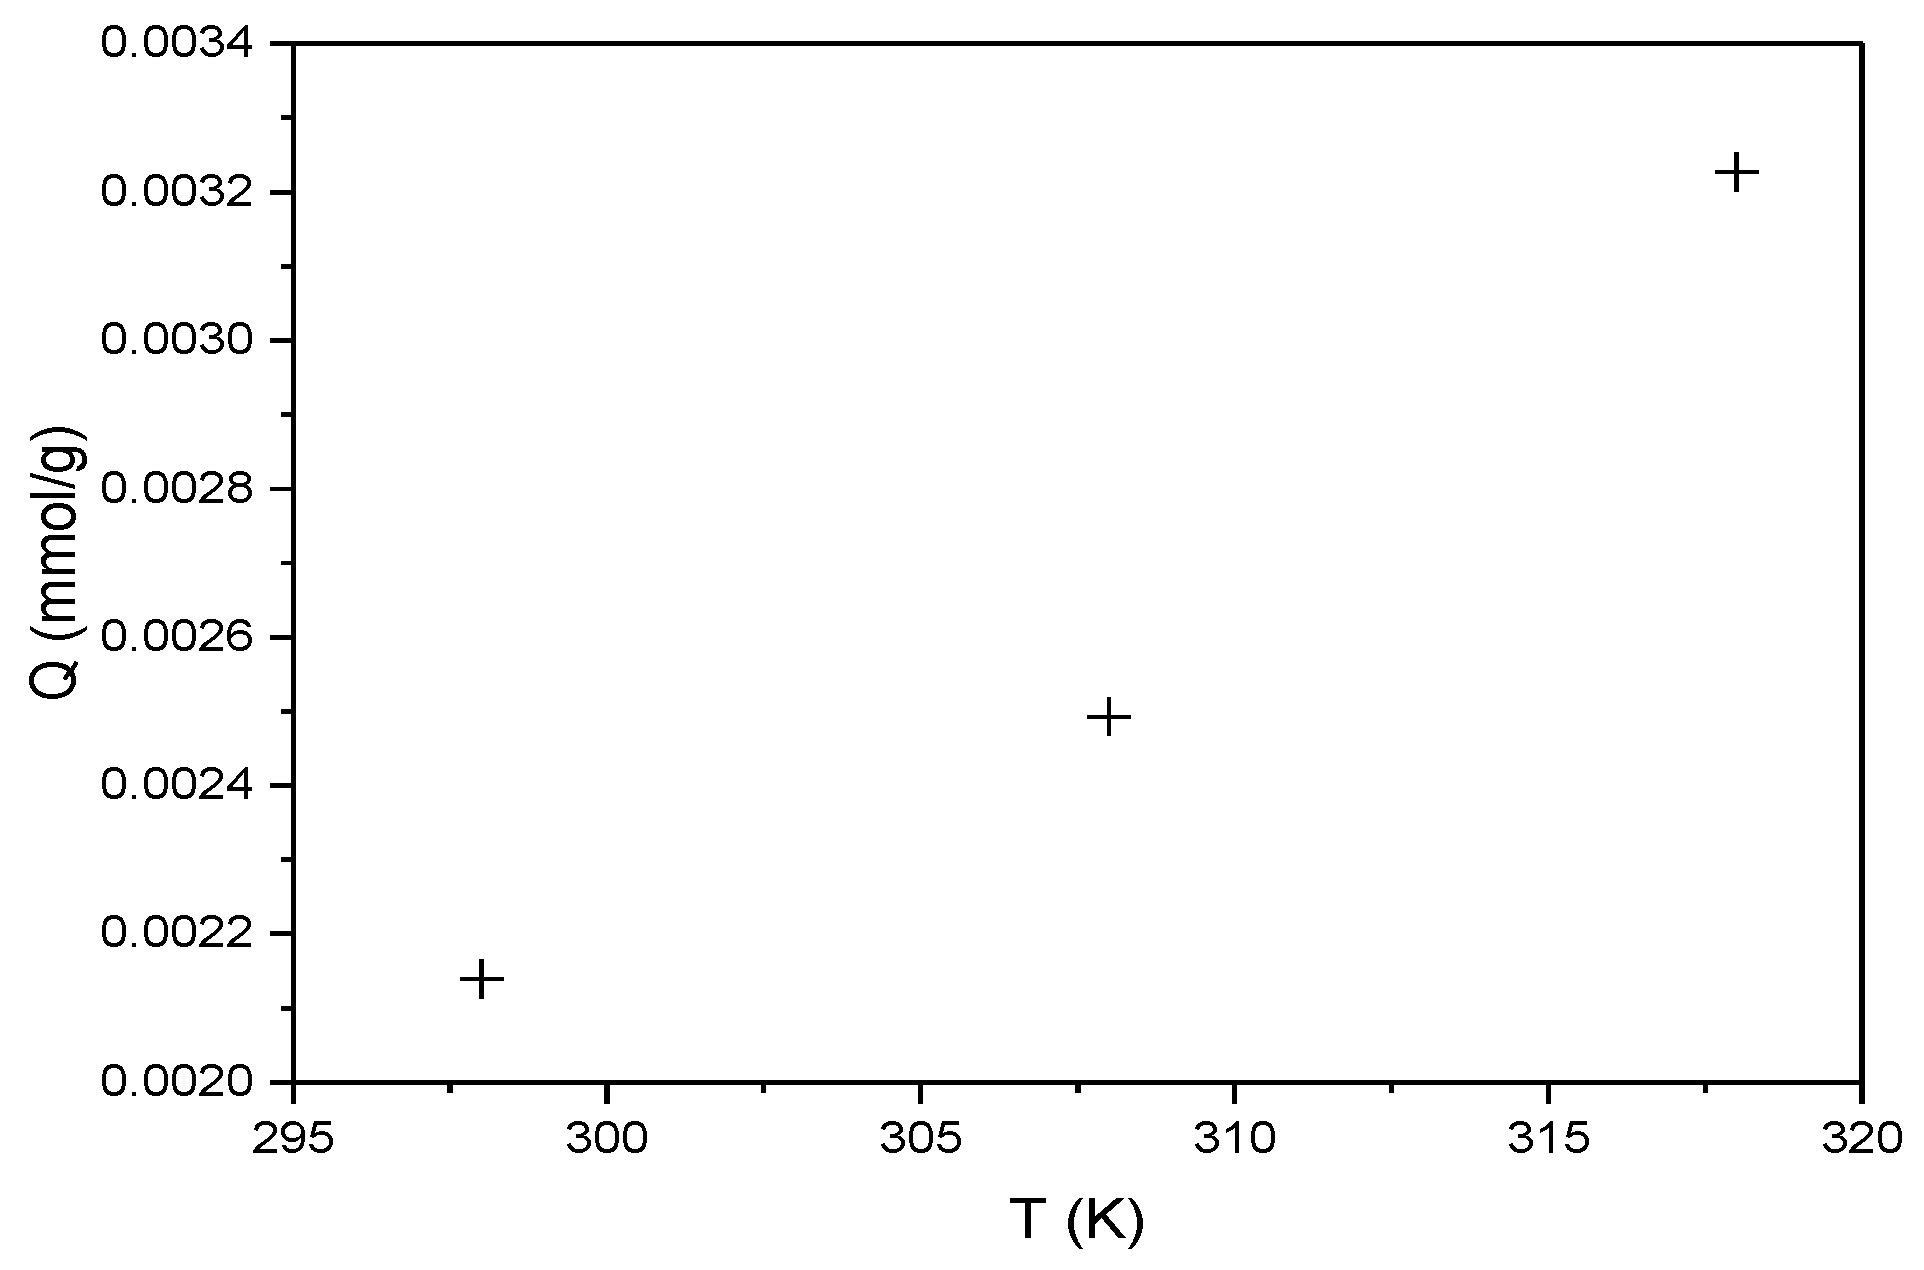
The same thermodynamic analysis principle was applied to RBBR adsorption on the hemp biosorbent. Figure 13 shows the temperature dependence of sorption capacity.
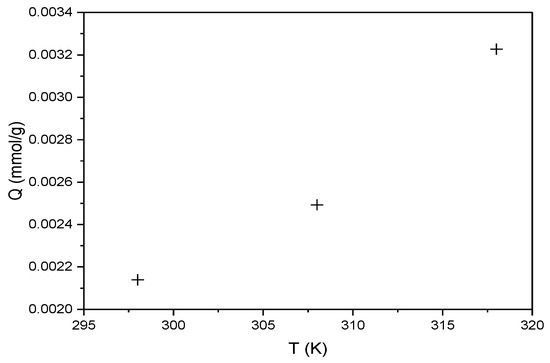
Figure 13.
Effect of temperature on the sorption capacity of hemp biosorbent for RBBR (expressed in mmol/g; pH = 5, biosorbent dosage = 0.1 g, Ci = 100 mg/L, t = 60 min).
Figure 14 displays the Van ’t Hoff plot (lnK vs. 1/T) used to determine the thermodynamic parameters for RBBR adsorption.
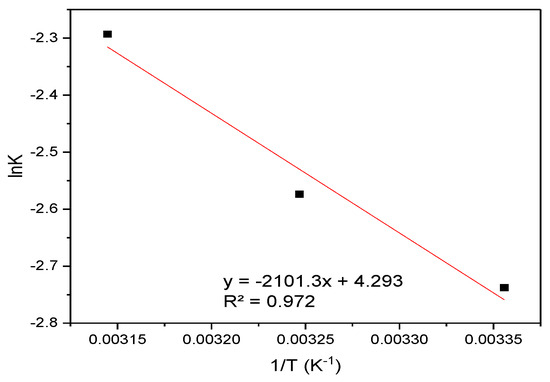
Figure 14.
Van ’t Hoff analysis: plot of lnK vs. 1/T for the sorption of RBBR onto hemp biosorbent.
The corresponding calculated values are summarized in Table 4.
Table 4.
Thermodynamic parameters for RBBR adsorption on hemp biosorbent (pH = 5; Ci = 100 mg/L).
The adsorption of RBBR on hemp biosorbent is spontaneous (ΔG° = −3.38 to −3.46 kJ/mol), exothermic (ΔH = −2.10 kJ/mol), and entropy-driven (ΔS = 4.29 J/mol·K).
- Molecular modeling
The computational results (Table 5) directly explain the experimental observations: Congo Red’s stronger adsorption (−7.5 kcal/mol binding energy) correlates with its higher uptake (Qmax = 4.47 mg/g), while RBBR’s weaker binding (−5.4 kcal/mol) corresponds to its lower capacity (Qmax = 2.44 mg/g) with both systems showing entropy-driven binding (ΔS > 0) that confirms the molecular displacement mechanisms observed in docking studies. This difference in affinity can be attributed to the nature of the molecular interactions each dye forms with cellulose.
Table 5.
Calculated binding energies and interaction types between dyes CR/RBBR and cellulose.
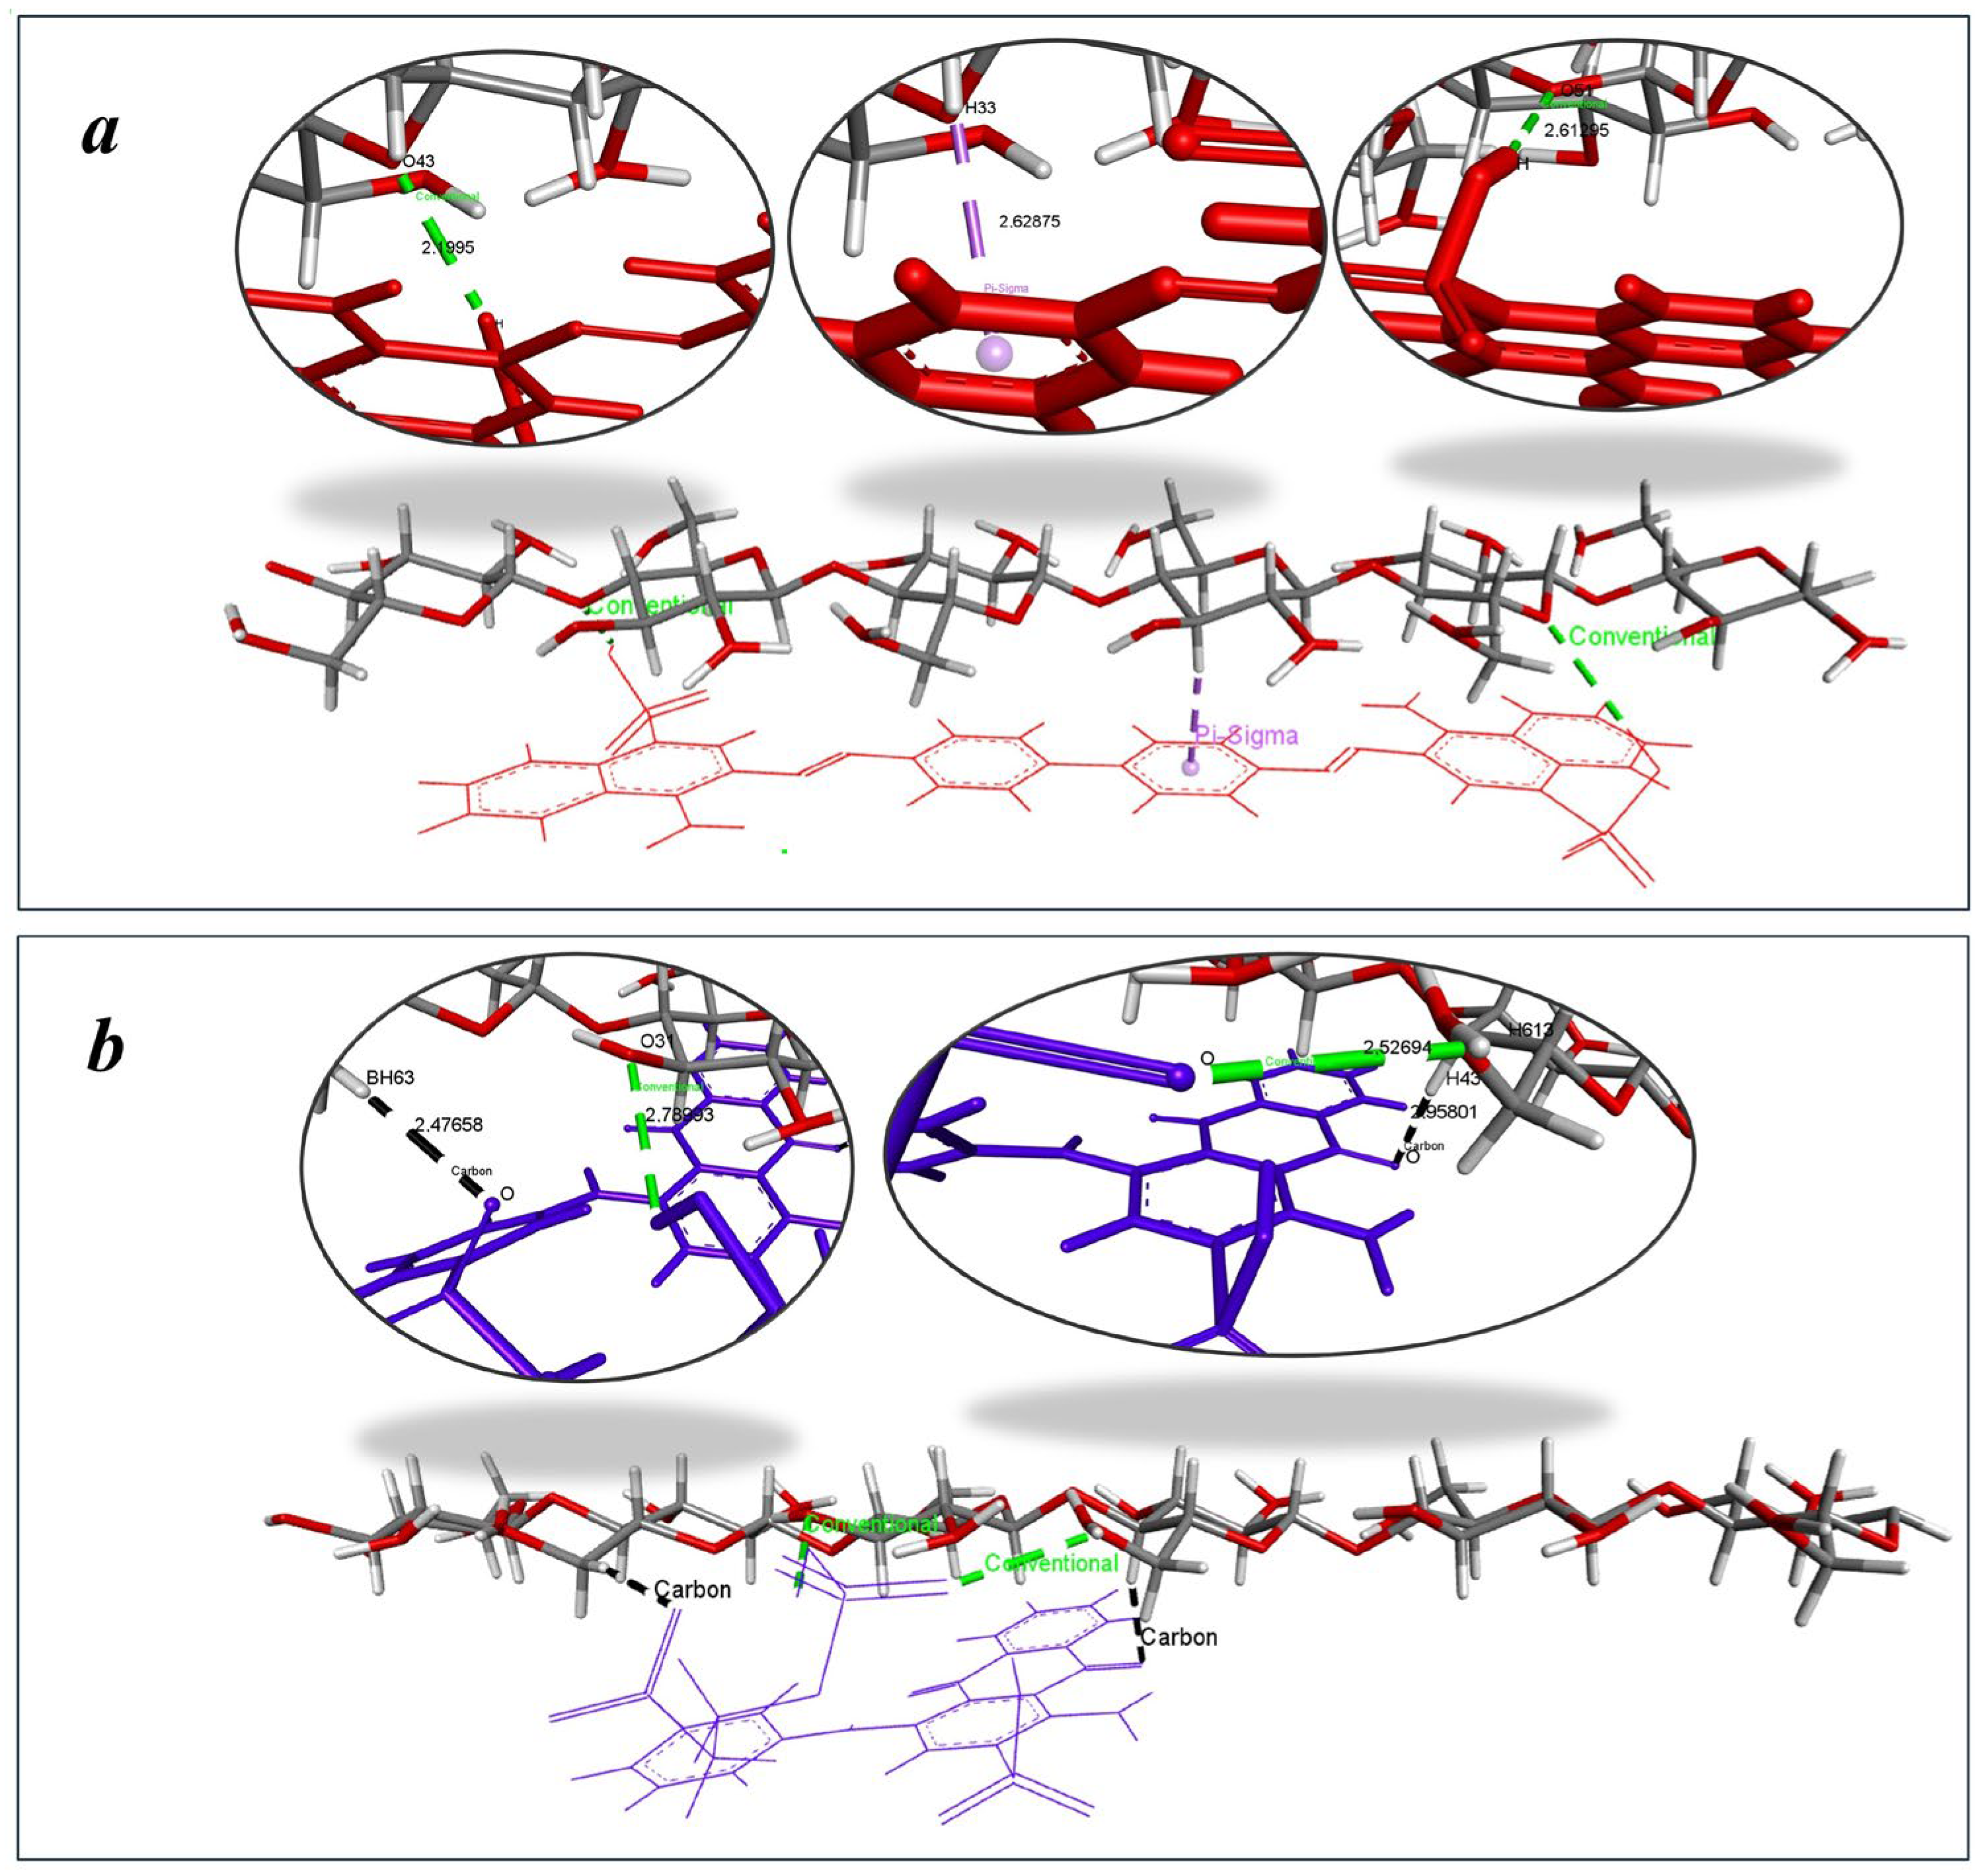
The biphenyl core of CR creates a planar, extended π-conjugated system spanning approximately 15 Å, providing an ideal electronic architecture for strong interactions with cellulose’s glucose units. CR stabilizes its complex through conventional hydrogen bonds and π–σ interactions involving its biphenyl moiety (Figure 15a). These interactions are generally stronger and more directional, contributing significantly to binding stability, with bond distances ranging from 2.199 to 2.613 Å for hydrogen bonds and 2.628 Å for π–σ interactions, indicating close and stable contact with the cellulose surface. In contrast, RBB interacts with cellulose primarily through C–H…π interactions (Figure 15b) from its anthraquinone moiety and conventional hydrogen bonds involving its sulfonate group. RBBR’s anthraquinone core exhibits a more rigid three-dimensional structure limiting its ability to maximize surface contact with cellulose’s linear chains. C–H…π interactions are typically weaker than π–σ interactions, which likely accounts for the less stable complex and higher binding energy. The observed interaction distances—2.477 to 2.958 Å for C–H…π and 2.527 Å to 2.789 Å for hydrogen bonds—further support the reduced binding strength and sorption efficiency of RBBR. This combined analysis clearly demonstrates how specific molecular interactions (hydrogen bonds, π-σ, and C-H∙∙∙π) control the macroscopic sorption performance of each dye on hemp biosorbent.
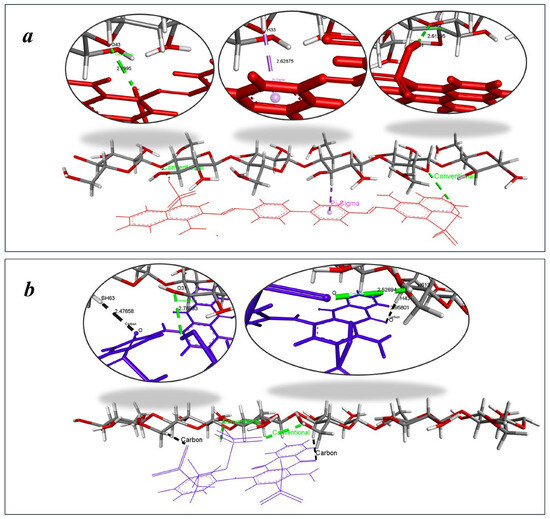
Figure 15.
Dominant binding interactions of (a) CR and (b) RBBR with active sites on cellulose.
These results not only explain how substances are absorbed at a level but also offer a practical way to choose or create materials that can remove certain types of dyes in actual wastewater treatment situations more effectively Predictive insights into the connection between bonding energy and interaction types allow for specific enhancements to cellulose-based products to increase their efficiency in removing contaminants. For example, improving the surface properties to encourage interactions like π–π or π–σ could greatly enhance the adsorption of aromatic dyes such, as Congo Red.
4. Conclusions
Unmodified industrial hemp demonstrates moderate but practically relevant adsorption capacities for Congo Red (Qmax = 4.47 mg/g) and Remazol Brilliant Blue R (Qmax = 2.44 mg/g). While these values are lower than specialized adsorbents, hemp offers compelling sustainable advantages as a renewable agricultural byproduct. Compared to other farm residues, raw hemp offers superior structural integrity and stability in aqueous systems, along with native -OH/-COOH functional groups enabling chemical-free dye binding. Versus processed adsorbents, it provides significant cost and energy savings and lower CO2 emissions due to eliminated activation requirements.
The adsorption mechanisms of the two dyes differ significantly. CR binding is governed by electrostatic interactions and π-σ stacking, with a binding energy of −7.5 kcal/mol, facilitated by its biphenyl moiety. In contrast, RBBR adsorption primarily involves weaker C−H∙∙∙π interactions (−5.4 kcal/mol). Thermodynamic analysis revealed that both processes are spontaneous (ΔG < 0), exothermic (ΔH ≈ −2 kJ/mol), and entropy-driven (ΔS > 0). Kinetic studies further showed that CR adsorption follows a pseudo-first-order model, while RBBR adsorption aligns with the Elovich model.
This molecular-level understanding highlights the critical roles of cellulose’s hydroxyl groups and lignin’s aromatic domains in enabling distinct binding modes. Such insights pave the way for the targeted optimization of biosorbents for specific pollutant classes, advancing the development of cost-effective and sustainable water treatment solutions.
Author Contributions
L.S.: conceptualization, methodology, writing—original draft, visualization. D.A.: formal analysis, investigation, writing—review and editing. I.J.: formal analysis, investigation, writing—review and editing. M.M.: methodology, writing—review and editing. R.S.: methodology, visualization, investigation, writing—review and editing. J.P.: validation, formal analysis, investigation, writing—review and editing. All authors have read and agreed to the published version of the manuscript.
Funding
This work was supported by the European Union.
Institutional Review Board Statement
Not applicable.
Informed Consent Statement
Not applicable.
Data Availability Statement
Data presented in this article are available at request from the corresponding author.
Conflicts of Interest
The authors declare no conflicts of interest.
References
- Kishor, R.; Purchase, D.; Saratale, G.D.; Saratale, R.G.; Ferreira, L.F.R.; Bilal, M.; Chandra, R.; Bharagava, R.N. Ecotoxicological and health concerns of persistent coloring pollutants of textile industry wastewater and treatment approaches for environmental safety. J. Environ. Chem. Eng. 2021, 9, 105012. [Google Scholar] [CrossRef]
- Chandanshive, V.V.; Kadam, S.; Rane, N.; Jeon, B.-H.; Jadhav, J.; Govindwar, S. In situ textile wastewater treatment in high rate transpiration system furrows planted with aquatic macrophytes and floating phytobeds. Chemosphere 2020, 252, 126513. [Google Scholar] [CrossRef] [PubMed]
- Lellis, B.; Fávaro-Polonio, C.Z.; Pamphile, J.A.; Polonio, J.C. Effects of textile dyes on health and the environment and bioremediation potential of living organisms. Biotechnol. Res. Innov. 2019, 3, 275–290. [Google Scholar] [CrossRef]
- Abe, F.R.; Soares, A.M.; de Oliveira, D.P.; Gravato, C.A. Toxicity of dyes to zebrafish at the biochemical level: Cellular energy allocation and neurotoxicity. Environ. Pollut. 2018, 235, 255–262. [Google Scholar] [CrossRef]
- Gupta, V.K. Suhas Application of low-cost adsorbents for dye removal—A review. J. Environ. Manag. 2009, 90, 2313–2342. [Google Scholar] [CrossRef] [PubMed]
- Crini, G.; Lichtfouse, E. Wastewater treatment: An overview. In Green Adsorbents for Pollutant Removal; Crini, G., Lichtfouse, E., Eds.; Springer: Cham, Switzerland, 2018; pp. 1–21. [Google Scholar] [CrossRef]
- Miklos, D.B.; Remy, C.; Jekel, M.; Linden, K.G.; Drewes, J.E.; Hübner, U. Evaluation of advanced oxidation processes for water and wastewater treatment—A critical review. Water Res. 2018, 139, 118–131. [Google Scholar] [CrossRef]
- Gogate, P.R.; Pandit, A.B. A review of imperative technologies for wastewater treatment I: Oxidation technologies at ambient conditions. Adv. Environ. Res. 2004, 8, 501–551. [Google Scholar] [CrossRef]
- Nidheesh, P.; Gandhimathi, R. Trends in electro-Fenton process for water and wastewater treatment: An overview. Desalination 2012, 299, 1–15. [Google Scholar] [CrossRef]
- Boczkaj, G.; Fernandes, A. Wastewater treatment by means of advanced oxidation processes at basic pH conditions: A review. Chem. Eng. J. 2017, 320, 608–633. [Google Scholar] [CrossRef]
- Ali, H. Biodegradation of synthetic dyes—A review. Water Air Soil Pollut. 2010, 213, 251–273. [Google Scholar] [CrossRef]
- Khan, R.; Bhawana, P.; Fulekar, M.H. Microbial decolorization and degradation of synthetic dyes: A review. Rev. Environ. Sci. Bio/Technol. 2013, 12, 75–97. [Google Scholar] [CrossRef]
- Srinivasan, S.; Sadasivam, S.K. Biodegradation of textile azo dyes by textile effluent non-adapted and adapted Aeromonas hydrophila. Environ. Res. 2021, 194, 110643. [Google Scholar] [CrossRef] [PubMed]
- Kyzas, G.Z.; Kostoglou, M. Green adsorbents for wastewaters: A critical review. Materials 2014, 7, 333–364. [Google Scholar] [CrossRef] [PubMed]
- Vijayaraghavan, K.; Yun, Y.-S. Bacterial biosorbents and biosorption. Biotechnol. Adv. 2008, 26, 266–291. [Google Scholar] [CrossRef]
- Fomina, M.; Gadd, G.M. Biosorption: Current perspectives on concept, definition and application. Bioresour. Technol. 2013, 160, 3–14. [Google Scholar] [CrossRef]
- Crini, G. Non-conventional low-cost adsorbents for dye removal: A review. Bioresour. Technol. 2006, 97, 1061–1085. [Google Scholar] [CrossRef] [PubMed]
- Nasuha, N.; Hameed, B. Adsorption of methylene blue from aqueous solution onto NaOH-modified rejected tea. Chem. Eng. J. 2011, 166, 783–786. [Google Scholar] [CrossRef]
- Momčilović, M.Z.; Vučić, M.R.; Meseldžija, S.; Velinov, N.; Suručić, L.; Bojić, A.L. Batch sorption dynamics and equilibrium for the capture of Ni(II) onto activated carbon developed from yellow dock (Rumex crispus). Biomass Conv. Bioref. 2024, 1–10. [Google Scholar] [CrossRef]
- Khelifa, N.; Aithamoudi, S.; Laoufi, N.A. Preparation and characterization of biosorbent of shrimp co products-based and its potential application in the removal of an anionic dye. Desalination Water Treat. 2022, 279, 195–202. [Google Scholar] [CrossRef]
- Anastopoulos, I.; Kyzas, G.Z. Agricultural peels for dye adsorption: A review of recent literature. J. Mol. Liq. 2014, 200, 381–389. [Google Scholar] [CrossRef]
- Liu, J.; Beckerman, J. Application of sustainable biosorbents from hemp for remediation of copper(II)-containing wastewater. J. Environ. Chem. Eng. 2022, 10, 107494. [Google Scholar] [CrossRef]
- Mongioví, C.; Morin-Crini, N.; Lacalamita, D.; Bradu, C.; Raschetti, M.; Placet, V.; Ribeiro, A.R.L.; Ivanovska, A.; Kostić, M.; Crini, G. Biosorbents from plant fibers of hemp and flax for metal removal: Comparison of their biosorption properties. Molecules 2021, 26, 4199. [Google Scholar] [CrossRef] [PubMed]
- Viscusi, G.; Napolitano, F.; Gorrasi, G. Modified hemp fibers as a novel and green adsorbent for organic dye adsorption: Adsorption, kinetic studies and modeling. Euro-Mediterr. J. Environ. Integr. 2024, 9, 591–604. [Google Scholar] [CrossRef]
- Al-Rashed, S.M.; Al-Gaid, A.A. Kinetic and thermodynamic studies on the adsorption behavior of Rhodamine B dye on Duolite C-20 resin. J. Saudi Chem. Soc. 2012, 16, 209–215. [Google Scholar] [CrossRef]
- Maruthapandi, M.; Kumar, V.B.; Luong, J.H.T.; Gedanken, A. Kinetics, isotherm, and thermodynamic studies of methylene blue adsorption on polyaniline and polypyrrole macro-nanoparticles synthesized by C-dot-initiated polymerization. ACS Omega 2018, 3, 7196–7203. [Google Scholar] [CrossRef]
- Aljeddani, G.S.; Alghanmi, R.M.; Hamouda, R.A. Study on the isotherms, kinetics, and thermodynamics of adsorption of crystal violet dye using Ag-NPs-loaded cellulose de-rived from peanut-husk agro-waste. Polymers 2023, 15, 4394. [Google Scholar] [CrossRef]
- Suručić, L.T.; Nastasović, A.B.; Onjia, A.E.; Janjić, G.V.; Rakić, A.A. Design of an amino-functionalized chelating macroporous copolymer poly(GMA-co-EGDMA) for the sorption of Cu(II) ions. J. Serb. Chem. Soc. 2019, 84, 1391–1404. [Google Scholar] [CrossRef]
- Suručić, L.T.; Janjić, G.V.; Rakić, A.A.; Nastasović, A.B.; Popović, A.R.; Milčić, M.K.; Onjia, A.E. Theoretical modeling of sorption of metal ions on amino-functionalized macroporous copolymer in aqueous solution. J. Mol. Model. 2019, 25, 177. [Google Scholar] [CrossRef]
- Langmuir, I. The adsorption of gases on plane surfaces of glass, mica and platinum. J. Am. Chem. Soc. 1918, 40, 1361–1403. [Google Scholar] [CrossRef]
- Freundlich, H.M.F. Über die Adsorption in Lösungen [On adsorption in solutions]. Z. Phys. Chemie 1906, 57, 385–470. [Google Scholar] [CrossRef]
- Temkin, M.I. Adsorption equilibrium and the kinetics of processes on nonhomogeneous surfaces and the interaction between adsorbed molecules. Zhurnal Fiz. Khimii 1941, 15, 296–332. [Google Scholar]
- National Center for Biotechnology Information. PubChem Compound Database. 2023. Available online: https://pubchem.ncbi.nlm.nih.gov/ (accessed on 16 February 2025).
- Land, H.; Humble, M.S. YASARA: A tool to obtain structural guidance in biocatalytic investigations. Methods Mol. Biol. 2018, 1685, 43–67. [Google Scholar] [CrossRef] [PubMed]
- CERMAV. PolySac3DB. 2023. Available online: https://polysac3db.cermav.cnrs.fr (accessed on 16 February 2025).
- Trott, O.; Olson, A.J. AutoDock Vina: Improving the speed and accuracy of docking. J. Comput. Chem. 2010, 31, 455–461. [Google Scholar] [CrossRef]
- van der Werf, H.M.G.; Harsveld van der Veen, J.E.; Bouma, A.T.M.; ten Cate, M. Quality of hemp (Cannabis sativa L.) stems as a raw material for paper. Ind. Crop. Prod. 1994, 2, 219–227. [Google Scholar] [CrossRef]
- Lu, Y.; Lu, Y.-C.; Hu, H.-Q.; Xie, F.-J.; Wei, X.-Y.; Fan, X. Structural characterization of lignin and its degradation products with spectroscopic methods. J. Spectrosc. 2017, 2017, 8951658. [Google Scholar] [CrossRef]
- Kavitha, D.; Namasivayam, C. Experimental and kinetic studies on methylene blue adsorption by coir pith carbon. Bioresour. Technol. 2007, 98, 14–21. [Google Scholar] [CrossRef]
- Al-Harby, N.F.; Albahly, E.F.; Mohamed, N.A. Kinetics, isotherm and thermodynamic studies for efficient adsorption of Congo red dye from aqueous solution onto novel cyanoguanidine-modified chitosan adsorbent. Polymers 2021, 13, 4446. [Google Scholar] [CrossRef]
- Farias, K.C.S.; Guimarães, R.C.A.; Oliveira, K.R.W.; Nazário, C.E.D.; Ferencz, J.A.P.; Wender, H. Banana peel powder biosorbent for removal of hazardous organic pollutants from wastewater. Toxics 2023, 11, 664. [Google Scholar] [CrossRef]
- Zhang, Z.; Moghaddam, L.; O’hara, I.M.; Doherty, W.O. Congo Red adsorption by ball-milled sugarcane bagasse. Chem. Eng. J. 2011, 178, 122–128. [Google Scholar] [CrossRef]
- Annadurai, G.; Juang, R.; Lee, D. Use of cellulose-based wastes for adsorption of dyes from aqueous solutions. J. Hazard. Mater. 2002, 92, 263–274. [Google Scholar] [CrossRef]
- Rahmat, N.A.; Ali, A.A.; Salmiati; Hussain, N.; Muhamad, M.S.; Kristanti, R.A.; Hadibarata, T. Removal of Remazol Brilliant Blue R from Aqueous Solution by Adsorption Using Pineapple Leaf Powder and Lime Peel Powder. Water Air Soil Pollut. 2016, 227, 105. [Google Scholar] [CrossRef]


Disclaimer/Publisher’s Note: The statements, opinions and data contained in all publications are solely those of the individual author(s) and contributor(s) and not of MDPI and/or the editor(s). MDPI and/or the editor(s) disclaim responsibility for any injury to people or property resulting from any ideas, methods, instructions or products referred to in the content. |
© 2025 by the authors. Licensee MDPI, Basel, Switzerland. This article is an open access article distributed under the terms and conditions of the Creative Commons Attribution (CC BY) license (https://creativecommons.org/licenses/by/4.0/).