Abstract
Thermochromic microcapsules were synthesized and optimized using crystal violet lactone, bisphenol A, and decanol as the core materials, a dispersible cationic red dye as the color-modifying additive, and urea-formaldehyde resin as the wall material, based on orthogonal and single-factor experiments. The effects of the proportion of cationic red dye in the core material, the mass ratio of formaldehyde to urea, the emulsifier HLB value, and the core–wall mass ratio on yield, encapsulation rate, thermochromic ΔE, and formaldehyde release of microcapsules were systematically investigated. The results showed that the core–wall ratio was the key factor affecting the comprehensive performance of the microcapsules. Through the comparison of orthogonal and single-factor tests, 11# microcapsule was identified as having the best overall performance in terms of ΔE, and encapsulation rate. The ΔE value was increased by about 165% compared with the lowest-performing sample, significantly enhancing the thermochromic response. The encapsulation rate was improved by nearly 40%, effectively enhancing the encapsulation quality and core stability, with overall performance standing out. The best preparation process was to add 0.5% of the core material mass of dispersible cationic red dye, the mass ratio of formaldehyde and urea was 1.2:1, the HLB value of emulsifier was 10, and the core–wall ratio was 1:1.1. The yield of 11# microcapsules prepared under this condition was 31.95%, the encapsulation rate was 68%, the thermochromic ΔE was 9.292, and the formaldehyde release concentration was 1.381 mg/m3. Furthermore, 11# microcapsules with different addition levels were introduced into the UV primer to evaluate their effects on the mechanical and optical properties of the coating. The results showed that the addition of microcapsules weakened the gloss and light transmittance of the coating, increased the surface roughness, and decreased the elongation at break. When the addition amount was 5%, the coating exhibited the best overall performance: UV-visible light transmittance reached 91.92%, 60° gloss was 42.2 GU, elongation at break was 9.3%, and surface roughness was 0.308 μm. This study developed a purple thermochromic microcapsule system by regulating the dispersible dye content and interfacial conditions. In coating applications, the system exhibited a strong ΔE response and excellent overall performance, offering great advantages over existing similar systems in terms of color-change efficiency, ΔE enhancement, and coating adaptability.
1. Introduction
The development of intelligent material science has driven innovation in environmentally responsive functional coatings [1,2,3,4,5,6]. At present, color-changing systems based on external stimuli such as light, heat, and electricity have already found applications in multiple fields [7,8,9,10,11]. Thermochromic materials with controllable reactions and simple conditions have attracted extensive attention. Taking the ternary system composed of crystal violet lactone, bisphenol A, and fatty alcohol as an example, its reversible thermochromic properties can be effectively protected through microencapsulation technology, providing technical support for the development of durable intelligent coatings. Microcapsules feature a core–shell structure that protects functional core materials from environmental degradation [12]. UV coatings, as an environmentally friendly coating system, are characterized by low energy consumption and high efficiency [13,14]. Modified UV coatings have already demonstrated properties such as self-healing, antibacterial, and flame retardant [15,16]. However, the limited functionality of traditional UV coatings restricts its broader application in the field of smart home [17]. By integrating thermochromic microcapsules into UV resin matrix, a novel coating system with both rapid curing and intelligent color-changing capabilities can be constructed [18]. Microcapsule technology has the advantages of low cost and easy preparation [19,20]. A number of fossil-based and bio-based microcapsules have also been widely used in various aspects of daily life for a long time [21]. Microencapsulation technology is widely used in functional coatings, powder pharmaceuticals and food preservation [22,23]. Combined with microcapsule technology, UV coatings can achieve intelligent functions [24,25,26].
Spray drying, as an efficient and controllable microcapsule preparation technology, has been widely used in food, medicine, cosmetics, pesticides and functional materials in recent years [27,28,29]. The method is to mix the substance to be coated with the wall material into an emulsion or suspension and then atomize it. Under the action of hot air, the solvent is rapidly evaporated to form microcapsules, which has the advantages of fast preparation speed, simple operation, low cost and suitable for active substances with high thermal stability [30]. Especially in the loading of fragrances, vitamin, probiotics, natural pigment and heat-sensitive functional materials, the spray drying method shows a good encapsulation effect and release control ability [31]. da Silva Acácio et al. [32] microencapsulated the essential oil of S. terebinthifolius by spray drying maltodextrin and gum arabic as embedding agents and SiO2 as colloid adjuvant. The morphology of the microcapsules was analyzed by scanning electron microscope (SEM) and proved that the particles were regular spherical particles with a size ranging from 5 to 10 μm. Thermal stability of the microcapsules was studied by thermogravimetric analysis–differential scanning calorimetry (TGA-DSC), and the microcapsules remained stable at temperatures up to 200 °C. The microcapsules produced by spray drying were able to protect essential oils from external influences, such as thermal degradation. Takatani et al. [33] successfully prepared new microcapsules using ethyl laurate as the core material (phase change material; PCM) and gelatin as the shell. It was found that physical crosslinking of tannic acid was most effective in strengthening the shell under acidic to neutral pH conditions, and spray drying temperature of 120 °C was most suitable for producing well-dried microcapsules with minimal PCM loss. Currently, this technique has achieved certain progress in microcapsule particle size control, encapsulation efficiency improvement, and development of multifunctional wall materials. It has gradually become one of the mainstream processes for rapid drying and large-scale encapsulation of heat-sensitive substances, providing a strong support for the development and application of functional microcapsules [34,35,36].
However, the existing thermochromic microcapsule systems still face certain limitations in practical applications. For instance, insufficient encapsulation stability often leads to a shortened color-change lifetime, poor compatibility with coating compromises optical performance, and the high cost of some thermochromic dyes restricts their use in smart coatings. Conventional thermochromic systems are typically based on ternary components (chromophore, developer, and solvent) and lack regulation of auxiliary colorants, resulting in a narrow color-change range. In this study, dispersible cationic red dye was introduced as an auxiliary colorant. Its excellent lipophilicity and thermal responsiveness are expected to synergize with the ternary system to optimize the tunable color range and enhance the response toward the purple region. Moreover, as a cationic dye, it exhibits good dispersibility and outstanding color stability, enabling uniform distribution within the core material, which facilitates stronger core–wall interfacial bonding, improves the structural stability of microcapsules, and enhances compatibility with coating systems.
Thermochromic microcapsules were prepared using crystal violet lactone, bisphenol A, and decanol as the ternary core system, with urea–formaldehyde resin serving as the wall material, via in situ polymerization. The results confirmed that the obtained microcapsules exhibited certain thermochromic properties; however, the color-changing performance still required an improvement [37]. Therefore, the present study aimed to further optimize the preparation process of thermochromic microcapsules, with a particular focus on enhancing the color difference and thermochromic sensitivity. To achieve this, a cationic red dye with good dispersibility was introduced into the core system, and spray drying was employed for rapid drying treatment of the resulting microcapsule emulsion, leading to the construction of urea–formaldehyde-coated cationic red-ternary system thermochromic microcapsules. Orthogonal and single-factor experiments were conducted to systematically investigate the effects of the proportion of dispersible cationic red in the core material, the mass ratio of formaldehyde to urea, the HLB value of the emulsifier, and the core–wall ratio on the yield, encapsulation rate, thermochromic ΔE value, and formaldehyde emission of microcapsules. The results showed that the core–wall ratio was the key factor affecting the properties of the microcapsules. Furthermore, functional coatings with thermochromic properties were prepared by adding the optimized microcapsules into UV primer. The effects of different microcapsule contents on the optical and mechanical properties of the coatings were investigated. The research objective was to obtain microcapsules with superior thermochromic performance and to provide experimental evidence and theoretical support for an application in cross-color tone thermochromic systems and functional coatings.
2. Materials and Methods
2.1. Test Materials
The materials and equipment used in the test are shown in Table 1 and Table 2, respectively. The dispersible cationic red dye was a dark red powder dye produced with a composite dispersant, mainly composed of 3-amino-5-carboxy-1,2,4-triazole, and did not possess thermochromic properties. Bisphenol A was used as the color developer in the thermochromic system, functioning primarily to trigger color changes in response to temperature variations. During the synthesis of the microcapsules, the bisphenol A was completely encapsulated within the wall material, thereby avoiding direct exposure to the external environment and consequently reducing potential risks of human and environmental contact during application. The coating used in the experiments was a UV matte primer (HB-4301), provided by Jiangsu Haitian Technology Co., Ltd., Zhenjiang, China.

Table 1.
Test materials.
Table 2.
Test equipment.
2.2. Preparation Method of Microcapsules
The orthogonal experiment was designed based on four factors during the microcapsule preparation process: the mass fraction of cationic red in the core materials, the mass ratio of formaldehyde solution to urea (WF:WU), the HLB value of the emulsifier, and the core–wall ratio. A single-factor experiment was designed to verify the key influencing factor. The selection of factors and levels for the orthogonal experiment is shown in Table 3. The detailed layout of the orthogonal experiment is shown in Table 4. Table 5 and Table 6 are the material tables of orthogonal test and single-factor test, respectively. The mass ratio of emulsifier to core material was set at 1:1.5. To enhance the compactness and structural stability of the microcapsule, SiO2 and NaCl were added as auxiliary dispersants. The ionic strength of the solution was adjusted by NaCl, whereby the polymerization of the wall material was promoted and an adsorption layer was formed on the microcapsule surface, suppressing flocculation and contributing to improved encapsulation efficiency and wall integrity. Meanwhile, SiO2 was employed to enhance the dispersion stability of the core emulsion during high-speed stirring, effectively preventing stratification and agglomeration. Based on previous studies, the amounts of both additives were set at 14% of the core material mass [37].
Table 3.
Table of orthogonal test factor and level.
Table 4.
Table of orthogonal test detailed layout.
Table 5.
Materials of orthogonal test.
Table 6.
Materials of single-factor test.
The HLB value of the emulsification system in the experiments was calculated as follows: when the emulsifier was a combination of Triton X-100 and gum arabic powder, the HLB value was determined according to Equation (1); when the emulsifier was a combination of Span 80 and gum arabic powder, the HLB value was calculated using Equation (2). Here, A1 and B1 represent the mass ratios of the nonionic emulsifier in their respective systems, while A2 and B2 represent the ratios of gum arabic powder.
H = (A1 × 13.4 + A2 × 8.0)/(A1 + A2)
H = (B1 × 4.3 + B2 × 8.0)/(B1 + B2)
Take sample 10# as an example:
- Preparation and dispersion of core materials: The water bath was adjusted to 50 °C, and 80 g of decanol was added to a beaker. Then 4.8 g bisphenol A and 1.6 g crystal violet lactone were added with the mass ratio of crystal violet lactone: bisphenol A: decanol being 1:3:50. The mixture was stirred at 400 rpm for 1.5 h, followed by cooling to room temperature. The obtained product was the thermochromic core material, hereinafter also referred to as the thermochromic compound. The 5.37 g gum arabic and 3.16 g Triton X-100 were weighed as emulsifiers, and 0.06 g dispersible cationic red dye was added. Then 162.13 mL distilled water and 12.80 g thermochromic compounds were added. The system was adjusted to 65 °C and stirred at a relatively high speed for 30 min. Then ultrasonic emulsification was carried out for 5 min.
- Preparation of wall materials: According to the material list, 8.00 g urea and 12.62 g formaldehyde were weighed. After adding 256.00 mL distilled water, triethanolamine was added dropwise to adjust the system pH to 8.5. The beaker was sealed, the temperature was adjusted to 70 °C, and the mixture was maintained at 300 rpm for 1 h to pre-polymerize the wall material.
- Preparation of microcapsules: The urea-formaldehyde prepolymer was added dropwise into the core material emulsion at a stirring speed of 500 rpm and a temperature of 35 °C, followed by the addition of 1.79 g SiO2 and 1.79 g NaCl. The 8% citric acid monohydrate solution was added dropwise to adjust the pH of the system to 2.5, and the mixture was stirred for 1 h. Then the temperature was then raised to 68 °C, the stirring speed was reduced to 250 rpm, and after stirring for 30 min, the microcapsule emulsion was left to stand at room temperature. The microcapsule emulsion was sealed and left to stand for 24 h, with a portion used for formaldehyde emission testing and the remainder subjected to spray drying. The inlet temperature of the spray dryer was set to 130 °C, and the peristaltic pump speed was set to 100 mL/h. After the machine was preheated and the outlet temperature stabilized around 60 °C, the drying process began. The spray-dried light purple powder constituted the final microcapsule product.
2.3. Preparation Method of the Paint Film:
The dimensions of the paint film mold were 50 mm × 50 mm × 20 mm, and the list of materials used for the UV primer mixture is shown in Table 7.
Table 7.
Materials table of blend UV primer.
Orthogonal and single-factor experiments: The 0.30 g thermochromic microcapsules was added to the UV primer, maintaining the total mass of microcapsules and UV primer at 1.00 g. After thorough mixing, the mixture was poured into the paint film mold. After the mixed primer was naturally leveled, the mold was placed on the conveyor belt of the single-lamp curing machine, with the conveyor speed set to 0.01 m/s and the curing time approximately 1 min. After curing, the paint film was demolded for color-change performance testing.
Paint film test: The optimal microcapsules obtained from the single-factor test were added to the UV primer at the addition amounts of 0%, 5%, 10%, 15%, 20% and 25%. The total mass of thermochromic microcapsules and UV primer was kept at 1.00 g, and the mixture was thoroughly mixed and poured into the paint film mold, or the total mass was kept at 0.50 g and coated on a glass plate. After the primer mixture had leveled naturally, the mold was placed on the conveyor belt of the single-lamp curing machine, and the conveying speed was adjusted to 0.01 m/s, and the curing time was about 1 min. After curing, the paint film was demolded for optical and mechanical performance testing, with the paint film without microcapsules serving as the blank control group.
2.4. Testing and Characterization
2.4.1. Yield and Encapsulation Rate Test
The yield was denoted as P. The mass of the dried microcapsules obtained was denoted as mp. The total mass of the main components of the core and wall materials used to prepare the sample was denoted as mr. The yield was calculated according to Equation (3).
P = (mp/mr) × 100%
The encapsulation rate was denoted as Pc. Microcapsules with mass m1 was ground thoroughly and placed into a beaker. The sample was soaked in ethanol and heated in 60 °C oven for 2 h. The mixture was stirred thoroughly every 15 min using a glass rod. After the reaction, the mixture was washed and vacuum-filtered with anhydrous ethanol. The filtered residue was then dried in a 60 °C oven. The mass of the dried residue was recorded as m2. The encapsulation rate was calculated according to Equation (4).
Pc = [(m1 − m2)/m1] × 100%
2.4.2. Color-Changing Performance and Formaldehyde Emission Test
Color-changing performance: The prepared paint films were placed in a refrigerator and cooled for a period of time to ensure the microcapsules were sufficiently chilled. A portable colorimeter was used to record the L, a, and b values of the coating at −20 °C [38]. Each sample was tested four times under low-temperature conditions. Then, after being heated in a 60 °C oven for a period of time, the same four tests were performed to obtain the L, a, and b values of the coating at high temperature. The color difference was calculated based on the average of the four test values at the two temperatures. Since the UV primer itself does not have thermochromic properties, the experimental results can be attributed to the color-changing performance of the microcapsules. The L value represents the brightness-darkness value of the sample, the a value represents the red-green value, and the b value represents the yellow-blue value [39,40]. The test data of the paint film at high temperature were denoted as L1, a1, and b1, and those at low temperature were denoted as L2, a2, and b2. The color difference ΔE was calculated according to Equation (5), where ΔL = L2 − L1, Δa = a2 − a1, Δb = b2 − b1.
ΔE = [(ΔL)2 + (Δa)2 + (Δb)2]1/2
Formaldehyde emission: The 0.50 g of the microcapsule emulsion was placed into a sealed 250 mL glass beaker, quickly capped, and allowed to stand at room temperature (25 ± 2 °C) for 24 h. An air quality detector was used to measure the formaldehyde concentration inside the beaker during the experiment. The detectable concentration range for HCHO formaldehyde testing was 0–1.999 mg/m3. Each sample was tested independently four times, and the HCHO concentration values were recorded. The results reflect the differences in free formaldehyde levels under various preparation conditions.
2.4.3. Normalization Analysis
To comprehensively evaluate the overall performance of the prepared thermochromic microcapsules, four parameters—yield rate, encapsulation rate, ΔE, and formaldehyde emission—were subjected to normalization analysis. During the weighted normalization process, all experimental data were first converted into positive indicators and standardized using the maximum–minimum method. The normalized values were calculated according to Equation (6), where n represents the normalized indicator value, nx denotes the original experimental value of sample x under the given indicator, and nmin and nmax refer to the minimum and maximum values of that indicator among all samples, respectively. After this transformation, all indicators were linearly mapped onto the [0, 100] range, facilitating cross-comparison.
n = (nx − nmin)/(nmax − nmin) × 100
On this basis, to more accurately reflect the importance of each indicator in the practical application of microcapsules, weighting coefficients (wi) were introduced to process the different indicators. The final comprehensive score was calculated according to Equation (7), where S denotes the overall performance score of a sample, nj is the normalized value of the j-th sample under a given indicator, wi represents the weight of the i-th indicator, and N is the total number of indicators.
Considering the research objectives and application requirements of thermochromic microcapsules, the weighting scheme was determined as follows: the ΔE directly characterizes the thermochromic performance and serves as the core indicator for evaluating the functionality of microcapsules; therefore, it was assigned the highest weight of 0.35. The encapsulation rate reflects the structural integrity and stability of the microcapsules, which are critical to maintaining functionality and prolonging service life, and was thus assigned a weight of 0.30. Formaldehyde emission represents the environmental safety of the material, closely related to practical applications and ecological requirements, and was given a weight of 0.20. Yield rate reflects the feasibility and efficiency of the preparation process, playing a role in enabling large-scale production, but its relative importance is lower compared with functionality and environmental safety; therefore, it was assigned a weight of 0.15. This weighting method ensures the comparability of multiple indicators and comprehensively reflects the overall level of performance, environmental safety, and process feasibility, thereby providing a more scientific basis for selecting the optimal microcapsules.
2.4.4. Microscopic Morphology Test
Optical microscopy (OM): An appropriate amount of the sample was placed on a glass slide and covered with a coverslip. The slide was then positioned on the observation stage of an optical microscope and examined under appropriate magnification.
Scanning electron microscopy (SEM): An appropriate amount of the sample was fixed onto a sample plate using double-sided tape for gold spraying treatment. After gold spraying treatment, the sample plate was placed on the observation stage inside the SEM chamber for vacuuming. Once the pressure reached the required level, the sample was observed under suitable magnification.
2.4.5. Chemical Composition Test
The chemical composition of the prepared microcapsules and paint films was analyzed using a Fourier-transform infrared (FTIR) spectrometer.
2.4.6. Optical Performance Test
Gloss: The gloss of the paint film was measured using a glossmeter. The gloss values were recorded under three different incident angles (20°, 60°, and 85°) to compare the differences [41].
Transmittance: The light transmittance of the paint film in the visible wavelength range was measured using a UV spectrophotometer. Transmittance refers to the ratio between the actual intensity of light that passes through a medium and the original light intensity, typically expressed as a percentage.
2.4.7. Mechanical Performance Test
Elongation at break: The prepared paint film was cut into standard dimensions, and both ends were clamped using a universal testing machine [42,43,44]. The film was stretched at a rate of 0.5 mm/min until it fractured [45]. The elongation at break of the paint film was calculated according to Equation (8), where e represents the elongation at break, L0 is the initial distance between the upper and lower clamps when the film is taut, and L′ is the distance between the clamps at the point of fracture.
e = [(L′ − L0)/L0] × 100%
Roughness: The surface roughness of the paint films was measured using a roughness tester, and the recorded values were used to analyze the variation trends in roughness among different coating samples [46,47,48,49].
3. Results and Discussion
3.1. Analysis of Microcapsule Preparation Results
3.1.1. Analysis of Microcapsule Yield and Encapsulation Rate
The yield analysis of microcapsules in the orthogonal experiment is shown in Table 8. Among the samples, Sample 5# exhibited the highest yield at 46.01%, followed by Sample 7# with a yield of 45.91%, and Sample 4# with a yield of 43.91%. The lowest yield was observed in Sample 2#, which was only 27.09%. The proportion of cationic red in the core materials had the greatest influence on the microcapsule yield. The order of influence of the four factors was A > B > C > D. The optimal synthesis condition for higher yield was A2B1C3D1. The analysis of variance for yield is presented in Table 9. The ANOVA results indicated that all four factors had a significant effect on the microcapsule yield rate.
Table 8.
Analysis on the yield rate of microcapsules by orthogonal test.
Table 9.
Analysis of variance table for yield rate.
The encapsulation rate analysis of microcapsules in the orthogonal experiment is shown in Table 10. Samples 1# and 4# exhibited the highest encapsulation rate, reaching 68%. The mass ratio of formaldehyde to urea had the greatest influence on the encapsulation rate of the microcapsules. The order of influence of the four factors was B > C = D > A. The optimal synthesis condition for higher encapsulation rate was A1B1C2D1. As the WF:WU ratio decreased, it became increasingly difficult for the capsule wall to form. The analysis of variance for encapsulation efficiency is shown in Table 11. The ANOVA results indicated that factor A had a p-value > 0.05 and thus showed no significant effect on the microcapsule encapsulation rate. Therefore, when designing the single-factor experiment, factor A was first excluded as a variable. Factors B, C, and D all exhibited significant effects on the encapsulation rate of the microcapsules.
Table 10.
Analysis of microcapsules encapsulation rate by orthogonal test.
Table 11.
Analysis of variance table for encapsulation rate.
3.1.2. Analysis of Color-Changing Performance and Formaldehyde Emission of Microcapsules
The results of color difference and formaldehyde emission from the microcapsules in the orthogonal experiment are shown in Table 12. As the temperature gradually increased from low temperature, the color of the microcapsules changed from dark purple to light purple gradually. With the rise in temperature, ΔE values generally increased, indicating that the microcapsules had thermochromic performance. Heating–cooling cycle experiments were further conducted to monitor the ΔE variation during the cooling process. The results, as shown in Table 13, indicated that the color change of the microcapsules exhibited a certain degree of reversibility and cycling stability, with the ΔE trend remaining stable after multiple cycles. Sample 5# showed the highest ΔE value of 10.568, demonstrating the best thermochromic performance. This was followed by sample 3# with a ΔE of 9.228, and Sample 8# with a ΔE of 7.351. Regarding formaldehyde emission, Sample 9# exhibited the lowest emission at 1.291 mg/m3, followed by Sample 1# and 7#, both at 1.303 mg/m3. However, the formaldehyde emission of all samples was significantly higher than international safety standards. Compared with the limit set by the World Health Organization (WHO) indoor air quality guidelines (0.1 mg/m3), the release level was markedly higher; it also exceeded the residential and public building air quality standards (maximum allowable concentration of 0.05 mg/m3 and daily average concentration of 0.01 mg/m3) [50,51,52]. This indicated that the current microcapsule system still required further optimization in terms of environmental safety. To reduce formaldehyde emissions, future studies could explore the incorporation of components such as chitosan, which has formaldehyde adsorption capability, or the use of green wall materials with low free formaldehyde content to partially replace urea-formaldehyde resin, thereby enhancing the environmental performance of the material.
Table 12.
The results of microcapsules ΔE and formaldehyde emission by orthogonal test.
Table 13.
The results of microcapsules chromaticity values and ΔE with decreasing temperature.
Table 14 presents the analysis of the color difference results of microcapsules from the orthogonal experiment. The emulsifier HLB value (C) had the most significant influence on the ΔE variation in the microcapsules. The order of influence among the four factors was C > D > B > A. The synthesis condition under the optimal ΔE was A3B2C3D3. The HLB value of the emulsifier had a significant impact on the microcapsule ΔE, primarily because it strongly influenced the emulsification process and the integrity of the microcapsule structure. At low HLB values, poor emulsification led to larger and uneven emulsion droplets, resulting in incomplete encapsulation and weakened thermochromic performance. An appropriate HLB value helped form a stable emulsion system, ensuring uniform dispersion and effective encapsulation of the thermochromic material, thereby enhancing the color-change response, reflected in a higher ΔE. Conversely, excessively high HLB values may lead the system overly hydrophilic, impairing wall material film formation and similarly reducing color-change performance. Therefore, at an HLB of 10, the microcapsule performance was balanced and ΔE reached its maximum. The analysis of variance for ΔE is shown in Table 15. The ANOVA results indicated that factor A had a p-value > 0.05 and thus showed no significant effect on the ΔE of the microcapsules. Factors B, C, and D all exhibited significant effects on the microcapsules ΔE.
Table 14.
Analysis on the ΔE results of microcapsules by orthogonal test.
Table 15.
Analysis of variance table for ΔE results.
Since formaldehyde emission is a negative indicator, directly including it in the comprehensive evaluation would lead to biased results. Therefore, in this study, its values were converted into positive parameters by taking the difference from the maximum permissible limit of the detection method (1.999 mg/m3). This transformation not only ensures comparability among indicators of different parameters but also facilitates unified evaluation after normalization. Within this framework, the lower the formaldehyde release, the larger the difference obtained, and thus the higher the normalized score, indicating better environmental performance of the material. The analysis of formaldehyde emission from microcapsules in the orthogonal experiment is shown in Table 16. The core–wall ratio had a significant impact on the formaldehyde emission during microcapsule preparation. The order of influence among the four factors was D > B > C > A. The optimal synthesis condition for achieving low formaldehyde emission was A3B1C3D1, indicating that formulations with lower formaldehyde content are more environmentally friendly. The analysis of variance for formaldehyde emission is shown in Table 17. The ANOVA results indicated that all four factors had significant effects on the formaldehyde emission of the microcapsules.
Table 16.
Analysis on the formaldehyde emission by orthogonal test.
Table 17.
Analysis of variance table for formaldehyde emission.
3.1.3. Analysis of Normalized Orthogonal Experiment Results and Single-Factor Comprehensive Performance of Microcapsules
The weighted normalization analysis was performed on the experimental data of microcapsules prepared through orthogonal experiments, converting each index such as yield, encapsulation rate, color difference (ΔE), and formaldehyde emission into a standardized percentage scale using the range method. This enabled comprehensive evaluation on a unified scale. After weighted normalization, the final comprehensive scoring results are shown in Table 18. Among them, Sample 5# achieved the highest score of 86.67, demonstrating the best overall performance, particularly excelling in color difference between high and low temperatures. Sample 7# ranked second, with a total score of 66.10, indicating a relatively high comprehensive performance as well. Figure 1 shows the normalized scores radar chart of microcapsules by orthogonal test, which provides a clear visual comparison of the comprehensive advantages and shortcomings of each sample.
Table 18.
Normalized score of orthogonal test results.
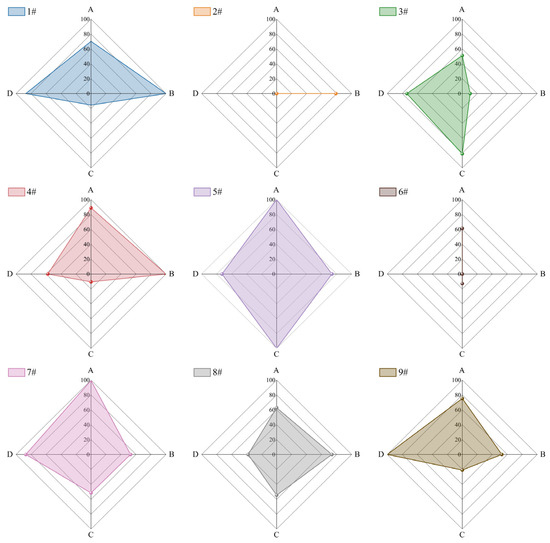
Figure 1.
Normalized scores radar chart of microcapsules by orthogonal test: (A) yield rate, (B) encapsulation rate, (C) ΔE, (D) formaldehyde emission.
The analysis results of the average total score with equal weighting in the orthogonal experiment are shown in Table 19. Range analysis indicated that the core–wall mass ratio had the most significant effect on the comprehensive score. The order of influence among the four factors was D > C > B > A, and the optimal synthesis condition for the microcapsules was A3B1C3D1. That was, 0.5% cationic red dye was added, the ratio of formaldehyde to urea was 1.2:1, the ratio of core–wall was 1:1, and the HLB value of emulsifier was 10. At the same time, in the orthogonal experiment, the microcapsule score showed a trend of first decreasing and then increasing with the reduction in the core–wall ratio. Therefore, on this basis, the single-factor experiment was designed using the same process, with the core–wall ratio range set between 1:1 and 1:1.4 to further verify its influence on microcapsule performance. Preliminary experiments revealed that when the core–wall ratio was below 1:1, the microcapsules were difficult to form stably, and both encapsulation efficiency and structural integrity decreased; therefore, this range was not included in the present tests. Microcapsules numbered 10# to 14# correspond to core–wall ratios of 1:1, 1:1.1, 1:1.2, 1:1.3, and 1:1.4, respectively.
Table 19.
Analysis of factors affecting the score of orthogonal tests of microcapsule samples.
Table 20 and Table 21 present the comprehensive performance results of microcapsules from the single-factor experiments, along with their normalized scores. Figure 2 shows the normalized score radar chart of microcapsules by single-factor test. Sample 11# showed outstanding performance across all indicators, with the best ΔE of 9.292 and the highest encapsulation rate of 68%. Its weighted normalized comprehensive score was 83.05, higher than that of the other single-factor samples. Although sample 5# showed a slightly higher score (86.67), sample 11# was derived from the single-factor optimization experiment, and its preparation conditions were more representative of the actual improvement effects under factor influences. Moreover, it exhibited the best encapsulation rate, indicating a more complete microcapsule structure with better long-term stability and application reliability. Meanwhile, although its ΔE was lower than that of sample 5#, it was still at a relatively high level, ensuring a desirable thermochromic effect. Further heating–cooling cycle experiments were conducted, and the results shown in Table 22 demonstrated that the ΔE variation trend of 11# remained stable during the cycles. This finding was consistent with the cycling stability results obtained in the orthogonal test, thereby further confirming its superior reversible thermochromic performance. In summary, sample 11# was selected as the preferable microcapsule due to its advantages in stability, overall performance balance, and representativeness in the optimization experiment. With a suitable emulsification environment and a relatively high core–wall ratio, Sample 11# achieved a good balance between the structural integrity of the wall and the functionality of the core material. This enabled the thermochromic material to effectively exhibit color change while being well protected by the robust wall shell. The optimal preparation conditions were the addition of 0.5% dispersible cationic red dye relative to the core material mass, a formaldehyde-to-urea ratio of 1.2:1, an emulsifier HLB value of 10, and a core–wall mass ratio of 1:1.1.
Table 20.
The results of microcapsule comprehensive performance by single-factor test.
Table 21.
Normalized score of single-factor test results.
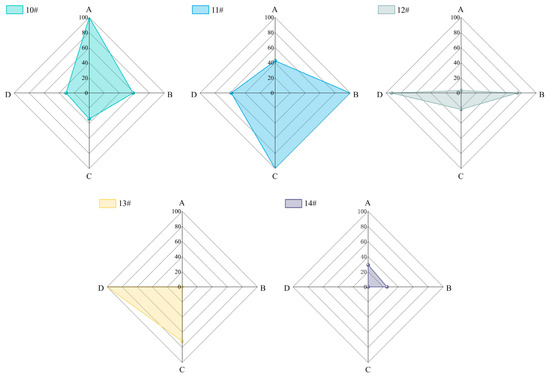
Figure 2.
Normalized scores radar chart of microcapsules by single-factor test: (A) yield rate, (B) encapsulation rate, (C) ΔE, (D) formaldehyde emission.
Table 22.
The results of microcapsules chromaticity values and ΔE with decreasing temperature.
3.1.4. Microscopic Morphology Analysis of Microcapsules
As shown in Figure 3, a moderate addition of the cationic red dye helped improve the dispersion of the core material and enhanced the uniformity of the microcapsules. However, when the addition level was too high, the excessive cationic groups interfered with the stability of the emulsion system, leading to an incomplete emulsification of the core material and, consequently, intensified aggregation of the microcapsules. Therefore, an appropriate amount of cationic red dye was crucial for ensuring desirable morphology and performance of the microcapsules. As the mass ratio of formaldehyde to urea decreased, the particle size of microcapsules increased, and the spherical morphology of the overall microcapsules was improved first and then weakened. This suggested that when the formaldehyde-to-urea ratio was between 1.2:1 and 1.0:1, a small amount of dimethylol urea was formed, which enhanced the crosslinking degree of the microcapsule wall material without causing excessive crosslinking or agglomeration. With the increase in the emulsifier HLB value, the formation of microcapsules improved, and the particle size of the microcapsules became more uniform at an HLB value of 10. When the HLB value was 6, the microcapsules tended to rupture or became unformed. This indicated that an emulsifier with an HLB value of 10 achieved a better hydrophilic–lipophilic balance with the oil phase (core material) used in this study under aqueous conditions, thereby enhancing emulsion stability and facilitating microcapsule formation. Meanwhile, as the core–wall ratio decreased, some microcapsule particles became larger, and the particle size of the microcapsules changed from uniform distribution at the beginning to varying sizes, with increased agglomeration. This showed that with the increase in wall material, microcapsules were more likely to form, but the excessive presence of wall material in the system could lead to rapid binding between the core and wall materials, resulting in particle size irregularities and excessive crosslinking.
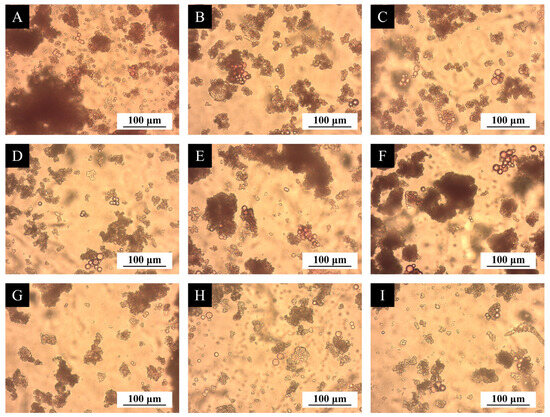
Figure 3.
OM images of orthogonal test microcapsules: (A) 1#, (B) 2#, (C) 3#, (D) 4#, (E) 5#, (F) 6#, (G)7#, (H) 8#, (I) 9#.
The particle size distribution of microcapsules was analyzed in combination with Figure 4. Microcapsules 1–3# exhibited overall particle sizes within the small-to-medium range, with relatively uniform morphology, indicating stable microcapsule structures under these conditions. Microcapsules 4# showed the narrowest size distribution within the small particle range, with an average diameter of 3.42 ± 1.85 μm and regular morphology, corresponding to its highest encapsulation rate. This demonstrated the positive effect of small and uniform particle sizes on improving encapsulation performance. Microcapsules 5# had a larger mean size of 5.11 ± 2.72 μm, with pronounced agglomeration in OM images; however, it exhibited the highest yield rate and ΔE. This suggested that under moderate dye proportion and relatively high HLB values, dense structures could form, enabling strong thermochromic performance despite evident agglomeration. Microcapsules 6 and 7# had similar particle size distributions, but stronger agglomeration was observed in 6#, which was consistent with its significantly lower encapsulation rate compared to microcapsules 7#. Microcapsules 8#, with an average size of 3.68 ± 2.01 μm, showed moderate performance, without remarkable advantages in ΔE or encapsulation rate. Microcapsules 9#, although having a relatively large mean size of 5.62 ± 2.90 μm, exhibited a distinctly lower ΔE. This indicated that at lower contents of cationic red dye, the insufficient chromophore dosage led to weaker color-change effects, even when particle size was relatively large.
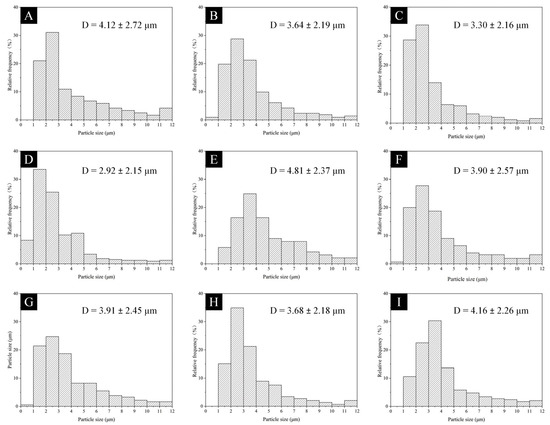
Figure 4.
Particle size distribution of orthogonal test microcapsules: (A) 1#, (B) 2#, (C) 3#, (D) 4#, (E) 5#, (F) 6#, (G)7#, (H) 8#, (I) 9#.
Figure 5 shows the OM images of microcapsule samples prepared from the single-factor experiments. As the core–wall ratio decreased, excessive crosslinking of the wall material occurred, causing microcapsules to stick together and further aggravated aggregation. More and more large-sized microcapsules were produced, and the uniformity of particle size also decreased, which was unfavorable for subsequent addition into UV coatings. Microcapsules with uneven particle sizes, when added to UV coatings, could not only worsen aggregation but also negatively impacted the mechanical and optical properties of the coating. Uneven particle sizes in the coating may cause localized high stress, affecting the mechanical properties of the coating such as flatness, gloss, and hardness. During long-term use, a local stress could also reduce the service life of the coating.
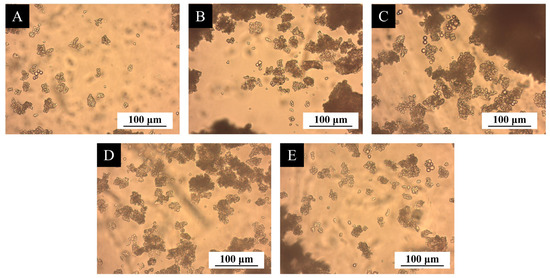
Figure 5.
OM images of single-factor test microcapsules: (A) 10#, (B) 11#, (C) 12#, (D) 13#, (E) 14#.
The analysis was based on the SEM microstructures of microcapsules in the single-factor experiment shown in Figure 6 and the particle size distribution shown in Figure 7. As the core–wall ratio decreased, the phenomenon of excessive crosslinking in the microcapsules became more severe. The particle size distribution of microcapsules 10#, 11#, and 12# fell within the smaller range of 1–7 μm, indicating smaller particle sizes, with mean particle sizes of 4.43 ± 2.21 μm, 4.11 ± 2.60 μm, and 5.22 ± 2.66 μm, respectively. Sample 10# and 11# exhibited lighter crosslinking and more uniform particle sizes. Sample 11# microcapsule showed the most concentrated distribution within the small particle size range. The particle size of Sample 13# was generally larger, with the mean particle size increasing to 6.06 ± 2.83 μm. While in Sample 14# microcapsule, almost no independent microspheres could be found, and the particle size range was too broad—small microcapsules coexisted with ones larger than 11 μm—resulting in the worst microstructure. This is because, as the core–wall ratio decreased, the excessive wall material caused even the formed microcapsules to cross-link more easily during the rapid drying of the spray-drying process under external force. The effect of the core–wall ratio on crosslinking behavior can be attributed to the relative content of the wall material. When the core–wall ratio is too high, the wall material is insufficient to fully encapsulate the core, resulting in incomplete crosslinking, a loose shell structure, and consequently reduced encapsulation efficiency and microcapsule stability. Conversely, when the core–wall ratio is too low, the crosslinking density of the wall material is enhanced, but aggregation and uneven deposition are more likely to occur, thereby reducing the encapsulation performance. The microcapsules 10# and 11# exhibited better microstructural performance. This morphological difference was consistent with the performance data discussed earlier. Sample 11# exhibited better results in both encapsulation rate and ΔE, indicating that a uniform particle size distribution and a moderate crosslinking structure contribute to improving the integrity of the capsule wall and the stability of the color change. In contrast, the strong agglomeration observed in Samples 13# and 14# reduced the encapsulation rate and was accompanied by a decrease in ΔE, suggesting that agglomeration and excessive crosslinking weakened the thermochromic performance. These findings demonstrated that the microscopic morphological characteristics were intrinsically related to the comprehensive performance indicators of the microcapsules, further confirming the key role of the core–wall ratio in regulating the structure and function of microcapsules.
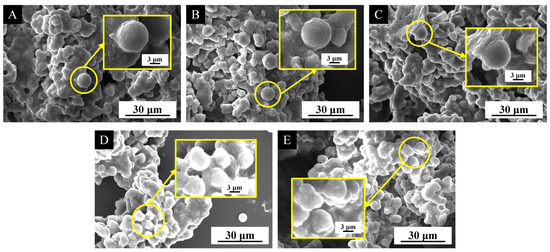
Figure 6.
SEM images of single-factor test microcapsules: (A) 10#, (B) 11#, (C) 12#, (D) 13#, (E) 14#.
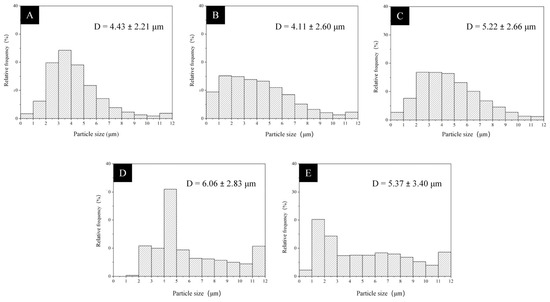
Figure 7.
Particle size distribution of microcapsules from single-factor test: (A) 10#, (B) 11#, (C) 12#, (D) 13#, (E) 14#.
3.1.5. Chemical Composition Analysis of Microcapsules
From Table 23 and Figure 8, it can be seen that the absorption peak at 3353 cm−1 originates from the overlapping stretching vibrations of N–H and O–H, the peak at 2963 cm−1 corresponded to the asymmetric stretching vibration of –CH2–, the peak at 1635 cm−1 was assigned to the carbonyl stretching vibration of secondary amide (amide I) in the UF wall material, and the peak at 1136 cm−1 corresponded to the characteristic absorption of CH3O. These characteristic peaks were all observed in the infrared spectra of the microcapsules, indicating the presence of the wall material.
Table 23.
Characteristic peak of infrared spectrum.
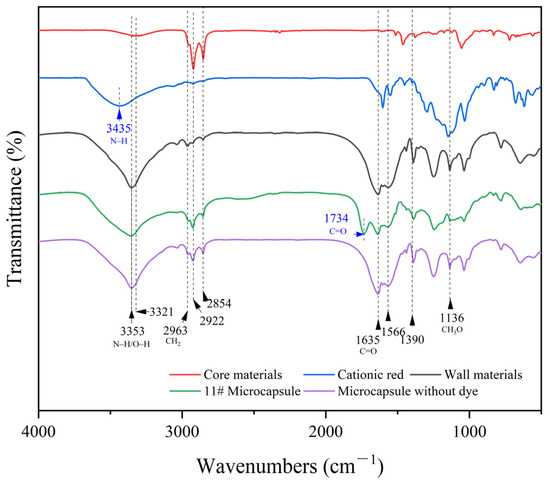
Figure 8.
Infrared spectrum diagram of core materials, wall materials, cationic red and 11# microcapsule.
In the infrared spectra of microcapsules containing cationic red dye, characteristic peaks of the core material were also observed. A new ester carbonyl C=O absorption peak appeared at 1734 cm−1 in the dye-containing microcapsules, which was absent in both the dye-free control microcapsules and the pure cationic red dye. This peak arose because the incorporation of the dye induced the opening of the lactone ring in the core material, forming a conjugated chromophore structure and generating a new ester carbonyl. Meanwhile, the symmetric stretching vibration of the carboxylate at 1390 cm−1 further confirmed the occurrence of the ring-opening reaction.
The absorption peak at 3435 cm−1 originated from the N–H stretching vibration of the amino groups in the dispersible cationic red dye, which was clearly present in the spectrum of the pure dye. In the 11# microcapsules containing the dye, this peak was slightly weakened and showed a minor shift, indicating possible hydrogen bonding or electrostatic interactions between the dye and the wall/core materials. The spectrum of 11# microcapsules simultaneously exhibited characteristic peaks of the wall material, core material, and the new features introduced by the dye, confirming that the dye had been successfully encapsulated while retaining its inherent color properties, thereby demonstrating the successful preparation of the microcapsules.
Based on the test results of other microcapsule properties, the 11# microcapsule exhibited the best overall performance when the core–wall ratio was 1:1.1. Its yield reached 31.95%, encapsulation rate was 68%, thermochromic ΔE was 9.292, and formaldehyde emission concentration was 1.381 mg/m3. The 11# microcapsules were then incorporated into the coating to evaluate various coating properties, aiming to determine the optimal addition level of microcapsules in the UV coating system.
As shown in Figure 9, due to the high saturation of the red background, it was difficult to visually distinguish changes in the blue hue with the naked eye. However, the images captured using the same camera settings revealed variations within the red-purple color range. At low temperatures, the microcapsules appeared dark purple, while at high temperatures, they turned light purple, indicating that a clear color change occurred between –20 °C and 60 °C. Quantitative analysis of ΔE showed that the instrumentally measured ΔE values could effectively reflect the thermochromic response of the microcapsules, compensating for the subjectivity and limitations of visual observation.
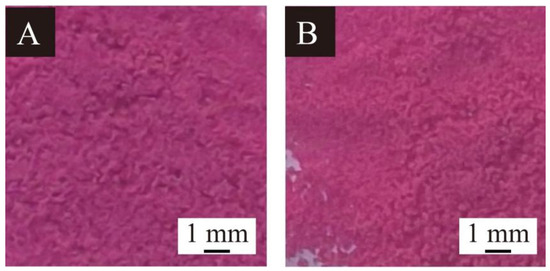
Figure 9.
Macro thermochromic effect of 11# microcapsules: (A) at −20 °C, (B) at 60 °C.
3.2. Paint Film Performance Analysis
3.2.1. Analysis of Paint Film Optical Performance
The effects of adding 11# microcapsules on the gloss and transmittance of the UV primer are shown in Table 24. At a 5% addition, the UV coating exhibited increased gloss loss at the 60° angle; however, at 10%, gloss loss decreased, followed by an increase again at 15%. This trend is attributed to the relatively poor microstructure of the 11# microcapsules. At low addition levels, the uneven dispersion of microcapsules caused localized surface irregularities in the high-solids UV coating, reducing glossiness. When the addition amount increased to 10%, the light loss rate decreased, indicating that the microcapsules were relatively uniformly dispersed in the coating, and the coating surface became smoother. The maximum capacity was achieved at 15% loading, beyond which excessive microcapsules reduced surface smoothness and consequently weakened gloss.
Table 24.
Effect of adding 11# microcapsule on the glossiness and transmittance of UV primer.
The optical performance of the coatings is shown in Figure 10. As the amount of microcapsules increased, the transmittance of the coating decreased. The transmittance of the coating without microcapsule addition was 94.06%, which dropped to 56.58% when 30% of the 11# microcapsules were added. This change indicated that microcapsules had a significant impact on the optical properties of the coating. The decrease in transmittance might be related both to the pigments within the microcapsules, which could absorb certain wavelengths of light, and to scattering effects caused by the microcapsule particles and their aggregation [53,54]. It also highlighted that excessive addition could reduce transparency, which was unfavorable for applications requiring high light transmittance. Within the 5–15% addition range, the coating transmittance remained relatively high, providing a reasonable balance between thermochromic functionality and basic optical performance. However, when the addition exceeded 15%, transparency dropped significantly, making it unsuitable for transparent or semi-transparent primer systems that required high transmittance.
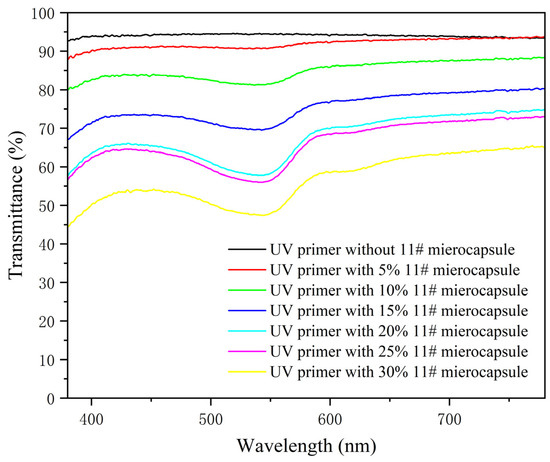
Figure 10.
UV visible transmittance of UV primer with 11# microcapsules.
3.2.2. Analysis of Paint Film Mechanical Performance
Table 25 shows the effects of different addition levels of 11# microcapsules on the elongation at break and surface roughness of the coating. Adding only 5% microcapsules reduced the elongation at break from 10.6% to 9.3%, indicating that the microcapsules, acting as rigid particles, introduced localized stress concentrations within the coating matrix. Meanwhile, the limited interfacial interaction between the microcapsules and the polymer matrix hindered local mechanical load transfer, affecting the continuity of the matrix. In addition, during UV curing, the microcapsules caused slight shading in certain regions, subtly interfering with the polymer crosslinking process. As the amount of addition increases, the roughness gradually rose, starting from a relatively high level. Considering the relatively poor microstructure of the 11# microcapsules, the amount of the UV primer coating should not be too high. The mechanical properties were better at 5% addition, and the elongation at break and roughness showed excellent results. From the perspective of performance weighting, considering the application requirements of UV primers in transparent or semi-transparent systems, this study prioritized the optical properties of the coating, particularly transmittance, while also taking mechanical properties into account as necessary for reliability. Although a 5% microcapsule addition slightly reduced glossiness, transmittance remained within an acceptable range, and overall optical performance was satisfactory. With microcapsule additions of 10% or more, uneven distribution within the coating led to a decline in optical properties and a noticeable deterioration in mechanical performance. Therefore, based on the combined performance in optical properties and color difference, the optimal addition level of 11# microcapsules in the UV primer was determined to be 5%, in order to achieve the best overall coating performance.
Table 25.
Effect of adding 11# microcapsule on the elongation at break and roughness of UV primer.
3.2.3. Analysis of Paint Film Morphology
The SEM images of UV primer coating with different mass fractions of 11# microcapsules are shown in Figure 11. Surface irregularities caused by microcapsule aggregation were observed. At a 5% addition level of 11# microcapsules, the UV primer exhibited poor surface morphology with relatively large protrusions. The aggregation of microcapsules led to poor leveling, which further resulted in an uneven UV coating surface. When the amount of additives was further increased, the surface of the coating with 10% 11# microcapsules showed more extensive but less pronounced protrusions. This may have contributed to a further increase in surface roughness, while the impact on gloss appeared to be less severe than at the 5% level. Although this study did not quantitatively analyze the size, coverage area, or defect density of the aggregates, the evolution of surface morphology indicated that the dispersion and aggregation behavior of the microcapsules in the coating had a significant impact on the observed trends in gloss and roughness. While considering pursuing high thermochromic ΔE, the optical mechanical properties of the coating itself cannot be too affected. Therefore, considering the comprehensive influence of microcapsules on coating performance, the optimal addition amount was determined to be 5% of 11# microcapsules, at which point the surface morphology could be accepted to a certain extent.
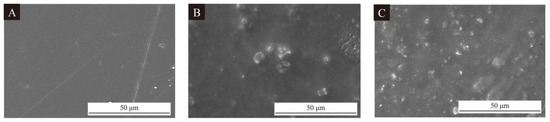
Figure 11.
SEM images of UV primer with 11# microcapsule: (A) without microcapsules (B) 5% 11# microcapsule, (C) 10% 11# microcapsule.
3.2.4. Chemical Composition Analysis of Paint Film
Figure 12 shows the infrared spectra of UV primer and microcapsules. The absorption peaks at 1176 cm−1 and 1724 cm−1 corresponded to the C–O and C=O stretching vibrations, respectively, which were characteristic peaks of the main components in the UV primer, namely polyester acrylate resin, trimethylolpropane triacrylate, and trimethylolpropane acrylate. The peak at 2922 cm−1 was attributed to the C–CH3 stretching vibration, originating from both bisphenol A in the core material and epoxy acrylate resin in the UV primer. This peak was enhanced in the spectrum of the UV primer with 10% 11# microcapsules. The peak at 1635 cm−1 represented the ester carbonyl C=O stretch of a non-lactone ring structure, while the peak at 1390 cm−1 corresponded to the symmetric stretching of carboxylate, indicating that the lactone ring had opened to form a conjugated chromogenic structure. Importantly, the coating with the addition of microcapsules did not produce a new peak that was different from the microcapsules and the coating, suggesting that the addition of microcapsules did not hinder the curing process of the UV primer nor induce chemical reactions between the two. Thus, the microcapsules were confirmed to be suitable for addition in UV primer.
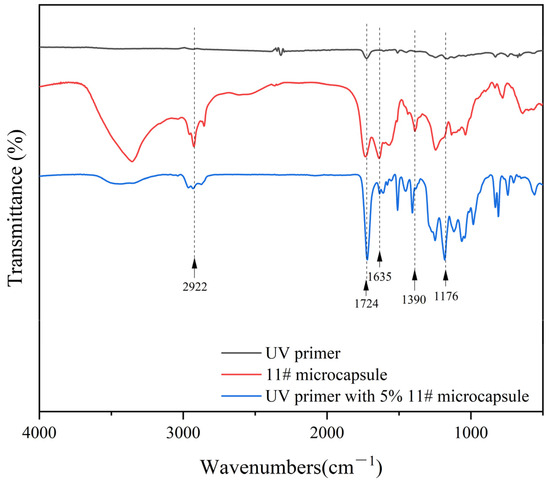
Figure 12.
Infrared spectrum diagram of the UV primer, 11# microcapsule and UV primer with 10% 11# microcapsule.
When 11# microcapsules were added to the UV primer at a loading of 5%, the overall performance of the UV coating was optimized. The UV–visible light transmittance reached 91.92%, the 60° gloss was 42.2 GU, and the 60° gloss loss rate was 62%. In terms of mechanical properties, the elongation at break was 9.3%, and the surface roughness was 0.308 μm. The 11# microcapsules also exhibited excellent thermochromic performance, with a ΔE value of 9.292 between low and high temperatures.
4. Conclusions
Through orthogonal experiment and single factor experiment, the preparation process of urea-formaldehyde-coated cationic red-ternary system thermochromic microcapsule was optimized, and its thermochromic ability in coating system was verified. The effects of the proportion of dispersed cationic red in the core material, the mass ratio of formaldehyde to urea, the HLB value of the emulsifier, and the core–wall ratio on the overall microcapsule performance were systematically investigated. Among these factors, the core–wall ratio had the most significant impact. The optimal preparation conditions were: dispersed cationic red that accounts for 0.5% of the mass of the core material, a formaldehyde-to-urea ratio of 1.2:1, an emulsifier HLB value of 10, and a core–wall ratio of 1:1.1. As the core–wall ratio decreased, excessive crosslinking of the wall material led to microcapsule agglomeration and sticking, resulting in a decrease in yield, the encapsulation rate and ΔE value first increase and then decrease, and the formaldehyde emission increases first and then decreases. When the core wall ratio was 1:1.1, the microcapsules exhibited an optimal comprehensive performance, with a yield of 31.95%, encapsulation rate of 68%, thermochromic ΔE of 9.292, and formaldehyde emission of 1.381 mg/m3. When 5% amount of 11# microcapsules was added, the UV coating exhibited the best comprehensive properties: UV–visible transmittance of 91.92%, 60° gloss of 42.2 GU, gloss loss of 62%, elongation at break of 9.3%, and roughness of 0.308 μm. Future studies will further determine the ΔE–temperature response curves and color-change temperature parameters of UV primer films containing thermochromic microcapsules at different temperatures, and explore their application on substrates such as wood, in order to more systematically evaluate their thermochromic performance and practical potential. Effort will also be devoted to optimizing the wall material formulation by exploring bio-based alternatives with low free formaldehyde release or formaldehyde adsorption capability, in order to enhance the green characteristics and environmental friendliness of the microcapsule system.
Author Contributions
Conceptualization, methodology, validation, resources, data management, and supervision, writing—review and editing, J.H.; formal analysis, Y.Z.; investigation, X.Y. and J.L. All authors have read and agreed to the published version of the manuscript.
Funding
This project was partly supported by the Qing Lan Project and the Natural Science Foundation of Jiangsu Province (BK20201386).
Institutional Review Board Statement
Not applicable.
Informed Consent Statement
Not applicable.
Data Availability Statement
Data are contained within the article.
Conflicts of Interest
The authors declare no conflicts of interest.
References
- Wu, J.; Yu, P.C.; Wang, L.J.; Zhang, X.J.; Xie, W.W.; Zeng, J.; Zhou, G.F.; Zhang, Z. Reversible Thermochromic Phase Change Material Microcapsules with High Latent Heat via Cellulose Nanocrystal Stabilized Pickering Emulsion for Smart Coatings. Small 2025, 21, 2505575. [Google Scholar] [CrossRef] [PubMed]
- Chang, Y.J.; Yan, X.X.; Wu, Z.H. Application and prospect of self-healing microcapsules in surface coating of wood. Colloid Interface Sci. Commun. 2023, 56, 100736. [Google Scholar] [CrossRef]
- An, K.; Wang, Y.Q.; Sui, Y.; Qing, Y.Q.; Tong, W.; Wang, X.Z.; Liu, C.S. Recent advances of cerium compounds in functional coatings: Principle, strategies and applications. J. Rare Earth. 2025, 43, 227–245. [Google Scholar] [CrossRef]
- Chen, Z.B.; Wu, Z.H. Application Prospect of Multifunctional Hydrogel Coating in Household Field. Coatings 2024, 14, 1580. [Google Scholar] [CrossRef]
- Chang, Y.J.; Wu, Z.H.; Liu, E.W. Fabrication of chitosan-encapsulated microcapsules containing wood wax oil for antibacterial self-healing wood coatings. Ind. Crops Prod. 2024, 222, 119438. [Google Scholar] [CrossRef]
- Calabrese, L.; Proverbio, E. Recent Developments on Functional Coatings for Industrial Applications. Coatings 2023, 13, 59. [Google Scholar] [CrossRef]
- Li, Y.J.; Yao, B.H.; Zeng, P.Y.; Peng, Q.C.; Li, Y.Y.; Li, K.; Zang, S.Q. Pressure-Triggered Photochromism in Chiral Salicylaldehyde Schiff Bases. Chin. J. Chem. 2024, 42, 2987–2992. [Google Scholar] [CrossRef]
- Sun, D.D.; Wu, Y.; Han, X.; Liu, S.M. A supramolecular strategy for gated photochromism in aqueous solution and solid state. Mater. Chem. Front. 2022, 6, 2929–2934. [Google Scholar] [CrossRef]
- Jaik, T.G.; Ciubini, B.; Frascella, F.; Jonas, U. Thermal response and thermochromism of methyl red-based copolymer systems—Coupled responsiveness in critical solution behaviour and optical absorption properties. Polym. Chem. 2022, 13, 1186–1214. [Google Scholar] [CrossRef]
- Wilk-Kozubek, M.; Potaniec, B.; Gazinska, P.; Cybinska, J. Exploring the Origins of Low-Temperature Thermochromism in Polydiacetylenes. Polymers 2024, 16, 2856. [Google Scholar] [CrossRef]
- Gupta, J.; Shaik, H.; Gupta, V.K.; Sattar, S.A. Perspective of Electrochromic Double Layer Towards Enrichment of Electrochromism: A Review. Braz. J. Phys. 2024, 54, 89. [Google Scholar] [CrossRef]
- Deng, J.Z.; Huang, N.; Yan, X.X. Effect of Composite Addition of Antibacterial/Photochromic/Self-Repairing Microcapsules on the Performance of Coatings for Medium-Density Fiberboard. Coatings 2023, 13, 1880. [Google Scholar] [CrossRef]
- Chen, Y.; Liu, R.; Luo, J. Enhancing weathering resistance of UV-curable coatings by using TiO2 particles as filler. Prog. Org. Coat. 2023, 169, 106936. [Google Scholar] [CrossRef]
- Zhang, H.Q.; Feng, X.H.; Wu, Y.; Wu, Z.H. Factors influencing the properties of UV-cured self-matting film. Prog. Org. Coat. 2024, 189, 108241. [Google Scholar] [CrossRef]
- Zhang, Y.A.; Sheng, Y.M.; Wang, M.H.; Lu, X. UV-curable self-healing, high hardness and transparent polyurethane acrylate coating based on dynamic bonds and modified nano-silica. Prog. Org. Coat. 2022, 172, 107051. [Google Scholar] [CrossRef]
- Todorova, D.; Dimitrov, K.; Herzog, M. Solvent free UV curable coating for paper protection. Sustain. Chem. Pharm. 2021, 24, 100543. [Google Scholar] [CrossRef]
- Sykam, K.; Hussain, S.S.; Sivanandan, S.; Narayan, R.; Basak, P. Non-halogenated UV-curable flame retardants for wood coating applications: Review. Prog. Org. Coat. 2023, 179, 107549. [Google Scholar] [CrossRef]
- Wang, T.H.; Liu, X.B.; Luo, J.; Liu, R.; Sun, G.Q. Encapsulation of Dyed Alkanes with Polyurethane Microcapsules from Interfacial Polymerization Enables Irreversible Thermochromic Coatings. ACS Appl. Polym. Mater. 2024, 6, 8811–8820. [Google Scholar] [CrossRef]
- Sánchez-Osorno, D.M.; López-Jaramillo, M.C.; Paz, A.V.C.; Villa, A.L.; Peresin, M.S.; Martínez-Galán, J.P. Recent Advances in the Microencapsulation of Essential Oils, Lipids, and Compound Lipids through Spray Drying: A Review. Pharmaceutics 2023, 15, 1490. [Google Scholar] [CrossRef]
- Liu, X.D.; Gao, W.; Lu, Y.; Wu, L.Y.; Chen, Y.P. High-throughput microfluidic production of carbon capture microcapsules: Fundamentals, applications, and perspectives. Int. J. Extrem. Manuf. 2024, 6, 032010. [Google Scholar] [CrossRef]
- Lu, X.R.; Wang, X.F.; Xue, D.; Zhao, T. Preparation and characterization of n-octadecane @ bio-based polyurea microcapsules. Sustain. Chem. Pharm. 2025, 45, 102002. [Google Scholar] [CrossRef]
- Xiao, Z.B.; Zhou, L.Y.; Sun, P.L.; Li, Z.B.; Kang, Y.X.; Guo, M.X.; Niu, Y.W.; Zhao, D. Regulation of mechanical properties of microcapsules and their applications. J. Control. Release 2024, 375, 90–104. [Google Scholar] [CrossRef] [PubMed]
- Berraaouan, D.; Essifi, K.; Addi, M.; Hano, C.; Fauconnier, M.L.; Tahani, A. Hybrid Microcapsules for Encapsulation and Controlled Release of Rosemary Essential Oil. Polymers 2023, 15, 823. [Google Scholar] [CrossRef] [PubMed]
- Chang, Y.J.; Liu, E.W.; Wu, Z.H. Constructing chitosan microcapsules using hydroxypropyl methylcellulose for self-healing antibacterial wood coating. Int. J. Biol. Macromol. 2025, 308, 142300. [Google Scholar] [CrossRef]
- Deng, J.Z.; Yan, X.X. Preparation of Tung Oil Microcapsules Coated with Chitosan-Arabic Gum and Its Effect on the Properties of UV Coating. Polymers 2025, 17, 1985. [Google Scholar] [CrossRef]
- Xia, Y.X.; Yan, X.X. Preparation of UV Topcoat Microcapsules and Their Effect on the Properties of UV Topcoat Paint Film. Polymers 2024, 16, 1410. [Google Scholar] [CrossRef]
- Tao, Y.T.; Tang, Z.H.; Huang, Q.Y.; Xu, X.F.; Cheng, X.Y.; Zhang, G.X.; Jing, X.Y.; Li, X.L.; Liang, J.; Granato, D.; et al. Effects of spray drying temperature on physicochemical properties of grapeseed oil microcapsules and the encapsulation efficiency of pterostilbene. Lwt-Food Sci. Technol. 2024, 193, 115779. [Google Scholar] [CrossRef]
- Phanse, S.K.; Chandra, S. Spray drying encapsulation of essential oils: Insights on various factors affecting the physicochemical properties of the microcapsules. Flavour Frag. J. 2024, 39, 93–115. [Google Scholar] [CrossRef]
- Espinosa-Andrews, H.; Morales-Hernández, N.; García-Márquez, E.; Rodríguez-Rodríguez, R. Development of fish oil microcapsules by spray drying using mesquite gum and chitosan as wall materials: Physicochemical properties, microstructure, and lipid hydroperoxide concentration. Int. J. Polym. Mater. 2023, 72, 646–655. [Google Scholar] [CrossRef]
- Zhang, S.N.; Yan, R.M.; Zhang, S.Y.; Lu, Y.N. W/O/W Multiple Emulsified Microcapsules Based on Biopolymer Soybean Isolate Proteins: Improving Tannic Acid’s Biocompatibility and Sustained-Release Performance. Molecules 2025, 30, 2373. [Google Scholar] [CrossRef]
- Zhang, X.Z.; Wang, D.; Liu, L.; Jiang, W.L.; Xiang, W.L.; Zhang, Q.; Tang, J. Microencapsulation of Zanthoxylum schinifolium essential oil through emulsification followed by spray drying: Microcapsule characterization and functional evaluation. Colloids Surf. A 2024, 687, 133484. [Google Scholar] [CrossRef]
- da Silva Acácio, R.; Pamphile-Adrian, A.J.; Florez-Rodriguez, P.P.; de Freitas, J.D.; Goulart, H.F.; Santana, A.E.G. Dataset of Schinus terebinthifolius essential oil microencapsulated by spray-drying. Data Brief 2023, 47, 108927. [Google Scholar] [CrossRef] [PubMed]
- Takatani, M.; Takaoka, N.; Nakagawa, K.; Kobayashi, T. Preparation of bio-based thermal energy storage microcapsules by spray drying and its property evaluation. J. Therm. Anal. Calorim. 2025, 150, 5981–5990. [Google Scholar] [CrossRef]
- Jiang, J.Y.; Ma, C.; Song, X.N.; Zeng, J.H.; Zhang, L.W.; Gong, P.M. Spray drying co-encapsulation of lactic acid bacteria and lipids: A review. Trends Food Sci. Technol. 2022, 129, 134–143. [Google Scholar] [CrossRef]
- Hashim, N.A.; Mudalip, S.K.A.; Man, R.C.; Sulaiman, S.Z. Menhaden fish oil encapsulation by spray drying process: Influence of different biopolymer materials, inlet air temperature and emulsion ratios. J. Chem. Technol. Biot. 2023, 98, 2726–2733. [Google Scholar] [CrossRef]
- San, S.M.; Jaturanpinyo, M.; Limwikrant, W. Effects of Wall Material on Medium-Chain Triglyceride (MCT) Oil Microcapsules Prepared by Spray Drying. Pharmaceutics 2022, 14, 1281. [Google Scholar] [CrossRef]
- Zou, Y.M.; Yan, X.X. Preparation and Optimization of Thermochromic Microcapsules as a Ternary System of Crystal Violet Lactone: Bisphenol A: Decanol Encapsulated with Urea Formaldehyde Resin in a UV-Curable Primer. Polymers 2025, 17, 851. [Google Scholar] [CrossRef]
- GB/T 11186.3-1989; Methods for Measuring the Colour of Coating Films. Part III: Calculation of Colour Differences. Standardization Administration of the People’s Republic of China: Beijing, China, 1990.
- Qi, Y.Q.; Zhang, Z.Q.; Sun, Y.; Shen, L.M.; Han, J.L. Study on the Process Optimization of Peanut Coat Pigment Staining of Poplar Wood. Forests 2024, 15, 504. [Google Scholar] [CrossRef]
- Qi, Y.Q.; Zhou, Z.W.; Li, J.X.; Shen, L.M.; Han, J.L. Study on the dyeing properties of Chinese fir with Cinnamomum camphor pigment by premordant dyeing. Wood Mater. Sci. Eng. 2025, 20, 16–176. [Google Scholar] [CrossRef]
- GB/T 4893.6-2013; Test of Surface Coatings of Furniture-Part 6: Determination of Gloss Value. Standardization Administration of the People’s Republic of China: Beijing, China, 2013.
- Wang, C.; Li, J.Y.; Wang, X.W.; Chu, Q.; Wang, T.Y. Influence of Shell Structure on the Tensile Strength of Fused Filament Fabrication Models. Mater. Plast. 2024, 61, 19–26. [Google Scholar] [CrossRef]
- Xue, J.X.; Xu, W.; Zhou, J.C.; Mao, W.G.; Wu, S.S. Effects of High-Temperature Heat Treatment Modification by Impregnation on Physical and Mechanical Properties of Poplar. Materials 2022, 15, 7334. [Google Scholar] [CrossRef] [PubMed]
- Wang, C.; Huang, H.Y.; Wang, X.W.; Wang, Y.B.R.; Zhu, Y. Effect of drying treatment on the physical and mechanical properties of material extrusion-based 3D-printed PETG models. BioResources 2025, 20, 7000–7009. [Google Scholar] [CrossRef]
- Hu, W.G.; Zhao, Y.; Xu, W.; Liu, Y.Q. The Influences of Selected Factors on Bending Moment Capacity of Case Furniture Joints. Appl. Sci. 2024, 14, 10044. [Google Scholar] [CrossRef]
- Hu, W.G.; Yu, R.Z.; Yang, P. Characterizing Roughness of Wooden Mortise and Tenon Considering Effects of Measured Position and Assembly Condition. Forests 2024, 15, 1584. [Google Scholar] [CrossRef]
- Liu, Y.; Hu, J.; Xu, W. Surface Roughness of Wood Substrates after Grinding and Its Influence on the Modification Effect of Structural Color Layers. Forests 2023, 14, 2213. [Google Scholar] [CrossRef]
- Xu, X.T.; Zhang, M.; Yue, X.Y.; Xiong, X.Q. Design of furniture mortise-and-tenon joints: A review of mechanical properties and design recommendations. Wood Mater. Sci. Eng. 2025, 1–15. [Google Scholar] [CrossRef]
- Hu, W.; Luo, M.; Liu, Y.; Xu, W.; Konukcu, A.C. Experimental and numerical studies on the mechanical properties and behaviors of a novel wood dowel reinforced dovetail joint. Eng. Fail. Anal. 2023, 152, 107440. [Google Scholar] [CrossRef]
- Wang, C.L.; Wu, Z.H.; Wang, J.X.; Liu, Y. Theory and Method for Rapid Carbon Footprint Accounting of Solid Wood Furniture. Forest Prod. J. 2025, 75, 155–163. [Google Scholar] [CrossRef]
- Shi, L.Y.; Liu, Y.; Hu, J.; Chen, H.; Ji, J.G. Life-Cycle Assessment of Bicycles Based on Bamboo Bending Technology. For. Prod. J. 2025, 75, 179–188. [Google Scholar] [CrossRef]
- Fu, S.J.; Xiong, X.Q.; Wan, R.Y.; Zhang, M.; Xu, X.T. The Development and Future Challenges of China’s Furniture Industry. Drewno 2025, 68, 00045. [Google Scholar] [CrossRef]
- Hu, J.; Liu, Y.; Xu, W. Impact of cellular structure on the thickness and light reflection properties of structural color layers on diverse wood surfaces. Wood Mater. Sci. Eng. 2025, 20, 495–505. [Google Scholar] [CrossRef]
- Hu, J.; Liu, Y.; Xu, W. Influence of Cell Characteristics on the Construction of Structural Color Layers on Wood Surfaces. Forests 2024, 15, 676. [Google Scholar] [CrossRef]


Disclaimer/Publisher’s Note: The statements, opinions and data contained in all publications are solely those of the individual author(s) and contributor(s) and not of MDPI and/or the editor(s). MDPI and/or the editor(s) disclaim responsibility for any injury to people or property resulting from any ideas, methods, instructions or products referred to in the content. |
© 2025 by the authors. Licensee MDPI, Basel, Switzerland. This article is an open access article distributed under the terms and conditions of the Creative Commons Attribution (CC BY) license (https://creativecommons.org/licenses/by/4.0/).