Abstract
Ti1−xCrxN thin-film samples were sputter-deposited with lateral composition gradients x = 0.1–0.9 across each sample. In order to determine the effect of Cr content on oxidation, samples were air-oxidized at temperatures ranging from 650 to 950 °C. The extent and type of oxide formed was characterized using X-ray diffraction. Only minor oxidation was observed for the 650–750 °C temperature range. At 850 °C, films below x = 0.7 showed poor oxidation resistance, with the formation of TiO2 and Cr2O3 oxides, but little oxidation occurred above x = 0.7. At 950 °C, films above x = 0.7 again exhibited the best oxidation resistance. Chromium nitride films, which deposited as Cr2N, were found to begin oxidizing at 750 °C, indicating that the increased oxidation resistance of the higher-Cr Ti-Cr-N films can be attributed to the Ti-induced stabilization of the B1-structured phase. A compositionally-uniform film (x = 0.79) was also deposited and analyzed by XPS before and after oxidation. Oxidation resulted in primarily Cr2O3 at the surface, with some TiO2 also present, with the oxide richer in Cr than the starting film composition. These results suggested that at higher Cr compositions in the film, the oxidation mechanism was controlled by Cr diffusion to the surface.
1. Introduction
Hard coatings based on transition metal nitrides are widely used as protective coatings, and are capable of providing a high degree of wear resistance as well as reduced friction for many applications. TiN is a very common transition metal nitride coating that has found widespread use as a tool coating, while CrN has found applications in automotive components and metal forming dies. However, the need for nitride-based coatings that can be used in more severe and demanding environments, particularly applications at high-temperatures, has led to the development of multi-element nitride coatings [1]. The most common of these is TiAlN, which has a higher strength and oxidation resistance than TiN, and provides better performance for high-speed machining applications [2,3,4]. Coatings based on the Ti-Si-N system have also been extensively investigated. The addition of Si to TiN has been found to result in a more disordered nano-scale microstructure, which leads to improvements in hardness and wear resistance [5,6,7,8]. Films based on the Ti-Cr-N system have also been deposited using a variety of deposition methods [9,10,11,12] with the goal of improving hardness and oxidation resistance. Further improvements in nitride coatings have been sought using films based on the Ti-Al-Cr-N system. These films have demonstrated improved hardness and thermal stability [13,14,15], oxidation resistance [16] and exhibit lower friction and wear [17]. However, as these coatings become more complex and the number of possible compositions increases dramatically, it is important to understand the role of each element in order to optimize the final composition. The objective of the present study is to gain a better understanding of the oxidation mechanisms in the Ti-Cr-N system and to optimize of the Cr/Ti ratio.
The oxidation behavior of Ti-Cr-N coatings was first reported by Otani and Hofmann [18], who deposited coatings by magnetron sputtering which were then air-oxidized at temperatures between 350 and 800 °C. A series of three coatings (x = 0.2, 0.4 and 0.7) were deposited, along with TiN and CrN coatings. Sputter depth profiling using Auger Electron Spectroscopy was used to determine oxide compositions as well as oxide layer thickness. They found the lowest oxidation rate with a Cr content of x = 0.4. Coatings of this composition formed a bilayer structure consisting of a Ti-rich Ti-Cr mixed oxide at the surface, and a Cr-rich oxide below this layer. It was stated that Ti-rich oxide layers formed by the inward diffusion of oxygen, while the Cr-rich layer forms by outward diffusion of Cr through the Cr-oxide layer. The observed improvements in the oxidation resistance of the Ti-Cr-N coatings were attributed to a mutual hindrance of diffusion of oxygen inward and Cr towards the surface.
Further studies of the oxidation resistance of TiCrN coatings were reported by Lee et al. [19]. Again, discrete Cr/Ti ratios were selected (three in this case), and the coatings were deposited by arc ion plating. The kinetics of oxidation were examined, and the best coating had a Cr/Ti ratio of 3.7 (x = 0.79 in the Hoffmann/Otani notation), which was the highest ratio studied. However, these coatings were not significantly better than CrN alone. Cross-section samples were examined by electron microprobe analysis, and mixed TiO2/Cr2O3 layers were found. In most cases, the surfaces were TiO2 alone or TiO2-rich. In a separate study, Lee et al. [20] compared coatings of TiN to TixCr1−xN coating with x = 0.2 and 0.6. While the TiN coating oxidized rapidly above 500 °C, the Ti-Cr-N coating with x = 0.6 began to oxidize only above 700 °C. In order to determine the diffusing species controlling the oxidation, a thin Pt film was deposited on this coating before oxidation to serve as an inert marker. After oxidation (at 900 °C for 20 min) a bilayer TiO2/Cr2O3 oxide formed, with the Pt film between these two oxide layers. This indicated the mobile species were mainly Ti (outward) and O (inward), and the oxidation of the coating was controlled by the diffusion of these elements through the dense Cr2O3 layer. Experiments on the oxidation kinetics showed the Ti-Cr-N films were similar to a CrN-only film. In a subsequent study [21], TiCrN oxidized coatings were studied by examining thin cross-sections of oxidized coatings in the transmission electron microscope (TEM) which has superior resolution in comparison to the previous methods used. In that study, coatings with nearly equal Ti/Cr ratios showed preferential formation of TiO2-rich oxide surface layers (but with some Cr within the layer), while a coating with a Cr/Ti ratio of 3.6 only formed a single-layer Cr-rich oxide. It was proposed that despite the higher activity of Ti in comparison to Cr, the low concentration of Ti in the coating decreased the tendency of Ti to oxidize as a separate TiO2 layer.
The above studies show that the mechanisms and kinetics of Ti-Cr-N oxidation depend strongly on the relative Cr/Ti concentrations. Titanium rich coatings form TiO2 surface oxide layers, which are often highly porous and poorly adherent. As the coatings become more Cr-rich, a composition is reached where the oxide formed is mainly Cr2O3. While the oxidation resistance (in terms of kinetics) of these Cr-rich Ti-Cr-N coatings does not appear to be superior to CrN alone, other coating properties, such as hardness and friction coefficients, may be improved with the addition of Ti to CrN. Therefore, examination of the oxidation behavior over the entire range of Cr-Ti compositions is imperative for overall optimization of the coatings. In the present study, we have carried out this task by depositing samples with lateral composition gradients, and then quantifying the extent of oxidation by using X-ray diffraction. In addition, we examined the mechanism of oxidation in a Cr-rich Ti-Cr-N coating by conducting X-ray photoelectron spectroscopy (XPS) analysis.
2. Experimental Section
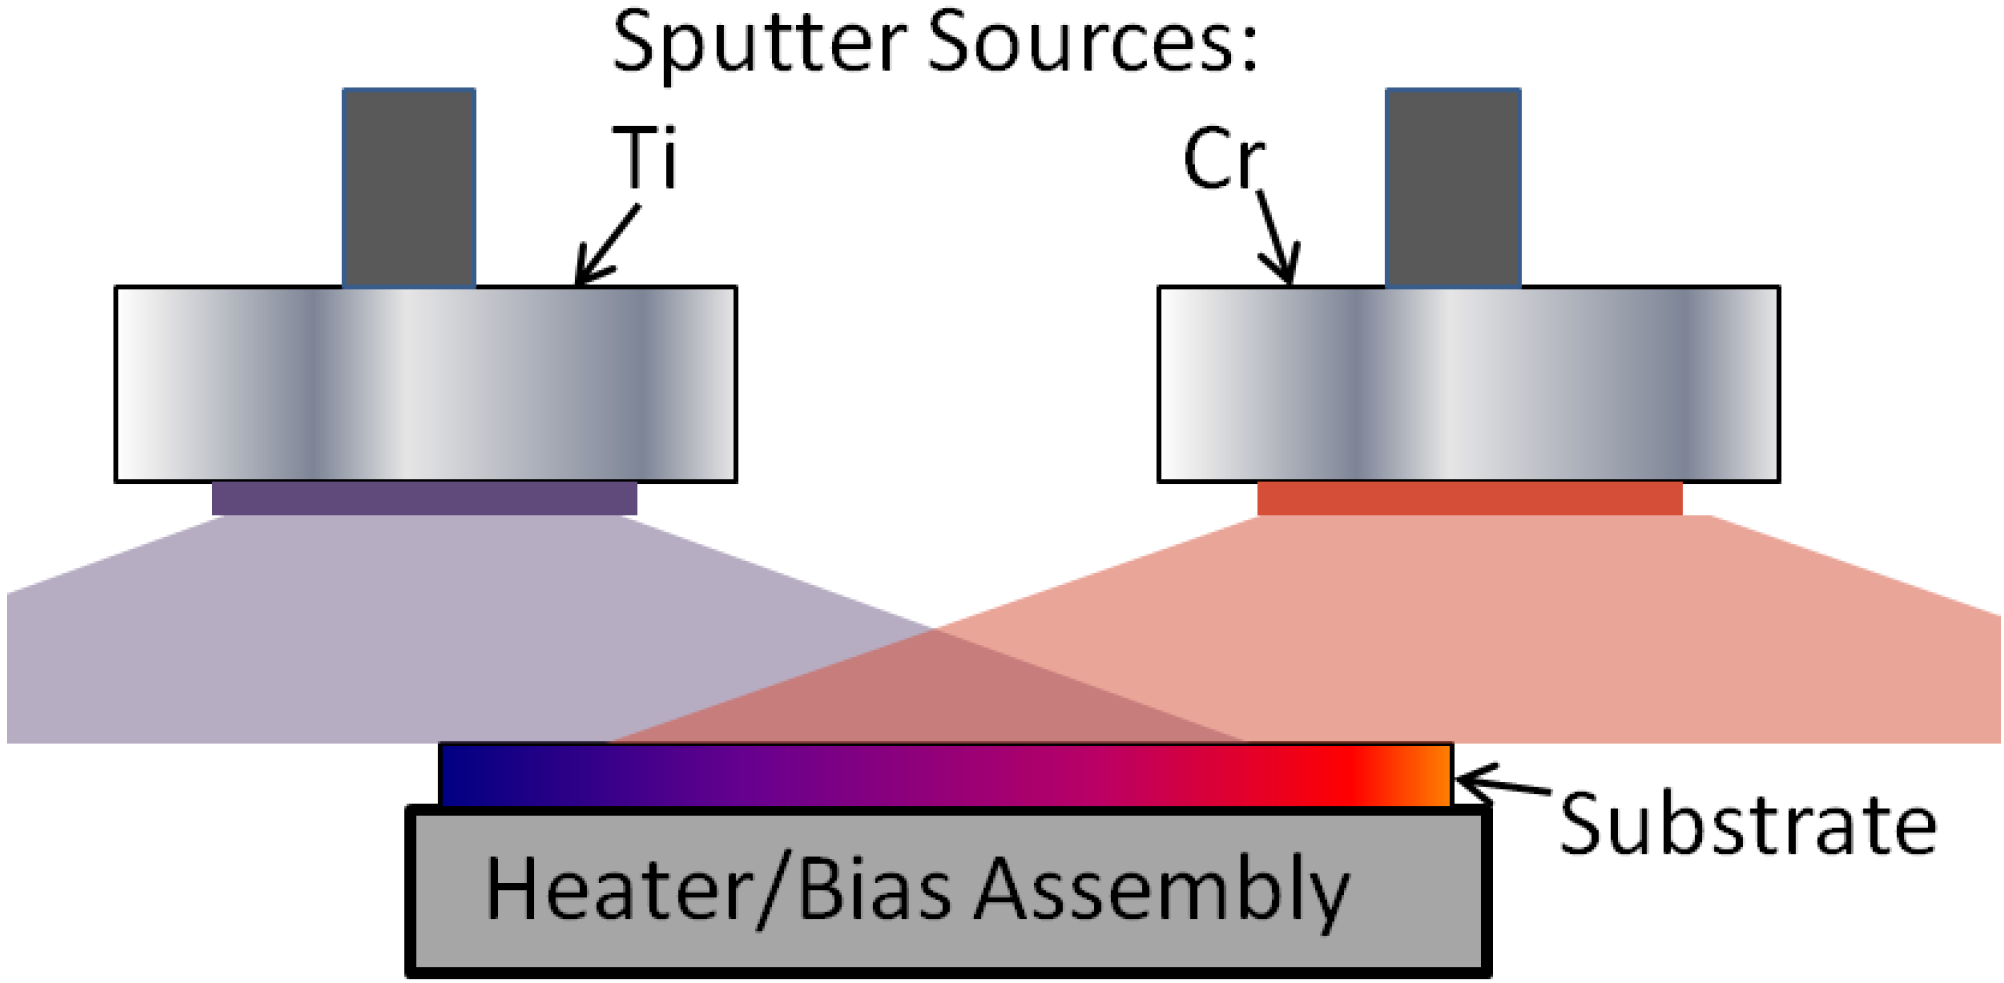
The Ti-Cr-N films examined in this study were deposited using two different deposition systems, which are denoted here as system I and system II. System I was used to deposit the lateral gradient films using the arrangement shown schematically in Figure 1. These samples were used in the XRD-based oxidation studies. System II was used to deposit uniform films on steel substrates that were used for surface characterization by XPS. Table 1 shows a summary of the main features and deposition parameters for each system. System I had a base pressure of 5 × 10⁻⁷ Torr (66.5 μPa), and housed two 50-mm diameter magnetron sputter sources that were oriented in the sputter down position and powered by two RF-type power supplies. Films deposited in this system on (111) Si substrates, which were cut to an approximate size of 5 mm wide by 50 mm in length. These substrates were placed on a heater block (50 mm diameter) located 11 cm from the sputter source targets and maintained at a temperature of 450 °C. The sputter guns were further oriented so that the direct (center) line of sight for each gun was approximately 25 mm past the ends of the Si substrates. Using this set-up, non-uniform films were deposited with TiN-rich compositions on one end and CrN-rich compositions on the other. By running a number of test samples, the power level for each sputter gun was adjusted to result in compositions of approximately 90%TiN-10%CrN (x = 0.1) on one end of the substrate and 10%TiN-90%CrN (x = 0.9) on the other. The relative metal compositions along the length of these samples were determined by EDS analysis in the SEM (see Section 2) and found to follow a linear relation.
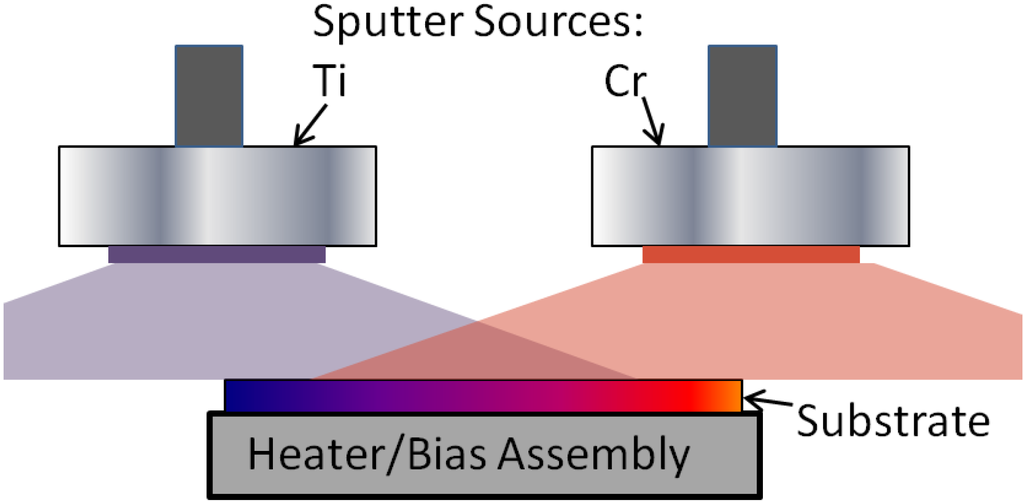
Figure 1.
Schematic diagram of the deposition arrangement for the lateral gradient samples deposited using system I.
Figure 1.
Schematic diagram of the deposition arrangement for the lateral gradient samples deposited using system I.
The specific deposition parameters for the lateral gradient samples are shown in Table 1. To improve adhesion, a thin (~10 nm) Ti layer was first deposited on the Si substrates followed by the Ti-Cr-N film. The deposition parameters were set to deposit 1-μm thick films, which was verified by SEM cross-section analysis. Additional Ti-Cr-N films (of uniform composition) were deposited for surface characterization. These samples were also to be used for later mechanical and tribological studies, so good uniformity and film adhesion was important. Therefore, the second deposition system (system II), which has a rotating sample stage and also incorporates an End-Hall ion source (Model Mark I, Veeco Ion Sources, Fort Collins, CO, USA) that was used to pre-clean the substrates by ion etching, was used to deposit these films. The films deposited in this system were of a fixed composition that was selected based on the results of the oxidation studies. The substrates used in this study were Si and 440C stainless steel discs. The steel discs were 25 mm in diameter, 2–3 mm thick, and were polished using abrasives up to 0.05 μm alumina. The film thickness was 1.2 μm as determined from SEM cross-section images.

Table 1.
Description of deposition systems and parameters.
| Parameters | System I | System II |
|---|---|---|
| Deposition Systems | ||
| Base pressure | 6.6 × 10⁻⁵ Pa | 6.6 × 10⁻⁶ Pa |
| Sputter power supplies | RF | DC |
| Target-to-substrate distance | 60 mm | 50 mm |
| Substrate rotation | – | 50 rpm |
| Deposition pressure | 0.66 Pa | 0.27 Pa |
| Ar flowrate | 20 sccms | 20 sccms |
| N2 flowrate for nitride deposition | 5 sccms | 5.2 sccms |
| In-situ substrate cleaning | – | End-Hall Ion Source |
| Film Deposition | ||
| Substrates | Silicon (111) | 440C Steel |
| Substrate bias | −50 V | −80 V |
| Substrate temp | 450 °C | 550 °C |
The lateral gradient samples were then oxidized in ambient air for one-half hour at temperatures of 650–950 °C in 100 °C increments. After oxidation, the samples were examined under a low-power optical microscope to look for peeling, cracking or spalling of the film. However, the main technique used to determine the extent of oxidation was X-ray diffraction. Samples were examined using a Bruker/AXS diffractometer equipped with a General Area Detector Diffraction System (GADDS) area detector. The diffractometer was also equipped with a CuKα X-ray tube, and a graphite incident beam monochromator was used to eliminate the Kβ line. The incident beam optics also included a 0.8-mm pinhole collimator. This resulted in a beam size of about 1.2 mm when the sample was positioned at an angle of 25° to the incident beam. Area-detector frames were acquired at 5 mm intervals along the sample and then each frame was integrated to give a plot of intensity vs. the standard diffraction angle, 2θ. Using the EDS calibration data for the Si strips, the positions could then be correlated with the original sample composition. Compositions will be reported here as “x” in the formula Ti1−xCrxN unless otherwise noted as absolute compositions. (The nitrogen was confirmed to be near 50% of the absolute film composition by using XPS analysis).
To further characterize the oxidized films, selected samples were analyzed in a Kratos HS XPS system. Analysis was carried out using a MgKα X-ray source, with a pass energy of 160 eV for survey scans and 80 eV for scans of individual element peaks. Sputter-etching was used to remove surface impurities and obtain sub-surface compositions. This was carried out using an in-situ Ar+ ion etching process with an ion energy of 3.5 kV and a filament current of 15 mA. The composition was analyzed using the system-supplied software and database, and the peaks analyzed were the Ti 2p, Cr 2p, N 1s, and O 1s. SEM and EDS analysis was carried out using an AMRAY-3300FE SEM equipped with an Oxford IMIX EDS system. For imaging, a beam voltage of 7 kV was used, while for EDS analysis an accelerating voltage of 25 kV was used.
3. Results and Discussion
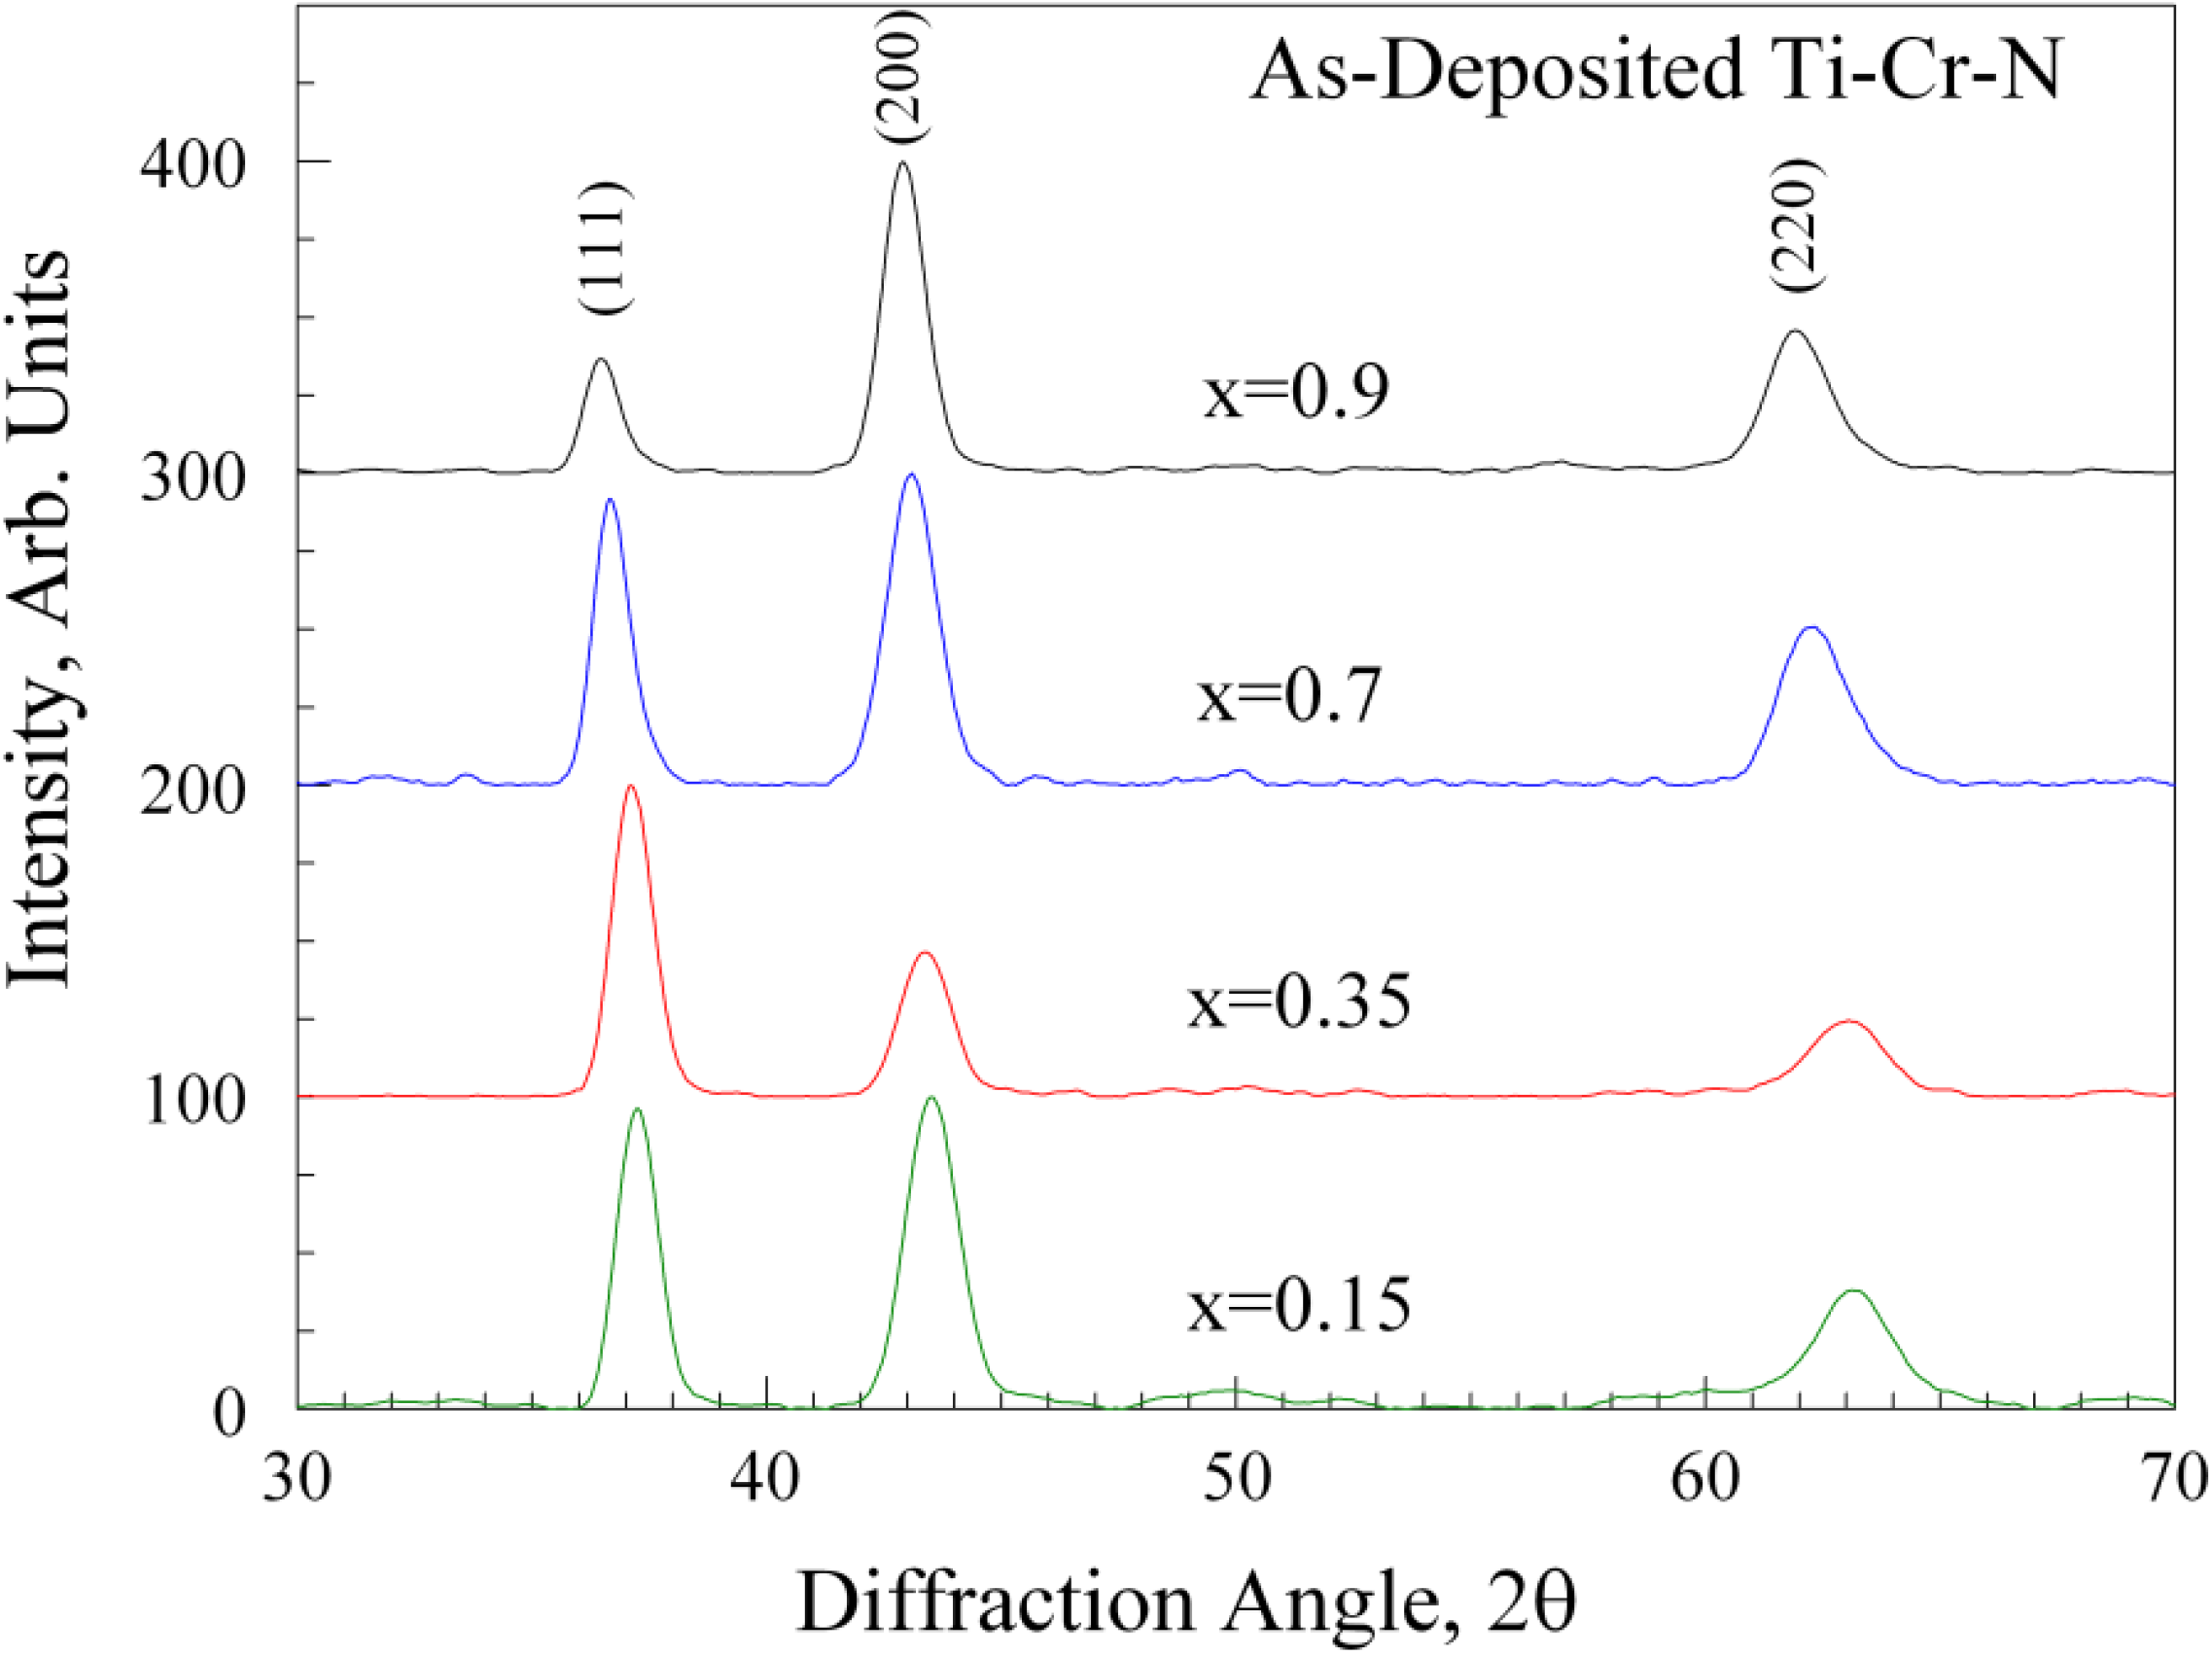
Figure 2 shows X-ray diffraction patterns from the as-deposited lateral gradient sample. In this figure, four points were selected from the sample corresponding to x = 0.15, 0.35, 0.70 and 0.9. All samples showed only peaks for the B1-Rocksalt structure, and the patterns in the figure show the (111), (200) and (220) reflections.
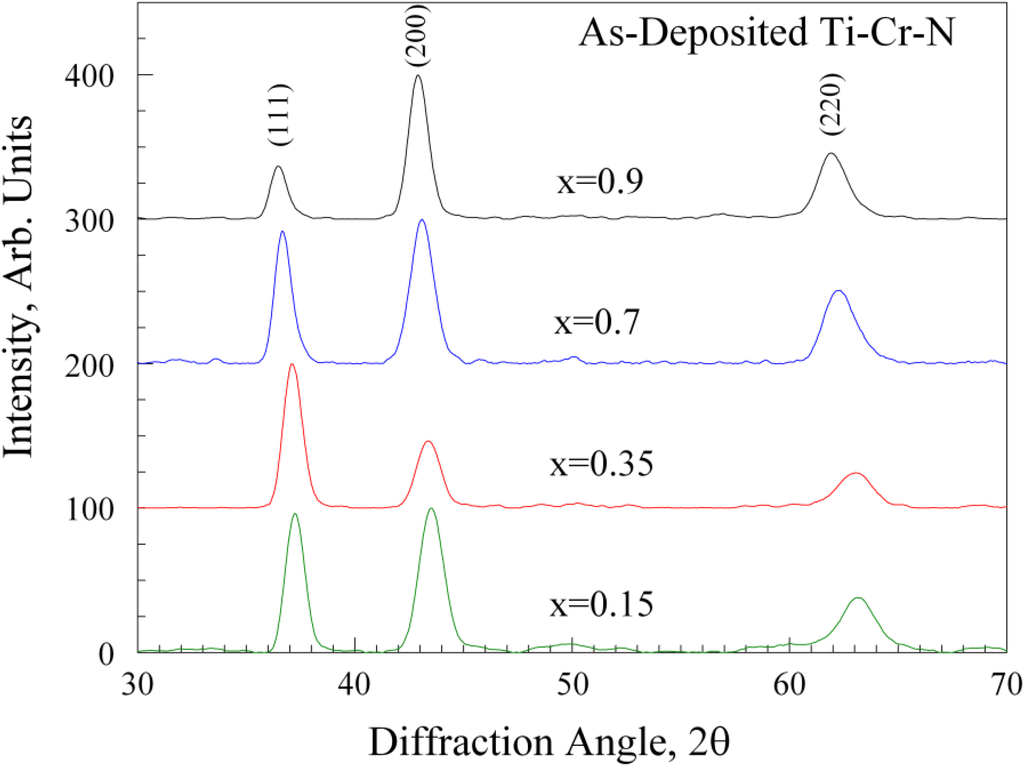
Figure 2.
X-ray diffraction results for four as-deposited samples on a lateral-graded sample. In each case, the film has the B1-rocksalt structure; no evidence for a Cr2N-phase was found.
Figure 2.
X-ray diffraction results for four as-deposited samples on a lateral-graded sample. In each case, the film has the B1-rocksalt structure; no evidence for a Cr2N-phase was found.
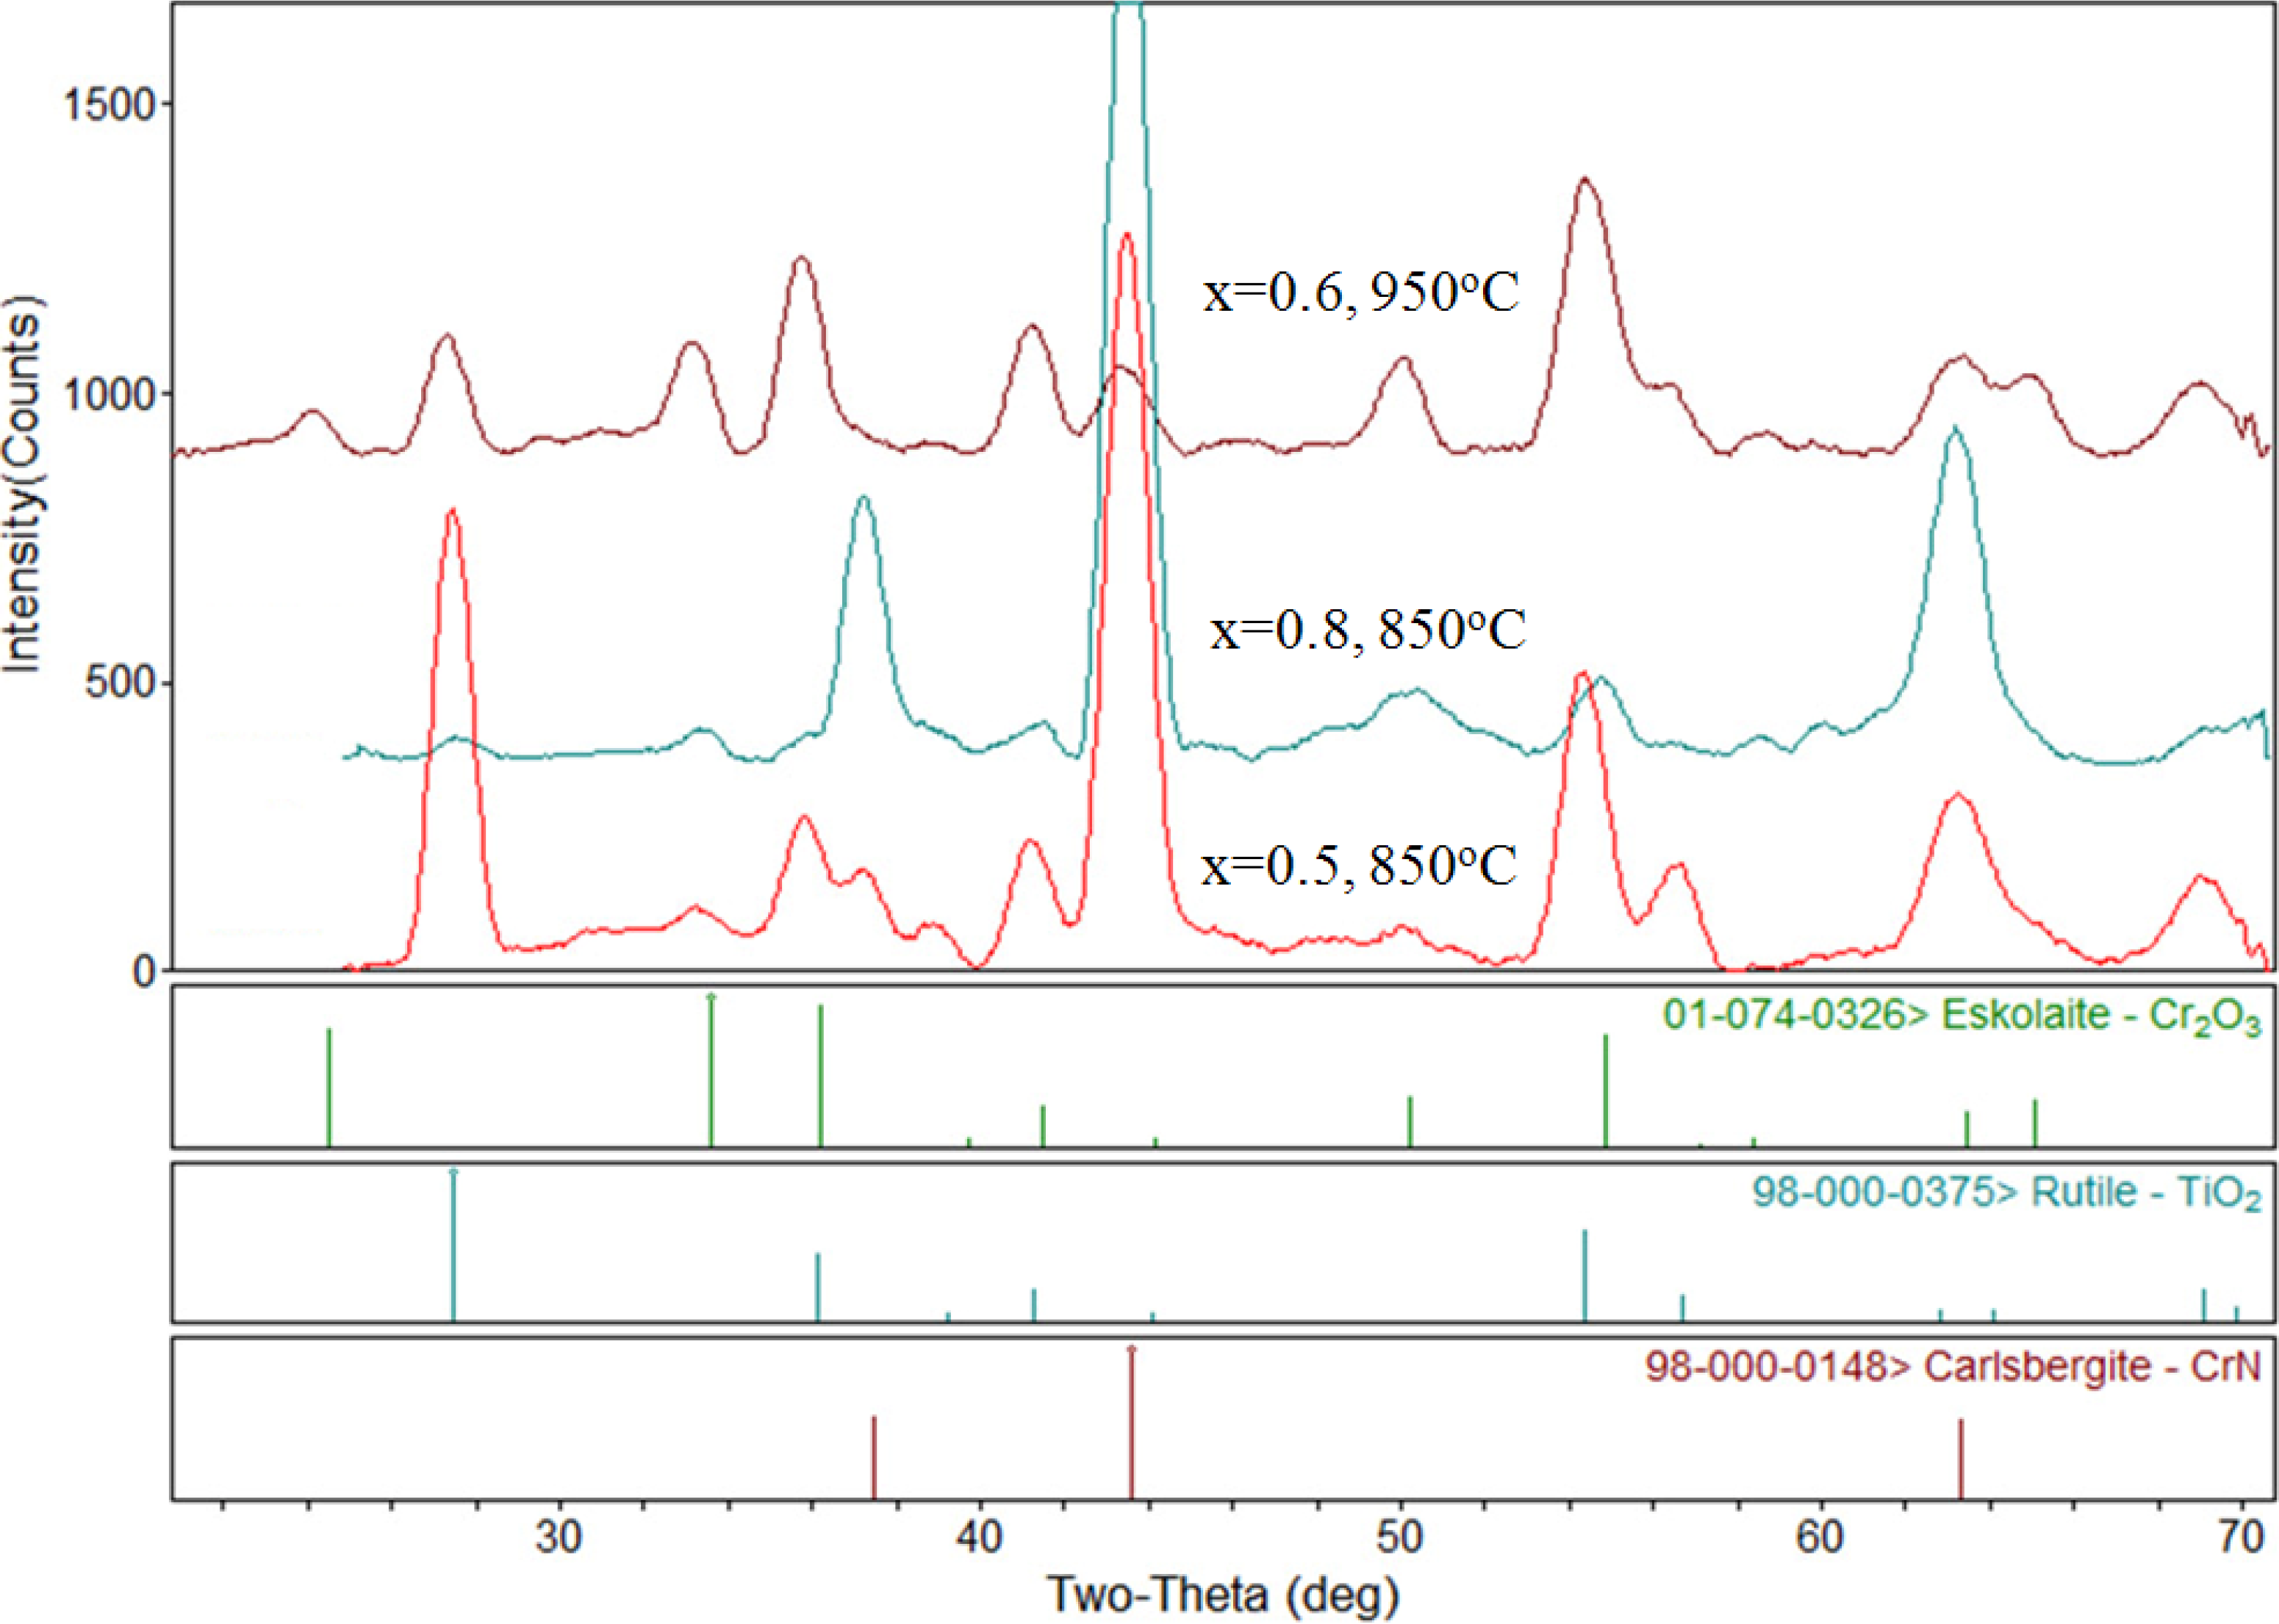
After oxidation at 650 °C, the samples showed minor discoloration, but the X-ray diffraction patterns were largely unchanged. This indicates that significant oxidation did not take place at this temperature. Oxidation at 750 °C showed a significant amount of film peeling at the Ti-rich end up to the 30% Cr point, and after this point the 40%–60% Cr content region shows some slight discoloration with some peeling occurring at the 40% region. The 70% Cr content and higher showed a blue color with little to no peeling. At higher oxidation temperatures, visual inspection showed the films exhibited similar, but more significant oxidation effects. However, the area of the samples corresponding to 60%–70% Cr showed the least tendency towards peeling and spalling after oxidation. Figure 3 shows X-ray diffraction results from three selected samples after oxidation. The sample with 50% Cr oxidized at 850 °C showed the rocksalt-structure peaks still present (indicated by the CrN reference pattern) but peaks corresponding to rutile (TiO2) are also clearly present. The largest peak for rutile occurs at 2θ = 27.43° and is the (110) peak for this compound. There was also some evidence for a small amount of Cr2O3 in this spectrum, but the TiO2 was the dominant oxide compound. The sample with 80% Cr, also oxidized at 850 °C, is also shown in Figure 3. In this case, the dominant peaks are from the original TiCrN as-deposited compound. Smaller peaks are also present that indicated the formation of some oxide compounds, however, it is clear that much less oxidation occurred due to the higher Cr content in this film. The final spectrum in Figure 3 shows the sample with x = 0.6 oxidized at 950 °C. In this case, the film has almost completely oxidized and evidence for both the TiO2 and Cr2O3 phases is present. The (104) peak located at 2θ = 33.59° is a good indicator for the Cr2O3 phase, since it does not overlap with either the TiO2 or original TiCrN peaks.

Figure 3.
Examples of XRD patterns for oxidized samples. PDF file reference lines are shown below the patterns. The CrN pattern has been included as an approximate reference for the B1-TiCrN phase.
Figure 3.
Examples of XRD patterns for oxidized samples. PDF file reference lines are shown below the patterns. The CrN pattern has been included as an approximate reference for the B1-TiCrN phase.
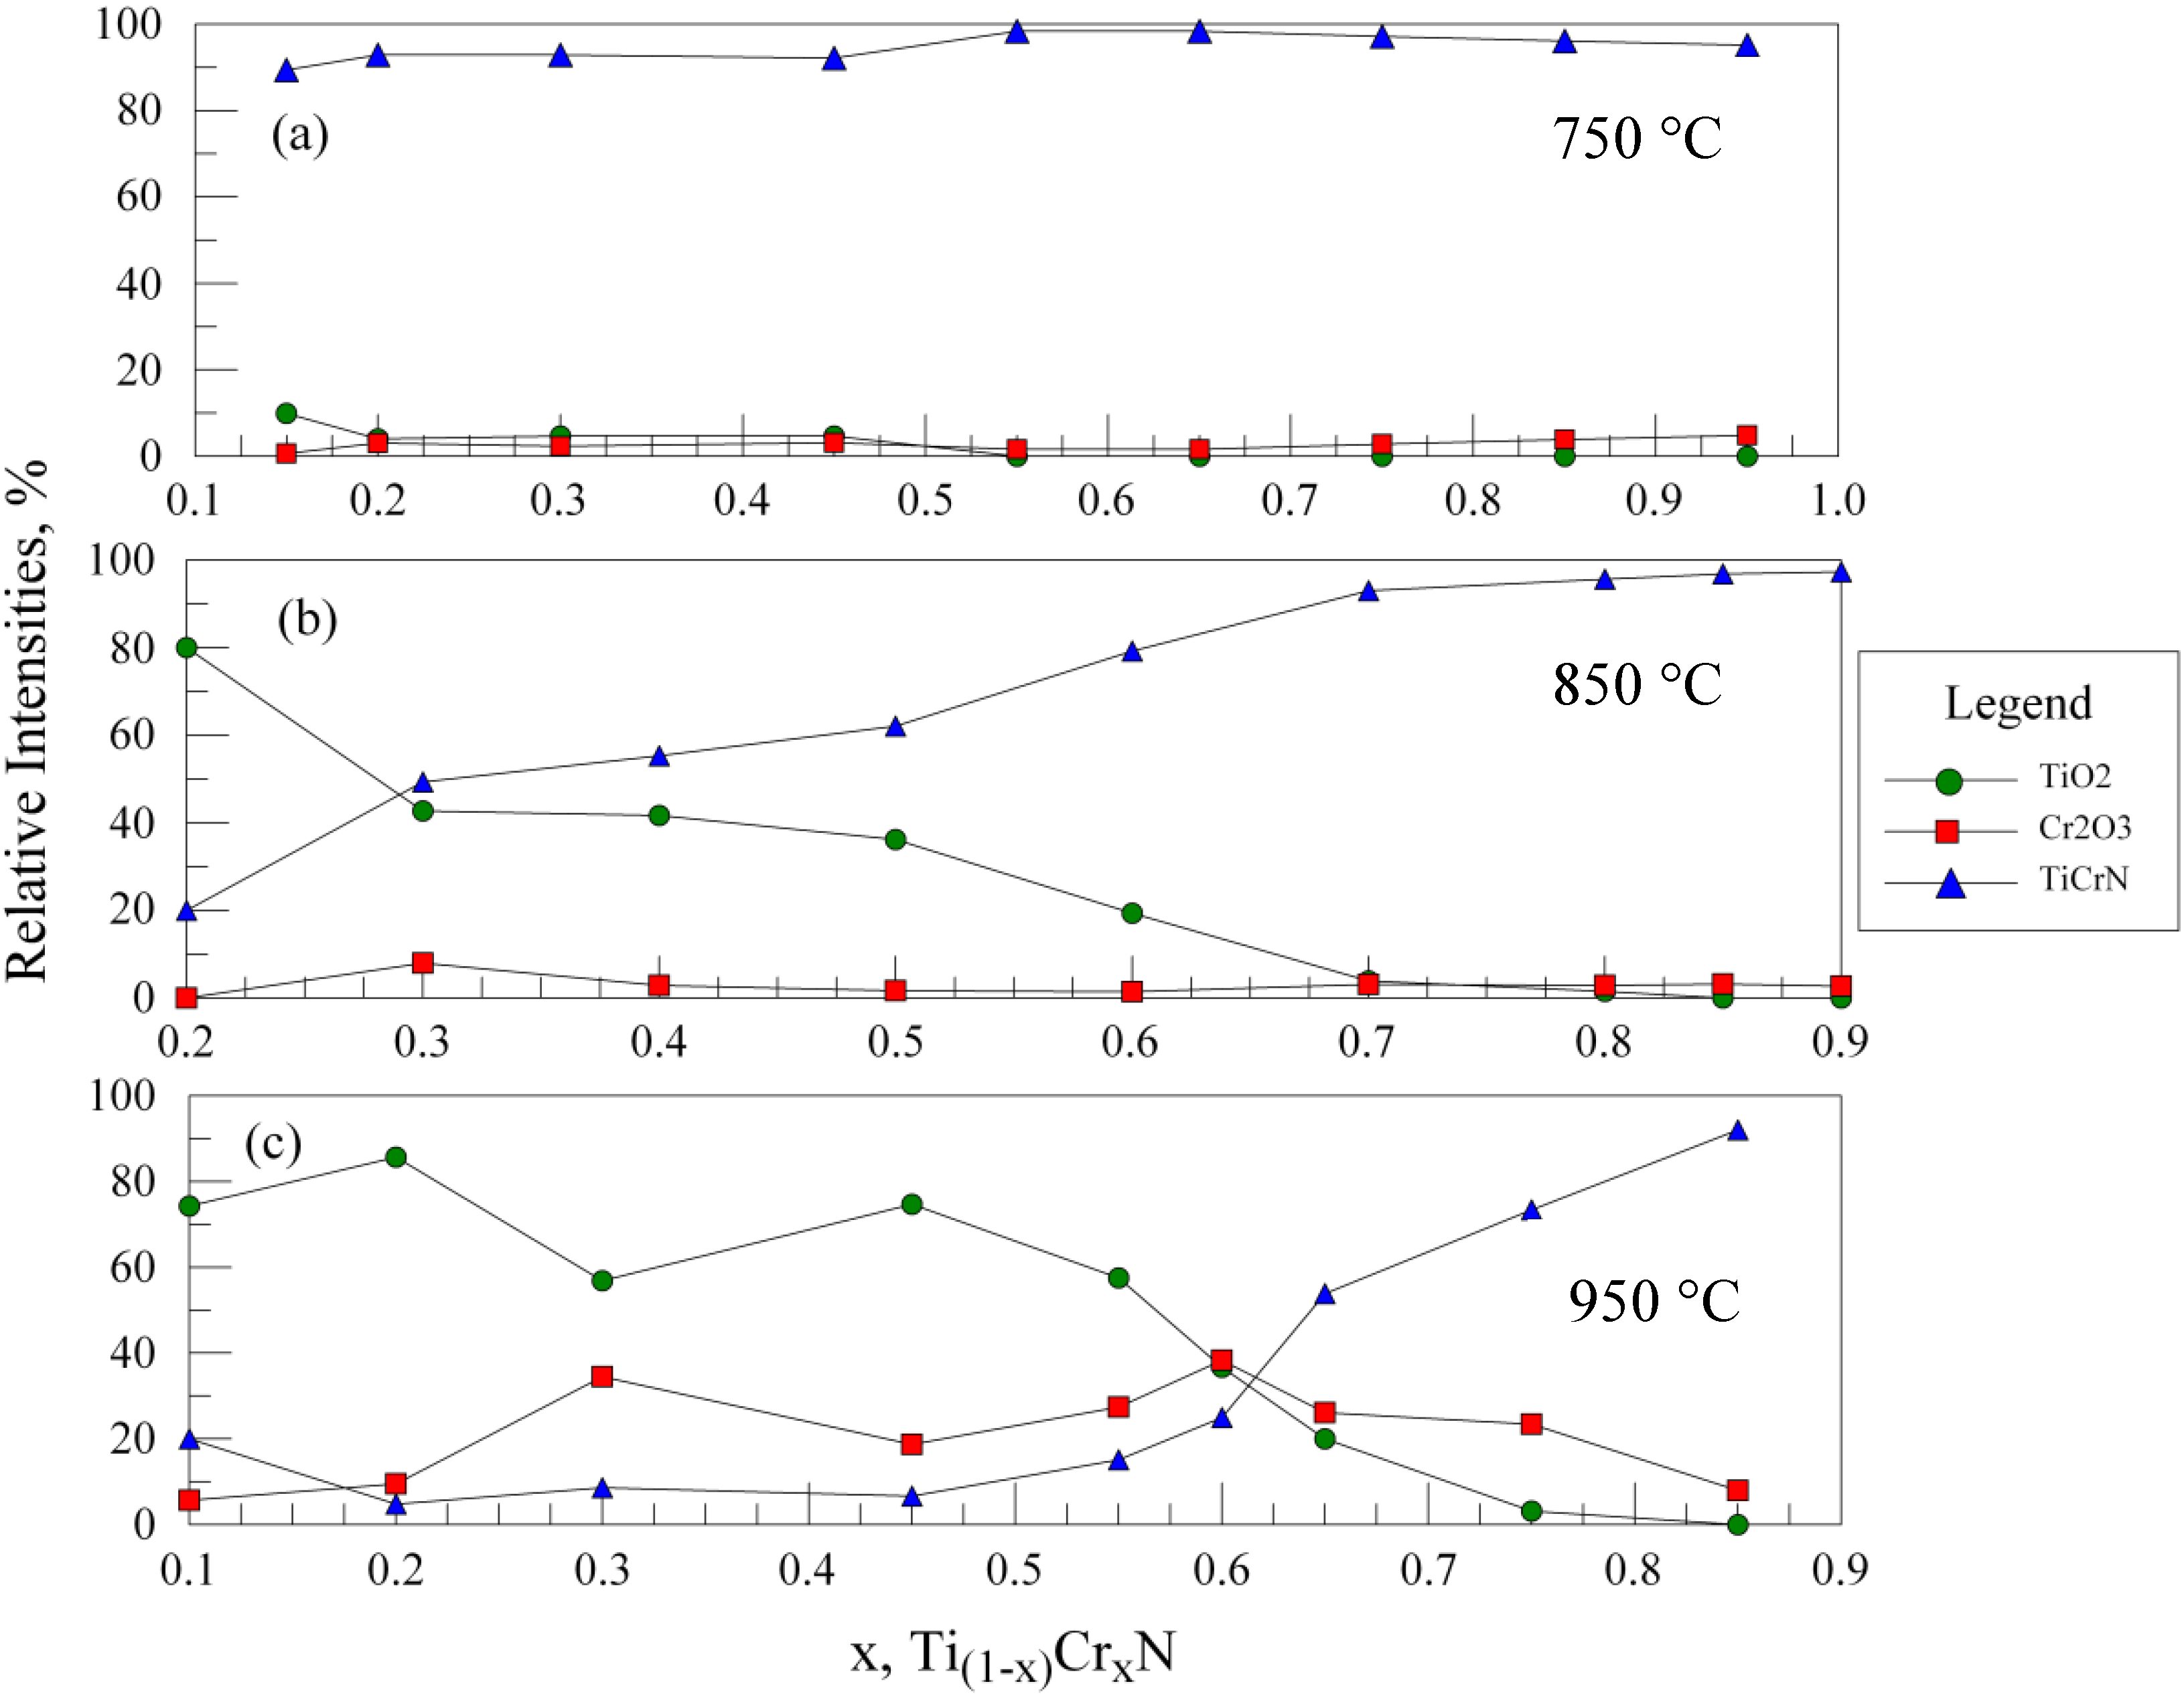
In order to assess the relative oxidation behavior in the entire range of samples studied, the following analysis procedure was adopted. In each spectrum, the relative intensities of the (110) TiO2, the (104) Cr2O3, and the (111) and (200) of the TiCrN phases were measured (as maximum peak heights). The peaks were then renormalized to obtain a total 100% peak intensity, with the (111)/(200) peaks for TiCrN combined to represent this phase. The new relative intensities were plotted and the results are shown in Figure 4a–c for oxidation temperatures ranging from 750 to 950 °C (650 °C is not shown as little oxidation occurred). At 750 °C, while the extent of oxidation is still relatively small, the most evidence for oxidation is found in the samples with less than x = 0.5; the samples near x = 0.6 show the best resistance to oxidation. At 850 °C (Figure 4b), oxidation at the lowest Cr content shows the formation of mostly TiO2. As expected, the relative amount of TiO2 formed decreases with increasing Cr content, however, the amount of Cr2O3 does not increase in a complementary fashion. As a result, the relative amount of TiCrN is higher at larger Cr contents. This indicates that films with higher Cr contents are more oxidation resistant; at x = 0.7 and above little oxidation is evident. At 950 °C (Figure 4c), significant amounts of TiO2 and Cr2O3 are present for most compositions, although above x = 0.7 the sharply increasing amount of TiCrN indicates better oxidation resistance is obtained with increasing Cr content.
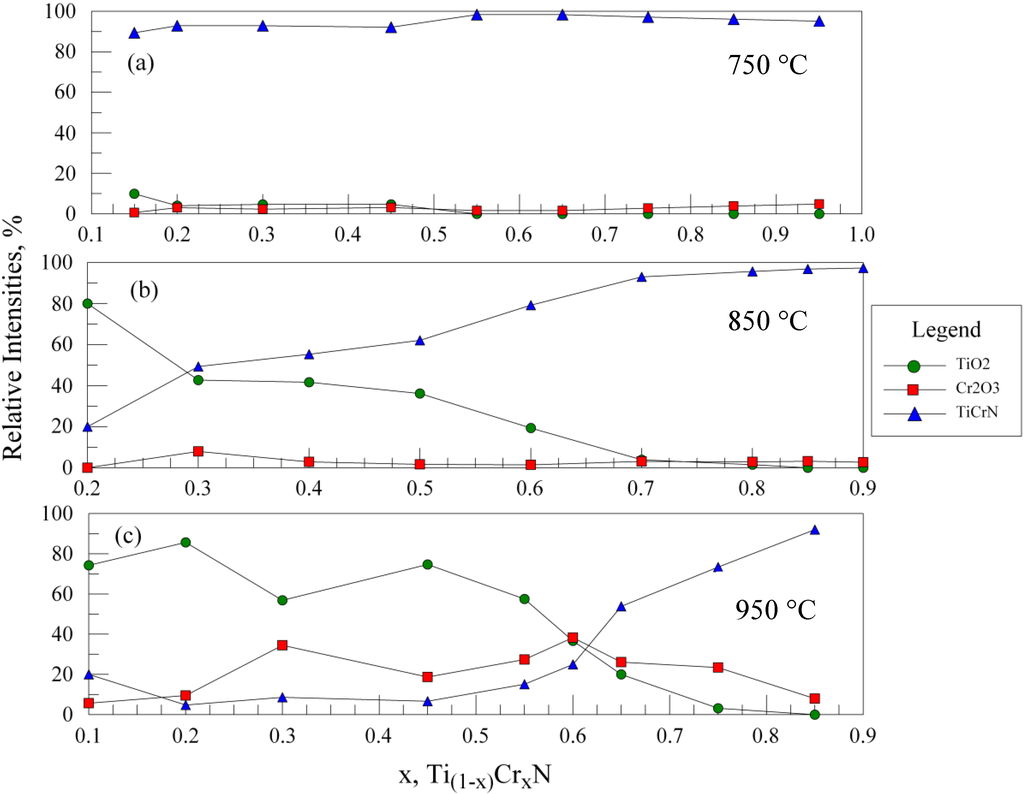
Figure 4.
XRD results for lateral gradient films oxidized for 30 min at (a) 750 °C; (b) 850 °C; and (c) 950 °C. The relative intensities of the TiO2, Cr2O3 and TiCrN phases are shown vs. the relative %Cr in the films. Note that for oxidation at 750 °C, as well as for films at 850 °C with greater than 70% Cr, very little oxidation is observed. At 950 °C, an improved oxidation resistance is found for films with x ≥ 0.7.
These results were compared to oxidation of pure TiN and Cr-nitride films. As expected, the TiN oxidized significantly even at 650 °C. The Cr-nitride film showed significant oxidation at 750 °C. However, the Cr-nitride films deposited in this study (using system II and the parameters shown in Table 1) formed the Cr2N structure in the as-deposited state. Previous research has shown that the activation energy for the oxidation of Cr2N is lower than that of CrN [22]. Furthermore, the mechanism for oxidation of CrN was found to occur by a decomposition of CrN to Cr2N, followed by conversion to the oxide. As shown in Figure 1, all of the Ti-Cr-N films studied here showed only the B1 structure with no evidence for the formation of Cr2N even at the highest Cr concentrations. Therefore, the improved oxidation resistance obtained in the TiCrN samples with relatively small amounts of Ti can be attributed to the stabilization of the B1-rocksalt structure and the ability to maintain the (Ti, Cr)N stoichiometry.
Based on the above results, a film with a nominal composition near x = 0.7 was selected for further study and deposited using system II on steel substrates as described in the previous section. (As shown below the actual composition of the film was determined to be x = 0.79.) This sample was cut into three sections and oxidized at temperatures of 750, 850 and 950 °C for 0.5 h. While the XRD results shown above indicate only minimal oxidation for this composition/temperature range, oxidation of the surface was visually evident and thereby appropriate for analysis by XPS. Table 2 shows the results for the as-deposited and oxidized samples. The as-deposited sample was ion etched for 15 min to remove surface contaminants. The spectrum showed only Ti, Cr and N to be present with an absolute nitrogen concentration of 42.1% and a Cr/Ti ratio of 3.7. After oxidation at 750 °C, the sample was analyzed after ion etching at three different times. The first step was to ion etch for 3 min, after which the adventitious carbon was removed. Chemical analysis showed no nitrogen present and a metal/oxygen ratio of 0.56, slightly below the expected 0.66 value for an M2O3 oxide. The Cr/Ti ratio was 4.0. After further etching for a total of 6 min, the metal/oxygen ratio was Cr/Ti ratio was 3.1. Additional etching, for a total of 16 min, again yielded 3.1 for the Cr/Ti ratio. Comparing the Cr/Ti ratio for the as-deposited and oxidized samples, the oxide contains a similar concentration of Cr.
Table 2.
XPS analysis of the as-deposited and oxidized Ti-Cr-N films (absolute concentrations shown; ND = not detected).
| Sample Treatment | Etch Time (min) | Cr at.% | Ti at.% | N at.% | O at.% | Cr/Ti Ratio |
|---|---|---|---|---|---|---|
| As-Deposited | 15 | 45.7 | 12.2 | 42.1 | ND | 3.7 |
| 30 min @ 750 °C | 3 | 28.9 | 7.3 | ND | 63.9 | 4.0 |
| 6 | 26.8 | 8.7 | ND | 64.5 | 3.1 | |
| 16 | 27.0 | 8.8 | ND | 64.2 | 3.1 | |
| 30 min @ 850 °C | 3 | 30.4 | 5.2 | ND | 64.5 | 5.8 |
| 6 | 31.0 | 3.9 | ND | 65.2 | 7.9 | |
| 16 | 35.2 | 4.4 | ND | 60.4 | 8.0 | |
| 30 min @ 950 °C | 5 | 36.4 | 5.6 | ND | 58.0 | 6.5 |
| 15 | 37.9 | 5.3 | ND | 59.9 | 7.2 | |
| 60 | 39.1 | 4.7 | ND | 56.1 | 8.3 |
The sample oxidized at 850 °C was also examined after ion etching for 3, 6 and 16 min. Overall, the Ti concentrations in the oxide were lower than those found for the 750 °C samples, yielding higher Cr/Ti ratios. The Cr/Ti ratio also increased slightly with depth, indicating a decreasing Cr gradient toward the surface, and therefore Cr diffusion outward. The outward diffusion of Cr was also reported by Otani and Hofmann [18]. However, the presence of Ti also indicates some oxygen diffuses through the oxide layer to react with Ti in the coating. This suggests a mechanism where the initial formation of the oxide occurs by nucleation of mixed Cr2O3/TiO2 grains, and then by outward diffusion of Cr and some inward diffusion of oxygen leaving a Cr-rich surface oxide layer. Previous studies [19,20,21,22] indicate that at higher Ti fractions in the coating, the volume of TiO2 formed, and the surface area associated with this volume, makes it energetically more favorable for the TiO2 to displace the Cr2O3 at the surface. This appears to occur below about x = 0.7 or a Cr/Ti ratio of 2.33.
The results of the XPS analysis after oxidation for 0.5 h at 950°C are also shown in Table 2. In this case, because the oxide layer was thicker, the ion etch times were increased to a total of 60 min. Again, only Cr, Ti and O were found; no Fe was detected. (As shown for the Si-substrate samples in Figure 3c, a substantial fraction of the original nitride film is still present even after oxidation at 950 °C, and this was verified by XRD for the steel-substrate samples as well.) The concentration of Cr and Cr/Ti ratios were again found to increase with depth. As in the 850 °C sample, the Cr/Ti ratios were higher than measured in the as-deposited coating. These results show the oxidation mechanism at 950 °C is similar to that observed at 850 °C.
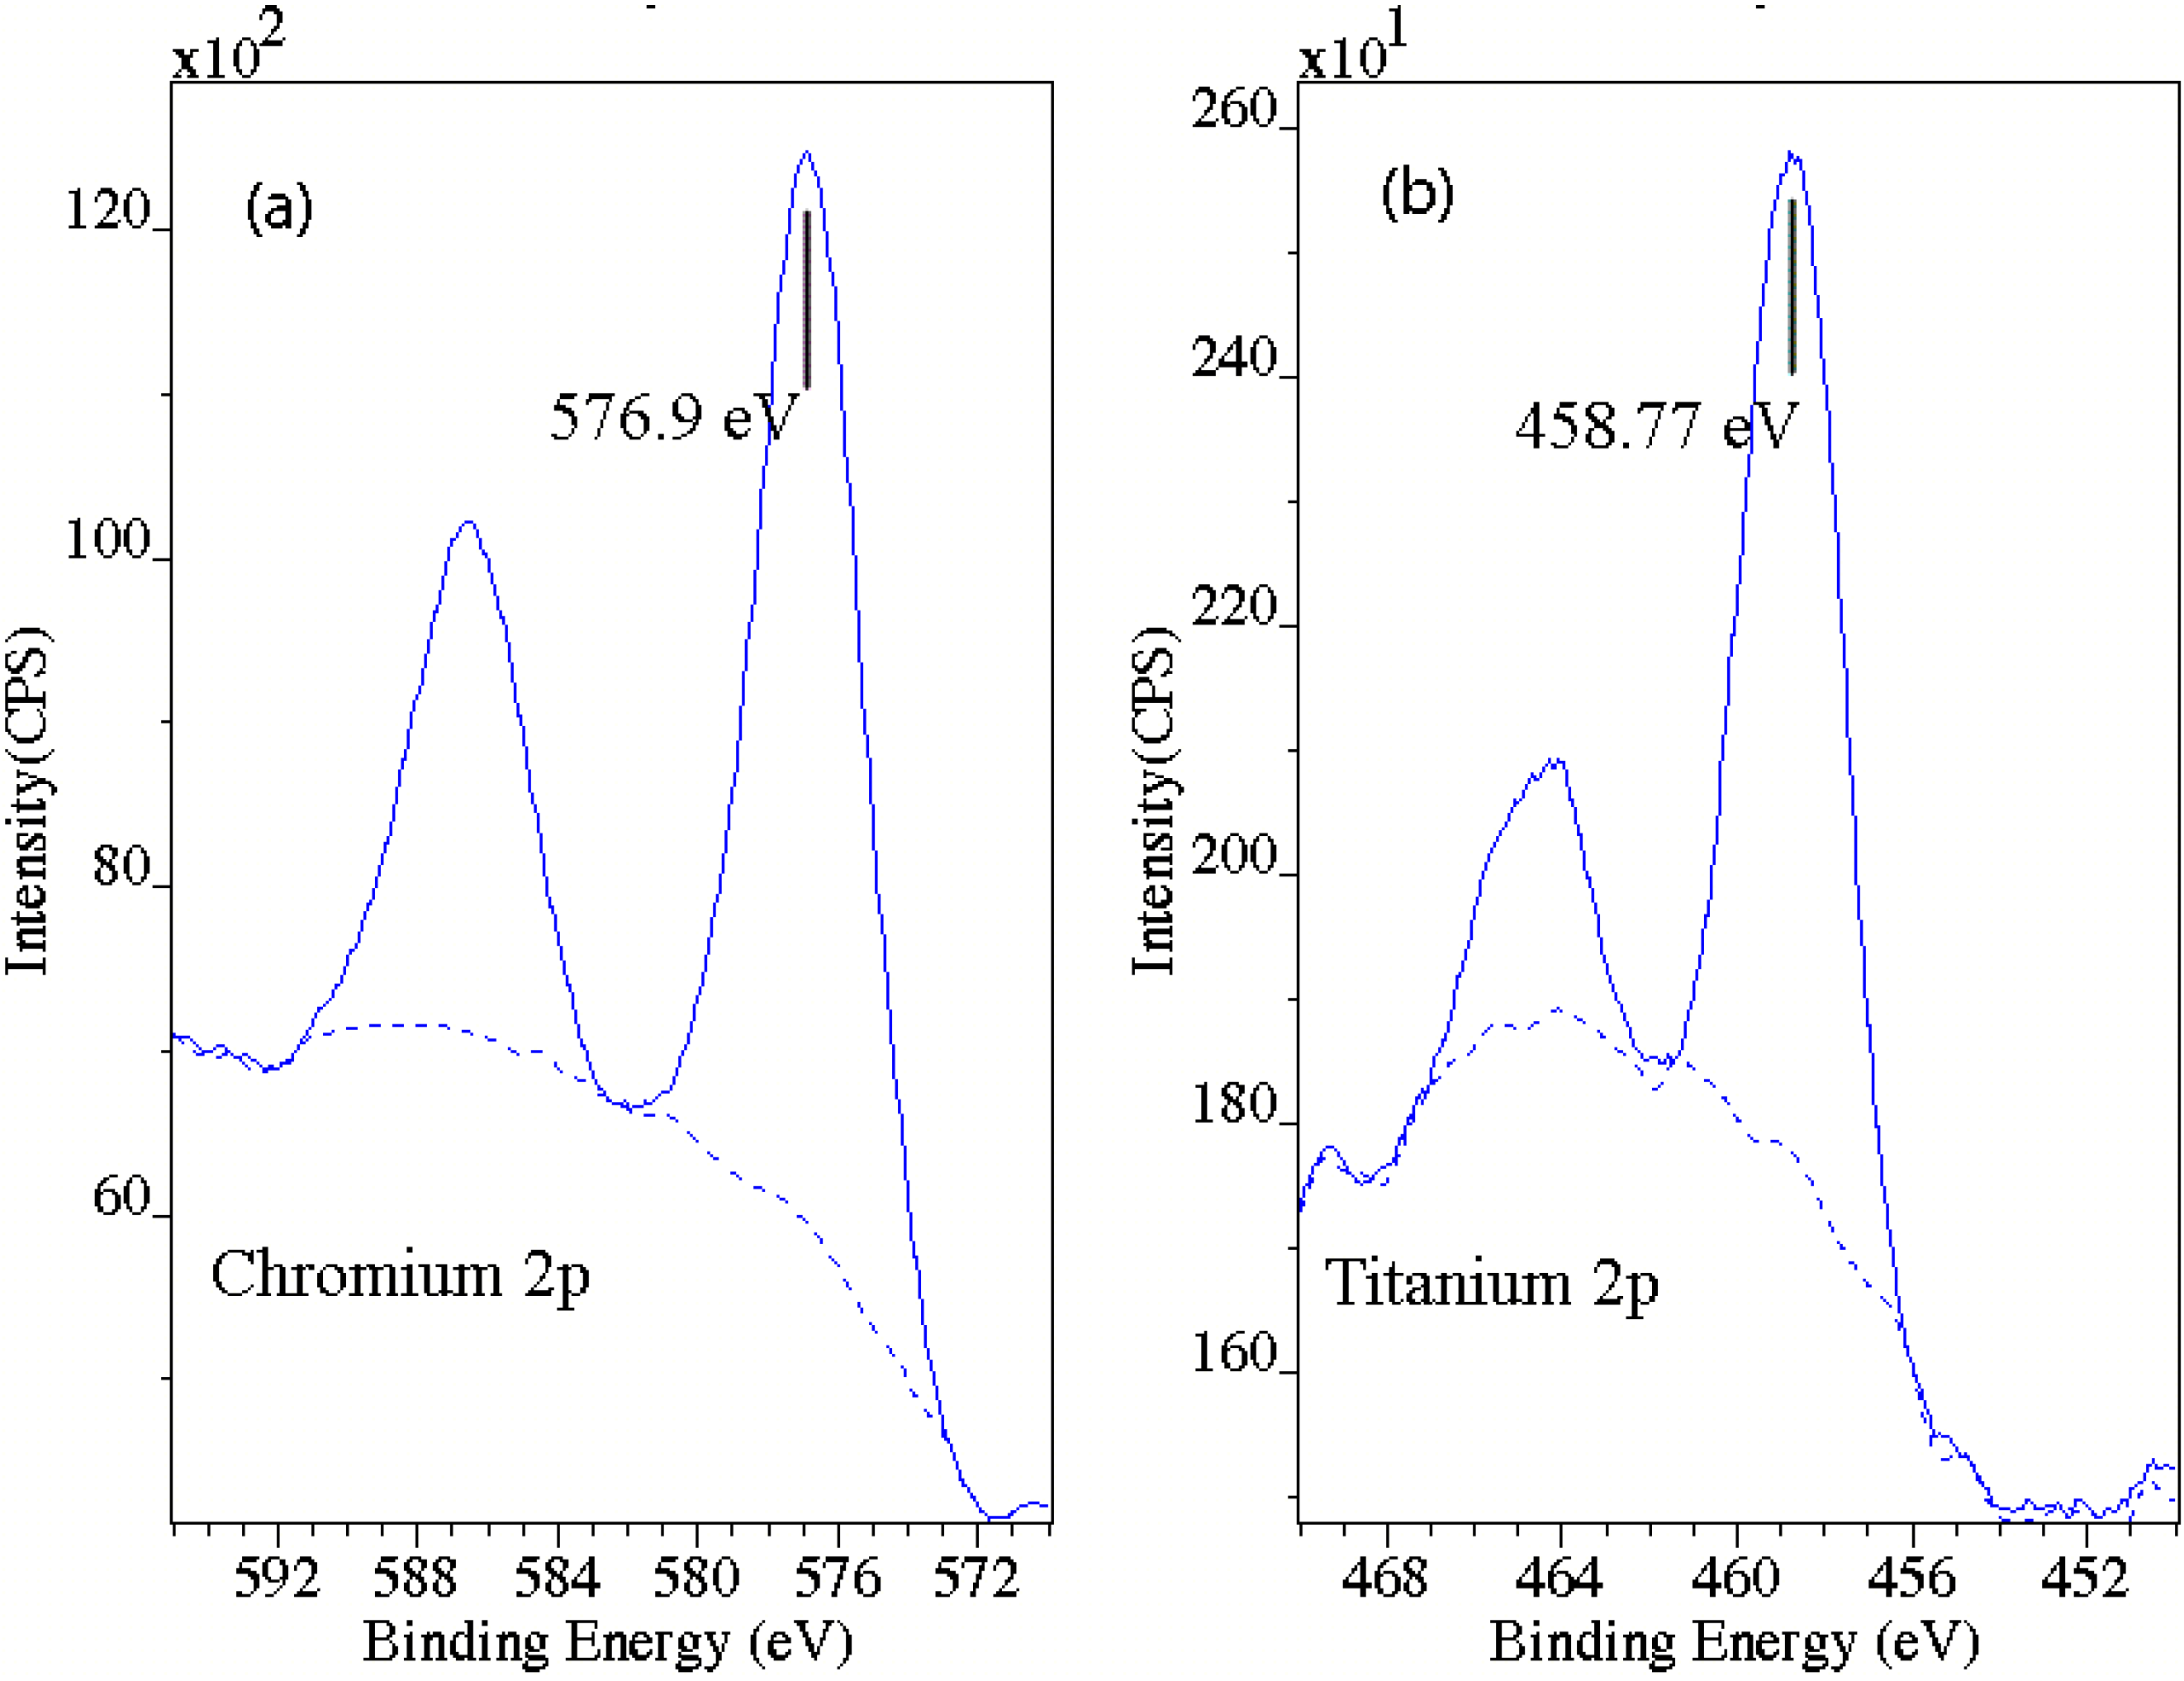
The oxidation state of Cr and Ti was also examined using XPS for the 850 °C sample. A detailed spectrum was acquired after the 16-min etch for the Cr and Ti 2p regions. The results are shown in Figure 5. The Cr peak is located at 576.9 eV, which is the accepted value for Cr in Cr2O3[23]. For Ti, the 2p3/2 peak was found at 458.77 eV, which is very close to the values typically reported for TiO2[23]. The peak position for Ti2O3 has been reported as 456.9 eV [24], about 2 eV below that for TiO2, and no peaks were observed at this energy. These results show that the oxide formed is a mixed oxide of Cr2O3/TiO2 rather than Ti substitution within the Cr2O3 lattice.

Figure 5.
XPS spectra for (a) Cr 2p, and (b) Ti 2p regions. The locations of the peaks are consistent with the Cr2O3 and TiO2 phases, with no evidence for Ti2O3, which would appear at an energy of 457.8 eV. This demonstrates the absence of significant Ti within Cr2O3.
Figure 5.
XPS spectra for (a) Cr 2p, and (b) Ti 2p regions. The locations of the peaks are consistent with the Cr2O3 and TiO2 phases, with no evidence for Ti2O3, which would appear at an energy of 457.8 eV. This demonstrates the absence of significant Ti within Cr2O3.
The above results show that the oxidation process at 750 °C involves oxygen diffusion into the surface (along with out-diffusion of nitrogen), and conversion of the Ti-Cr nitride into mixed Cr2O3/TiO2 phases. Due to the relatively low temperatures, the long-range diffusion of Cr or Ti is limited and the oxide composition is only slightly more Cr-rich than the nitride. However, at oxidation temperatures of 850 and 950 °C, more substantial diffusion of Cr can occur, bringing Cr to the surface. The limited ability of Ti to diffuse through the Cr2O3 layer, and the lack of a continuous TiO2 phase at this composition, renders the Ti relatively immobile. Therefore, despite the likely lower surface energy of TiO2, Cr2O3 is the dominant species at the surface due to these kinetic constraints, in contrast to lower-Cr films that typically exhibit TiO2 surface layers [19,21]. These results are also consistent with those of Lee et al. [21], who examined a film of nearly the same Cr/Ti ratio and found Cr2O3 as the surface oxide with little evidence of Ti. They also observed the formation of voids near the oxide/coating interface, which is due to the outward diffusion of Cr with limited diffusion of Ti. In our samples, we noted that for the uniform x = 0.79 films deposited on steel substrates, some peeling of the film was noted after oxidation at 950 °C. This could be a consequence of void formation at the oxide/coating interface.
4. Conclusions
- Evaluation of Ti-Cr-N films through the complete range of Ti/Cr compositions showed the best oxidation resistance is obtained for films with greater than x = 0.70;
- Comparison of the Cr-nitride films to high-Cr content Ti-Cr-N films showed that Ti stabilizes the B1-structure over that of the Cr2N structure, and this effect provides superior oxidation resistance;
- Examination of a high-Cr content film (x = 0.79) showed that the oxidized surface layer was mainly Cr2O3 with small amounts of TiO2, with a higher Cr/Ti ratio than the initial nitride film;
- The Cr/Ti ratios measured near the oxide surface indicate an outward diffusion of Cr, particularly at the higher temperature (850–950 °C). This limits pathways for Ti diffusion and inhibits the formation of a TiO2 surface layer, which is typically observed in coatings with lower Cr compositions.
Acknowledgments
The authors are grateful for the support of the US National Science Foundation under grant #CMMI/MCME-1031052.
Author Contributions
James E. Krzanowski: X-ray photoelectron spectroscopy analysis of oxidized films, SEM analysis, and manuscript preparation; Daniel J. Foley: Deposition of nitride films, annealing of films, X-ray diffraction analysis of as-deposited and oxidized films.
Conflicts of Interest
The authors declare no conflict of interest.
References
- Mayrhofer, P.H.; Mitterer, C.; Hultman, L.; Clemens, H. Microstructural design of hard coatings. Prog. Mater. Sci. 2006, 51, 1032–1114. [Google Scholar]
- Münz, W.-D. Titanium aluminum nitride films: A new alternative to TiN coatings. J. Vac. Sci. Technol. A 1986, 4. [Google Scholar] [CrossRef]
- Musil, J.; Hruby, H. Superhard nanocomposite Ti1−xAlxN films prepared by magnetron sputtering. Thin Solid Films 2000, 365, 104–109. [Google Scholar] [CrossRef]
- Bobzin, K.; Lugscheider, E.; Maes, M.; Immich, P.; Bolz, S. Grain size evaluation of pulsed TiAlN nanocomposite coatings for cutting tools. Thin Solid Films 2007, 515, 3681–3684. [Google Scholar] [CrossRef]
- Veprek, S.; Reiprich, S.; Li, S.H. Superhard nanocrystalline composite materials—The TiN/Si3N4 system. Appl. Phys. Lett. 1995, 66, 2640–2642. [Google Scholar] [CrossRef]
- Cheng, Y.H.; Browne, T.; Heckerman, B.; Meletis, E.I. Mechanical and tribological properties of nanocomposite TiSiN coatings. Surf. Coat. Technol. 2010, 204, 2123–2129. [Google Scholar] [CrossRef]
- Kim, K.H.; Park, B.H. Mechanical properties and oxidation behavior of Ti-Si-N films prepared by plasma-assisted CVD. Chem. Vap. Depos. 1999, 5, 275–279. [Google Scholar] [CrossRef]
- Meng, W.J.; Zhang, X.D.; Shi, B. Microstructure and mechanical properties of Ti-Si-N coatings. J. Mater. Res. 2002, 17, 2628–2632. [Google Scholar] [CrossRef]
- Vishnyakov, V.M.; Bachurin, V.I.; Minnebaev, K.F.; Valizadeh, R.; Teer, D.G.; Colligon, J.S.; Vishnyakov, V.V.; Yurasova, V.E. Ion assisted deposition of titanium chromium nitride. Thin Solid Films 2006, 497, 189–195. [Google Scholar] [CrossRef]
- Aouadi, S.M.; Wond, K.C.; Mitchell, K.A.R.; Namavar, F.; Tobin, E.; Mihut, D.M.; Rohde, S.L. Characterization of titanium chromium nitride nanocomposite protective coatings. Appl. Surf. Sci. 2004, 229, 387–394. [Google Scholar] [CrossRef]
- Lee, S.Y.; Kim, G.S.; Hahn, J.H. Effect of the Cr content on the mechanical properties of nanostructured TiN/CrN coatings. Surf. Coat. Technol. 2004, 177–178, 426–433. [Google Scholar] [CrossRef]
- Jung, D.H.; Park, H.S.; Na, H.S.; Lim, J.W.; Lee, J.J.; Joo, J.H. Mechanical properties of (Ti, Cr)N coatings deposited by inductively coupled plasma assisted direct current magnetron sputtering. Surf. Coat. Technol. 2003, 169–170, 424–427. [Google Scholar] [CrossRef]
- Vattanaprateep, N.; Panich, N.; Surinphong, S.; Tungasmita, S.; Wangyao, P. Structural and mechanical properties of nanostructured TiAlCrN thin films deposited by cathodic arc deposition. High Temp. Mat. Proc. 2013, 32, 107–111. [Google Scholar]
- Sullivan, J.F.; Huang, F.; Barnard, J.A.; Weaver, M.L. Effect of nitrogen pressure on the hardness and chemical states of TiAlCrN coatings. J. Vac. Sci. Tech. A 2005, 23, 78–84. [Google Scholar] [CrossRef]
- Santana, A.E.; Karimi, A.; Derflinger, V.H. Microstructure and mechanical behavior of TiAlCrN multilayer thin films. Surf. Coat. Technol. 2004, 177, 334–340. [Google Scholar]
- Warcholinski, B.; Gilewicz, A.; Myslinski, P. Tribolgical properties of TiAlCrN Thin Films. Rev. Adv. Mater. Sci. 2009, 22, 81–88. [Google Scholar]
- Qiang, R.; Shejun, H.; Nacan, H. Properties of TiAlCrN coatings prepared by vacuum cathodic arc ion plating. Rare Metals 2008, 27, 251–256. [Google Scholar] [CrossRef]
- Otani, Y.; Hofmann, S. High temperature oxidation behavior of (Ti1−xCrx)N coatings. Thin Solid Films 1996, 287, 188–192. [Google Scholar] [CrossRef]
- Lee, D.B.; Kim, M.H.; Lee, Y.C.; Kwon, S.C. High temperature oxidation of TiCrN coatings deposited by ion plating. Surf. Coat. Technol. 2001, 141, 232–239. [Google Scholar] [CrossRef]
- Lee, K.H.; Jung, S.J.; Lee, J.J.; Park, C. High-temperature oxidation behaviors of (Ti1−xCrx)N coatings. J. Mat. Sci. Lett. 2002, 21, 423–425. [Google Scholar] [CrossRef]
- Lee, D.B. TEM study on oxidized TiCrN coatings ion-plated on a steel substrate. Surf. Coat. Technol. 2003, 173, 81–86. [Google Scholar] [CrossRef]
- Hsieh, W.P.; Wang, C.C.; Lin, C.H.; Shieu, F.S. Oxidation of arc-ion plated CrN coatings at elevated temperatures. J. Electrochem. Soc. 2002, 149, B234–B238. [Google Scholar] [CrossRef]
- Moulder, J.F.; Stickle, W.F.; Sobol, D.E.; Bomben, K.D. Handbook of X-ray Photoelectron Spectroscopy. Physical Electronics, Inc.: Eden Pararie, MN, USA, 1995; pp. 73, 77. [Google Scholar]
- Chan, C.M.; Trigwell, S.; Duerig, T. Oxidation of an NiTi alloy. Surf. Interface Anal. 1990, 15, 349–354. [Google Scholar] [CrossRef]
© 2014 by the authors; licensee MDPI, Basel, Switzerland. This article is an open access article distributed under the terms and conditions of the Creative Commons Attribution license (http://creativecommons.org/licenses/by/3.0/).