1. Introduction
Titanium diboride (TiB
2) ceramics exhibit various attractive properties which are interesting for technical applications: a high melting point (~3225 °C), high thermal conductivity (37–122 W·m
−1·K
−1 at 300 K), low electric resistivity (~0.13 µΩ·m), a relatively low density (4.5 g/cm
3), excellent chemical stability, and a high hardness (20–30 GPa) [
1,
2,
3,
4,
5,
6,
7]. Materials based on titanium diboride are in use as cutting tools, wear resistant parts, protective coatings, diffusion barriers, and for a reinforcement of carbide ceramics [
1,
2,
3,
4,
5,
6,
7,
8,
9,
10]. Appropriate deposition techniques like magnetron sputtering, dynamic ion mixing, electron beam evaporation or chemical vapour deposition allow producing TiB
2 thin films or coatings as hard materials [
11,
12,
13,
14,
15,
16,
17,
18,
19,
20]. Superhard coatings composed of over-stoichiometric nanocolumnar TiB
2 and synthesized by DC magnetron sputtering show hardness values of 60 GPa [
11]. In order to improve toughness and creep resistance of bulk titanium diboride ceramics, tungsten rich platelets were precipitated in-situ in a supersaturated (Ti,W,Cr,)B
2 solid solution [
21,
22,
23,
24,
25]. These precipitates lead to crack deflection and branching [
26]. Concerning thin films, it was recently shown [
27] that it is possible to deposit (Ti,W,Cr,)B
2 coatings with a thickness of about 1 µm on silicon substrates by DC magnetron sputtering of compound targets. X-ray diffractometry and electron microscopy characterizations show the presence of a columnar amorphous structure after deposition. Annealing the coatings at temperatures up to 1300 °C results in the formation of nano-crystalline precipitations composed of (Ti,W,Cr)B
2 (P6mmm), β-(W,Ti,Cr)B (Cmcm) and W
2B
4 (P6mmc) phases.
The aim of the present paper is to compare the thermally induced microstructural modifications in coatings of composition (Ti
0.49W
0.51)B
2 and (Ti
0.44W
0.30Cr
0.26)B
2 which are deposited on steel substrates to those sputtered on silicon substrates as given in [
27]. Heat treatments are applied in order to induce formation of a nano-crystalline structure and to tailor grain diameters. Further, it should be investigated in which way precipitation and phase formation are different for both type of substrates. The ability of these coatings as a candidate for hard coatings, re-enforced by nano-structuring is explored.
2. Experimental Section
The coatings were deposited by dc magnetron sputtering using sputter targets of composition (Ti
0.49W
0.51)B
1.97 and (Ti
0.44W
0.30Cr
0.26)B
1.95 [
27]. The chemical composition of the targets was measured by inductively coupled plasma-optical emission spectroscopy. The targets (about 50 mm diameter) were produced at RWTH Aachen by reaction sintering of TiB
2, WB
2 and CrB
2 powders (Japan New Metals Co., LTD., Osaka, Japan). The powders, which contain less than 1 wt% of impurities (C, Fe, N, O) were first mixed with isopropanol and were afterwards high-energy milled with WC/Co hard balls in order to improve sinter activity. Reaction sintering was done in argon in a uni-axial graphite hot press in boron nitride coated graphite crucibles at 50 MPa and 2100 °C for 8 h. In a second process step, the specimens were homogenized at 2000 °C for 8 h at ambient argon pressure and afterwards ground and polished.
About 1 µm thick films were sputtered on steel substrates (1.2210 115CrV3), containing about 1.2 wt% C, 0.7 wt% Cr, and 0.1 wt% V. After cleaning ultrasonically with ethanol, the substrates were fixed on a rotating sample holder with a target to substrate distance of about 13 cm. The target was tilted by about 17° from the direction perpendicular to the sample surface. All experiments were done in argon gas at 0.67 Pa (base pressure: 1.3 × 10
−3 Pa) at a sputtering power between 0.2 and 0.4 kW. The temperature of the coating during sputtering was detected by a type K thermocouple to be about 110 °C. As demonstrated in [
27], the chemical composition of the target is nearly identical to that of the coating, as proven by Rutherford backscattering spectrometry (RBS). Consequently, the chemical composition of the coatings is assumed to be (Ti
0.49W
0.51)B
2 and (Ti
0.44W
0.30Cr
0.26)B
2. The possible slight under-stoichiometry of boron is neglected.
The coatings were isothermally annealed at temperatures between 700 °C and 1100 °C at ambient argon pressure and quenched afterwards. In order to reduce a possible formation of oxide layers during annealing, two samples were placed on each other with the coated surface, were embedded in fine powder of TiB2 and were placed in a crucible.
Grazing incidence X-ray diffraction (GI-XRD) was carried out by a Siemens D5000 diffractometer in the asymmetric α/2θ modus using CoKα radiation (40 kV, 40 mA). Phase analysis was done using the program Powdercell for Windows 2.4 [
28]. The cross-sectional morphology of the coatings was examined by a field emission scanning electron microscope (FESEM) of the type FP 2067/32 Helios Nanolab (FEI), operating at 2–5 keV. Element depth profiles were measured by secondary ion mass spectrometry (SIMS) using a CAMECA IMS-3F machine and an O- primary ion beam (15 keV). This analysis gives a plot: intensity of secondary ions
vs. sputter time for each element. The sputtered area was about 250 µm × 250 µm. Depth calibration according to a standard procedure was done by first measuring the resulting SIMS crater depth with a mechanical profilometer (Alphastep 500, KLA-Tencor, Milpitas, CA, USA). Afterwards the sputter time is converted into the actual sputtered depth by assuming that the crater depth corresponds to the maximum sputter time and that a linear relationship exists.
3. Results and Discussion
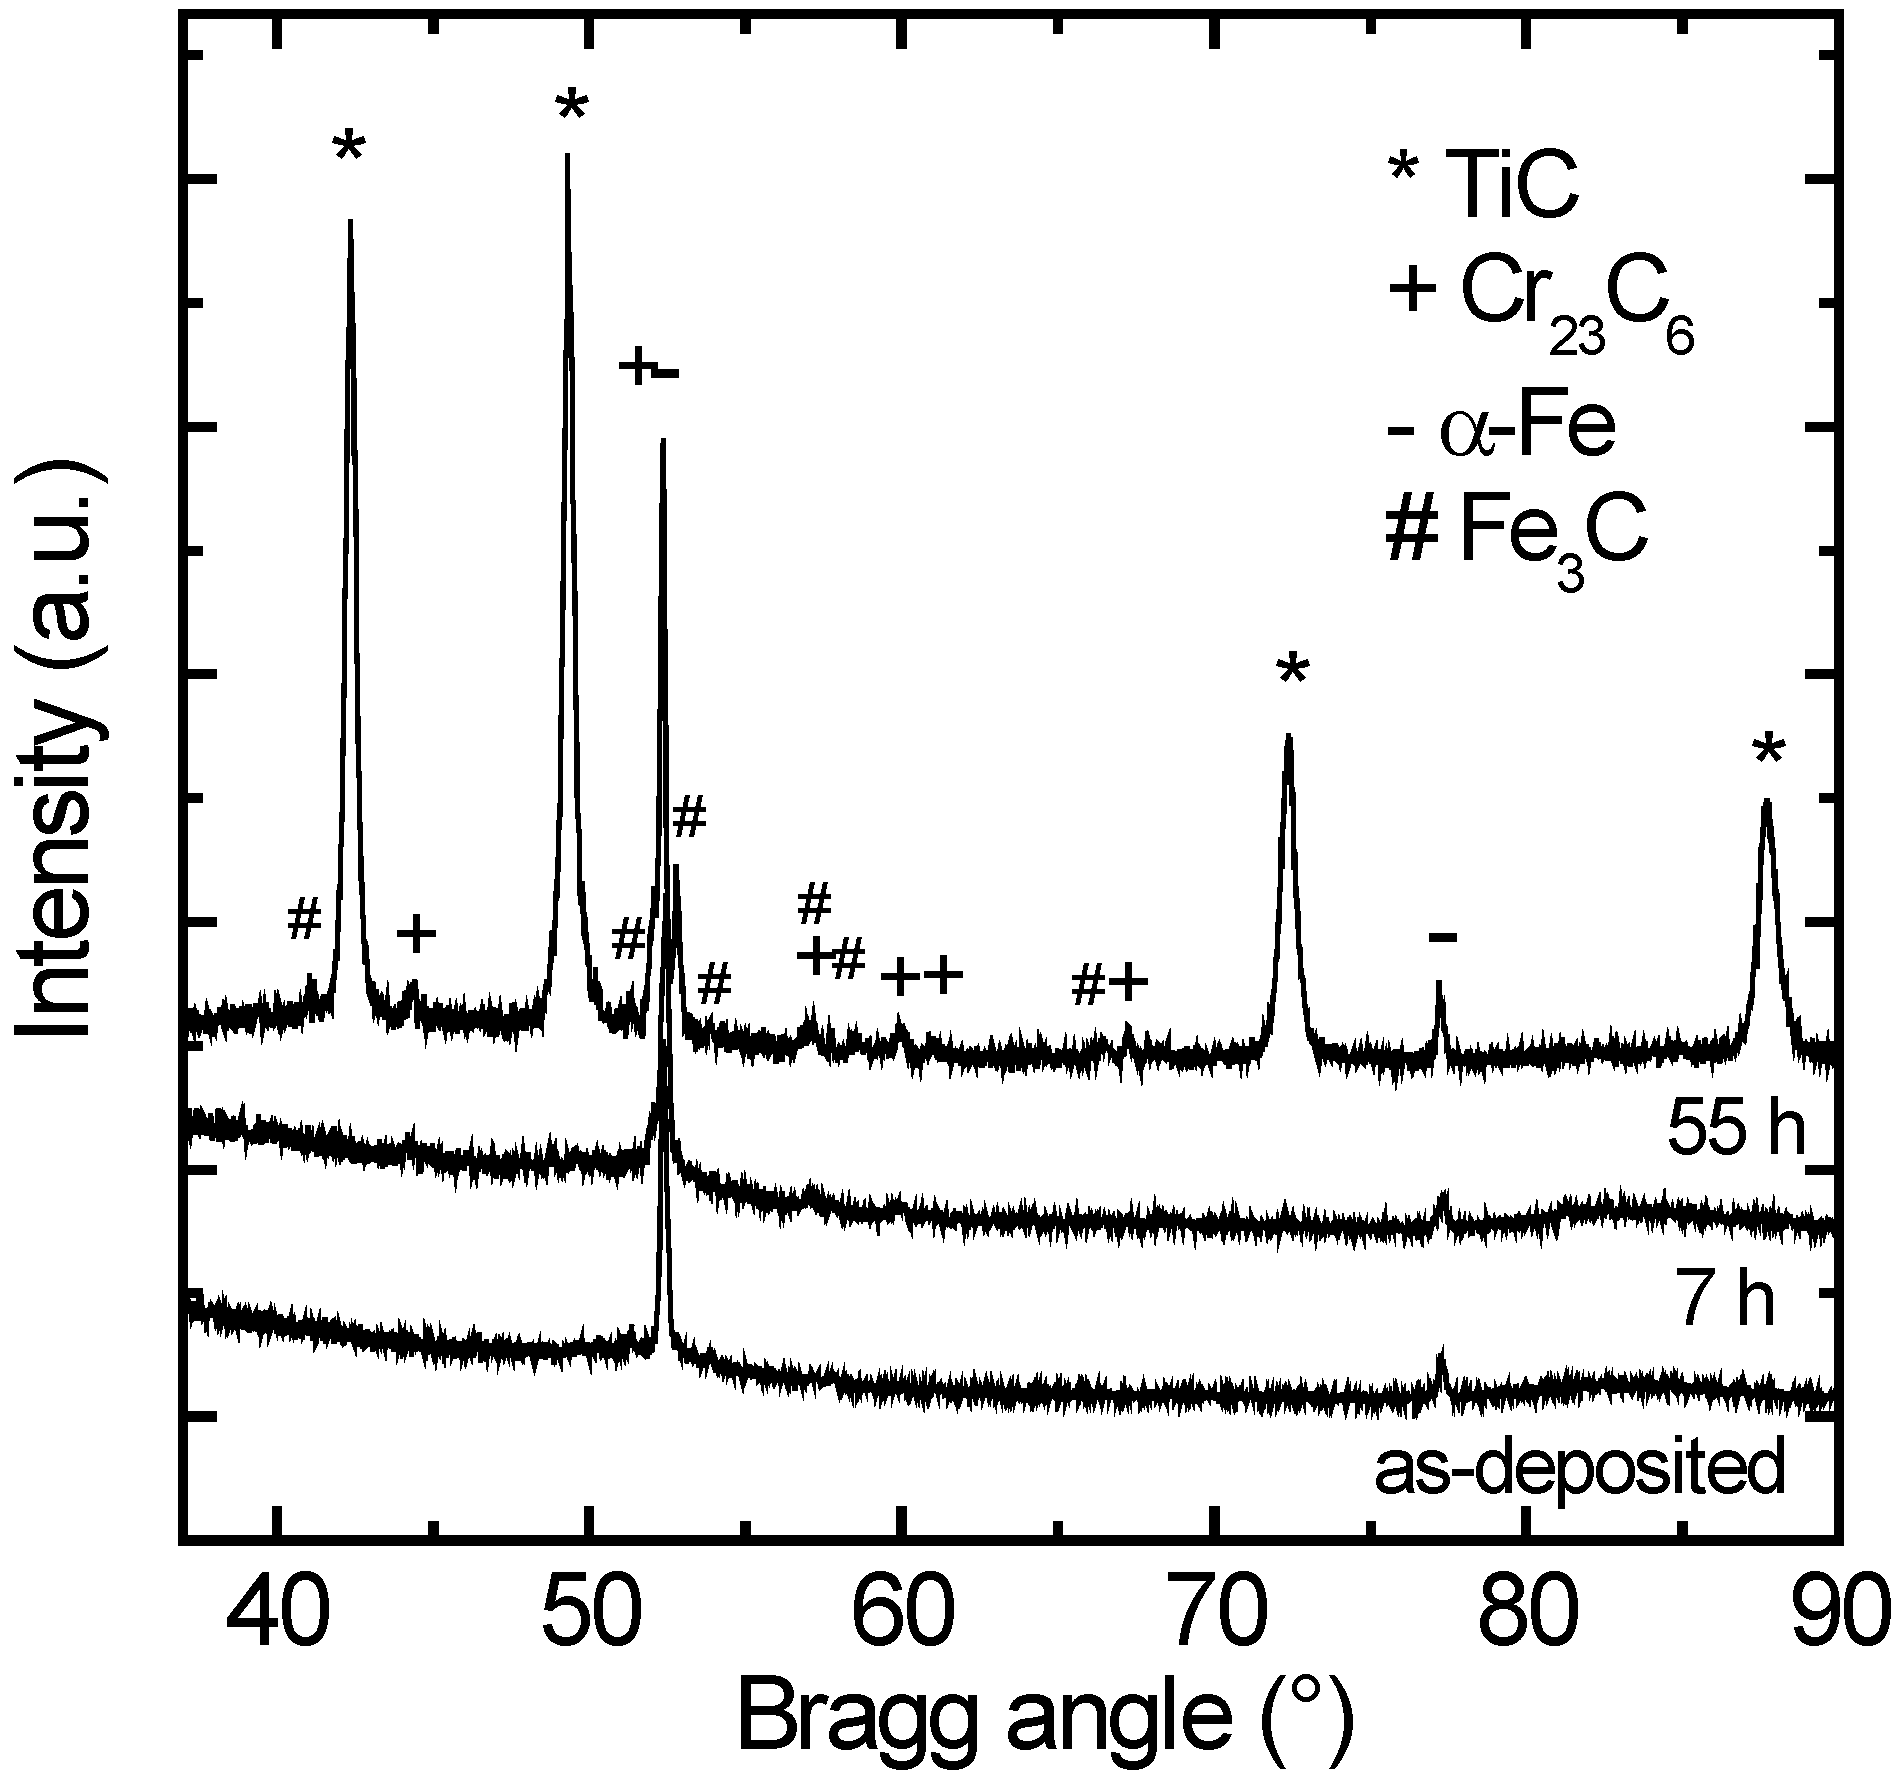
In
Figure 1 X-ray diffractograms of the Cr free coating (Ti
0.49W
0.51)B
2 are shown after deposition and after annealing at 700 °C for different times. As obvious, the coatings are X-ray amorphous after deposition (the same is true for the Cr containing coatings). The pattern only shows Bragg peaks which can be attributed to a α-Fe phase and a Fe
3C phase (low peaks) resulting from the steel substrate. Annealing of the as-deposited coatings at a temperature of 700 °C for some hours does not significantly modify the diffraction pattern as shown in
Figure 1. Only long term anneals for several tens of hours leads to the formation of crystalline precipitates. However, no boride phases are found as expected from preliminary work, where coatings of the same composition and with the same sputter parameters were deposited on silicon substrates [
27]. Instead, strong reflections of a cubic TiC phase (Fm-3m) [
29] with a lattice parameter of
a = (4.283 ± 0.005) Å occur. Lattice parameters are determined by fitting the X-ray diffractogram by the program Powder Cell for Windows 2.4 [
28]. An average grain size is assessed from the XRD pattern (width of the Bragg peak at 42.4°) annealed for 55 h using the Scherrer equation [
30]. A grain size of about 30 nm is found, indicating the formation of nano-crystalline precipitations during annealing. This grain size might be slightly under-estimated because effects of microstrain are neglected. However, for a rough estimate this approach is justified. In addition, small amounts (about 10%) of a cubic Cr
23C
6 phase (Fm-3m) [
29] with a lattice parameter of
a = 10.57 Å are also found. It is very likely that crystallization is not complete and a residual amorphous matrix phase is also present.
Figure 1.
Grazing incidence X-ray diffraction (GI-XRD) patterns of (Ti0.49W0.51)B2 coatings in the as-deposited state and after annealing at 700 °C for different annealing times. The precipitated phases of type TiC and Cr23C6 are indicated. The phases α-Fe and Fe3C result from the steel substrate.
Figure 1.
Grazing incidence X-ray diffraction (GI-XRD) patterns of (Ti0.49W0.51)B2 coatings in the as-deposited state and after annealing at 700 °C for different annealing times. The precipitated phases of type TiC and Cr23C6 are indicated. The phases α-Fe and Fe3C result from the steel substrate.
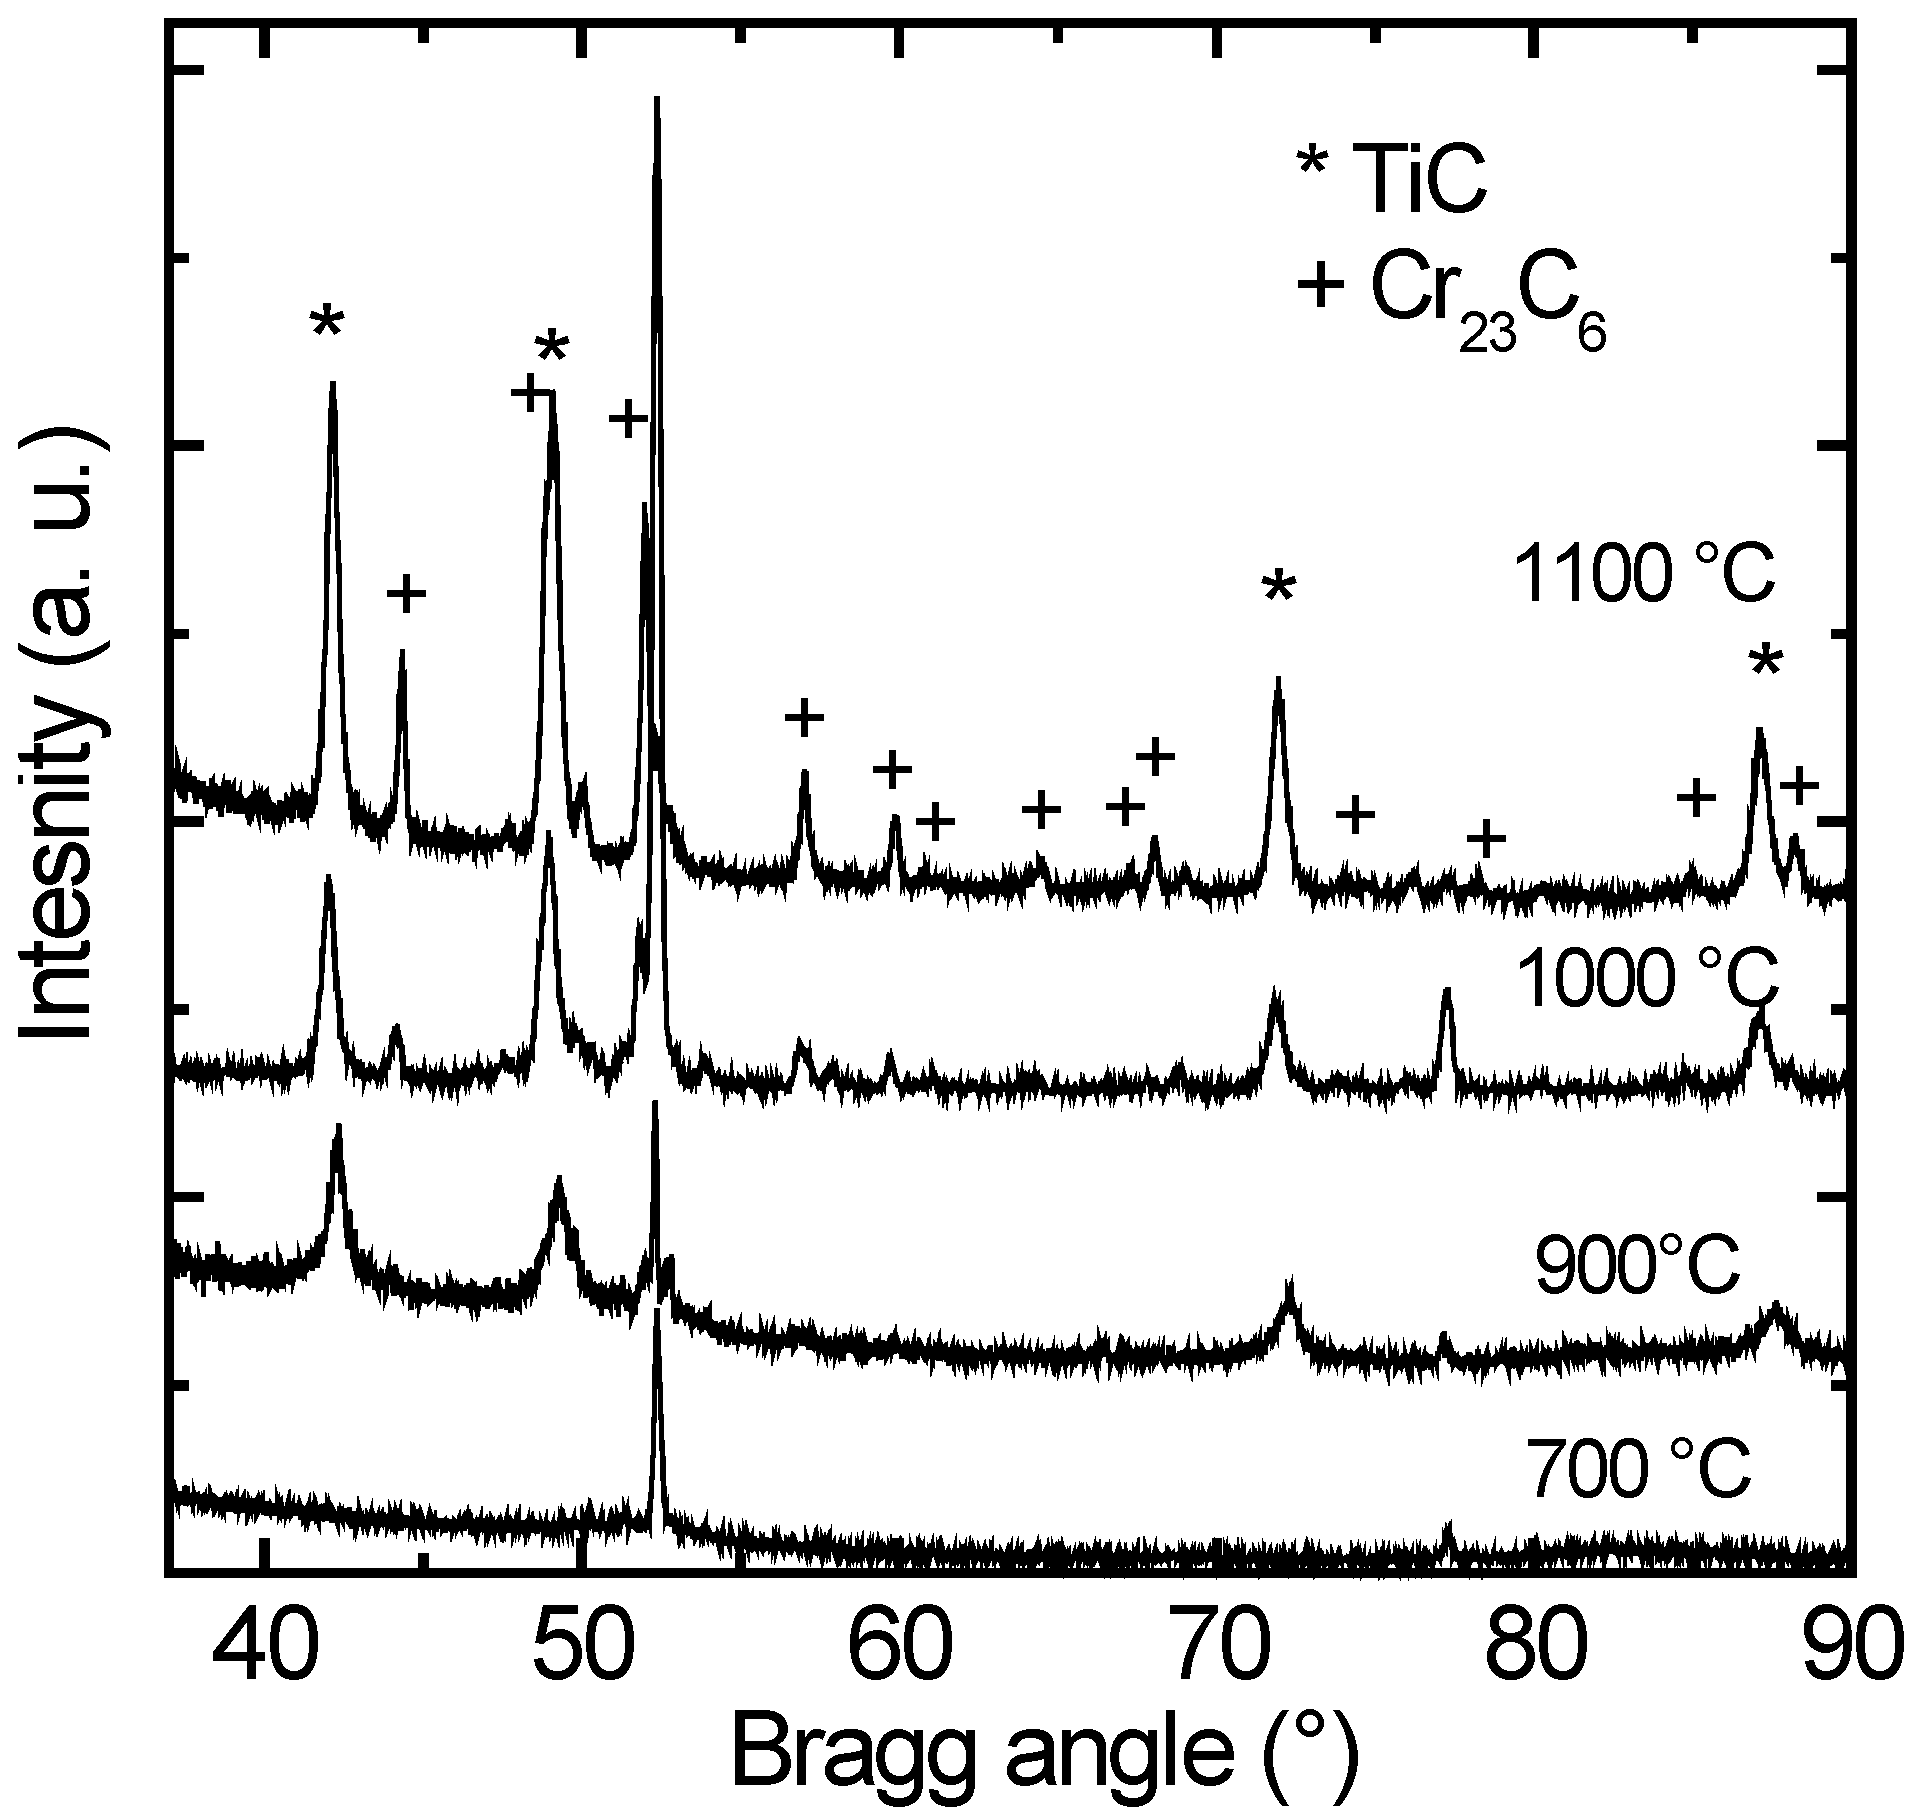
Similar behavior is observed for annealing the as-deposited coatings at higher temperatures of 900 °C, 1000 °C and 1100 °C, respectively. Here, precipitation kinetics is accelerated and the formation of TiC and Cr
23C
6 phases occurs already for an annealing time of only 0.5 h (shortest annealing time applied). In
Figure 2, X-ray patterns for annealing times of 0.5 h are plotted for these temperatures. It can be clearly seen, that first the TiC phase crystallizes at 900 °C and afterwards the Cr
23C
6 phase forms at 1000 °C and higher temperatures. The amount of the crystallized Cr
23C
6 phase increases up to 25% at higher annealing temperatures. The formation of crystalline precipitates starts at an about 200 K lower temperature as observed for silicon substrates [
27]. Grain sizes of the TiC and Cr
23C
6 phases obtained from the XRD patterns using the Scherrer formula (see above) are given in
Table 1. The grain size of the TiC phase ranges from 20 nm at low temperatures and short annealing times to 35 nm at high temperatures. This indicates that the crystallite size can be tailored by choosing adequate time-temperature annealing profiles. Similar results are found for the Cr
23C
6 phase (
Table 1). Here, the crystallite size varies between 35 and 60 nm. A further peculiarity of the results given in
Figure 2 and
Table 1 is that no significant amounts of boride compounds of type TiB
2 β-WB or W
2B
4 are found, also at temperatures as high as 1100 °C. This is in strong contrast to the results on silicon substrates [
27], where exclusively boride compounds are formed.
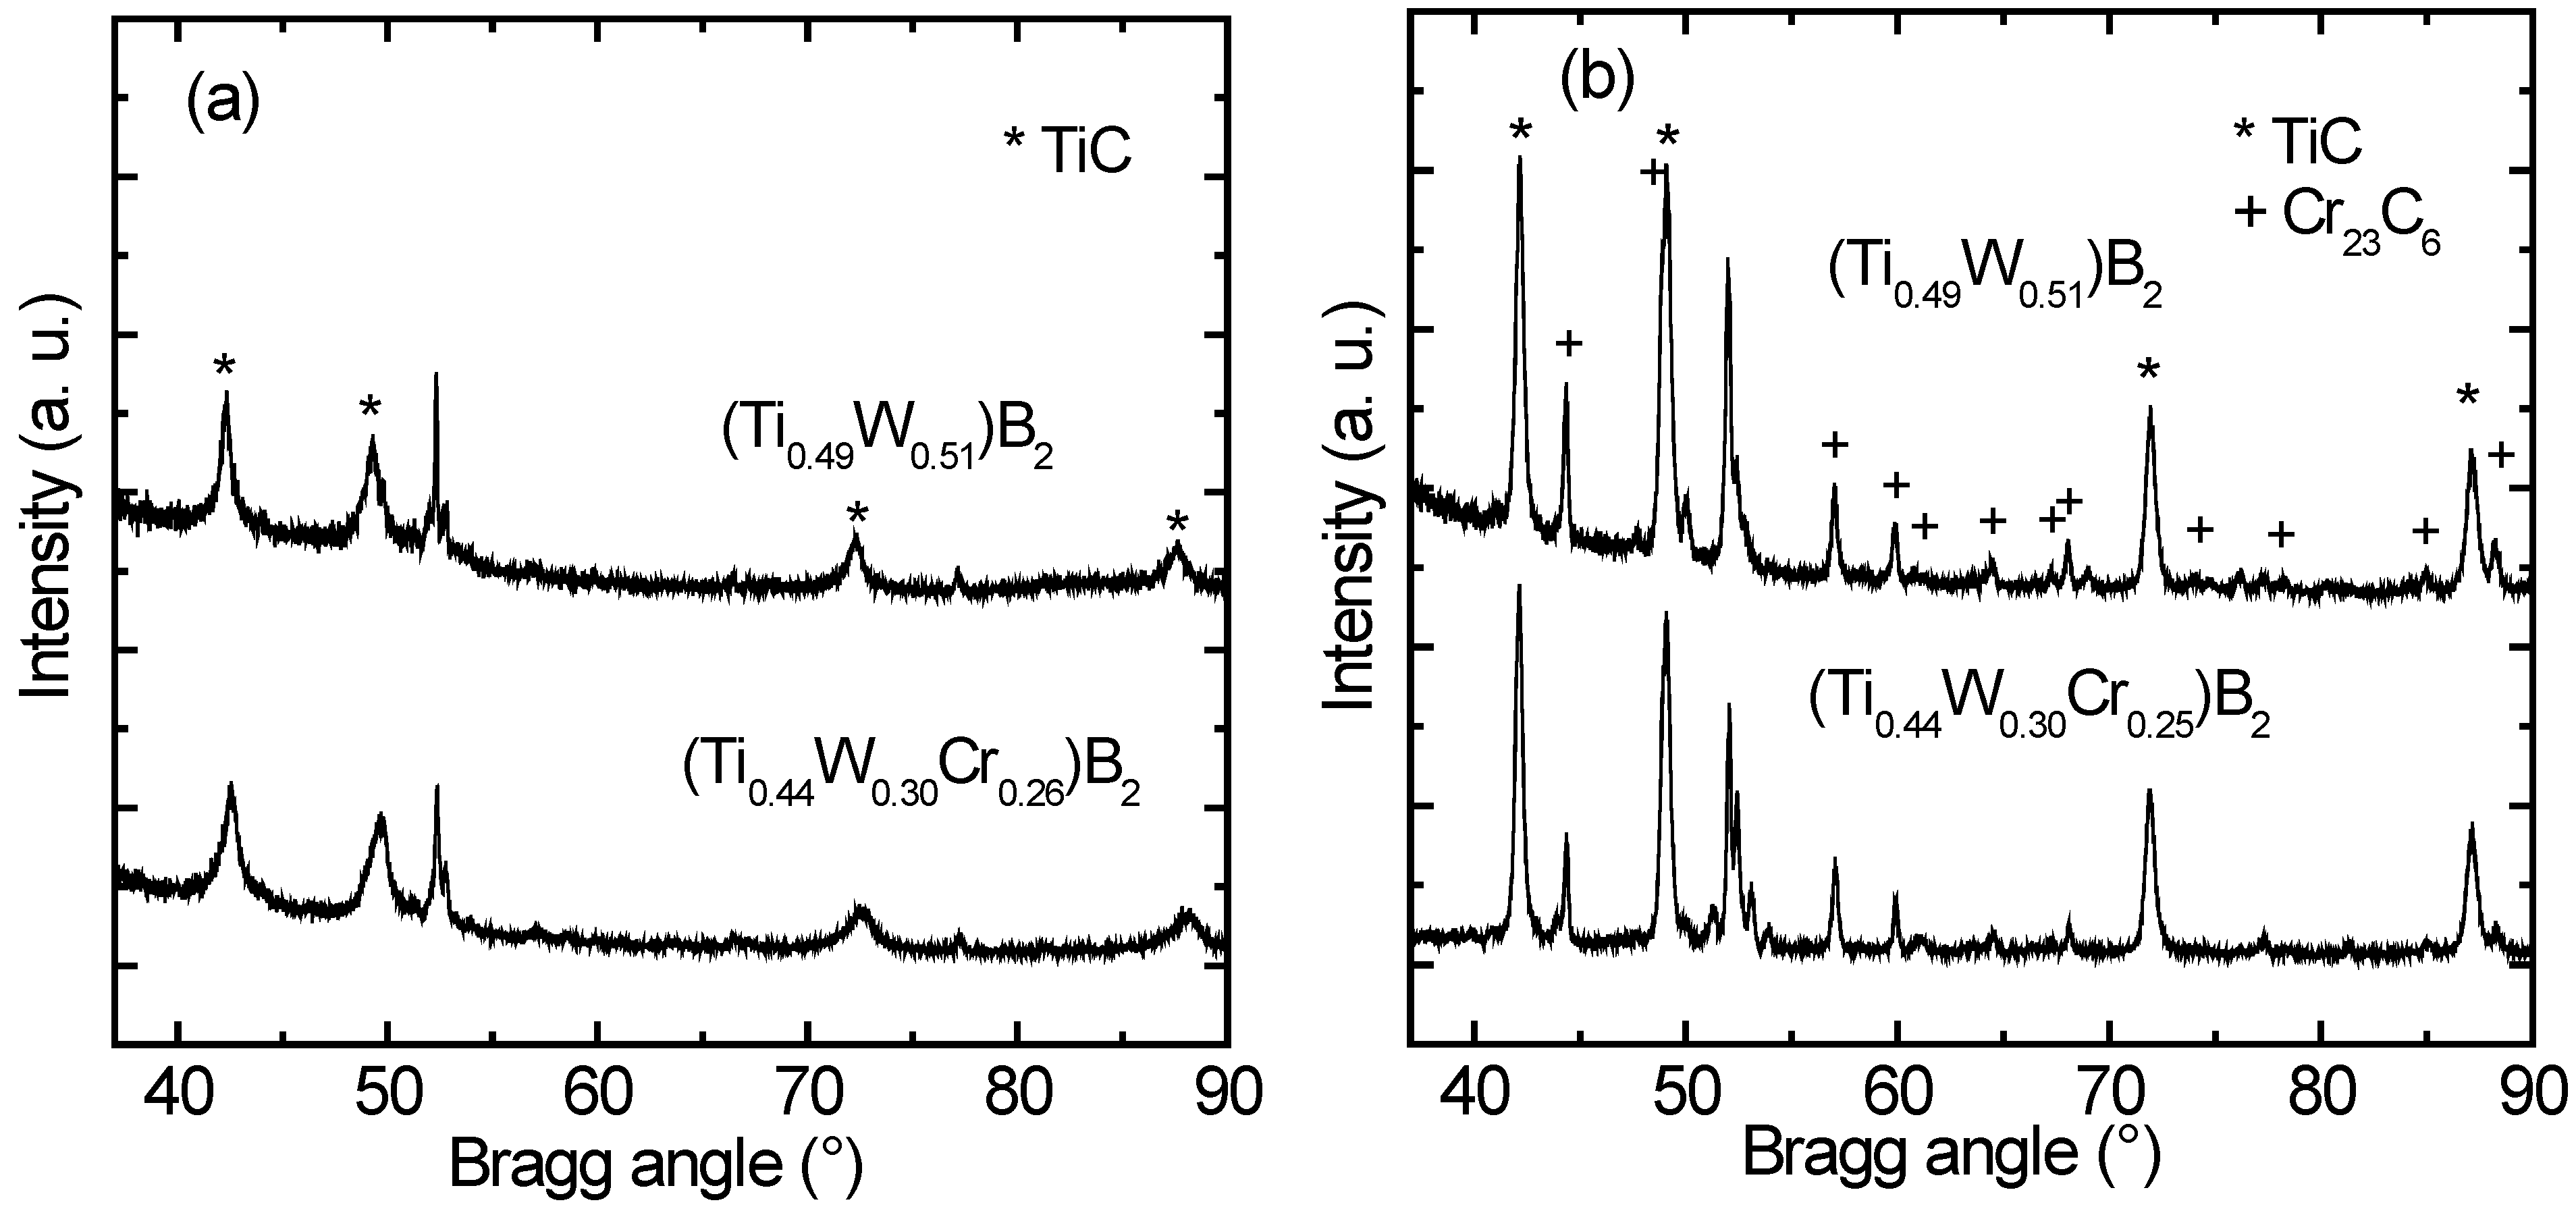
In
Figure 3 characteristic diffractograms of samples with and without chromium [(Ti
0.49W
0.51)B
2 and (Ti
0.44W
0.30Cr
0.26)B
2] are compared. The samples were annealed at 900 °C for 0.5 h (
Figure 3a) and at 1100 °C for 0.5 h (
Figure 3b), respectively. No significant differences between the patterns of the two different types of samples can be observed concerning type and amount of crystallized phases. Consequently, the precipitation kinetics is very similar for the two coatings. This is again in strong contrast to the findings for the same coatings on silicon substrates [
27], where the precipitation kinetics is strongly accelerated for the Cr containing coatings. The assessed crystallite size for the two phases in (Ti
0.44W
0.30Cr
0.26)B
2 is given in
Table 2. It varies between 10 and 40 nm for TiC and is about 50 nm for Cr
23C
6, respectively.
Figure 2.
GI-XRD patterns of (Ti0.49W0.51)B2 coatings after annealing for 0.5 h at 900 °C, 1000 °C, and 1100 °C, respectively. The precipitated phases of type TiC and Cr23C6 are indicated. Peaks referring to the steel substrate are unmarked.
Figure 2.
GI-XRD patterns of (Ti0.49W0.51)B2 coatings after annealing for 0.5 h at 900 °C, 1000 °C, and 1100 °C, respectively. The precipitated phases of type TiC and Cr23C6 are indicated. Peaks referring to the steel substrate are unmarked.
Table 1.
Lattice constants and grain size for (Ti0.49W0.51)B2 coatings determined from XRD measurements.
Table 1.
Lattice constants and grain size for (Ti0.49W0.51)B2 coatings determined from XRD measurements.
| Conditions | TiC (Fm-3m) | Cr23C6 phase (Fm-3m) |
|---|
| Annealing time (h) | Lattice constant (Å) (error: ±0.005 Å) | Grain size (nm) (error: ±5 nm) | Lattice constant (Å) (error: ±0.01 Å) | Grain size (nm) (error: ±5 nm) |
|---|
| 700 °C | 55 | 4.283 | 30 | 10.57 | – |
| 900 °C | 0.5 | 4.281 | 20 | 10.58 | – |
| 1 | 4.286 | 25 | 10.59 | – |
| 7.5 | 4.291 | 30 | 10.58 | 55 |
| 31.5 | 4.291 | 35 | 10.57 | 55 |
| 1000 °C | 0.5 | 4.301 | 25 | 10.60 | 35 |
| 1 | 4.302 | 25 | 10.60 | 45 |
| 1100 °C | 0.5 | 4.302 | 30 | 10.59 | 55 |
| 1 | 4.303 | 30 | 10.59 | 50 |
| 1.5 | 4.304 | 35 | 10.60 | 60 |
| 2 | 4.303 | 35 | 10.60 | 55 |
| 4 | 4.301 | 35 | 10.60 | – |
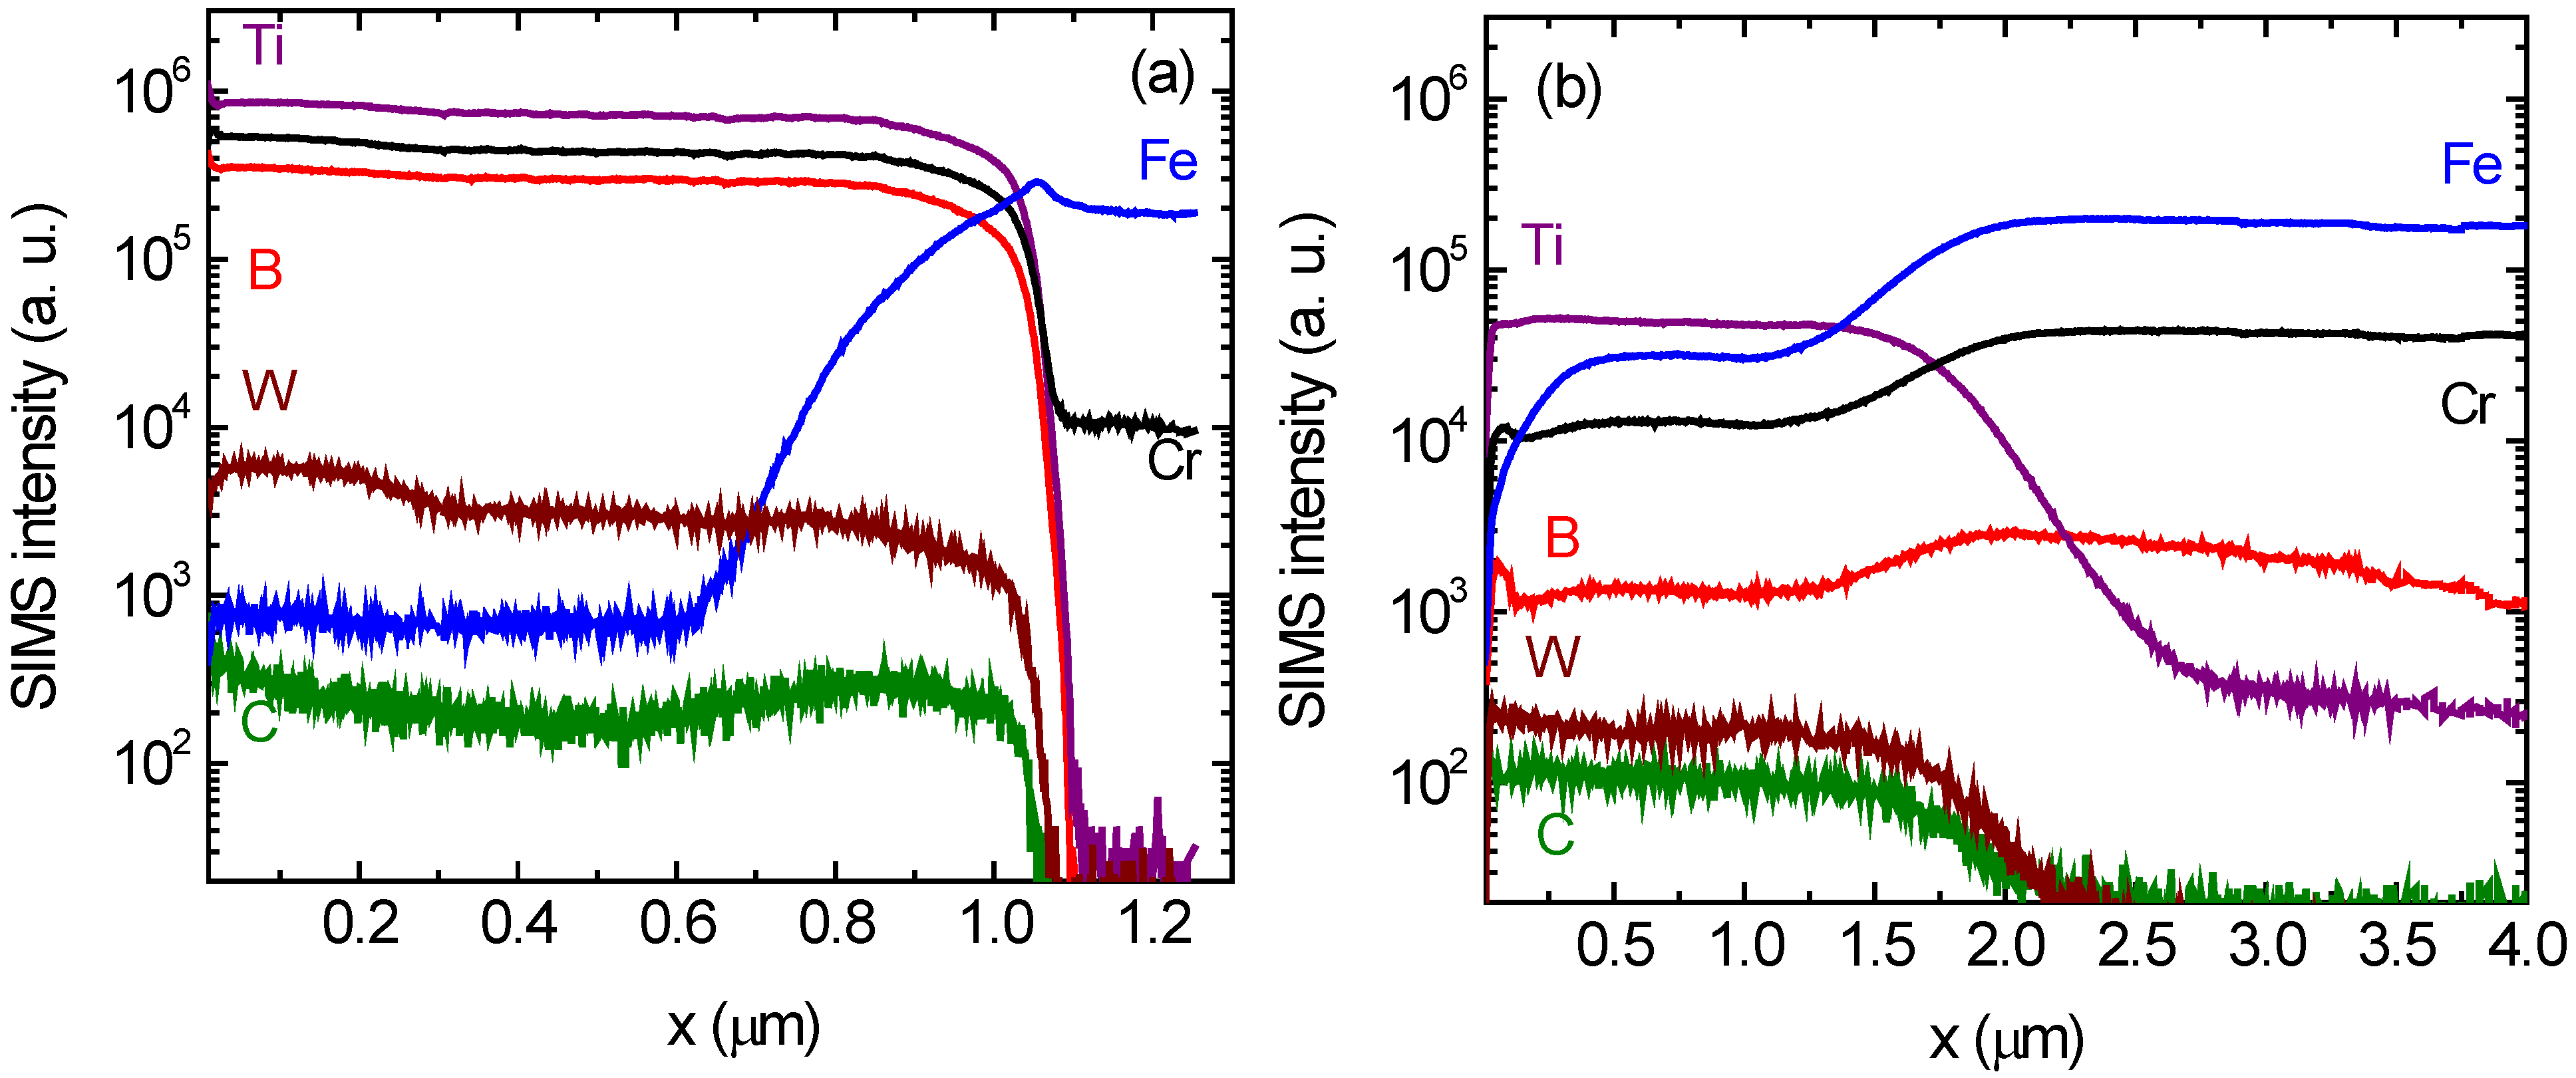
More insight into the precipitation behavior gives experiments with secondary ion mass spectrometry (SIMS) which are shown in
Figure 4. Experimentally derived depth profiles (SIMS intensity
vs. depth) of B, Ti, Cr, W, C, and Fe species are displayed for (Ti
0.44W
0.30Cr
0.26)B
2 coatings. For the as-deposited sample in
Figure 4a an about 1 µm thick film with sharp interfaces is clearly visible. After annealing at 1100 °C for 1 h (
Figure 4b) a strong intermixing of the elements takes place across the substrate/coating. Especially interesting are the strong diffusion of B and Cr from the coating into the substrate and the diffusion of Fe in the reverse way. This result indicates, that crystalline phase formation during annealing is not governed by the precipitation of crystalline boride compounds in an inert amorphous matrix of the coating, as found for silicon substrates [
27], but it is controlled by strong reactive diffusion processes between substrate and film. Since during annealing at elevated temperatures preferably carbide phases are formed, there has to be also a strong diffusion flux from the steel substrate (containing 1.2 wt% C) into the boride coating. The fact that the relatively low amount of carbon present in the substrate may lead to the formation of carbide compounds in the coating can be explained with a high atomic mobility of carbon at the temperatures under investigation and the much larger thickness of the substrate (1 mm) compared to the coating (1 µm). In order to introduce carbon into the coating in the ten percent range, the average carbon concentration in the substrate has to be lowered by only 10
−2 percent if carbon can quickly diffuse across the whole substrate thickness. According to ref. [
31] the carbon diffusivity in steel at 900 °C for a carbon content of about 1.2 wt% is in the order of 10
−11 m
2/s. This gives a diffusion length in the 100 µm to mm range, justifying the argumentation given above. Based on these results, in principle the formation of FeO precipitations cannot be excluded due to the diffusion of Fe into the coating. The FeO phase has the same space group (Fm-3m) and similar lattice parameters than the TiC phase. However, its existence is rather unlikely because the coatings were annealed in high purity argon and for the same boride coatings deposited on silicon [
27], which were annealed in an identical way, no oxide phases were found.
The fact that SIMS detects a lower amount of C inside the steel substrate than in the film can be explained by a lower ionization probability of C+ ions in steel than in the boride compound (matrix effect). The high atomic mobility of Cr will also explain the formation of the Cr23C6 phase in Cr free coatings of composition (Ti0.49W0.51)B2 by the diffusion of Cr from the steel substrate into the boride coating.
Figure 3.
GI-XRD patterns of (Ti0.49W0.51)B2 and (Ti0.44W0.30Cr0.26)B2 coatings after annealing for 0.5 h at (a) 900 °C and (b) 1100 °C. The precipitated phases of type TiC and Cr23C6 are indicated. Peaks referring to the steel substrate are unmarked.
Figure 3.
GI-XRD patterns of (Ti0.49W0.51)B2 and (Ti0.44W0.30Cr0.26)B2 coatings after annealing for 0.5 h at (a) 900 °C and (b) 1100 °C. The precipitated phases of type TiC and Cr23C6 are indicated. Peaks referring to the steel substrate are unmarked.
Table 2.
Lattice constants and grain size for (Ti0.44W0.30Cr0.26)B2 coatings determined from XRD measurements.
Table 2.
Lattice constants and grain size for (Ti0.44W0.30Cr0.26)B2 coatings determined from XRD measurements.
| Conditions | TiC (Fm-3m) | Cr23C6 phase (Fm-3m) |
|---|
| Annealing time (h) | Lattice constant (Å) (error: ±0.005 Å) | Grain size (nm) (error: ±5 nm) | Lattice constant (Å) (error: ±0.01 Å) | Grain size (nm) (error: ±5 nm) |
|---|
| 700 °C | 55 | 4.257 | 25 | 10.60 | – |
| 900 °C | 0.5 | 4.271 | 10 | – | – |
| 1 | 4.276 | 15 | 10.55 | – |
| 7.5 | 4.283 | 20 | 10.58 | 45 |
| 31.5 | 4.286 | 25 | 10.56 | 50 |
| 1000 °C | 0.5 | 4.297 | 15 | 10.60 | 50 |
| 1 | 4.297 | 20 | 10.57 | 50 |
| 1100 °C | 0.5 | 4.302 | 30 | 10.58 | 50 |
| 1 | 4.304 | 35 | 10.58 | 50 |
| 1.5 | 4.301 | 40 | 10.58 | 50 |
| 2 | 4.306 | 40 | 10.59 | – |
| 4 | 4.301 | 40 | 10.59 | – |
Figure 4.
Secondary ion mass spectrometry depth profiles of (Ti0.44W0.30Cr0.26)B2 coatings in (a) the as-deposited state and (b) after annealing for 1 h at 1100 °C.
Figure 4.
Secondary ion mass spectrometry depth profiles of (Ti0.44W0.30Cr0.26)B2 coatings in (a) the as-deposited state and (b) after annealing for 1 h at 1100 °C.
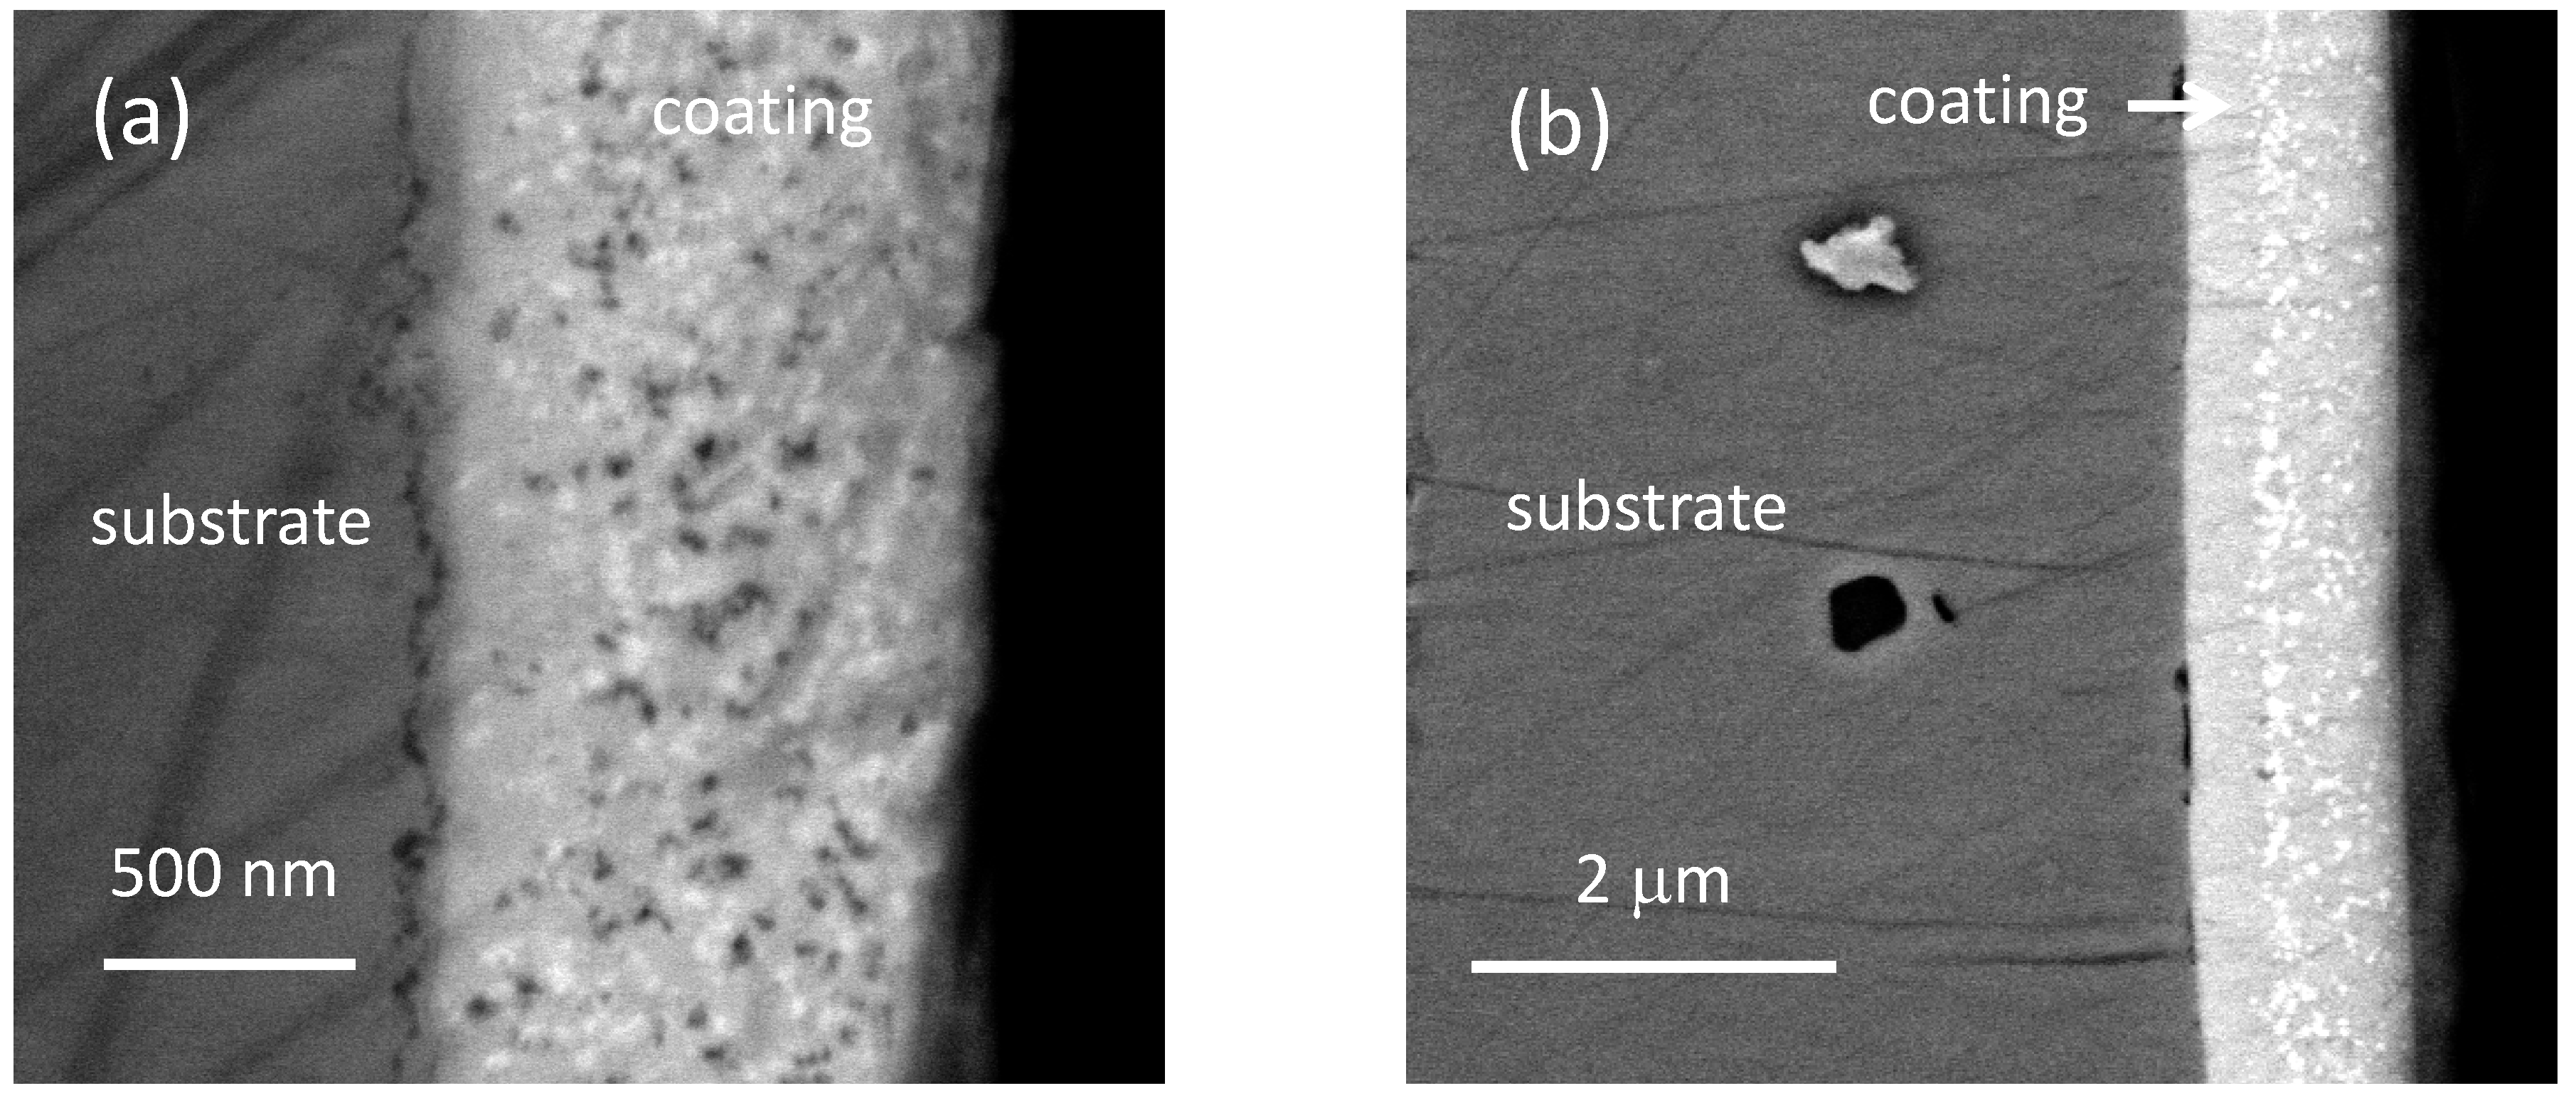
Figure 5 shows characteristic electron microscopy images of the microstructure of (Ti
0.49W
0.51)B
2 and (Ti
0.44W
0.30Cr
0.26)B
2 coatings annealed at 1000 °C in cross-sectional geometry. The actual boride coating and the steel substrate are indicated. The nanosized crystalline precipitations formed during annealing with dimensions of about 10–50 nm can be clearly seen as white spots. This indicates that heavy elements like W are present in the precipitates. Very likely we have solid solutions of (Ti,W,Cr)C and (Ti,W,Cr)
23C
6 phases as precipitates, where a mutual substitution of the transition metal is taking place. This is also indicated by the lattice constants of the crystalline phases as derived from the XRD patterns, which are also given in
Table 1 and
Table 2. For the TiC phase values of 4.26 Å (low temperatures) to 4.30 Å (high temperatures) are found which differ considerably from the values of pure TiC of 4.33 Å [
29]. Such (Ti,W,Cr)C solid solution compounds in bulk form are described in literature [
32,
33]. Compounds containing up to 75% W and 30% Cr were reported [
26]. According to Ref. [
32,
34], the lower lattice parameters in comparison to the pure TiC phase indicate that significant amounts of W might be incorporated into the Ti matrix and also an under-stoichiometry (Ti,W,Cr)C
x (
x < 1). Significant differences between the Cr free and Cr containing coatings were not found, indicating that Cr (originally present in the coating) does not play an important role for the mutual substitution process. A similar effect, however less pronounced, is found for the Cr
23C
6 phase. Lattice parameters of 10.55–10.60 Å are derived, slightly lower that the value of the pure phase of 10.65 Å [
29]. Also a partial incorporation of Fe into the nano-precipitates cannot be excluded.
Figure 5.
FESEM backscattering image in cross-sectional geometry for (a) (Ti0.49W0.51)B2 and (b) (Ti0.44W0.30Cr0.26)B2 coatings annealed at 1000 °C for 1 h.
Figure 5.
FESEM backscattering image in cross-sectional geometry for (a) (Ti0.49W0.51)B2 and (b) (Ti0.44W0.30Cr0.26)B2 coatings annealed at 1000 °C for 1 h.
As further obvious from
Figure 5, nano-sized dark areas are visible. These can tentatively be identified as pores, which result from the observed formation process of crystalline phases and the associated volume changes. Further, it is interesting that the formation of nano-crystals does not take place homogenously in the coating, but seems to start from surface near regions and is less pronounced close to the interdiffusion zone between substrate and coating. In that range, the local chemical composition seems to be more resistant against precipitation and crystallization.
The present results reveal that the thermally induced phase formation of boride coatings deposited on steel substrates results in nano-crystalline precipitations as also found for silicon substrates [
27]. The crystallite size is in the order of 10–50 nm for annealing up 1100 °C. However, the nano-crystalline precipitates are composed of carbide phases and not of boride phases. This difference can be explained by the fact that for steel substrates the microstructural evolution and formation of crystalline phases is dominated by reactive interdiffusion and not by precipitation in a supersaturated matrix. This also explains the similar precipitations kinetics of different coatings on steel substrates. In this context, the observed suppression of the formation of crystalline boride compounds is attributed to the concurrent formation of carbide phases, which are formed already at lower temperatures. During precipitation of the carbide phases, the amorphous matrix is modified in such a way that an additional crystallization of boride compound is not possible. In addition, the strong diffusion flux of boron from the coating into the substrate leads to a depletion of the element in the coating.


