Article

Evaluation of the Shearing Strength of a WC-12Co Thermal Spray Coating by the Scraping Test Method

Department of Mechanical Engineering, Tokyo University of Science, 6-3-1 Niijuku, Katsushika-ku, Tokyo 125-0051, Japan
Coatings 2015, 5(3), 278-292; https://doi.org/10.3390/coatings5030278
Submission received: 4 June 2015 / Revised: 8 July 2015 / Accepted: 10 July 2015 / Published: 15 July 2015
(This article belongs to the Special Issue Trends in Coatings and Surface Technology—Feature Papers)

Abstract

:
This paper reports on an experimental and analytical investigation conducted into efficacy of the scraping shear-test method in estimating the shearing adhesive strength of a thermally sprayed coating. It was found that the critical average shear stress, the apparent failure strength of WC-Co thermal spray coating, depends on both the dimensions of the test piece and the loading position around the interface between the coating and the substrate. More specifically, the apparent critical shear stress decreased as the height and width of the test piece increased. In addition, the apparent critical shear stress increased with increasing coating thickness and with decreasing loading point distance measured from the interface. Consequently, the real adhesive strength of thermally sprayed coating could not be ascertained from these experimental results. Furthermore, most of the failure initiation points were inside the coating, as opposed to at the interface. This fact means that the results of the tests do not indicate the interfacial adhesive strength, but rather the shear strength of the coating. Three-dimensional finite element method (FEM) analysis showed that the distributions of the shearing stress at the loading points were virtually the same at failure, regardless of the dimensions of the test piece. These results suggest that the scraping test method needs a corresponding numerical analysis of the failure mode in order to produce reliable results and is not necessarily able to estimate the interfacial adhesive strength of thermally sprayed coating.

1. Introduction

Thermally sprayed coatings have been applied to various important system parts, such as gas-turbine blades, combustion chamber walls, aerospace equipment, and the boiler tubes of industrial plants, all of which are used under severe conditions. For precise design of such coated parts, it is important to establish the adhesive strength criteria for thermally sprayed coating systems. Many test methods have been proposed to estimate the adhesive strength of thermal spray coatings for the purpose of comparing the relative adhesive strengths of various coatings. Some of these test methods include tensile tests of the coated specimen [1,2], bending tests of the coated plate/ring [3,4,5,6], scraping shear tests of the coated ring [7,8,9], and the tensile pin-test [10]. Several researchers have reviewed the merits and demerits of these test methods [11,12,13]. Moreover, a number of researchers have conducted lifetime evaluations [14,15,16,17,18,19] in which they considered the thermal loading cycles and changes in local structures such as oxidation growing and investigated the mechanism of delamination. To evaluate the fracture strength of the coating, the combined torsion-tension loading test using the coated butt-joint type tubular specimen has been proposed [20].
However, most of the results obtained from these test methods do not measure the actual unique strength of the coating system, but rather an apparent strength, such as the average stress. Consequently, corresponding numerical analyses have to be conducted on the testing method to determine the critical stress conditions at local singularity zones such as the interface edge. Thus, experimental methods in which the loads acting around the interface edge can be accurately controlled are needed.
Furthermore, many patterns of failure of the thermal sprayed coating system, such as wear, cracking, and delamination, are possible. Delamination due to tensile stress acting on irregularities at the interface has been discussed by Arai [16] and Kaneko et al. [19], and delamination due to concentrated shearing stress at the interface edge, caused by cleavage cracking of the coating under in-plane tension, has been studied by Arai et al. [15]. Because of the high probability of these types of failures, it is important that the specimen in the delamination strength test of coatings has a shape with an interface edge, on which shearing stress can be applied and accurately controlled until delamination occurs.
On the basis of the above considerations, the scraping shear-test method using a small coated plate with its coating subjected to a scraping shear force has recently gained favor in Europe [21], and is slated to be recognized as the international standard test [22]. However, some problems were discovered such as the failure patterns being unstable and the scatter being rather large; therefore, a large number of specimens must be prepared [23].
The objective of this paper is to clearly investigate these problems affecting the scraping shear test and estimate the efficacy of the testing method. In this report, first the effects of height, width, coating thickness of the specimen, and shearing point on the critical shearing force are investigated experimentally. Next, the shear and tensile stress distributions around the shear loading point at failure are analyzed via finite element method (FEM) analysis in order to estimate the efficacy of the testing method.
Recently, this author has proposed a torsion-tension pin-test method and used it to investigate the adhesive strength criteria of thermally sprayed WC-Co coating under interfacial shear and tensile loading experimentally and analytically. The reliability of the pin-test method has been confirmed through a series of studies [24,25,26]. This report on the reliability of the scraping shear-test method shows that the torsion-tension pin-test method is useful and reliable for estimating the adhesive strength of thermally sprayed coating and is thus deserves serious consideration globally.

2. Experiments

2.1. Specimen

The material used as the substrate of specimen was SCM440 chrome-molybdenum steel. The substrate plate was a square of length 100 mm and 5.2 mm thickness. Two thickness levels were selected for the WC-12Co thermal spray coating: t = 350 and 450 µm. The conditions of the thermal spraying by the high-velocity oxygen fuel (HVOF) method are shown in Table 1. Specimens were cut from the coated plate using the high speed wet cutting machine with height: H = 0.5–2.5 mm, and width: B = 1.5–5.5 mm, as shown in Figure 1.
Table 1. HVOF thermal spraying conditions.
Items in SprayingMaterials/Conditions
Spraying GunTAFA/JP-5000 Gun
Coating materialWC-12%Co Powder (15–53 μm)
Blasting conditionWA#60, 0.4 MPa
O260 m3/h
Kerosene0.03 m3/h
Combustion pressure0.7 MPa
Work distance400 mm
Figure 1. Specimen and the direction of the shearing force.
Coatings 05 00278 g001

2.2. Scraping Shear Test

Figure 2a shows the scraping shear testing apparatus. The steps in the testing procedure were as follows: (1) The thickness of the coating of each specimen was measured using a microscope; (2) A specimen was inserted into the testing apparatus, as shown in Figure 2a, and pushed to set the shear point at 25 (or 50) µm, measured from the interfacial line using the micrometer; (3) After the substrate of the specimen was fixed by turning the screw bolt, the shear bar made of sintered WC-Co cermet was pushed down using the computer controlled testing machine (AGS-5kNX by Shimadzu Co. Ltd., Kyoto, Japan) at a speed of 0.5 mm/min; (4) The critical shearing load F was then recorded and divided by the adhesive area (H × B) to get the critical shearing mean stress τ. The shape of the contact edge of the push bar was rectangular and the radius of curvature of the edge corner was approximately 0 mm, as shown in Figure 2b.
Figure 2. (a) Schematic diagram of the scraping shear-test apparatus as viewed from the side; (b) View of the edge of the push bar made of sintered WC-Co cermet.
Coatings 05 00278 g002

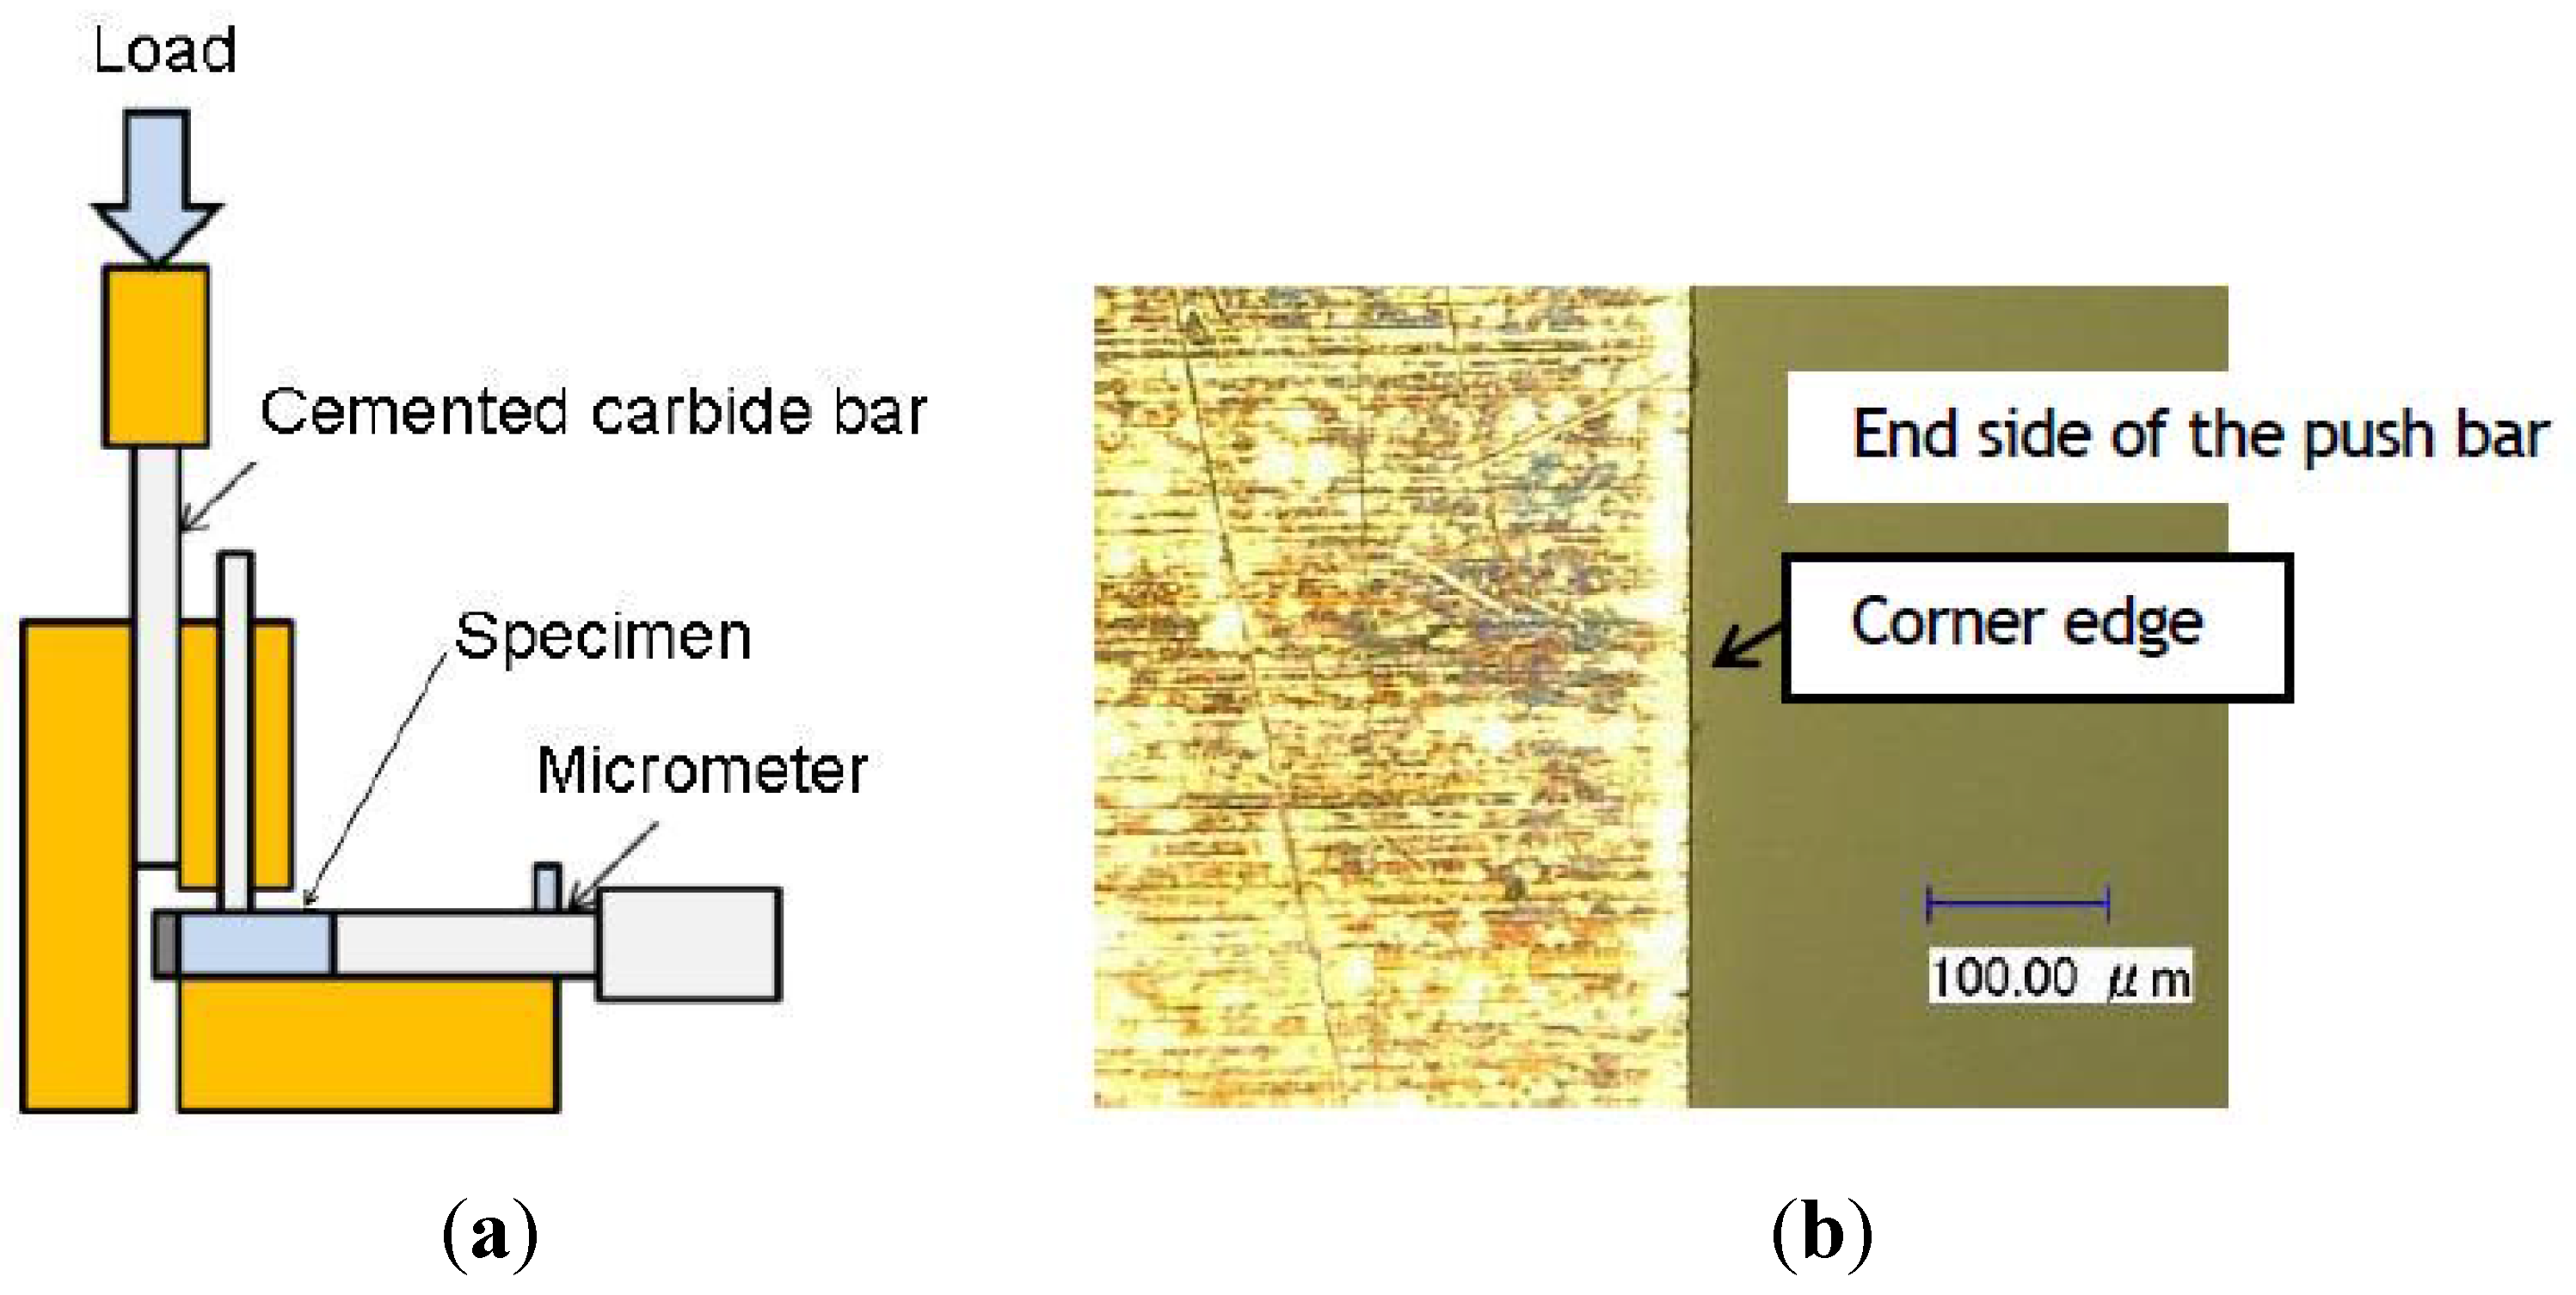
2.3. Reason and Procedure for Deciding the Shear Point to be 25 µm Offset from the Interface

Figure 3 shows an enlarged view of the interface between the coat and the substrate. Measuring the surface roughness of 15 specimens, the maximum surface roughness was found to be 18.1 µm (average: 14.8 µm). Thus, the full safety point for the shearing bar not to be in contact with the substrate in the shearing process was decided at c = 25 µm offset from the interfacial center line (see Figure 11 below). Furthermore, some tests were performed for the case of c = 50 µm in order to investigate the effect of c on the critical shear load.
Figure 3. Section view around the interface between the sprayed coating and the substrate of the specimen. The maximum height Ry in surface roughness at the interface is 18 µm.
Coatings 05 00278 g003

3. Experimental Results and Discussion

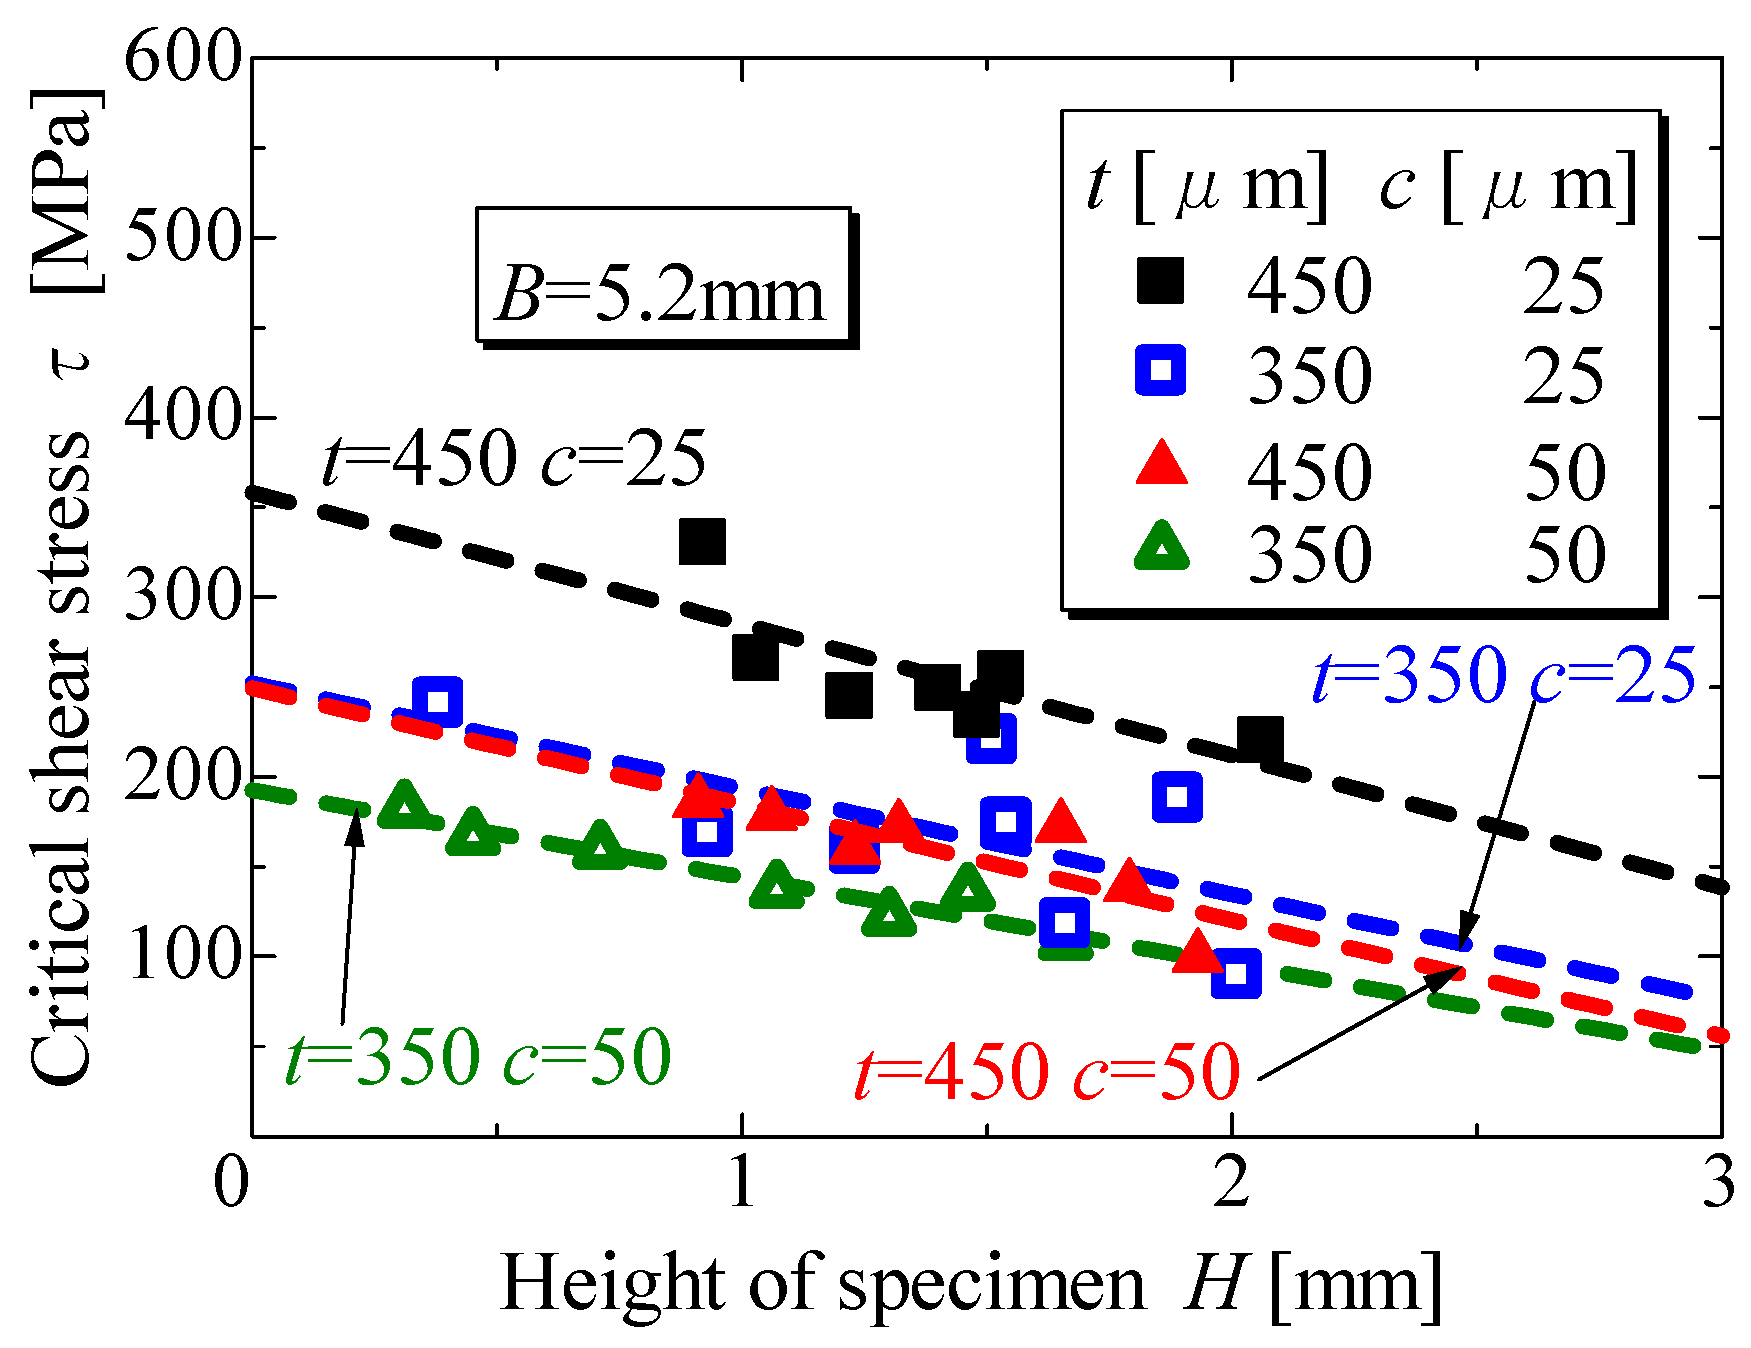
3.1. Effect of Specimen Height H on Critical Shearing Average Stress τ

Figure 4, Figure 5 and Figure 6 show the experimental results representing the effect of height H, coating thickness t and shearing point c on the critical shearing stress τ for the specimens with width 5.2, 3.3 and 2.2 mm, respectively.
Figure 4. Influence of specimen height on failure stress: Apparent failure stress decreases with increasing specimen height.
Coatings 05 00278 g004
Figure 5. Influence of specimen height on failure stress for specimen width B = 3.3 mm.
Coatings 05 00278 g005
Figure 6. Influence of specimen height on failure stress for specimen width B = 2.2 mm.
Coatings 05 00278 g006
From these results, it is clear that the critical shearing stress τ decreases with increasing specimen height H. This is because the shear stress distribution on the shearing plane has a maximum value at the contact top point with the shear bar and decreases quickly along the direction of the shearing plane, and the lower stress area increases with increasing height H, as shown in the case of the shear stress distribution at the adhesive plane of a lap joint under tension; thus, the average stress decreases with increasing height H. The critical average stress τ indicating the apparent shear strength decreases in line with the following permutation of the combination of coating thickness t (µm) with shear point c (µm), (1) 450, 25, (2) 350, 25, (3) 450, 50, (4) 350, 50.

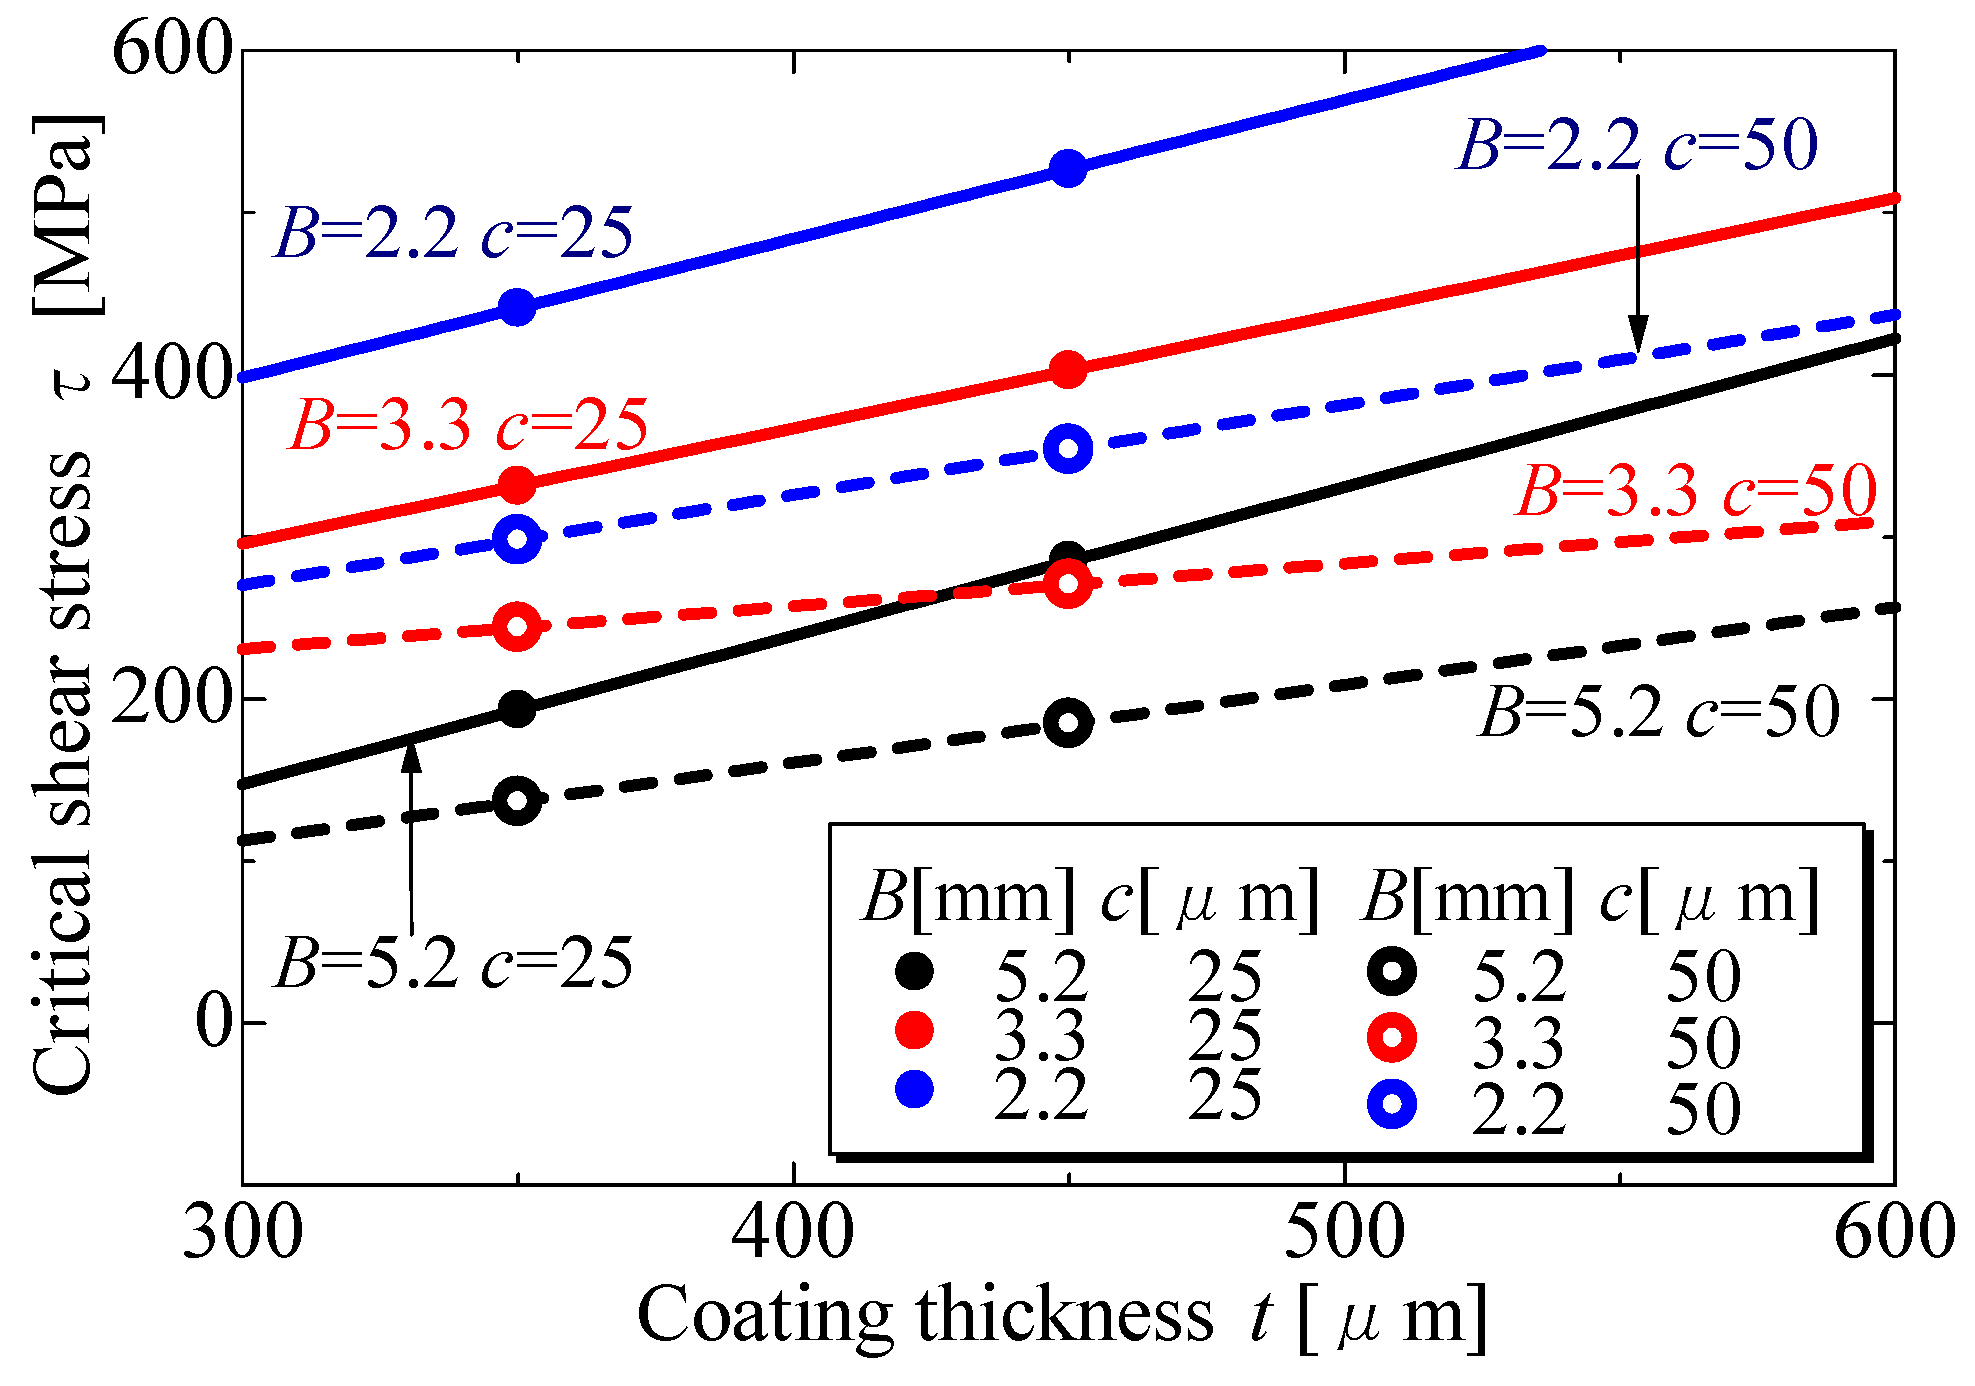
3.2. Effect of Coating Thickness t on Critical Shearing Stress τ

Figure 7 shows the coating thickness dependency of the critical shearing stress. The failure average stress increases with increasing coating thickness. This is because the contact area S with the shear bar increases with increasing coating thickness (see Figure 11): thus, the contact pressure decreases and then the local stress around the shear point decreases with increasing t.
Figure 7. Influence of coating thickness on failure stress: Apparent failure stress increases with increasing coating thickness.
Coatings 05 00278 g007

3.3. Effect of Shearing Point c on Critical Shearing Stress τ

From the results shown in Figure 4, Figure 5 and Figure 6, the critical shearing stress is found to increase with decreasing shearing point c. The reason for this is the same as that stated above in the previous section. Here, the contact area S with the shear bar decreases with increasing the shearing point c. Thus, the critical shear load in the case of c = 50 µm is smaller than that in the case of c = 25 µm.

3.4. Effect of Specimen Width B on Critical Shearing Stress τ

Figure 8 shows the relationship between the specimen width B and the critical shearing stress τ. The critical shearing stress τ decreases linearly with increasing width B. This is because the shearing stress is concentrated at the side corners of the specimen, and the central area where the shear stress is comparatively small increases with increasing width B.
Figure 9 shows the gradient for each line shown in Figure 4, Figure 5 and Figure 6. The gradients are virtually the same depending on the width of specimen. This means that the effect of specimen height on the shearing failure stress is stable regardless of the specimen width. Thus, the local stresses at the specimen’s corners increase with increasing height, H, and the apparent critical stress decreases irrespective of the width.
Figure 8. Influence of specimen width on failure shear stress: Apparent failure stress decreases with increasing specimen width.
Coatings 05 00278 g008
Figure 9. Relationship between specimen width and the gradient of the approximated lines shown in Figure 4, Figure 5 and Figure 6. Effects of the specimen height H on the critical shear stress are independent of the specimen width, B.
Coatings 05 00278 g009

3.5. Views of the Failed Specimens and Coatings

Figure 10a,b show the failed specimen, where: Figure 10a shows views of the delaminated coating and substrate. Some delaminated coats were separated into several parts at failure. Figure 10b shows a magnified view of the substrate with a stuck chip of coat. Almost all (90%) the substrates were stuck with coating chips around the shearing point after failure, as shown in Figure 10b. In some cases, the coating remained over the interfacial plane. In such cases, failures occurred inside the coating, not at the interface. Although some failure patterns could be observed, as mentioned above, no significant differences could be seen in the critical shear stress, τ. This is because failures always initiate at the inside of the coating around the interfacial edge and the shear stress becomes much larger at the chip of the initiated crack. Thus, the crack propagates quickly along the interface or inside the coating and the subsequent shear load is not larger than that at failure initiation. This fact shows that the critical shear load measured in this scraping test is not the real adhesive strength of the coating, but rather the shearing strength of the coating.
The shape of the scraping shear bar should be improved to ensure that the coating does not fail. However, precisely controlling the corner curvature of the scraping bar is difficult because the influence of the corner curvature on the stresses at the contact point is significant and delicate. Thus, the scraping shear -test method may not be adequate to evaluate the adhesive strength of the coating, especially for a coating system in which the coating strength is weaker than the adhesive strength.
In the ensuing section, the shear and tensile stress distributions are analyzed using FEM analysis to understand the experimental results obtained in the scraping shear tests.
Figure 10. (a) Failed specimen after scraping shear test separated into the coating and the substrate; (b) View around the interface, where the coating fragment remains at the interface edge.
Coatings 05 00278 g010

4. Three-Dimensional Stress Analysis by FEM

4.1. Analysis Method and Conditions

Analysis software: FEM Analysis software MARC2010. The three-dimensional elastic analysis mesh model of the scraping test specimen is shown in Figure 11, and the material constants used in the analysis are shown in Table 2. The minimum element size was 10 nm long.
Figure 11. FEM model of the scraping test specimen.
Coatings 05 00278 g011
Table 2. Material properties.
MaterialsYoung’s ModulusPoisson’s Ratio
SCM440208GPa0.268
WC/12Co154GPa0.230
As shown in Figure 11, the bottom end of the substrate was fixed in the direction of y-axis and the upper side subjected to the setting press load. To make the analysis model simple, the scraping bar was replaced by a rigid board, because Young's modulus of the bar made of sintered WC-Co cermet is very large (600–700 GPa) compared with that of the coating. However, this assumption may cause somewhat larger stresses in the analysis. In this contact analysis, the friction coefficient was assumed to be 0.3 at the contact plane between the rigid board and the coating. It was confirmed that influences of the setting press load and the friction coefficient on the stress distributions at the shear point A are very small.

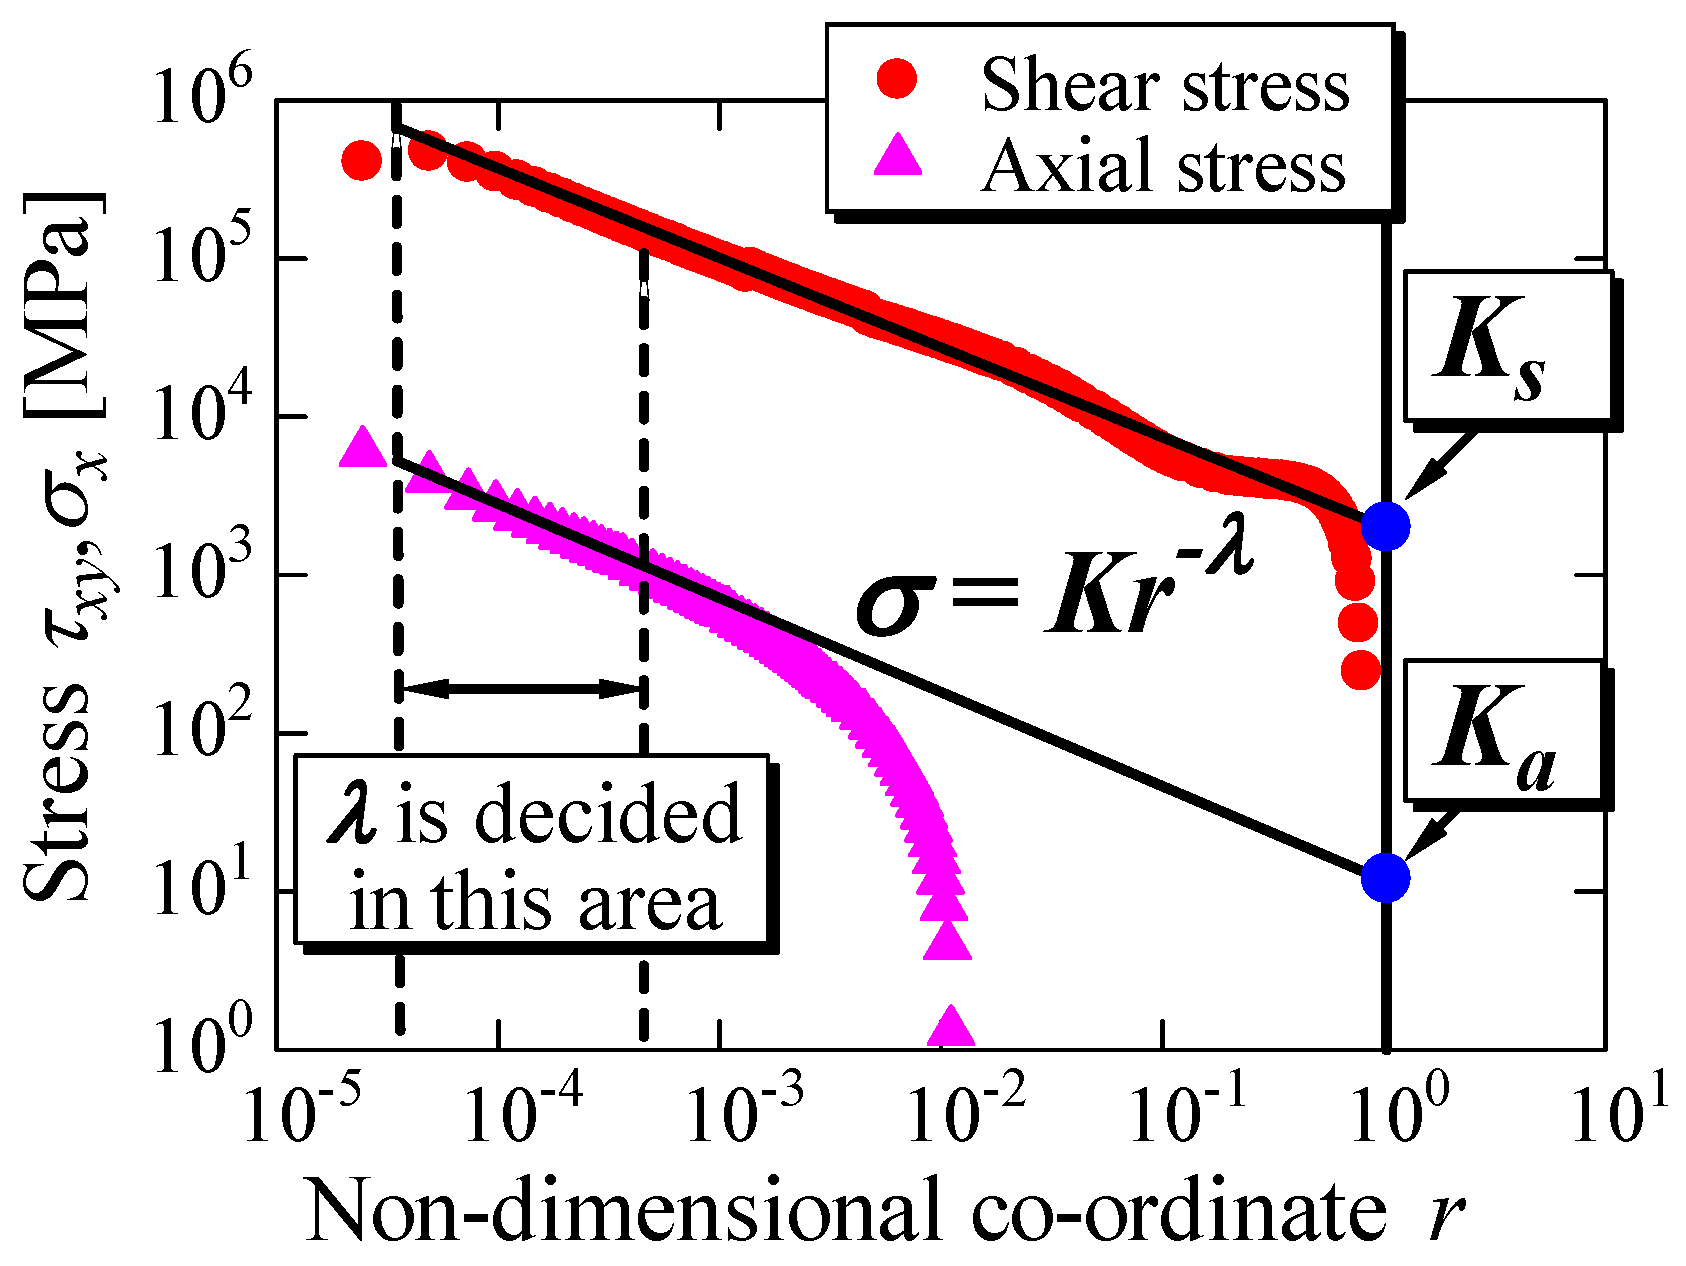
4.2. Evaluation of the Stress Singularity

The stress singularity field occurs around the contact point A with the rigid board edge shown in Figure 11. Figure 12 shows the typical stress distributions around the stress singularity area. Stress distributions at a singularity point are generally approximated by Equation (1), where σ is the stress components or equivalent stress: r, the non-dimensional length divided by 1 mm measured from the contact point A: λ, the singularity parameter: and K, the strength of the stress singularity:
σ = K r λ
The strength of the stress fields K can be determined as the intercept of the approximated straight line at r = 1 for the stress distributions at the area 5 × 10⁻⁵ < r < 5 × 10⁻⁴ mm, as shown in Figure 12.
Figure 12. Determination of K and λ on the stress distributions at the stress singularity field.
Coatings 05 00278 g012
The singularity parameter λ can be obtained as the gradient of the approximated straight line. It is usually a very reasonable supposition that the principal stress is dominant in the failure of brittle coatings such as WC-Co cermet. Thus, the principal stress that operates on the failure surface in the perpendicular direction should be discussed. In the scraping shear tests, all failures (or delaminations) occurred around the interface: hence, both the shear and tensile stress components should be taken into consideration in investigations of the failure criteria of a coating system. The strengths of the stress singularity obtained at failure are expressed by Ks for shear stress and Ka for tensile stress generated by a bending moment.

5. Analytical Results and Discussions

In these scraping tests, shear stress τxy operating at point A in the y-z plane, as shown in Figure 11, is maximum, where the curvature of the edge corner of the rigid board was assumed to be infinity. Thus, the shear and tensile stress distributions operating at contact point A in the y-z plane were calculated in this analysis.

5.1. Influences of Parameters in the Experiments on the Stress Distributions

To investigate the influence of height H and width B of the specimen, and the coating thickness t and the shear point c on stress distributions, corresponding shear and tensile stress distributions were calculated for the case of mean shear stress τm = 150 MPa using various FEM mesh models with various parameters.

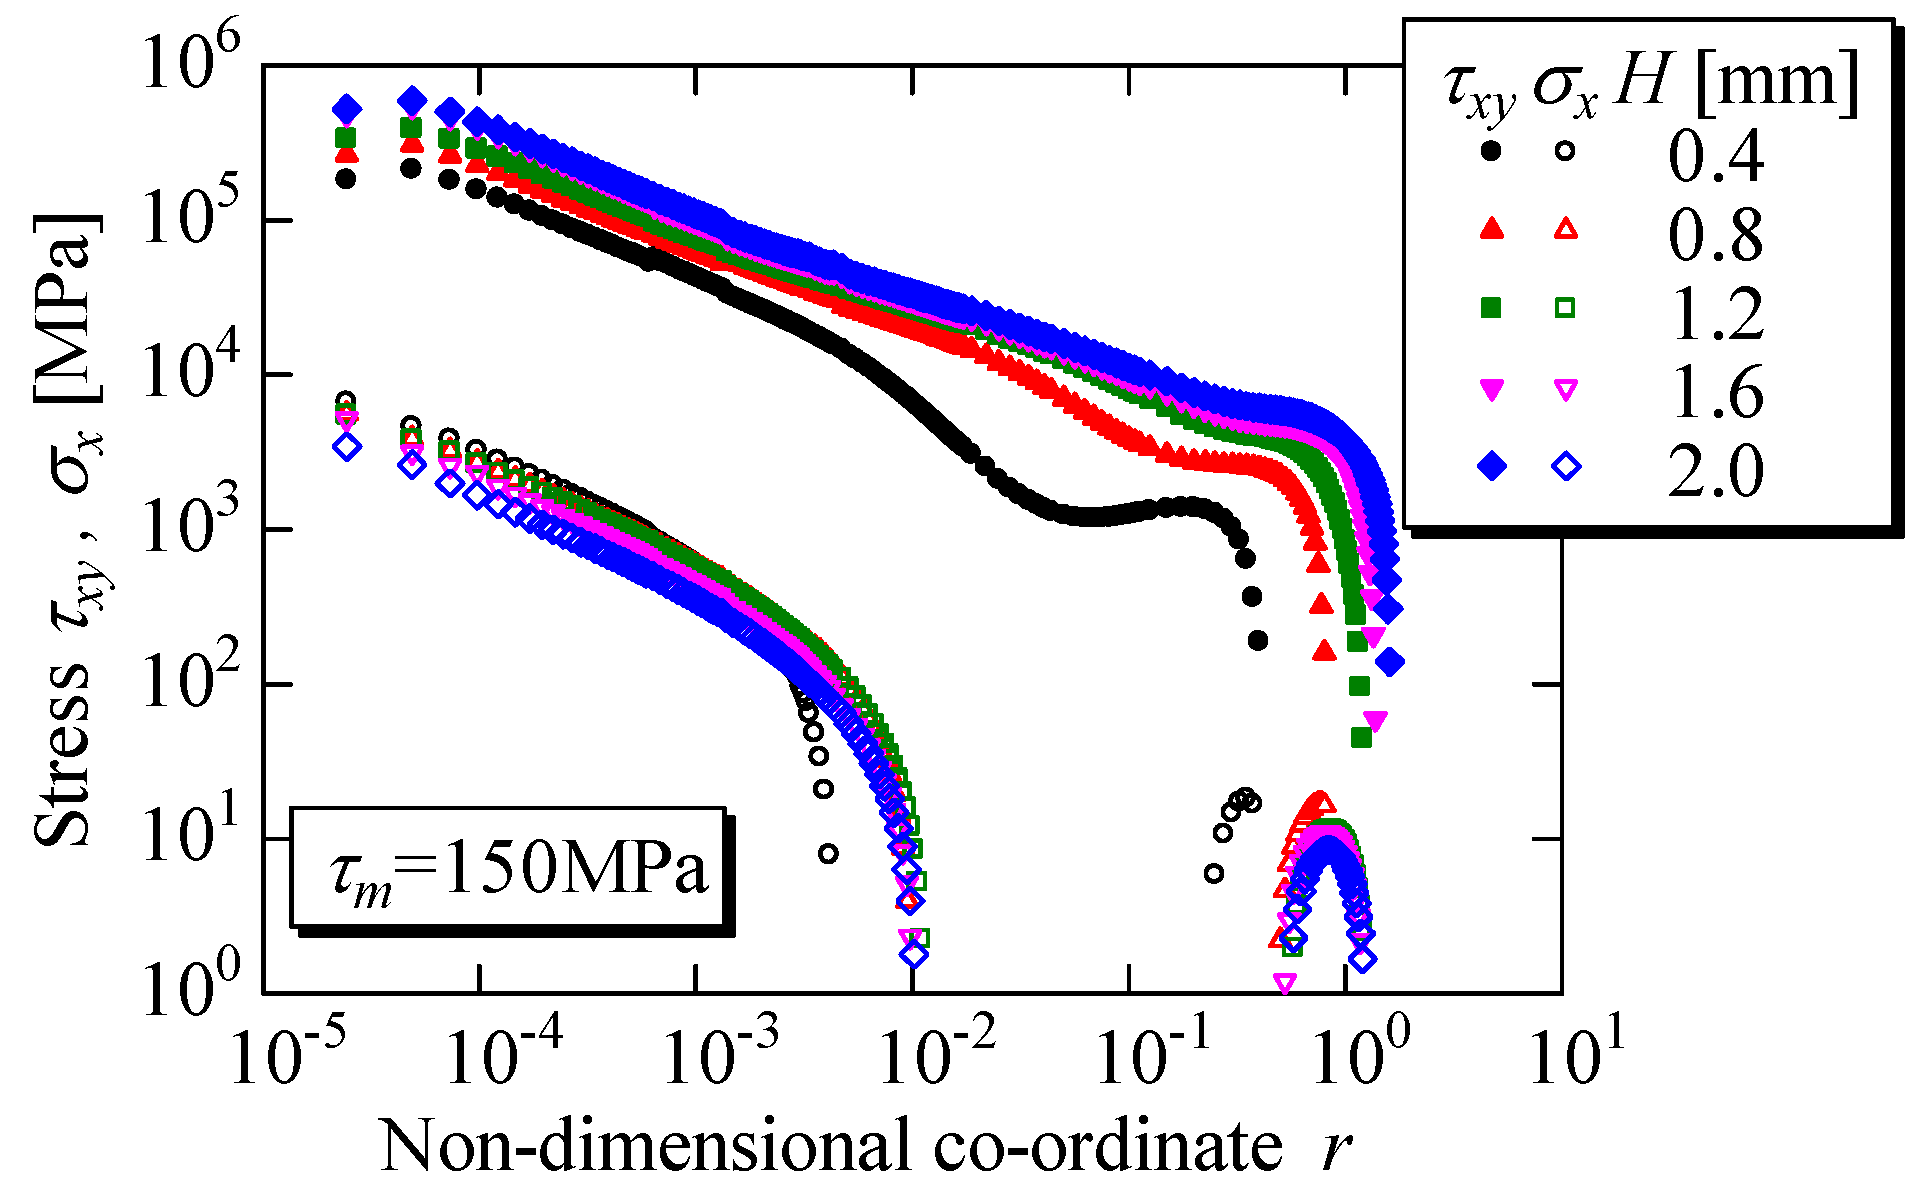
5.1.1. Influences of the Specimen Height H on the Stress Distributions

Figure 13 shows the influence of specimen height H on the shear stress τxy and the tensile stress σx for the conditions of constant width and mean shear stress. The abscissa indicates the shear and the tensile stresses and the ordinate indicates the non-dimensional coordinate r on y axis measured from the contact point A. The local shear stress τxy increases with increasing the specimen height H, which means that the specimen of higher H becomes apparently weaker, as shown in Figure 4.
Figure 13. Shear and tensile stress distributions for various specimen heights under constant average shear stress condition of τm = 150 MPa.
Coatings 05 00278 g013

5.1.2. Influence of Specimen Width B on the Stress Distributions

Figure 14 shows the influence of specimen width B on the shear stress τxy and the tensile stress σx for constant height and mean shear stress. The local shear stress τxy increases with increasing specimen width B, which means that the apparent strength decreases with increasing width B, as shown in Figure 8.
Figure 14. Shear and tensile stress distributions for various specimen widths under constant average shear stress condition of τm = 150 MPa.
Coatings 05 00278 g014

5.1.3. Influence of Coating Thickness t on the Stress Distributions

Figure 15 shows the relationship between the failure strength Ks and the coating thickness t for various H. Ks decreases with increasing t, which supports the tendencies of the experimental results shown in Figure 7. Furthermore, the influence of H on Ks decreases with increasing t. This is because the contact pressure and the local stress decrease with increasing t or the contact area, then the shear stress distributions become smooth.
Figure 15. Influence of coating thickness on Ks of the shear stress distributions under constant average shear stress condition of τm = 150 MPa.
Coatings 05 00278 g015

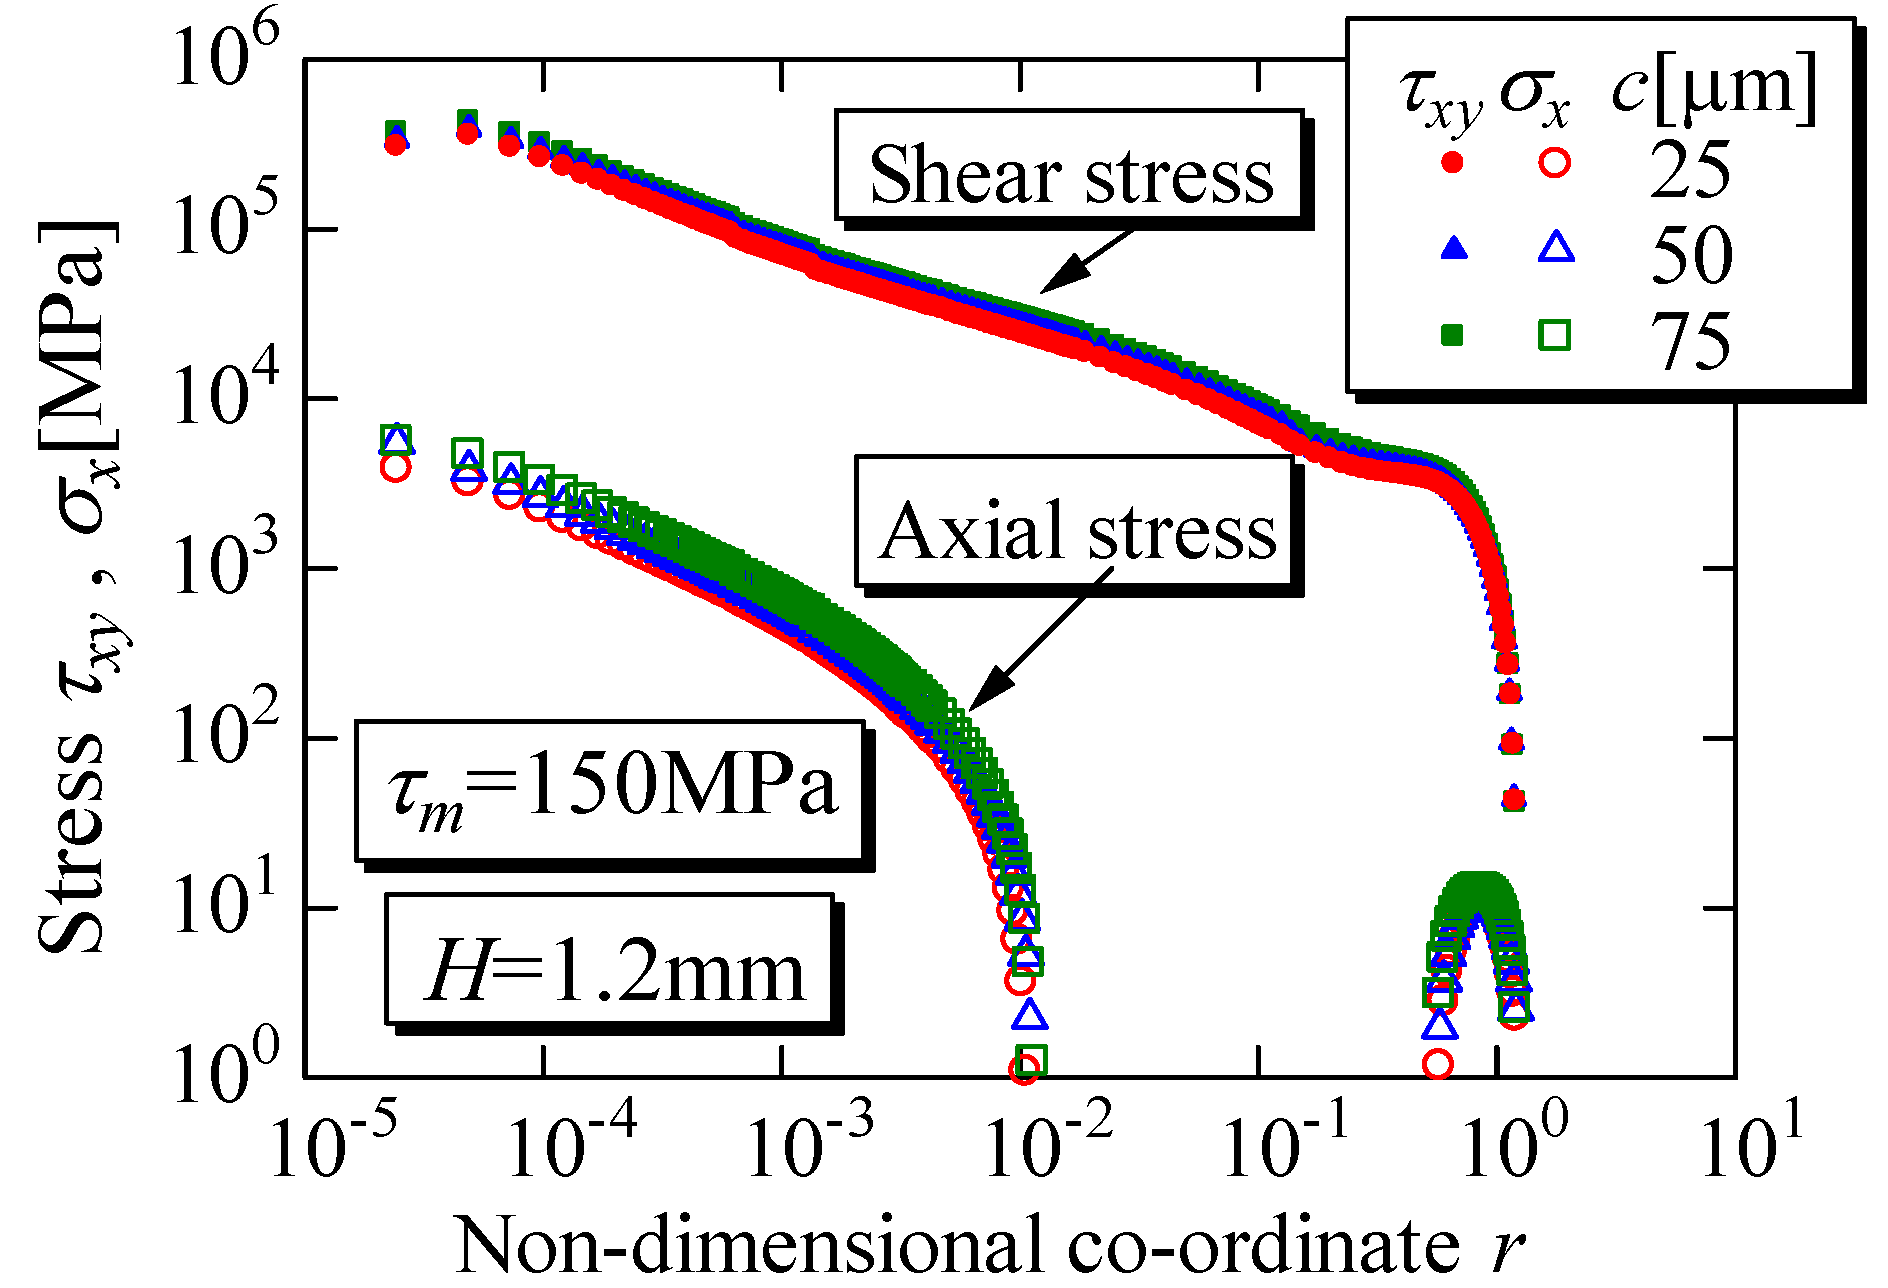
5.1.4. Influence of Shear Point c on the Stress Distributions

Figure 16 shows the influence of the shear point c on the shear and the bending stress distributions. Both the shear and the bending stresses increase with increasing c, for constant coating thickness t and specimen height H. The calculated results support the experimental facts that the critical shear stress decreases with increasing c, shown in Figure 3, Figure 4 and Figure 5. There was a ±5 μm error in c in the experiments, resulting in a ± 5 MPa scatter in the value of Ks.
Figure 16. Effects of contact position c on stress distributions under constant average shear stress condition of τm = 150 MPa for the specimen with H = 1.2 mm
Coatings 05 00278 g016

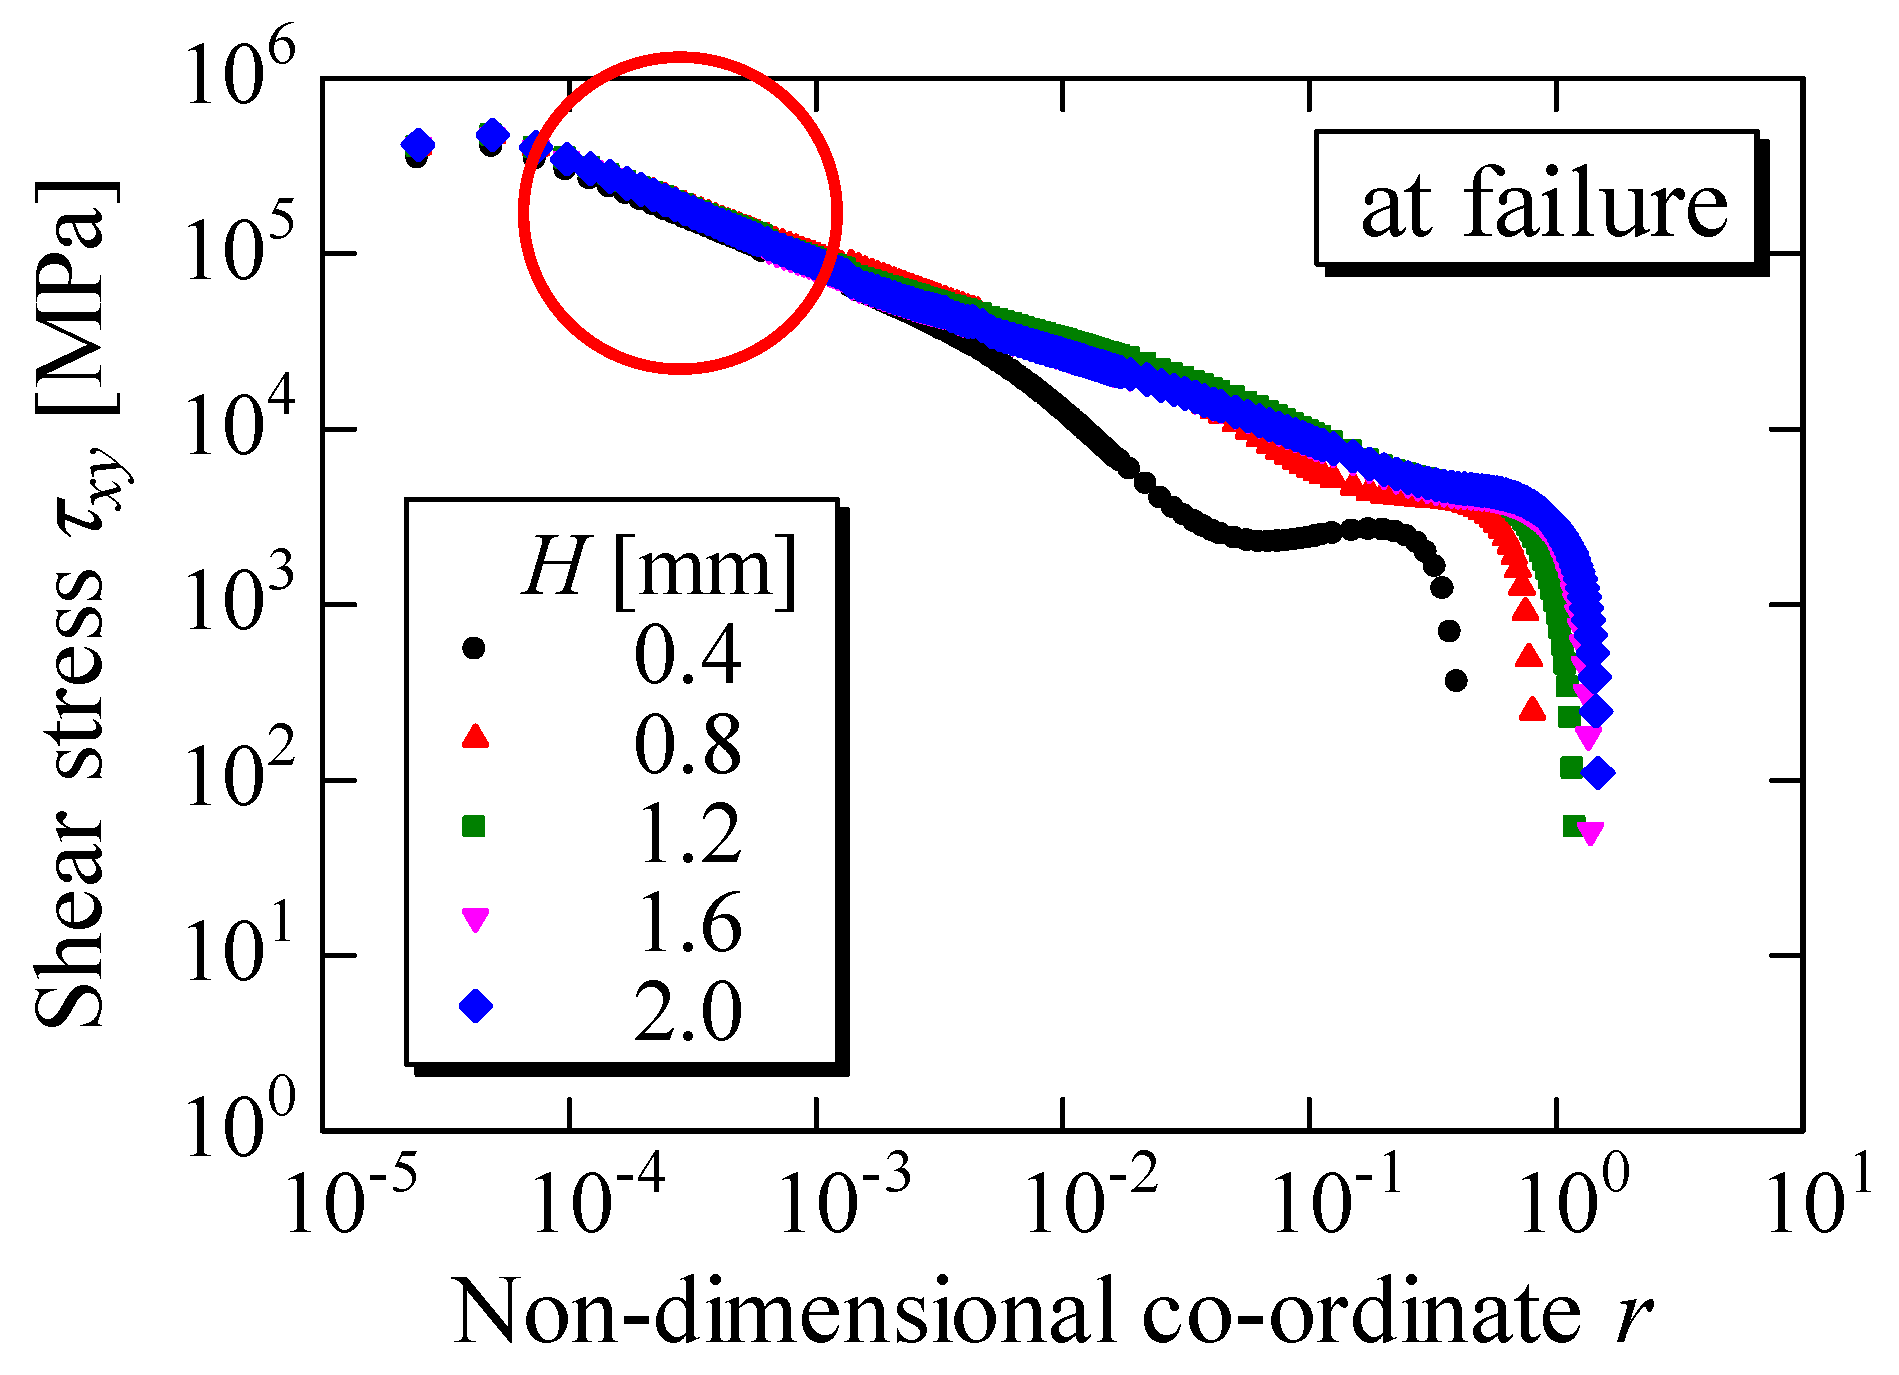
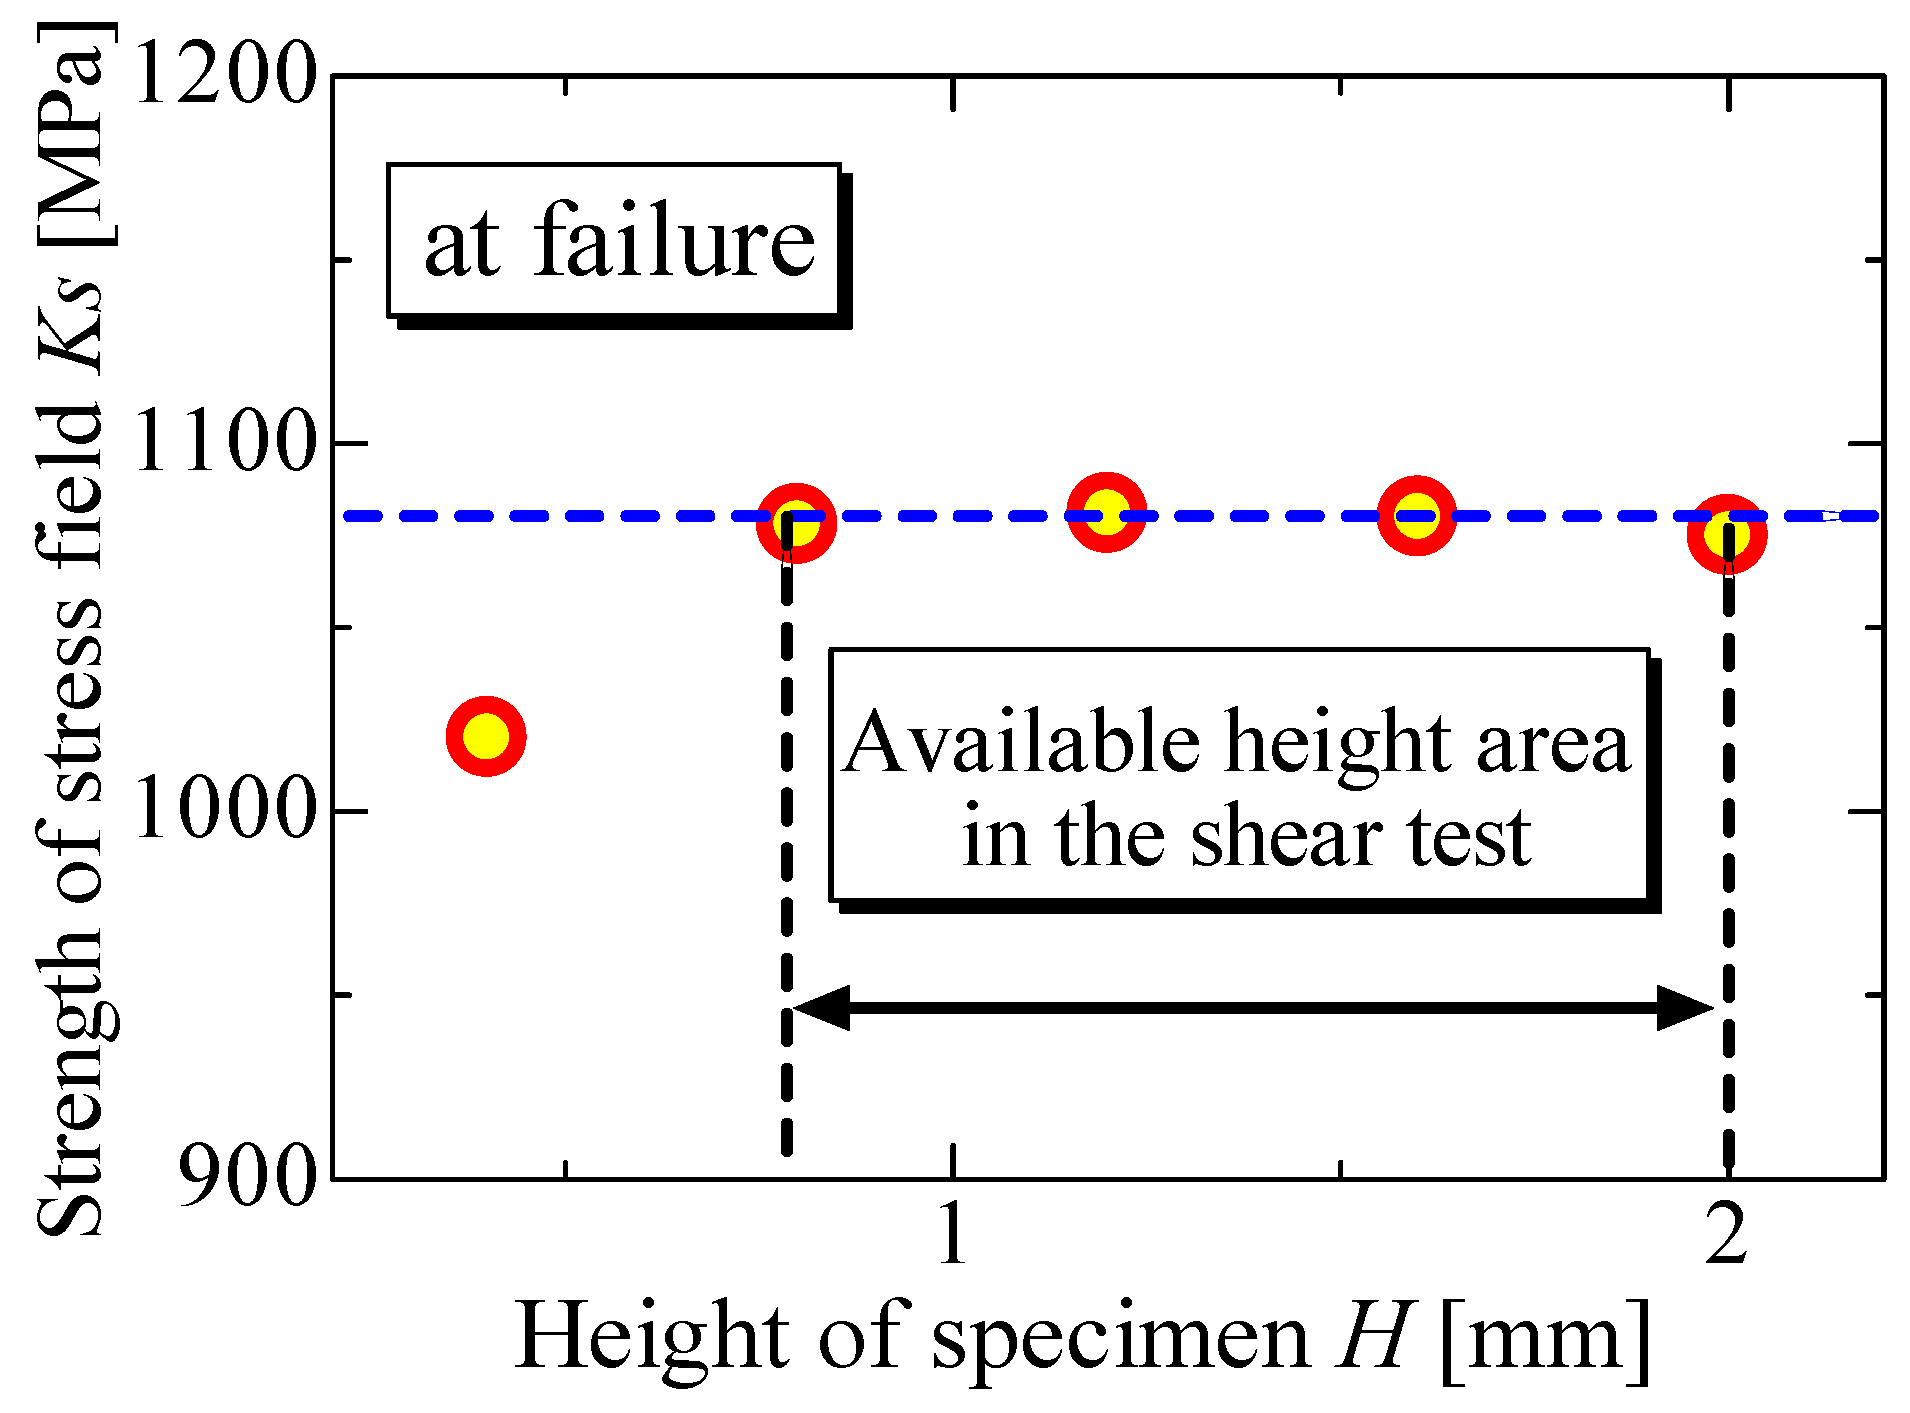
5.2. Stress Distributions Analysis around the Shearing Point at Failure

The shearing τxy and tensile σx stress distributions were analyzed for the case of the coating thickness t = 350 μm, and the shearing point c = 50 μm, for which the scattering in the experimental results are smallest in Figure 4.
Figure 17 shows the critical shear stress τxy distributions around the loading point at failure for various specimen heights H. The critical strength of the stress singularity Ks obtained from these shearing stress distributions are shown in Figure 18. The values of the obtained Ks are virtually stable regardless of H, except in the case of H = 0.4 mm. The value Ks = 1080 MPa is the failure condition of the WC-12Co coating under shear loading. Ks is small for the case H = 0.4 mm because the bending stress becomes critical before Ks becomes critical. As stated above, virtually all failures initiated inside the coating and Ks were obtained from the stress distributions working around the failure points: therefore, these values of Ks are not the adhesive strength of the coating.
Figure 17. Shear stress distributions at failure for various specimen heights, in which virtually the same stress distributions can be observed.
Coatings 05 00278 g017
Figure 18. Ks values at failure for various dimensions of specimen at the failure point.
Coatings 05 00278 g018
In the analytical study outlined above, the influence of surface roughness on stress distributions was neglected. Some dents on the surface may function as cracks. We know that a peeling force occurs at any top/bottom of surface roughness in an interface of thermal barrier coating after thermal loading [19]. Therefore, stress analyses using the mesh model with a surface crack at the corner edge of the specimen may be necessary.

6. Conclusions

In this paper, first the effects of specimen height, width, coating thickness and the shear loading point on the critical shearing force were investigated experimentally. Then, the shear and tensile stress distributions around the shear loading point, that is, the failure initiation point at failure, were analyzed using FEM to estimate the availability of the scraping shear testing method. The following conclusions are drawn:
(1)
The critical shear average stress decreases with increasing specimen height H and width B.
(2)
The critical shear average stress increases with increasing coating thickness t.
(3)
The critical shear average stress increases with decreasing shear loading position c.
(4)
Thus, the apparent critical strength depends on the magnitude of the specimen and the loading position in the scraping shear test.
(5)
Virtually all failures are initiated at the shear loading points on the coating. Therefore, the apparent critical shear strength does not represent the adhesive strength, but rather the shear strength of the coating.
(6)
The local singularity stresses were found to occur at the loading point on the coating. These singularity shear and tensile stresses were approximated τ = Ksr−λ and σ = Kar−λ, respectively. It was found that the singularity parameter λ is virtually constant and the strength of the stress singularity Ks becomes constant at failure, regardless of the magnitude of the specimen. Thus, the critical strength of the stress singularity obtained here indicates the shear fracture condition of the coating.
(7)
The strength of the shear stress singularity at the loading point was found to increase with increasing height H and width B of the specimen, and the loading position c measured from the interface, and with decreasing coating thickness t. Thus, the reasons why the apparent critical load depends on the magnitudes of specimen become clear.
(8)
This paper gave an important notice that the failure initiation point as well as the loading point should be carefully checked when the scraping shear -test method was used in evaluating the strength of a coating system.

Acknowledgements

The author gratefully acknowledges the support provided by the Ministry of Education, Science and Culture of Japan through grants-in-Aid for Scientific Research (No. 23560098). The author also wishes to express his appreciation to TOCALO Co., Ltd. for their support in making the specimens with thermally sprayed coatings, and graduate student Mr. Shingo Miwa and under graduate student Mr. Tsuyoshi Iwasaki for performing the experimental and analytical works.

Conflicts of Interest

The author declares no conflict of interest.

References

  1. Agrawal, D.C.; Raj, R. Measurement of ultimate shear strength of a metal-ceramic interface. Acta Metall. 1989, 37, 1265–1270. [Google Scholar] [CrossRef]
  2. Chen, B.F.; Hwang, J.; Chen, I.F.; Yu, G.P.; Huang, J.-H. A tensile-film-cracking model for evaluating interfacial shear strength of elastic film on ductile substrate. Surf. Coat. Tech. 2000, 126, 91–95. [Google Scholar] [CrossRef]
  3. Lane, M.W.; Dauskardt, R.H. Plasticity contributions to interface adhesion in thin-film interconnect structures. J. Mater. Res. 2000, 15, 2758–2769. [Google Scholar] [CrossRef]
  4. Tsui, Y.C.; Howard, S.J.; Clyne, T.W. The effect of residual stresses on the debonding of coatings -II. An experimental study of a thermally sprayed system. Acta Metall. Mater. 1994, 42, 2837–2844. [Google Scholar] [CrossRef]
  5. Li, H.; Khor, K.A.; Cheang, P. Adhesive and bending failure of thermal sprayed hydroxyapatite coatings: Effect of nanostructures at interface and crack propagation phenomenon during bending. Eng. Fract. Mech. 2007, 74, 1894–1903. [Google Scholar] [CrossRef]
  6. Okazaki, M.; Yamagishi, S.; Osakabe, M.; Fukanuma, H. A new testing method to evaluate adhesion strength of ceramic top coat in TBCs. J. Solid Mech. Mater. Eng. 2010, 4, 345–354. [Google Scholar] [CrossRef]
  7. Fukumoto, M.; Murakami, H.; Okane, I.; Harada, H. Improved ring shear test for the evaluation of adhesion strength of thermal sprayed coating. J. Jpn. Inst. Met. Mater. 1995, 59, 84–88. (In Japanese) [Google Scholar]
  8. Zhu, Y.L.; Mas, N.; Xub, S. Finite-element evaluation and improvement of a test procedure for coating shear bond strength determination. J. Therm. Spray Technol. 1999, 8, 328–332. [Google Scholar] [CrossRef]
  9. Guo, S.Q.; Mumm, D.R.; Karlsson, A.M.; Kagawa, Y. Measurement of interfacial shear mechanical properties in thermal barrier coating systems by a barb pullout method. Scr. Mater. 2005, 53, 1043–1048. [Google Scholar] [CrossRef]
  10. Inoue, Y.; Ono, H.; Noutomi, A.; Dewa, A.; Toyoda, M.; Tsukamoto, M. Adhesive strength evaluation of plasma sprayed coatings by tensile pin test. J. Jpn. Weld. Soc. 1991, 9, 167–173. (In Japanese) [Google Scholar] [CrossRef]
  11. Kaneko, K. Delamination strength of coating and fracture strength of coating’s own. Sci. Mach. 1997, 49, 450–457. (In Japanese) [Google Scholar]
  12. Kaneko, K. Evaluation methods of adhesive strength of thermal sprayed coating. J. High Temp. Soc. Jpn. 2004, 30, 301–307. (In Japanese) [Google Scholar]
  13. Nakasa, K. Interfacial Strength Evaluation Handbook; Jpn. Soc. Mater. Sci.: Kyoto, Japan, 2011. (In Japanese) [Google Scholar]
  14. Arai, M.; Iwata, U.; Sakuma, T.; Saito, M. Effect of a delamination initiation strength between thermal barrier coating and base metal on thermal aging. J. Soc. Mater. Sci. 2000, 49, 912–918. (In Japanese) [Google Scholar] [CrossRef]
  15. Arai, M.; Iwata, U.; Sakuma, T.; Saito, M. Proposal of delamination life prediction method thermal barrier coating layer under thermal cycle condition. J. Soc. Mater. Sci. 2001, 50, 651–656. (In Japanese) [Google Scholar] [CrossRef]
  16. Arai, M. Proposal of delamination strength evaluation method of thermal barrier coatings based on interface cohesive model with interface oxidation process. J. Soc. Mater. Sci. 2004, 53, 459–464. (In Japanese) [Google Scholar] [CrossRef]
  17. Arai, M.; Okajima, Y.; Kishimoto, K. Mixed-mode interfacial fracture toughness for thermal barrier coating. Eng. Fract. Mech. 2007, 74, 2055–2069. [Google Scholar] [CrossRef]
  18. Suzuki, K.; Kubo, T.; Tanaka, K.; Akiniwa, Y.; Okado, H. Oxidation of thermal barrier coatings and spalling stress analyzed with synchrotron X-rays. J. Soc. Mater. Sci. 2004, 53, 734–739. (In Japanese) [Google Scholar] [CrossRef]
  19. Kaneko, K.; Takatou, S.; Enomoto, K. Study on shear fatigue fracture and delamination mechanism of thermal barrier coatings after thermal loading. J. Solid Mech. Mater. Eng. 2010, 4, 315–324. [Google Scholar] [CrossRef]
  20. Kaneko, K.; Ohmori, A. Evaluations of strength of thermal sprayed coating for complex loading. J. Solid Mech. Mater. Eng. 2010, 4, 264–273. [Google Scholar] [CrossRef]
  21. DIN EN 15340:2007-06 EN 15340 Thermal Spraying-Determination of Shear Load Resistance of Thermally Sprayed Coatings; Beuth: Berlin, Germany, 2007.
  22. Marot, G.; Demareaux, P.; Lesage, J.; Hadad, M.; Siegmann, S.T.; Staia, M.H. Interfacial indentation and shear tests to determine the adhesion of thermal spray coatings. Surf. Coat. Tech. 2006, 201, 2080–2085. [Google Scholar] [CrossRef]
  23. Hartmann, S.; Deuerler, F.; Winkler, R. Evaluation of shear test results for determination of shear load resistance of thermally sprayed coatings. Therm. Spray 2008, 2008, 670–673. [Google Scholar]
  24. Kaneko, K.; Higaki, K. Delamination strength evaluation of thermal sprayed coating by torsion pin-test method. J. Solid Mech. Mater. Eng. 2011, 5, 1042–1050. [Google Scholar] [CrossRef]
  25. Kaneko, K.; Higaki, K. Delamination strength of WC-Co thermal-sprayed coating under combined stresses by torsion-tension pin-test method. J. Therm. Spray Technol. 2014, 23, 903–909. [Google Scholar] [CrossRef]
  26. Kaneko, K.; Higaki, K. Evaluation of fatigue delamination strength of WC-Co thermal sprayed coating by torsion-tension pin-test method. Trans. Jpn. Soc. Mech. Eng. 2014, 80. (In Japanese) [Google Scholar] [CrossRef]

