Article

In Situ Creep Behavior Characterization of Single Crystal Superalloy by UV-DIC at 980 °C

1
School of Materials Science and Engineering, Beihang University, Beijing 100191, China
2
Institute of Advanced Materials, Frontier Institute of Science and Technology Innovation, Beihang University, Beijing 100191, China
*
Authors to whom correspondence should be addressed.
Coatings 2019, 9(10), 598; https://doi.org/10.3390/coatings9100598
Submission received: 3 September 2019 / Revised: 18 September 2019 / Accepted: 20 September 2019 / Published: 23 September 2019
(This article belongs to the Section Surface Characterization, Deposition and Modification)

Abstract

:
High temperature creep resistance is a critical characteristic of Ni-based single crystal (SX) superalloys. In this work, the creep behavior of a Ni-based SX superalloy was in situ characterized at 980 °C by ultraviolet (UV) imaging combined two-dimensional digital image correlation (DIC) in vacuum environment. The surface pattern was fabricated to maintain stable over 65 h at 980 °C. The pattern images captured by UV imaging were analyzed using mean gray value and the full-field strain map of creep deformation was obtained. A laser displacement senor (LDS) was employed for measuring the creep strain on the specimen for comparison. The creep deformation result shows a good agreement between DIC and LDS, the microstructure of the different creep areas on the specimens also demonstrate that the results of DIC are reliable. The in situ creep characterization by UV-DIC shows a great potential for investigating creep behaviors at high temperatures.

1. Introduction

Ni-based single crystal (SX) superalloys with their excellent high temperature creep resistance have been extensively used for advance aero-engines’ turbine blade [1,2,3]. As a critical characteristic of SX alloy, the high temperature creep resistance not only determines the service life of the turbine blade, but also improves maximum performance of turbine engine [4,5]. In order to investigate the creep behaviors of the SX alloy, the mechanisms of creep resistance were investigated at different temperatures by creep machines, which contain a furnace, loads part, and high-temperature extensometers. The clip-on mechanical extensometers are widely used in creep testing to measure axial strains with an advantage of direct contact with the specimen and the results are unaffected by changes in the surface condition. However, these contacting extensometers are requiring contact with the material to function with an unadjustable gauge length. As a result, they have the disadvantages of manual intervention, less flexibility, and limited applicability due to the following reasons [6]: (1) The thermal disturbance from the environment results in deformation of extensometer; (2) the contact force of a single side entry extensometer will generate some degree of bending; (3) in a long term test the rods of the extensometer may be subject to creep deformation and (4) the transitional extensometer cannot deal with an irregular specimen.
To overcome these disadvantages, non-contact optical method digital image correlation (DIC) was widely used in the experimental mechanics community for full-field strain measurement. First, developed by a group of researchers from the University of South Carolina in the 1980s [7], DIC has been continuously refined and widely investigated for full-field displacement and strain measurements in different fields and environments. There are many advantages on deformation analysis for DIC such as: The simple experimental setup, easy implementation, wide range of applicability with adjustable temporal, and spatial resolutions [8,9,10]. Turner’s team [11] was the first one to measure the full-field displacement and strain by DIC at elevated temperatures. They determined the thermal strain and coefficient of thermal expansion (CTE) of three alloys at a temperature up to 600 °C. The charge-coupled device (CCD) camera was found to be very sensitive to the infrared radiation emitted by the heated sample. Thus, an infrared light cutting filter was used to reduce the infrared radiation. Lyons et al. [12] used DIC to determine the thermally and mechanically induced strain of the Inconel 718 alloy at temperatures up to 650 °C. In their work, they observed that the thermal radiation of a sample over 750 °C was brighter than the illuminated white light source which results in a failure of DIC analysis. To deal with this problem, they suggested using a brighter illuminator or filtering the appropriate wavelengths of radiation for achieving accurate measurements at even higher temperatures. Grant et al. [13] established an imaging system composed of blue light passing filters and blue illuminations to supress intensified thermal radiation for acquiring suitable images applied in DIC at elevated temperatures. The Young’s modulus and CTE of a Ni-base superalloy in the tensile loading test from ambient to 1000 °C were measured. Adopting the similar blue illuminations system, Young’s modulus, thermal expansion, and thermal-mechanical deformation during mechanical tests were measured and analysed at elevated temperatures up to 1600 °C [14,15,16]. However, the long-term creep test and creep behavior analysis of superalloy via DIC is seldom reported beyond 800 °C. This is mainly because long-term monitoring of creep behavior by DIC faces several challenges: First, intensified thermal radiation of the heated samples at higher temperatures will result in serious “decorrelation effect” above 600 °C that restricted the deformation measurement. Second, the artificial speckle pattern in the heating zone is vulnerable to long-term heating, which will be oxidized or burned off. Third, the gradient of temperature of heated air in the vicinity of a heated body can cause local changes in the refractive index which will lead to strain and displacement error.
For better solution of thermal radiation for DIC calculation at elevated temperatures, a novel ultraviolet (UV) imaging concept was proposed [17]. As it is shown in Figure 1a, when the temperature reaches 980 °C, the radiation light of wavelength over 400 nm increases significantly. However, the UV light zone remains weak at this temperature. As a result, UV light has been utilized for eliminating the disturbance of thermal radiation, as schematically illustrated in Figure 1b that the sample is actively illuminated by UV light while the residual radiation is cut off by an optical filter. A schematic illustration of the setup of the proposed microscopic system is shown in Figure 1c which is composed of a UV CCD camera, a bandpass filter, a UV light source, and a lens system [18]. Employing the novel UV imaging combing DIC (UV-DIC), the free thermal expansion of superalloy and ceramics composites have been studied [19,20,21]. However, studying the creep behavior of superalloys was never involved using the UV-DIC. In previous work [22], a direct current heating system (DCHS) with a high vacuum environment below 10−4 Pa was designed and established for high temperature observation for DIC measurement, and the DIC results showed a full-field strain map of SX specimens during tensile testing. The tensile property of recast layer around the drilled hole of thin-wall specimens was studied. However, the applications of DIC on tensile property cannot satisfy the superalloy researchers, the in situ DIC investigation on creep is still needed.
The objective of this work consists of in situ characterization of the creep behavior of SX specimens. For this purpose, both of the DCHS and the novel UV-DIC system was employed. Composed of UV lighting, bandpass filter imaging, and CCD cameras, the system can effectively suppress the strong thermal radiation encountered for the high temperature observation. The DCHS with high vacuum having merits of terminating the heat haze effect and lessening thermal radiation due to only the specimen itself emitting light was used to heat the specimen. A stable speckle pattern with long-term stability was fabricated. The full-field strain map of creep deformation was measured. To the author’s best knowledge, this is the first report regarding the creep behavior characterization of superalloy using UV-DIC.

2. Materials and Experimental Procedures

2.1. Materials and Specimen Preparation

A Ni-based SX model superalloy, with nominal composition (wt %) of (7.4–7.8)Al, (3.0–4.5)Ta, (8.9–9.3)Mo, (1.3–2.7)Cr, (1.4–1.6) Re, and Ni the balance, was chosen for this work, which is similar to a newly-developed 1200 °C-resisted SCA3 [23]. The master alloy was prepared by vacuum induction melting (VIM), and SX rods were produced by HRS (high-rate-solidification). The rod with the orientation within 5° deviating from [001] crystallographic direction (determined by Laue diffraction analysis) was chosen for this work. Then, the rod was fully heat treated under 1300 °C/2 h + 1310 °C/2 h + 1320 °C/2 h + 1330 °C/6 h + 1340 °C/10 h, air cooling (AC) + 1080 °C/2 h, AC + 870 °C/24 h, AC. After that, the rod was cut into creep specimens in Figure 2a. The thin-wall (TW) specimen was prepared by the following steps: (1) Mechanically grinded and polished the TW surface; (2) etched the polished surfaces of TW to appear the white background; (3) the Co2O3 speckles were printed on the surface of TW specimens by a high-pressure airbrush gun. Figure 2c shows the TW specimen white (010) surface covered with Co2O3 speckles.

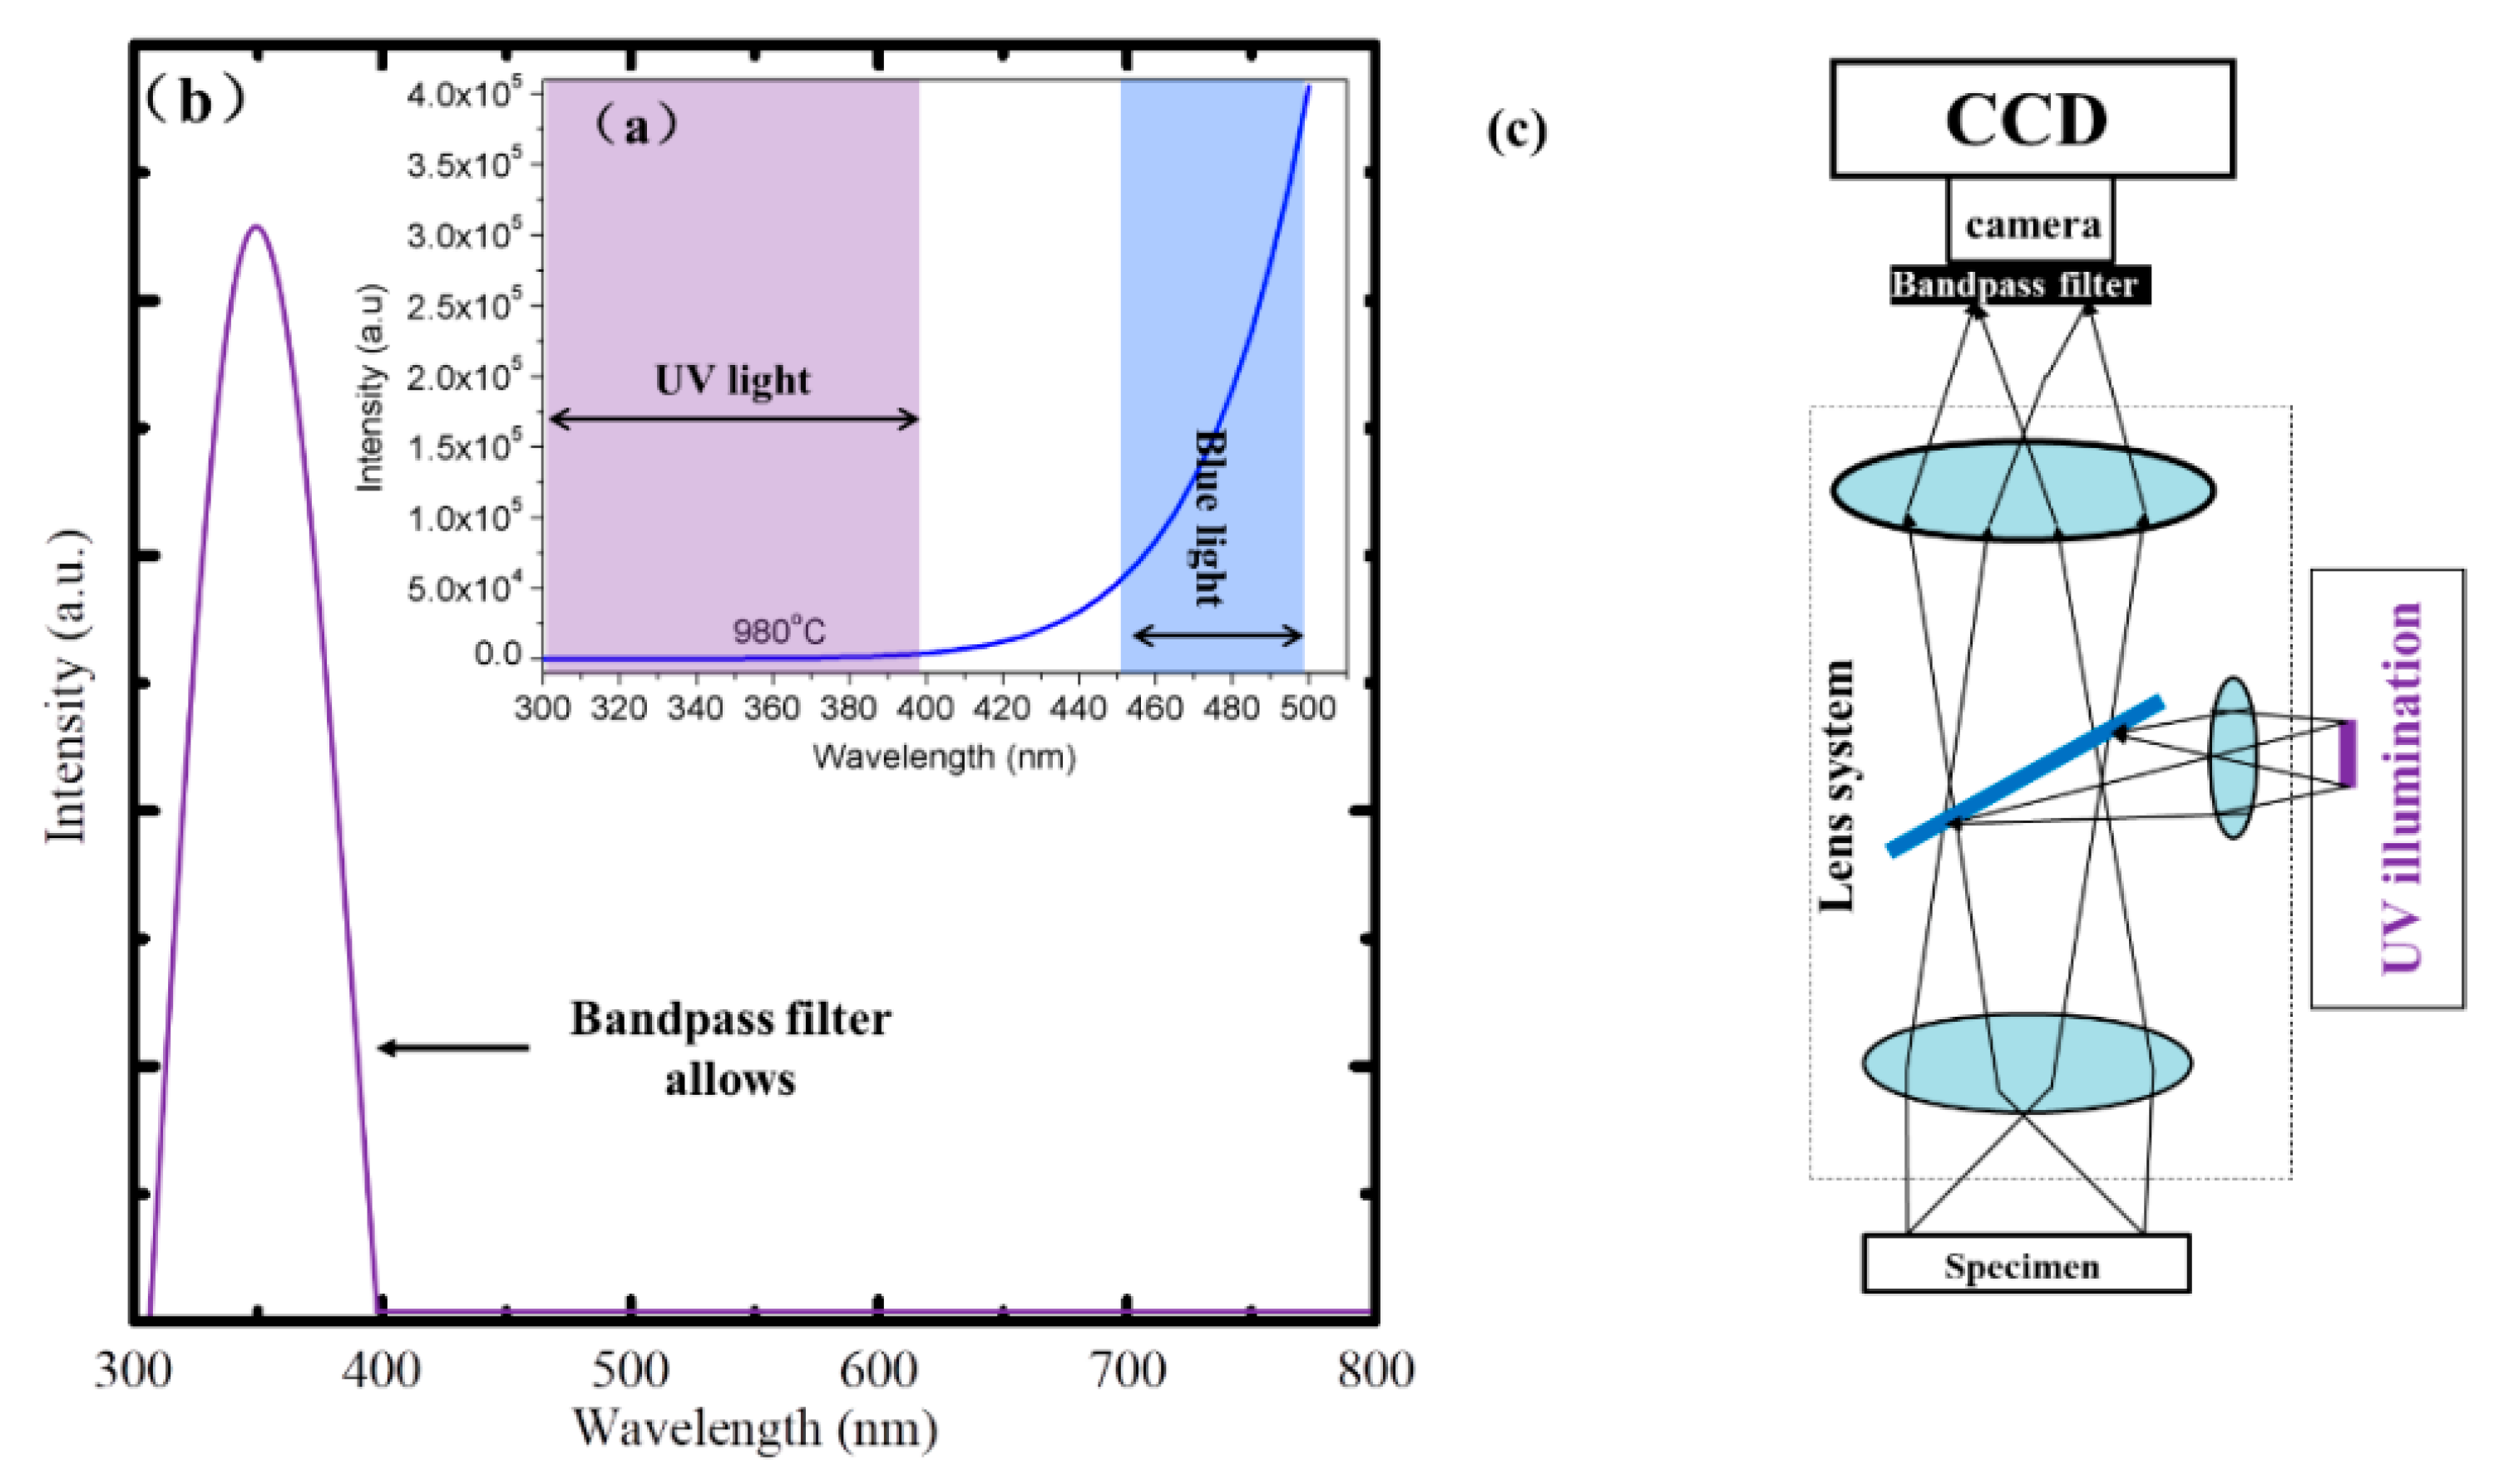
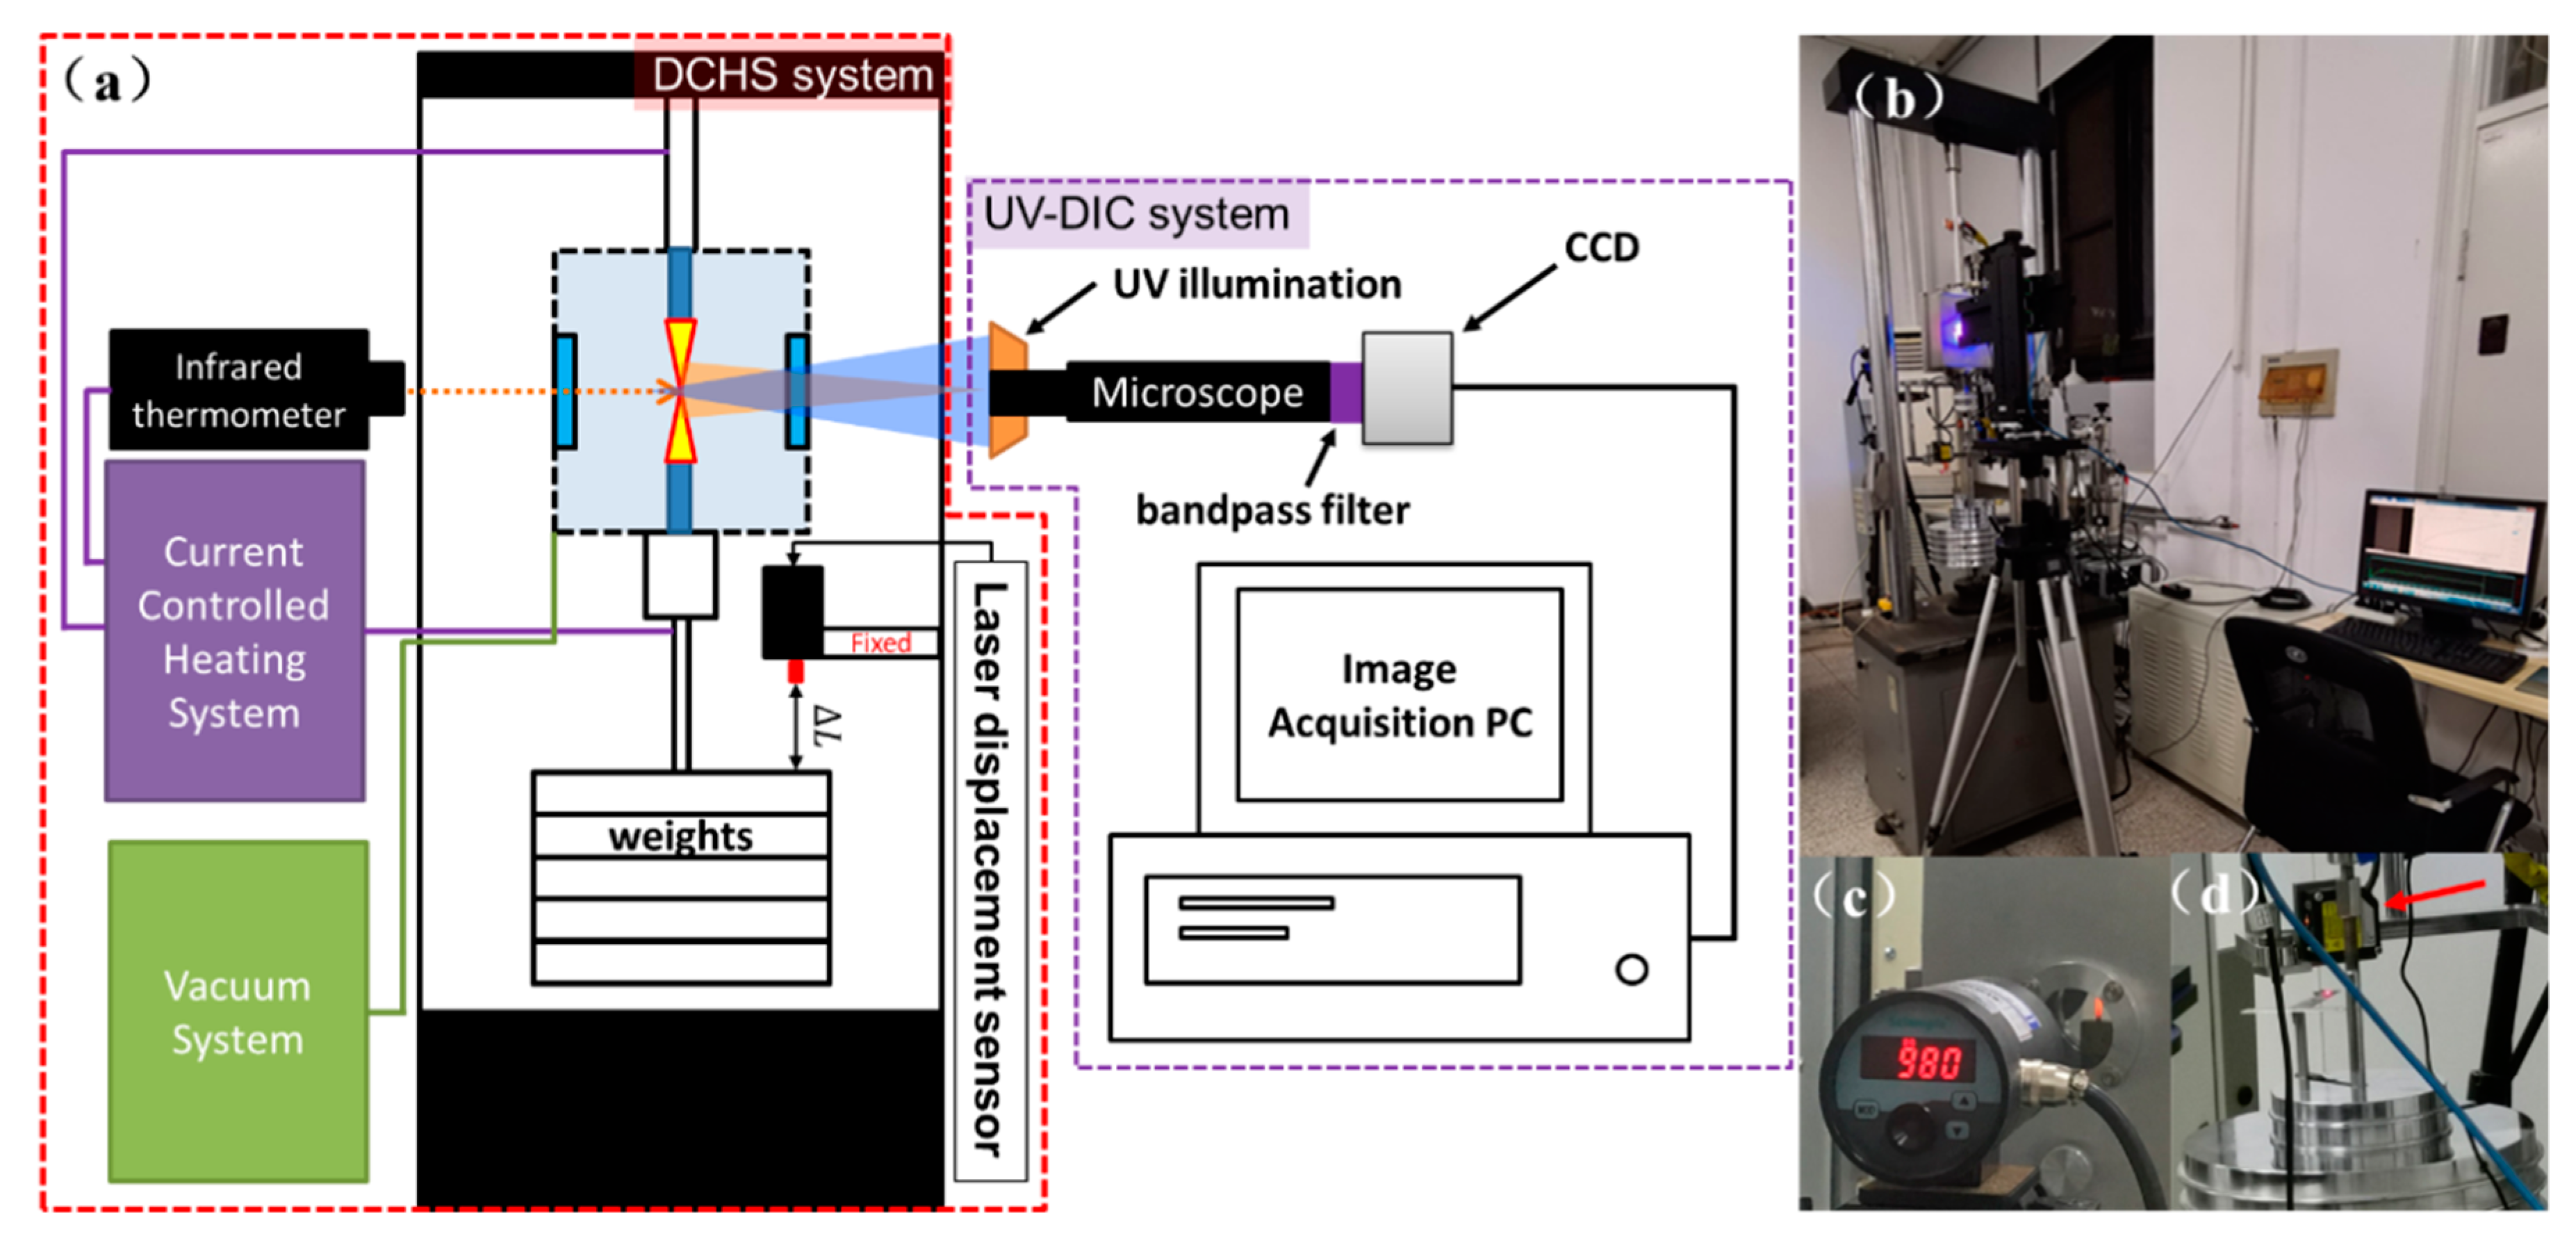
2.2. In Situ DIC Observation at 980 °C during Creep Test

Figure 3a shows illustrations of the DCHS and UV-DIC system for the creep test. The UV-DIC system consists of a UV illumination, an optical microscope, a bandpass filter, and a CCD camera (Microvision, MV-EM510M, Xi′an, China) with a resolution of 2456 × 2058 pixels. The quantum efficiency of the CCD is about 55% at 350 nm (Figure 2d). The UV bandpass filter, with a center wavelength of 365 ± 10 nm and a full-width at half maximum (FWHM) value of approximately 15 nm, has a transmittance of 60% at 365 nm. Since only the emitted UV light can pass through the bandpass filter to enter CCD sensor, the CCD can only receive pure light from UV illumination. The creep loads were conducted by those weights in Figure 3b, and a laser displacement sensor (LDS, Panasonic, HL-G103-A-C5, Osaka, Japan) was used for recording the displacement of those weights as shown in Figure 3d. Therefore, the ∆L (distance between the LDS and the top weight surface) recorded by LDS during creep included two parts: (1) The thermal expansion from the top to weight surface, which can be minimized by enough preload time before creep; (2) the creep strain from the specimen. The temperature of the specimen was measured by a colorimetric infrared thermometer (Sciample, CIT-1MD, Beijing, China) in Figure 3c and controlled by regulating electric density. When the heating program began, the specimen was heated by high frequency direct current (HFDC) with a rate about 100 °C s−1. Due to the HFDC heating, the temperature on the specimen was not uniform along the loads direction. Another colorimetric infrared thermometer was employed to measure the temperature distribution from the top to the bottom of the specimens. The results were shown in Figure 2b, the temperature distribution appears to be a parabola, and the uniform (±5‰) area is about 3 mm on the specimen. In order to prevent the surface from oxidation, a high vacuum environment below 10−4 Pa was established by a vacuum system. During the creep test, the specimen was preloaded with 30 MPa before LDS become stable which minimizes the thermal expansion of the loading-system (the fixture, pull-rods, and specimen) that might influence ∆L. After the ∆L of LDS was no longer increased in 30 min, the full stress of 250 MPa was loaded on the specimens, and the UV-DIC system began to record the deformed image with a capturing rate of one image per 10 min during the creep test.

2.3. Image Analysis

To quantify the brightness change of surface images during the creep process, the mean gray value of speckle pattern images acquired via UV optical system was evaluated using the histogram function in an image software package (ImageJ 1.45 s, Wayne Rasband, National Institutes of Health, Bethesda, MD, USA). The relationship between the mean gray value and temperature was analyzed. The surface strain field during creep testing was calculated by a commercial software VIC-2D (2009 Digital Image Correlation, version 2009.1.0, Correlated Solutions Inc., Columbia, SC, USA), which determines real-time displacement of the patterns from a reference image to deformed ones. During the analysis of these images using the 2D-DIC technique, a rectangle was plotted as the region of interest (ROI) shown in Figure 4a. The subset size was set to be 71 × 71 pixels, and the step size was set to be seven pixels. Zero-normalized sum of squared difference (ZNSSD), which offers the most robust noise-proof performance and is insensitive to the offset and linear scale in illumination lighting, was utilized. The ZNSSD is defined as follows:
C ZNSSD ( p ) = i = M M j = M M [ f ( x i , y j ) f m i = M M j = M M [ f ( x i , y j ) f m ] 2 g ( x i , y j ) g m i = M M j = M M [ g ( x i , y j ) g m ] 2 ] 2

2.4. Microstructure Analysis

The metallographic specimen was mechanically grinded, polished, and etched with 5 g CuCl2 + 100 mL HCl + 100 mL H2O + 100 mL C2H5OH. The fracture structure of the TW specimen after [001] creep was observed by scanning electron microscopy (SEM, CamScan, CS3400, Cambridgeshire, England) via the [010] directions. The microstructure on the observed surface was determined using SEM for investigating the evolution of the γ and γ′ phases after creep rupture.

3. Results and Discussion

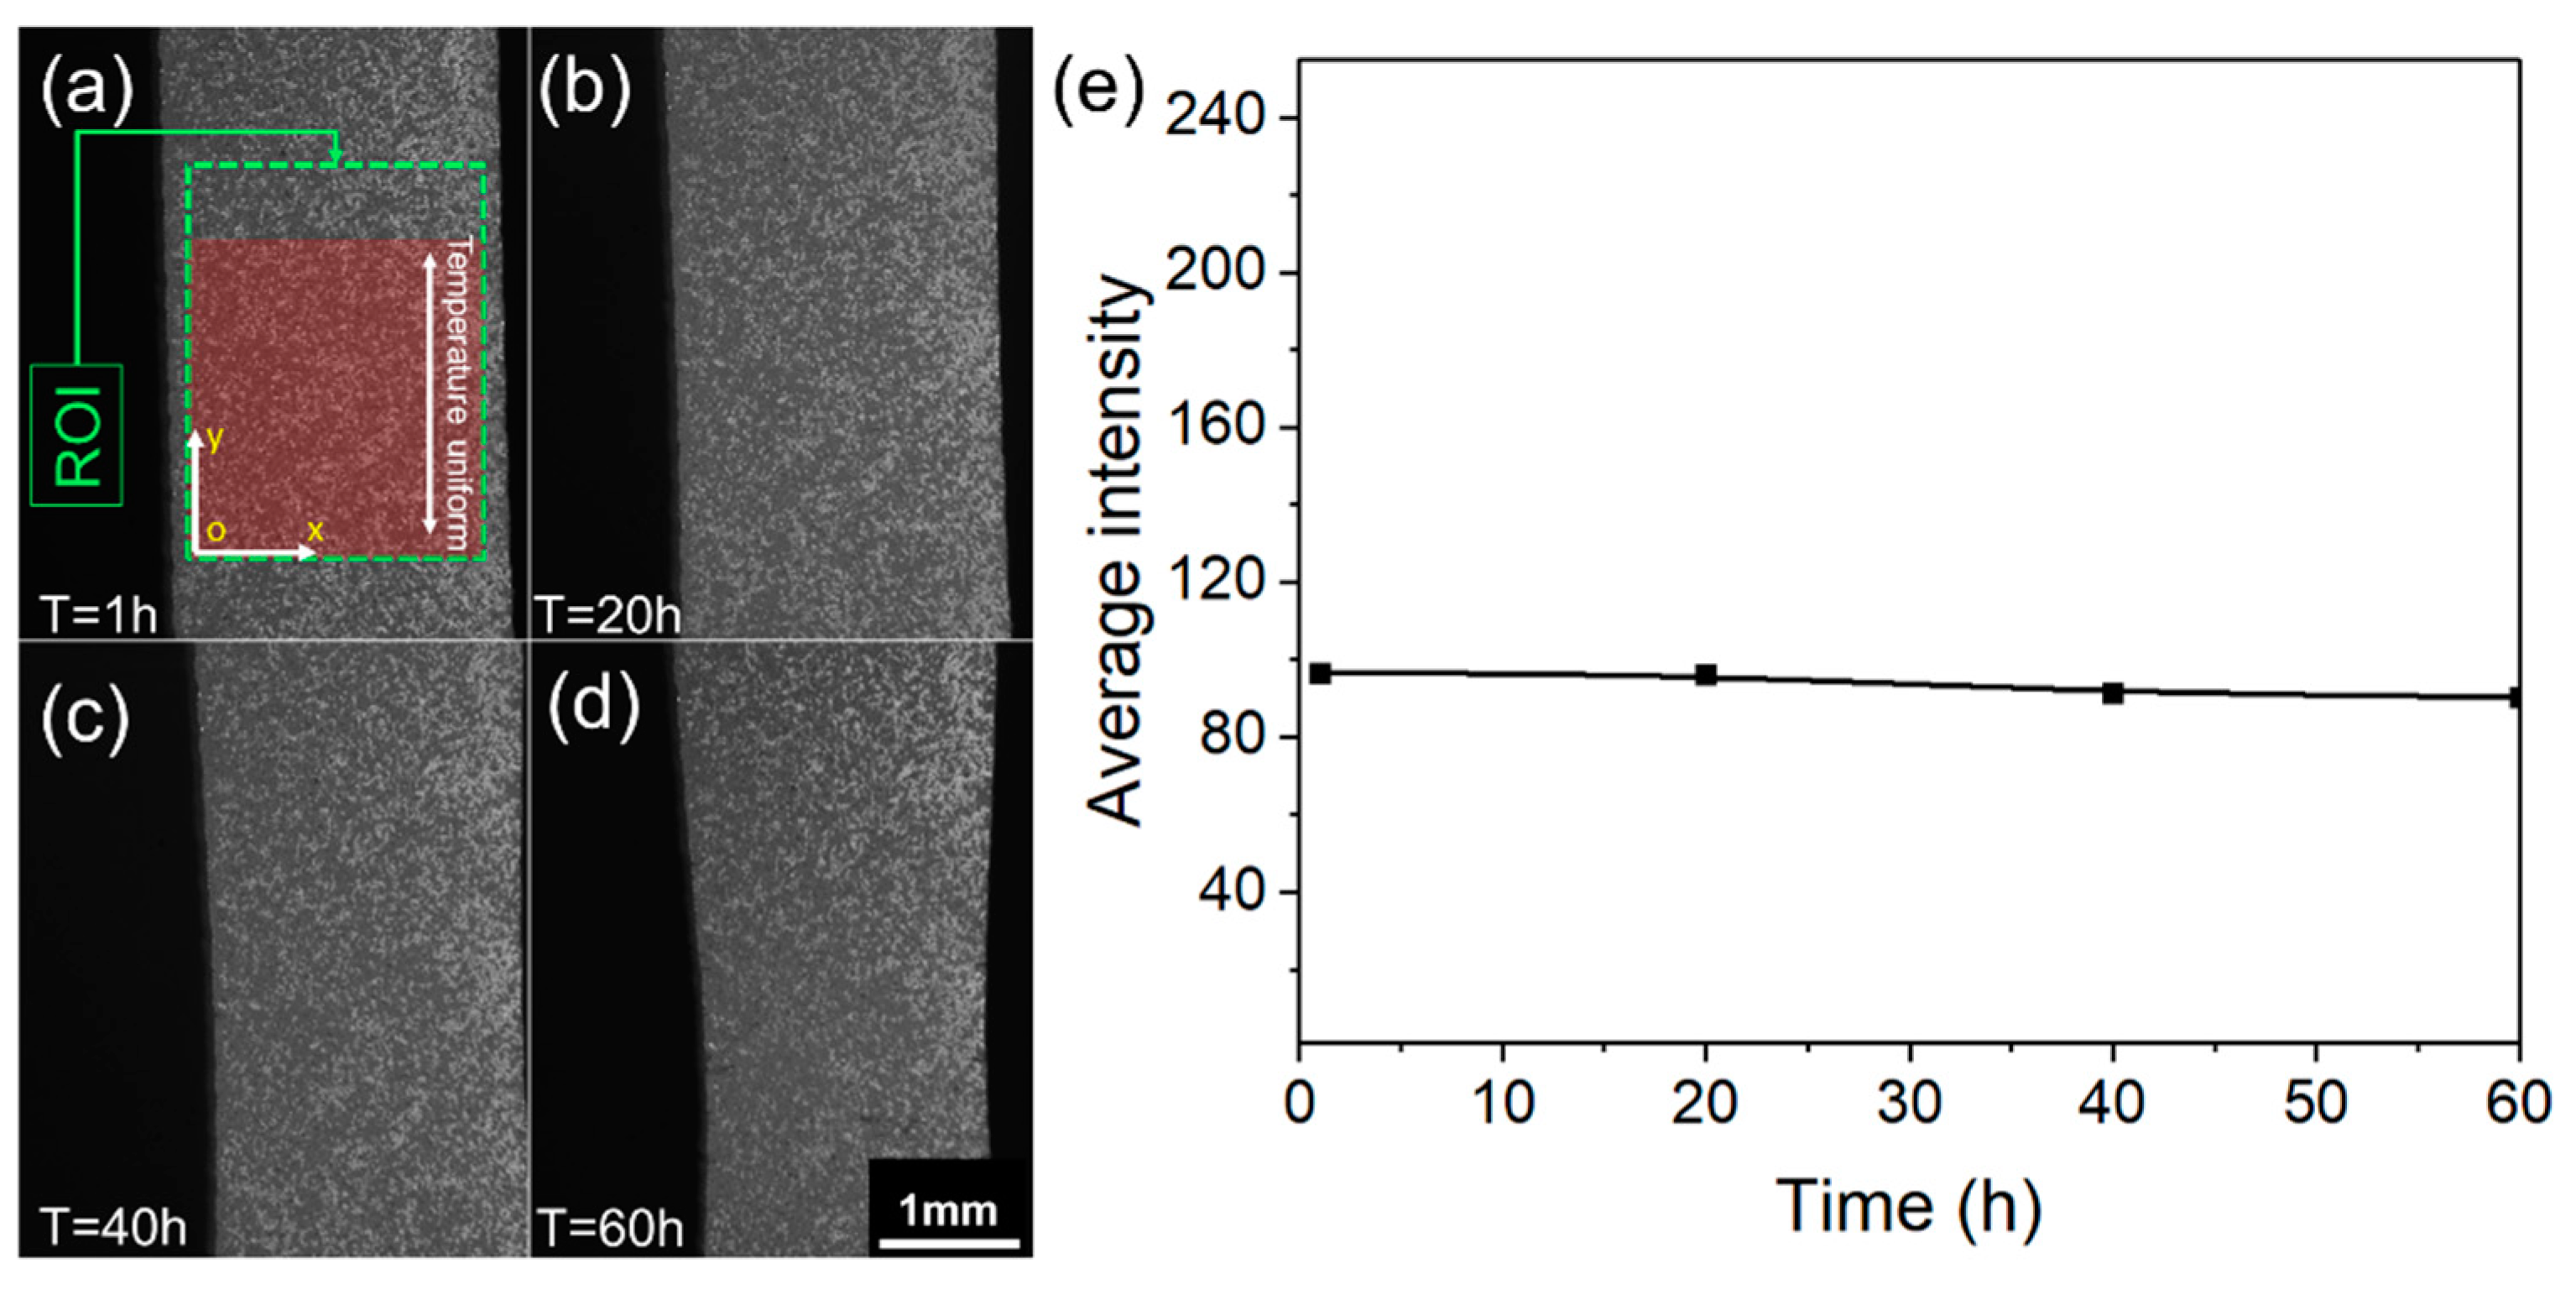
3.1. The Characterization of Creep Behaviors by UV-DIC System

The creep rupture life of the TW specimen at 980 °C/250 MPa is about 65 h. During the creep test, the UV-DIC system records the deformed image of the specimen surface in every 10 min. Figure 4a–d shows the typical images at different stages of the creep test, the speckles on the surface kept quite clear and stable at an elevated temperature within 65 h. It is obvious that all these images provided high contrast and sharpness, which confirmed the capability of the UV imaging system in suppressing the adverse influence of thermal radiation at elevated temperature. In order to investigate the quality of the image, a coordinate was established with the region of interest (ROI) zone at the left bottom of ROI, the x axis along width direction, and the y axis along the tensile direction, as defined in Figure 4a. The average intensity function E ( x , y ) is defined as:
E ( x , y ) = 1 x 1 · x = 0 x = x 1 ( 1 y 1 · y = 0 y = y 1 I ( x , y ) )
where I ( x , y ) is the pixel intensity of ROI at position ( x , y ) , x 1 are the most right positions on the x axis, y 1 are the top positions on the y axis, the corresponding average intensity, which was calculated by function E ( x , y ) of those images is shown in Figure 4e. As a parameter to evaluate if the images quality [20] is good enough for DIC calculation, the average intensity keeps almost unchanged during the creep test indicating that the speckles on the surface maintains stable at an elevated temperature within 65 h, which can be used for long term calculation of strain field via DIC.
The ROI was defined as surrounded by the green line in Figure 4a on the speckled surface. The full-field strain ( ε y y ) distribution maps during the creep test at 1, 20, 40 and 60 h were obtained by VIC-2D, as shown in Figure 5a–d. It can be seen that, for the TW specimen, no obvious strain concentration occurs on the calculation zone until 40 h. For a face centered cubic (FCC) crystal (Ni–based SX alloy is a FCC alloy), there are eight equivalent 110 { 111 } dislocation slip systems when the loads direction is strictly along [001] direction at an elevated temperature [24]. In spite of 5° deviating from [001] crystallographic orientation for TW specimen, in this case, only one a / 2 1 1 ¯ 0 { 111 } dislocation slip system activates preferentially at the beginning of the creep. Then, the Schmid factor, which commonly affects the activation ability of dislocation slip based on grain orientation [25] (the greater Schmid factor, the higher activation ability on dislocation movement), of this slip system will soon reduce to balance the asymmetrical deformation. In other words, the Schmid factor of other dislocation slip systems is increased. Therefore, the left slip systems will be activated the following time to cause multiple and stable slips [24]. As a result, the creep deformation exhibits a uniform deformation until necking begins at 980 °C. Figure 5c shows the deformation continuously increased while the necking phenomenon appeared. At the end of the creep, the stress increases as the cross section decreases. The amount of dislocations activated, left a large number of defects inside the specimen, which leads to initial cracks in Figure 5d.

3.2. Comparison between DIC and LDS Deformation Results

In order to obtain the creep behavior from the time-strain curve, both of DIC and LDS are employed for calculating the creep strain. A visual extensometer was set between two white points as shown in Figure 6a, which provides the time-strain curve for the creep test. The creep strain can be calculated as ε D I C = Δ L D I C / L 0 D I C . The ε D I C is the creep strain from the DIC result, Δ L D I C is the displacement between two white points in Figure 6a, L 0 D I C is the original gauge length (the distance between two white points in Figure 6a at the beginning of the creep). Meanwhile, the LDS also recorded the displacement information on the specimen. However, the temperature along the specimen was not absolutely uniform. According to Figure 2b, the temperature uniform zone (denoting the highest temperature zone) on the specimen is 3 mm. In order to calculate the acceptable original gauge length for LDS during the steady-state creep, the strain rate of the SX alloy can be expressed by the Dorn law [26]:
ε . s s = A σ A n exp ( Q a R T )
In the equation, ε . s s is the strain rate during a steady-state creep, A is the constant related to material structure, σ A is the applied stress ( σ A = 250   M P a ), n is the apparent stress exponent ( n 001 = 4.77 ) [26], R is the gas constant ( R = 8.314   kJ / mol ), T is the thermodynamics temperature, and Q is the apparent creep activation energy ( Q 001 = 469.56   kJ / mol ) [26]. Assuming that the creep rate ε . s s at 980 °C equals to one, the relative creep rate curve at different temperatures can be expressed in Figure 6b. The result indicated that the reduced temperature every 50 K can significantly prolong the rupture life of superalloys, and lowers the constant creep rate by an order of magnitude. The uniform zone of the heating area is about 3 mm, according to the measurement result in Figure 2b, the temperature of the other locations were soon falling to 930 °C. Therefore, it is acceptable that the considered temperature uniform length 3 mm to be the original gauge length ( L 0 L D S ) for LDS measurement. Then, the creep strain ε L D S can be expressed as ε L D S = Δ L L D S / L 0 L D S , which ∆LLDS is the displacement increment.
The creep deformation curves obtained by DIC and LDS are shown in Figure 6c. It appeared to be a good agreement between the DIC and LDS results. However, there still remains a slight difference between the DIC and LDS results. The preload time makes sure the whole loading-system reached a thermal equilibrium, which eliminated thermal expansion from the loading-system. Nevertheless, when the loads were increased from 30 to 250 MPa, the thermal contact resistance of the loading-system was reduced by the increasing contact stress, and it breaks the thermal balance which slightly raises the temperature of loading-system up. The extra thermal expansion from the loading-system was then taken accounted into LDS record leading to the result that LDS data become higher than the real value at the beginning of the creep. At the end of the creep, the necking phenomenon occurred, the deformation above the temperature uniform zone was no longer stable. As a result, the uniform deformation zone becomes shorter than L 0 L D S , in other words, the deformation information calculated by LDS becomes lower than the real value. Above all, it is obvious that the DIC results are more accurate than the LDS during the creep test, and the advantages are significant on the nonuniform analysis.

3.3. Microstructure Analysis of TW Specimen

Figure 7a shows the two-phase microstructure of a SX alloy after the standard heat treatment condition. It consists of γ′-cubes embedded in the γ-matrix, where the γ′ fraction is about 78 vol %, the γ′-cube size is 0.4−0.6 μm and the γ-channel width is 50–70 nm. Figure 7b shows the ε y y strain map of the TW specimen before creep rupture from DIC results. The microstructure of α and β area in Figure 7b were observed by SEM, which represented the temperature uniform (β) and nonuniform (α) areas, respectively. The microstructures in Figure 7c,d exhibited “rafting” and “collapse” structures which result in the creep rate differences. At the beginning of the high-temperature creep for Ni-based SX alloy, the cuboidal phase γ′ aligned along the crystallographic directions coarsens toward the direction perpendicular to the [001] tensile stress axis, which is called directional coarsening or “rafting” structure [27,28,29]. The “rafting” structure will be collapsed by continual stress and high temperature after a certain time, which is called the “collapse” structure. In other words, the appearance of the “collapse” structure indicated that the SX alloy is about to fail. Therefore, the “collapse” structure in area β implies that it is suffering from enough time under stress and high temperature which causes the rupture. On the contrary, the “rafting” structure belongs to the temperature nonuniform areas on the specimen, where the temperature is significantly lower than 980 °C. In this circumstance, according to Equation (3) in Section 3.2, the creep rate of area α is supposed to be slower than area β, and area α will certainly have a longer creep life. By the advantage of the DIC analysis, another two visual extensometers, corresponding to the VE1 and VE2 in Figure 7b, have been built for calculating the creep rate of α and β area in Figure 7e. It is obviously found that the creep rate of VE1 is significantly lower than the VE2, which results in the “rafting” and “collapse” structure in Figure 7c,d.

4. Conclusions

In this study, for the first time, in situ creep behavior characterization of a SX superalloy was studied at 980 °C by the UV-DIC technique. Benefiting from the specially designed UV imaging and DSCH system, strong disturbance of thermal radiation emitted from the heated sample and the traditional heating devices can be well suppressed. As such, high-fidelity images can be recorded with almost constant image contrast. In addition, by fully taking advantage of DSCH and full field capacities of the UV-DIC technique, imaging can be getting rid of heat haze and thermal radiation. The advantages of DIC are demonstrated by in situ creep behavior characterization of Ni-based SX superalloys. The full-field strain map provides more detail information from the creep test, such as local deformation, heterogeneous deformation, etc. The results successfully showed the validity and great potential of the proposed technique in measuring the creep behavior of high-temperature structural materials.

Author Contributions

Conceptualization, S.G. and Y.P.; methodology, Y.S.; software, Y.D.; validation, S.G., S.L. and C.M.; formal analysis, Y.S.; investigation, Y.S.; resources, S.G.; data curation, Y.S.; writing—original draft preparation, Y.S.; writing—review and editing, Y.D. and C.M.; visualization, Y.S.; supervision, S.G. and C.M.; project administration, S.G.; funding acquisition, S.G., S.L., Y.P. and Y.D.

Funding

This research is sponsored by the National Nature Science Foundations of China under grant Nos. 51671015, 51771007, 11602011, National Key Research and Development Program of China under grant No. 2017YFA0700700, and National Science and Technology Major Project (2017-VI-0011-0083).

Acknowledgments

The authors acknowledge the support of Heng Zhang and Yi Ru for technical support and materials used for experiments.

Conflicts of Interest

The authors declare no conflict of interest.

References

  1. Shi, Z.X.; Liu, S.Z.; Jian, Y.U.; Li, J.R. Tensile behavior of the second generation single crystal superalloy DD6. J. Iron Steel Res. Int. 2015, 22, 738–742. [Google Scholar] [CrossRef]
  2. Pollock, T.M.; Argon, A.S. Creep resistance of CMSX-3 nickel base superalloy single crystals. Acta Metall. Mater. 1992, 40, 1–30. [Google Scholar] [CrossRef]
  3. Nathal, M.V.; Ebert, L.J. Elevated temperature creep-Rupture behavior of the single crystal nickel-Base superalloy NASAIR 100. Metall. Trans. A 1985, 16, 427–439. [Google Scholar] [CrossRef]
  4. Jiang, L.W.; Li, S.S.; Wu, M.L. Investigation on creep mechanism of a Ni3Al-based single crystal superalloy IC6SX under 760oC/540MPa. Mater. Sci. Forum 2013, 747, 804–809. [Google Scholar] [CrossRef]
  5. Mughrabi, H.; Tetzlaff, U. Microstructure and high-temperature strength of monocrystalline nickel-Base superalloys. Adv. Eng. Mater. 2000, 2, 319–326. [Google Scholar] [CrossRef]
  6. McEnteggart, I. Contacting and non-contacting extensometry for ultra-high temperature testing. In Ultra High Temperature Mechanical Testing; Woodhead Publishing: Cambridge, UK, 1995; pp. 157–169. [Google Scholar]
  7. Peters, W.H.; Ranson, W.F. Digital imaging techniques in experimental stress analysis. Opt. Eng. 1982, 21, 213427. [Google Scholar] [CrossRef]
  8. Dong, Y.L.; Pan, B. A review of speckle pattern fabrication and assessment for digital image correlation. Exp. Mech. 2017, 57, 1161–1181. [Google Scholar] [CrossRef]
  9. Hild, F.; Roux, S. Digital image correlation: from displacement measurement to identification of elastic properties—A review. Strain 2006, 42, 69–80. [Google Scholar] [CrossRef]
  10. Dong, Y.; Kakisawa, H.; Kagawa, Y. Development of microscale pattern for digital image correlation up to 1400 C. Opt. Lasers Eng. 2015, 68, 7–15. [Google Scholar] [CrossRef]
  11. Turner, J.L.; Russell, S.S. Application of digital image analysis to strain measurement at elevated temperature. Strain 1990, 26, 55–59. [Google Scholar] [CrossRef]
  12. Liu, J.; Lyons, J.; Sutton, M.; Reynolds, A. Experimental characterization of crack tip deformation fields in alloy 718 at high temperatures. J. Eng. Mater. Technol. 1998, 120, 71–78. [Google Scholar] [CrossRef]
  13. Grant, B.M.B.; Stone, H.J.; Withers, P.J.; Preuss, M. High-temperature strain field measurement using digital image correlation. J. Strain Anal. Eng. Des. 2009, 44, 263–271. [Google Scholar] [CrossRef]
  14. Novak, M.D.; Zok, F.W. High-temperature materials testing with full-field strain measurement: Experimental design and practice. Rev. Sci. Instrum. 2011, 82, 115101. [Google Scholar] [CrossRef]
  15. Mao, W.G.; Chen, J.; Si, M.S.; Zhang, R.F.; Ma, Q.S.; Fang, D.N.; Chen, X. High temperature digital image correlation evaluation of in-situ failure mechanism: An experimental framework with application to C/SiC composites. Mater. Sci. Eng. 2016, 665, 26–34. [Google Scholar] [CrossRef] [Green Version]
  16. Chen, X.; Yang, L.; Xu, N.; Xie, X.; Sia, B.; Xu, R. Cluster approach based multi-Camera digital image correlation: Methodology and its application in large area high temperature measurement. Opt. Laser Technol. 2014, 57, 318–326. [Google Scholar] [CrossRef]
  17. Dong, Y.; Kakisawa, H.; Kagawa, Y. Optical system for microscopic observation and strain measurement at high temperature. Meas. Sci. Technol. 2014, 25, 025002. [Google Scholar] [CrossRef]
  18. Dong, Y. In-Situ evaluation of C/SiC composites via an ultraviolet imaging system and microstructure based digital image correlation. Nondestruct. Test. Eval. 2018, 33, 427–437. [Google Scholar] [CrossRef]
  19. Dong, Y.; Zhao, J.; Pan, B. Ultraviolet 3D digital image correlation applied for deformation measurement in thermal testing with infrared quartz lamps. Chin. J. Aeronaut. 2019. [Google Scholar] [CrossRef]
  20. Dong, Y.; Pan, B. In-Situ 3D shape and recession measurements of ablative materials in an arc-Heated wind tunnel by UV stereo-Digital image correlation. Opt. Lasers Eng. 2019, 116, 75–81. [Google Scholar] [CrossRef]
  21. Dong, Y.L.; Kakisawa, H.; Kagawa, Y. Development of new observation system used for deformation measurement of ceramic matrix composites at high temperature. Des. Dev. Appl. Struct. Ceram. Compos. Nanomater. 2014, 244, 81. [Google Scholar]
  22. Shang, Y.; Zhang, H.; Hou, H.; Ru, Y.; Pei, Y.; Li, S.; Gong, S.; Xu, H. High temperature tensile behavior of a thin-Walled Ni based single-Crystal superalloy with cooling hole: In-Situ experiment and finite element calculation. J. Alloys Compd. 2019, 782, 619–631. [Google Scholar] [CrossRef]
  23. Ru, Y.; Zhang, H.; Pei, Y.; Li, S.; Zhao, X.; Gong, S.; Xu, H. Improved 1200 °C stress rupture property of single crystal superalloys by γ′-Forming elements addition. Scr. Mater. 2018, 147, 21–26. [Google Scholar] [CrossRef]
  24. Kakehi, K.; Latief, F.H.; Sato, T. Influence of primary and secondary orientations on creep rupture behavior of aluminized single crystal Ni-Based superalloy. Mater. Sci. Eng. 2014, 604, 148–155. [Google Scholar] [CrossRef]
  25. Xin, R.; Liu, Z.; Sun, Y.; Wang, H.; Guo, C.; Ren, W.; Liu, Q. Understanding common grain boundary twins in Mg alloys by a composite Schmid factor. Int. J. Plast. 2019. [Google Scholar] [CrossRef]
  26. Yu, H.; Su, Y.; Tian, N.; Tian, S.; Li, Y.; Yu, X.; Yu, L. Microstructure evolution and creep behaviors of a [111] oriented single crystal nickel-based superalloy during tensile creep. Mater. Sci. Eng. 2013, 565, 292–300. [Google Scholar] [CrossRef]
  27. Müller, L.; Glatzel, U.; Feller-Kniepmeier, M. Calculation of the internal stresses and strains in the microstructure of a single crystal nickel-base superalloy during creep. Acta Metall. Mater. 1993, 41, 3401–3411. [Google Scholar] [CrossRef]
  28. Pollock, T.M.; Argon, A.S. Directional coarsening in nickel-Base single crystals with high volume fractions of coherent precipitates. Acta Metall. Mater. 1994, 42, 1859–1874. [Google Scholar] [CrossRef]
  29. Reed, R.C.; Matan, N.; Cox, D.C.; Rist, M.A.; Rae, C.M.F. Creep of CMSX-4 superalloy single crystals: effects of rafting at high temperature. Acta Mater. 1999, 47, 3367–3381. [Google Scholar] [CrossRef]
Figure 1. (a) Intensity and wavelength relationship at 980 °C according to Planck’s radiation law; (b) the transmittance property of ultra violet (UV) bandpass filter; (c) schematic illustration of the structure of the UV optical system [18].
Coatings 09 00598 g001
Figure 2. (a) The thin-wall (TW) specimen with [001] orientation; (b) the measurement for temperature uniform zone; (c) TW specimen for [001]-creep test with (010) observed speckled surface, the area between red and blue line are the temperature uniform zone; (d) the quantum efficiency of the charge-coupled device (CCD) and the transmittance of bandpass filter was used.
Coatings 09 00598 g002
Figure 3. (a) The illustrations of direct current heating system (DCHS) and UV-digital image correlation (UV-DIC) system; (b) the application of DCHS during the creep test; (c) the colorimetric infrared thermometer shows that the creep temperature is 980 °C; (d) the laser displacement sensor (LDS) is measuring the distance between the weight surface and itself.
Coatings 09 00598 g003
Figure 4. The typical DIC calculation image of the TW specimens at 1 h (a), 20 h (b), 40 h (c) and 60 h (d) during the creep test; (e) the average intensity of region of interest (ROI) at 1, 20, 40 and 60 h.
Coatings 09 00598 g004
Figure 5. The full-field ε y y stain mapping of TW specimens during the creep test at 1 h (a), 20 h (b), 40 h (c) and 60 h (d).
Coatings 09 00598 g005
Figure 6. (a) The visual extensometer on TW specimens during the creep test; (b) the relative creep rate under different temperatures; (c) the LDS and DIC curves for TW creep deformation.
Coatings 09 00598 g006
Figure 7. (a) The original microstructure of IC21 SX alloy after standard heat treatment; (b) the ε y y strain map of the TW specimen before the creep rupture from the DIC result; (c) the microstructure of the area of α (far from the fracture); (d) the microstructure of the area of β (near the fracture); (e) the creep rate of VE1 and VE2 during the creep test.
Coatings 09 00598 g007

