A Micropitting Study Considering Rough Sliding and Mild Wear


Abstract
:1. Introduction
2. Methodology
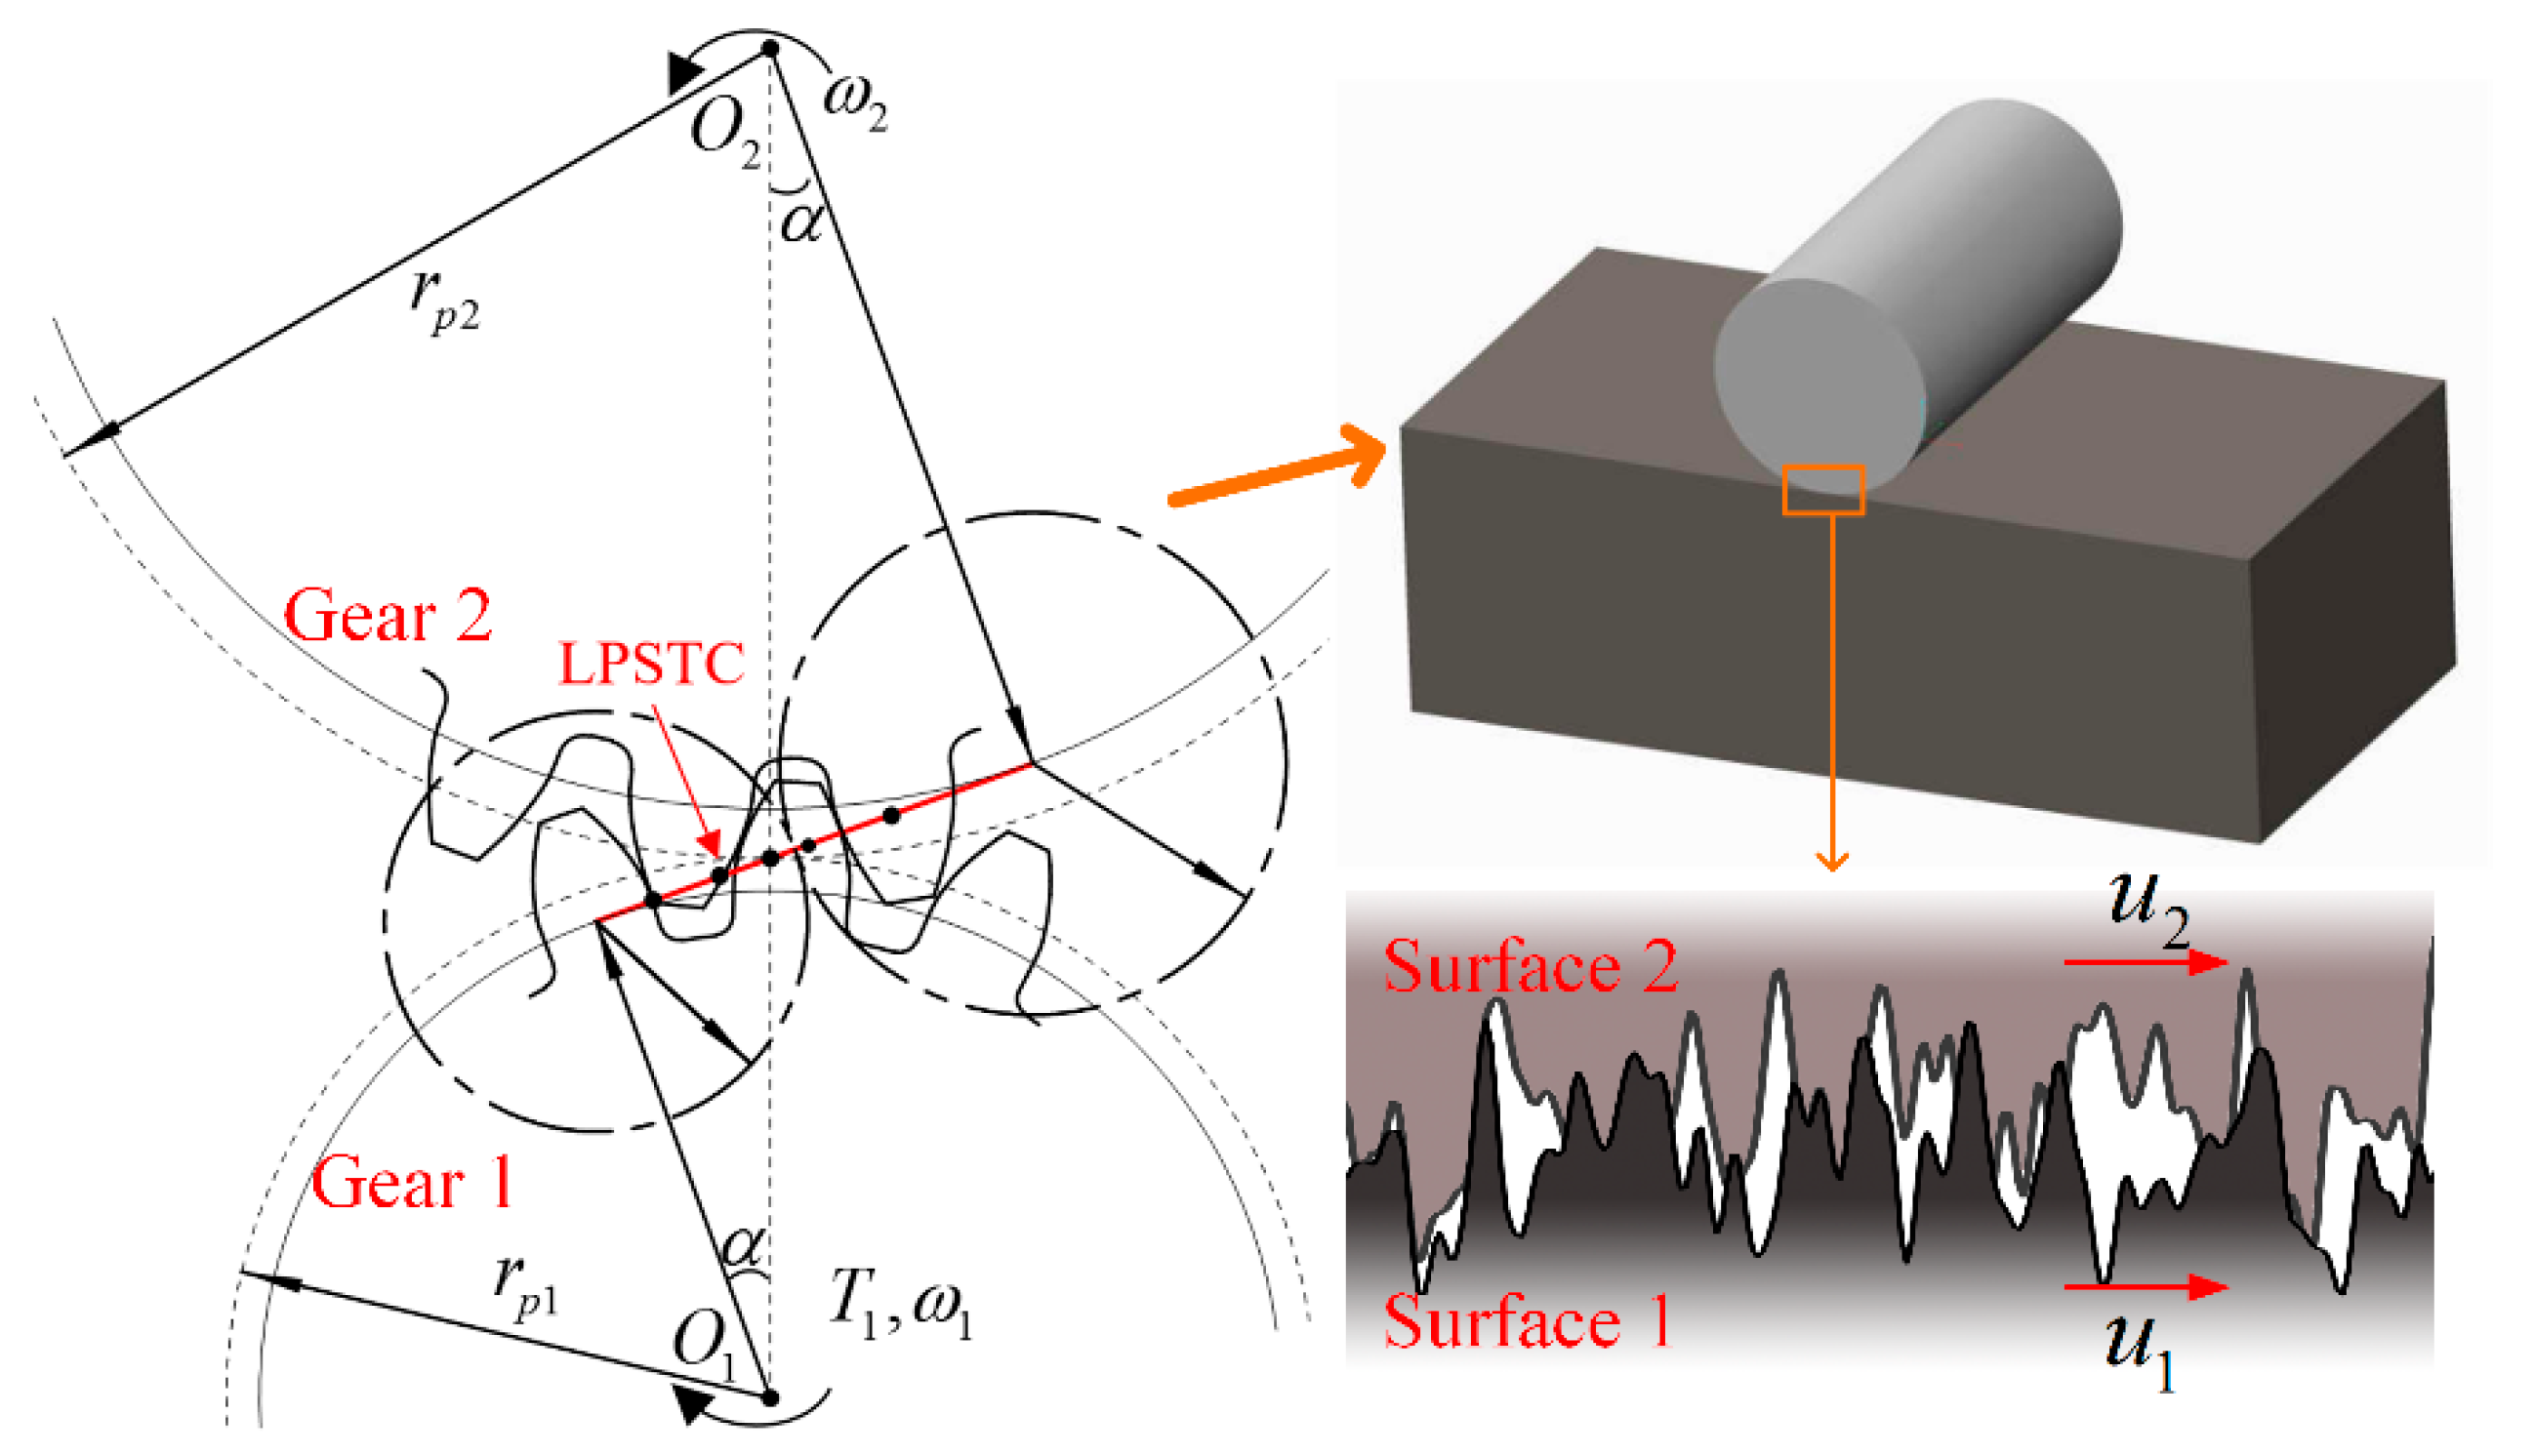
2.1. EHL Equations
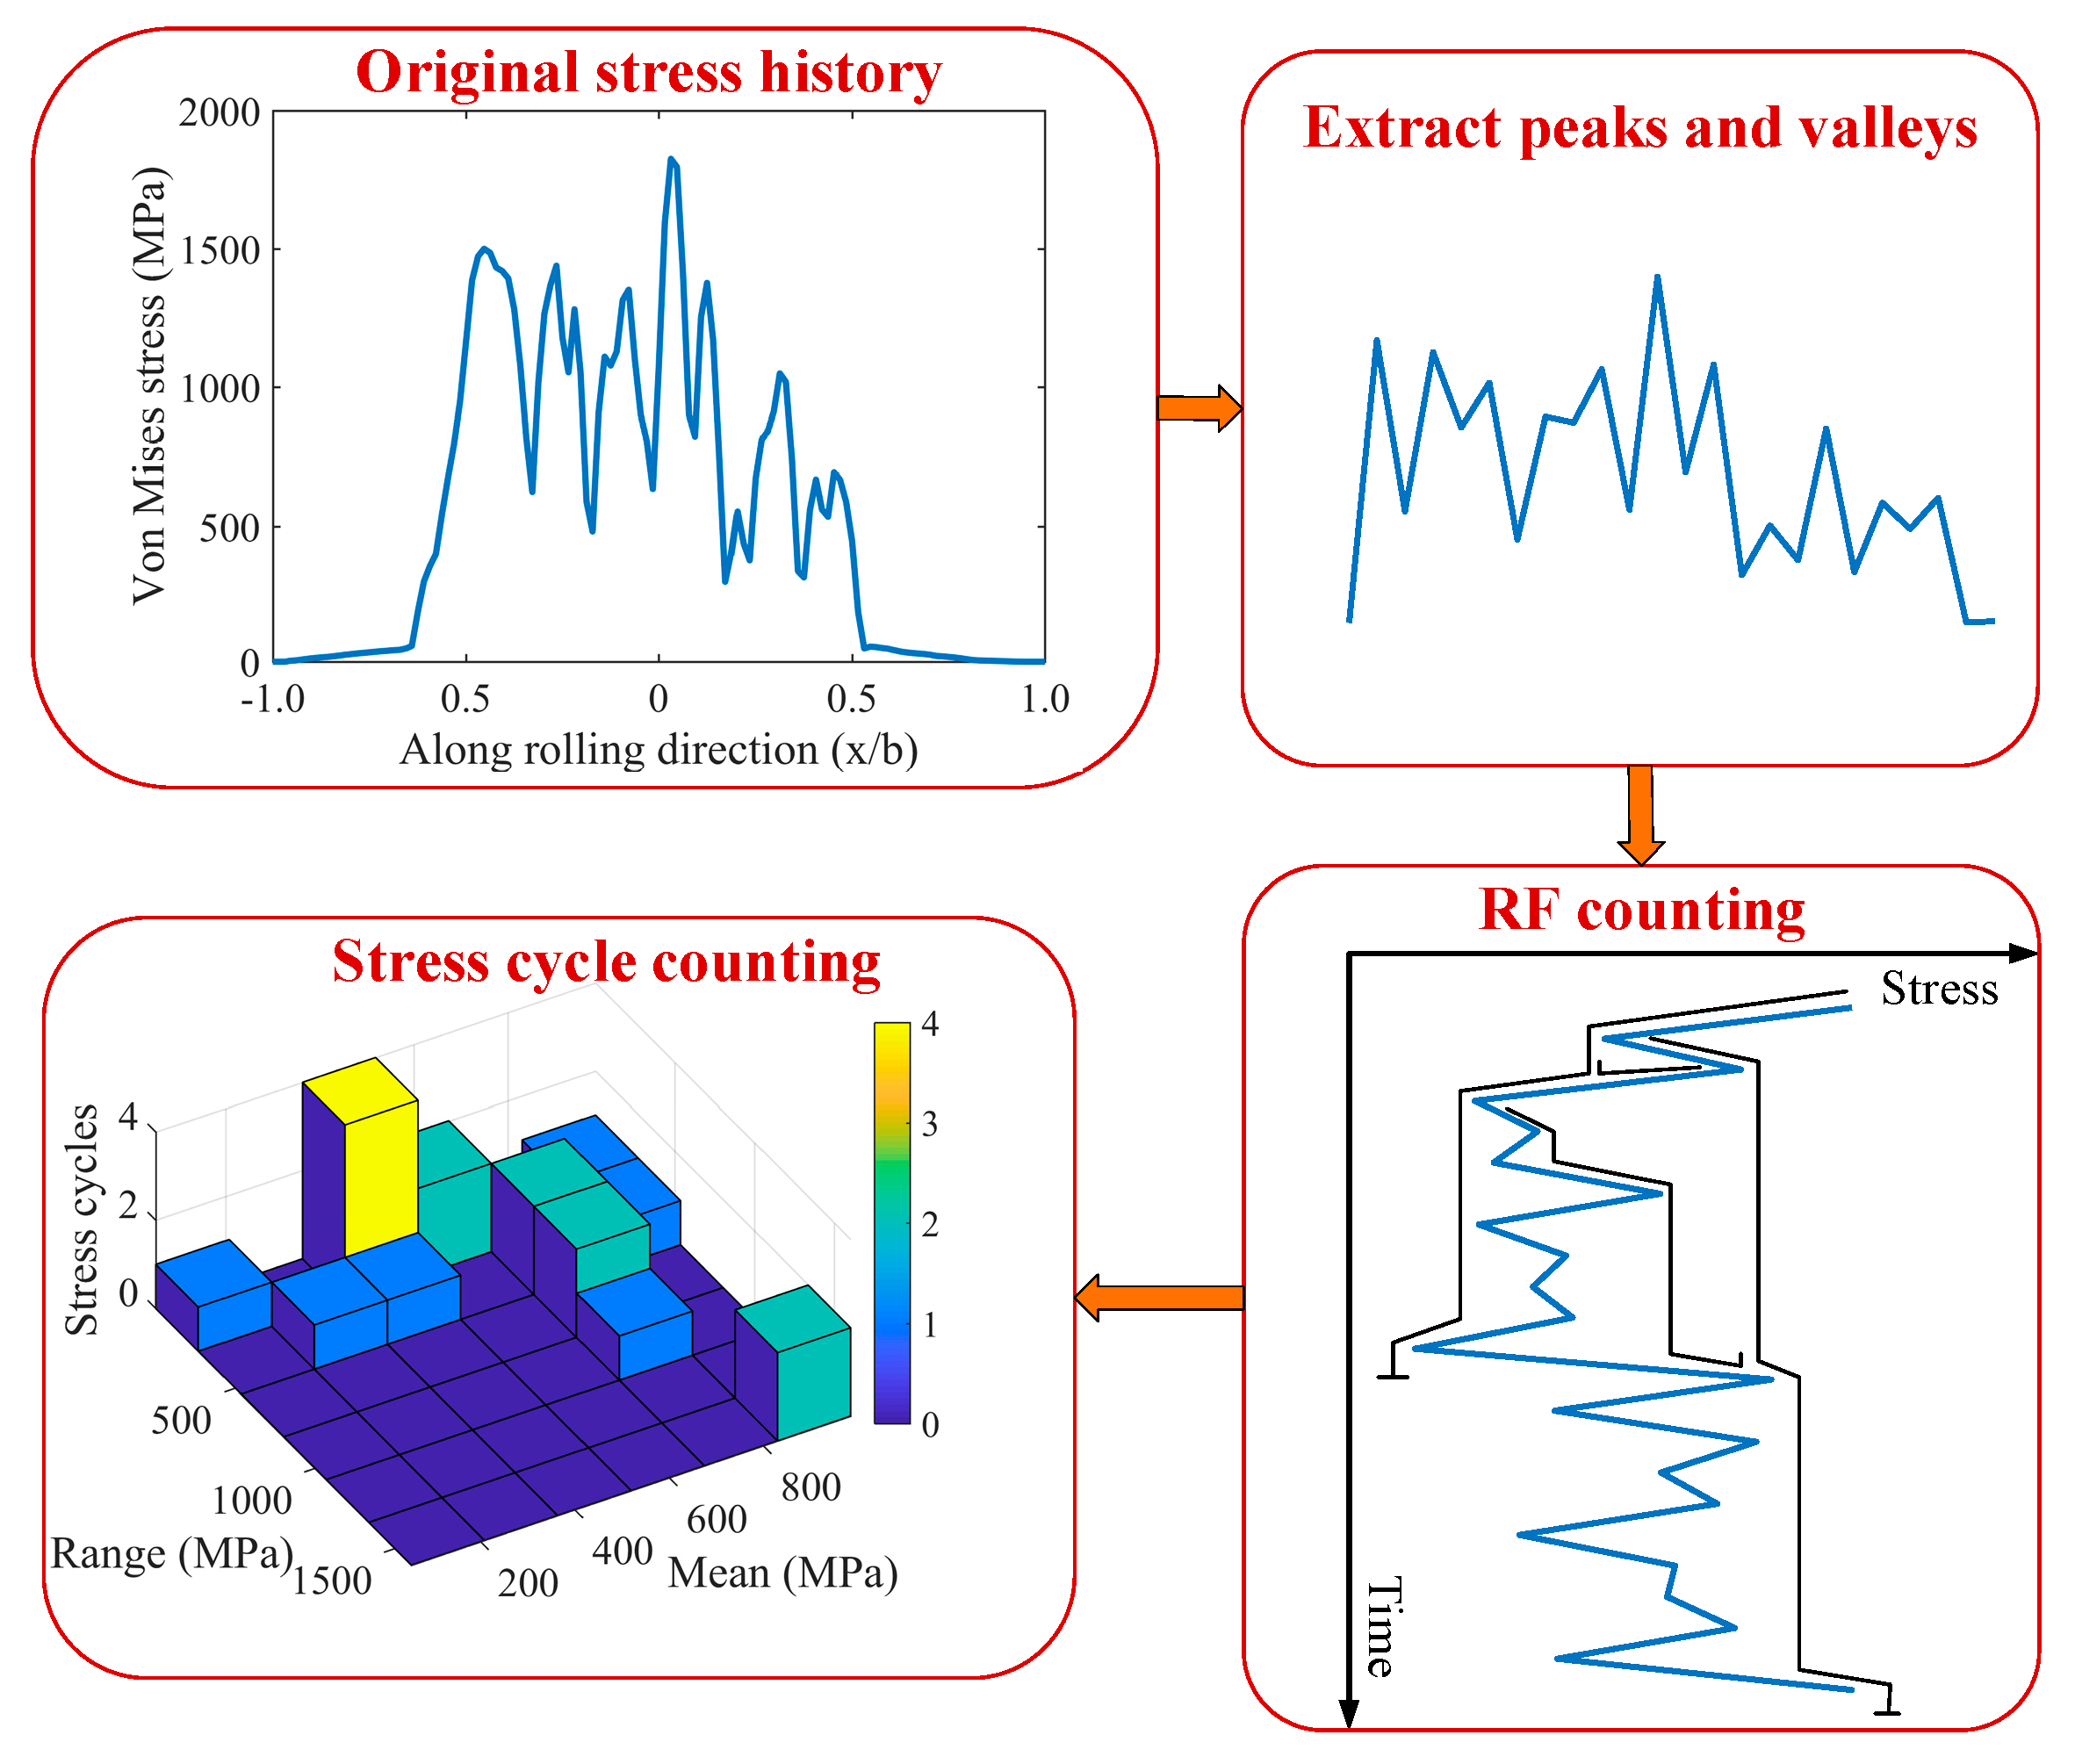
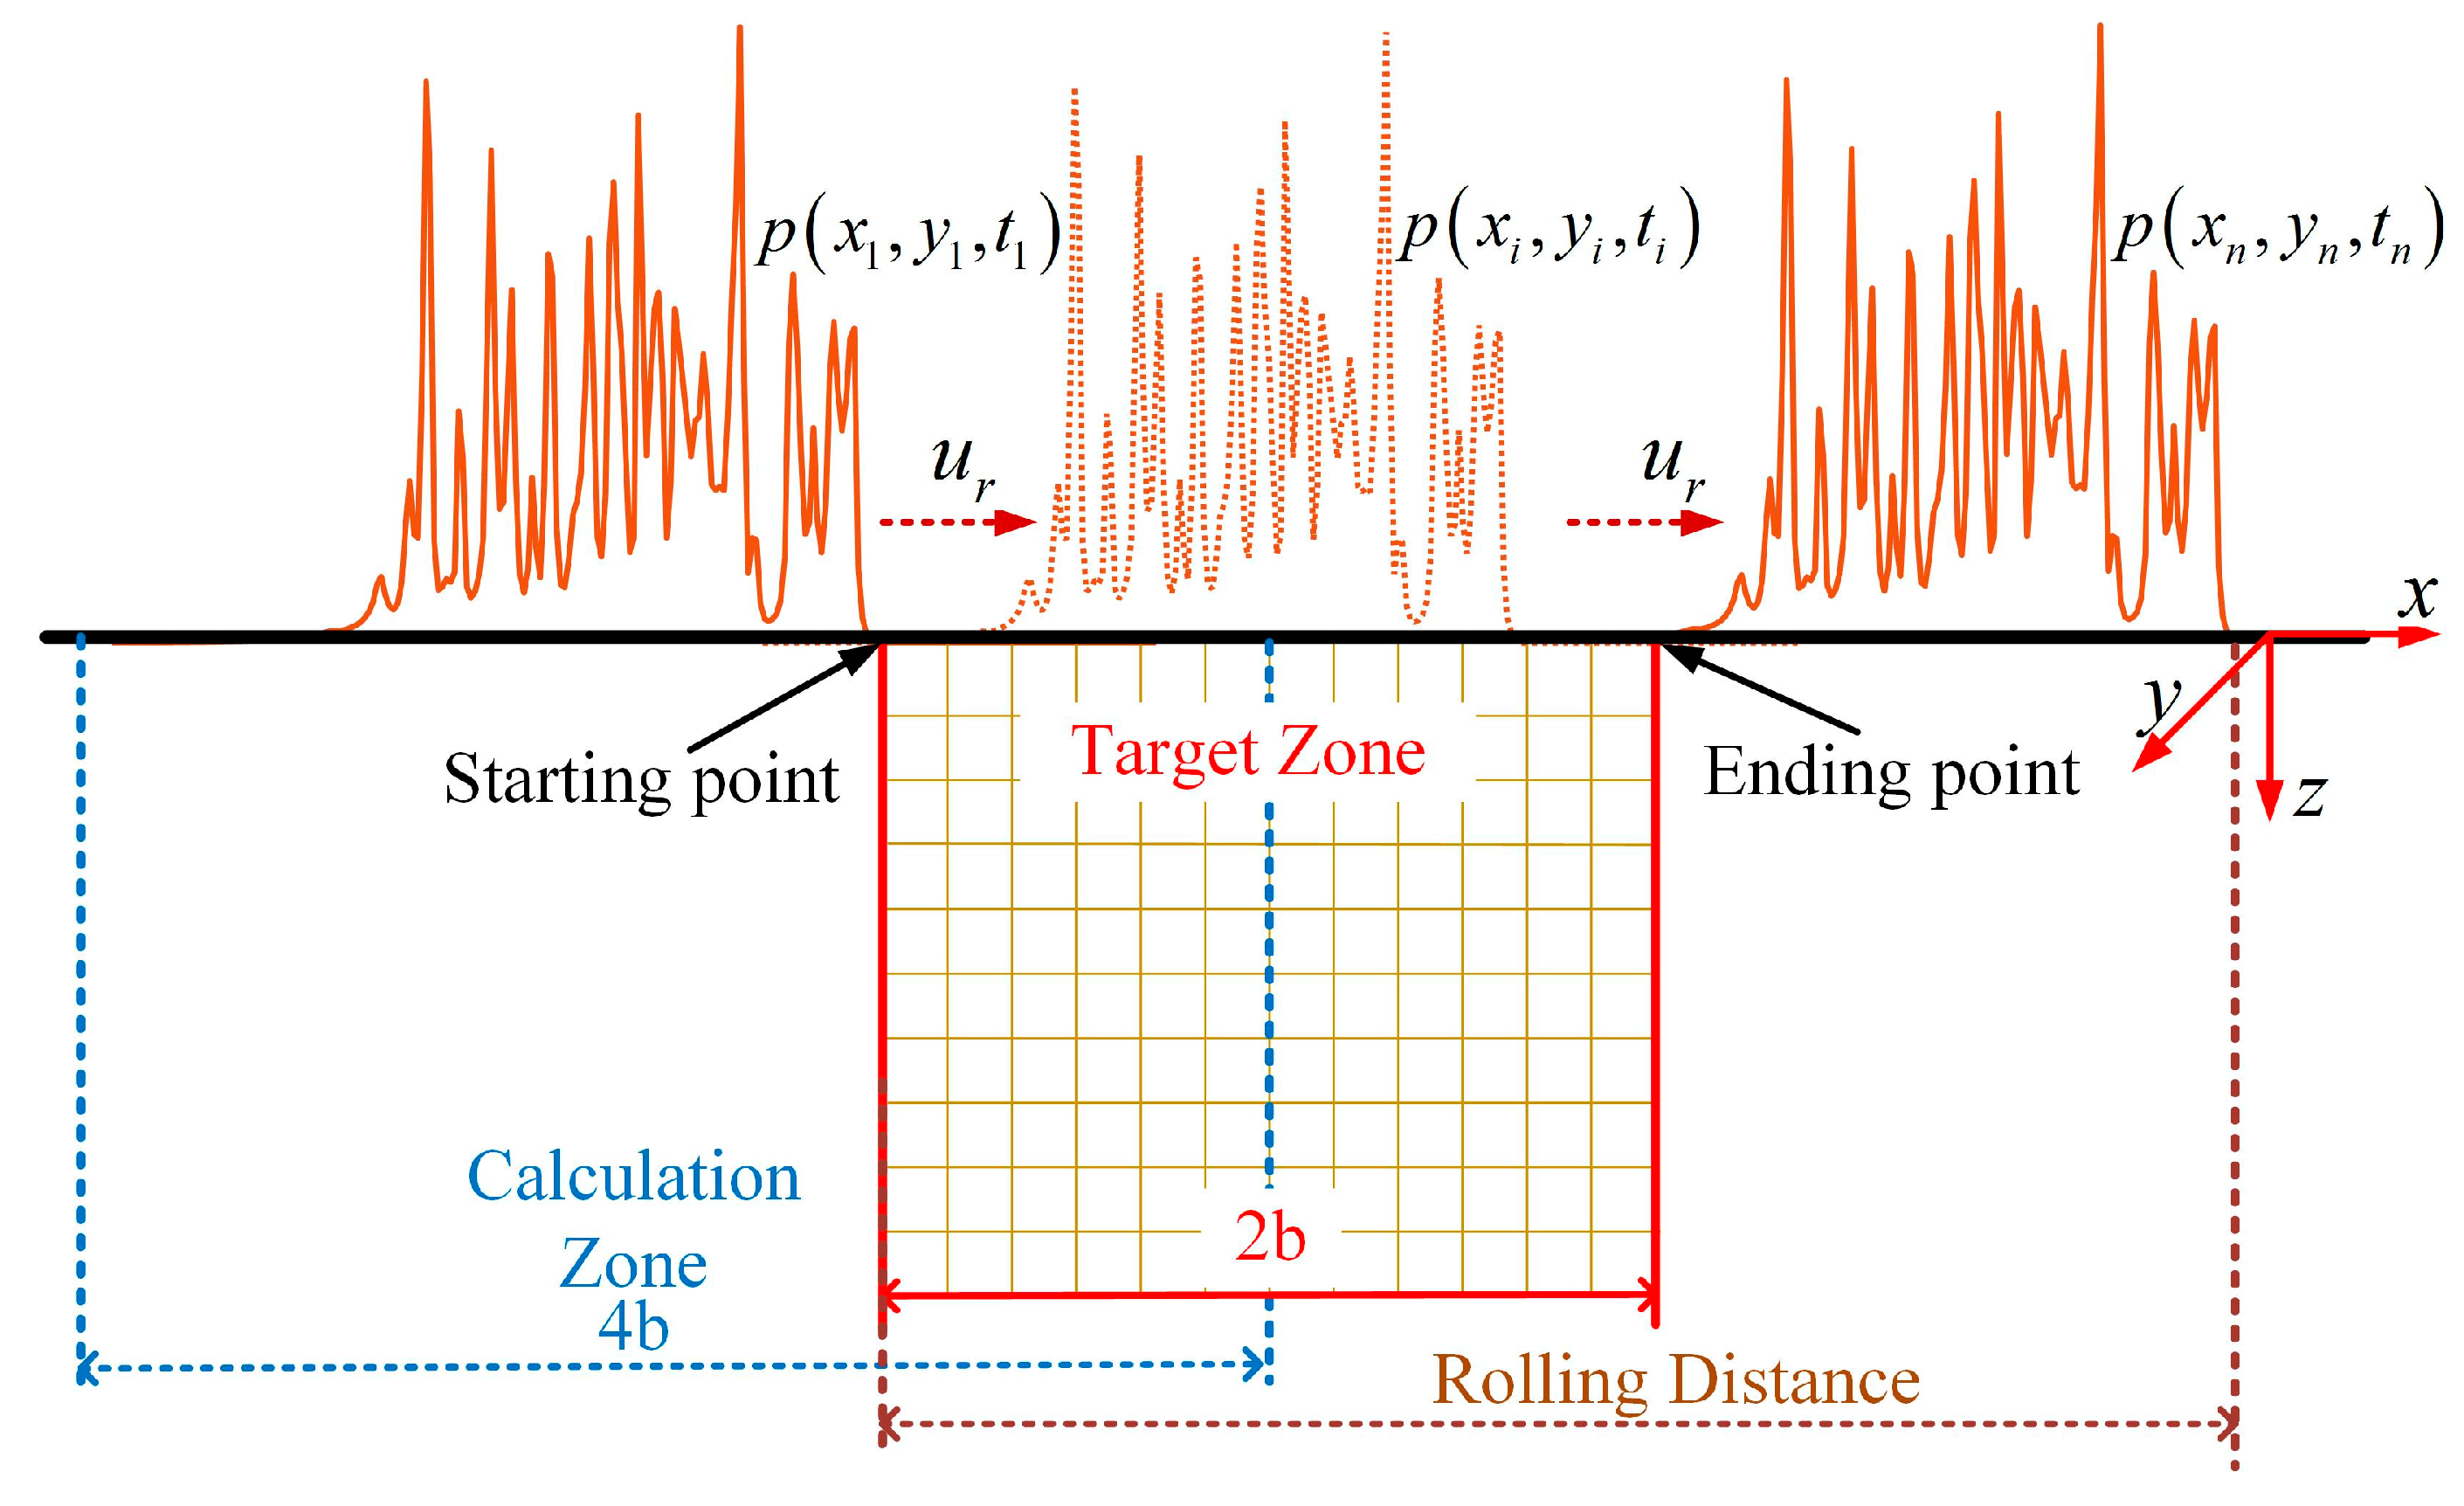
2.2. Stress History and Damage Accumulation Rule
2.3. Wear Model
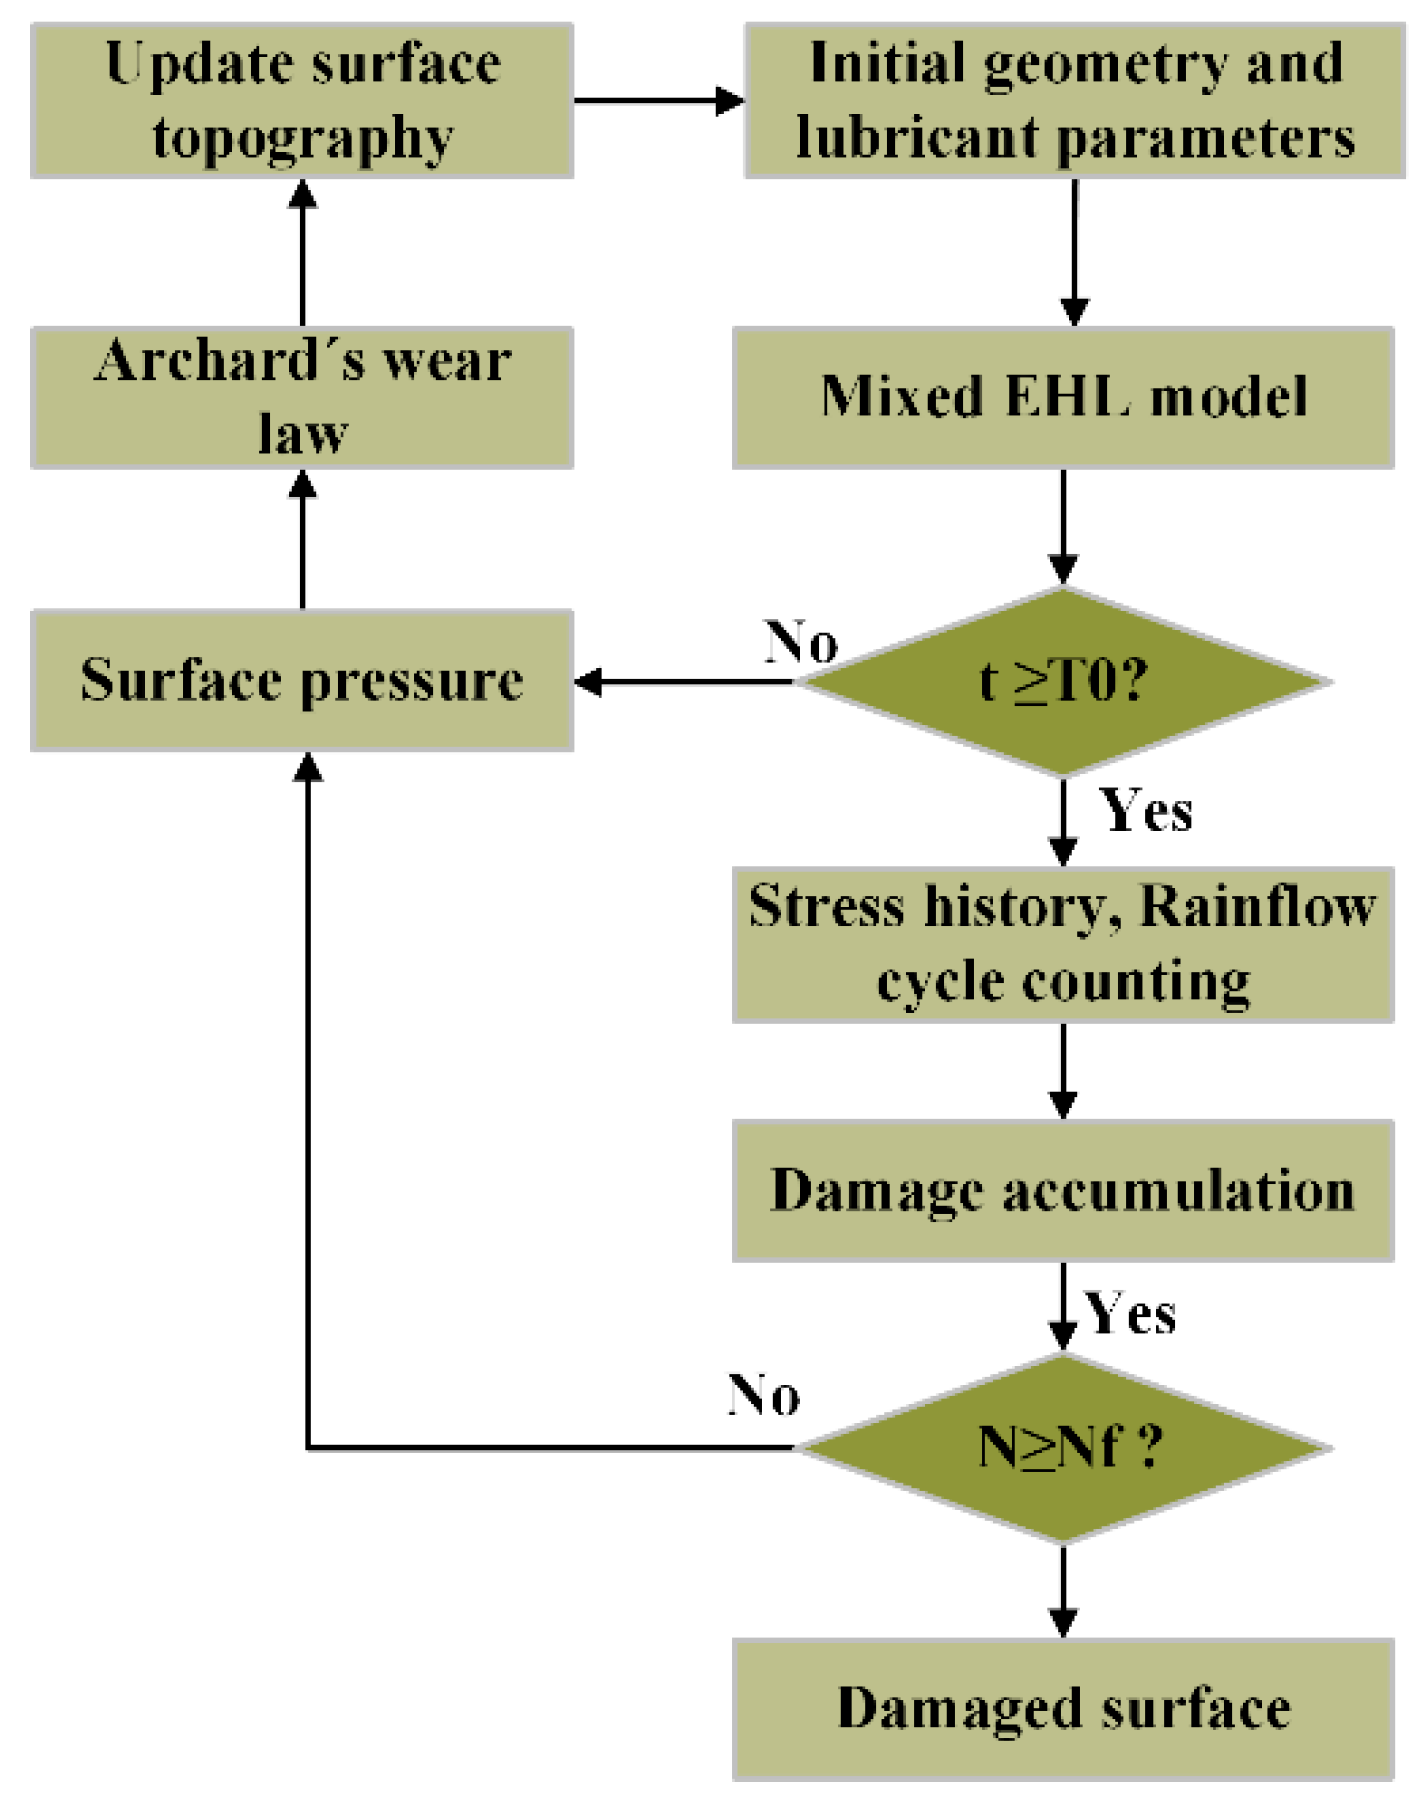
2.4. Numerical Procedure
3. Results and Discussion
3.1. The Effect of Stress Micro-Cycles
3.2. The Effect of Mild Wear
3.3. The Effect of Surface Roughness and Speed
4. Conclusions
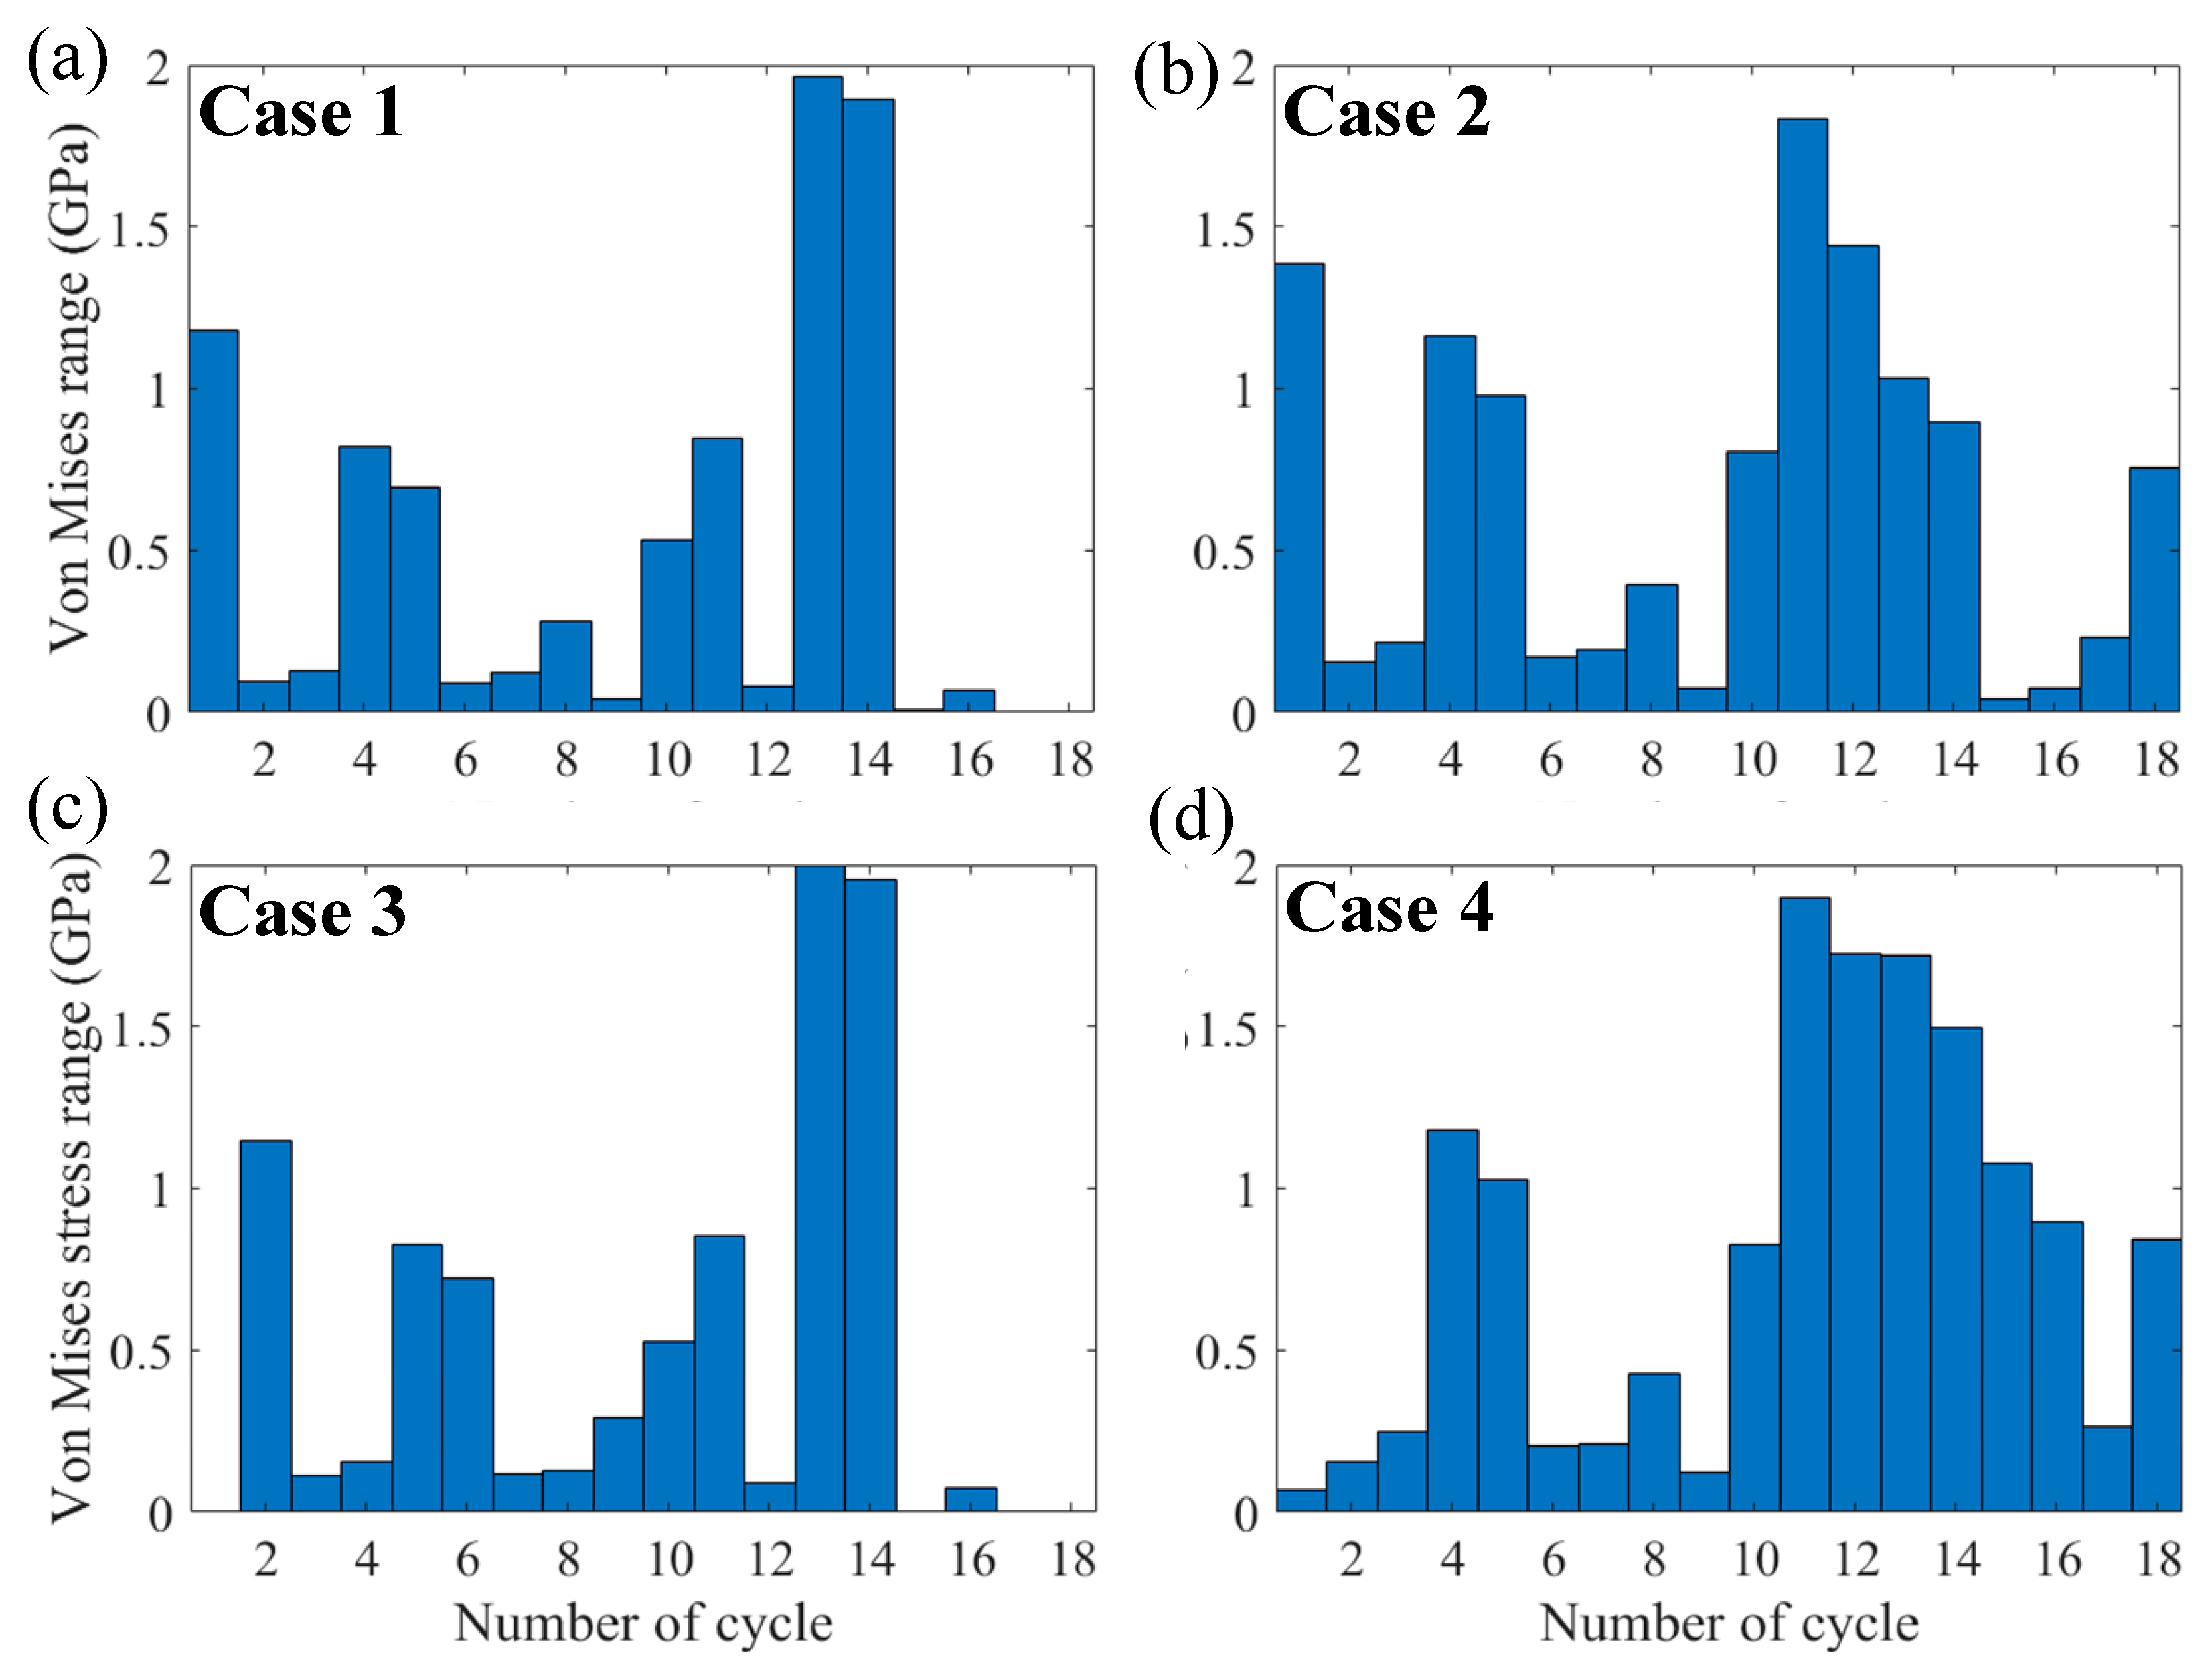
- In rolling–sliding contact, stress micro-cycles are introduced by sliding kinematics and surface roughness. The fluctuations in stress history is caused by the relative motion of surface asperities. More stress cycles and higher equivalent stress amplitude both lead to a higher damage accumulation.
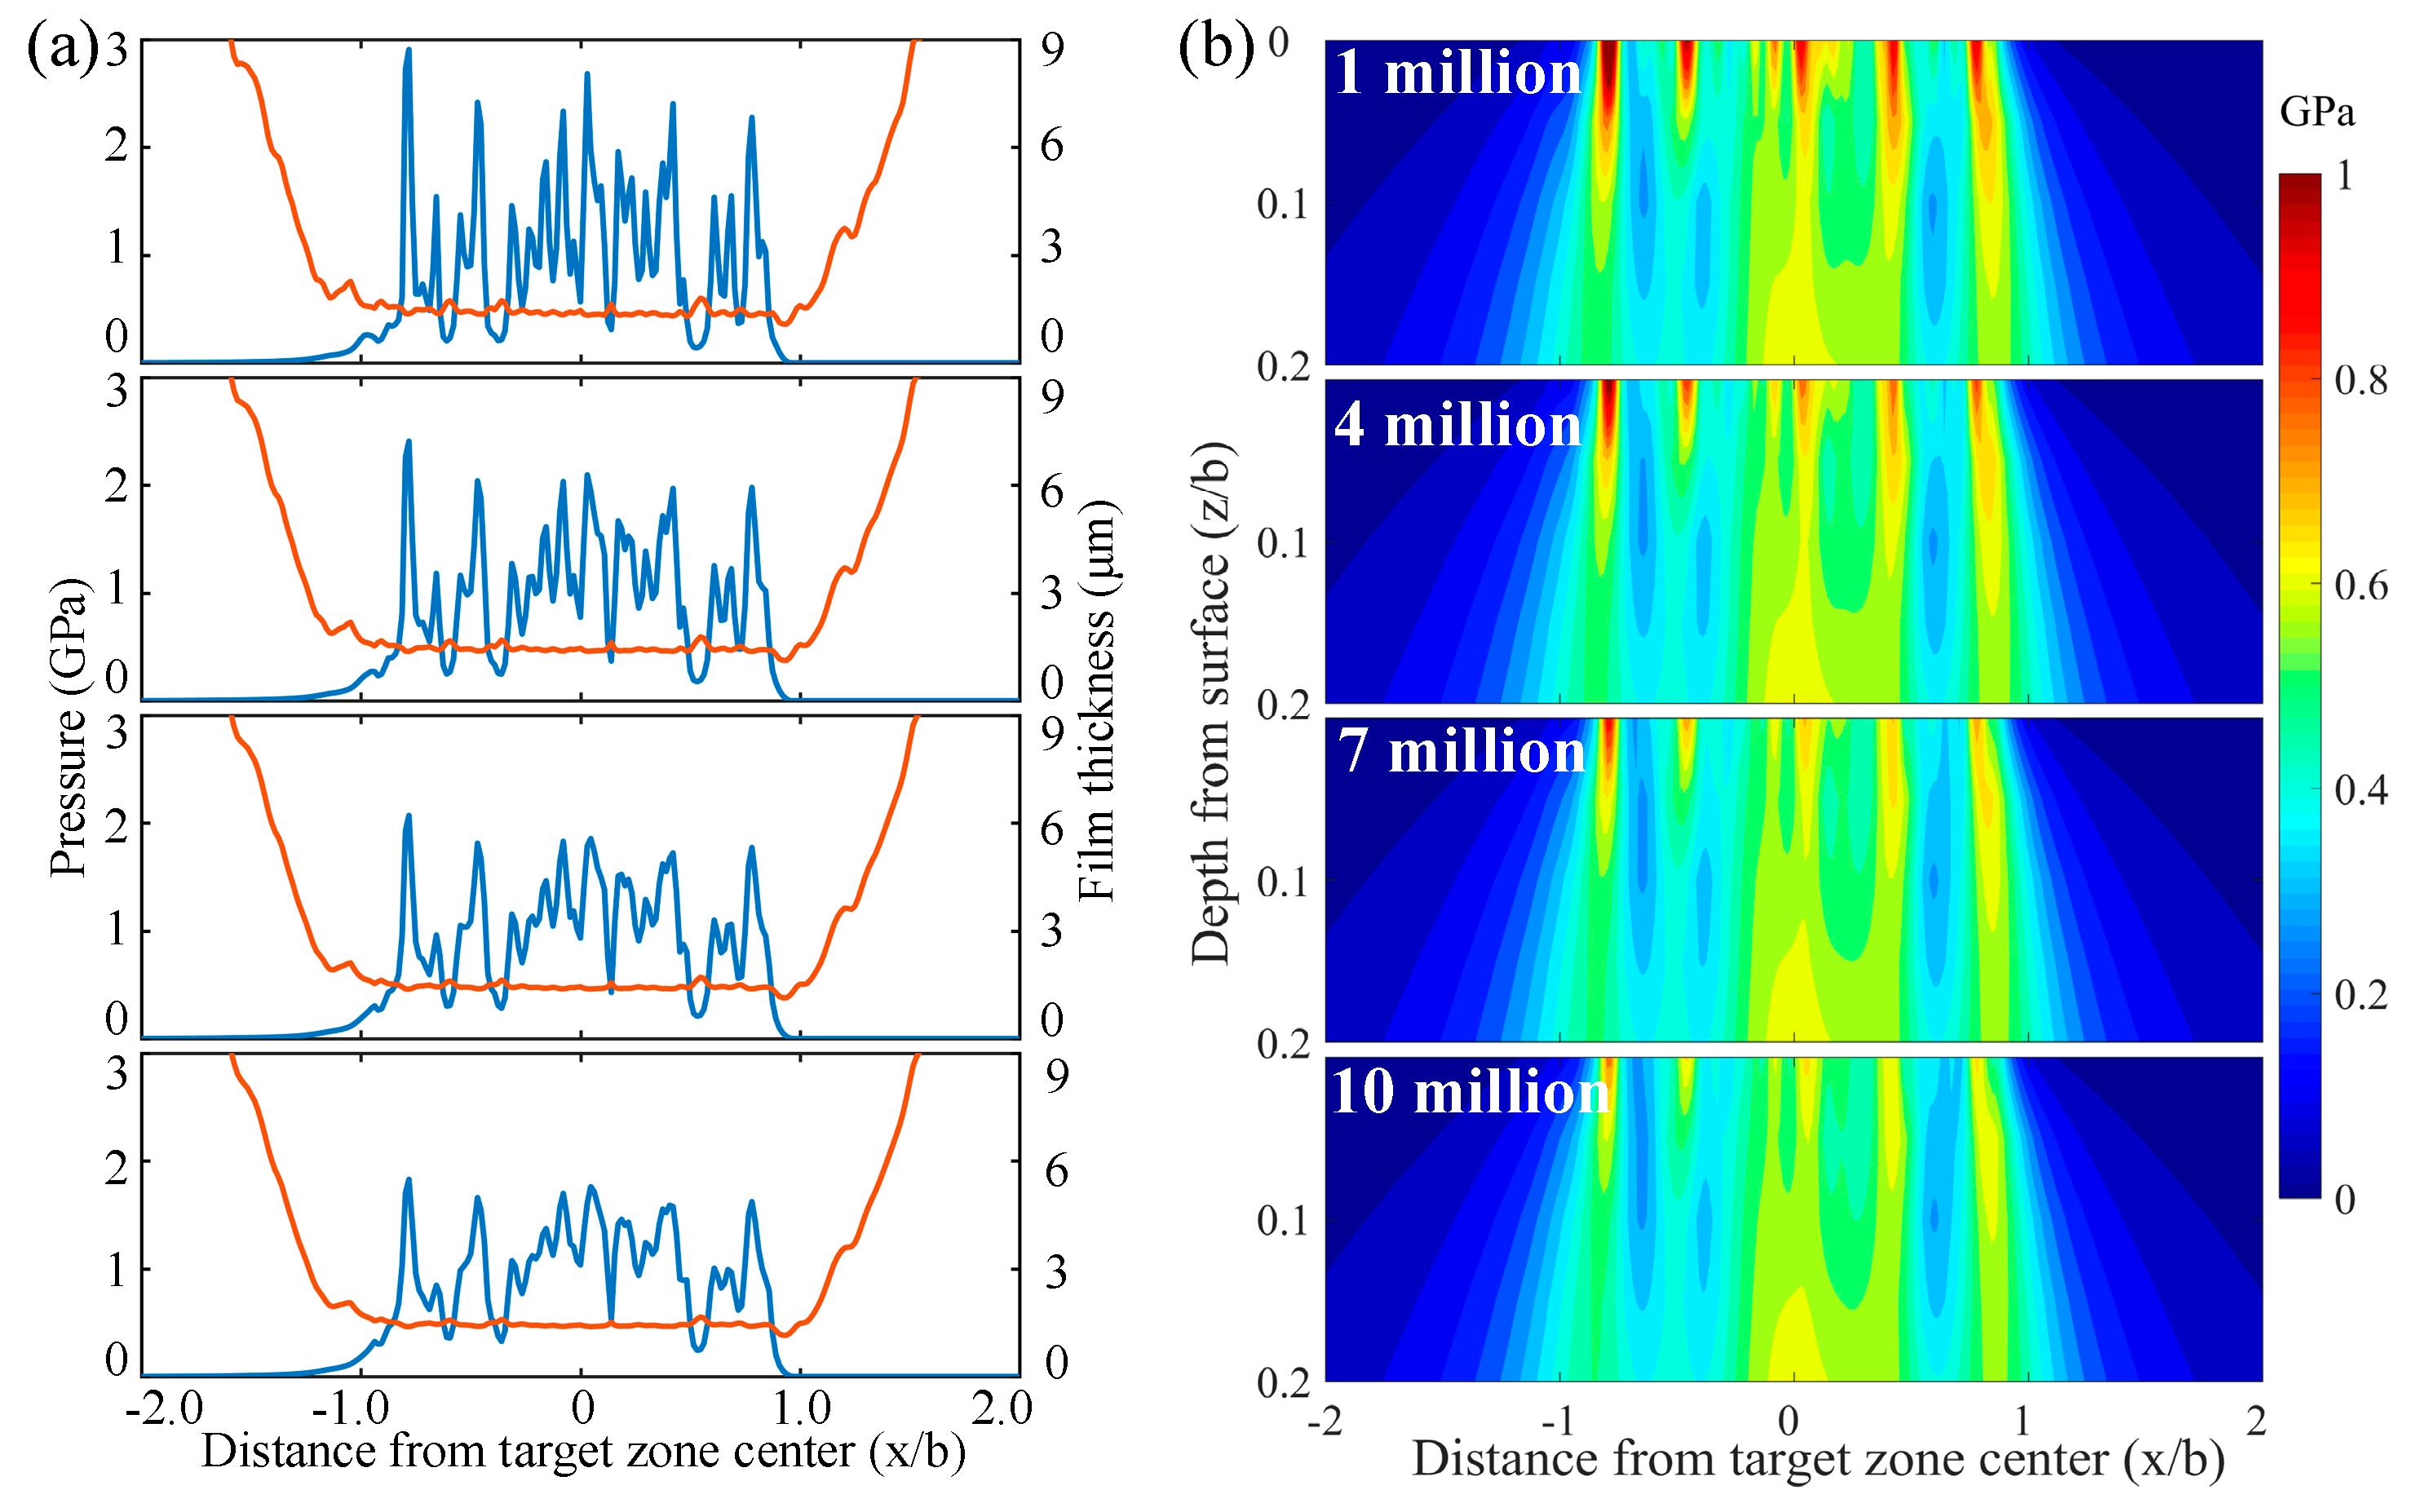
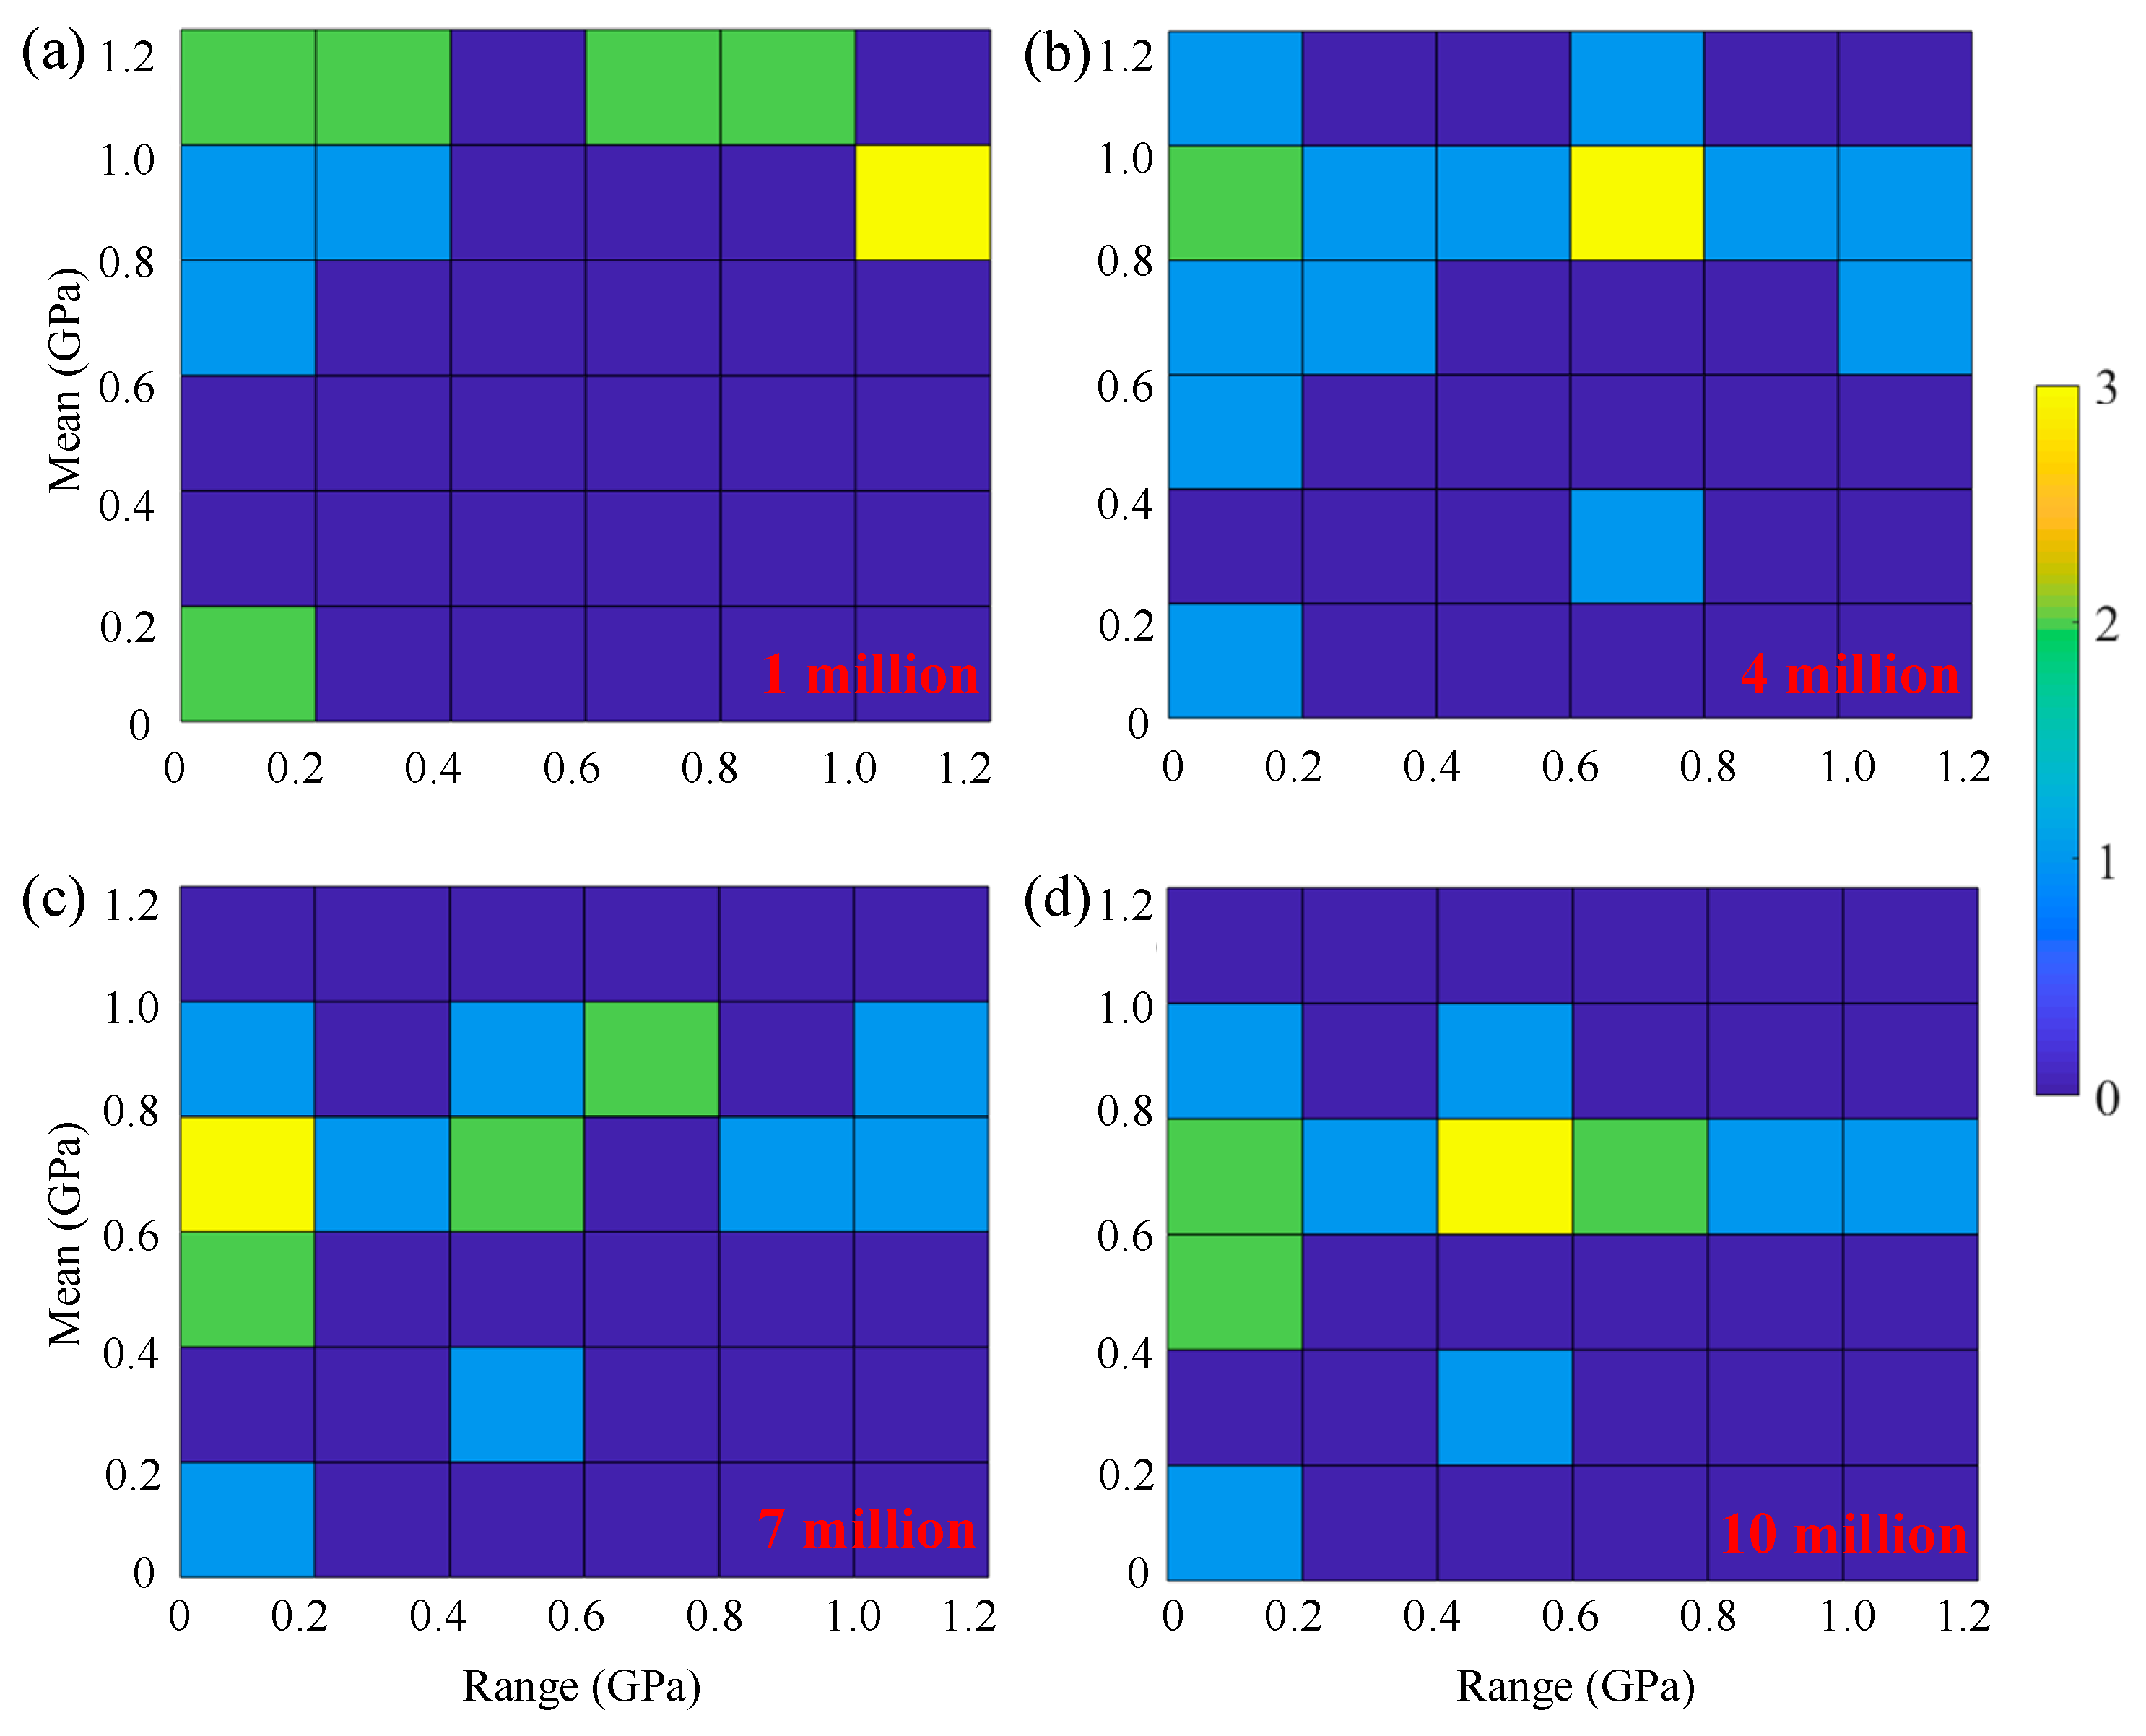
- Surface asperities are smoothed due to the wear process, while the macro waviness of the topography remains. Mild wear reduces the roughness noticeably, and consequently decreases the maximum pressure and alleviates the sub-surface stress concentration. The number of high-stress cycles decreases as the life cycles increase.
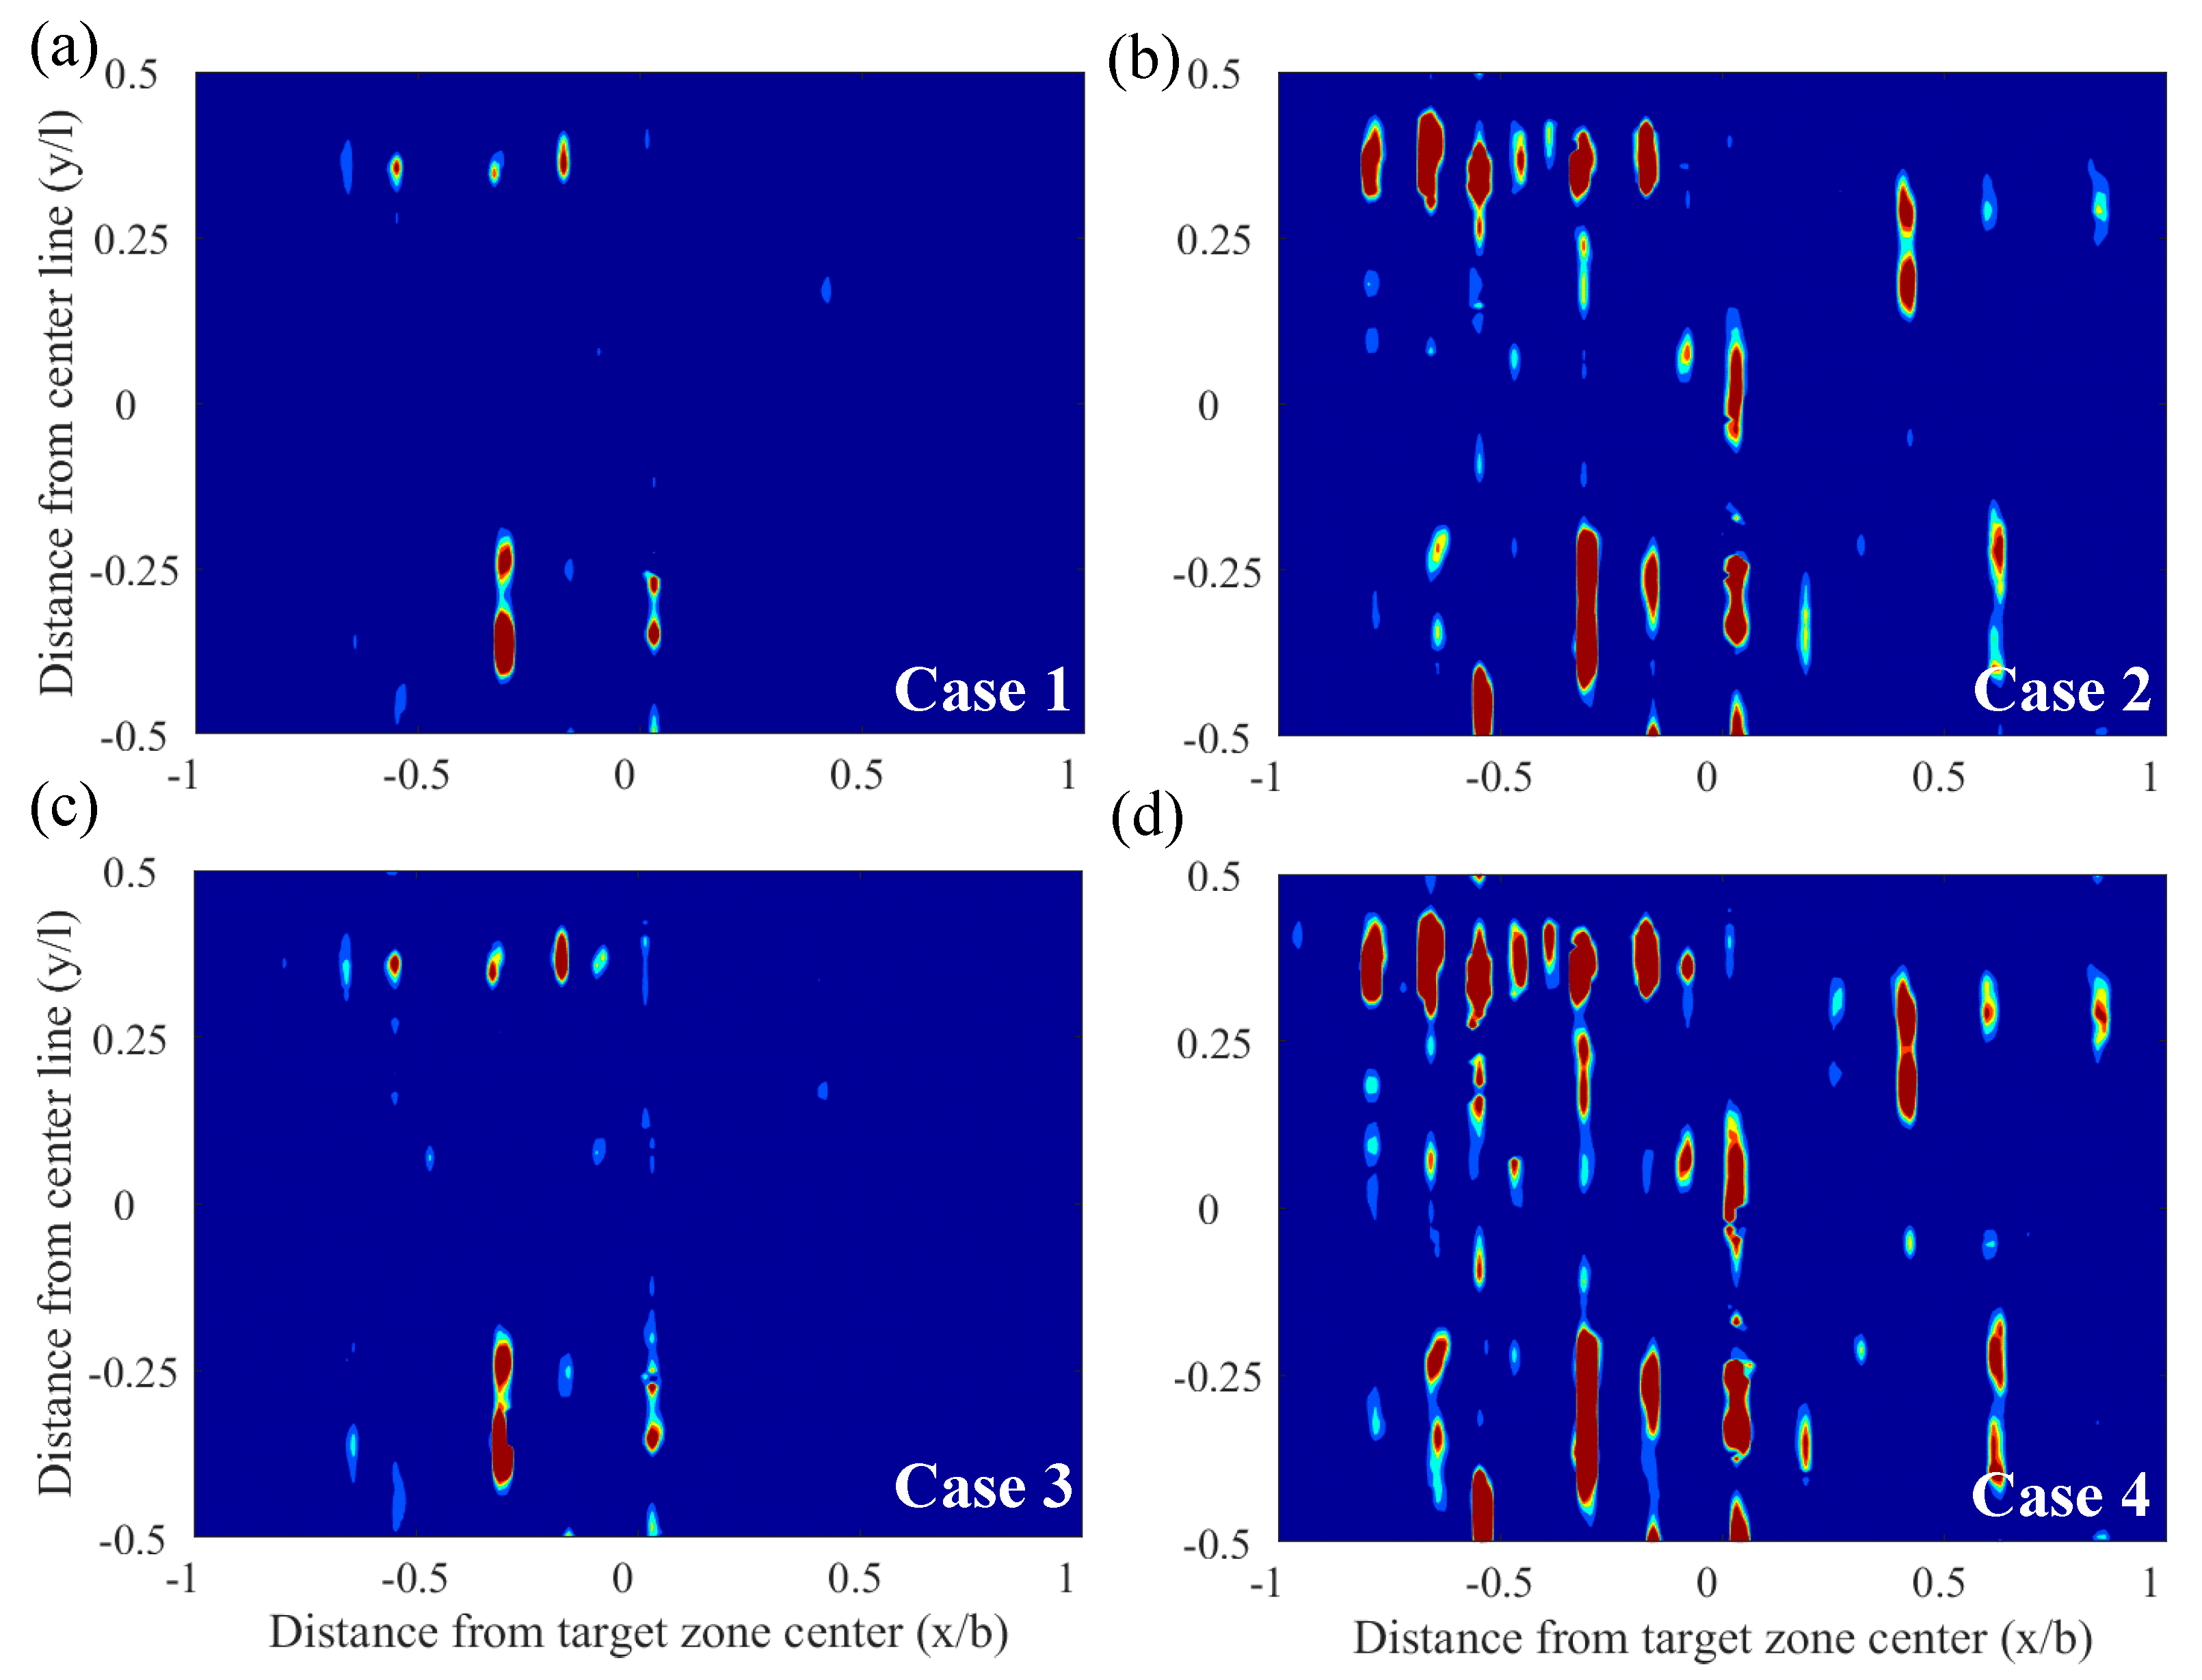
- In rolling–sliding contact, the faster surface dominates the composite height of asperities, then determines the fluctuations of pressure, as well as stress ranges. Under the same composite roughness and rolling speed, the faster and rougher surface may induce more damage on the counter-surface. The service life can be improved by optimizing the combination of surface topography.
- The interaction between initiated micropits and mild wear would be incorporated in the future work. Thus, the further understanding of competition mechanism between surface contact fatigue and mild wear can be explored, by evaluating the rate of micropitting initiation and progression then comparing it with wear rate.
Author Contributions
Funding
Acknowledgments
Conflicts of Interest
References
- Rycerz, P.; Kadiric, A. The Influence of Slide–Roll Ratio on the Extent of Micropitting Damage in Rolling–Sliding Contacts Pertinent to Gear Applications. Tribol. Lett. 2019, 67. [Google Scholar] [CrossRef]
- Kim, T.H.; Olver, A.V. Stress history in Rolling–Sliding contact of rough surfaces. Tribol. Int. 1998, 31, 727–736. [Google Scholar] [CrossRef]
- Liu, H.; Liu, H.; Zhu, C.; Zhou, Y. A review on micropitting studies of steel gears. Coatings 2019, 9, 42. [Google Scholar] [CrossRef]
- Olver, A.V. The Mechanism of Rolling Contact Fatigue: An Update. Proc. Inst. Mech. Eng. Part J J. Eng. Tribol. 2006, 219, 313–330. [Google Scholar] [CrossRef]
- Lainé, E.; Olver, A.V.; Beveridge, T.A. Effect of lubricants on micropitting and wear. Tribol. Int. 2008, 41, 1049–1055. [Google Scholar]
- Morales-Espejel, G.E.; Brizmer, V. Micropitting modelling in Rolling–Sliding contacts: Application to rolling bearings. Tribol. Trans. 2011, 54, 625–643. [Google Scholar] [CrossRef]
- Morales-Espejel, G.E.; Rycerz, P.; Kadiric, A. Prediction of micropitting damage in gear teeth contacts considering the concurrent effects of surface fatigue and mild wear. Wear 2018, 398–399, 99–115. [Google Scholar] [CrossRef]
- Morales-Espejel, G.E.; Brizmer, V.; Piras, E. Roughness evolution in mixed lubrication condition due to mild wear. Proc. Inst. Mech. Eng. Part J J. Eng. Tribol. 2015, 229, 1330–1346. [Google Scholar] [CrossRef]
- Brandão, J.A.; Martins, R.; Seabra, J.H.O.; Castro, M.J.D. An approach to the simulation of concurrent gear micropitting and mild wear. Wear 2015, 324–325, 64–73. [Google Scholar] [CrossRef]
- Zhou, Y.; Zhu, C.; Gould, B.; Demas, N.G.; Liu, H.; Greco, A.C. The effect of contact severity on micropitting: Simulation and experiments. Tribol. Int. 2019, 138, 463–472. [Google Scholar] [CrossRef]
- Ueda, M.; Spikes, H.; Kadiric, A. In-Situ observations of the effect of the ZDDP tribofilm growth on micropitting. Tribol. Int. 2019, 138, 342–352. [Google Scholar] [CrossRef]
- Evans, H.P.; Snidle, R.W.; Sharif, K.J. Deterministic mixed lubrication modelling using roughness measurements in gear applications. Tribol. Int. 2009, 42, 1406–1417. [Google Scholar] [CrossRef]
- Wang, Q.; Liu, S. A Versatile Method of Discrete Convolution and FFT (DC-FFT) for contact analyses. Wear 2000, 243, 101–111. [Google Scholar]
- Zhu, D.; Wang, Q.J. Elastohydrodynamic lubrication: A gateway to interfacial mechanics—Review and prospect. J. Tribol. 2011, 133, 041001. [Google Scholar] [CrossRef]
- Zhu, D.; Ren, N.; Wang, Q.J. Pitting Life Prediction Based on a 3D Line Contact Mixed EHL Analysis and Subsurface von Mises Stress Calculation. J. Tribol. 2009, 131, 041501. [Google Scholar] [CrossRef]
- Zhou, Y.; Zhu, C.; Liu, H.; Song, C.; Li, Z. A numerical study on the contact fatigue life of a coated gear pair under EHL. Ind. Lubr. Tribol. 2018, 70, 23–32. [Google Scholar] [CrossRef]
- Liu, H.; Liu, H.; Zhu, C.; Sun, Z.; Bai, H. Study on contact fatigue of a wind turbine gear pair considering surface roughness. Friction 2019. [Google Scholar] [CrossRef]
- Li, S.; Kahraman, A. A Micro-Pitting model for spur gear contacts. Int. J. Fatigue 2014, 59, 224–233. [Google Scholar] [CrossRef]
- Sharif, K.J.; Evans, H.P.; Snidle, R.W. Modelling of elastohydrodynamic lubrication and fatigue of rough surfaces: The effect of lambda ratio. Proc. Inst. Mech. Eng. Part J: J. Eng. Tribol. 2012, 226, 1039–1050. [Google Scholar] [CrossRef]
- Pu, W.; Zhu, D.; Wang, J.; Wang, Q.J. Rolling–Sliding contact fatigue of surfaces with sinusoidal roughness. Int. J. Fatigue 2016, 90, 57–68. [Google Scholar] [CrossRef]
- Zhou, Y.; Zhu, C.; Liu, H.; Song, H. Investigation of Contact Performance of a Case-hardened Gears under Plasto-Elastohydrodynamic Lubrication. Tribol. Lett. 2019, 138, 463–472. [Google Scholar] [CrossRef]
- Gu, Z.; Zhu, C.; Liu, H.; Du, X. A comparative study of tribological performance of helical gear pair with various types of tooth surface finishing. Ind. Lubr. Tribol. 2019, 71, 474–485. [Google Scholar] [CrossRef]
- Yang, P.; Wen, S. A Generalized Reynolds Equation for Non-Newtonian Thermal Elastohydrodynamic Lubrication. J. Tribol. 1990, 112, 631–636. [Google Scholar]
- Dowson, D.; Higginson, G.; Whitaker, A. Elasto-Hydrodynamic lubrication: A survey of isothermal solutions. J. Mech. Eng. Sci. 1962, 4, 121–126. [Google Scholar] [CrossRef]
- Roelands, C.; Vlugter, J.; Waterman, H. The Viscosity-Temperature-Pressure relationship of lubricating oils and its correlation with chemical constitution. J. Basic Eng. 1963, 85, 601–607. [Google Scholar] [CrossRef]
- Liu, S.; Wang, Q. Studying Contact Stress Fields Caused by Surface Tractions with a Discrete Convolution and Fast Fourier Transform Algorithm. J. Tribol. 2002, 124, 36. [Google Scholar] [CrossRef]
- Johnson, K.L. Contact mechanics; Cambridge university press: Cambridge, UK, 1987. [Google Scholar]
- Langlais, T.; Vogel, J.; Chase, T. Multiaxial cycle counting for critical plane methods. Int. J. Fatigue 2003, 25, 641–647. [Google Scholar] [CrossRef]
- Rychlik, I. A new definition of the rainflow cycle counting method. Int. J. Fatigue 1987, 9, 119–121. [Google Scholar] [CrossRef]
- Standard, A. E1049-85. Standard Practices for Cycle Counting in Fatigue Analysis; ASTM: West Conshohocken, PA, USA, 2011. [Google Scholar]
- Sutherland, H.J. On the Fatigue Analysis of Wind Turbines; Sandia National Labs.: Albuquerque, NM, USA, 1999. [Google Scholar]
- Wei, P.; Zhou, H.; Liu, H.; Zhu, C.; Wang, W.; Deng, G. Modeling of contact fatigue damage behavior of a wind turbine carburized gear considering its mechanical properties and microstructure gradients. Int. J. Mech. Sci. 2019, 156, 283–296. [Google Scholar] [CrossRef]
- Boller, C.; Seeger, T. Materials Data for Cyclic Loading: Low-Alloy Steels; Elsevier: Amsterdam, The Netherlands, 2013. [Google Scholar]
- Archard, J. Contact and rubbing of flat surfaces. J. Appl. Phys. 1953, 24, 981–988. [Google Scholar] [CrossRef]
- Liu, H.; Mao, K.; Zhu, C.; Xu, X. Mixed lubricated line contact analysis for spur gears using a deterministic model. J. Tribol. 2012, 134, 021501. [Google Scholar] [CrossRef]
- Li, S.; Kahraman, A.; Klein, M. A fatigue model for spur gear contacts operating under mixed elastohydrodynamic lubrication conditions. J. Mech. Des. 2012, 134, 041007. [Google Scholar] [CrossRef]
- Roy, S.; White, D.; Sundararajan, S. Correlation between evolution of surface roughness parameters and micropitting of carburized steel under boundary lubrication condition. Surf. Coat. Technol. 2018, 350, 445–452. [Google Scholar] [CrossRef]


| Parameters | Values |
|---|---|
| Number of teeth | |
| Normal module | |
| Face width | |
| Pressure Angle | |
| Poisson’s ratio | |
| Elastic modules | |
| Gear shifting coefficients | |
| Rated input torque | |
| Input speed | |
| Ambient density | |
| Ambient dynamic viscosity | |
| Viscosity-pressure coefficient | |
| Kinematic viscosity at 40 °C | |
| Kinematic viscosity at 100 °C |
| Case # | Surface 1 Ra | Surface 2 * Ra | Damage Area Ratio | |
|---|---|---|---|---|
| 1 | 3.0 | 0.26% | ||
| 2 | 3.0 | 1.88% | ||
| 3 | 1.5 | 0.32% | ||
| 4 | 1.5 | 3.05% |
© 2019 by the authors. Licensee MDPI, Basel, Switzerland. This article is an open access article distributed under the terms and conditions of the Creative Commons Attribution (CC BY) license (http://creativecommons.org/licenses/by/4.0/).
Share and Cite
Zhou, Y.; Zhu, C.; Liu, H. A Micropitting Study Considering Rough Sliding and Mild Wear. Coatings 2019, 9, 639. https://doi.org/10.3390/coatings9100639
Zhou Y, Zhu C, Liu H. A Micropitting Study Considering Rough Sliding and Mild Wear. Coatings. 2019; 9(10):639. https://doi.org/10.3390/coatings9100639
Chicago/Turabian StyleZhou, Ye, Caichao Zhu, and Huaiju Liu. 2019. "A Micropitting Study Considering Rough Sliding and Mild Wear" Coatings 9, no. 10: 639. https://doi.org/10.3390/coatings9100639
APA StyleZhou, Y., Zhu, C., & Liu, H. (2019). A Micropitting Study Considering Rough Sliding and Mild Wear. Coatings, 9(10), 639. https://doi.org/10.3390/coatings9100639