3.1. Microstructural Characterization
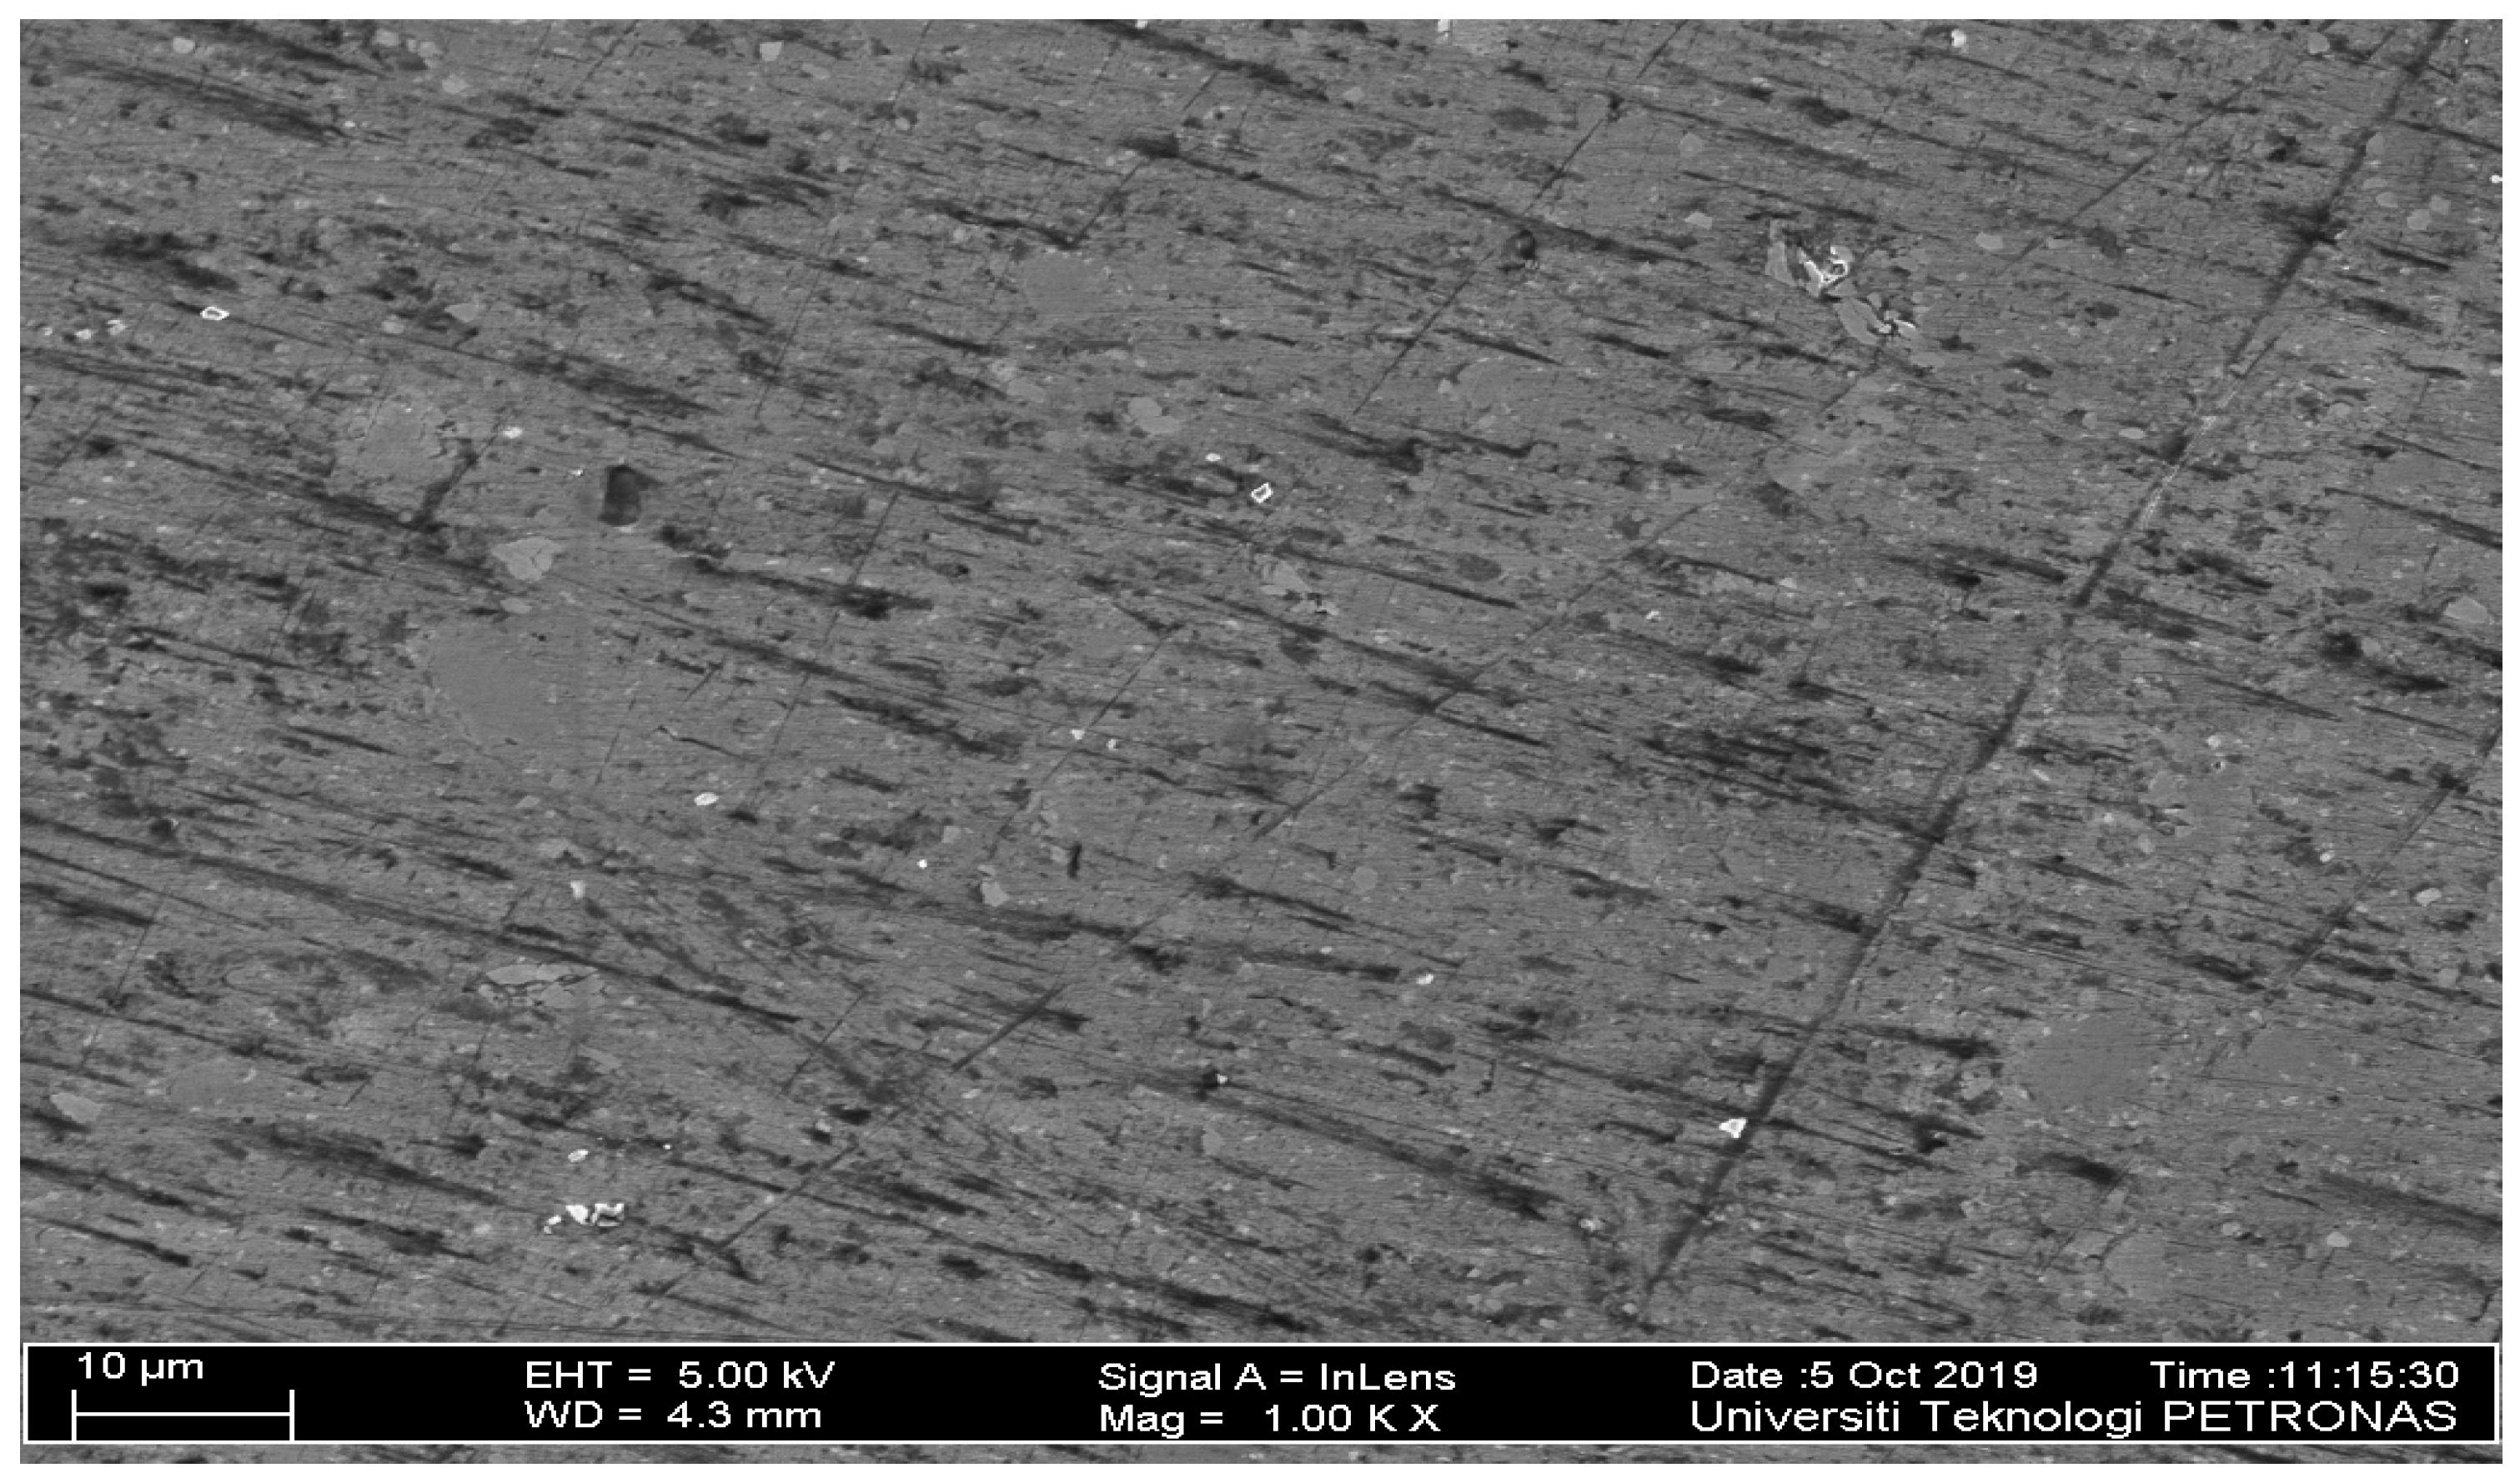
In this study for microstructure analysis, the surface composites with highest (Run 24) and lowest (Run 10) wear rate (mg/m) have been cut and analysed.
Figure 2 and
Figure 3 show FESEM micrographs containing distribution of SiC and Gr particles into the Al 7075 matrix for Run 10 and Run 24 composite stir zones.
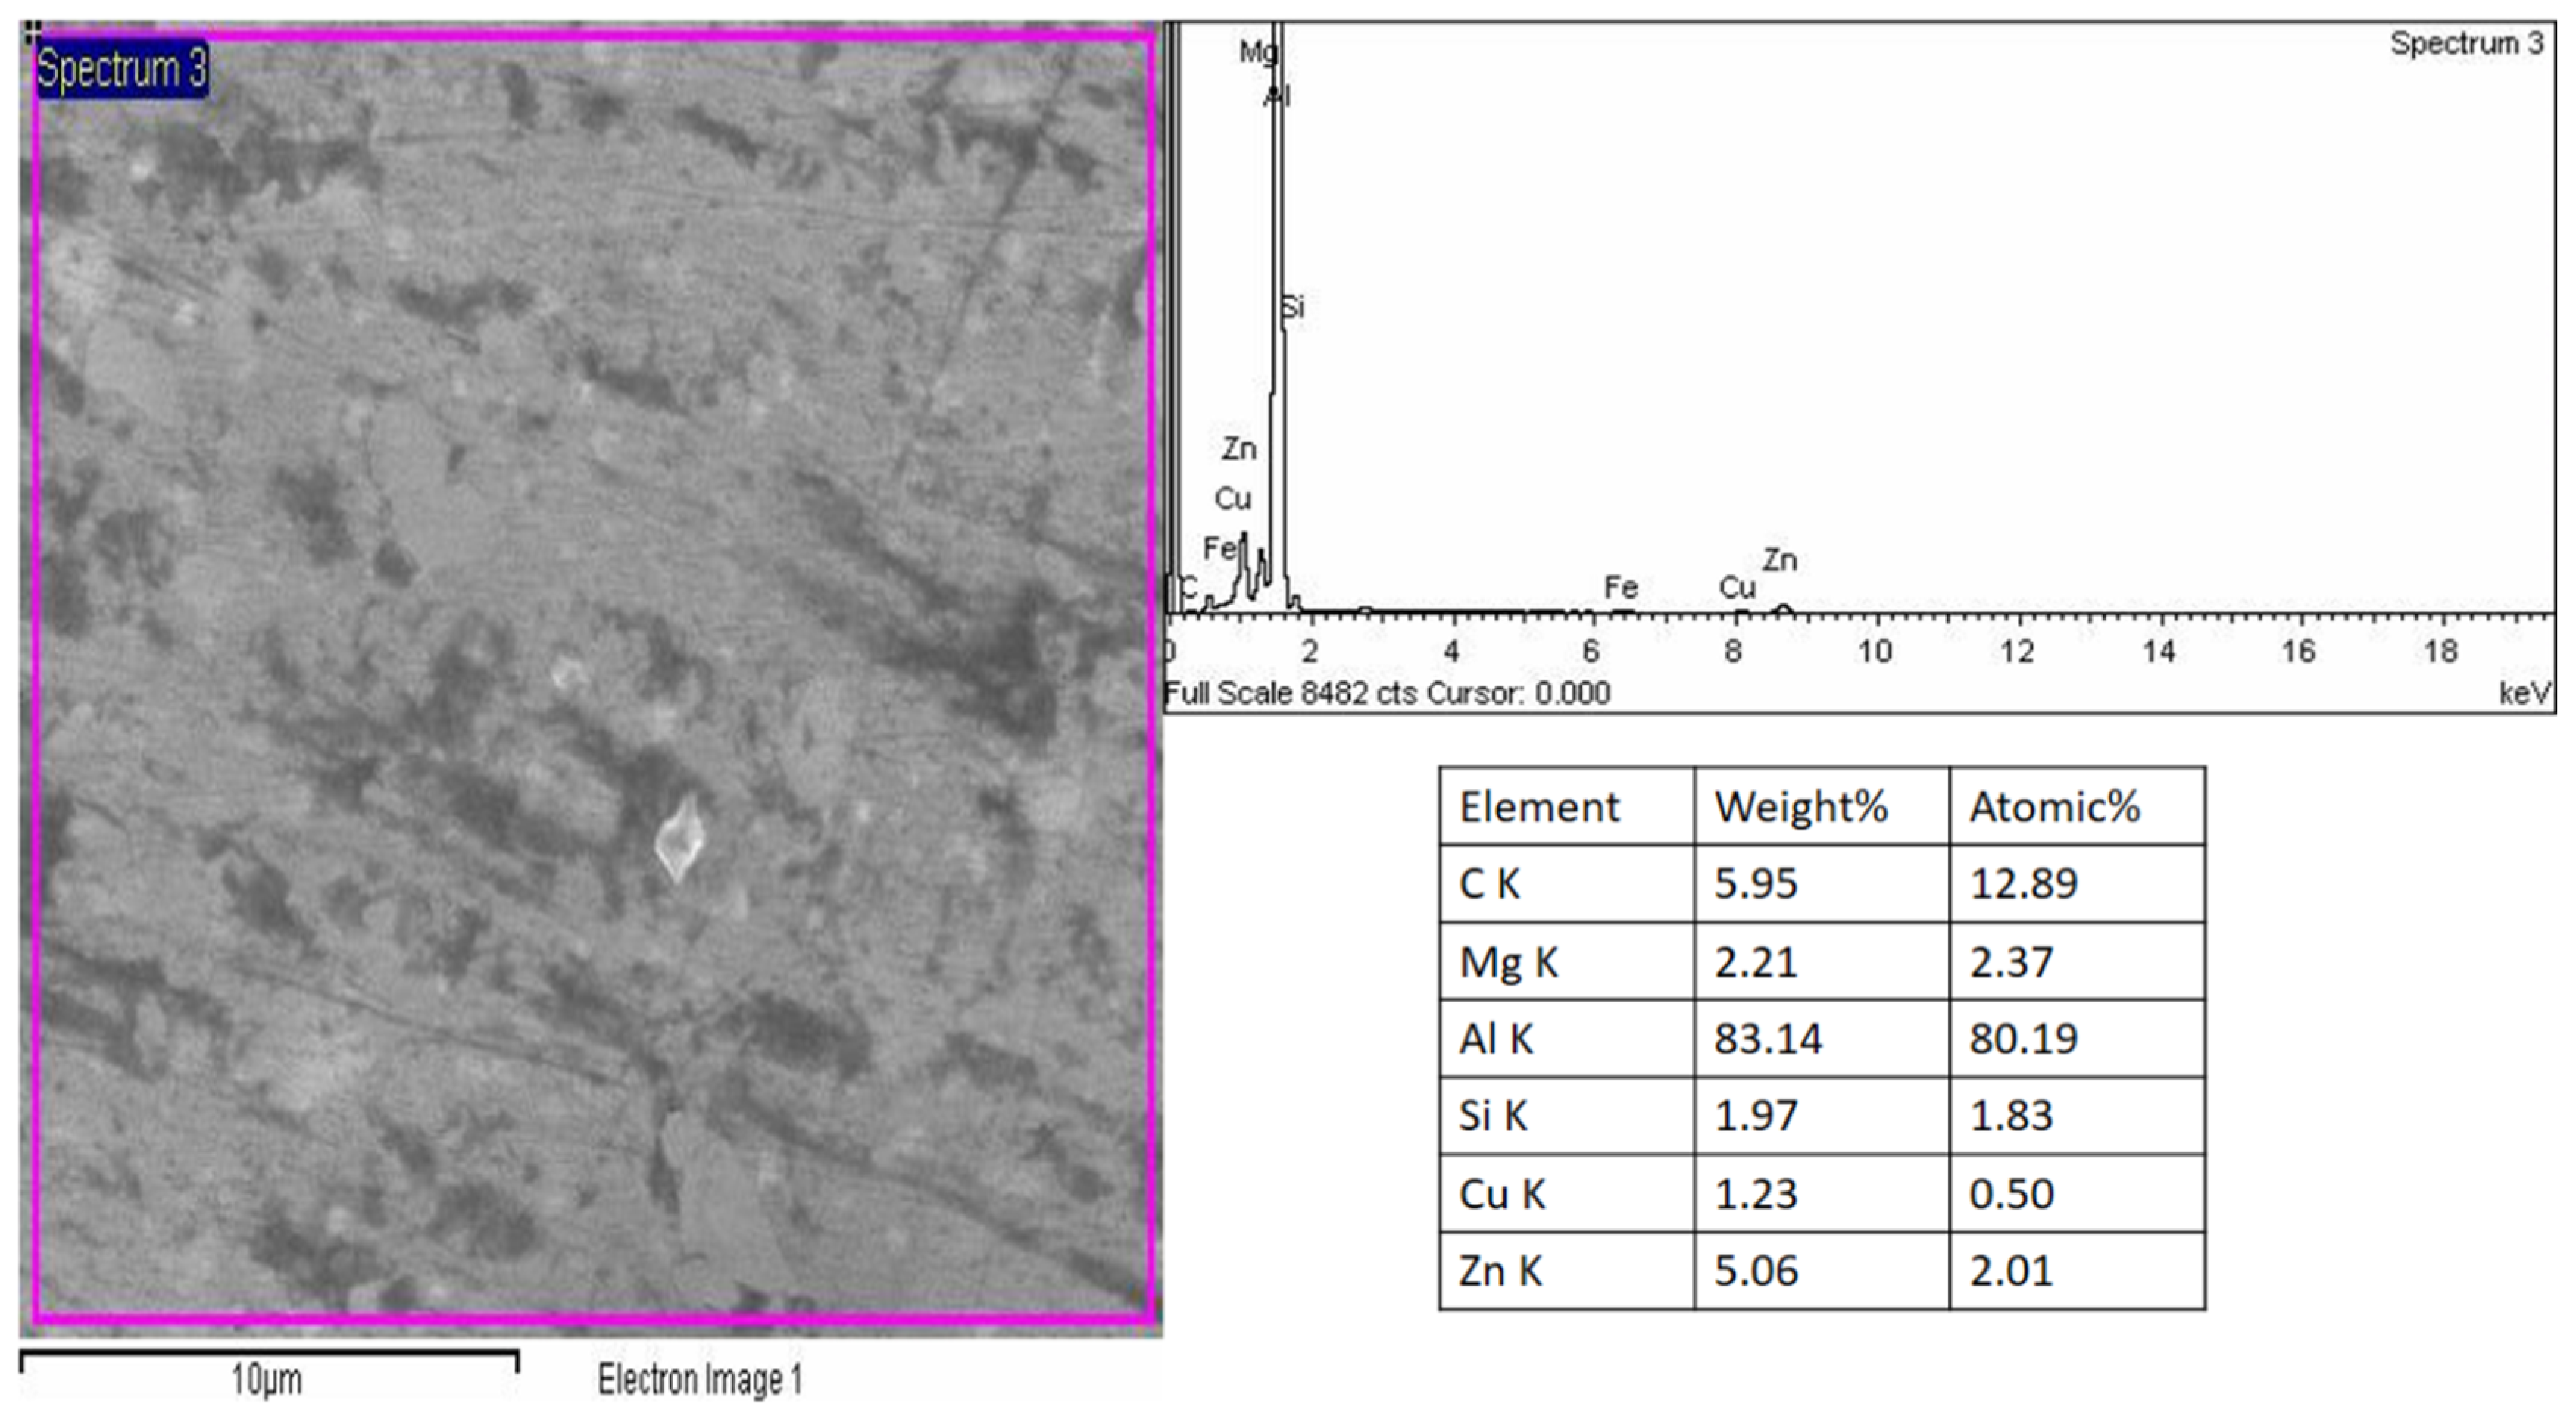
Figure 4 and
Figure 5 show the more magnified SEM micrographs of Al 7075-SiC/Gr composites of Run 10 and 24 samples showing the interfaces between base alloy and reinforcements. The presence of SiC and Gr particles and their dispersion was confirmed by FESEM energy dispersive X-ray (EDX) and mapping analysis as shown in
Figure 6 and
Figure 7, respectively.
From
Figure 4 micrographs of Run 10, it is observed that, the SiC particles are well surrounded by graphite flakes and the graphitized SiC particle zones are present in more numbers compared to Run 24 composite micrographs shown in
Figure 5. In case of Run 10, due to very high rotational speed stirring action, the material movement has facilitated well dispersion of SiC/Gr powders and has given sufficient opportunity to encapsulate the graphitic layers around the SiC particles. The graphite flakes get expholiated into multilayer graphene due to the shear action during intense plasticization [
24,
25]. The graphite flakes have covered large area in the composites due to their large surface area. The SiC particles get fragmented in both samples have fragmented into uneven sizes due to the intense plasticization. The expholiated graphitic layers have acted as a bridge between the SiC/Gr reinforcements and the base alloy, and has contributed for greater interfacial bonding. Due to very high thermal conductivity, the hybrid ratio of Gr is restricted to maximum 40%, as the high content of Gr than this limit has given tattering defects in the composite band [
24].
The graphitized SiC particles in Run 10 are observed to have good interfacial bonding than the Run 24 composite sample. The extent of graphite layers encapsulating the SiC particles is more in case of Run 10 sample than the Run 24 sample due to more intense stirring action. In both the samples, the hybrid ratio of 60:40 is used, but the intense plasticization due to high rotational speed in case of Run 10 has facilitated to overcome the flow stress of the base alloy prominently and thus the particles’ interaction and mobilization inside the matrix have been increased. The greater volume percentage (12%) of SiC/Gr powder with lower rotational speed (500 rpm) in Run 24 has restricted the particle movement and dispersion during the stirring action. On the other hand, the low volume percentage of the SiC/Gr powder with high rotational speed (1500 rpm) has facilitated significant particle movement and dispersion in the matrix.
The very thin graphite flakes have covered the more surface area inside the Al 7075-SiC/Gr composites as shown in
Figure 7. Where as the SiC particles have been fragmented and distributed in the composites. The composite surfaces were different in appearance depending on the machine parameters and reinforcement dispersion. The SiC/Gr reinforcement particles dispersion inside the matrix has affected resultant grain size obtained inside the composites. The grain growth in processed composites is mainly controlled by the pinning effect due to presence of reinforcements. Thus due to encapsulation of reinforcements during intense plasticization the more refined grains structure is obtained in the resultant surface composites.
3.2. Wear Properties
The wear rate (mg/m) and average coefficient of friction for each sample has been measured and tabulated in
Table 3. For all the Al 7075-SiC/Gr samples, the wear resistance has increased compared to the base alloy. Then wear rate as a response has been analyzed using analysis of variance (ANOVA). The ANOVA analysis results are given in
Table 4 and
Table 5 below and the model for wear rate as a response is observed to be significant. The influence of independent variables with respect to wear rate are observed and discussed in below sections.
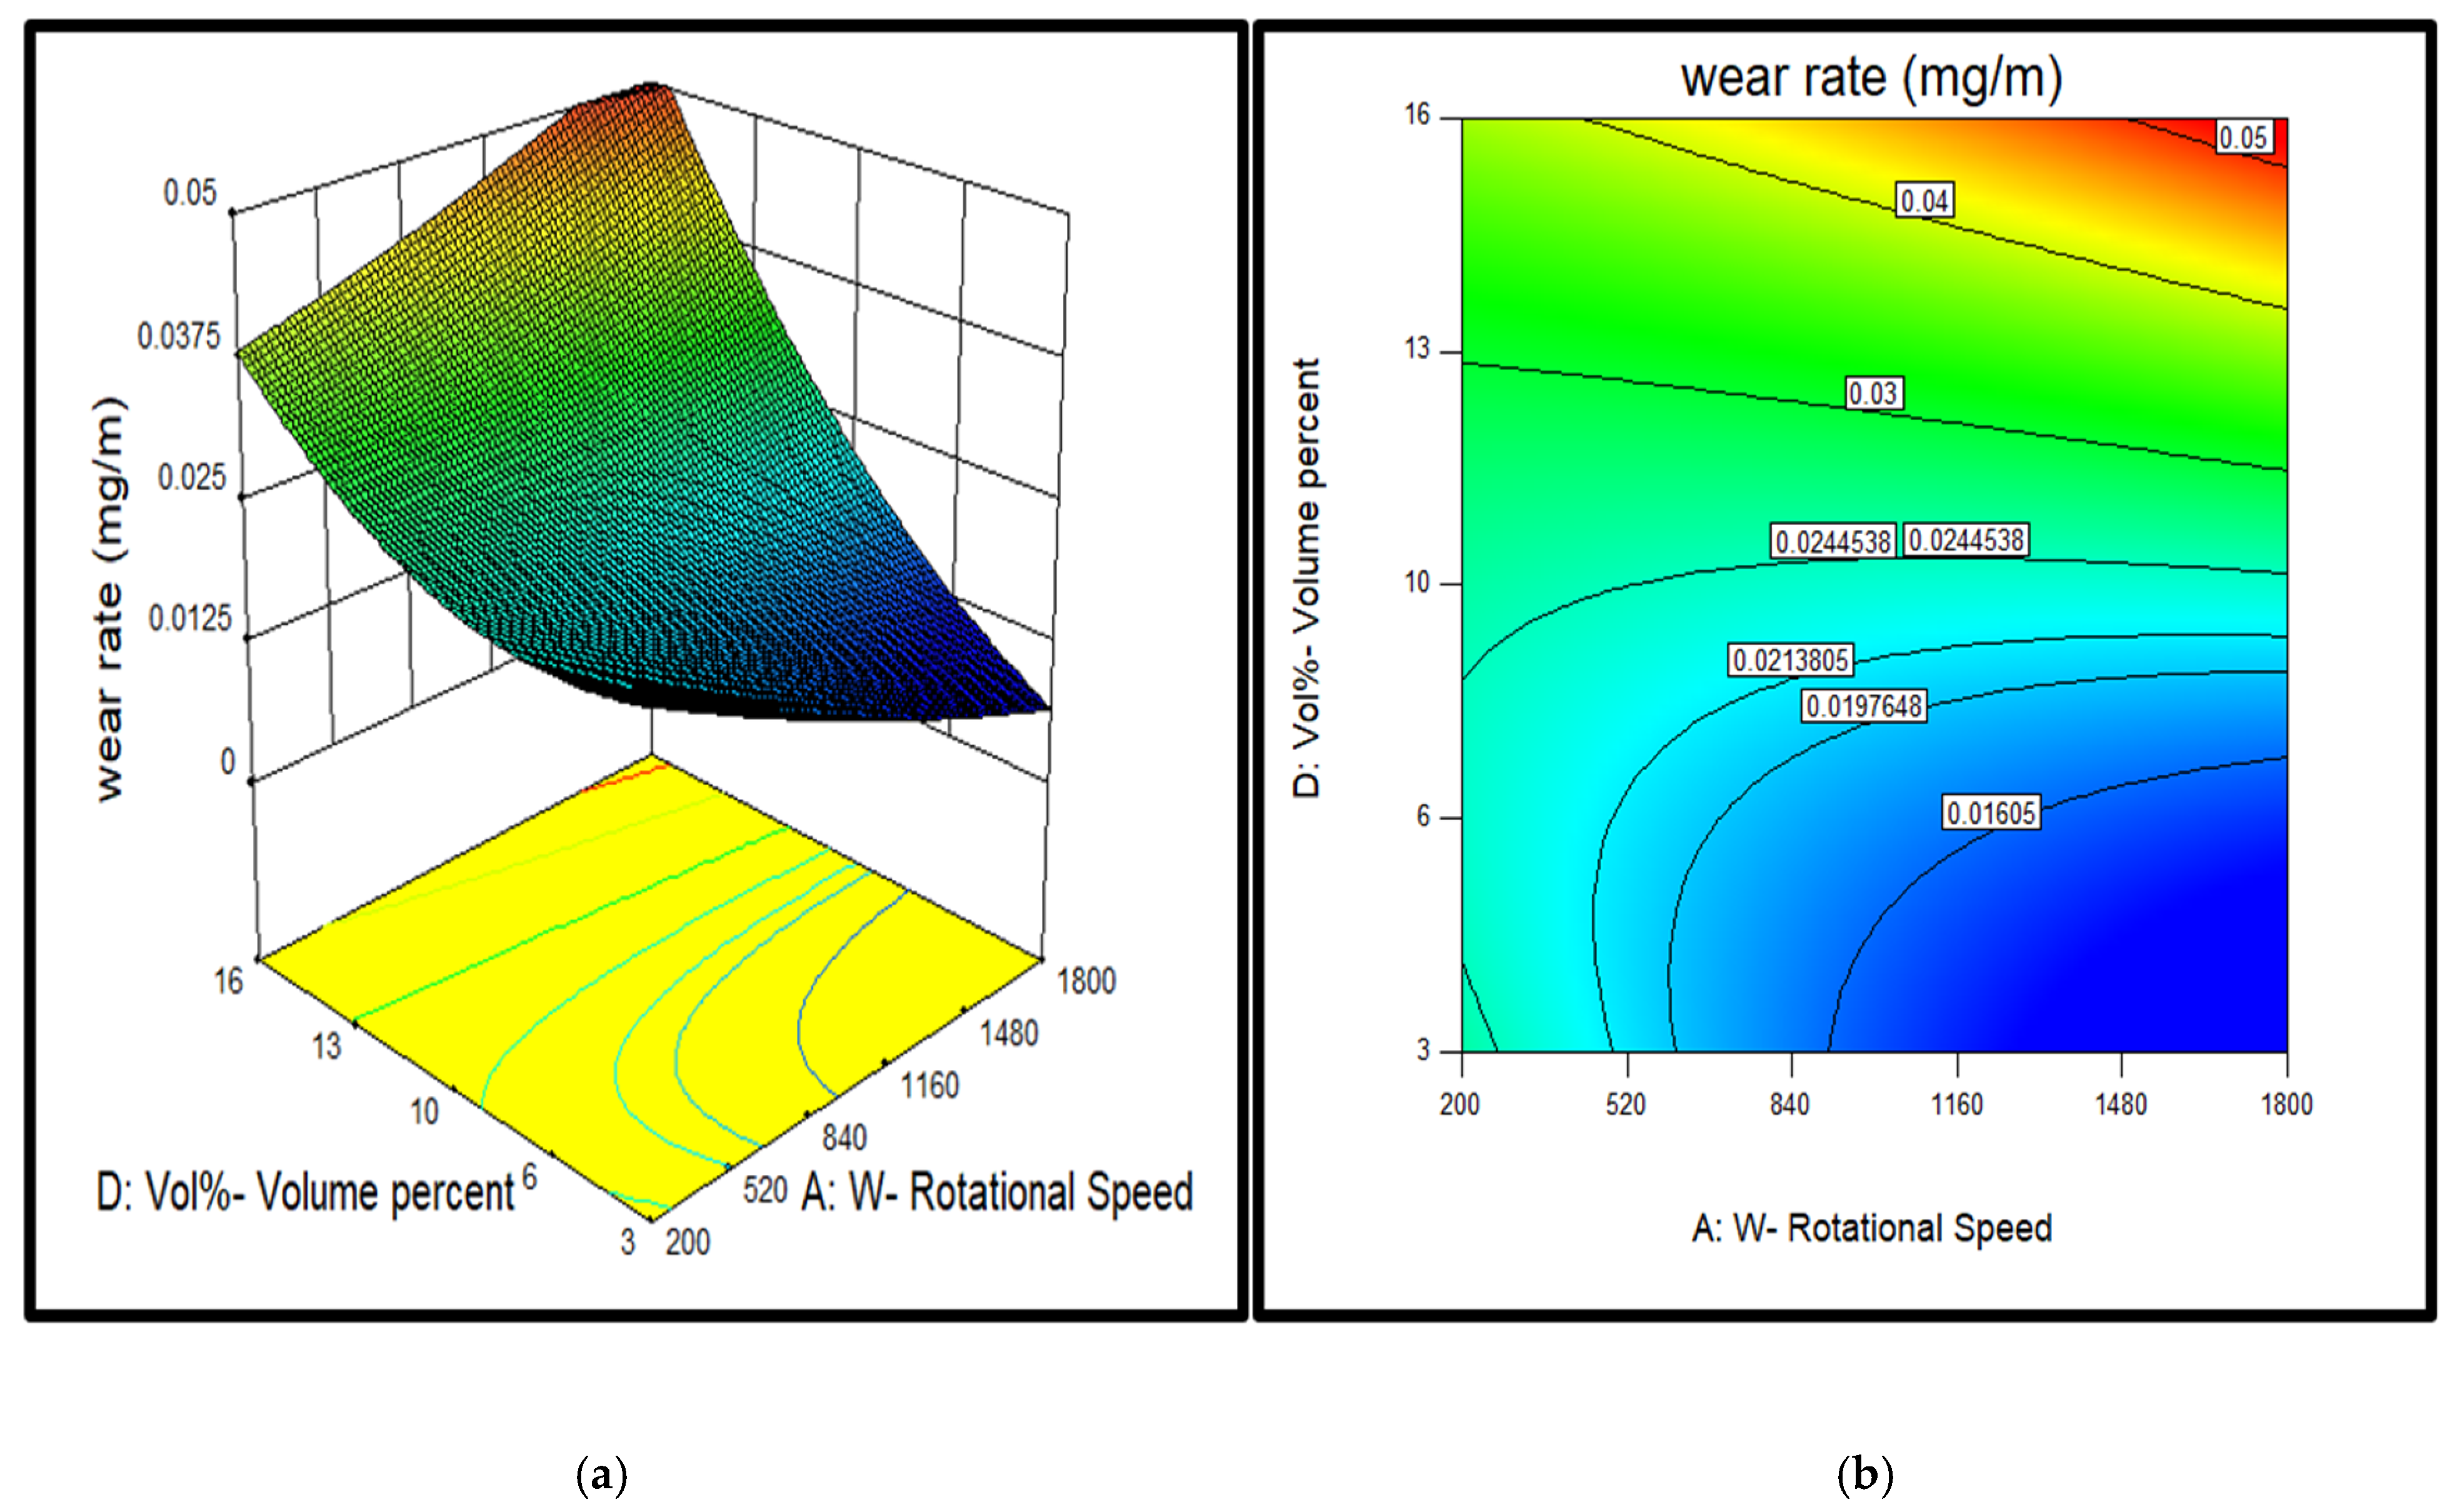
The contour diagram from
Figure 8,
Figure 9 and
Figure 10 show the ranges of four variables for the different intervals of wear rates of the hybrid surface composite samples. The minimum wear rate of 0.01194 mg/m is observed for Run 10 (w 1500 rpm, v 40 mm/min, HR 60:40, vol% 4) composite. Whereas highest wear rate of 0.05175 mg/m is obtained for Run 24 (w 500 rpm, v 20 mm/min, HR 60:40, vol% 12) composite specimen. The coefficient of friction values obtained varies between ranges of 0.85 to 0.98. From the ANOVA analysis, it has been observed that all four independent parameters are found significant.
From the analysis of plots of independent parameters against wear rate, the influence of each parameter on it is observed and important observations are as follows: (a) The desirable range of rotational speed is (1160–1500 rpm). The increase in tool rotational speed has shown decrease in wear rate due to more uniform distribution of SiC/Gr nano particles and thus results in strengthening of the composites by grain size strengthening and Orowan strengthening mechanism. The higher rotational speed facilitates the greater extent of intense plasticization, which provides more reinforcement movements. The Gr flakes expholiated into multi-layered graphene and encapsulates around SiC particles and have contributed to more interfacial bonding. (b) the tool traverse speed has shown lower wear rates at the middle range 27–33 mm/min speeds. This is due to the effect of stirring action on reinforcement distribution and secondly on precipitations resizing and dispersion of the base alloy. The minimum traverse speed may have contributed to the heterogeneous distribution of reinforcements and agglomeration of powders will results into weak interfacial bonding and reinforcements piling out during wear tests. Therefore, in this study the traverse speed of around 30 mm/min has shown the minimum wear rate, at which balanced effect on distribution of reinforcement and precipitation dissolution would have occurred.
In the case of reinforcement related to two parameters, the effects are discussed as follows: (c) The hybrid ratio of SiC/Gr particles has shown effect on wear rate in such a way that the wear rate of the hybrid composites predicted minimum at the ranges in 50:50 to 60:40 ratios. The wear rate observed minimum at the Run 10 sample with HR of 60:40. The hard ceramic SiC particles will act as load-bearing elements and resists the wearing action due to their higher inherent hardness properties. On the other hand the Gr flakes on the surface of the wear tests samples has developed the mechanically mixed lubricating layer between the disc and pin. This Gr tribofilm once generated has reduced the wear rate due less friction and more gliding action during dry sliding actions. (d) Volume percentage of SiC/Gr reinforcement as a parameter has decided the desirable range for the optimum wear properties. From the analysis, it is predicted that the vol% between 3 and 6 will give lower wear rates. From the tests carried out, Run 10 with 4 vol% has shown minimum wear rate for the Al 7075-SiC/Gr surface composites. The volume percentage of reinforcements affects on grain size distribution, agglomeration of powders, the required stirring action to overcome the flow stress of base alloy, finally the extent of interaction between reinforcements and interfacial bonding with the base alloy. The optimal amount of powder for the given stirring action has not only availed the homogenous distribution of reinforcements but also the significant strengthening by means of good interfacial bonding.
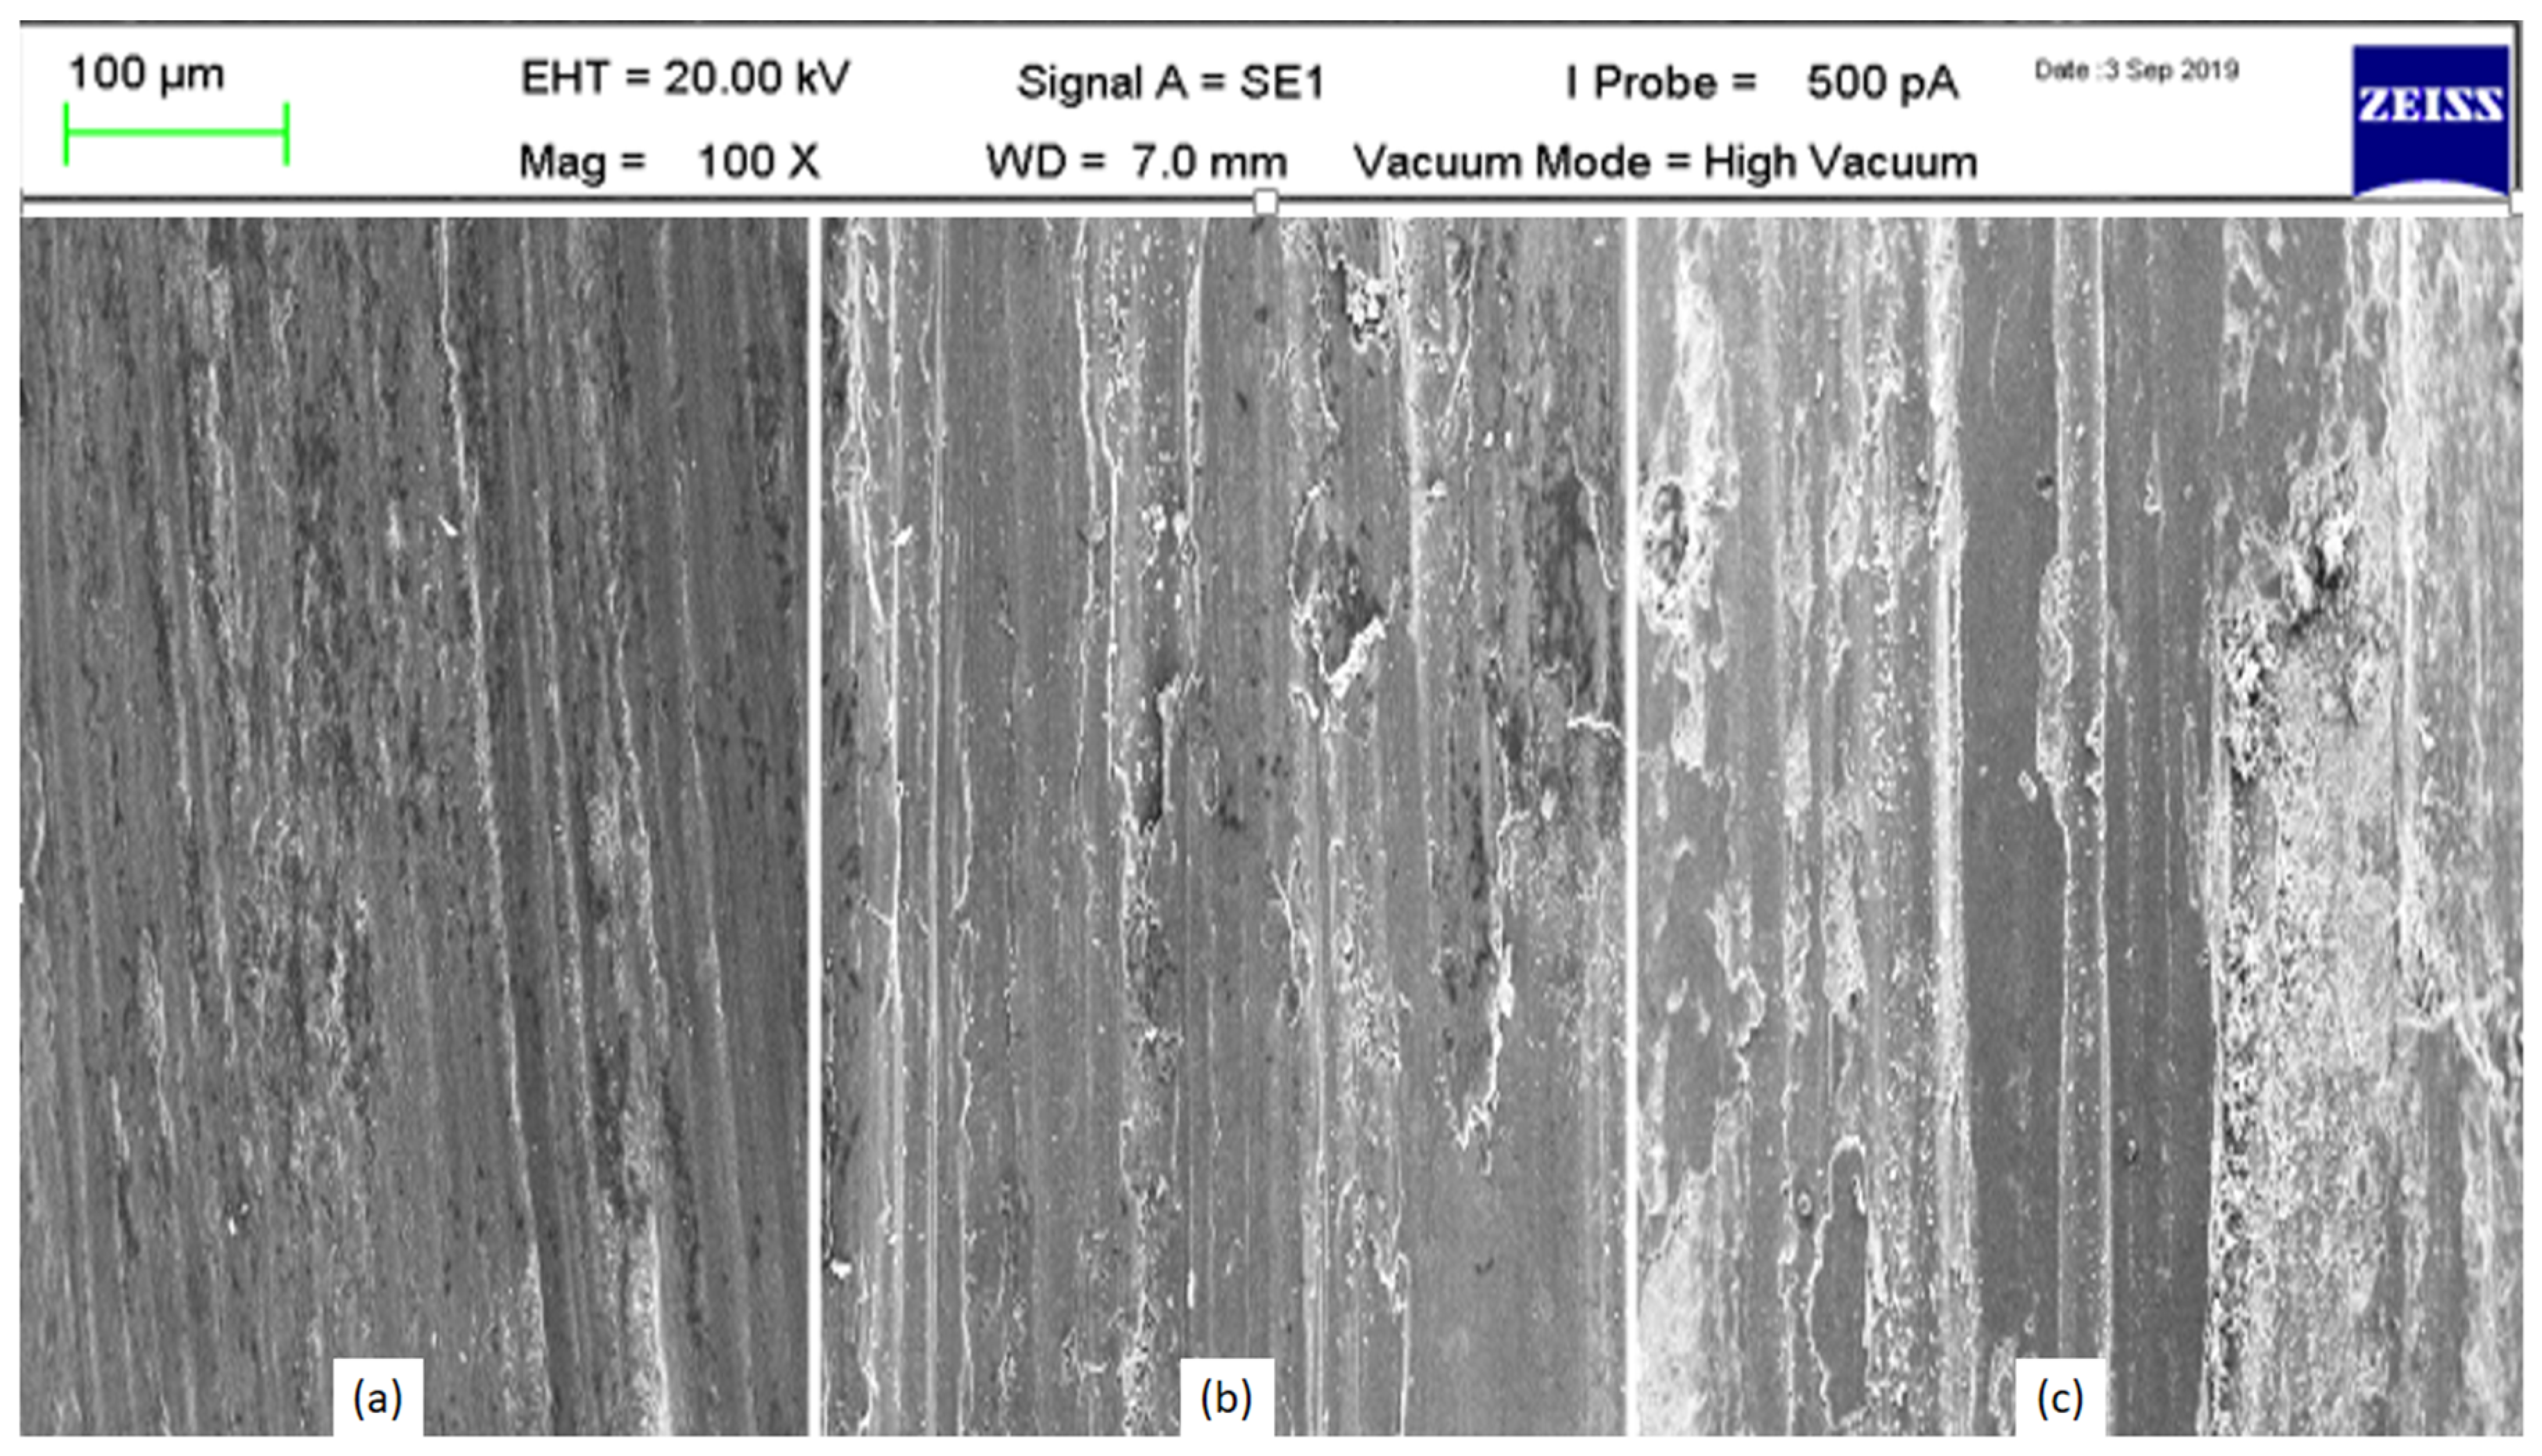
The wear tracks on the pins of base alloy, Run 10 composite and Run 24 composite are as shown in
Figure 11. The clear difference is observed on the wear tracks of these materials, the composite’s surface morphology indicates presence of mechanically mixed tribo film over the surface in bright color due to reinforced SiC/Gr particles. The worn out surface of Al 7075 base alloy shows heterogeneous and adhesive wear mechanism, which is due to absence of any hard particles at the surface. Also, severe plastic deformations without any delamination, cracks of the base alloy indicate the adhesive wear mechanism. On the composite’s worn out surfaces, the presence of hard graphitized SiC particles results in both abrasive and adhesive wear mechanism. Initially, due to adhesion, the wear loss occurred, further due to presence of graphitized SiC particles the resistance to wear increases and thus dimples, delaminations and cracks are observed on the surfaces.
Amongst the surface composites, the composites with high-volume percentage of reinforcements shows the pulling out of reinforcing particles due to loose interfacial bonding with the base alloy. The Run 24 wear track shows such particles pulling out due to agglomeration of powder and loose interfacial bonding with the base alloy, and thus resulted in higher wear rate. The wear mechanism has changed from adhesion to abrasion due to the presence of these hard reinforcement particle pulling out process. In case of Run 10 composite sample, the due to homogenous distribution and good interfacial bonding with the base alloy, the graphitized SiC reinforcement not only resists the wear prior to high hardness but also develops lubricative tribofilm due to graphitic flakes between mating surfaces. Thus, the wear rate was lower for Run 10 composite sample than the Run 24 sample.
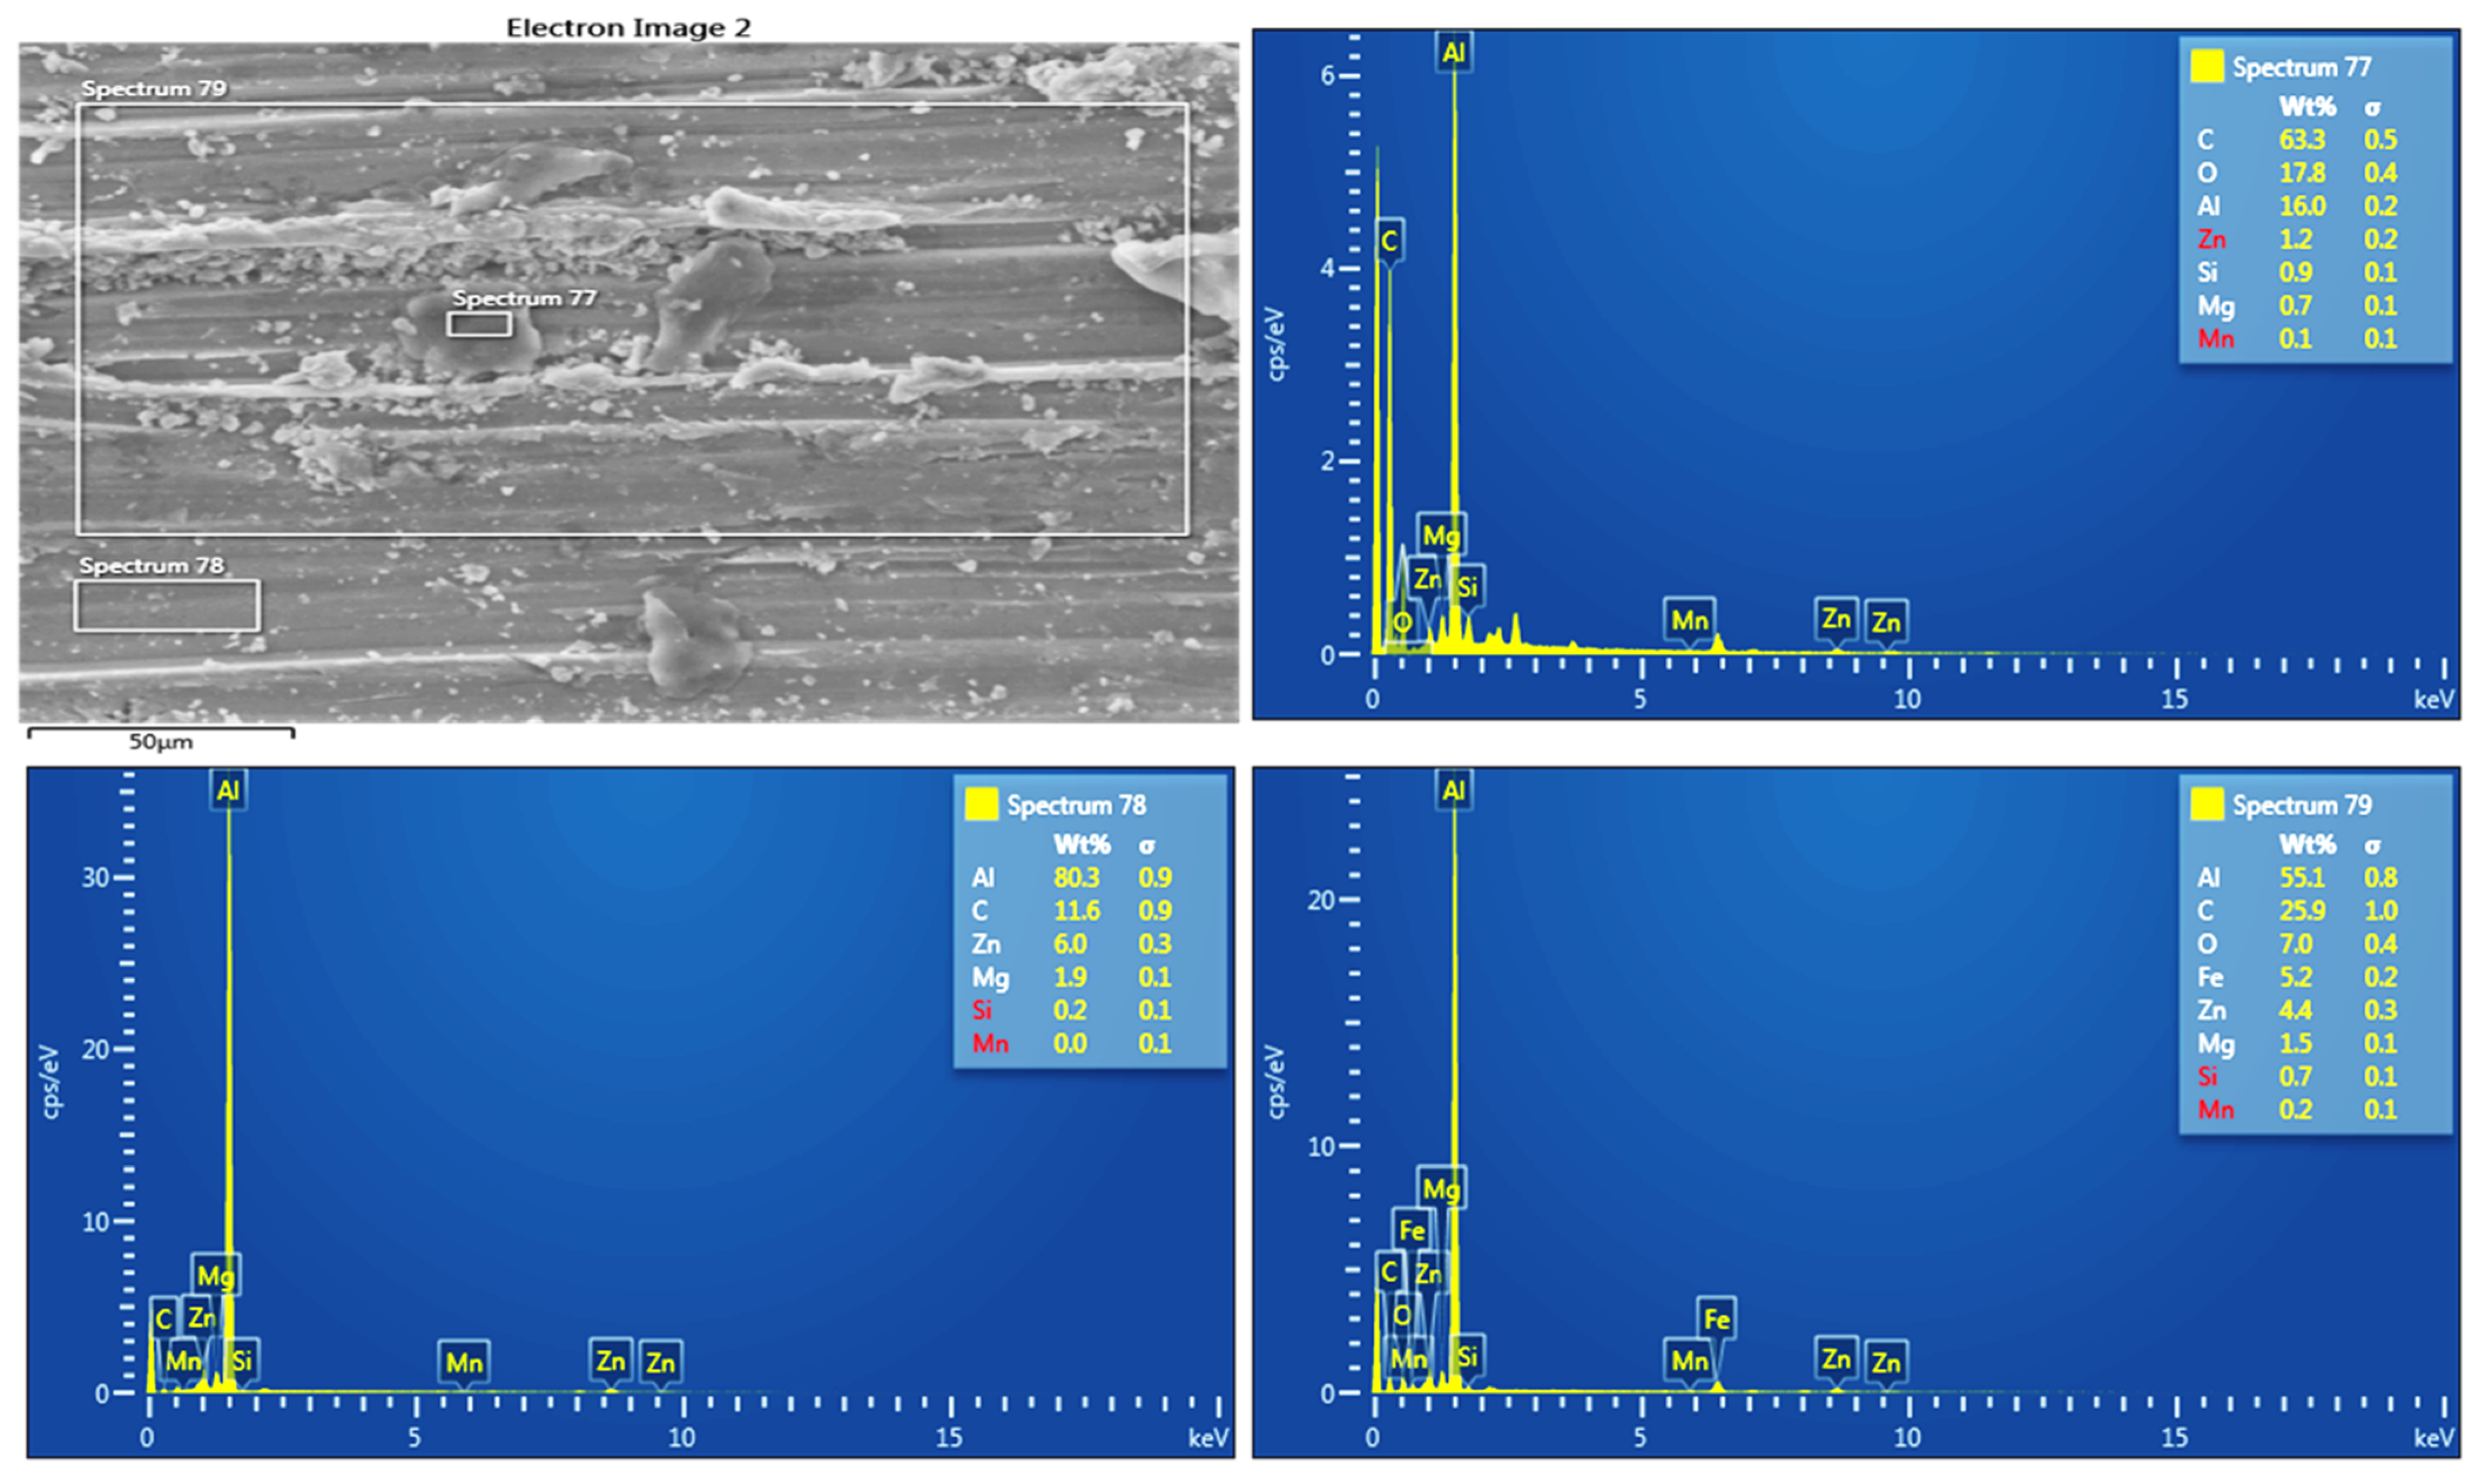
The wear track of Run 10 composite has been analysed for confirming the presence of reinforcement SiC/Gr particles and mating steel disc particles. The FESEM-EDX analysis for such confirmation is shown in
Figure 12 given below. The dark spots on the wear track confirms in terms of graphitized SiC particles as shown in spectrum 77 in the
Figure 12. The highest carbon (C) presence confirms that those are the regions with SiC/Gr reinforcements.
The moderate dark uniform area confirms the presence of thin graphitic tribofilm since the spectrum 78 shows the C presence next to the base Al alloy as shown in
Figure 12. Finally the spectrum 79 covers whole area of track under the scope and finalized prominent presence of SiC/Gr reinforcement and traces of steel disc particles as ferrous (Fe) element.
3.3. Microhardness
The Vickers’s microhardness tests are conducted on all the composite samples and the results are listed as shown in
Table 3. The microhardness values are found some composites more and others less than the base alloy (140 HV). The base alloy used in this study is Al 7075-T651 and which has been heat treated. The FSP has contributed to the reduction of hardness for some composite samples due to dissolution of precipitates during highly intense super plastic deformation. Thus the ranges of tool rotational speed and tool traverse speed are important parameters deciding the extent of deformation. The maximum microhardness of 300 HV is found for Run 14 composite whereas minimum of 85 HV is found for Run 3 surface composite. The increase in hardness is attributed to grain size strengthening due to restriction of grain growth by reinforcements pinning effects. So the microhardness has been mainly controlled in these composites by means of two mechanisms i.e., retaining of inherent precipitates within base alloy and uniform grain size strengthening due to the pinning effect. The increase in dislocation densities due to mismatch of thermal coefficients of reinforcements and base alloy also has contributed to enhancement in microhardness of resultant composites. Xiaofei Ju et al. [
36] mentioned that the heat treatment (T6) on the FSPed composites retained the full precipitates solution in the base alloy along with same grain structure of composites. The ANOVA of microhardness as a response is given in
Table 6 and
Table 7 below, the model is found to be significant.
The desirable ranges of independent parameters for maximizing the microhardness of composites is observed through following plots shown in
Figure 13 and
Figure 14. From the plots it is confirmed that, for this heat treated base alloy both retaining of precipitations and grain size strengthening by more uniform reinforcements dispersion phenomenon are important in order to control the resultant microhardness. The retaining of precipitate solution depends on extent of stirring action. Thus high rotational speed at lower traverse speed has led to dissolution of precipitates solution. However, for same machine parameters condition, the SiC/Gr powder distribution will be high. In balancing conditions, the medium range of tool rotational speed (800–1120 rpm) and tool traverse speed around (30 mm/min) has given more microhardness properties for the resultant composites.
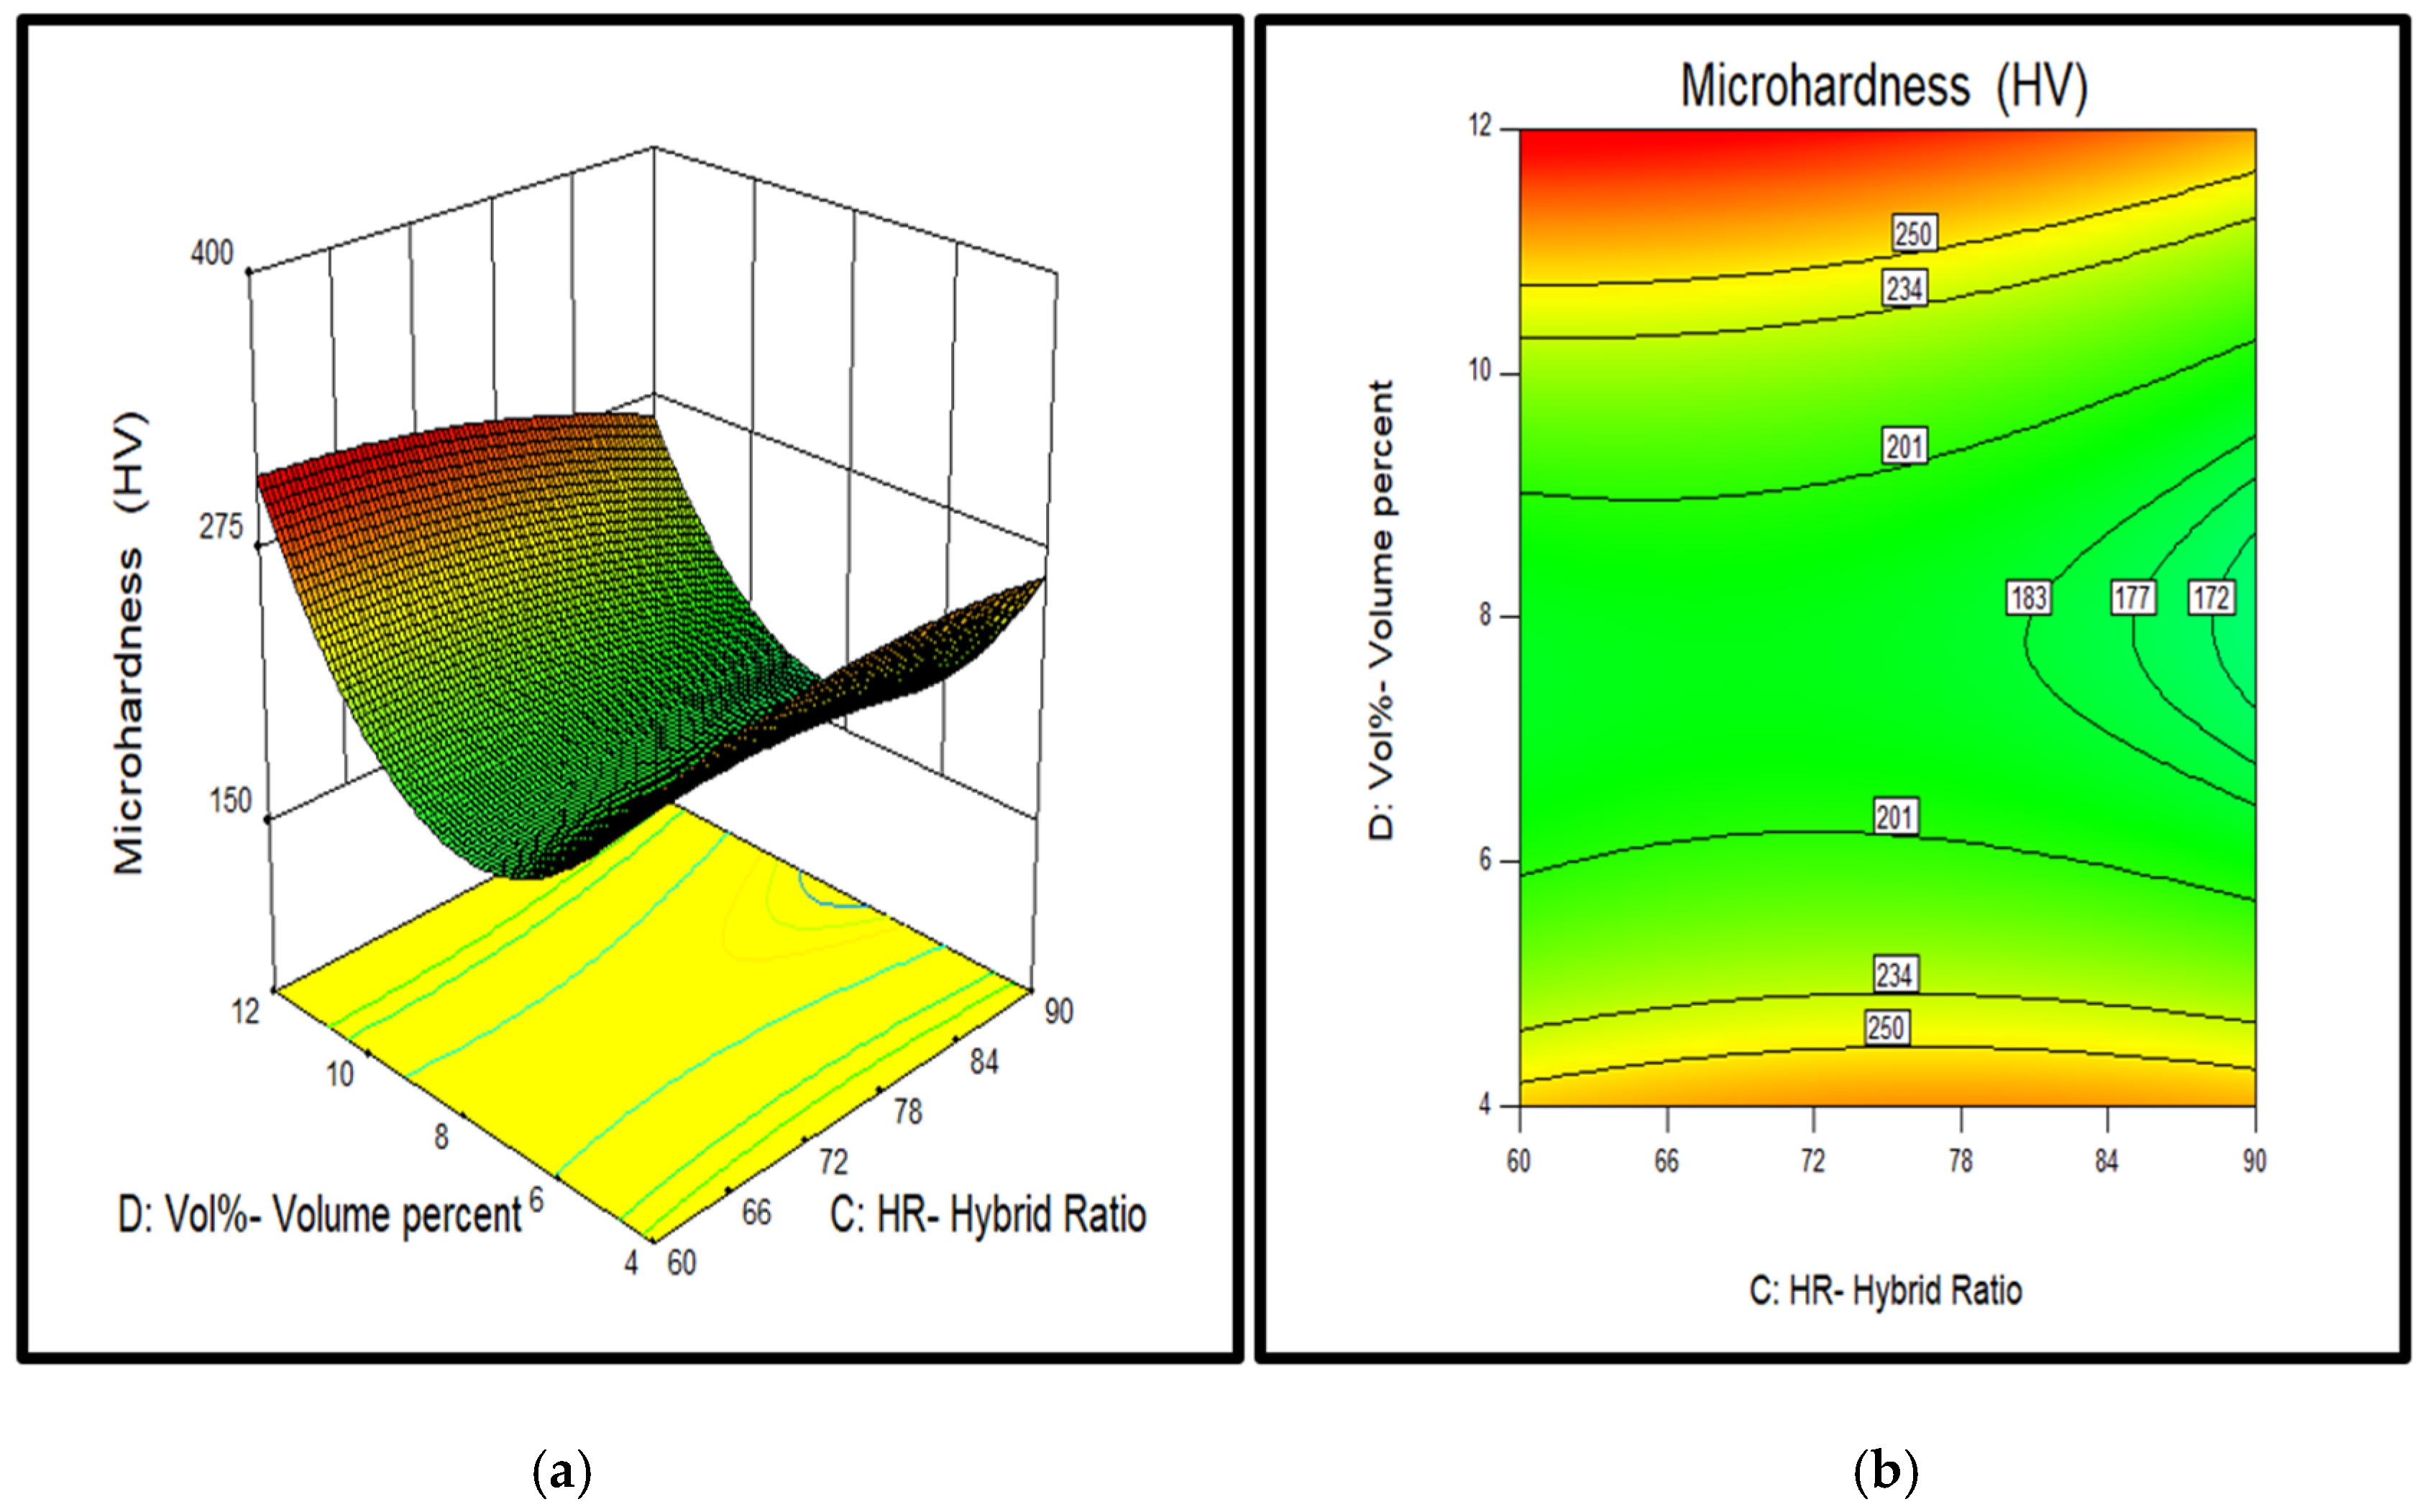
In case of reinforcements volume percentage and hybrid ratio, it is observed from
Figure 15 that the higher volume percentage (10–12%) and hybrid ratio between (60:40–70:30) has shown higher micro-hardness for the surface composites. Higher volume percentage of reinforcements have restricted grain growth in more extent due to which the more refined grain structure has to be obtained. The SiC particles are harder than the base alloy, so as its content increase resulted in higher microhardness of the composites. Although graphite flakes are softer than the base alloy, they have acted as a bridge between load-bearing SiC particles and base alloy to enhance the interfacial bonding. Thus these graphite expholiation into multi layered graphene has supported in enhancing the microhardness of the resultant material.
Thus from the study, it is concluded that microhardness of Al 7075-SiC/Gr composites are controlled by all independent parameters in regard to their effect on resultant grain size distribution and retaining of inherent precipitates as mentioned in the above discussion.

 ,
, 


