Abstract
Wood and plants are made of fibers that contain, in addition to cellulose, lignin and hemicelluloses. Xylan and galactoglucomannan are the dominant secondary cell wall hemicelluloses. In modern times, fibers are important materials for the biorefinery industry and for developing biocomposites. For these and other applications, the structural analysis of fibers is important, and Raman spectroscopy is among the many analytical techniques used. However, given the structural similarity between hemicelluloses and cellulose, many of their Raman contributions overlap, and the extent to which the overlapping features of hemicellulose modify the spectrum of cellulose is not yet fully understood. The present investigation focuses on this aspect by examining xylan, one of the hemicelluloses. As a model system, samples with various mass ratios of cotton microcrystalline cellulose (MCC) and xylan (birch wood) were prepared and analyzed using FT-Raman spectroscopy. In most cases, the Raman intensities were sample-composition-dependent, and, when the selected band intensities were plotted against the xylan content, good linear correlations (with an R2 between 0.69 and 1.0) were obtained. The results indicated that with increased xylan content, the peak intensities increased at 1460, 898, and 494 cm−1 and declined at 1480, 1121, 1096, and 520 cm−1. Additionally, intensity changes (%) in the MCC bands with respect to MCC’s fractions in various mixture samples showed that, in most cases, the mixture intensities increased and were highly correlated with the xylan amounts in the mixtures (with an R2 between 0.75 and 0.97). These findings were applied to interpret Raman spectra of selected xylan-containing delignified plant fibers. It is hoped that the insights gained in this study will allow for better interpretation of the spectra of natural and treated plant materials.
1. Introduction
Lignocellulosic biomass is an important feedstock that can serve as a sustainable raw material supply for producing chemicals, fuels, and biopolymers. In such biomasses, after cellulose, hemicelluloses are the second-most-dominant component, and they are chemically heterogeneous in nature [1,2,3]. In many plant cells, xylan is one such structural polysaccharide, composed of β-D-1,4-linked xylopyranosyl residues with numerous substitutions at C-2 and/or C-3 of the main chain with arabinose, galactose, glucuronic acid, and other monosaccharides [2]. It is found in the cell walls of land plants, in which it may constitute up to 30% of their dry weight. Nevertheless, its localization in cellulose fibers remains poorly understood [4,5,6,7,8], and the presence of xylan seems to be one of the factors behind the low accessibility of cellulose [8,9]. In industrial applications, in the context of the production of regenerated textile fibers wherein dissolving pulps are used, the removal of hemicelluloses and particularly of xylan in hardwood pulps is important [9,10].
Raman spectroscopy is being increasingly used to analyze cellulose and lignocellulose materials [11,12,13,14]. It provides information on both the molecular composition and molecular structure of cell walls. This technique is complementary to IR and offers several advantages. Raman analysis is non-destructive and requires no sample preparation, and the presence of water in samples does not pose any problems. Additionally, there are many Raman spectroscopy techniques available that can be used in the study of cellulose and lignocellulose materials. For example, to minimize sample fluorescence in a spectrum, FT-Raman spectroscopy is used in situations where a near-infrared (NIR) laser is used [15,16]. Alternatively, treatment with alkaline-hydrogen peroxide or sodium borohydride to modify the chromophores in lignin, usually responsible for fluorescence, has been successfully used [17]. As a last resort, in the analysis of cellulosic biomass, lignin can be removed if the information desired corresponds to the carbohydrate components. However, in general, in Raman spectroscopy, there are additional techniques available for suppressing the fluorescence background [18]. Another area of research has been the use of confocal Raman imaging, where a sample can be chemically mapped at high spatial resolution [13,19,20]. Recently, reviews focusing on applications of Raman spectroscopy in plant biomass and cellulose materials have been published [14,20,21].
FT-Raman spectroscopy has been used to study wood and plant fibers. The spectral contributions of cellulose, hemicelluloses, and lignin were ascertained [15,22], and it was concluded that the contributions of hemicellulose are broad and, in many regions, overlap with those of cellulose [15]. One of the outcomes of xylan’s contribution at 1096 cm−1 was that the 380-Raman cellulose crystallinity of hemicellulose-containing materials was found to be lower compared to substances wherein hemicellulose was absent or present in lower amounts [17]. Similarly, depending on a sample’s composition, cellulose crystallinity data obtained using the other Raman methods may be affected [23,24]. Although the contributions of glucomannan and xylan hemicelluloses as well as lignin were identified in the Raman spectrum of black spruce wood, [15] how their presence modifies the spectral features of cellulose was not investigated. Moreover, from the earlier work [15,17,22], some of the lignin Raman bands also have contributions at wavenumbers where primarily carbohydrates contribute. Therefore, the specific goal of this study was to analyze, in delignified fibers, how the presence of xylan modifies the spectrum of cellulose. This was investigated by analyzing model samples with various mixture compositions of crystalline cellulose and xylan. Subsequently, this knowledge was applied to better interpret the Raman spectra of many delignified plant fibers that were mainly composed of cellulose and xylan.
2. Materials and Methods
Chemicals and materials. Sodium hydroxide (AR grade) and Birchwood xylan were obtained from Sigma–Aldrich (St. Louis, MO, USA). Sodium chlorite (technical grade) and Glacial acetic acid were obtained from Alfa Aesar (Tewksbury, MA, USA) and Fisher Scientific (Pittsburg, PA, USA), respectively. Toluene was purchased from J. T. Baker Chemical Co (Phillipsburg, NJ, USA). The type of cotton microcrystalline cellulose (MCC) used was Whatman CC31 powder, which was obtained from Whatman International Ltd., (Maidstone, UK). The rest of the chemicals and reagents were acquired from Sigma–Aldrich (St. Louis, MO, USA). The samples of flax, aspen, willow, corn stalk, kenaf core, kenaf bast, and hardwood bleached kraft pulp (HWBKP) were available at the Forest Products Laboratory, Madison WI.
Cellulose–xylan mixture samples. Model mixture samples with different mixture compositions of crystalline cellulose and xylan were made by mixing cotton MCC (Whatman CC31) and xylan powders. In the mixture samples, the MCC/xylan wt. ratios varied from 90:10 to 50:50. After physically mixing the samples, each sample was further mixed using a few drops of methanol and air-dried at 25 °C before use.
Delignified samples. Wiley milled samples (40 mesh) of flax, aspen, willow, corn stalk, kenaf core, and kenaf bast were delignified via acid chlorite treatment. To remove lignin, these materials were treated with acid chlorite under previously reported conditions [17,25]. First, water-suspended samples were heated to 70 °C, and then glacial acetic acid and sodium chlorite were added. Subsequently, every hour, the chemical charge was added three times over a period of 7 h. The Klason method [26] was used to measure the extent of delignification achieved. These measurements indicated that the samples were highly delignified (Klason lignin 1–5%).
Chemical Composition Analysis. To determine the quantitative amounts of lignin and carbohydrates [27], selected fiber samples were analyzed chemically. Klason lignin repeatability was 0.4%, and for the carbohydrates, the standard deviation was <1% [27].
FT-Raman spectroscopy. A Bruker MultiRam spectrometer (Bruker Instruments Inc., Billerica, MA, USA) equipped with a 1064 nm 1000 mW continuous-wave (CW) diode-pumped Nd:YAG laser was used to analyze the samples in triplicate. Samples, weighing 100 mg each, were pressed into pellets using a hydraulic press and an 8 mm die. The pellets were made by applying 276 × 106 dyn/cm2 of compressive pressure. Raman spectra were obtained using 600 mW of laser power, and 2048 scans/spectrum were collected. Spectra were processed using Bruker OPUS 7.2 software. This involved background subtraction, peak identification, and other mathematical operations. In OPUS, background correction was carried out by using the “rubberband option” with 64 baseline points. The spectra were converted to ASCII format and then imported into Excel for the creation of charts.
Quantitative analysis was carried out by measuring all samples under identical experimental conditions (same instrument, constant laser power, and identical scattering geometry). Additionally, toluene was used as an external standard because the ratio of the analyte (cellulose or xylan) band intensity to external standard band intensity (toluene’s band) is proportional to analyte concentration and independent of any changes in the experimental variables, e.g., laser power [28]. For each sample, toluene’s spectra (sampled in a shortened NMR tube) were measured over time, both before and after each sample analysis. No significant variation in the intensity of the toluene band at 522 cm−1 was noted under identical sampling conditions (laser power 600 mW).
Raman band intensity and % band intensity changes. Intensities of various bands and changes in the intensities of selected Raman bands were calculated as follows. Using OPUS software, for 1480 and 1460 cm−1 peaks, a sloping line was drawn under each peak from 1440 to 1500 cm−1, and the peak heights were measured at 1480 and 1460 cm−1. However, for the remaining cellulose peaks at 1121, 1096, 911, 898, 520, and 494 cm−1, prior to measuring peak heights at the peak positions, a horizontal line under each peak was drawn from 944, 944, 845, 845, 510, and 473 cm−1, respectively. For the mixture samples, % band intensity changes were calculated using the following equation (Equation (1)):
where ΔIwavenumber is change in the band intensity at a selected wavenumber position in the sample spectrum and “x” is the faction of MCC present in that mixture-sample. For example, for a 60:40 mixture (60% MCC and 40% xylan), x would be 0.6 in Equation (1).
3. Results and Discussion
3.1. Fiber Samples and Their Chemical Compositions
The chemical compositions of MCC and the delignified plant fibers are provided in Table 1. Considering that, in Raman spectroscopy, lignin can give rise to fluorescence and that some of its spectral features overlap with those of cellulose [15,22], it was mostly removed using the mild acid chlorite delignification method [25]. In Table 1, the samples are listed in the order of highest to lowest glucan content. In this investigation, fibers with high xylan content were chosen, although the amount always remained less than 25% (Table 1). Moreover, except for delignified flax, the content of glucomannan in these materials was low (<1.5%, Table 1). This was by design, ensuring that the spectral contributions of the latter would not further complicate the matter. None of the samples listed in Table 1 contain much lignin (in all cases < 4.5%), and residual proteins always appeared as Klason lignin due to this material’s insolubility in the concentrated acid. The glucan content of the Table 1 materials varied between 92 and 45%, and the cotton MCC was the most enriched in cellulose (>90%). Of the xylan-containing samples, aside from MCC and delignified flax, the rest had significant amounts present (between 14 and 25%; Table 1).

Table 1.
Chemical composition of cotton MCC and plant fibers.
3.2. Raman Bands of Cellulose and Other Cell Wall Components
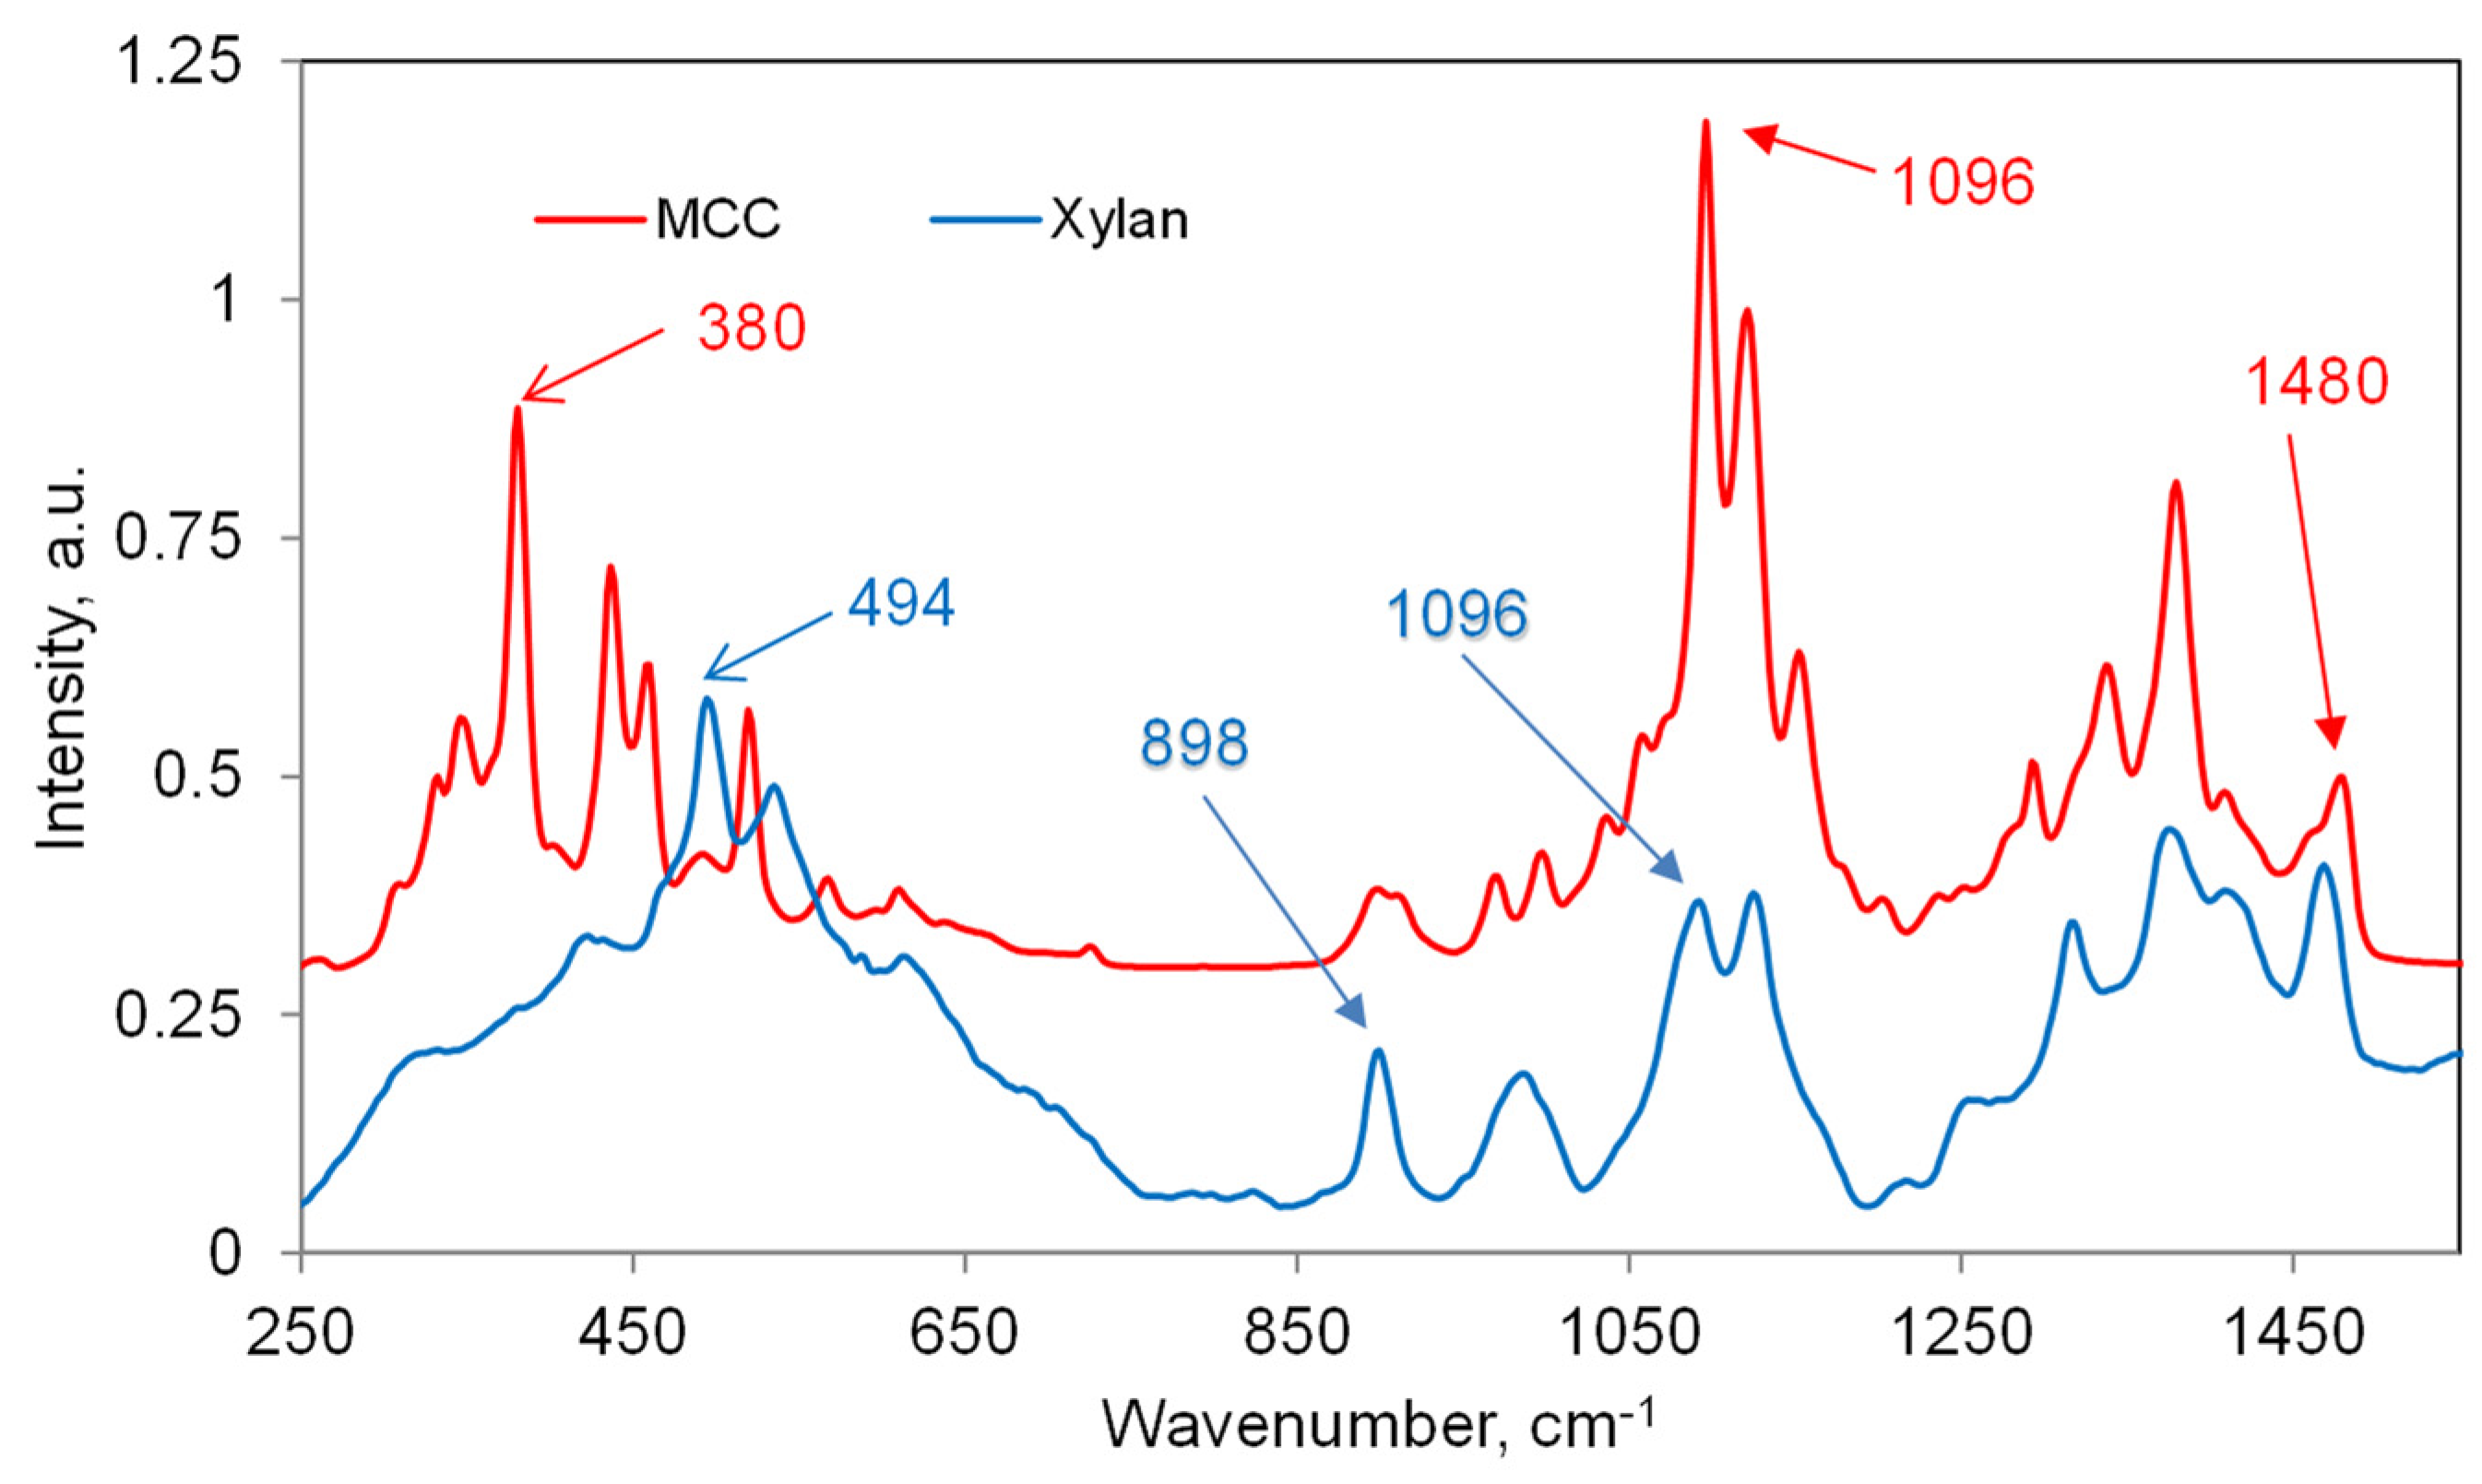
The Raman spectra of MCC and xylan in the fingerprint region 250 to 1550 cm−1 are shown in Figure 1. Additionally, below 250 cm−1, only crystalline cellulose has bands at 172 and 93 cm−1 (not shown in Figure 1). Table 2 lists the Raman bands of MCC as well as selected band wavenumbers of the other cell wall components (xylan, glucomannan, and lignin) [15,22]. For lignin, only those peak positions that overlap with the spectral features of crystalline cellulose are listed (Table 2). For each component’s spectrum, the relative intensities of the bands are designated in terms of being very strong (vs), strong (s), medium (m), weak (w), etc. (Table 2). The spectral peak positions along with their assignments to the components are listed in Table 2.
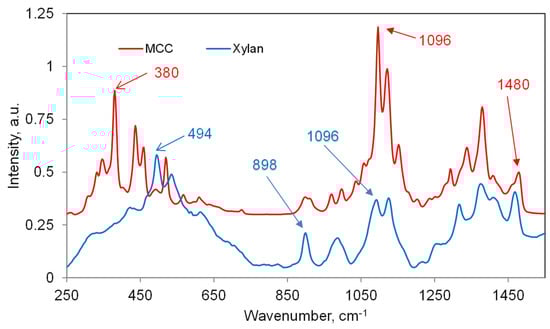
Figure 1.
Raman spectra of MCC and xylan (250–1550 cm−1 region).
Table 2.
Band positions of MCC and other cell wall components, 70–1550 cm−1 region.
3.3. Cellulose/Xylan Mixture Samples
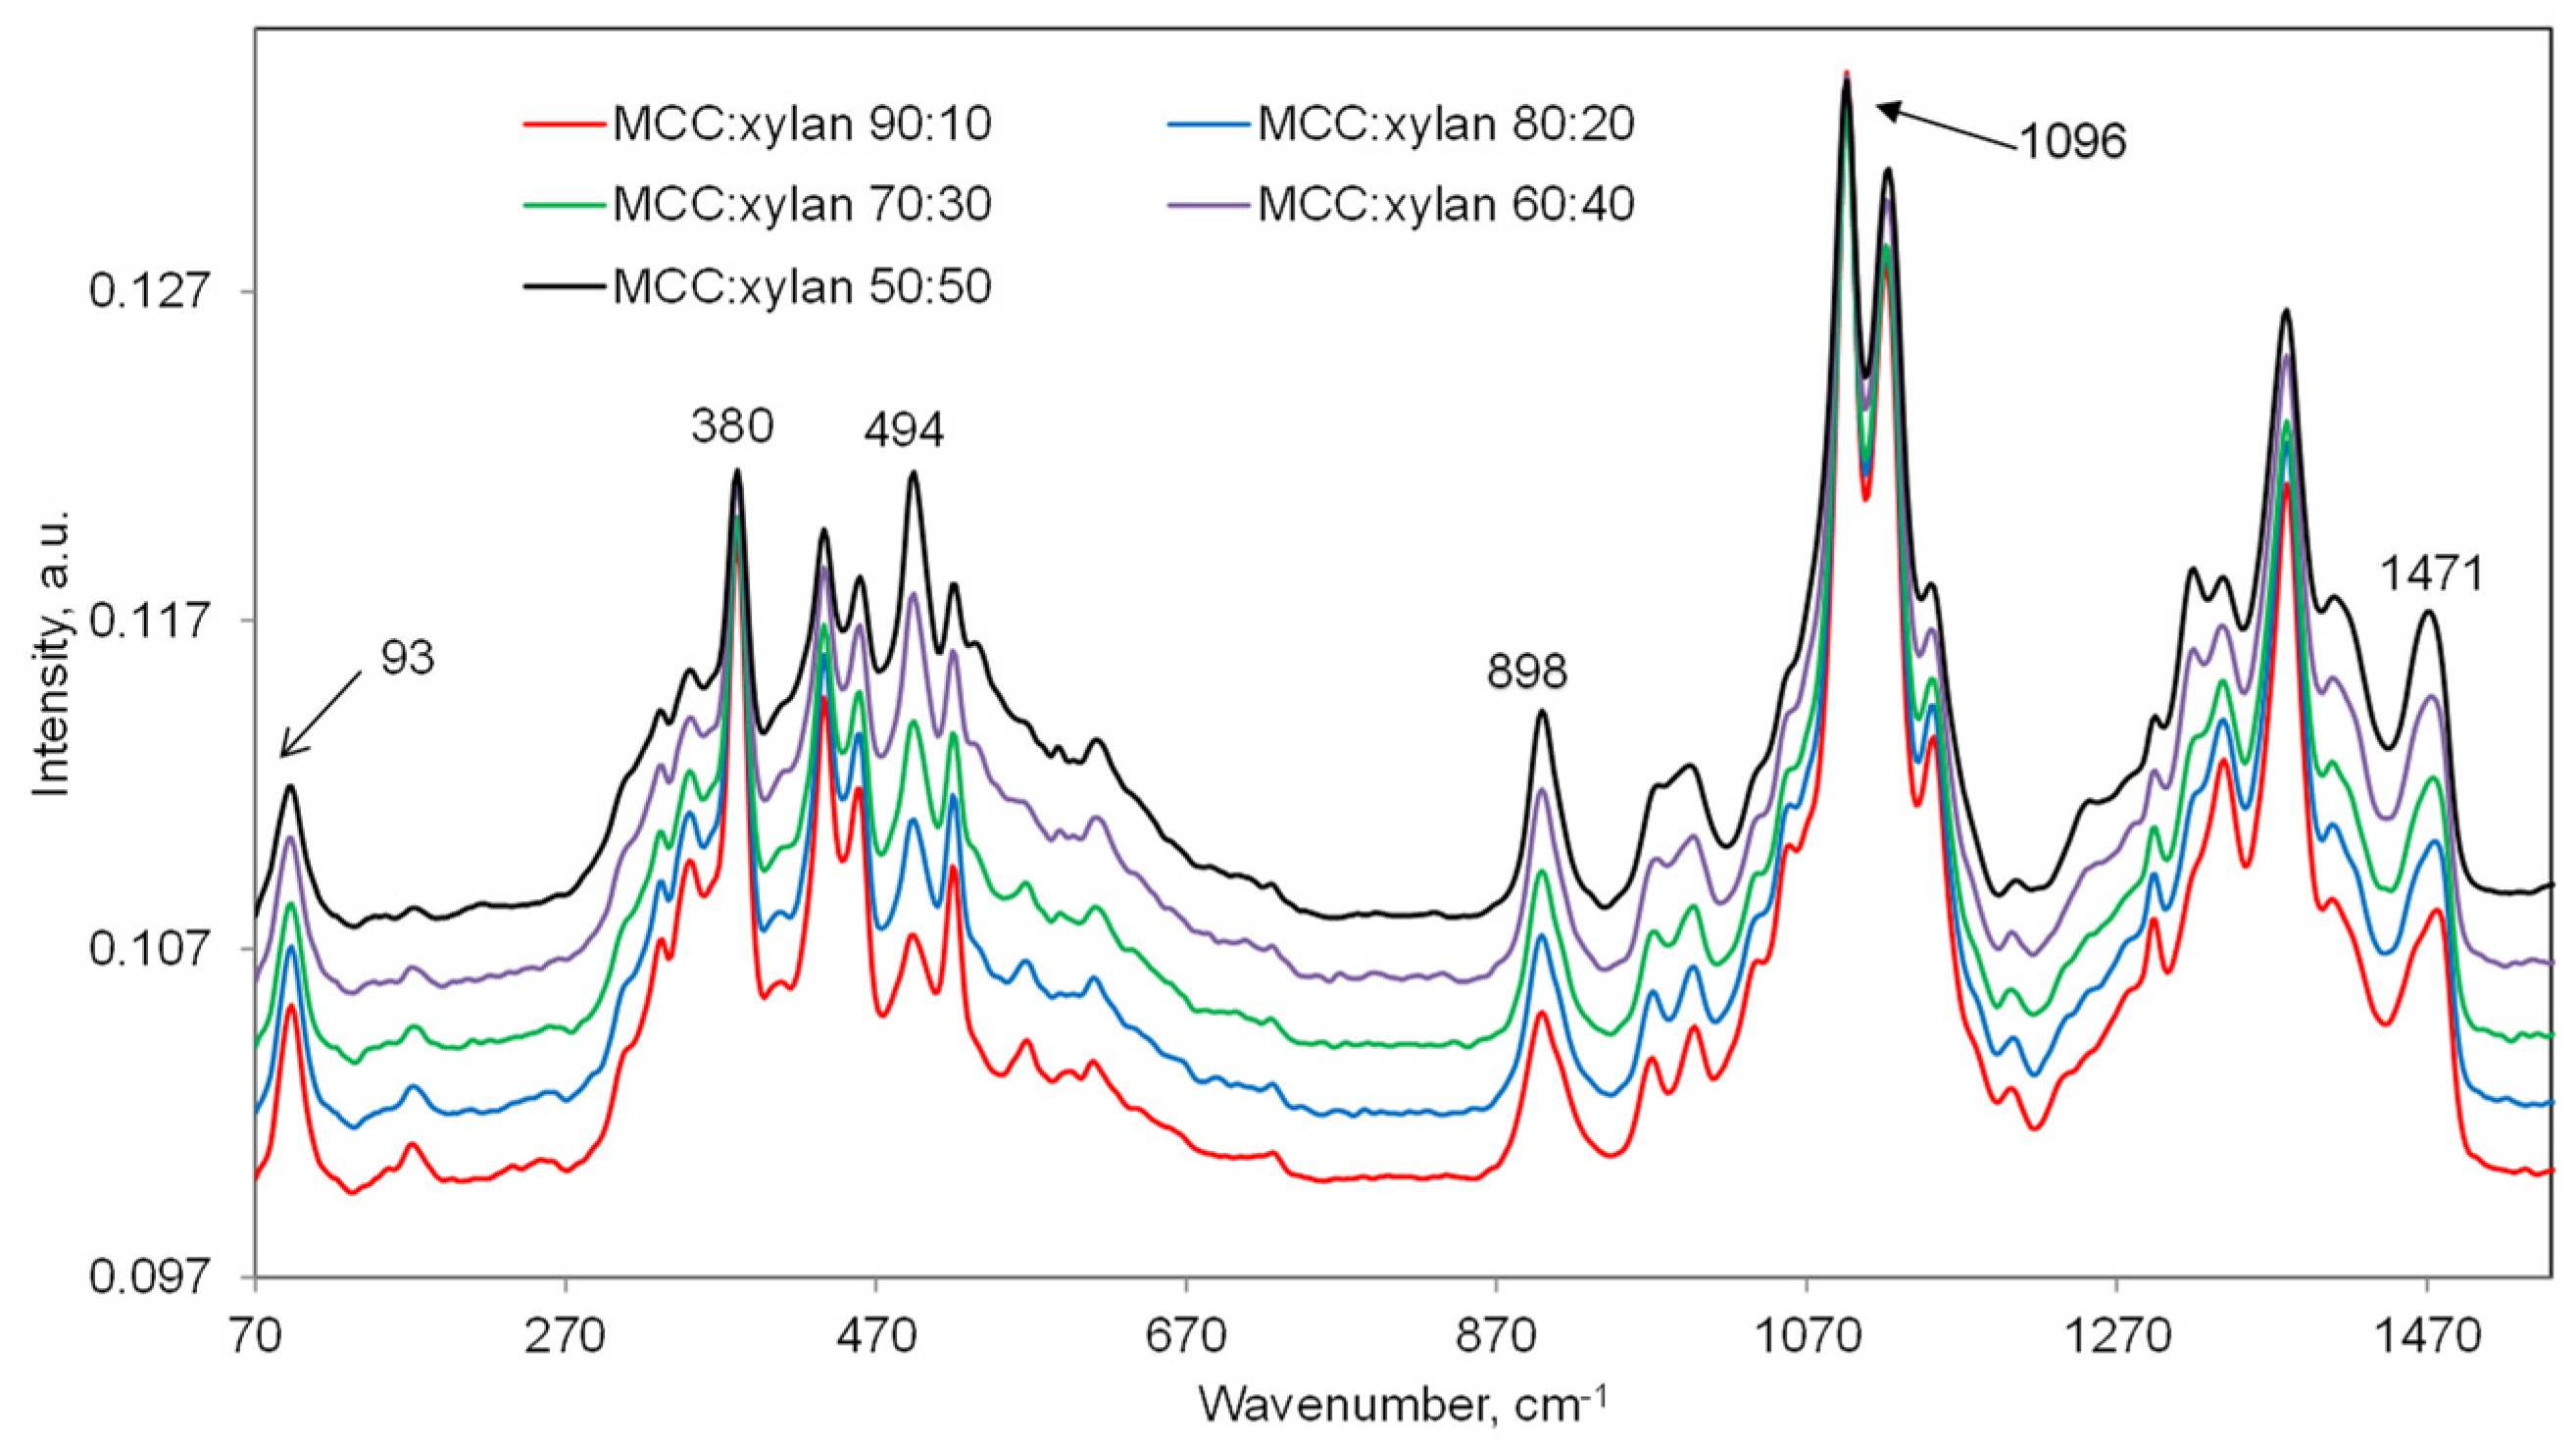
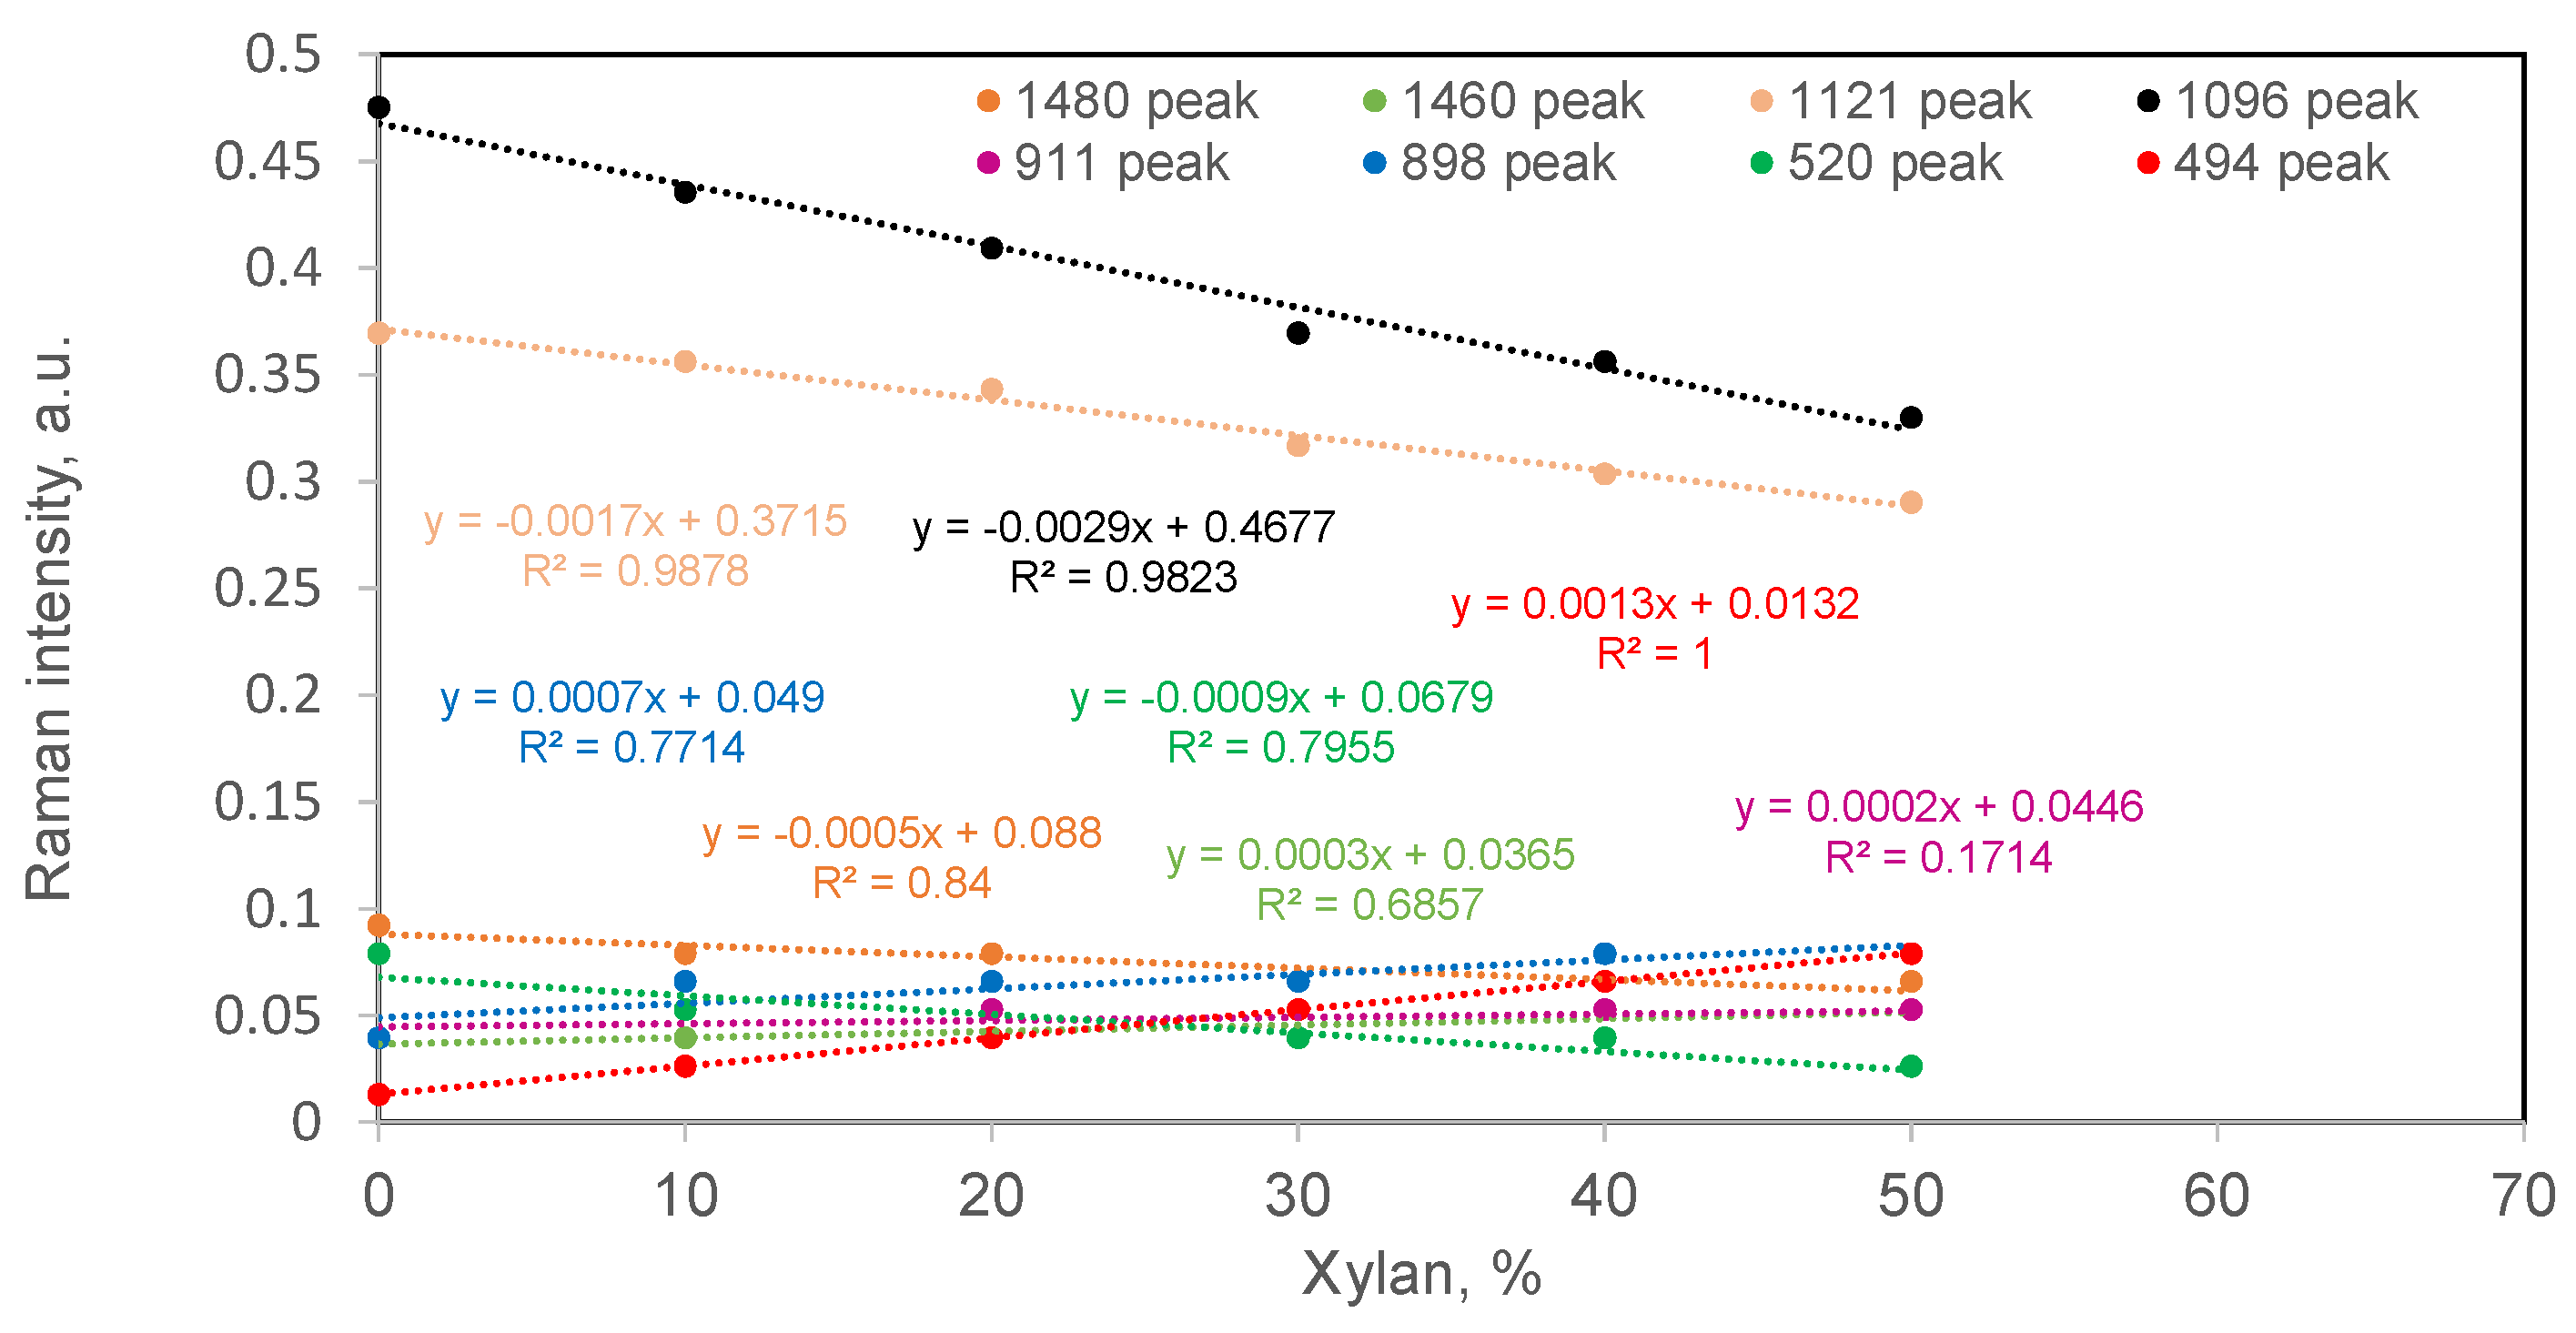
Cellulose/xylan mixtures (respective ratios of 90:10 to 50:50; Table 3) were prepared and analyzed using Raman spectroscopy. Judging by the mixture spectra in Figure 2, the main bands of xylan (1469, 1126, 1091, 900, and 494 cm−1; Table 2) overlapped with the cellulose features and modified their intensities to varying degrees. Therefore, for the mixture samples, peak intensity changes of the following eight bands of cellulose were evaluated: 1480, 1460, 1121, 1096, 911, 898, 520, and 494 cm−1 (Figure 1, Table 2). Because the intensity change is sample-composition-dependent, the percentage intensity change at a particular wavenumber (Table 3) was calculated using Equation (1), wherein the actual fraction of MCC present was factored in. In Figure 3, the calculated band intensity changes are plotted against the percentage of xylan in the samples, and, in most cases, good linear correlations (with an R2 between 0.69 and 1.0) were obtained. This means that the change in the xylan content accounted for a substantial amount of the variance in the MCC band intensities. However, the 911 cm−1 band intensity showed a poor correlation (R2, 0.17, Figure 3), which may be related to the fact that while both cellulose and xylan weakly contribute in this case (Table 2), only the falling wing of xylan’s band at 900 cm−1 influences the intensity at 911 cm−1 (Table 2, Figure 1).
Table 3.
Changes in MCC Raman band intensities as a function of xylan concentration.
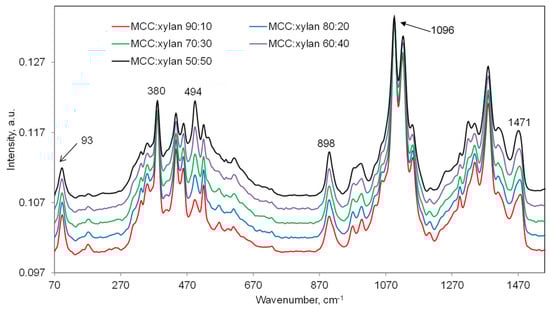
Figure 2.
Raman spectra of mixture samples with various MCC/xylan mass ratios. Some of the peaks in the spectrum of the mixture sample (cellulose/xylan, 50:50) are annotated.
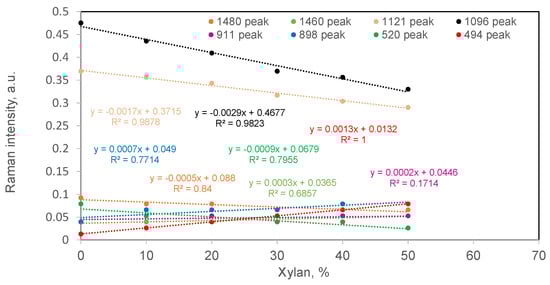
Figure 3.
Band intensity changes in the Raman spectra of the various MCC/xylan mixture samples.
With an increased amount of xylan, while the intensities were greater at three locations (1460, 898, and 494 cm−1; Figure 3), they declined at many other band locations (1480, 1121, 1096, and 520 cm−1); these are all these wavenumber positions where MCC contributed strongly, and, for the 1121 and 1096 cm−1 bands, the implication was that any increased contribution from xylan (Table 2) was not enough to completely offset the decline caused by the reduction in MCC. A similar reduction was also noted for the 520 cm−1 band because there was only minimal contribution from the nearby xylan peak at 494 cm−1 (Table 2, Figure 1); therefore, for most of the samples, as the amount of cellulose in the sample declined, so did the intensity at 520 cm−1 (Figure 2 and Figure 3).
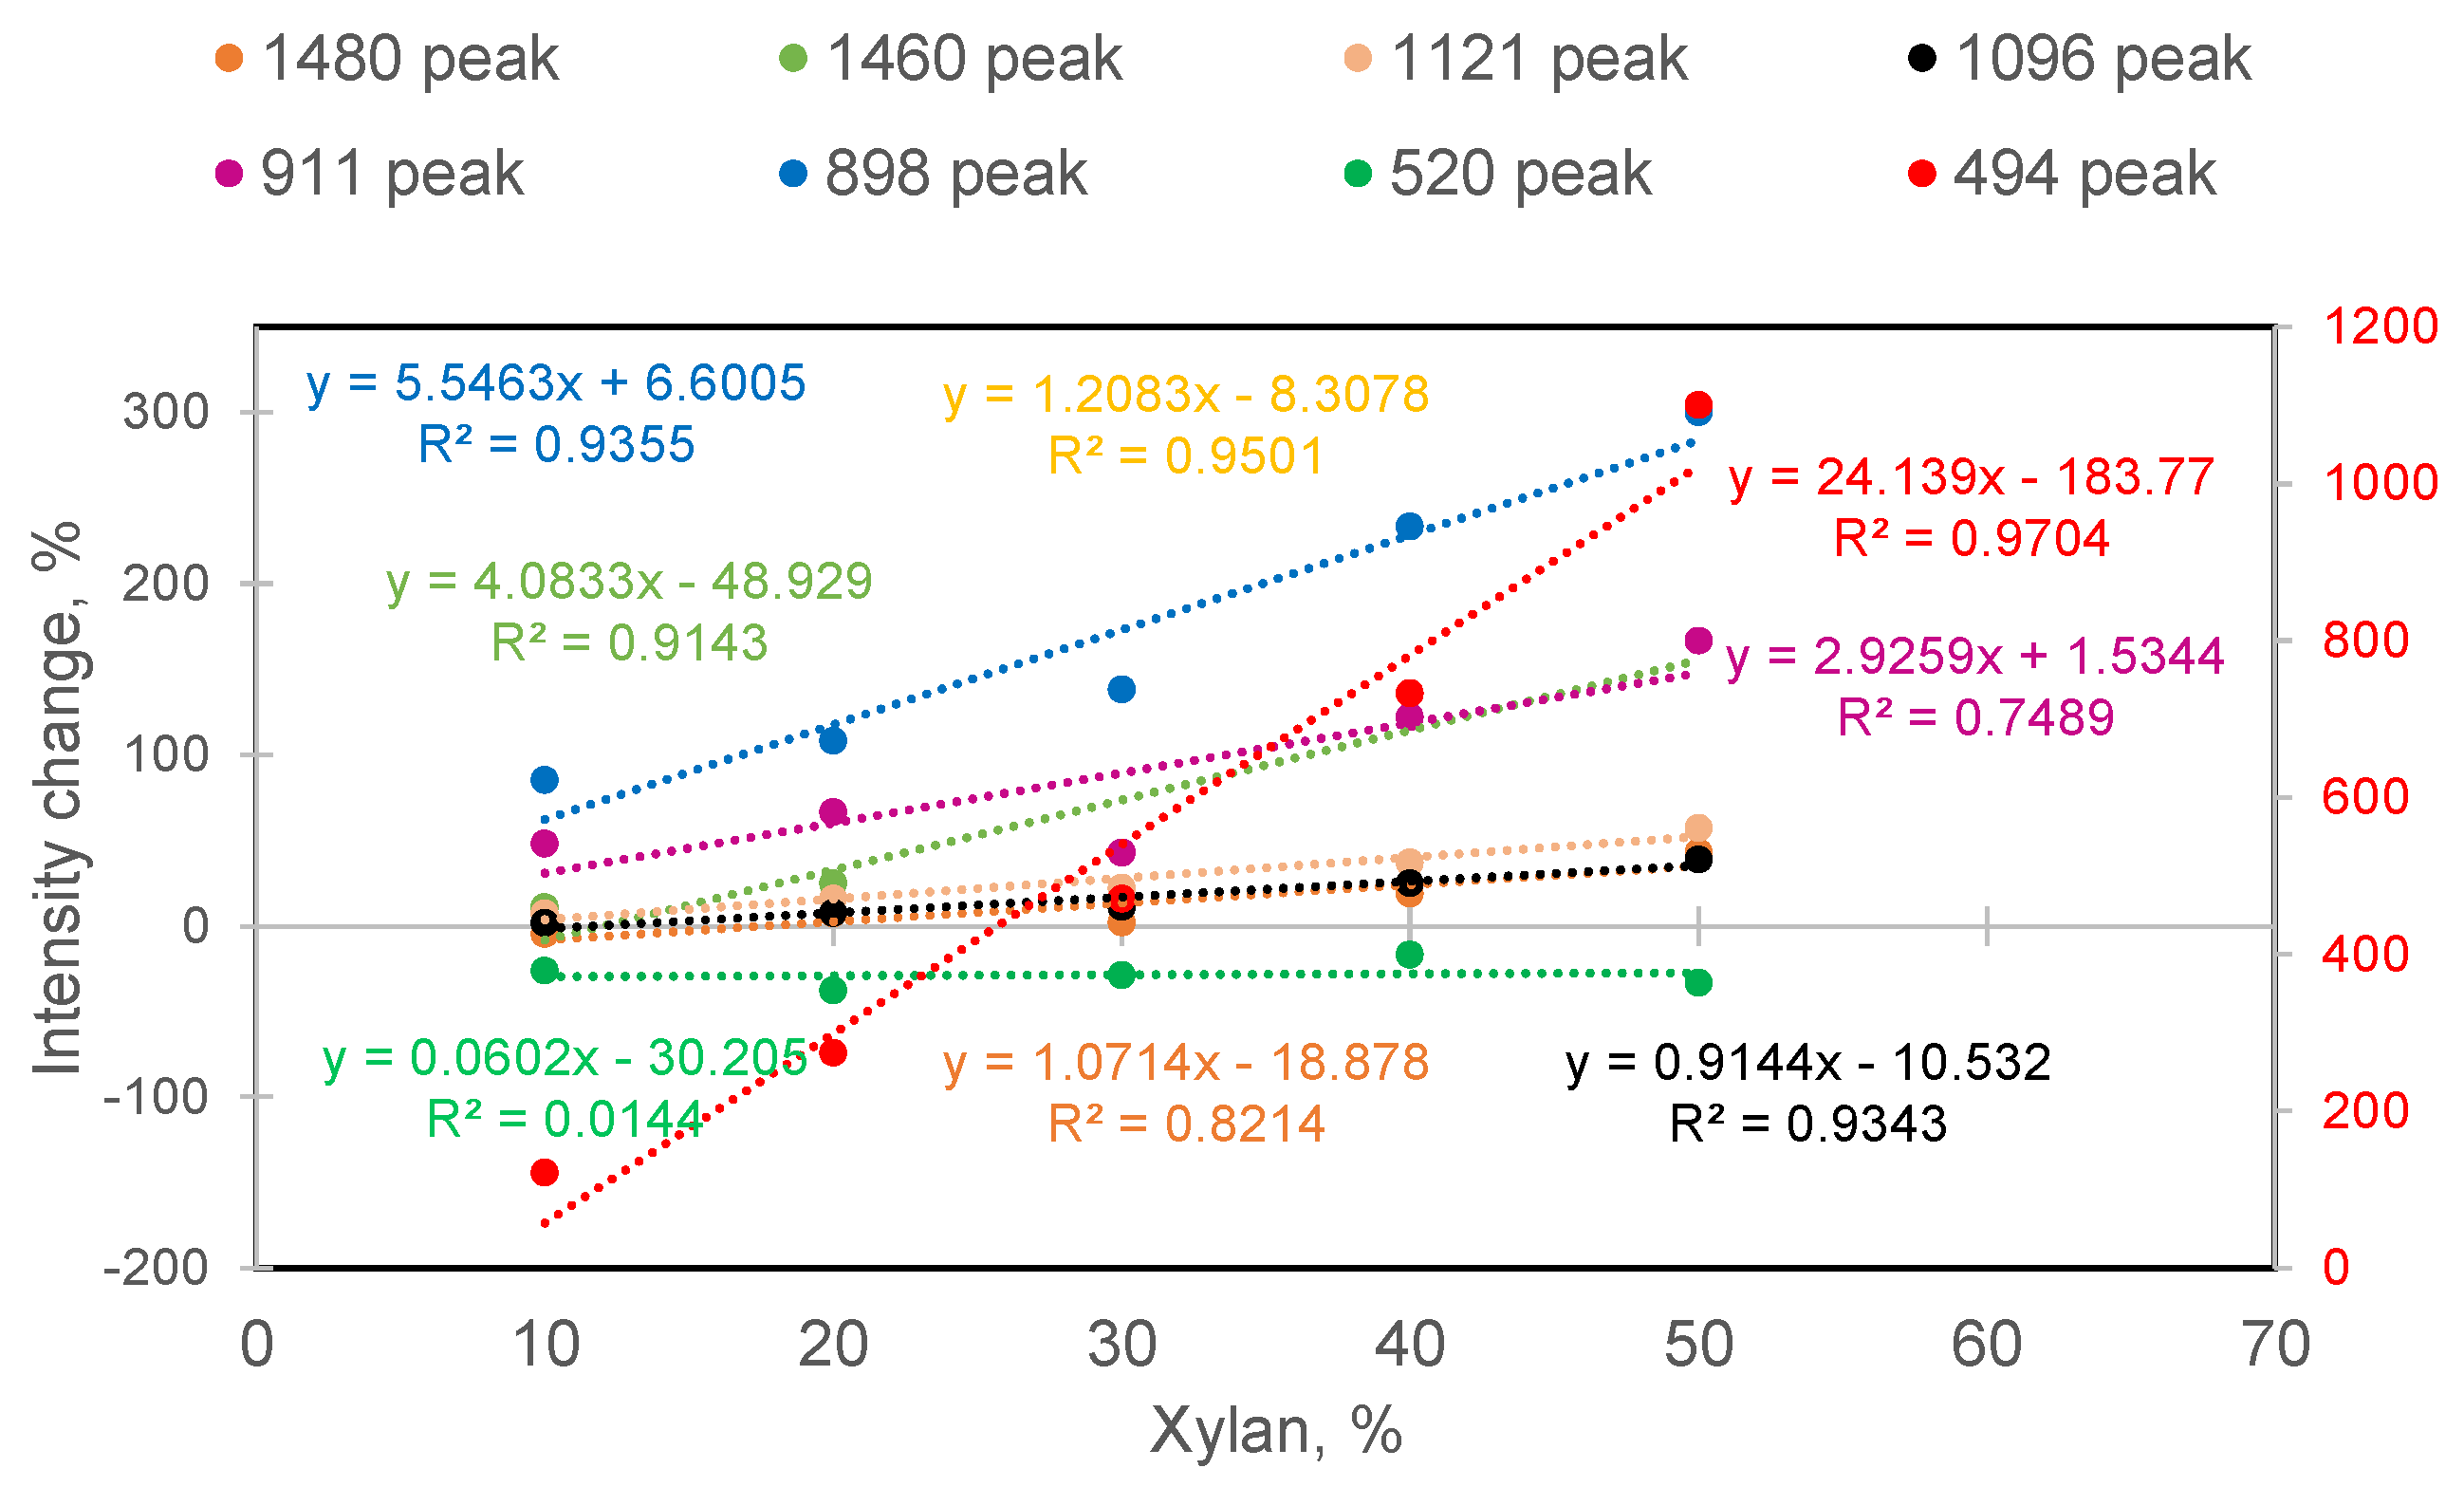
The results regarding the percent intensity changes with respect to the cellulose fraction in the mixture (%ΔIwavenumber, Equation (1)) are reported in Table 3. In these data, it is clear that when the band intensities of pure MCC at the fractions that existed in the mixtures (e.g., sample X4 in Table 3; x = 0.6; sample MCC fraction corresponds to 60%) were compared with their Raman intensities in the mixtures, for most of the MCC bands, the mixture intensities increased, and such increases correlated well with the xylan amounts in the mixtures ((Table 3) with an R2 between 0.97 and 0.75, as shown in Figure 4). For instance, % ΔI1460 increased from 11% to 167% (Table 3, samples X1 to X5). In contrast, the 520 cm−1 MCC peak showed a decline upon increasing the xylan content (Figure 4). Based on the data in Table 3, most of the decline occurred for sample X2 (xylan/MCC 20:80). This result can be rationalized as follows: Because of the additional presence of xylan in the mixtures, the 520 and 494 cm−1 peaks overlapped in a way that decreased the accuracy of the calculation of the former’s peak height (as described in the Materials and Methods section, a horizontal baseline under the band was drawn from 510 cm−1) (Figure 1; Table 3). On the other hand, due to xylan’s Raman contributions, the rest of the MCC band intensities increased to various degrees (Table 3, Figure 4). In summary, based on Figure 4, the order of the intensity changes (%) was as follows: ΔI494 > ΔI898 > ΔI911 > ΔI1460 > ΔI1480. Later, for fiber samples, this information was used to determine how xylan impacts the spectral intensities of cellulose.
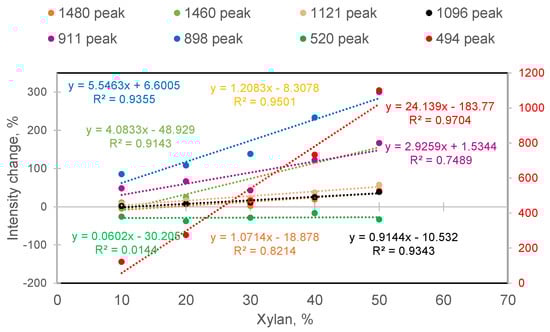
Figure 4.
Intensity changes (%) in bands of MCC with respect to its fractions in various mixture samples.
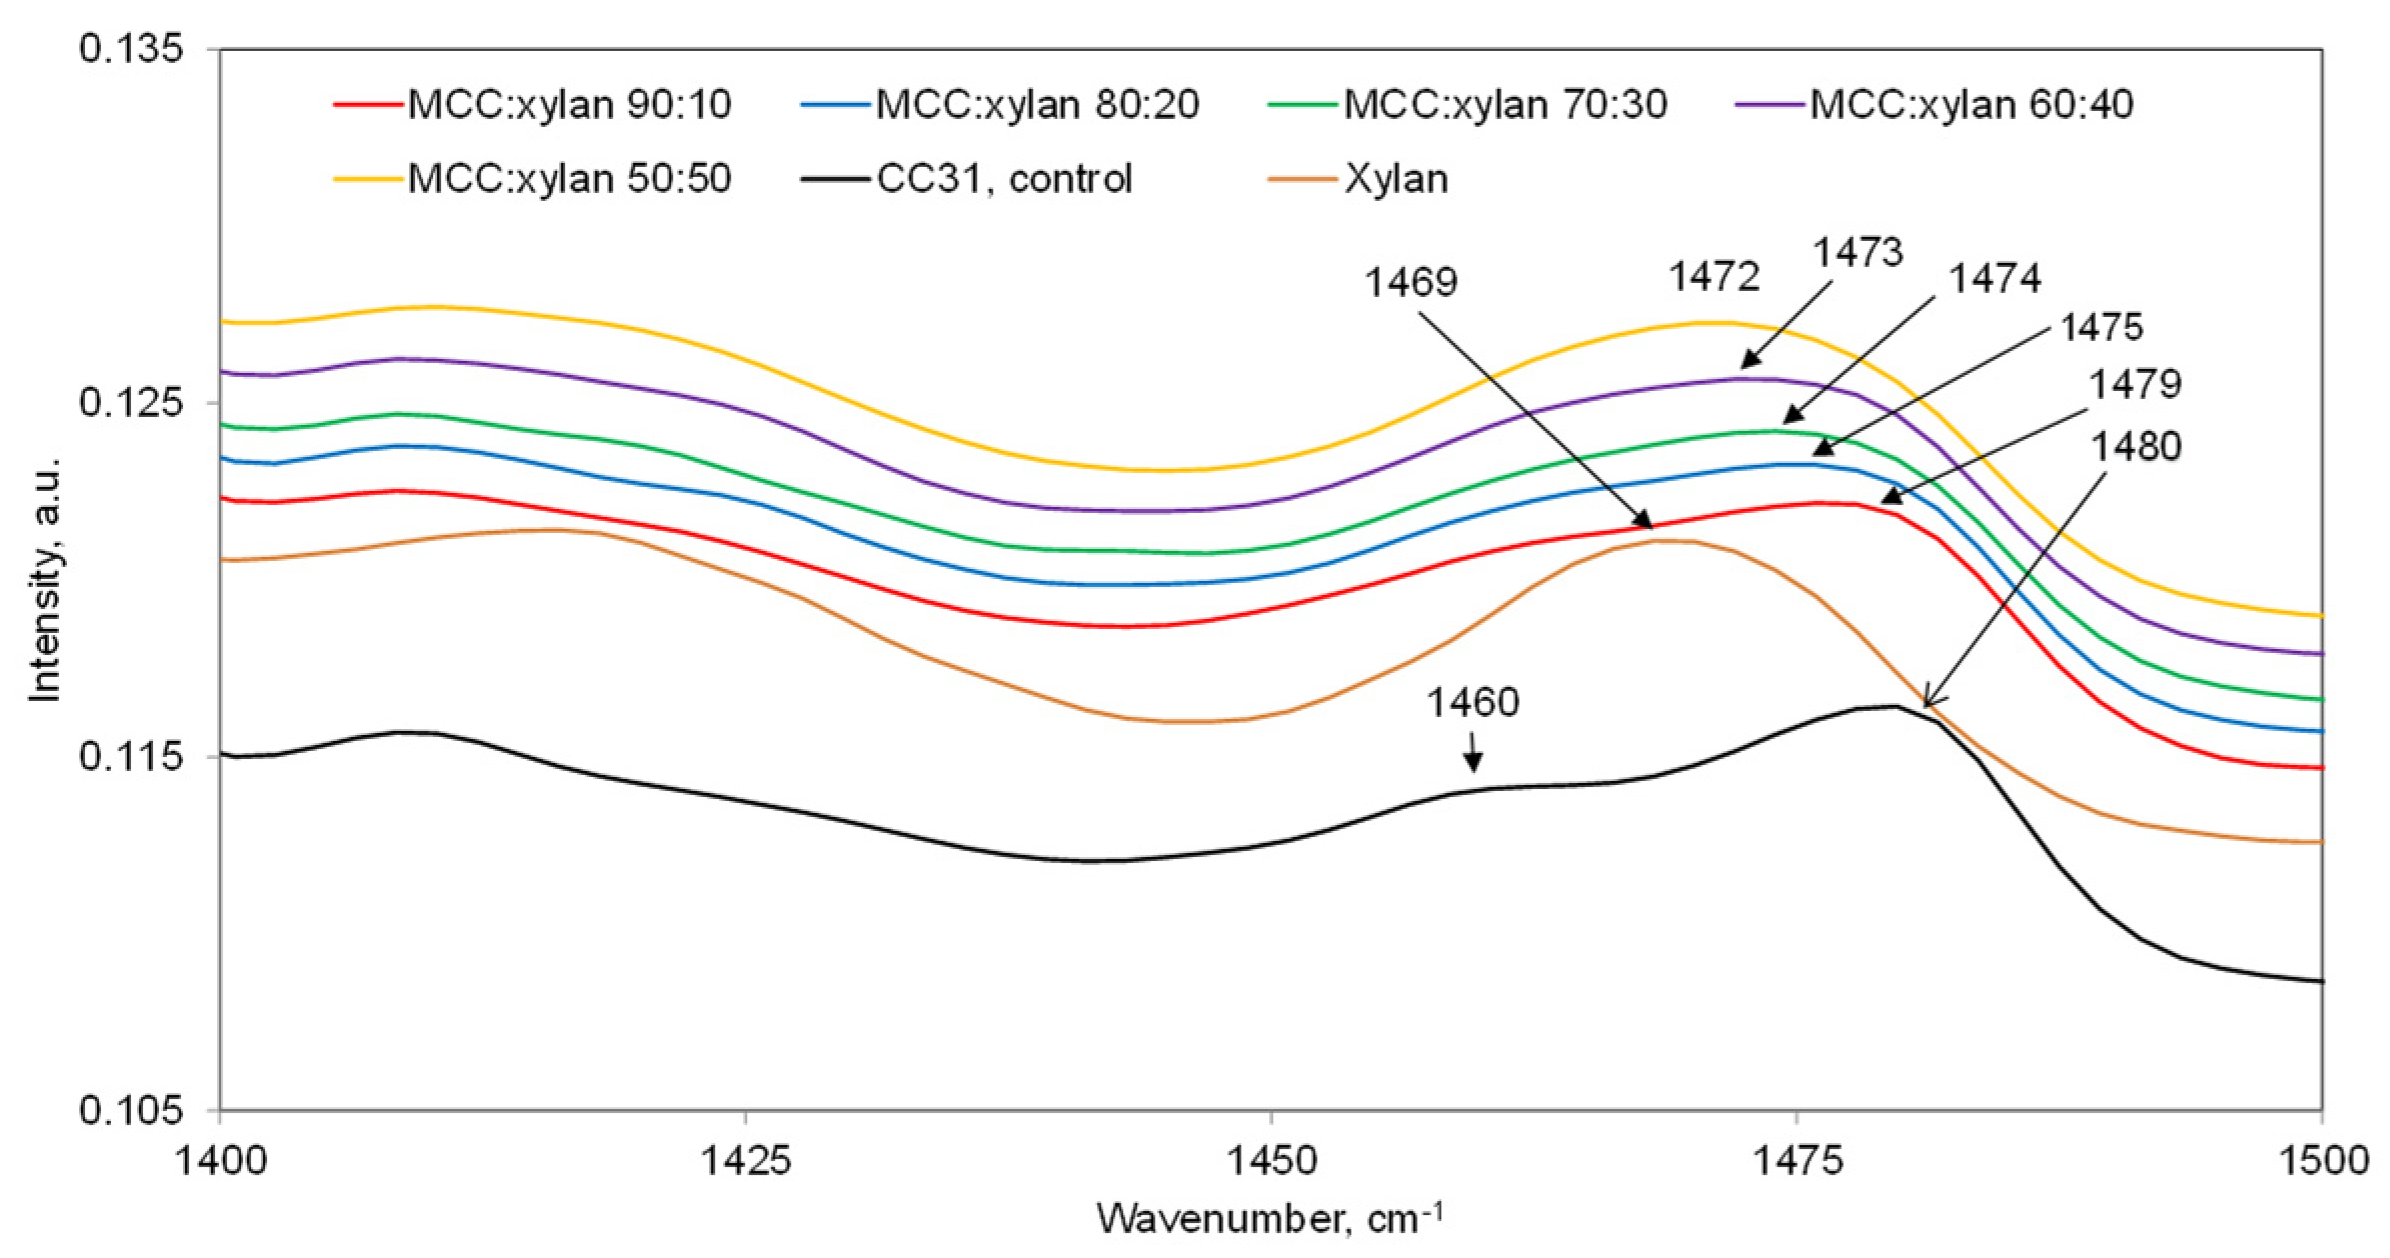
The other point to note is that in the region where the spectral features of the sample components significantly overlap, the band position of the mixture sample can undergo a shift. Usually, the shift depends upon both the initial intensities of the bands involved and the sample composition. This phenomenon is illustrated in Figure 5, where the 1400 to 1500 cm−1 region spectra of various mixture samples along with those of the two components (MCC and xylan) are shown. As can be noted, due to the band overlap, the pure MCC peak, originally located at 1480 cm−1, shifted to lower wavenumbers. In the case of the cellulose/xylan 50:50 sample, the peak shifted by 8 cm−1.
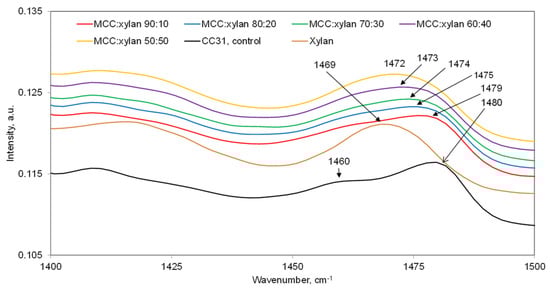
Figure 5.
Band positions of the samples of different compositions in the 1450–1500 cm−1 region.
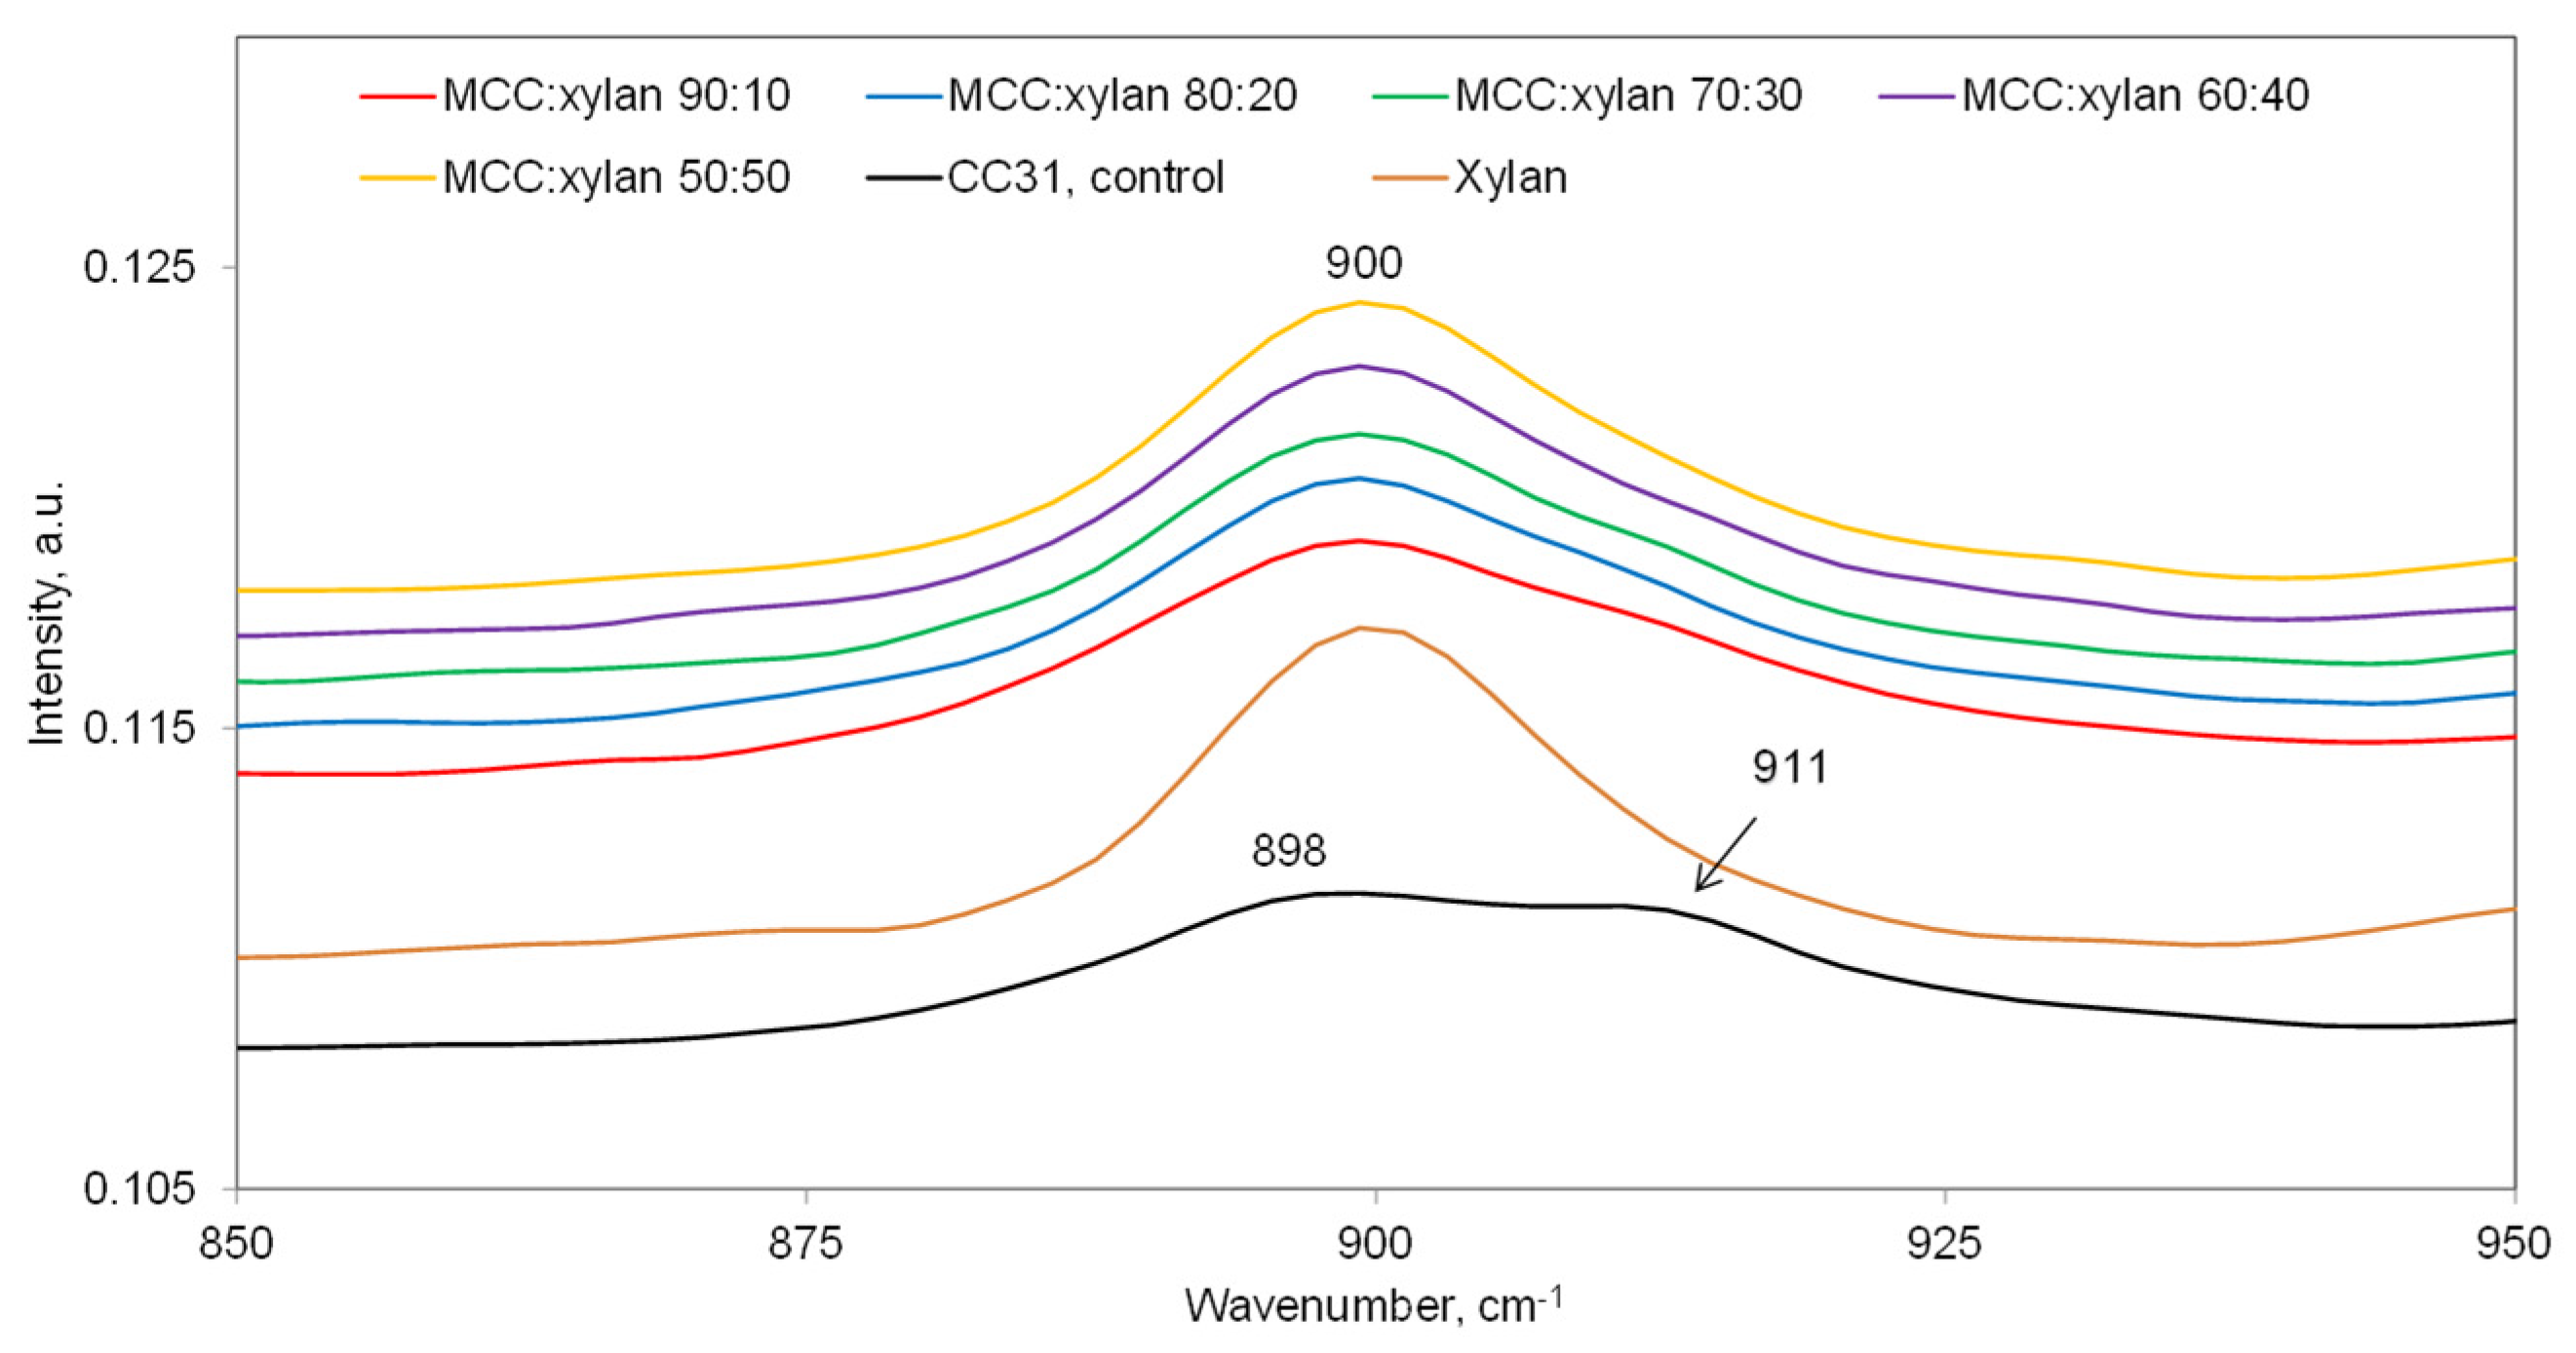
Another example of band overlap can be seen in the 900 cm−1 region, where MCC has two peaks (898 and 911 cm−1, Figure 6) and xylan only has one at 898 cm−1. Although the MCC shoulder at 911 cm−1 is still perceptible at a low xylan level (e.g., the MCC/xylan 80:20 sample), it fades at higher xylan levels (Figure 6). Moreover, contrary to the 1450–1550 cm−1 region situation that was discussed above, no significant shift in the 898 cm−1 MCC peak was observed because this peak is common to both MCC and xylan, and the MCC feature at 911 cm−1 is quite weak.
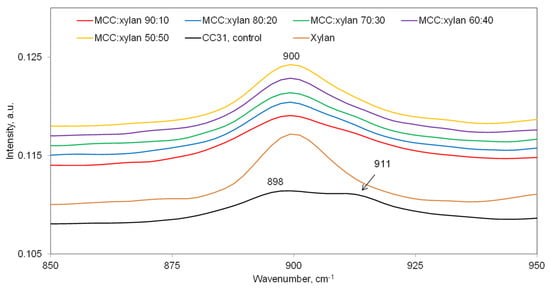
Figure 6.
Band profiles of the mixture samples and their components (MCC and xylan) in 900 cm−1 region.
4. Application to Fibers
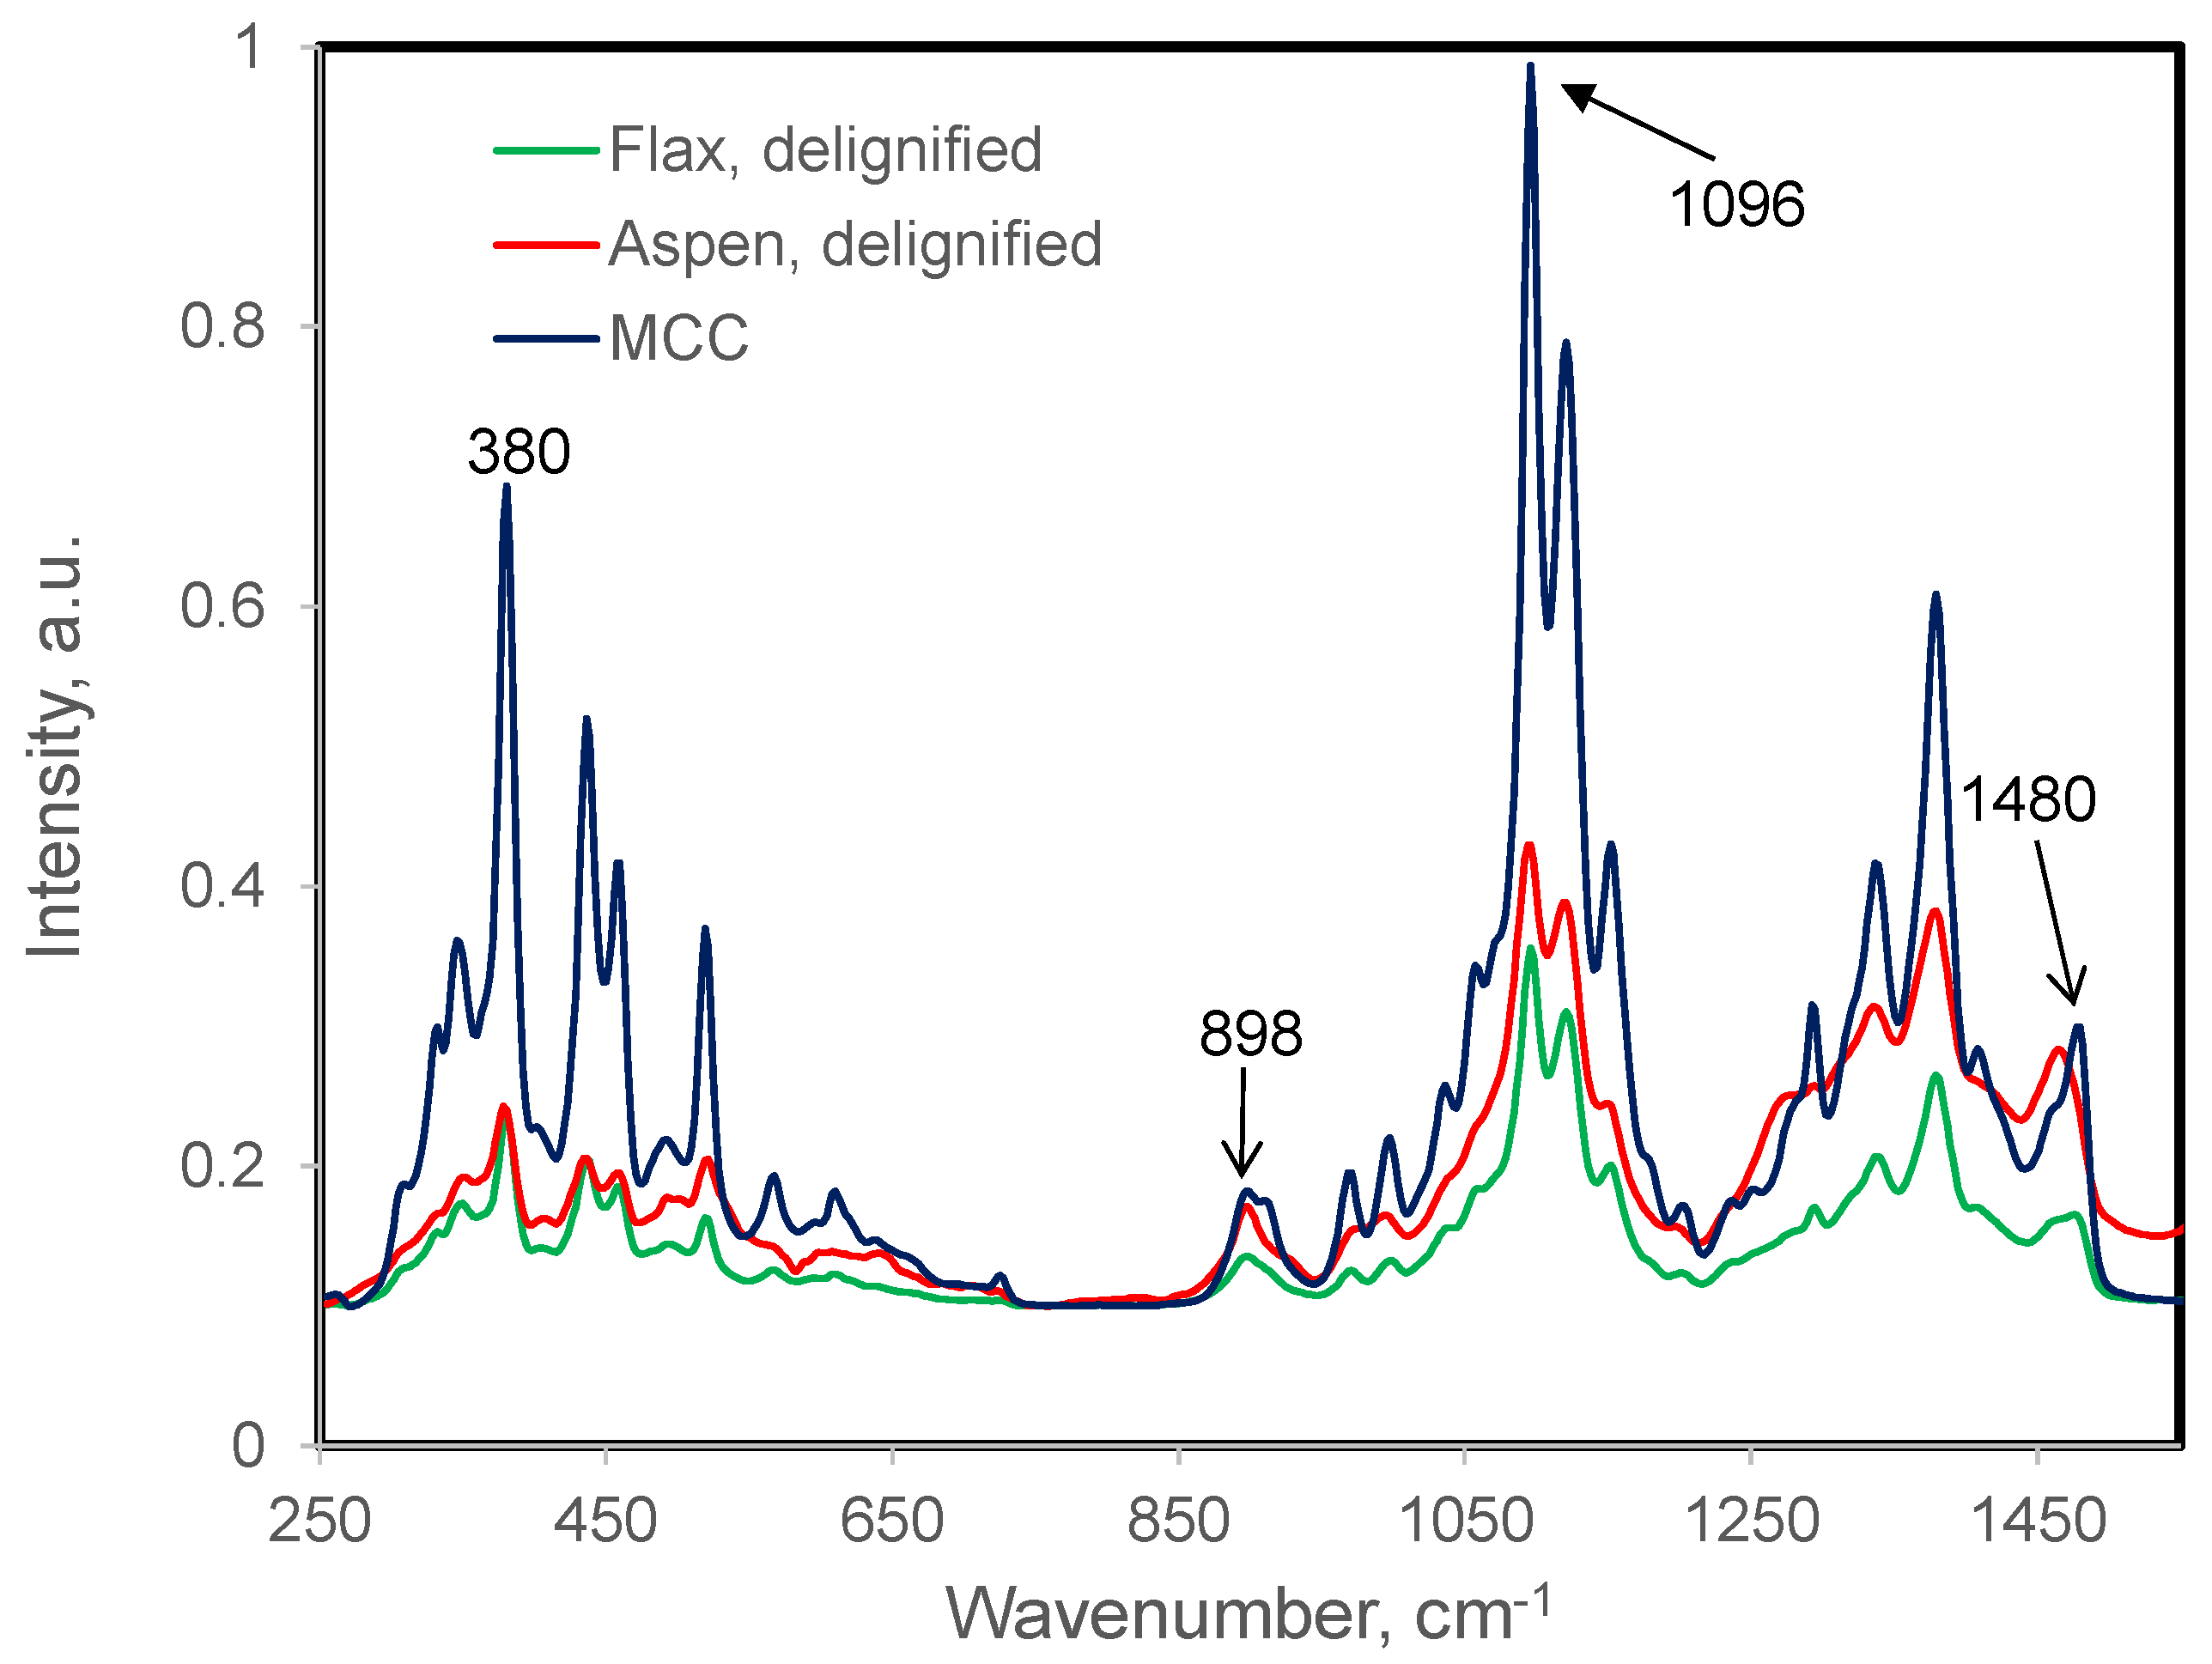
Raman spectra of the fibers were obtained under identical conditions and corrected by using an external standard (toluene). Therefore, the obtained band intensities can be compared directly. In Figure 7, the spectra of the two delignified plant fibers (flax and aspen) and MCC are compared. Moreover, the band intensities for these and other fiber samples are listed in Table 4. The intensities are not normalized for the differing content of glucan in the fibers (Table 1). When the data for MCC, flax, and aspen were compared (Table 1 and Table 4, Figure 7), the Raman features of MCC were found to be highly resolved and significantly more intense (e.g., compare band intensities I1480, I1121, I1096, and I520, Table 4). Even after accounting for the glucan-content differences between them, the MCC band intensities remained higher (Table 1 and Table 4). Moreover, this holds true even when the xylan contributions are present in the spectra (xylan’s presence increases many of these intensities). This is because unlike MCC, plant cellulose is significantly less crystalline. Therefore, in the following, to appraise the fibers’ spectra with respect to the contributions of xylan, instead of MCC, spectral data of delignified flax (which contains 79% cellulose and a 98.3:1.7 glucan/xylan ratio, Table 1) are used.
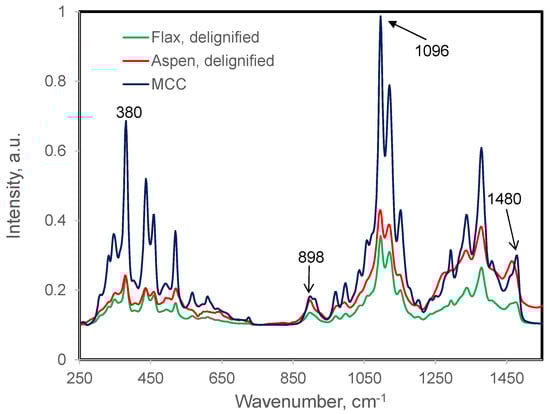
Figure 7.
Raman spectra of MCC, delignified aspen, and delignified flax.
Table 4.
Raman intensities of selected bands.
Comparing Band Intensities
Considering the Table 4 intensity data, for the non-MCC samples, the I1480 data are similar, and small variations among the low- and high-xylan samples (Table 1) can be understood in terms of the (a) xylan contributions at 1480 cm−1 (Figure 5) and the fact that (b), in higher cellulose samples, a greater contribution is made by cellulose (i.e., delignified flax and HWBKP, Table 1 and Table 4). Next, considering the I1460 data, the intensities for flax and HWBKP were lower than the rest of the fiber samples. This is likely to be because between the two bands of MCC at 1480 and 1460 cm−1, the latter is significantly weaker (Figure 5), and even though these two samples have higher amounts of cellulose, this fact does not fully compensate for the lower amount of xylan, which also contributes here (Figure 5). However, in the rest of the fiber samples, compared to flax, xylan’s contribution at 1460 cm−1 is higher. In contrast, in the fibers, the Raman intensities I1121 and I1096 did not vary all that much; therefore, at these wavenumbers, the contributions from cellulose are predominant. The other bands in the fibers’ spectra (Figure 8) that showed higher Raman intensities when a significant amount of xylan was present were 911, 898, and 494 cm−1 (Table 4). Compared to delignified flax (1.34% xylan, Table 1), the I911, I898, and I494 were higher by at least 1.5, 1.7, and 3 times, respectively (Table 4). As mentioned above, such increases are in accordance with the prediction (ΔI494 > ΔI898 > ΔI911 > ΔI1460 > ΔI1480, Table 3) that was based upon the analysis of the MCC and xylan mixtures (Figure 4). The highest increase was observed at 494 cm−1 (Figure 9, Table 4), which is in accordance with the expectation that, in the Raman spectrum of xylan, this is one of the strongest peaks (Figure 1, Table 2).
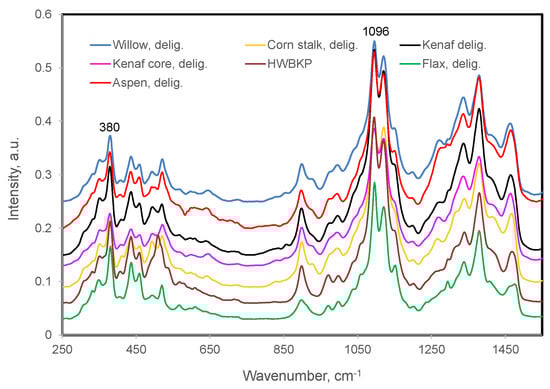
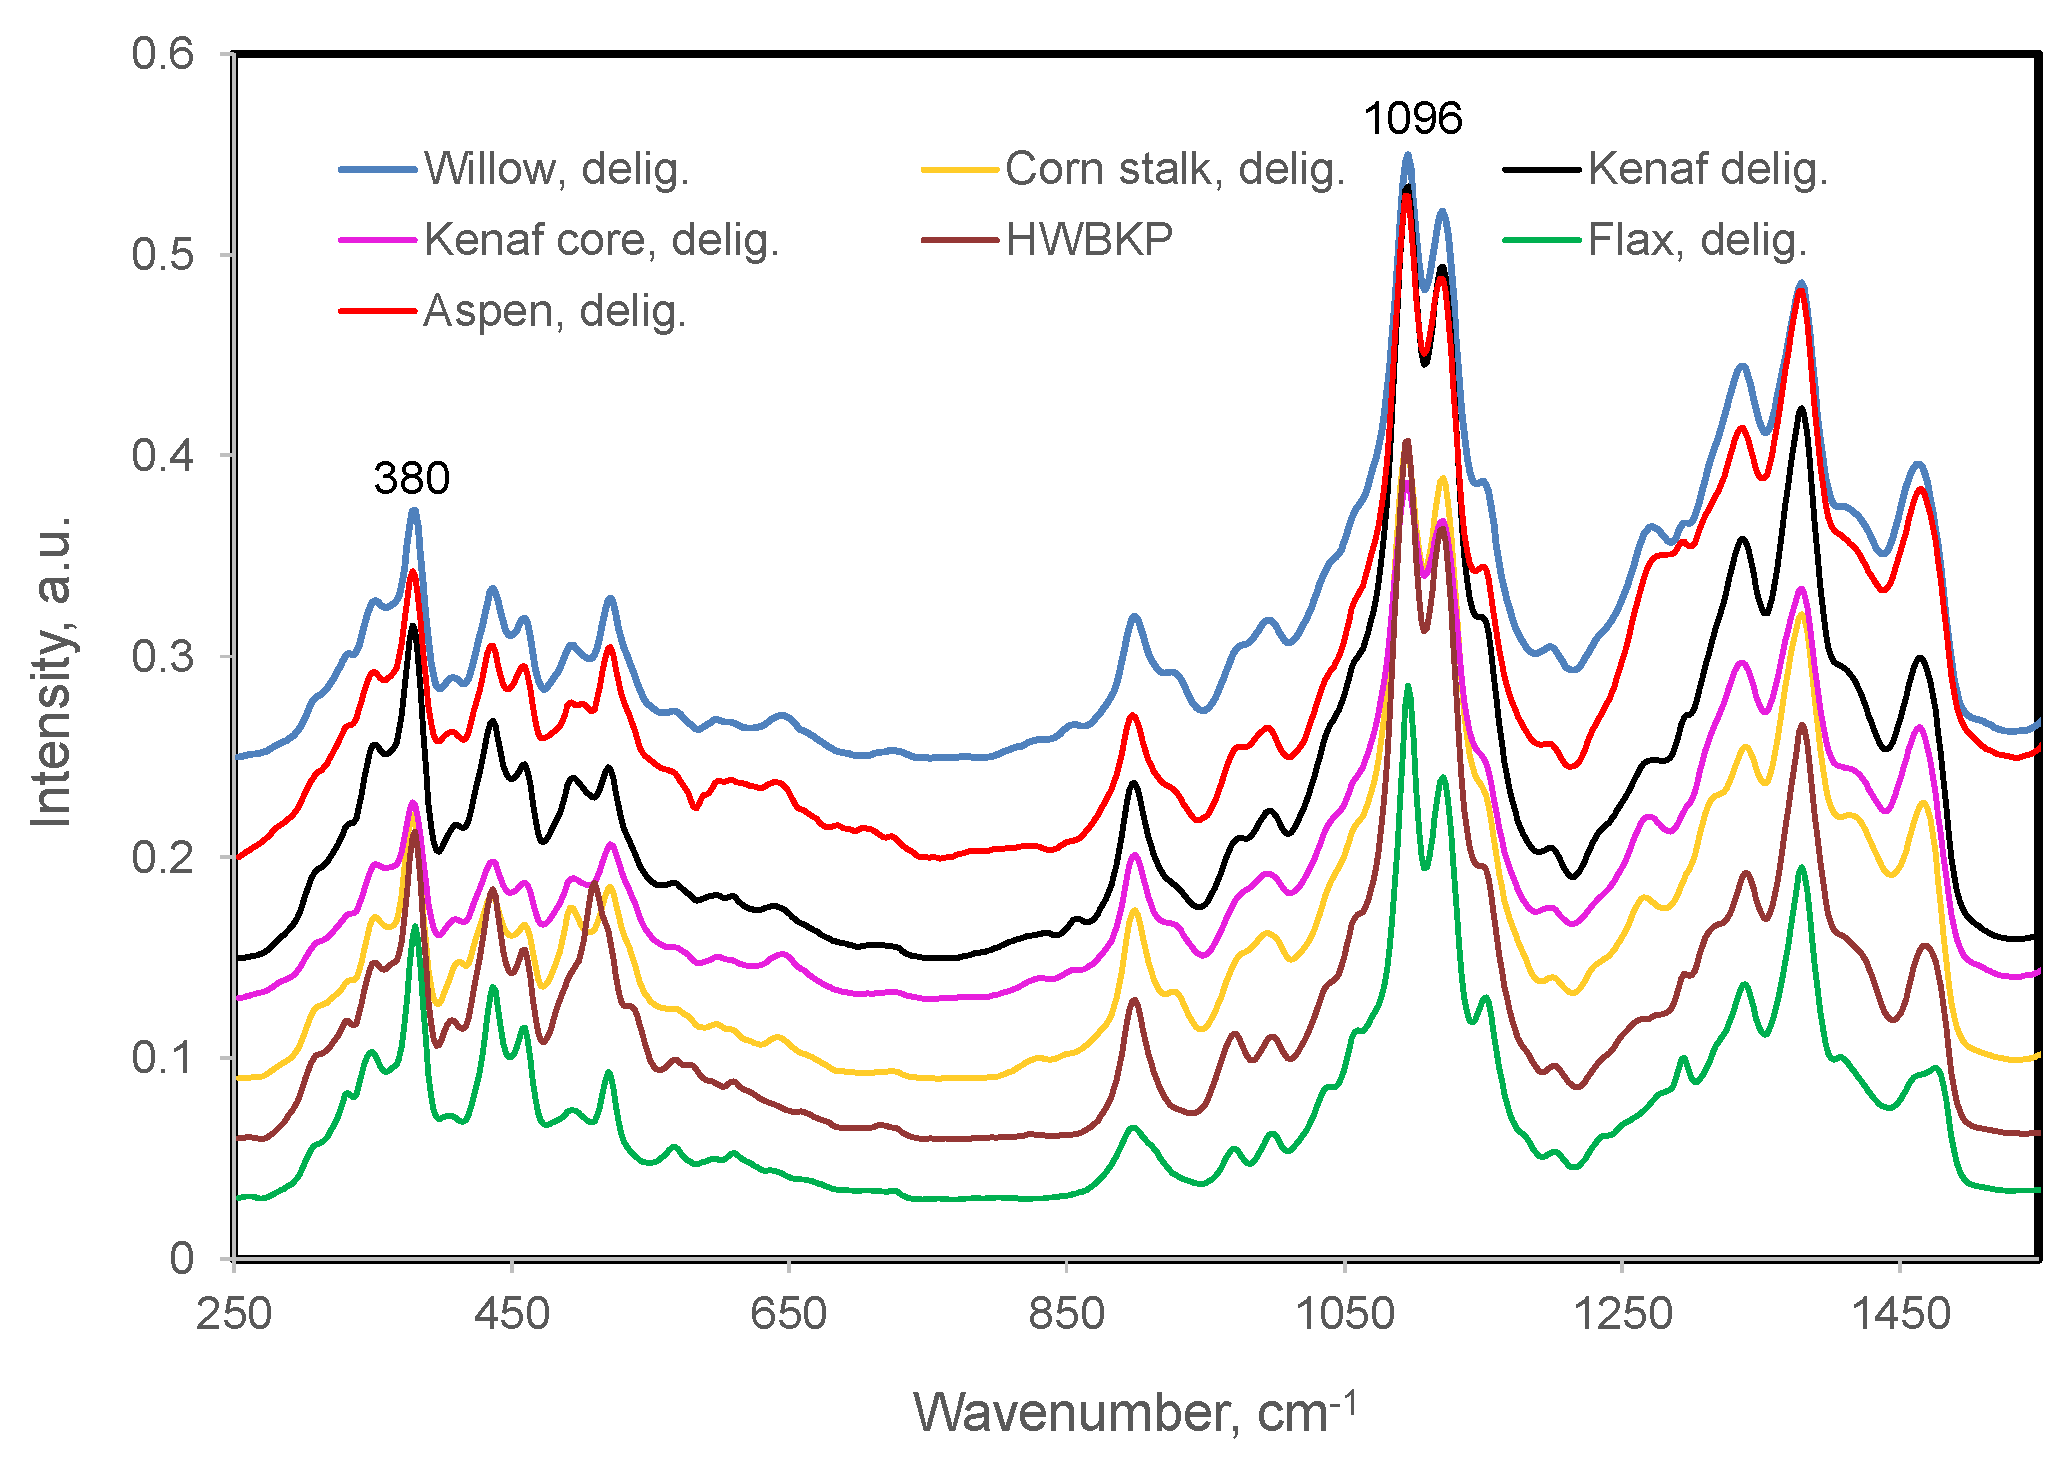
Figure 8.
Raman spectra of various plant fibers.
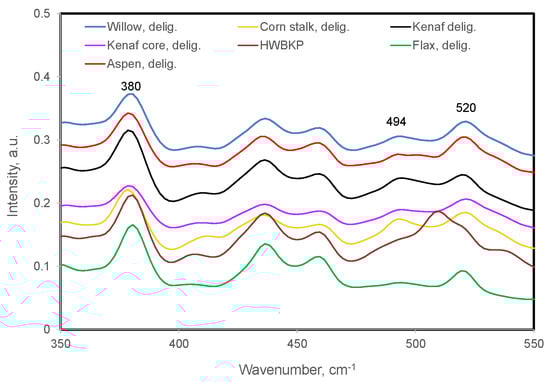
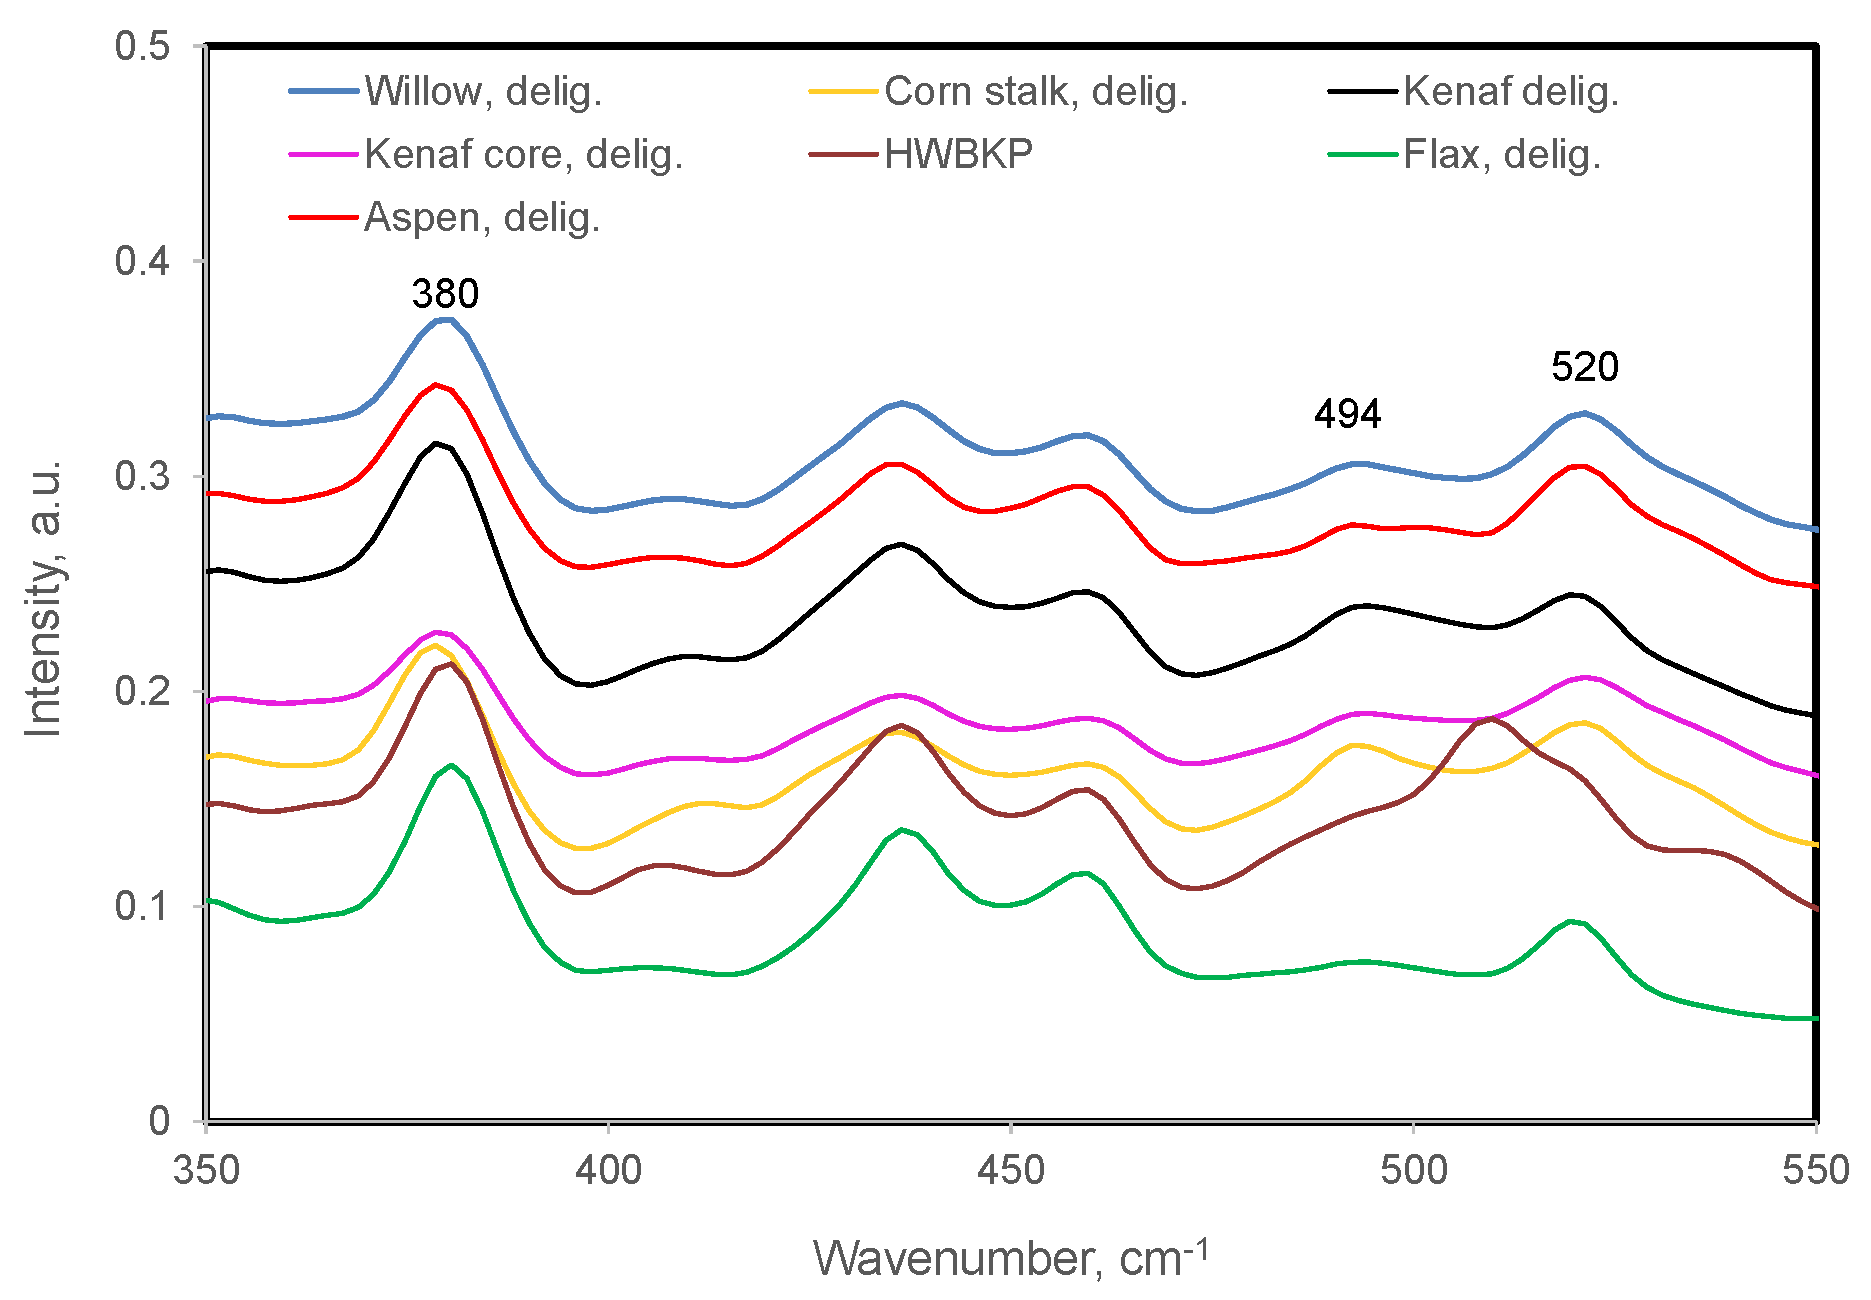
Figure 9.
Raman spectra of plant fibers: comparison of 494 cm−1 bands attributed to xylan.
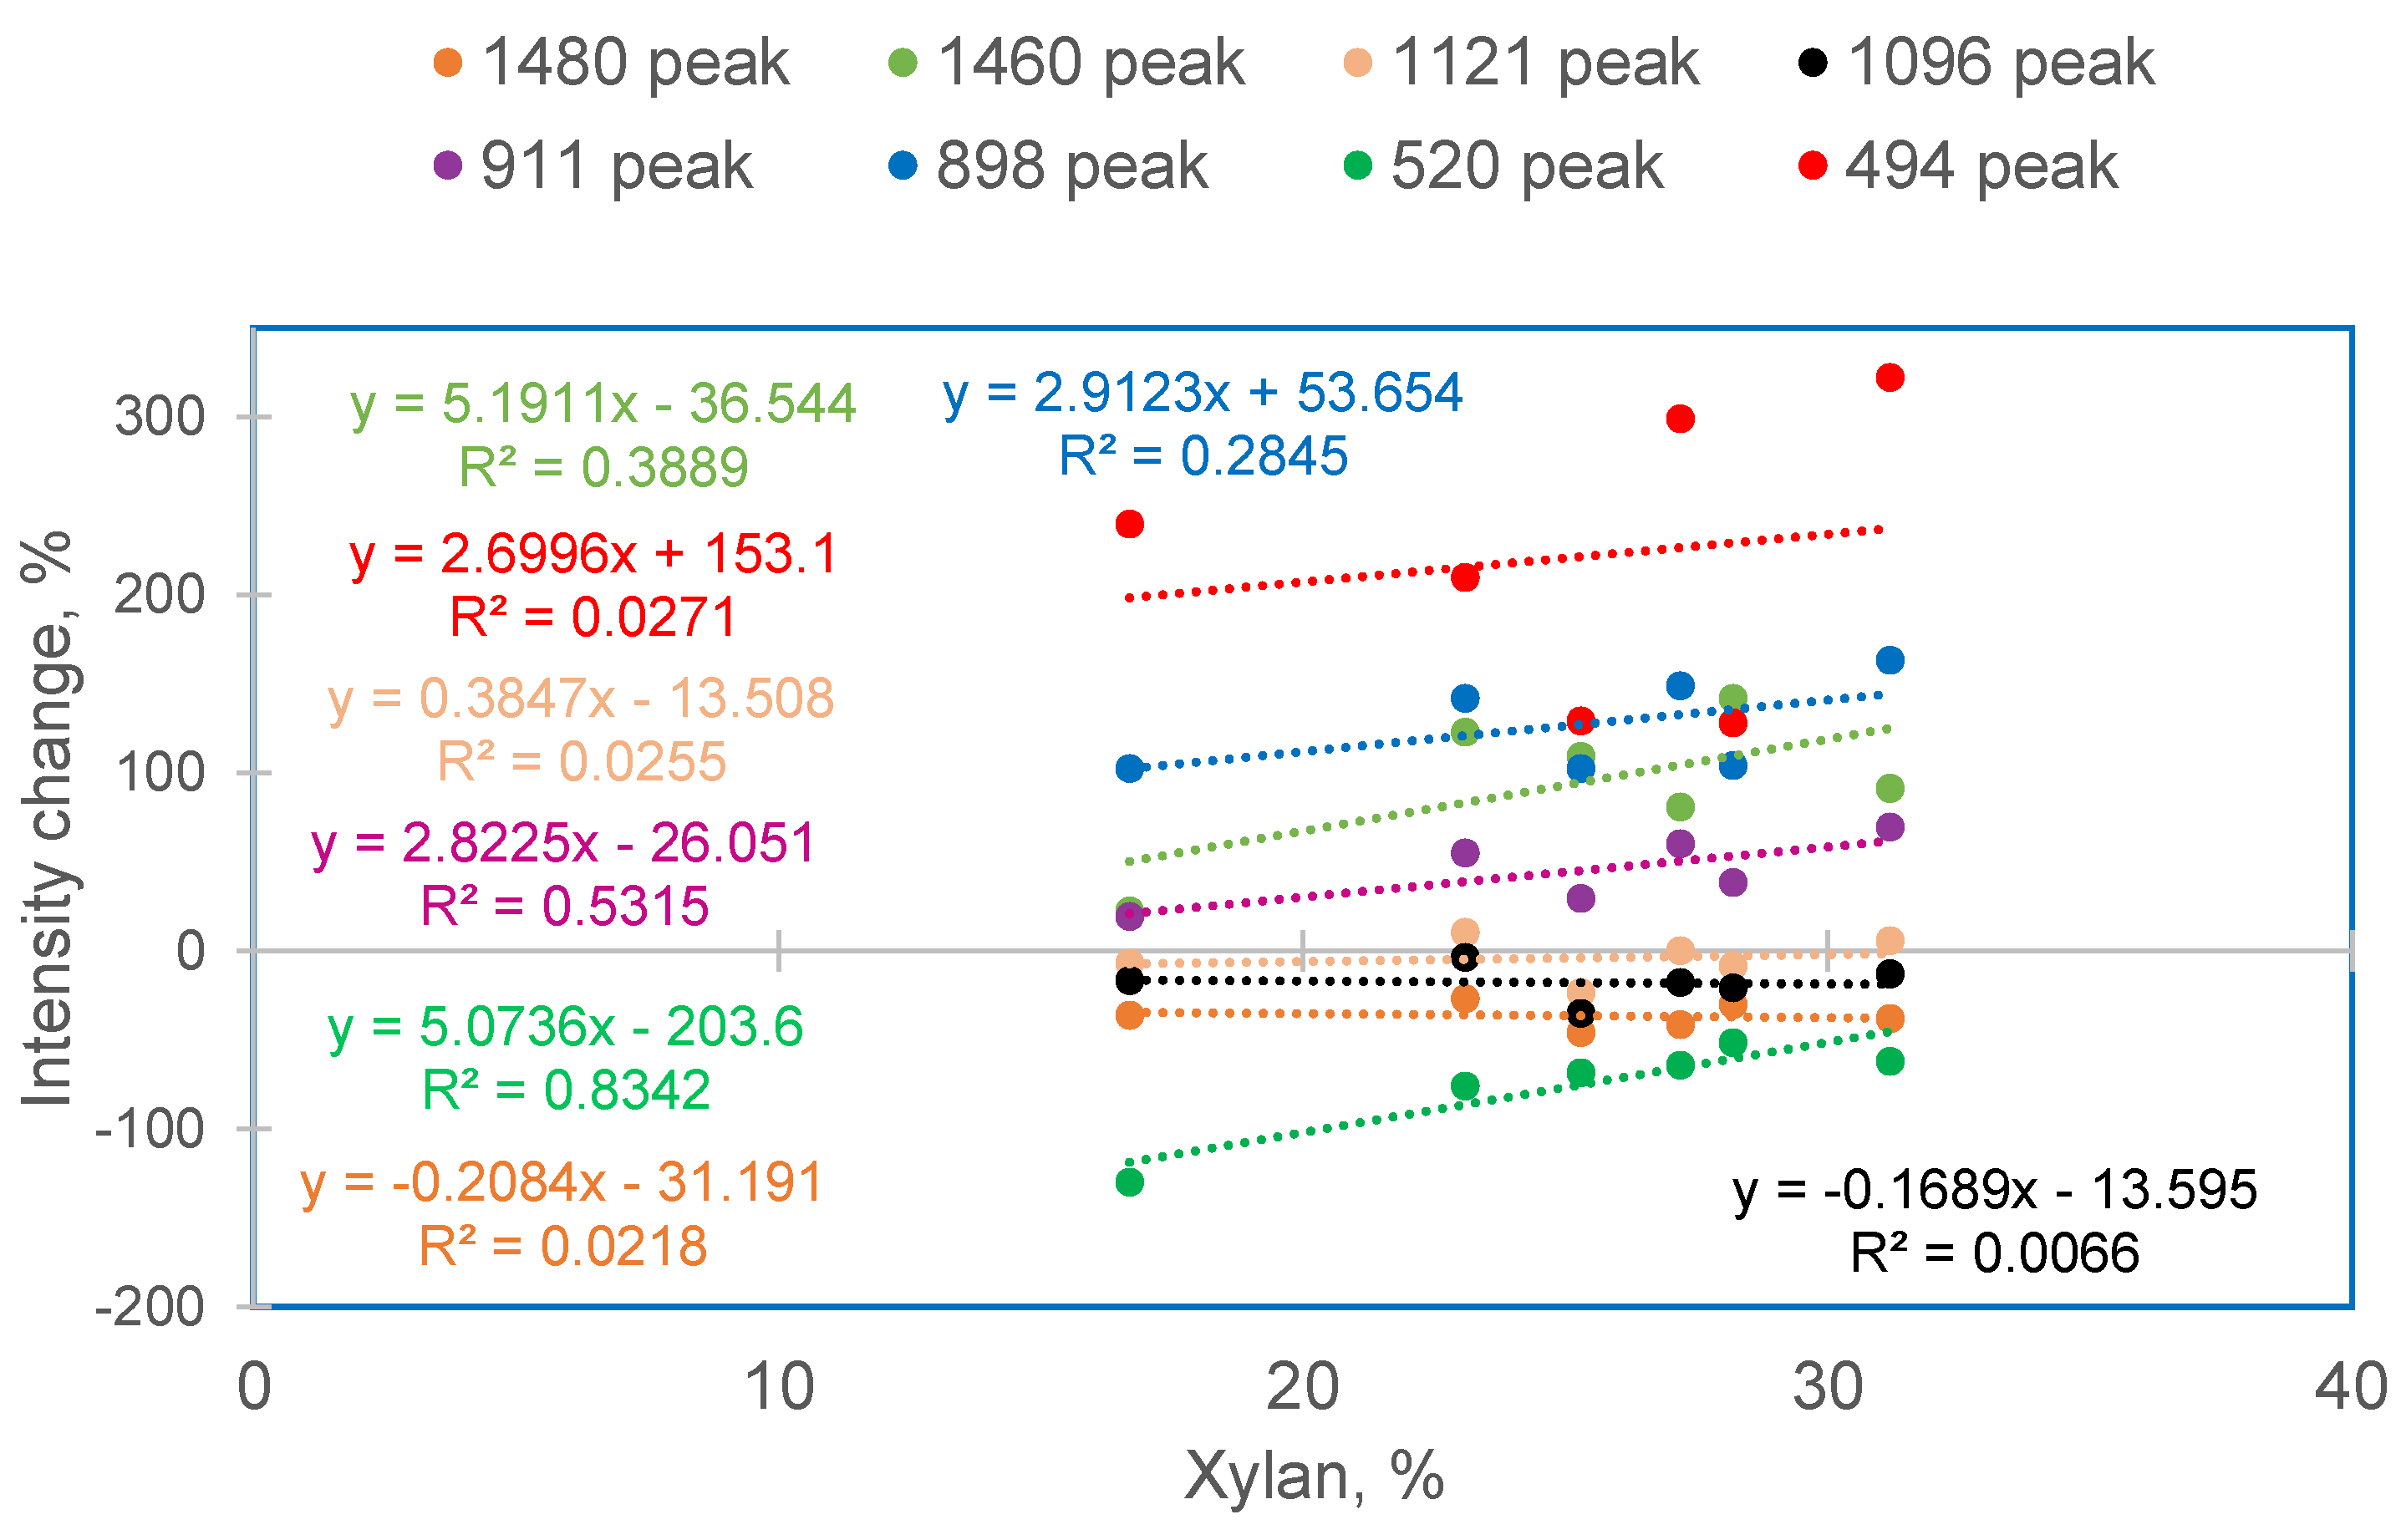
In Figure 10, % intensity changes in the spectra of the fibers are plotted based on Equation (1), wherein these changes are calculated relative to the delignified-flax cellulose content instead of MCC (Table 4). Although, as expected, with an increasing xylan content, the %-intensity-changes increased at 1460, 911, 898, and 494 cm−1 (ΔI494 > ΔI898 > ΔI1460 > ΔI911); for these bands, the linear regression was not good (R2 between 0.03 to 0.53; Figure 10). Presently, there is no explanation for this; however, differences between the fibers—not only between the supramolecular structures of celluloses but also between xylan’s chemical structures [29]––are two potential explanations. A poor linear correlation with increased xylan content was also seen for the bands at the 1480, 1121, and 1096 cm−1 peaks (with an R2 between 0.007 and 0.026, Figure 10). The reason for this is likely to be that, with an increased xylan content, the intensity changes at these locations are low, as was observed earlier in the case of the MCC–xylan mixtures (Figure 4 and Table 3). Lastly, compared to delignified flax, as expected, the 520 cm−1 peak’s intensity was lower in all cases because less cellulose was present. Nevertheless, with an increased amount of xylan, the extent of the decline was reduced (Figure 10). The explanation for this seems to be that there is a tailing contribution appearing at 520 cm−1 from the neighboring xylan peak at 494 cm−1 (Figure 9).
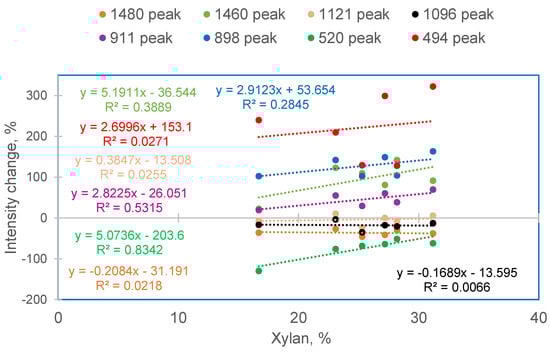
Figure 10.
Intensity changes (%) in Raman bands with respect to their flax-cellulose fraction in various plant fibers.
5. Conclusions
To better understand the Raman spectra of plant fibers and other cellulosic biomasses, the spectra of samples made from the mixture of microcrystalline cellulose (MCC) and xylan were investigated. It was found that in spectral regions where contributions from both MCC and xylan were present, the cellulose spectrum was modified significantly. With increased xylan content, the sample peak intensities increased at 1460, 898, and 494 cm−1 and declined at 1480, 1121, 1096, and 520 cm−1. Such modifications depended on the compositions of the mixture samples as well as the band intensities of the overlapping spectral features of the components. This information was then used to interpret spectra of xylan-containing wood and plant fibers, and it was shown that the most affected cellulose peaks were 1480, 1460, 911, 898, and 494 cm−1. This work shows how the Raman spectra of the selected delignified fibers, which are mainly composites of cellulose and xylan, can be resolved and understood in terms of the spectra of their components. It is hoped that the insights obtained will be useful for the better interpretation of the spectra of plant materials.
Author Contributions
Author contributions: U.P.A. carried out conceptualization, methodology, and all the analysis work. He also wrote the entire manuscript. S.A.R. carried out many of the experiments and reviewed the manuscript draft. All authors have read and agreed to the published version of the manuscript.
Funding
No external funding was received for carrying out this study.
Data Availability Statement
The data presented in this study are available on request from the corresponding author.
Conflicts of Interest
The authors declare no competing financial interests.
References
- Han, J.S.; Rowell, J.S. Chemical Composition of Fibers. In Paper and Composites from Agro-Based Resources; Rowell, R.M., Young, R.A., Rowell, J.K., Eds.; CRC Press Inc.: Boca Raton, FL, USA, 1997; pp. 83–134. [Google Scholar]
- Albersheim, P.; Darvill, A.; Roberts, K.; Sederof, R.; Staehelin, A. Plant Cell Walls: From Chemistry to Biology, 1st ed.; Garland Science: New York, NY, USA, 2010. [Google Scholar]
- Terrett, O.M.; Dupree, P. Covalent interactions between lignin and hemicelluloses in plant secondary cell walls. Curr. Opin. Biotechnol. 2019, 56, 97–104. [Google Scholar] [CrossRef] [PubMed]
- Park, Y.B.; Cosgrove, D.J. Xyloglucan and its interactions with other components of the growing cell wall. Plant Cell Physiol. 2015, 56, 180–194. [Google Scholar] [CrossRef] [PubMed]
- Berglund, J.; Mikkelsen, D.; Flanagan, B.M.; Dhital, S.; Gaunitz, S.; Henriksson, G.; Lindström, M.E.; Yakubov, G.E.; Gidley, M.J.; Francisco Vilaplana, F. Wood hemicelluloses exert distinct biomechanical contributions to cellulose fibrillar networks. Nat. Commun. 2020, 11, 4692. [Google Scholar] [CrossRef] [PubMed]
- Salmén, L. On the organization of hemicelluloses in the wood cell wall. Cellulose 2022, 29, 1349–1355. [Google Scholar] [CrossRef]
- Terrett, O.M.; Lyczakowski, J.J.; Yu, L.; Iuga, D.; Franks, W.T.; Brown, S.P.; Dupree, R.; Dupree, P. Molecular architecture of softwood revealed by solid-state NMR. Nat. Commun. 2019, 10, 4978. [Google Scholar] [CrossRef] [PubMed]
- Pękala, P.; Szymańska-Chargot, M.; Zdunek, A. Interactions between non-cellulosic plant cell wall polysaccharides and cellulose emerging from adsorption studies. Cellulose 2023, 30, 9221–9239. [Google Scholar] [CrossRef]
- Spönla, E.; Rahikainen, J.; Potthast, A.; Grönqvist, S. High consistency enzymatic pretreatment of eucalyptus and softwood kraft fibres for regenerated fibre products. Cellulose 2023, 30, 4609–4622. [Google Scholar] [CrossRef]
- Wollboldt, R.P.; Zuckersta¨tter, G.; Weber, H.K.; Larsson, P.T.; Sixta, H. Accessibility, reactivity, and supramolecular structure of E. globulus pulps with reduced xylan content. Wood Sci. Technol. 2010, 44, 533–546. [Google Scholar] [CrossRef]
- Agarwal, U.P. 1064 nm FT-Raman spectroscopy for investigations of plant cell walls and other biomass materials. Front. Plant Sci. 2014, 5, 490. [Google Scholar] [CrossRef]
- Lupoi, J.S.; Singh, S.; Simmons, B.A.; Henry, R.J. Assessment of Lignocellulosic Biomass Using Analytical Spectroscopy: An Evolution to High-Throughput Techniques. BioEnergy Res. 2014, 7, 1–23. [Google Scholar] [CrossRef]
- Gierlinger, N. New Insights into Plant Cell Walls by Vibrational Microspectroscopy. Appl. Spectrosc. Rev. 2018, 53, 517–551. [Google Scholar] [CrossRef]
- Agarwal, U.P. Analysis of Cellulose and Lignocellulose Materials by Raman Spectroscopy: A Review of the Current Status. Molecules 2019, 24, 1659. [Google Scholar] [CrossRef] [PubMed]
- Agarwal, U.P.; Ralph, S.A. FT-Raman Spectroscopy of Wood: Identifying contributions of lignin and carbohydrate polymers in the spectrum of black spruce (Picea mariana). Appl. Spectrosc. 1997, 51, 1648–1655. [Google Scholar] [CrossRef]
- Himmelsbach, D.S.; Akin, D.E. Near-Infrared Fourier-Transform Raman Spectroscopy of Flax (Linum usitatissimum L.) Stems. J. Agric. Food Chem. 1998, 46, 991–998. [Google Scholar] [CrossRef]
- Agarwal, U.P.; Reiner, R.S.; Ralph, S.A. Estimation of cellulose crystallinity of lignocelluloses using near-IR FT-Raman spectroscopy and comparison of the Raman and Segal-WAXS methods. J. Agric. Food Chem. 2013, 61, 103–113. [Google Scholar] [CrossRef] [PubMed]
- Wei, D.; Chen, S.; Liu, Q. Review of fluorescence suppression techniques. Appl. Spectro. Rev. 2015, 50, 387–406. [Google Scholar] [CrossRef]
- Agarwal, U.P. Raman imaging to investigate ultrastructure and composition of plant cell walls: Distribution of lignin and cellulose in black spruce wood (Picea mariana). Planta 2006, 224, 1141–1153. [Google Scholar] [CrossRef]
- Kanbayashi, T.; Kataoka, Y.; Ishikawa, A.; Matsunaga, M.; Kobayashi, M.; Kiguchi, M. Depth profiling of photodegraded wood surfaces by confocal Raman microscopy. J. Wood Sci. 2018, 64, 169. [Google Scholar] [CrossRef]
- Saletnik, A.; Saletnik, B.; Puchalski, C. Overview of popular techniques of Raman spectroscopy and their potential in the study of plant tissues. Molecules 2021, 26, 1537. [Google Scholar] [CrossRef]
- Agarwal, U.P.; McSweeny, J.D.; Ralph, S.A. FT–Raman Investigation of Milled-wood Lignins: Softwood, hardwood, and chemically modified black spruce lignins. J. Wood Chem. Technol. 2011, 17, 324–344. [Google Scholar] [CrossRef]
- Schenzel, K.; Fischer, S.; Brendler, E. New method for determining the degree of cellulose I crystallinity by means of FT Raman spectroscopy. Cellulose 2005, 12, 223–231. [Google Scholar] [CrossRef]
- Agarwal, U.P.; Ralph, S.A.; Reiner, R.S.; Baez, C. New cellulose crystallinity estimation method that differentiates between organized and crystalline phases. Carbohydr. Poly. 2018, 190, 262–270. [Google Scholar] [CrossRef] [PubMed]
- Browning, B.L. Methods of Wood Chemistry; Wiley-Interscience: New York, NY, USA, 1967; Volume II. [Google Scholar]
- TAPPI Test Method. In Acid Insoluble Lignin in Wood and Pulp; Official Test Method T-222 (Om); TAPPI: Atlanta, GA, USA, 1983.
- Davis, M.W. A rapid method for compositional carbohydrate analysis of lignocellulosics by high pH anion-exchange chromatography with pulse amperometric detection (HPAE/PAD). J. Wood Chem. Technol. 1998, 18, 235–252. [Google Scholar] [CrossRef]
- Pelletier, M.J. Quantitative Analysis Using Raman Spectrometry. Appl. Spectrosc. 2003, 57, 20A–42A. [Google Scholar] [CrossRef]
- Ebringerová, A.; Heinze, T. Xylan and Xylan Derivatives–Biopolymers with Valuable Properties. Macromol. Rapid Commun. 2000, 21, 542–556. [Google Scholar] [CrossRef]
Disclaimer/Publisher’s Note: The statements, opinions and data contained in all publications are solely those of the individual author(s) and contributor(s) and not of MDPI and/or the editor(s). MDPI and/or the editor(s) disclaim responsibility for any injury to people or property resulting from any ideas, methods, instructions or products referred to in the content. |
© 2023 by the authors. Licensee MDPI, Basel, Switzerland. This article is an open access article distributed under the terms and conditions of the Creative Commons Attribution (CC BY) license (https://creativecommons.org/licenses/by/4.0/).