Abstract
High-Efficiency Particulate Air (HEPA) filtration plays a crucial role in maintaining air quality in critical environments such as lean rooms, hospitals, and nuclear facilities. The point of this study is to look into how well nuclear-grade HEPA filters work and behave by looking at the main ways they catch particles using two modeling methods to figure out how well the filters work overall. This study encompasses particles with diameters ranging from 0.05 to 5.00 µm and a density of 1500 kg/m3. The current study systematically examined key parameters such as particle size, fiber diameter, and filtration velocity, which revealed their significant influence on the HEPA filter efficiency. Notably, the most penetrating particle size (MPPS) is identified within the expected range of 0.1–0.3 µm for both approaches. A critical threshold in fiber diameter is discovered when it exceeds 0.85 µm, resulting in a substantial shift in particle penetration and overall collection efficiency. This study also explored the impact of filtration velocity on filter performance, demonstrating increasing deviations as velocity rises, following a polynomial trend. The current study also rigorously validated the model predictions against experimental data from uranine particle filtration tests, confirming the model’s accuracy and applicability. These findings provide essential insights for optimizing the design and operation of nuclear HEPA filters, emphasizing the necessity of considering the particle size, fiber diameter, and filtration velocity. Both modeling approaches exhibit a negligible 0.04% deviation in the MPPS efficiency, which increases polynomially with the filtration velocity. Importantly, both approaches consistently identified the same MPPS regardless of the filtration velocity. Additionally, the model reinforces the substantial impact of fiber size on filter efficiency. A comprehensive comparison with the experimental data yielded closely aligned results with a maximum deviation of 1.14%. This validation strengthens the model’s ability to elucidate the underlying physical phenomena governing the influence of filtration velocity on efficiency, making it a valuable tool in nuclear HEPA filter research and development.
1. Introduction
Developing sustainable energy resources poses a formidable challenge for governments striving to meet their societies’ energy demands. Simultaneously, the environmental remediation concerns cannot be ignored, especially when linked to energy production processes. Public awareness of the negative consequences of careless nuclear practices has increased, underscoring the importance of social acceptance for sustainable nuclear endeavors [1,2,3]. To gain societal trust, nuclear energy producers must prioritize safety measures within nuclear power plants and their surrounding environments [4,5].
A variety of models exists to compute the efficiencies of fibrous filters, considering parameters such as filtration velocity, fiber diameter, and packing density. This study selected specific models to calculate the single-fiber efficiency and overall media efficiency due to their established applicability and relevance to nuclear-grade HEPA filters. The models by Lee and Liu (1982) [6] and Kuwabara (1959) [7] were chosen due to robustness and validated performance in similar contexts.
To avoid overfitting and ensure computational efficiency, this work did not select alternative models like those proposed by Ramarao et al. (1994) [8], which offer comprehensive approaches. The chosen models strike a balance between simplicity and accuracy, making them suitable for the operating conditions of nuclear facilities. Future research may explore the integration of these alternative models to further enhance the predictive accuracy of HEPA filter performance.
Nuclear power production generates substantial volumes of radioactive waste, the nature and quantity of which depend on various factors, including reactor type, design features, operating conditions, and fuel integrity [9,10]. Some of these radioactive wastes are activated radionuclides that come from building materials, moderators, and coolants. They are also contaminated by fuel-related corrosion and fission products. Researchers have devised various methods for managing and treating nuclear power plant waste, attaining notable levels of effectiveness and reliability [11,12]. Ongoing efforts are underway to refine waste management systems’ safety and economic aspects. Regulatory oversight by the International Atomic Energy Agency (IAEA) plays a pivotal role in assessing and reviewing radioactive waste management systems in the nuclear industry [13]. Adequate waste management within nuclear plants is imperative to support the sustainability criteria for energy projects. This involves mitigating the potential hazards posed by radionuclides and optimizing the operational costs [14,15,16].
Nuclear facilities, among other applications, widely recognize the effectiveness of High-Efficiency Particulate Air (HEPA) Filtration in removing airborne particles. Besides nuclear applications, other industries like semiconductor manufacturing, aerospace environments, pharmaceutical processing, bioengineering, hospitals, and airplane cabin air systems have also utilized HEPA filters [17,18]. Studies such as those conducted by Alderman et al. [11] examined the performance of HEPA filters under varying conditions to assess their efficacy in maintaining clean and safe air environments [19,20]. This extensive use of high-efficiency particulate air filtration extends to the nuclear industry, where HEPA filters have a well-established history of preventing the release of radioactive aerosols [19]. Given that nuclear waste contains volatile fission products, HEPA filters are very important for keeping these radioactive volatiles inside the reactor and stopping them from spreading to other areas, which keeps everyone safe. Previous studies [21,22] have demonstrated that glass fiber media, a proven and effective material for capturing and trapping particles, is primarily used to construct HEPA filters. These filters are very good at what they do; they can catch at least 99.97% of aerosol pollutants, with a particle size of 0.3 µm being close to the Most Penetrating Particle Size (MPPS), which is the particle size that is hardest for a filter to catch [23,24].
The growing demand for air filtration products has led to an influx of distributors and resellers in consumer, retail, and industrial markets [25,26]. This increased competition can confuse consumers because of varying HEPA filter brands, jargon, and performance ratings. The efficiency and performance of HEPA filters depend on several factors, including filter medium development, particle characteristics, velocity, and air filtration level. Multiple standards regulate HEPA filters. ISO 29463 [27], developed based on EN 1822 filter classes, was applied to industrial EPA, HEPA, and ULPA filters [28,29,30]. The EN 1822:2009 standard [31], launched in 1998, was the first to classify HEPA filters based on the filtration process theory and introduced the Most Penetrating Particle Size (MPPS) evaluation criterion, which identifies the least arrestable particle size. In the US, HEPA filters are classified differently, with MIL-STD-282 being the foundational test procedure since 1956, alongside IEST-RP-CC001 and CC007 protocols specifying particle sizes for efficiency tests, evaluated at 0.3 µm, 0.1–0.2 µm, or 0.2–0.3 µm, depending on the filter class. Many manufacturers and distributors label products as H13, the minimum HEPA filter class in the US, with technical differences among H13, IEST Type F, and True HEPA filters being negligible. HEPA filters that meet the ISO 14644 standard [32] are suitable for clean rooms, including nuclear reactors. Notably, EN 1822-class [31] H14 HEPA filters arrest 99.9993% of particles at their MPPS, classifying them under the ULPA filter class ISO 50 U according to ISO 29463, with different leakage tests compared to EN 1822 filters [33].
In nuclear facilities, arrays of HEPA filters are integral components of the ventilation systems. Typically, the filter medium is approximately 0.381 mm thick and comprises ultrafine glass fibers bound together with an organic binder [34]. Radionuclides and chemical products from nuclear fission processes often contaminate the internal environment of nuclear reactors. Nuclear fission releases materials such as cesium (Cs) and cesium oxide, which are known for their hazardous properties when they react with moisture to form cesium hydroxide (CsOH) [35,36].
2Cs + 2H2O → 2CsOH + H2
Cs2O + H2O → 2CsOH
The nuclear reactor’s internal environment disperses these radioactive compounds, including non-stable isotopes like 137Cs and 131I. Certain isotopes, such as 137Cs, may exhibit an extended half-life of up to 30 years. The ventilation systems of nuclear reactors are meticulously designed to prevent the release of hazardous compounds into the external environment, particularly when monitoring for internal or external radiation exposure fails to meet the Nuclear Safety and Radiation Protection Regulations [35,36,37].
Modeling and simulating HEPA filters is a critical aspect of research and development aimed at gaining a deeper understanding of their filtration efficiency and overall performance [38]. By employing modeling and simulation, researchers and engineers can acquire valuable insights into how HEPA filters behave under varying operational conditions and design parameters, thus enabling them to optimize filter designs effectively. However, modeling fibrous filters, such as HEPA filters, presents a fundamental challenge because of the intricate structure of such media. Glass fiber filter media, for instance, utilize fiber codes, resulting in polydisperse fiber diameter distributions in real media. The filtration theory emphasizes the significant influence of fiber diameter on filtration parameters, including particle penetration, capture efficiency, and filter pressure drop [39]. To address this complexity, researchers have introduced parameters such as fiber constants into mathematical models to measure filter efficiency. Examples include the work in [40,41], which incorporated the fiber length distribution. Additionally, models may account for the fiber volume distribution (packing density), reflecting the polydispersity of fibrous filters such as HEPA filters. Random mixtures of polydisperse fibers typically comprise these filters, with finer fibers responsible for particle capture and larger fibers providing structural integrity. To make it easier to figure out how much air is moving through the filter, theoretical models often simplify this complicated structure by only looking at a single perpendicular fiber and ignoring the effects of nearby or interfering fibers in the medium.
The cell model improves this by considering the effects of adjacent fibers [7] and describing the filter as a succession of parallel fibers placed perpendicular to the flow. Nevertheless, disparities between numerical calculations based on these models and experimental results from industrial filters persist because of inadequate descriptions of fibrous structure complexity [42]. To address these disparities, an alternative approach employs specially designed fibrous filters with well-defined structural characteristics, including monodisperse fibers and the absence of a binding agent. Advances in nanotechnology have further improved the efficiency of the HEPA filters. For instance, a study [43] investigated the use of Gr-Ag hybrid materials on HEPA filters. This study aimed to enhance the performance of HEPA filters in nuclear applications by treating them with a Gr–Ag hybrid material. This modern and eco-friendly approach to nanotechnology has shown promising results in terms of improving the efficiency of HEPA filters.
Despite continuous advancements in filtration technology, it remains crucial to have a deep understanding of the fundamental principles underlying fibrous filter operation. This knowledge serves as the foundation on which innovative solutions can be developed. The point of this study is to look at all aspects of the performance and efficiency of nuclear-grade HEPA filters. This includes looking at various modeling approaches and how well they can be used to predict how the filters will behave, as well as how particles are collected and how overall efficiency patterns work. This was achieved by evaluating the overall filter efficiency under normal operating conditions against aerosols (density: 1500 kg/m3), with particle size distributions ranging from 0.05 to 5 µm. It employs both additive and independent approaches to particle collection mechanisms to cover the typical MPPS size range of 0.1–0.2 µm. The significance of this topic has become evident in the context of global efforts to reduce environmental pollution, mitigate ecological and health risks, and enhance the safety of nuclear facilities [44].
This research presents a comparative analysis of the efficiency outcomes of each of these varieties by employing experimental and simulation data obtained from an experiment utilizing a nuclear HEPA filter of properties as described by a member of the authors of this paper, Joubert et al. (2010) [45]. This is significant because the literature lacks investigation on the disparities between methods for calculating the fiber efficiency of HEPA filters at different filtration velocities and aerosol sizes at the same time.
2. Methodology
2.1. System Description
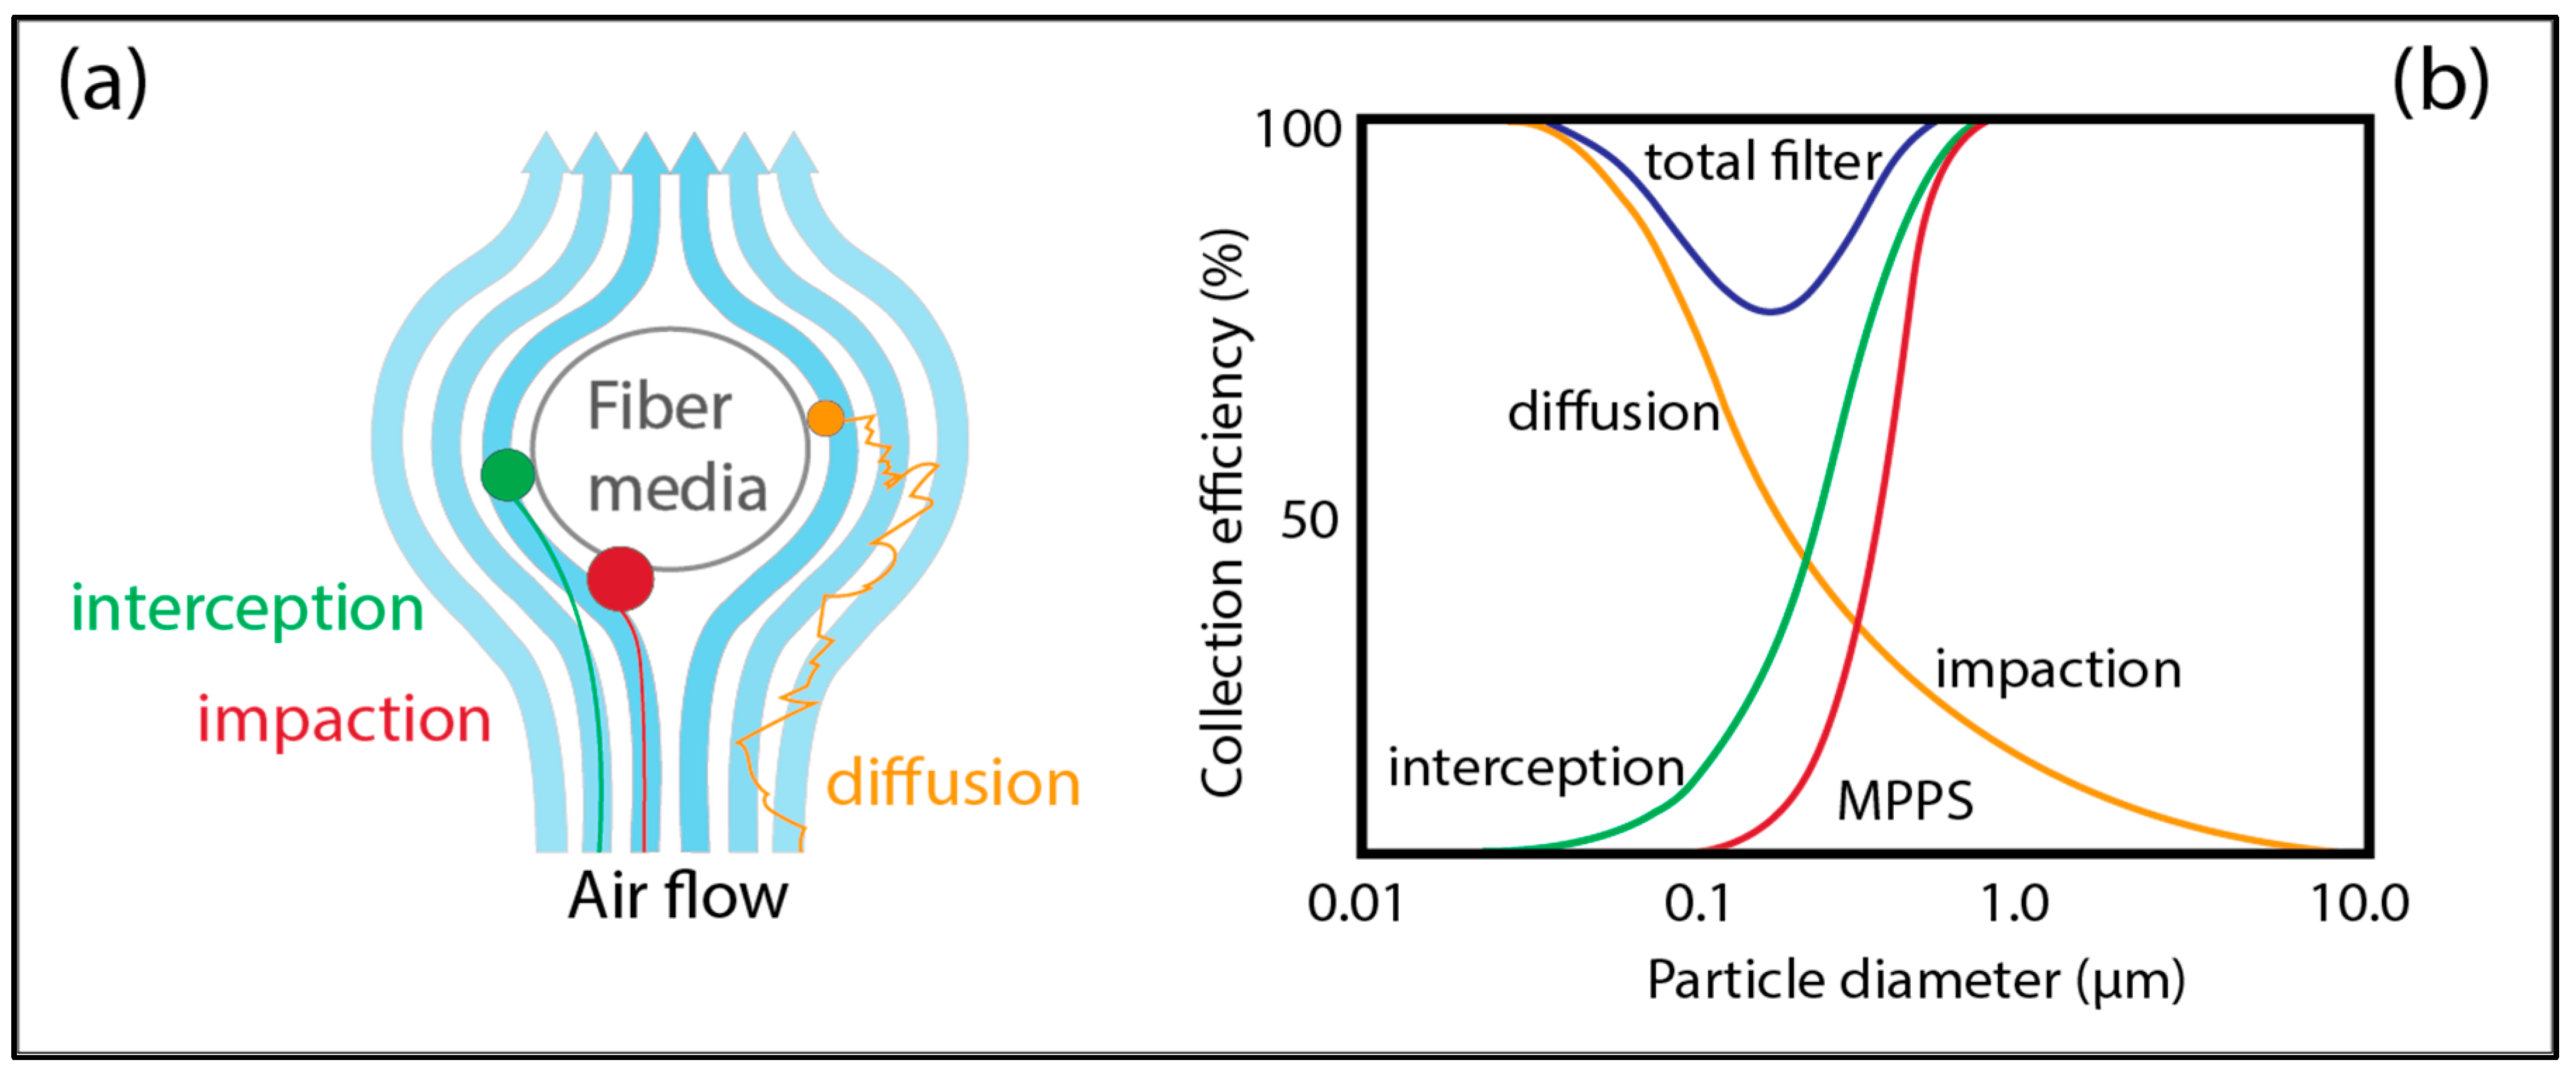
In order to understand filtration mechanisms and improve the performance of High-Efficiency Particulate Air (HEPA) filters, our methodology delves into the thorough exploration of particle deposition mechanisms. Various primary capture mechanisms are involved in the porousdo main of themicro structure, including diffusion, interception, and inertial impaction. Diffusion, characterized by the random Brownian motion of particles altering their trajectories, becomes pronounced for particles smaller than 0.1 µm. Interception involves particles of finite size drawing near or adhering to flow streamlines and dominating for particles ranging from 0.1 to 1 µm and beyond.
Larger particles, on the other hand, are mainly affected by inertial impaction, which causes them to deviate from their fluidic path. This usually happens for particles bigger than from 0.3 to 1.0 µm, depending on the speed of the gas and the size of the filter structure. Figure 1 illustrates the three main filter capture mechanisms and how they work together to achieve high performance.

Figure 1.
(a) Main filter-capturing mechanism. (b) Filtration single-fiber efficiency and total efficiency (Author’s illustration).
The current study carefully selected relevant models for each collection mechanism, building on foundational research, particularly Al-Attar’s work [46], which established semi-empirical correlations for calculating single-fiber efficiencies. Also, it specifically employed Kuwabara’s [7] flow-based descriptions, underpinned by the concept of fibers as an assembly of cylinders, as the basis for the models.
This study primarily concentrated on these selected mechanisms, neglecting other capturing mechanisms due to their simplicity and minimal impact on the core essence of the filter model. Understanding these deposition mechanisms lays the ground work for modeling, simulation, and subsequent analysis of HEPA filter performance under various operating conditions and design parameters, with a primary focus on them ain filtration mechanisms.
Lee and Liu [6] devised a theoretical model, adapted from experimental findings, to calculate single-fiber efficiency through diffusion. This correlation is based on a flow model incorporating Kawabata’s [7] hydrodynamic factor from 1959, which treats fibers as a collection of cylinders:
where is the packing density of the media, and Pe is the Peclet number which is given as follows:
where is the filtration velocity, is the fiber diameter, and the coefficient of diffusion of the particle.
The coefficient of diffusion for a spherical particle is given as follows:
where is the Boltzmann’s constant, is the gas temperature, µ is the gas dynamic viscosity, is the particle diameter, and is the Cunningham slip factor.
Lee & Liu [6] introduced a theoretical model for the collection efficiency of a single fiber through interception, based on a cylindrical assembly and continuous regime. The model is expressed as follows:
where is the interception number and is given as follows:
Regarding the collection efficiency of inertial impaction, Gougeon (1994) [47] proposed the following relationship:
where St is the Stokes number, given as follows:
where is the superficial velocity, is the particle diameter, is the particle density, is the slip factor, is the fluid dynamic viscosity, and is the fiber diameter.
To calculate the total single fiber efficiency of the combined effect of Brownian diffusion, inertial impaction, and interception, there are two approaches, additivity and independent, which were used, as by (Ramarao et al., 1994) [8] in Equations (7) and (8), respectively:
The overall particle collection efficiency is closely related to the total fiber removal efficiency, as defined by Lee and Liu (1982) [6]:
By referring to the previous Formula (7), Lee and Liu [6] and Zhu [48] expressed the particle penetration in the filter by the following expression:
Since both approaches in Equations (5) and (6) are investigated in this study, to distinguish the independent approach it will be denoted with a prime sign (′) when performing both single fiber and overall efficiency calculations (′ and ′E).
2.2. Mathematical Modeling
To make a mathematical model that works like a real HEPA filter, it is important to use empirical data, a precise boundary, and the above mathematical expressions that describe the filtration process. Table 1 and Table 2 show experimental data on the medium characteristics and operating conditions obtained from the work conducted previously by one of the authors (Joubert et al., 2010) [45]. The mathematical model in corporated these experimental data sets and parameters for simulation and analysis purposes.

Table 1.
Main characteristics of the medium, (Joubert et al., 2010) [48].
Table 2.
Experimental conditions conducted by (Joubert et al., 2010) [48].
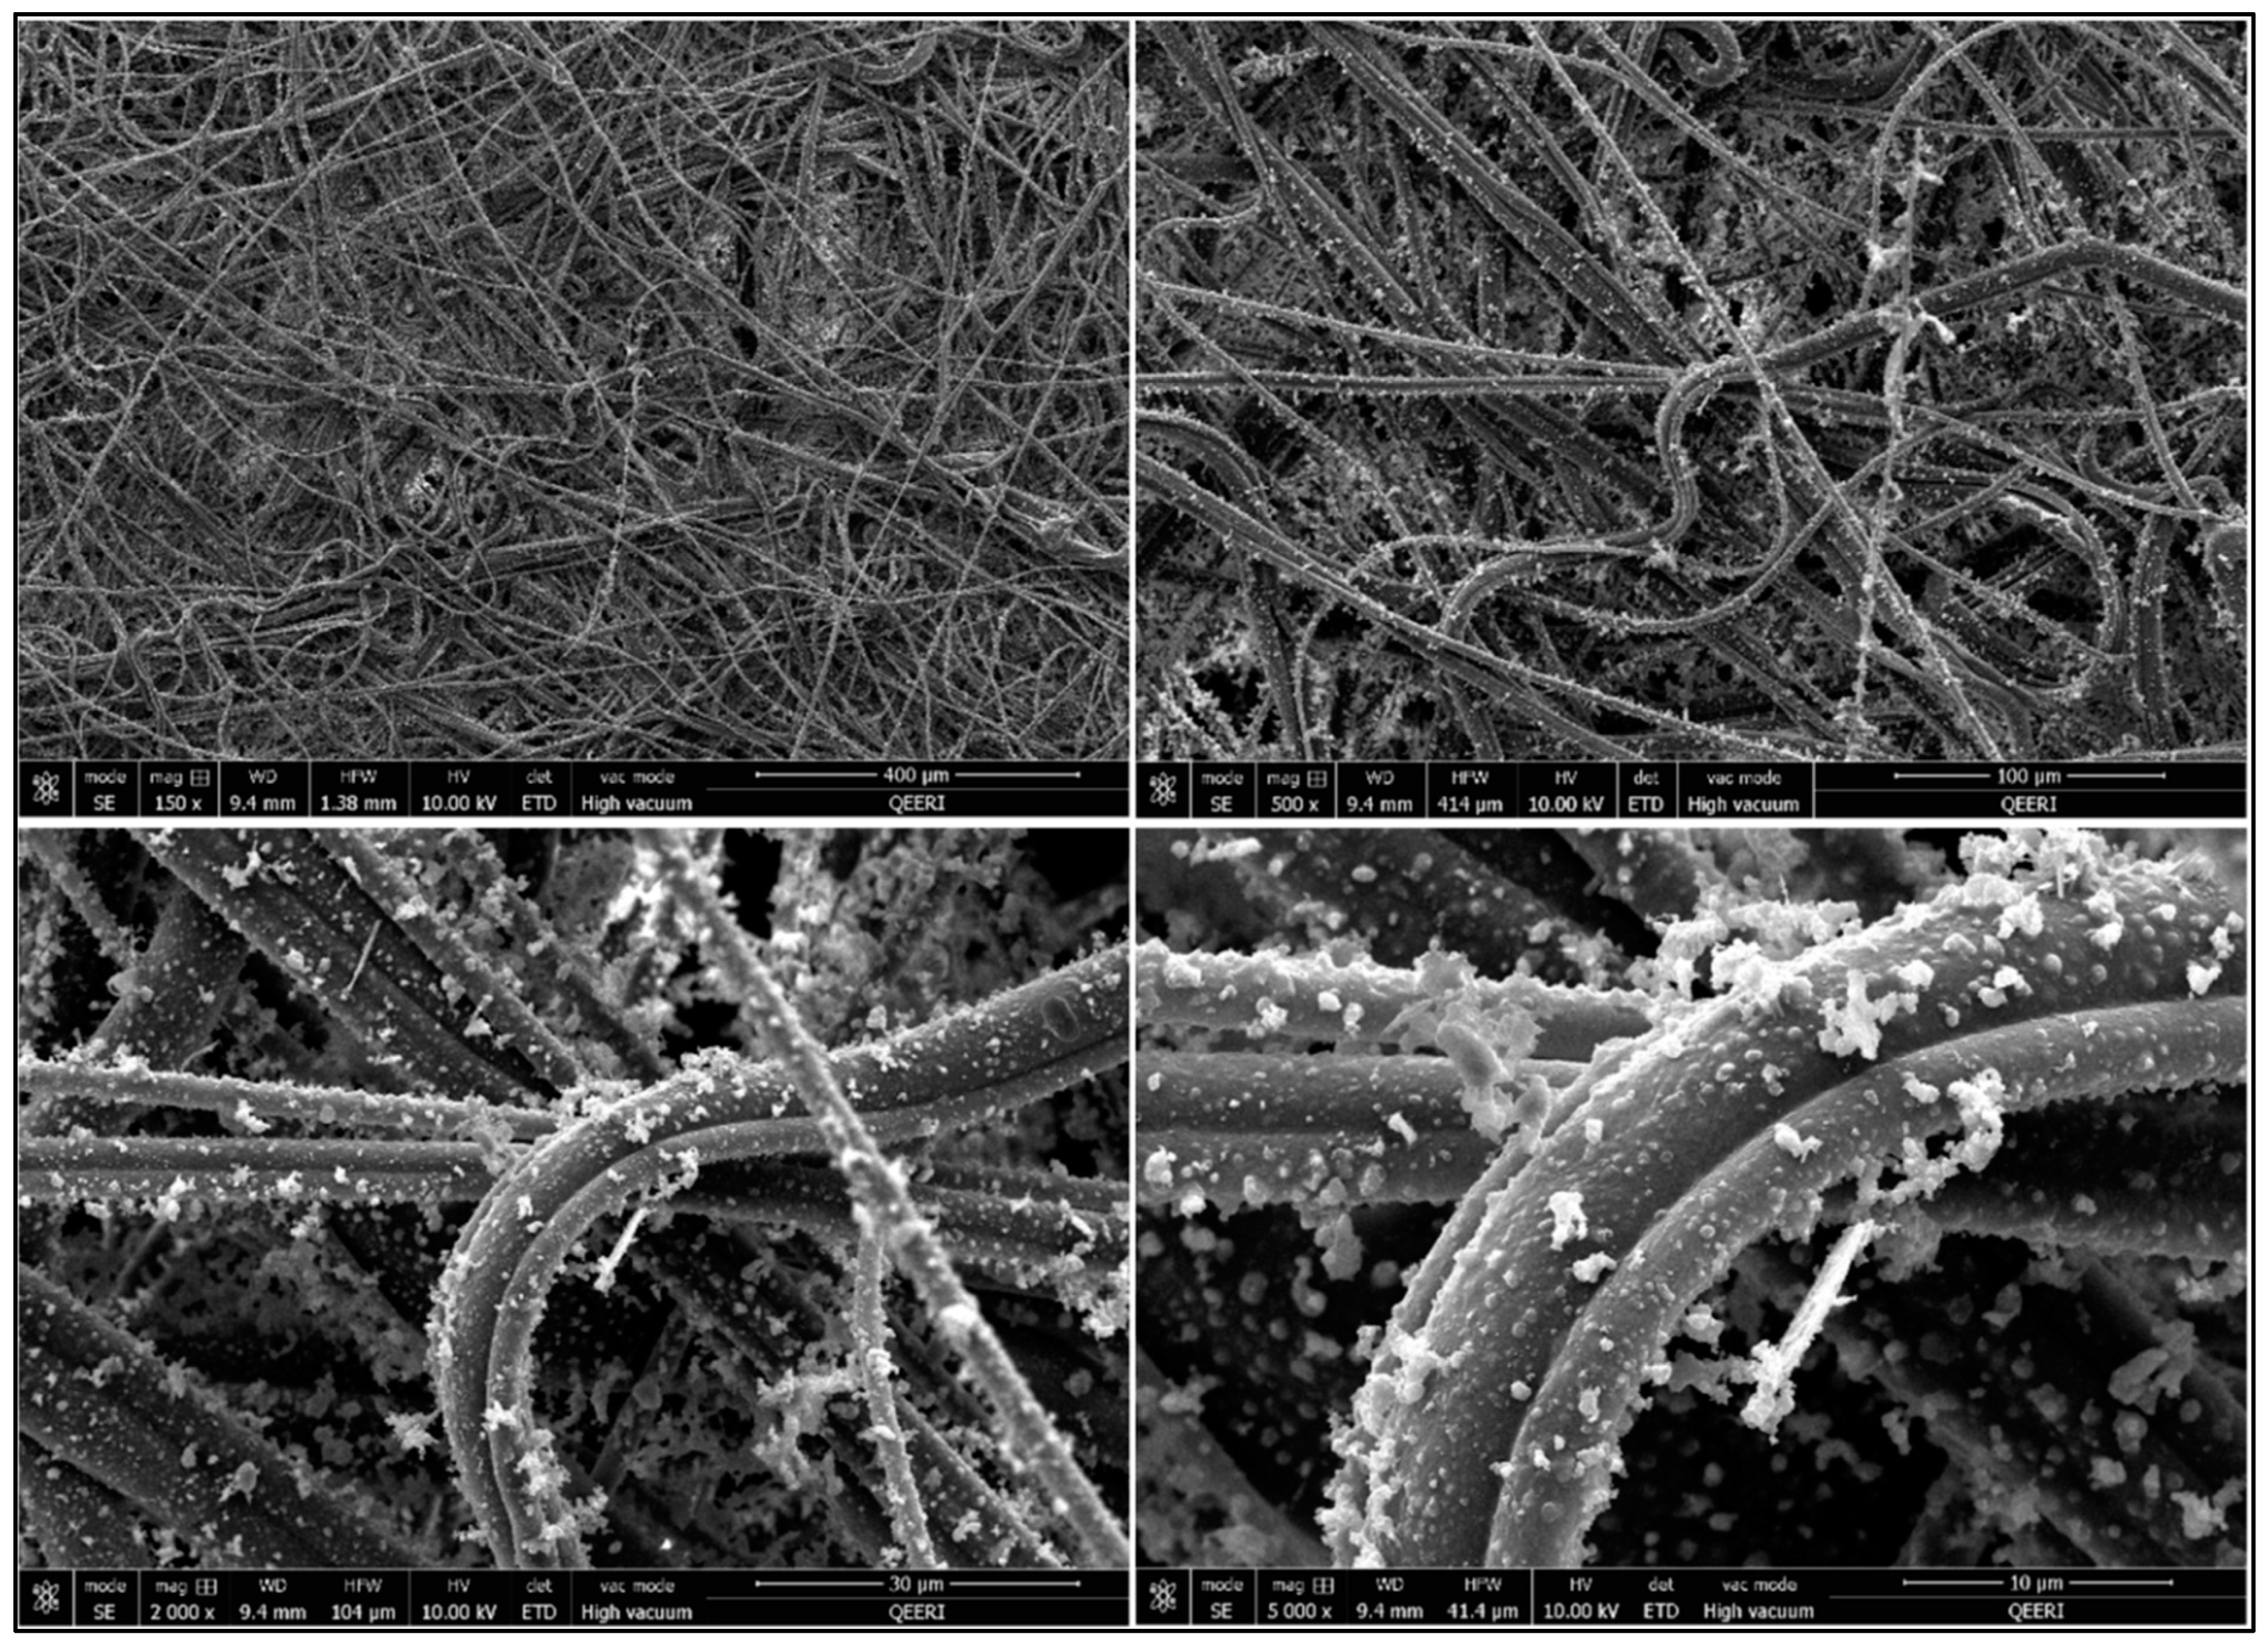
The porous structural properties, including the fiber diameter and medium thickness, were characterized by Joubert et al. (2010) [45] using scanning electron microscopy (SEM). The observations and measurements from this characterization are presented in Table 1.
This study obtained and analyzed SEM images of a sample-loaded HEPA filter to gain a deeper understanding of the filter structure and particleac cumulation, as shown in Figure 2.

Figure 2.
SEM images of a sample-loaded HEPA filter with a zoom of 400,100, 30, and 10 µm (credit: HBKU Core Labs).
The SEM images demonstrate that the HEPA filter in Figure 2 effectively captures particles in cases with random and non-uniform fibrous structures. The variance in fiber diameters, evident from the magnified views, allows the capture of a diverse range of particle sizes.
In addition, the surface irregularities on the fibers, combined with the visible adhered particles, further highlight the filter’s high filtration capability in a densely interwoven design.
This study, as a preliminary assumption, considers filter operation under standard conditions.
Consequently, factors such as pressure drop resulting from dry air clogging or cake formation due to humidity were not considered, given the extensive research in the literature covering these aspects. Nonetheless, it is essential to note that the pressure drop significantly influences the filter lifespan and energy efficiency, emphasizing the need for its minimization (Polat et al., 2021) [48] It is essential to note that the packing density is assumed to be uniform throughout all the filter fibers, which are considered straight and of uniform diameter.
The data presented in Table 2 reflect the operational condition parameters and baseline values for filter evaluation and analysis. Variations in such baseline values were examined to gain an understanding of filtration performance and behavior under various operational conditions.
Numerous standards exist for evaluating the efficiency of HEPA filtration. For instance, the American standard ANSI employs Dioctyl Phthalate (DOP) aerosol, whereas the British standard uses Sodium Chloride (NaCl) aerosol to assess high-performance filters such as HEPA and ULPA. Additionally, numerous other testing standards are available. This study used a typical French AFNOR NFX 44011 standard [49] which generates sodium fluorescein aerosol (uranine) from a chemical formula (C20H10Na2) powder. The French testing standard is notable for its simplicity, cost-effectiveness, and simplicity. However, it consistently yielded higher results than other testing standards [13].
Joubert et al., 2010 [44], derived results from experimental work, applying the French standard AFNOR NFX 44011 to the model program and focusing on aerosol particles with a diameter of 0.18 µm (uranine) [48,50].
The EN ISO 16170 standard [51] suggests three testing methods: DEHS (Di-Ethyl-Hexyl-Sebacate), Polystyrene Latex Spheres (PSL), and fluorescein soda. Each of these methods has its unique advantages and limitations.
DEHS: known for its precision in measuring penetration efficiencies at different particle sizes, providing detailed insights into the filter performance under varying conditions.
- PSL: offers the advantage of a uniform particle size distribution, making it useful for evaluating the consistency of filter performance.
- Fluorescein soda: effective in visualizing particle capture and distribution within the filter media.
The AFNOR NFX 44011 standard was selected for this study due to its established use in evaluating HEPA filters in the nuclear industry, its cost-effectiveness, and its ability to produce consistent and repeatable results [25]. While the DEH Sand PSL methods provide valuable data, they require more complex setups and higher costs that are beyond the scope of this initial investigation [26]. The AFNOR NFX 44011 standard is chosen for a balanced approach, ensuring accurate and reliable results while maintaining feasibility within the experimental constraints.
Future studies should consider incorporating multiple testing standards to provide a more comprehensive evaluation of HEPA filter performance, leveraging the strengths of each method to gain deeper insights into filter behavior under different conditions [27,28].
Section 3 presents simulation results derived from the constructed mathematical model, enriched with parameters from experimental data, effectively creating an offline digital representation of the filter system.
3. Results and Discussion
A comprehensive mathematical model was formulated, considering the three primary collection mechanisms inherent to fibrous filters and predefined operating conditions, building upon the mathematical system description and experimental data detailed in the preceding section. The simulation of the filter model yielded results that aligned with the anticipated behavior. A series of model experiments was subsequently performed to scrutinize the various aspects of the model’s characteristics. The investigation began with an assessment of single fiber efficiencies using both approaches, followed by an examination of overall efficiencies, an analysis of the Most Penetrating Particle Size (MPPS), an investigation into the influence of velocity on efficiency, and an exploration of the relationships between particle penetration and fiber diameter.
3.1. Single Fiber Efficiency
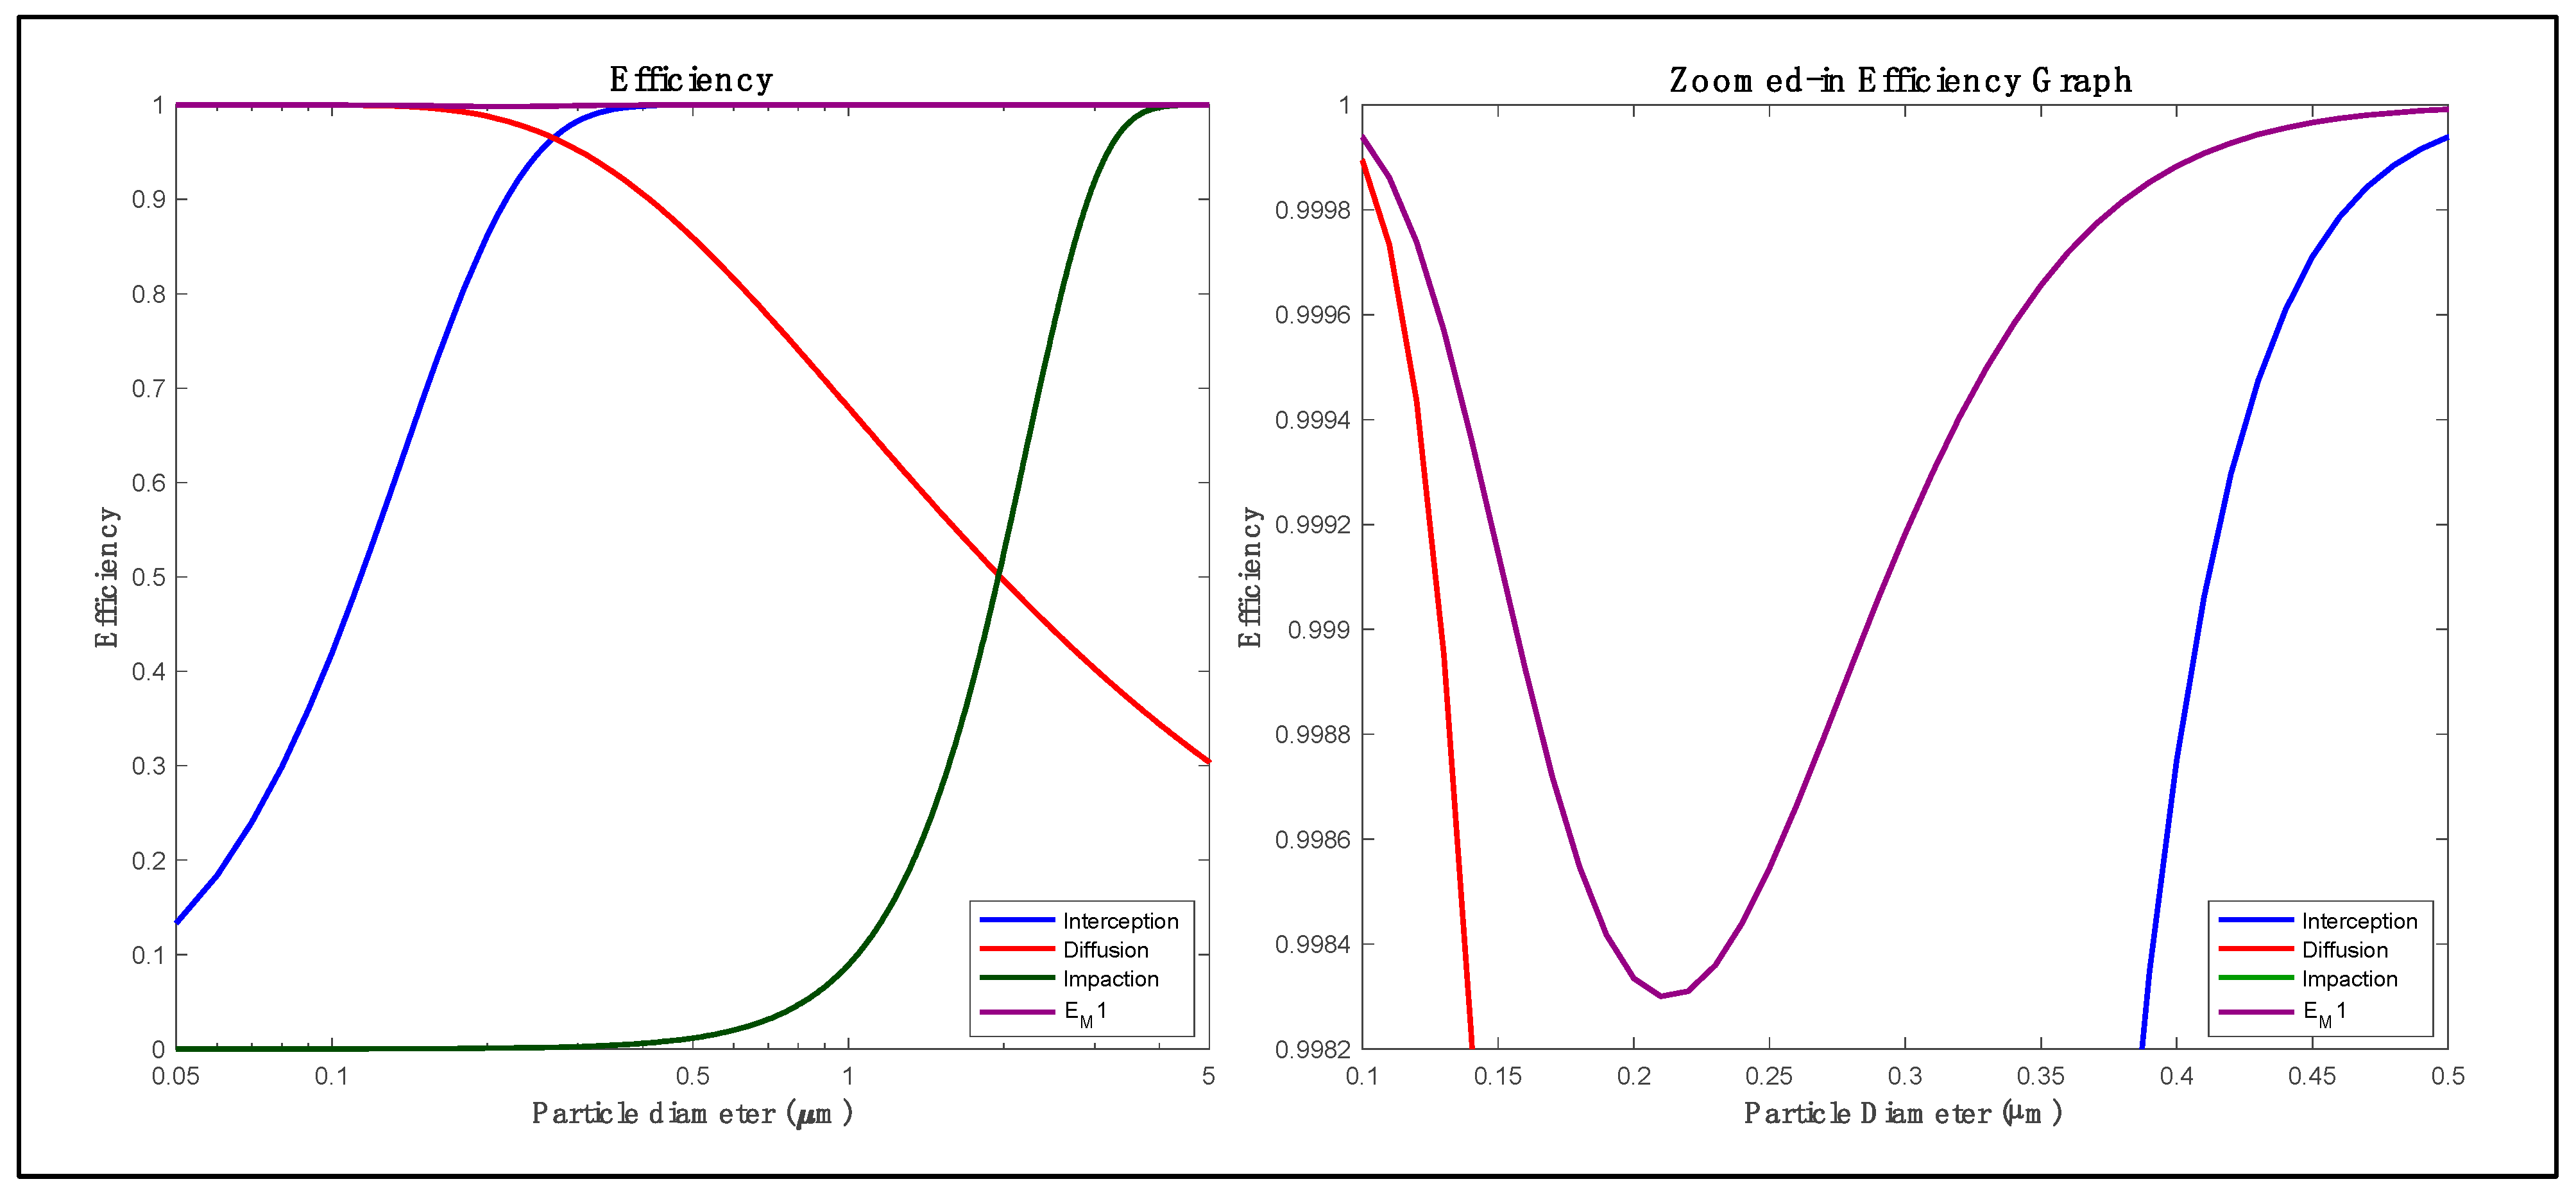
The standard filter behavior analysis began with a model simulation to observe the efficiency of single-fiber collection across the main capture mechanisms over a range of particle sizes. Figure 3 shows the results of the simulation.
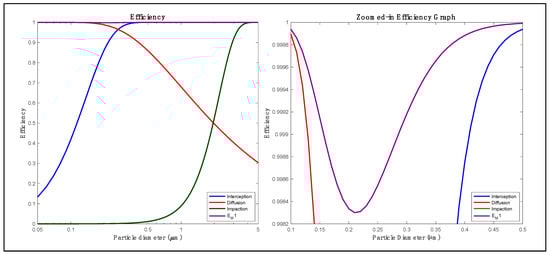
Figure 3.
Filter single fiber efficiency of the three main mechanisms and total efficiency.
As depicted in Figure 3, the interception curve steadily increases with particle size, indicating an increased capture of larger particles by the filter fibers. The diffusion efficiency showed a peak in the submicron range, emphasizing the role of Brownian motion in trapping smaller particles. The impaction efficiency is significant for larger particles because of their momentum, but it decreases after its peak. The cumulative total efficiency curve calculated using the additivity approach (E_M1) depicts near-perfect filtration for small particles, with visible variations in the submicron range. This highlights the complex interplay between different filtration mechanisms and emphasizes the importance of the submicron particle domain in filtration design.
3.2. Overall Efficiency
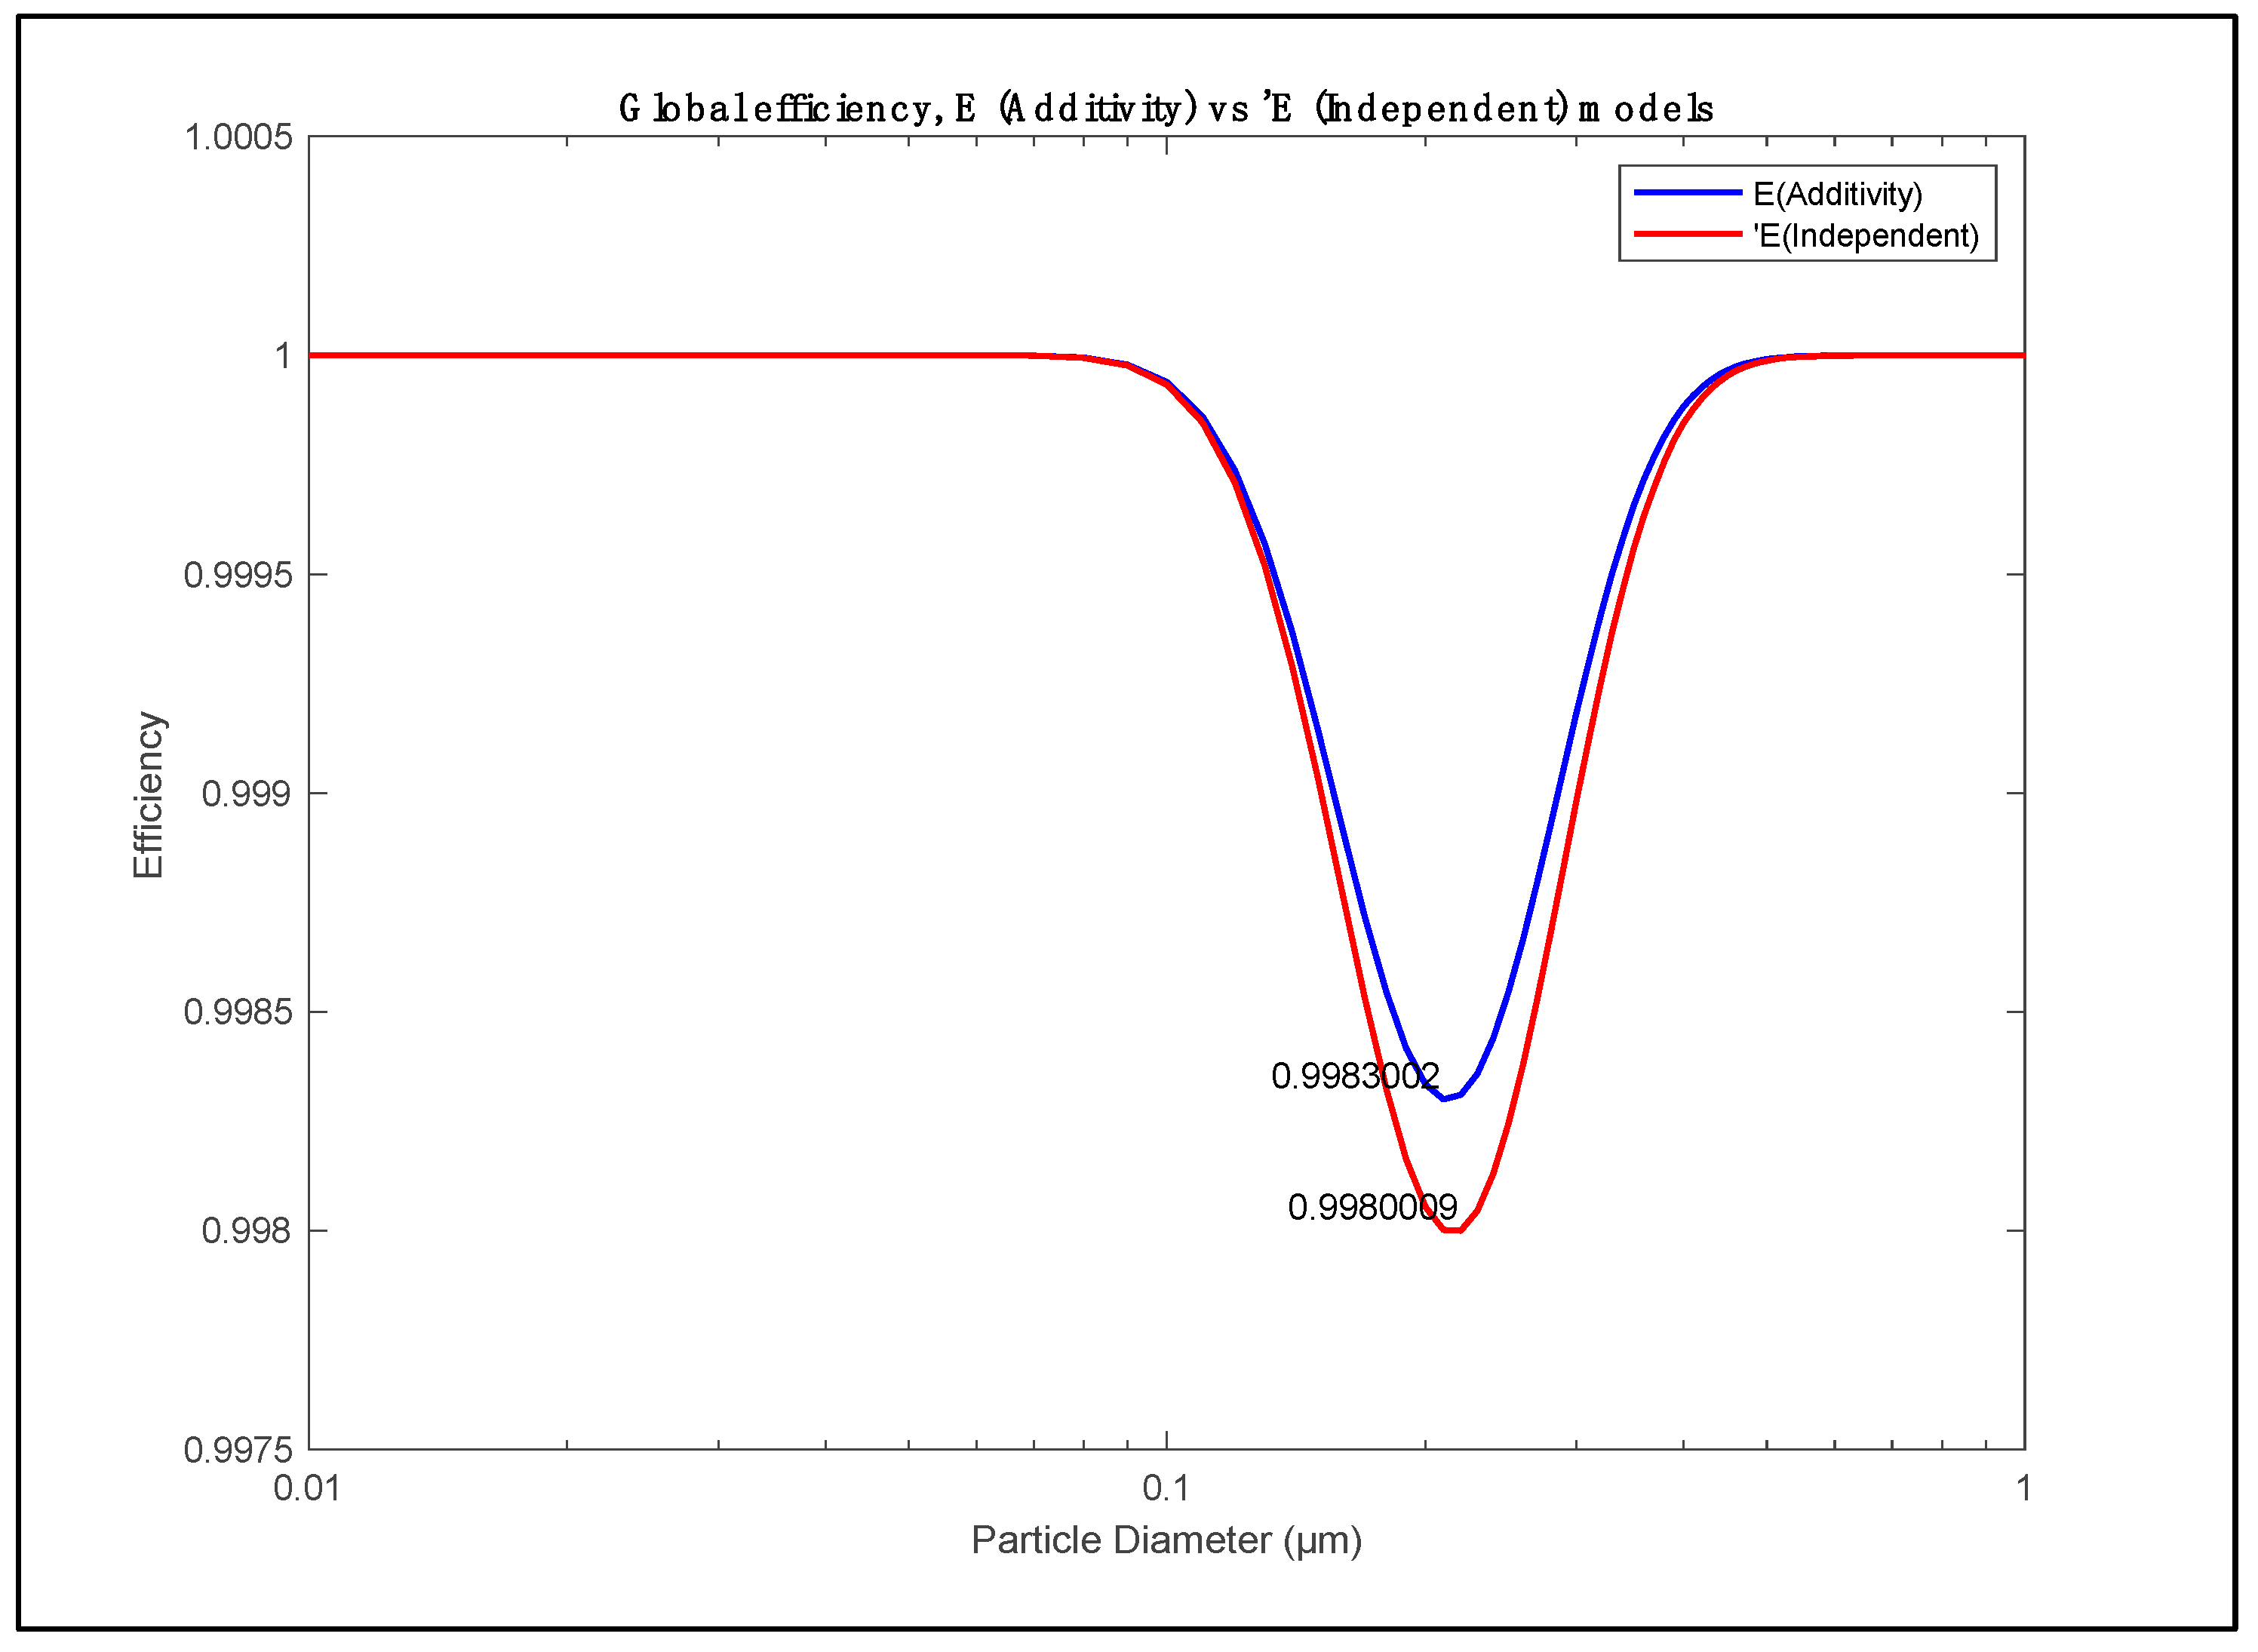
After examining the main filter capture mechanisms and their cumulative efficiency (E), the next step was to compare and evaluate the filter cumulative efficiency using the two calculation approaches (E vs. ′E). The filter model facilitates this comparison as shown in Figure 4, which provides a side-by-side comparison of these approaches under identical operating conditions.
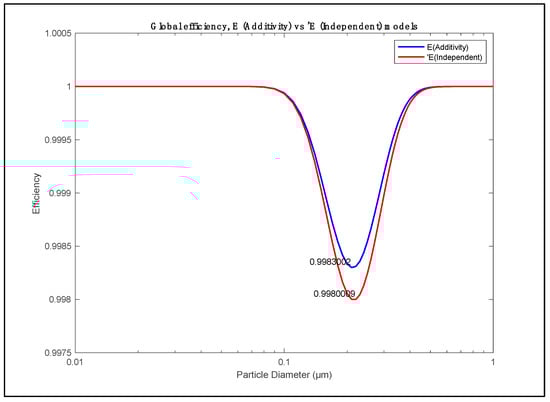
Figure 4.
Overall filter efficiency vs. particle diameter using additive (E) and independent (′E) approaches.
The comparison between the E (Additivity) and ′E(Independent) methods, shown in Figure 4, shows that the minimum filtration efficiency stays the same at about 0.21 µm, which is in the expected range of from 0.1 to 0.3 µm. Notably, for the benchmark particle size of 0.3 µm, both methodologies yield a nearly identical collection efficiency of close to 99.8%. Although all filter material efficiency curves generally display similar trends, the capture capacity and MPPS location predominantly hinge on the specific filter media and its operational conditions. Under identical operating conditions, both the E and ′E methods yield comparable MPPS particle diameters, albeit with a minor efficiency discrepancy at that point. This consistency in the MPPS range validates the conventional use of 0.18 µm (uranine: fluorescein disodium dihydrate, C20H14Na2O7) or even 0.3 µm DOP(Di-OctylPhthalate) tests in filter assessments.
3.3. Decontamination Factor (DF)
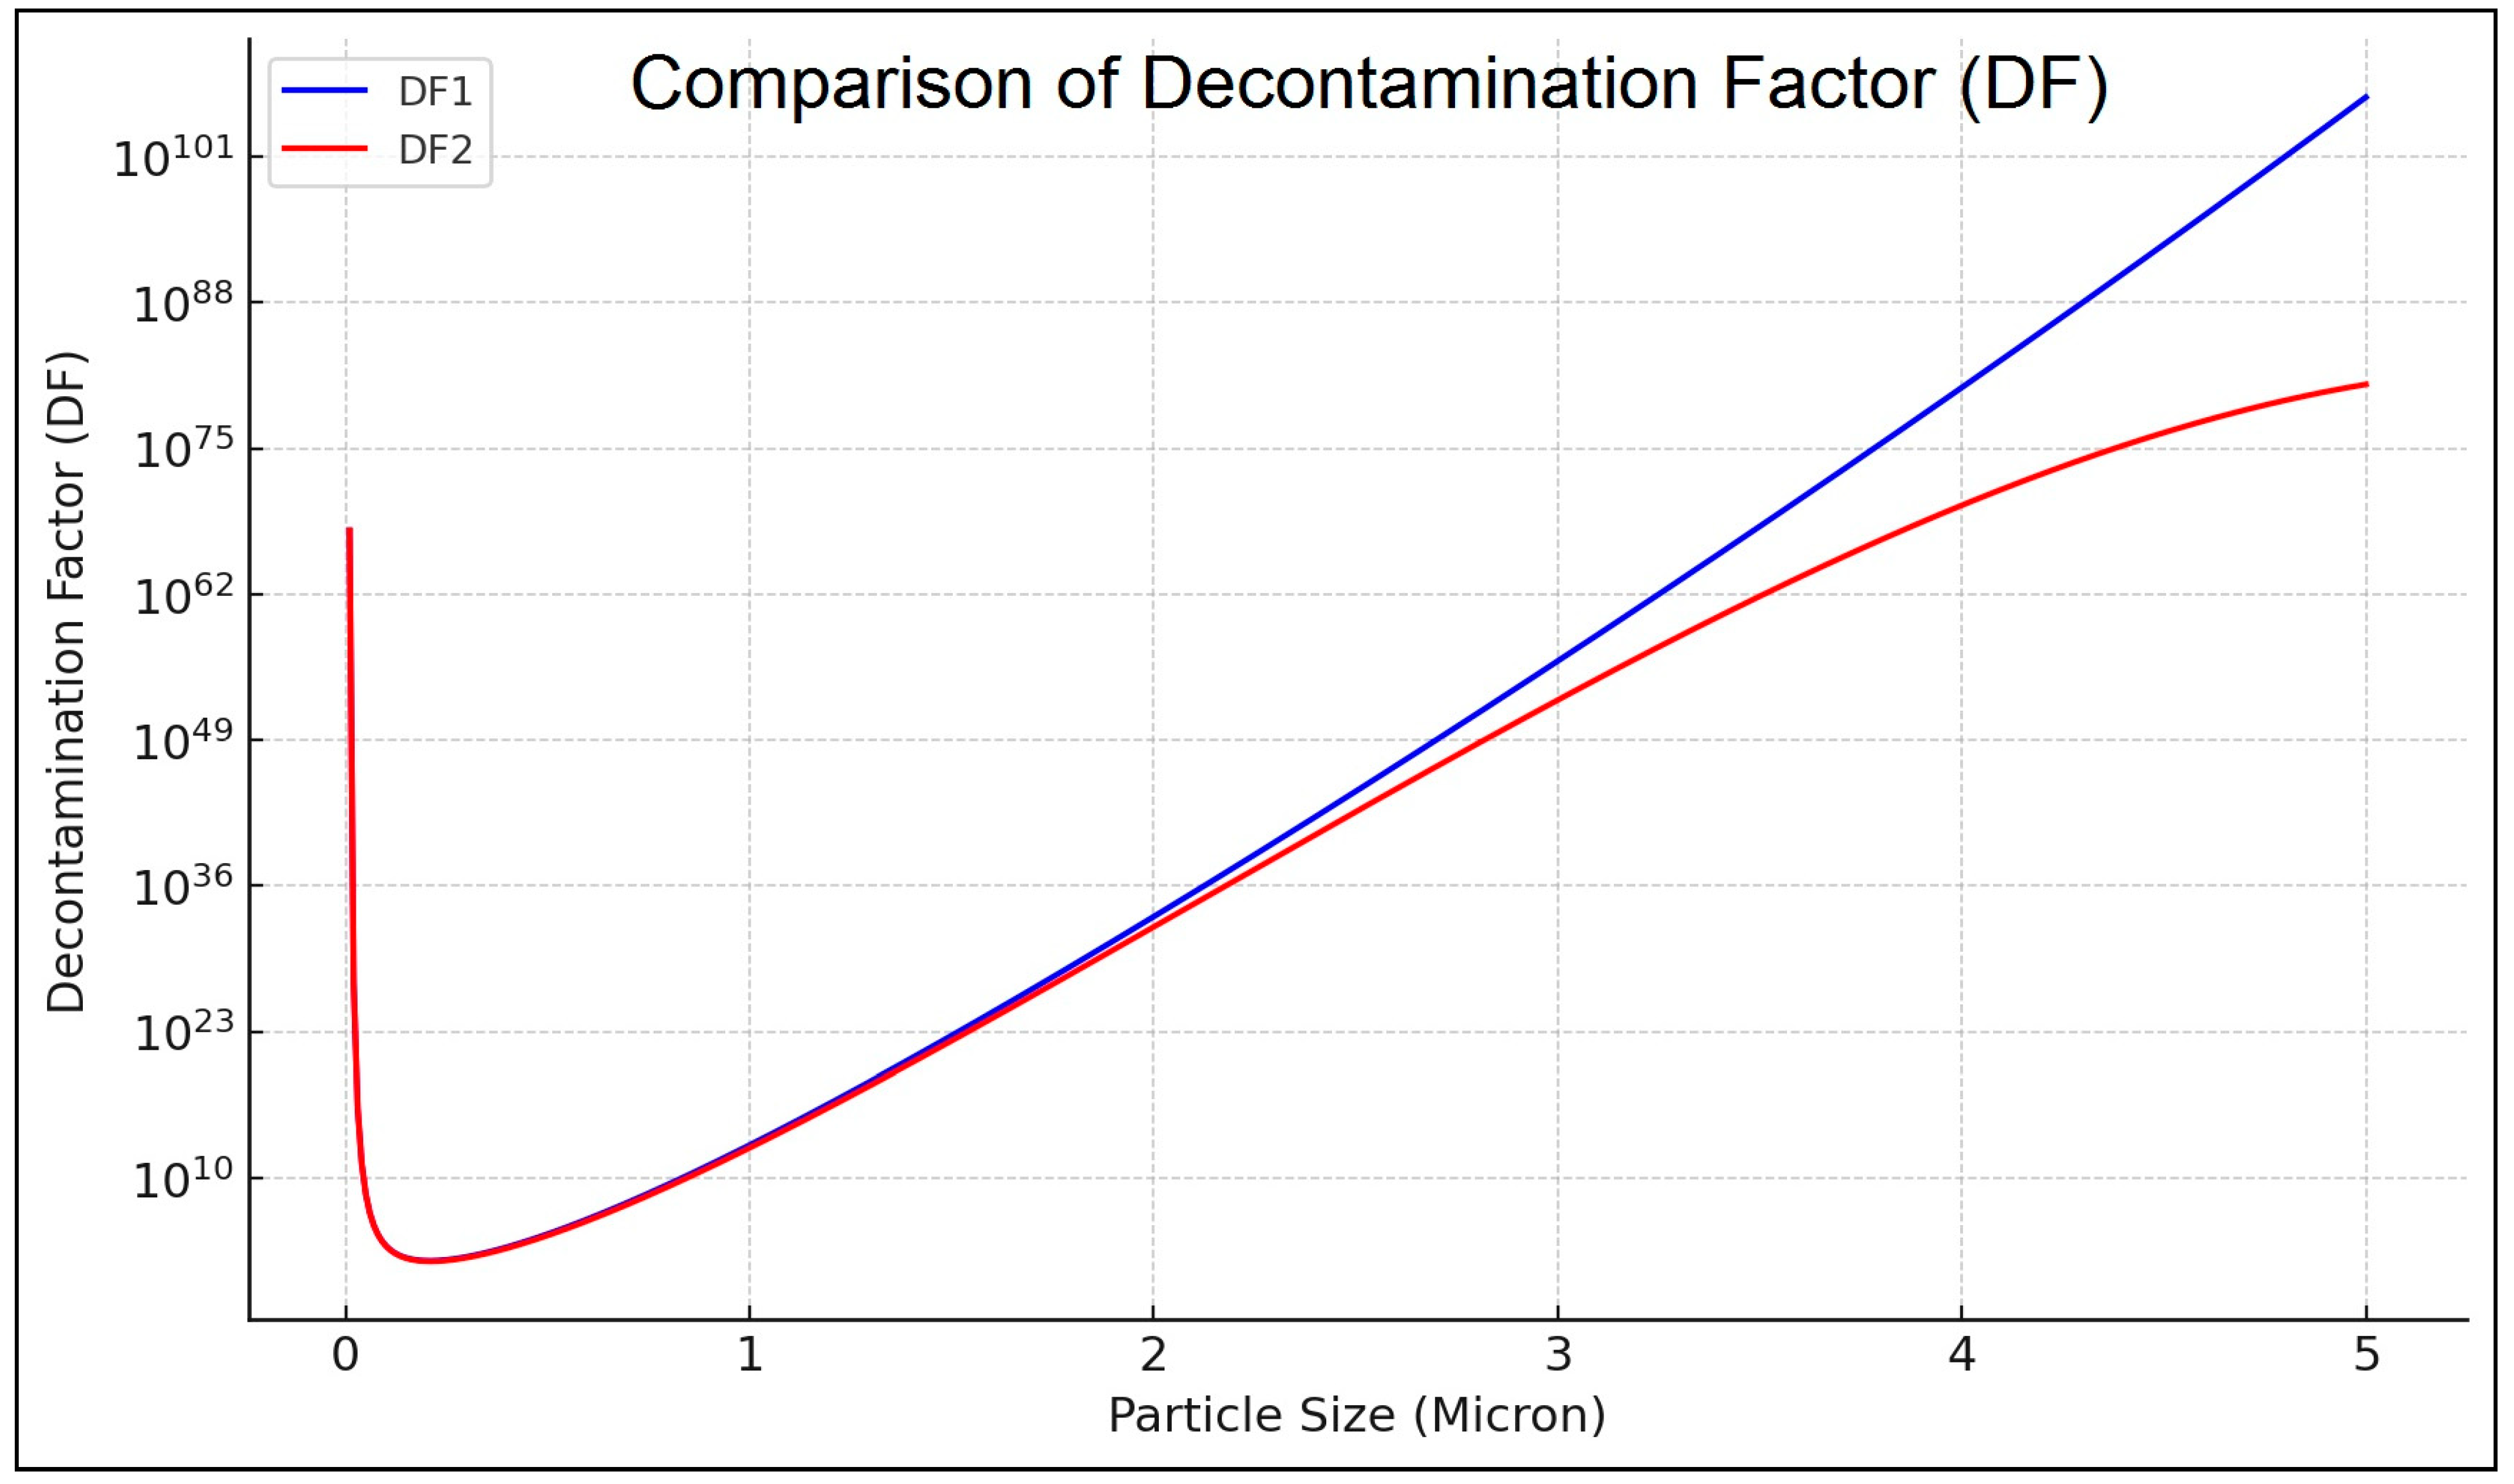
The Decontamination Factor (DF) is a measure of the efficiency of a filtration system, such as a HEPA filter, in removing particulate matter from an air stream. It is defined as the ratio of the concentration of contaminants upstream of the filter to the concentration of contaminants downstream of the filter. Figure 5 illustrates a comparison of DF values using the two modeling approaches.
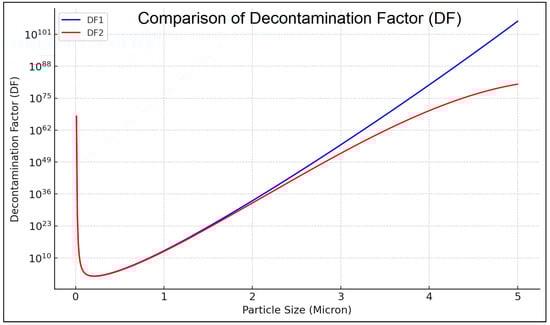
Figure 5.
Comparison of decontamination factor of the two modeling approaches.
As can be seen in Figure 5, the two modeling approaches initially exhibit identical performance up to a particle size of 1.5 µm, after which the model DF values start to gradually diverge, demonstrating the differences between the two models.
3.4. Influence of Filtration Velocity on the MPPS
In assessing the influence of filtration velocity on the MPPS, it is important to note that the MPPS is at a juncture with the minimum capture efficiency. The filtration velocity significantly influences the MPPS, heavily depending on the characteristics of the filter media and operational parameters. Nuclear applications narrow the crucial range from the typical MPPS of 0.1–0.3 µm to 0.1–0.2 µm. This study’s mechanistic model considers filtration velocities between 1.0 and 8.0 cm/s, as tabulated in Table 3.
Table 3.
Variations in overall efficiency and MPPS vs representative filtration velocities.
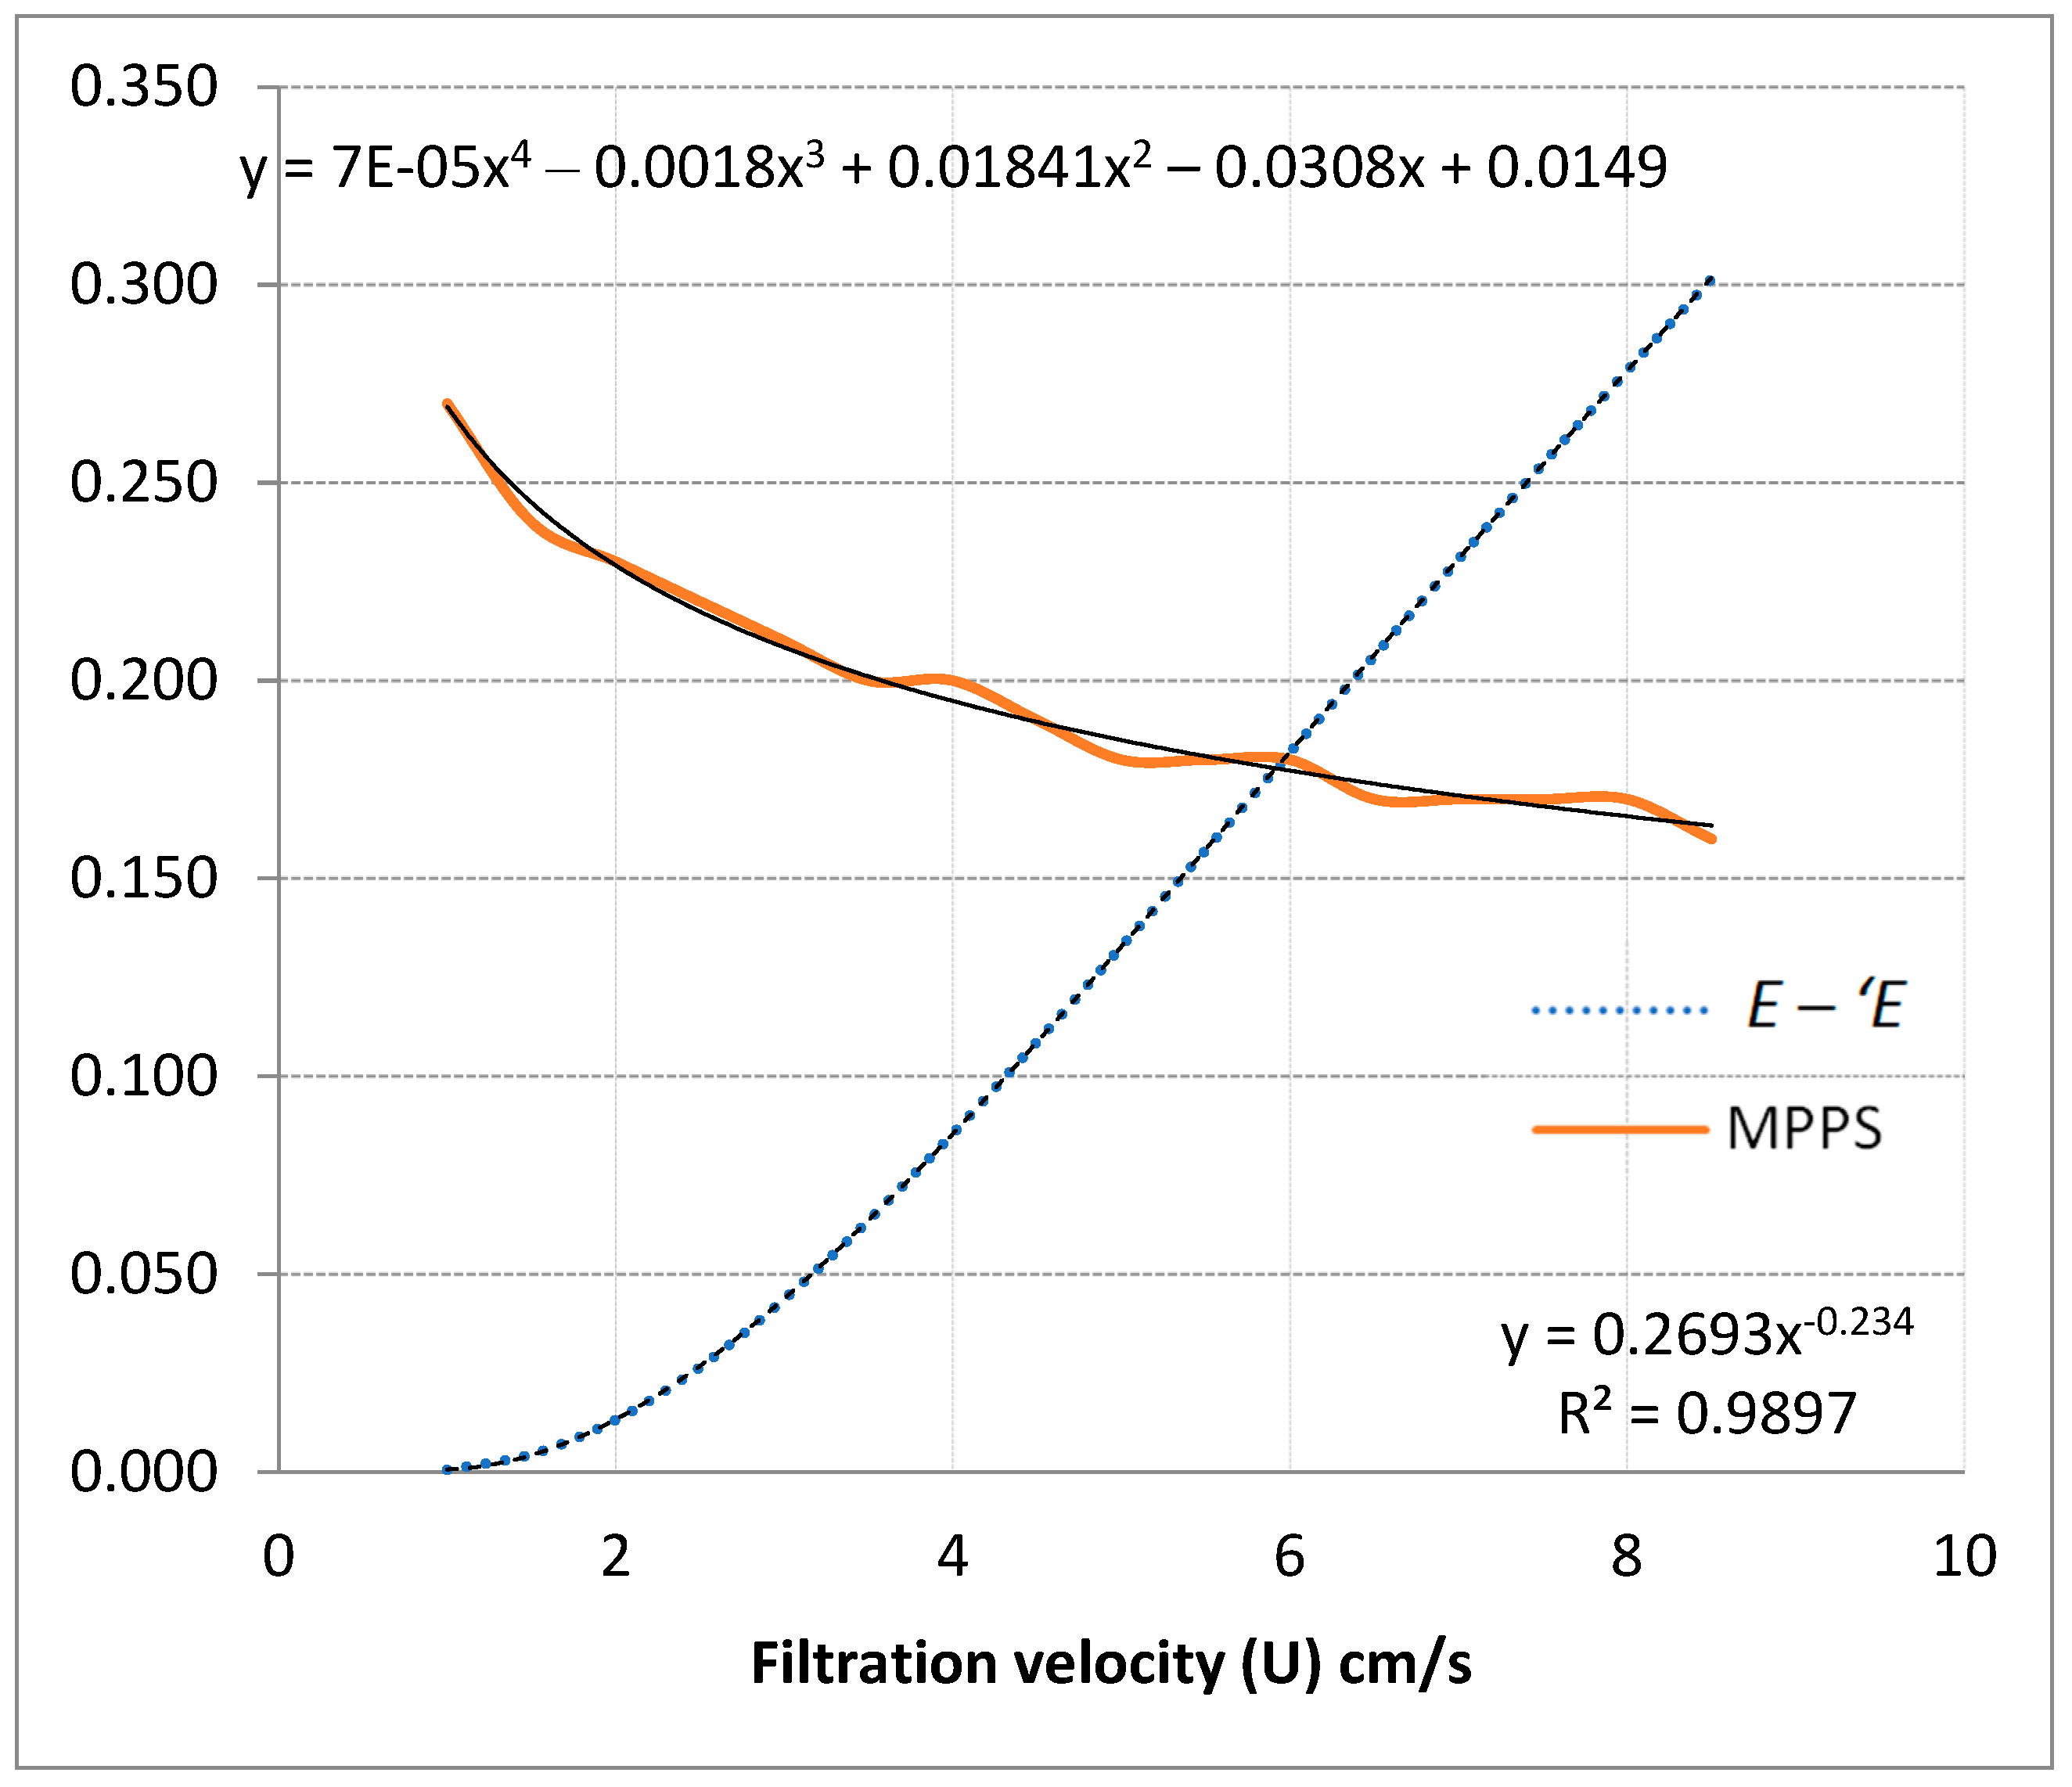
To investigate the relationship between filtration velocity and its impact on both MPPS and efficiency discrepancies between the two approaches, the data from Table 3 were plotted and analyzed to deduce the polynomial and power correlation that govern their relation, as illustrated in Figure 5.
By observing the data plot in Figure 6, the correlation formulas that estimate the percentage difference between the overall efficiencies ()/ was deduced as follows:
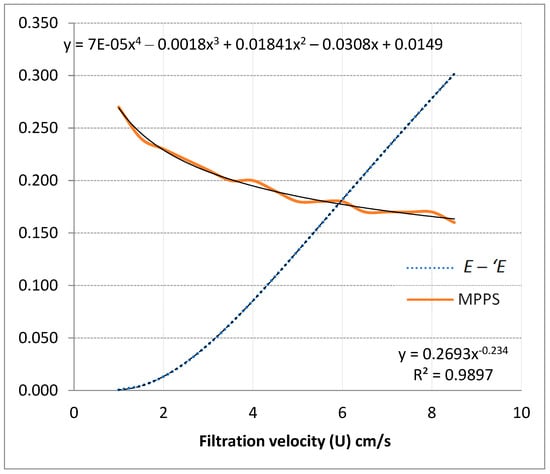
Figure 6.
Filtration velocity effect on MPPS (µm) and efficiency (E and ′E).
Based on the modeling conditions shown in Table 1 and Table 2, the MPPS values are equal to an R2 of 1 and 0.9876, which shows the correlation between the values and the filtration velocity (U). Figure 6, there indicates is an inverse correlation between the MPPS and filtration velocities. At the same time, a straight line connects the filtration speed to the difference in the two ways of figuring out the overall fiber efficiency, E, at the MPPS. At a speed of 5.96 cm/s, a pivotal interception happened, matching both values with the uranine aerosol’s median aerodynamic diameter mass of 0.18 µm, as shown in Equation (13).
Based on the representative values provided above and a comprehensive assessment of HEPA filter evolution in emerging nuclear power generation reactors, this study reaffirms that filtration velocities exceeding 3 cm/s result in achieving the recommended MPPS values. It makes sense to use the independent approach (′η) to figure out the overall fiber efficiency, especially at higher filtration speeds where the modeling percentage difference between the two approaches (η and ′η) grows. However, it is worth noting that the use of both approaches remains acceptable in other industrial sectors, particularly at velocities lower than 3 cm/s.
In their research, (Ramarao et al., 1994) [8] demonstrated that, when the fibrous filter medium is homogeneous, the independent approach provides a more accurate approximation for calculating the overall efficiency. Current modeling clearly supports the use of an independent approach in efficiency modeling studies by predetermining all internal conditions for calculations. However, it is important to note that it highlights potential variations in overall efficiencies that were not considered when dealing with actual case values, especially because of the diversity of the filter media. Nevertheless, this study provides evidence that using both approaches does not significantly impact MPPS values.
Although the current modeling approach provides valuable insights, it simplifies certain complexities inherent to real-world HEPA filters. Specifically, the model does not account for medium heterogeneities, such as variations in the packing density and thickness, fiber size distribution, and velocity gradients.
- Medium Heterogeneities: Variations in packing density and thickness can create localized regions with differing filtration performance. These heterogeneities can significantly affect the overall efficiency of the filter by altering the flow pathways and particle capture dynamics.
- Fiber Size Distribution: Real HEPA filters typically exhibit a polydisperse fiber size distribution, which affects the interaction between particles and fibers. The uniform fiber diameter assumptions in the model do not capture the full range of interactions that occur in actual filter media, potentially leading to discrepancies between the modeled and experimental efficiencies.
- Velocity Gradients: Non-uniform flow distribution through the filter can result in velocity gradients that influence particle capture mechanisms. Areas of higher velocity may enhance impaction and interception, where as those of lower velocity may improve diffusion-based capture.
To address these limitations, future research should focus on developing sophisticated models that incorporate these factors. Such models would provide a more accurate representation of HEPA filter performance under various operational conditions. Additionally, experimental studies should aim to quantify the impact of these variables to validate and refine the advanced models.
3.5. Model-Experimental Comparison at Different Velocities
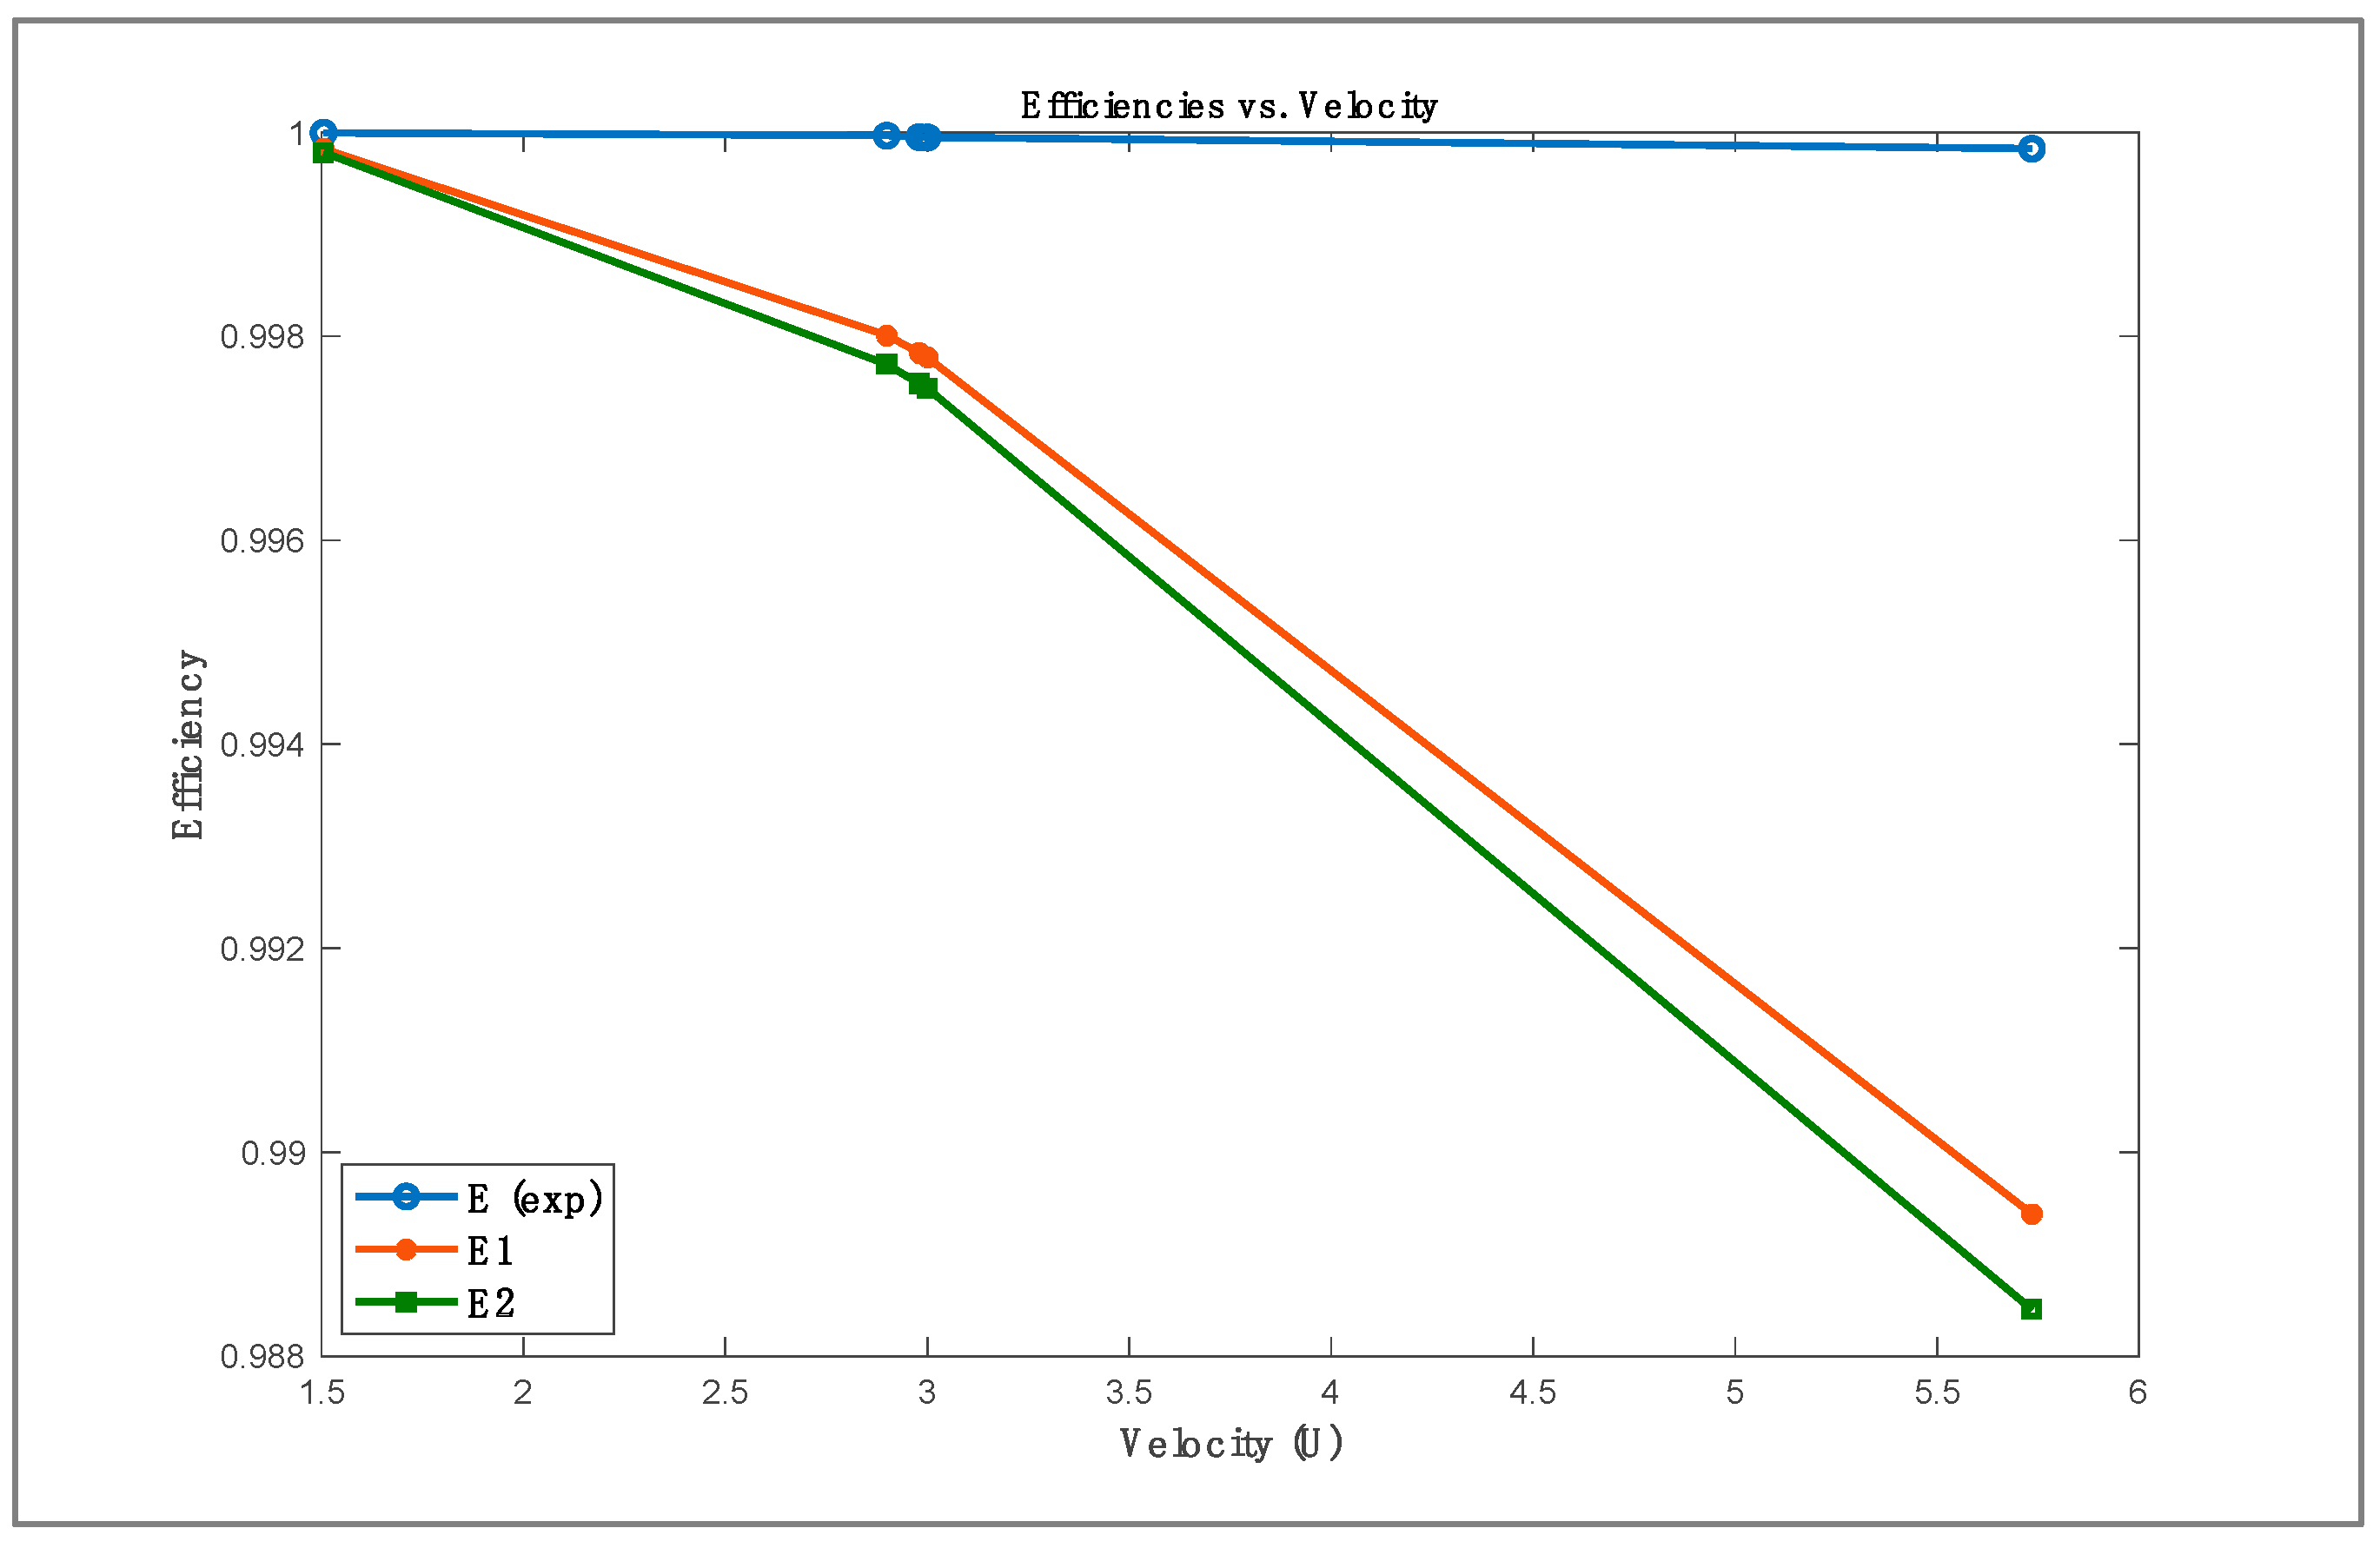
To analyze the efficiency–performance difference between the two approaches under study against a range of filtration velocities, Figure 6 was produced using the data in Table 3 and the experimental data.
Both theoretically calculated efficiencies exhibited a maximum deviation of 1.14% from the experimental efficiency. These experimental results validate the theoretical observation of an inverse relationship between filtration velocity and efficiency using the model’s two approaches.
According to Equation (2), the change in filtration velocity affects the particle collection mechanisms of impaction and diffusion but theoretically has no effect on interception. The increase in filtration velocity will increase the Peclet number and decrease the capture by diffusion, which is evident in Equation (1). Conversely, Equation (3) governs an increase in filtration velocity, leading to an increase in the Stokes number and capture by impaction. In practice, the filtration velocity may affect the adhesion of particles to the fibers. Ramarao et al. (1994) [8] measured the single fiber efficiency due to impaction for particles with diameters larger than 5 µm at different filtration velocities and Stokes number critical values. Filtration velocities lower than 5 cm/s showed greater adhesion efficiency because the fibers did not vibrate in the gas stream at such rates. This study’s model revealed (Figure 3) that diffusion and interception are the dominant mechanisms in the MPPS. Thus, an increase in filtration velocity will mainly reduce the particle collection by distribution and decrease the efficiency and particle diameter at the MPPS.
A comparison between the model predictions and experimental results in Figure 7 reveals notable discrepancies. Several factors, not fully accounted for in the model, account for these differences. First, the fact that real HEPA filters have a wide range of fiber sizes means that they capture particles more or less effectively than models that assume all fibers have the same diameter. Second, the model does not look at how uranine particles’ electrostatic charges might affect particle capture. Charged particles and neutral fibers could work together to create image forces that make particle capture better. Additionally, localized variations in packing density and thickness within the filter medium can create uneven flow distributions, further contributing to the observed differences.
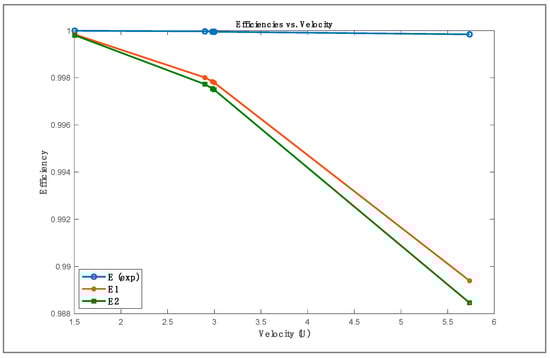
Figure 7.
Models and experimental filter efficiencies vs. velocity.
Furthermore, uncertainties in the porous structural properties, such as variations in the fiber alignment and density, could affect the overall filtration performance. The model’s simplification of these properties may not fully reflect the complex interactions occurring within the actual filter media. These unmodeled parameters highlight the need for more sophisticated modeling approaches that incorporate medium heterogeneities and fiber size distributions to improve predictive accuracy. Future studies should focus on developing models that account for these factors to provide a more comprehensive understanding of HEPA filter performance under various operational conditions.
This study proposes a hypothesis to elucidate the evolving disparity between theoretical and experimental efficiencies, given the absence of filter clogging and cake formation in uranine measurements. This divergence may be attributed to uncertainties in the porous structural properties, the polydispersity of fibers unaccounted for in the model, and the electrostatic charges of uranine particles. Even though these charges are minimal, they potentially enhance particle capture through electrostatic mechanisms, such as image forces, involving neutral fibers and charged particles. Notably, this electrostatic mechanism is not considered in the model.
3.6. Fiber Diameter Implications
The importance of the fiber diameter in the efficiency calculations should not be underestimated. Within the mechanistic model, calculations involved preselected fiber diameters (df) ranging from 0.1 to 1.5 µm, considering particles with a diameter of 0.18 µm and a filtration velocity of 3 cm/s. Figure 8 illustrates a direct nonlinear relationship between fiber diameter and Penetration (P and ′P). However, in terms of efficiency, there is an inverse relationship between the fiber diameter and overall efficiency.
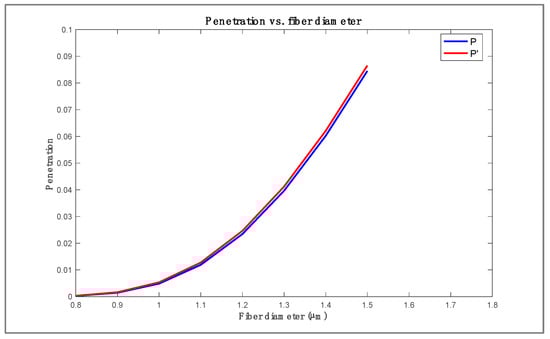
Figure 8.
Relationship between penetration and fiber diameter.
A notable shift in the overall single-fiber collection efficiency became evident when the fiber diameter exceeded approximately 0.85 µm. The total single-fiber efficiency (η) was determined by comparing the percentages derived from both the additivity and independence methods. It is worth noting that this variation had a negligible effect on the fiber diameter estimates.
3.7. 3D Visualization of Filter Performance
The filter model was leveraged to create and simulate performance across various scenarios and conditions, gaining a more comprehensive understanding of filter behavior across abroad spectrum of key variables and parameters. This three-dimensional visualization not only provides insights into how the filter operates under different settings, but also allows us to explore its responses to changes in particle size, flow velocities, and other critical factors, as well as the manner in which they interact. By generating these visual representations, we aimed to unveil intricate patterns and trends within the data, facilitating a deeper appreciation of the filter’s performance dynamics. Figure 9 depicts the filter performance in two scenarios: (a) a fixed particle diameter (dp) of 0.3 with variable fiber diameter (df) and velocity (U), and (b) a fixed velocity of 0.026 m/s with dynamic values of dp and df.
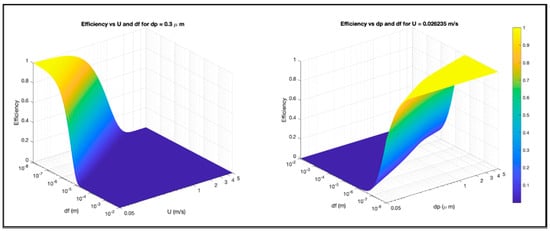
Figure 9.
Visualization of HEPA filter performance at (left) fixed particle size of 0.3 µm and (right) fixed velocity at 0.026 m/s.
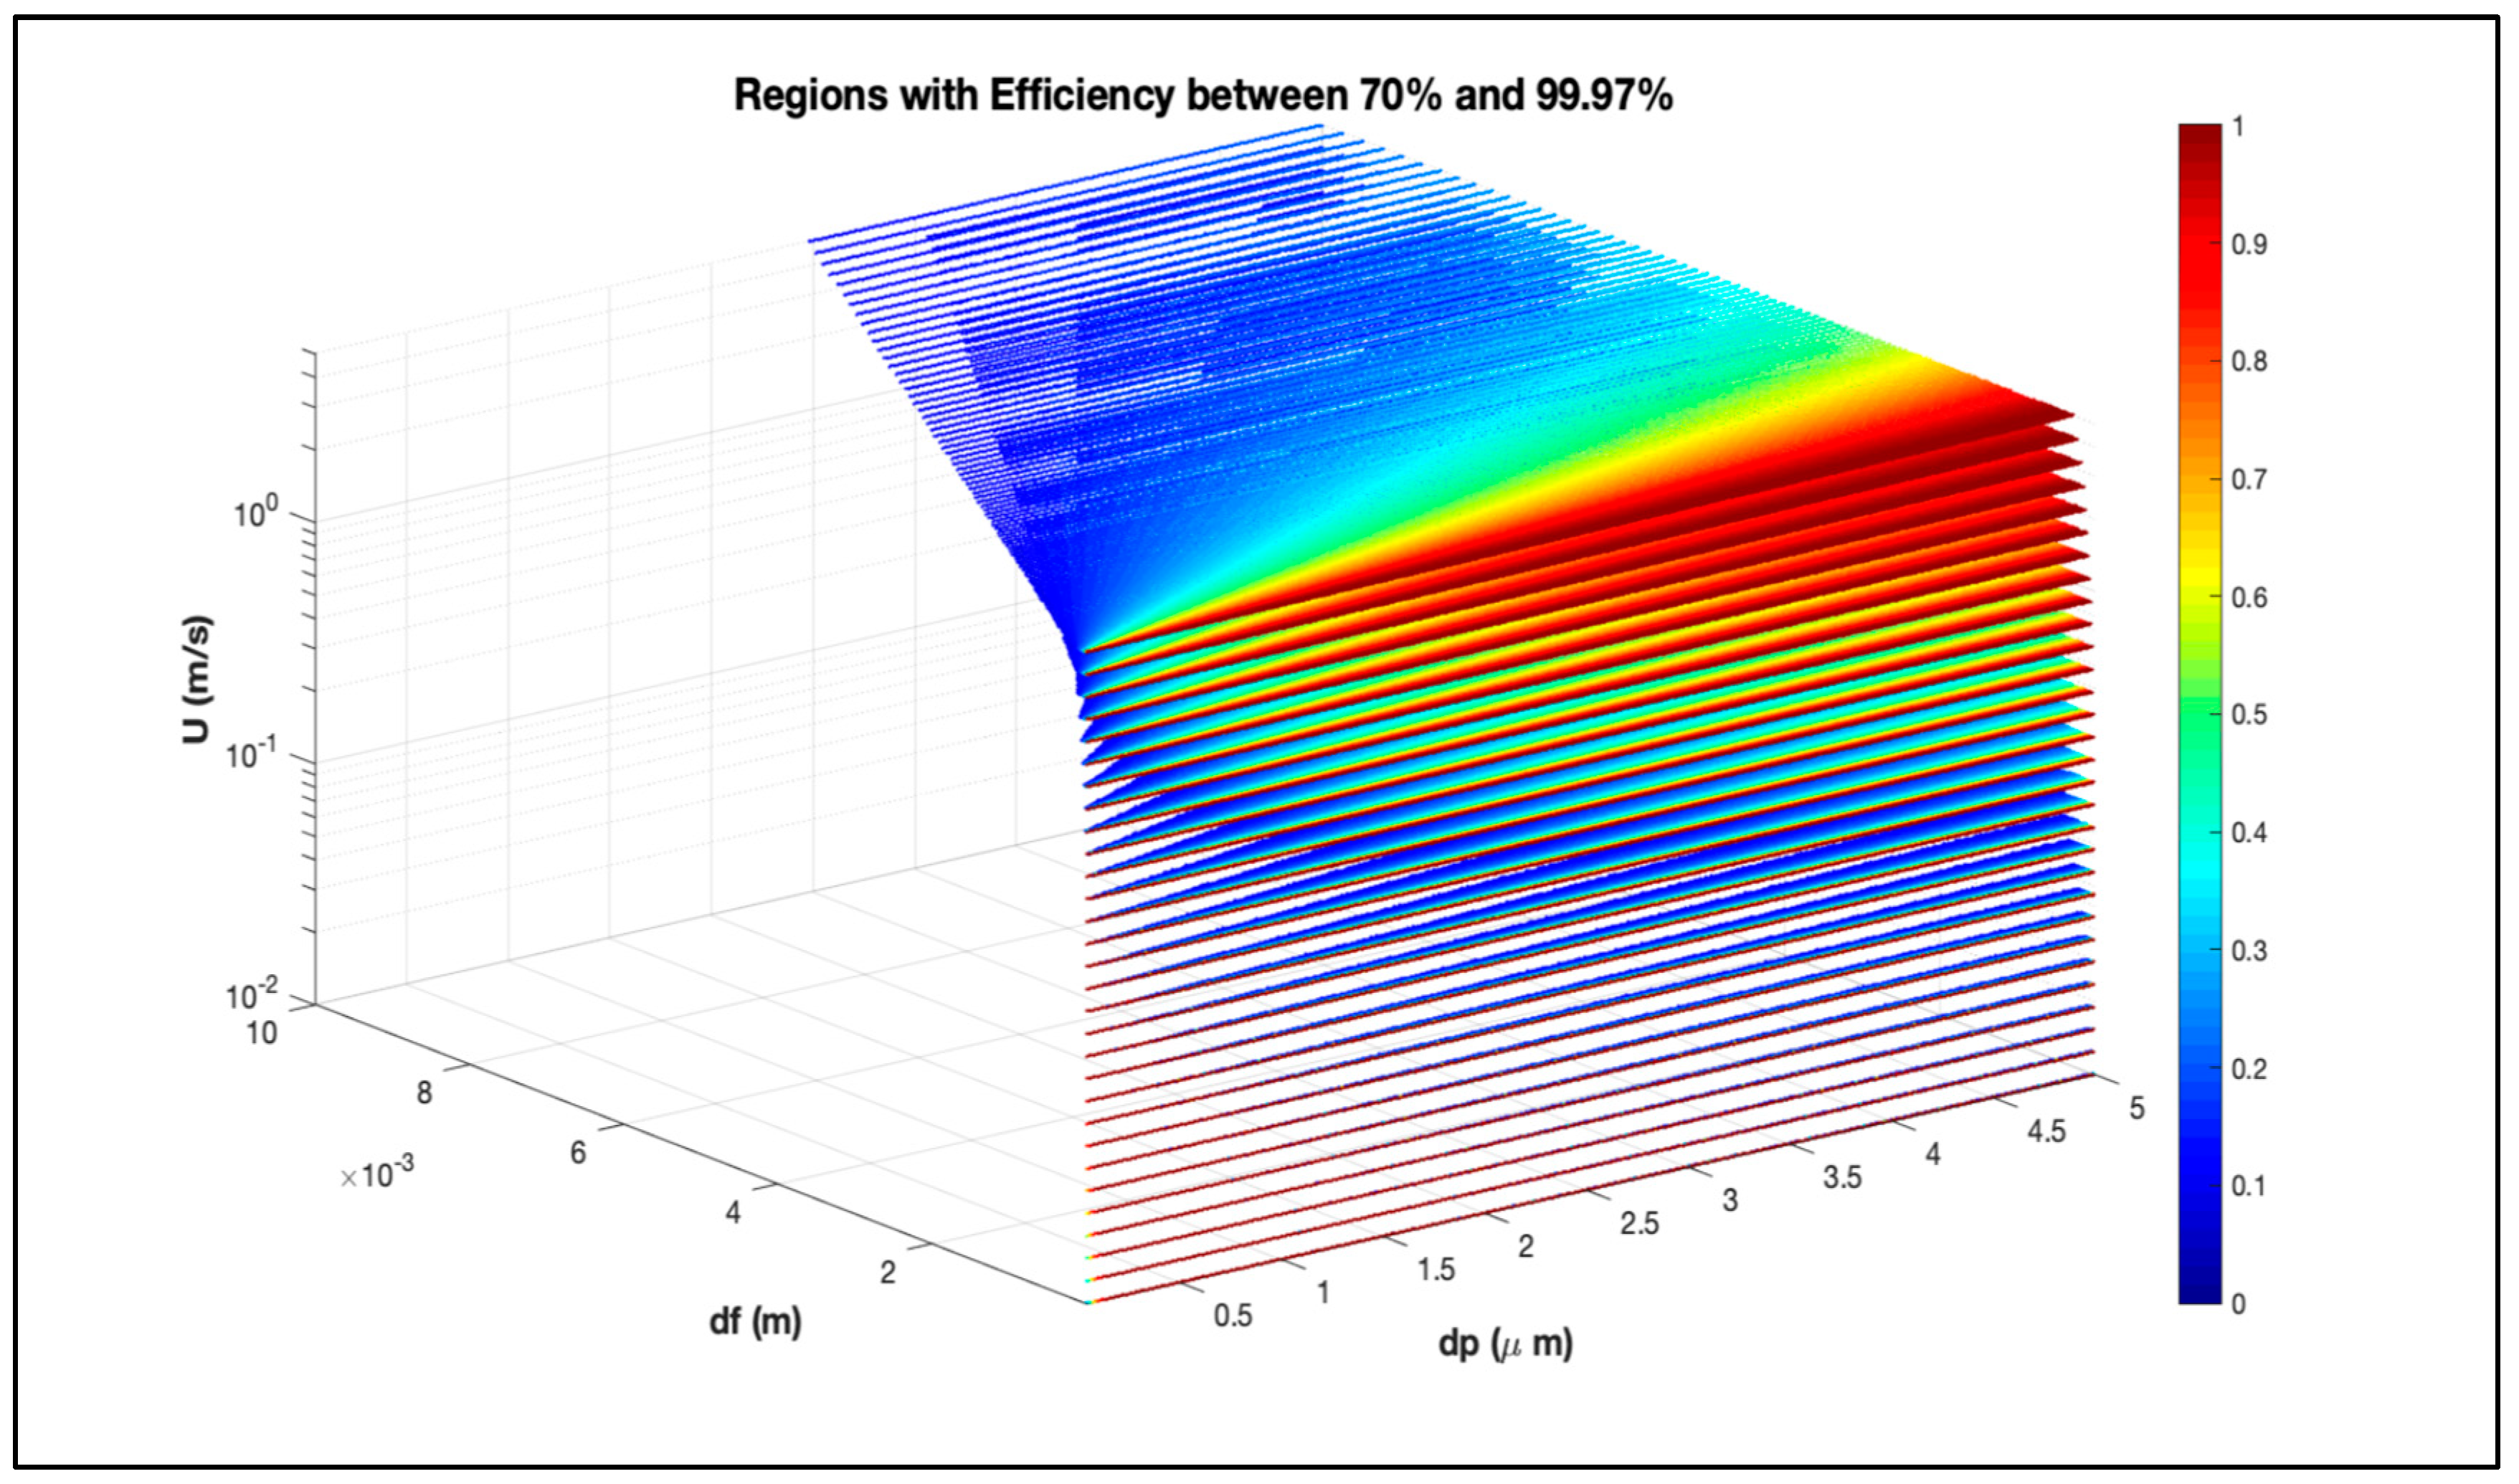
In the left plot of Figure 9, the efficiency is visualized as a function of df and U for a constant dp of 0.3 µm. Here, efficiency displayed a distinctive peak, suggesting optimal conditions for lower df and U values. Conversely, the plot on the right shows df and dp’s efficiency at a fixed U value of 0.026235 m/s. The surface again highlights a prominent peak, signifying regions of maximal efficiency with larger dp and smaller df. The color gradient, spanning from blue to yellow, represents the efficiency range, with yellow indicating higher values. Figure 10 goes one step further with this visualization test by mapping the complex interactions of the three key variables (dp, df, and U) in a 3D space. This shows how the combined changes in these variables shape the behavior of the filter and determine how well it works.
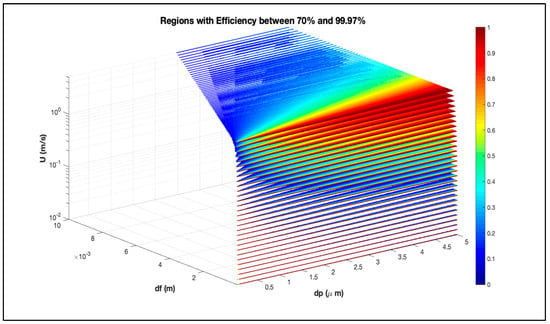
Figure 10.
A 3D visualization of HEPA filter efficiency performance across a wide range of velocities, fibers, and particle diameters.
As shown in Figure 10, the 3D graph demonstrates the dynamic interplay among the three main variables (dp, df, and U). The color gradient highlights regions of efficiency between 70% and 99.97%, offering a clear visual representation of how these factors collectively influence filter efficiency. The surface structure reveals the conditions under which the filter performs the best. Larger particles, smaller fiber diameters, and lower velocities, as expected, achieved the maximum efficiency in particle capture.
4. Conclusions
Investigations into nuclear-grade HEPA filters have yielded significant insights into their particle capture efficiency and overall performance. The study selection involved rigorous modeling and experimental validation, revealing critical parameters that influence filter efficiency, such as fiber diameter, particle size, and filtration velocity. The optimal filtration velocities exceeding 3 cm/s were identified as crucial for achieving the Most Penetrating Particle Size (MPPS) and we discovered a critical threshold in fiber diameter, beyond which particle penetration increased substantially. These findings enhance the understanding of filtration dynamics and provide actionable guidelines for improving the HEPA filter design in nuclear applications.
The systematic model simulations, based on predetermined parameters, experimental data, and operating conditions, confirmed the model’s consistency with established filtration theory, with results from thorough comparisons within a 1.14% deviation. These findings indicate that filtration velocities exceeding 3 cm/s are optimal for achieving MPPS values in real-world applications. A slight reduction in the overall filter efficiency within the 5–6 cm/s range, particularly in the uranine collection scenarios, suggests a potential upper threshold of velocity. Minimal disparities between the two modeling approaches in the 0.1–0.3 µm fiber diameter range confirm modeling robustness. However, a significant shift in particle collection efficiency becomes evident when fiber diameters exceed approximately 0.85 µm. These results show that the independent approach is more accurate when figuring out overall efficiency, particularly at higher filtration velocities, offering a valuable methodological advantage for future HEPA filter modeling endeavors and enhancing understanding of filtration dynamics and optimal filtration velocity selections.
Author Contributions
All authors, A.A.D., M.A.-A., K.K., M.F., A.A., L.A.-H. and A.J., contributed to the conception and design of the study. Material preparation and data collection and analysis were performed by A.A.D., M.A.-A. and A.J. The first draft of the manuscript was written by A.A.D., and all the authors commented on the previous versions of the manuscript. All authors have read and agreed to the published version of the manuscript.
Funding
The authors declare that no funds, grants, or other support were received during the preparation of this manuscript, other than the acknowledged institutions that support and collaborate in the research work that has been performed. Financial interests: authors (the authors) declare that they have no relevant financial or nonfinancial interests to disclose.
Institutional Review Board Statement
Not applicable.
Informed Consent Statement
Not applicable.
Data Availability Statement
The data presented in this study are available on request from the corresponding author due to the privacy of this data.
Acknowledgments
The authors are profoundly grateful to IMT Atlantique, France, the Budapest University of Technology and Economics (BME), the Jordan Atomic Energy Commission (JAEC), and the Applied Science Private University for their steadfast support and esteemed collaboration throughout this scientific review. Additionally, we extend our heartfelt appreciation to the core laboratory facilities at Hamad Bin Khalifa University, Qatar. Their expertise and meticulous assistance in capturing exceptional SEM images of our HEPA filter sample have been pivotal in elevating our research endeavors.
Conflicts of Interest
The authors declare no conflict of interest.
Abbreviations
| HEPA | High-Efficiency Particulate Air |
| MPPS | Most Penetrating Particle Size |
| IAEA | International Atomic Energy Agency |
| NSRPR | Nuclear Safety and Radiation Protection Regulations |
| SEM | Scanning Electronic Microscopy |
| E | Overall efficiency, Equation (7) |
| η | Total single fiber efficiency, Equations (5) and (6) |
| ηD | Single fiber efficiency by diffusion, Equation (1) |
| ηR | Single fiber efficiency by interception, Equation (2) |
| ηI | Single fiber efficiency by inertial impaction, Equation (3) |
| α | Medium packing density, 0.008 < α < 0.151 |
| R | Characteristic number, R = dp/df; 0.0045 < R < 0.12 |
| dp | Particle diameter, 0.05 ≤ dp ≤ 5 µm |
| df | Fiber diameter µm |
| Uf/U | Superficial velocity, 1 < uf < 30 cm/s |
| ρP | Particle density: 1500 kg/m3 |
| µ | Fluid dynamic viscosity |
| t | Thickness of the filter |
| Pe | Peclet number |
| St | Stokes number |
References
- Faouri, S.; AlBashayreh, M.; Azzeh, M. Examining stability of machine learning methods for predicting dementia at early phases of the disease. arXiv 2022, arXiv:2209.04643. [Google Scholar] [CrossRef]
- Mansour, M.A.; Beithou, N.; Othman, A.; Qandil, A.; Khalid, M.B.; Borowski, G.; Alsaqoor, S.; Alahmer, A.; Jouhara, H. Effect of liquid saturated porous medium on heat transfer from thermoelectric generator. Int. J. Thermofluids 2023, 17, 100264. [Google Scholar] [CrossRef]
- Yuan, X.; Zuo, J.; Ma, R.; Wang, Y. How would social acceptance affect nuclear power development? A study from China. J. Clean. Prod. 2017, 163, 179–186. [Google Scholar]
- Bresson, J. High-Efficiency Particulate air Filter Test Activities at the Department of Energy; 1987; Available online: https://inis.iaea.org/search/search.aspx?orig_q=RN:20015811 (accessed on 17 April 2024).
- Burchsted, C.; Kahn, J.E.; Fuller, A.B. Nuclear Air Cleaning Handbook: Design, Construction, and Testing of High-Efficiency Air Cleaning Systems for Nuclear Application; Oak Ridge National Laboratory: Oak Ridge, TN, USA, 1976. [Google Scholar]
- Lee, K.; Liu, B. Theoretical study of aerosol filtration by fibrous filters. Aerosol Sci. Technol. 1982, 1, 147–161. [Google Scholar] [CrossRef]
- Kuwabara, S. The forces experienced by randomly distributed parallel circular cylinders or spheres in a viscous flow at small Reynolds numbers. J. Phys. Soc. Jpn. 1959, 14, 527–532. [Google Scholar] [CrossRef]
- Ramarao, B.V.; Tien, C.; Mohan, S. Calculation of single fiber efficiencies for interception and impaction with superposed Brownian motion. J. Aerosol Sci. 1994, 25, 295–313. [Google Scholar]
- Gilbert, H. High-Efficiency Filter in Nuclear Air Cleaning; 1987. Available online: https://www.nrc.gov/docs/ML2023/ML20237K506.pdf (accessed on 17 April 2024).
- Osaki, M.; Kanagawa, A. Performance of high-efficiency particulate air filters under severe conditions. Nucl. Technol. 1989, 85, 274–284. [Google Scholar]
- Alderman, S.L.; Parsons, M.S.; Hogancamp, K.U.; Waggoner, C.A. Evaluation of the effect of media velocity on filter efficiency and most penetrating particle size of nuclear grade high-efficiency particulate air filters. J. Occup. Environ. Hyg. 2008, 5, 713–720. [Google Scholar] [CrossRef]
- Association, J.A.C. Studies on in-place test of high efficiency particulate air filters in nuclear fuel facilities. Kuki Seijo 1983, 21, 1–19. [Google Scholar]
- IAEA. Comparison of High Efficiency Particulate Filter Testing Methods; IAEA: Vienna, Austria, 1985. [Google Scholar]
- Abdallah, S.; Nasir, M.; Afaneh, D. Performance evaluation of spherical and pyramid solar stills with chamber stepwise basin. Desalination Water Treat. 2021, 218, 119–125. [Google Scholar] [CrossRef]
- Kassai, M.; Al-Hyari, L. Investigation of ventilation energy recovery with polymer membrane material-based counter-flow energy exchanger for nearly zero-energy buildings. Energies 2019, 12, 1727. [Google Scholar] [CrossRef]
- Shaw, D.; Blundell, N. Analysing causes of avoidable waste in complex systems: A case study from the nuclear industry. J. Clean. Prod. 2014, 85, 41–50. [Google Scholar] [CrossRef]
- Bergman, W.; Sawyer, S. Development of a High-Efficiency, High-Performance Air Filter Medium; Lawrence Livermore National Lab.: Livermore, CA, USA, 1988. [Google Scholar]
- Bourrous, S.; Ribeyre, Q.; Lintis, L.; Yon, J.; Bau, S.; Thomas, D.; Vallières, C.; Ouf, F.-X. A semi-automatic analysis tool for the determination of primary particle size, overlap coefficient and specific surface area of nanoparticles aggregates. J. Aerosol Sci. 2018, 126, 122–132. [Google Scholar] [CrossRef]
- Xu, B.; Liu, J.; Ren, S.; Yin, W.; Chen, Q. Investigation of the performance of airliner cabin air filters throughout lifetime usage. Aerosol Air Qual. Res. 2013, 13, 1544–1551. [Google Scholar] [CrossRef]
- Abraham, M.E. Microanalysis of Indoor Aerosols and the Impact of a Compact High-Efficiency Particulate Air (HEPA) Filter System. Indoor Air 1999, 9, 33–40. [Google Scholar] [CrossRef]
- Shim, E.; Jang, J.-P.; Moon, J.-J.; Kim, Y. Improvement of Polytetrafluoroethylene Membrane High-Efficiency Particulate Air Filter Performance with Melt-Blown Media. Polymers 2021, 13, 4067. [Google Scholar] [CrossRef]
- Arunkumar, R.; Hogancamp, K.U.; Parsons, M.S.; Rogers, D.M.; Norton, O.P.; Nagel, B.A.; Alderman, S.L.; Waggoner, C.A. High-efficiency particulate air filter test stand and aerosol generator for particle loading studies. Rev. Sci. Instrum. 2007, 78, 085105. [Google Scholar] [CrossRef]
- Al-Ghriybah, M.; Alnsour, M.A.; Al-Hyari, L. Using Weibull distribution model for wind energy analysis of small-scale power generation at Al-Salt city in Jordan. Model. Earth Syst. Environ. 2023, 9, 2651–2661. [Google Scholar] [CrossRef]
- ISO. New Standard for EPA, HEPA and ULPA Filters; ISO: Geneva, Switzerland, 2017. [Google Scholar]
- Schweinheim, C. Setting standards for HEPA filter efficiency. Filtr. Sep. 2015, 52, 13–15. [Google Scholar] [CrossRef]
- Xu, T.; Lan, C.H.; Jeng, M.S. Performance of large fan-filter units for cleanroom applications. Build. Environ. 2007, 42, 2299–2304. [Google Scholar] [CrossRef]
- ISO 29463; High-Efficiency Filters and Filter Media for Removing Particles in Air-Part 3: Testing Flat Sheet Filter Media. International Organization for Standardization: Geneva, Switzerland, 2011. Available online: https://www.iso.org/standard/51837.html (accessed on 8 July 2024).
- Zhou, B.; Shen, J. Comparison Of HEPA/ULPA Filter Test Standards between America And Europe. 2007. Available online: https://www.irbnet.de/daten/iconda/CIB7011.pdf (accessed on 17 April 2024).
- Wilcox, M.; Kurz, R.; Brun, K. Technology Review of Modern Gas Turbine Inlet Filtration Systems. Int. J. Rotating Mach. 2012, 2012, 128134. [Google Scholar] [CrossRef]
- Benmansour, A.; Hamdan, M.A.; Bengeuddach, A. Experimental and numerical investigation of solid particles thermal energy storage unit. Appl. Therm. Eng. 2006, 26, 513–518. [Google Scholar] [CrossRef]
- EN 1822-1; High Efficiency Air Filters (EPA, HEPA, and ULPA)—Part 1: Classification, Performance, Testing, Marking. Standard. European Committee for Standardization: Brussels, Belgium, 2009. Available online: https://www.emw.de/en/filter-campus/filter-classes.html (accessed on 8 July 2024).
- ISO 14644-1; Cleanrooms and Associated Controlled Environments—Part 1: Classification of Air Cleanliness. ISO: Geneva, Switzerland, 2015; 44p. Available online: https://www.iest.org/Standards-RPs/ISO-Standards/ISO-14644-Series/IEST-Guides-to-ISO-14644-Standards (accessed on 8 July 2024).
- Purchas, D.B.; Sutherland, K. CHAPTER 5—Air and Gas Filter Media. In Handbook of Filter Media, 2nd ed.; Elsevier eBooks; Elsevier: Amsterdam, The Netherlands, 2002; pp. 153–200. [Google Scholar] [CrossRef]
- Comsan, M.N. Proceedings of the Third Environmental Physics Conference (EPC-2008). 2009. Available online: https://www.osti.gov/etdeweb/biblio/21301784 (accessed on 8 July 2024).
- IAEA. Particulate Filtration in Nuclear Facilities; International Atomic Energy Agency: Vienna, Austria, 1991. [Google Scholar]
- Linder, P. Air Filters for Use at Nuclear Facilities; 1970; Available online: https://inis.iaea.org/collection/NCLCollectionStore/_Public/34/065/34065171.pdf (accessed on 17 April 2024).
- Parthasarthy, P.; Shome, J. High Efficiency Particulate Air Filtration and Monitoring System for an Underground Nuclear Waste Repository; 1987; Available online: https://inis.iaea.org/search/search.aspx?orig_q=RN:20015811 (accessed on 17 April 2024).
- Djouider, F. Performance Evaluation of High Efficiency Particulate Filters for the Removal of Sub-Micrometer Radioactive Aerosols in Nuclear Power Reactors. Simulation Study. J. King Abdulaziz Univ. Eng. Sci. 2023, 33, 11. [Google Scholar]
- Alilou, Y.; Bardin-Monnier, N.; Thomas, D.; Bourrous, S.; Lemaître, P.; Gélain, T. Development of a semi-analytical model to predict the pressure drop of clean pleated high-efficiency particulate air filters. Can. J. Chem. Eng. 2023, 101, 1623–1632. [Google Scholar] [CrossRef]
- Lück, R.; Lu, K.; Frantz, W. JMA analysis of the transformation kinetics from the amorphous to the nanocrystalline state. Scr. Metall. Mater. 1993, 28, 1071–1075. [Google Scholar] [CrossRef]
- Hinds, W.C. Aerosol Technology: Properties, Behavior, and Measurement of Airborne Particles. 1999. Available online: https://lib.ugent.be/en/catalog/rug01:000658373 (accessed on 17 April 2024).
- Chuanfang, Y. Aerosol filtration application using fibrous media—An industrial perspective. Chin. J. Chem. Eng. 2012, 20, 1–9. [Google Scholar]
- Ciorîță, A.; Suciu, M.; Coroş, M.; Varodi, C.; Pogăcean, F.; Măgeruşan, L.; Mirel, V.; Ștefan-van Staden, R.I.; Pruneanu, S. Antibacterial Enhancement of High-Efficiency Particulate Air Filters Modified with Graphene-Silver Hybrid Material. Microorganisms 2023, 11, 745. [Google Scholar] [CrossRef]
- First, M. Air and Gas Cleaning Technology for Nuclear Applications. ASHRAE Trans.; (United States), 1986. 92 (CONF-860106-). Available online: https://www.osti.gov/biblio/7243063 (accessed on 17 April 2024).
- Joubert, A.; Laborde, J.C.; Bouilloux, L.; Calle-Chazelet, S.; Thomas, D. Influence of humidity on clogging of flat and pleated HEPA filters. Aerosol Sci. Technol. 2010, 44, 1065–1076. [Google Scholar] [CrossRef]
- Al-Attar, I.S. The Effect of Pleating Density and Dust Type on Performance of Absolute Fibrous Filters. Doctoral Dissertation, Loughborough University, Loughborough, UK, 2011. [Google Scholar]
- Gougeon, R. Liquid Aerosol Filtration by Fibrous Filters in Interception and Inertial Regimes; Filtration des Aerosols Liquides par les Filtres a Fibres en Regimes Dinterception et Dinertie. 1994. Available online: https://www.osti.gov/etdeweb/biblio/411280 (accessed on 17 April 2024).
- Polat, Y.; Calisir, M.; Gungor, M.; Sagirli, M.N.; Atakan, R.; Akgul, Y.; Demir, A.; Kilic, A. Solution blown nanofibrous air filters modified with glass microparticles. J. Ind. Text. 2021, 51, 821–834. [Google Scholar] [CrossRef]
- NFX 44 011-1972; Superseded, Air Cleaning Devices—Method of Measuring Filter Efficiency Using a Uranine (Fluorescent) Aerosol, Superseded Date, 01-11-2016, Published date, 12-01-2013. Association Francaise de Normalisation: Saint-Denis, France, 2013. Available online: https://www.boutique.afnor.org/fr-fr/norme/nf-x44011/separateurs-aerauliques-methode-de-mesure-de-lefficacite-des-filtres-au-moy/fa009648/14606 (accessed on 8 July 2024).
- Hinds, W.C.; Zhu, Y. Aerosol Technology: Properties, Behavior, and Measurement of Airborne Particles; John Wiley & Sons: Hoboken, NJ, USA, 2022. [Google Scholar]
- ISO 16170: 2016; In Situ Test Methods for High Efficiency Filter Systems in Industrial Facilities. ISO: Geneva, Switzerland, 2017. Available online: https://www.iso.org/standard/55785.html (accessed on 8 July 2024).


Disclaimer/Publisher’s Note: The statements, opinions and data contained in all publications are solely those of the individual author(s) and contributor(s) and not of MDPI and/or the editor(s). MDPI and/or the editor(s) disclaim responsibility for any injury to people or property resulting from any ideas, methods, instructions or products referred to in the content. |
© 2024 by the authors. Licensee MDPI, Basel, Switzerland. This article is an open access article distributed under the terms and conditions of the Creative Commons Attribution (CC BY) license (https://creativecommons.org/licenses/by/4.0/).