Article

Modern Insulation Materials for Sustainability Based on Natural Fibers: Experimental Characterization of Thermal Properties

Department of Energy Conversion Engineering, Faculty of Mechanical and Power Engineering, Wroclaw University of Science and Technology, 27 Wybrzeze Wyspianskiego Street, 50-370 Wroclaw, Poland
Fibers 2024, 12(9), 76; https://doi.org/10.3390/fib12090076
Submission received: 31 July 2024 / Revised: 2 September 2024 / Accepted: 16 September 2024 / Published: 18 September 2024

Abstract

:
The recycling of materials is in line with the policy of a closed-loop economy and is currently an option for managing waste in order to reuse it to create new products. To this end, 3D printing is being used to produce materials not only from pure polymers but also from their composites. Further development in this field seems interesting and necessary, and the use of recycled materials will help to reduce waste and energy consumption. This article deals with the use of degradable waste materials for the production of insulating materials by 3D printing. For the study, samples with different numbers of layers (one and five), composite thickness (20, 40, 60, 80, and 100 mm) and composition (including colored resins that were transparent, black, gray, and metallized, as well as resins that were colored gray using soybean oil and gray using natural fibers) were made. The role of natural fillers was played by glycerin and biomass ash with a weight ratio of 5%. The finished materials were tested, and the values of the coefficient of thermal resistance and heat transfer were determined. The best thermal properties among the tested materials were distinguished by a five-layer sample made of soybean-oil-based resin with a thickness of 100 mm. This sample’s heat transfer coefficient was: 0.16 W/m2K. As a material for thermal insulation in 3D printing technology, biodegradable components have great potential.

1. Introduction

In recent years, plastics recycling has become one of the leading environmental and waste management issues [1,2]. Recycling is considered the preferred waste management option because it allows the reuse of waste to create new products through 3D printing. Recently, research in 3D printing has focused not only on the production of plastic materials but also on the use of composite materials that have been doped with plastics. Bioplastics have emerged as an option for sustainable development, especially those that are biodegradable and compostable [3,4,5]. Further development in this area is both interesting and necessary, as the use of recycled materials helps to reduce waste and save energy and natural resources. One of the most promising applications of 3D printing technology in construction is the production of thermal insulation from recycled materials [1,6,7,8,9].

1.1. Cold Storage Facilities and Construction

Buildings, especially their cooling systems, significantly affect the environment through raw material usage and waste production. Energy efficiency in structures is crucial for lowering greenhouse gas emissions. The building sector accounts for 30–40% of global energy consumption, largely driven by heating and cooling needs. With this in mind, many countries are striving to improve the energy efficiency of buildings through the use of better insulation materials and envelope technologies, with directives such as the European Directive 2010/31/EU requiring new buildings to be “near zero energy” by 2020 [6,7,10,11]. The use of additively printed insulation made from industrial and construction waste can significantly reduce the carbon footprint of buildings and contribute to energy efficiency [12,13,14,15,16].
Insulation plays a very important role in reducing heat gain in refrigeration. The most commonly used insulation in refrigeration is plastic. These are mostly closed-cell plastics due to their parameters such as non-absorption of moisture, etc. [12,13,14,15,16,17]. Insulation materials used in the refrigeration and air conditioning industry include polyurethane, polystyrene, polyethylene, and rubber, as well as mineral fibers, i.e., mineral wool and glass wool. While these materials are effective at maintaining intended temperatures in buildings, they are made from non-renewable resources. As a result, there is a growing interest in alternative insulation materials made from renewable or recycled fibers. Natural fibers such as jute, flax, and hemp have proven to be suitable alternatives to mineral insulation and are the subject of many research projects [18,19,20,21]. In addition to the insulation material itself, optimizing the thickness of the building envelope is very important in reducing energy consumption in buildings. It is a key factor in heat loss. Designing high-performance insulation can significantly reduce the energy consumed by heating and cooling systems [22]. Several approaches can be used to improve the thermal performance of building envelopes, including the use of high-performance insulation materials and structural improvements to exterior insulation structures.

1.2. Organic Materials of Insulation

In recent years, the modernization and upgrading of existing structures has resulted in an increasing amount of insulation being sent for disposal. Non-biodegradable materials quickly fill landfills and become a disposal problem. This creates an environmental problem for developing countries that do not have adequate facilities to collect or recycle materials [1,23,24]. Considering the environmental issue, research is being carried out to find biodegradable insulation that is environmentally friendly. The use of green insulation in construction improves the thermal management of buildings and allows the use of environmentally friendly insulation materials. Current insulation materials, such as polyurethane, polystyrene foam, and mineral wool, have good physical properties, including low thermal conductivity. However, they are expensive to develop and are not suitable from the point of view of the environment and human health [7,25]. In the original development of refrigeration, natural products such as reed, peat, and hemp were used for insulation. Due to their promising properties, green composites using natural fillers as reinforcements are replacing traditional polymers reinforced with synthetic fibers, which are non-biodegradable and cause environmental concerns [1,10,26]. Agricultural waste can also be a good substitute for traditional insulation materials [6]. The agricultural industry generates huge amounts of waste that is compostable, renewable, and, most importantly, often has low thermal conductivity. Ongoing research on and applications of natural fiber-based composites have gained increasing attention in the current state of sustainable development.

1.3. Three-Dimensional Printing and Biodegradable Materials

Three-dimensional printing has provided a novel approach to the development and promotion of natural fiber-based composites and an important platform for the development of biomass materials for smart and industrialized manufacturing [27,28]. Three-dimensional printing technology is capable of producing fully functional parts from a wide range of materials. These include ceramics, polymers, and metals [29]. The use of various additive printing materials facilitates the creation of complex shapes and is often used for low-volume production in the aerospace, automotive, and medical industries [27]. The most well-known, indispensable, and widely used materials for 3D printing are polymers. They owe their popularity to characteristics such as good mechanical properties, low cost, easy availability, and adaptability to different printing techniques [27,28]. Thermoplastic polymer filaments are most commonly used in medical devices and biomaterials as inert materials that contribute to the efficient functioning of devices and provide mechanical support. With today’s technology, 3D printing can also produce ceramic and concrete objects without cracks or large pores. Ceramic is a durable, strong, fireproof material, but it is also brittle. It can be used in any geometry and shape due to its liquid state [22,28,30,31,32,33].
Composites are materials that contain more than one component. They have better physical properties than single materials. Recently, they have gained popularity due to their better availability and properties [34,35]. Examples of composite materials used for 3D printing include fiberglass polymers, carbon fiber polymers, and natural fillers. In addition to the main materials used in additive printing technology, other less common materials are also used. Three-dimensional printing technology can process and produce shape and geometry using food materials such as chocolate [28]. A more specific raw material is lunar dust, the process of making multilayer parts from which may have potential applications in future lunar colonization. Biodegradable materials are natural materials. Their properties are usually less favorable than those of materials that are not biodegradable. To reduce the production costs of some commonly used plastics, scientists have begun research into mixing them with other biodegradable materials and reinforcing them with biofibers. The availability of these materials as fillers for additive technology is their primary and very important advantage. Natural fiber composites have a lower environmental impact. This encourages further testing and development for their continued and expanded use [2,36]. Plastics are often reinforced with natural additives to improve their thermo-mechanical properties. However, the main reason for their limited use is the hygroscopicity of biofibers and their incompatibility with the hydrophobic matrix of polymers. The materials used for additive 3D printing (SLA 3D printing) are usually derived from oil-based substrates. To make 3D SLA additive manufacturing compatible with sustainability, the use of renewable (biodegradable) materials has become a research topic that is as important as 3D printing techniques. Unfortunately, there are few options for natural materials suitable for photopolymerization (SLA). However, some vegetable oils can be transformed to be suitable for this purpose [27,32,37]. These oils are renewable raw materials with high efficiency, low toxicity, biodegradability, and surface modification capabilities, making them very promising for SLA applications [32,36,37,38,39]. Researchers [40] conducted a detailed study using soybean oil (AESO). They performed FTIR and photorheology measurements on the UV curing of epoxidized acrylates from soybean-oil-based formulations. In their study, the researchers showed that adding appropriate functional comonomers, including trimethylolpropane triacrylate (TMPTA), and adjusting the photoinitiator concentration accordingly, in the range of 1% to 7%, can help reduce UV exposure time by up to 25%. In addition, thermal and mechanical properties were determined using TGA and DMA measurements. The authors observed a significant improvement in mechanical properties in all the formulations developed. These properties were further improved when reactive diluents were added. After thorough testing, it was concluded that the prepared vegetable-resin-based ink formulations with reactive diluents are suitable inks for AM-assisted UV printing, providing them the right viscosity. The researchers Tour et al. and Lin et al. [41] used soybean oil, natural polyphenols, and luminescent graphene to synthesize the inks. It is worth mentioning that the resulting materials were photocurable, biodegradable, and renewable.

1.4. Three-Dimensional-Printed Cellular Composites for Thermal Insulation

An effective way to improve thermal efficiency in buildings is to use air voids in partitions or insulation. This is a commonly used technique to increase thermal resistance.

Overview of 3D-Printed Cellular Composites’ Applications

In the available literature, there are many studies, both experimental and numerical, devoted to heat transfer in air cavities of various shapes and configurations.
Researchers Lorente and colleagues [42] created a simplified analytical model of the thermal behavior (conduction, convection, and radiation) for vertical air spaces with a large height-to-thickness ratio and for a series of spaces arranged in a row. Other researchers and co-authors, including Stefanizzi [43], analyzed the typical geometry of blocks with horizontal and vertical air-filled openings, taking into account the different average temperatures obtained by assigning different temperatures to surfaces perpendicular to the direction of heat flow. Their research showed that relying on standards to estimate the thermal resistance of air voids in certain geometric arrangements and boundary conditions can lead to significant errors. For example, voids in brick blocks with horizontal openings can be underestimated by as much as 40%. Al-Tamimi and colleagues [44] used finite element modeling (FEM) to determine the most effective cavity geometry for reducing heat flow in concrete masonry blocks and compared the results with the thermal insulation performance of commercially available blocks. In their study, the researchers showed that the newly designed block with optimized geometry achieved a significant improvement in thermal insulation of up to 71% compared to other models, including those currently on the market. Similarly, Suntharalingam and co-authors [30] used FEA to compare various concrete wall samples and evaluate the thermal performance of different geometric arrangements. The study showed that walls with multiple rows of cavities and internal baffles had significantly better thermal performance (U = 0.34 W/(m2·K)).
Structures with internal air voids, inspired by the geometric arrangement of bee honeycombs, have gained great popularity in various fields, especially in architecture [45]. Honeycomb structures are well known for their efficiency in energy applications. They also serve as excellent thermal barriers and heat sinks [22,46,47,48,49]. Zhu and co-authors [50] have analyzed the heat transfer mechanism in cement honeycomb structures (CHSs) using thermal infrared imaging technology. Their research showed that thermal diffusion through the cavities of the honeycomb pattern weakens layer by layer up to the surface.
The search for useful geometries to minimize heat transfer across opposing block surfaces has been widely discussed in the literature. In this context, the emerging and still little explored tool of 3D printing may be the optimal approach to explore new building envelope configurations to improve thermal performance due to its ability to produce complex geometries. Examples of the use of adynamic printing to produce thermal blocks are still few, although their number is growing rapidly.
Of the researchers working on this topic, de Rubeis and others have carried out the most extensive research [47]. They demonstrated the potential of additive printing for insulation systems through theoretical and experimental analysis of the thermal properties of a 3DFDM-printed polylactic acid (PLA) hollow block. The internal cavities of the block were then filled with various waste materials, such as polystyrene and wool, to evaluate the effect of the insulation materials on the thermal properties of the cavity. Subsequently, de Rubeis et al. [46] conducted theoretical and experimental analyses to study the thermal behavior of three blocks printed from PLA with different internal geometries: (i) multi-row structure, (ii) square structure, and (iii) honeycomb structure. The results showed that the hexagonal cells exhibited higher performance, indicating that increasing the complexity of the internal structure leads to a reduction in heat transfer. On the basis of this research, de Rubeis et al. [48] also studied a hexagonal cell block with cavities filled with various natural and recyclable insulation materials. The results showed that incorporating waste materials significantly improved the thermal performance of the 3D-printed block, reducing the heat transfer coefficient by up to 57%. De Rubeis et al., in a later study [22], tested 3DFD-printed blocks that were made of recyclable plastic and had different internal geometries based on hexagonal cells. The fabricated blocks were characterized by a constant cell size, while their vertical structures differed and were divided into three categories: (i) the hexagonal air cavities contained no horizontal baffles; (ii) the hexagonal air cavities contained three horizontal baffles, dividing the cells vertically into four parts; and (iii) the honeycomb structure was characterized by three horizontal baffles and an offset along the vertical axis. With his research, they showed a reduction in the heat transfer coefficient (U) of up to 11.5% by using horizontal baffles. Mihalache and co-authors [32] studied the effect of complex interior wall structures on thermal performance. The goal was to prevent overheating caused by thermal radiation. Dey and co-authors [37] have investigated the thermal performance of 3D-printed concrete panels for use as walls. They conducted tests to determine the thermal performance of 3D-printed panels containing two different void patterns with and without insulating material. Kaszynka and co-authors [31] compared the thermal properties of traditional walls with those of 3D-printed components. The researchers showed that insulating the printed structures was not problematic. The corrugated structure of the 3D-printed walls increased the adhesion of the adhesive mortar, promoting the effective attachment of thermal insulation. Suntharalingam et al. [30] and Cuevas et al. [51] studied various topological wall variations to identify the most energy-efficient configurations. Specifically, they analyzed 32 configurations with and without various insulation materials. The researcher Anwajler [2,36,49,52,53,54,55,56,57,58,59] has carried out extensive research using an additive method (3D printing) to produce insulating materials for use in various industries, construction, or thermal packaging of frozen foods. Together with other researchers, she analyzed cellular polymer composites produced mainly using 3D FDM, SLS, SLA, and DLP technologies. Her research focused on determining the effects of the internal structure of the core that fills the cellular composites, the different types of printing materials used, and the layering of the composites on their insulating properties. Ultimately, her work showed that printed composites could be used as effective thermal insulation materials, and the lowest thermal conductivity coefficient determined was 0.023 W/(m·K).
In conclusion, based on the literature review, it is clear that 3D printing is a method that has great potential for use in improving the thermal properties of insulation materials. First, 3D printing makes it possible to create very complex and precise geometries that would be difficult or impossible to produce using traditional methods. Second, additive technology makes it possible to use advanced topological optimization techniques to reduce weight while maintaining strength. It also makes it possible to create customized, personalized products without the added cost of tooling, molds, or dies and significantly reduces the time from concept to finished prototype, allowing for faster testing and iteration of designs. Another advantage of 3D printing technology is the ability to simultaneously print different materials in a single part, which can result in unique properties such as a hardness gradient or the mixing of materials of different colors. In 3D printing, materials are added layer by layer, which minimizes waste compared to subtractive methods, where large amounts of material are removed. Most importantly, depending on the printing technology, it is possible to control the internal properties of the structure, such as porosity, which can affect weight, thermal insulation, or energy absorption, and the ability to produce final parts directly from digital files eliminates the need for intermediate manufacturing steps. Most importantly, by minimizing waste, printing only the exact amount of material needed, and using biodegradable materials, 3D printing can be a more environmentally friendly alternative to traditional methods.
Based on the above discussion of the advantages of using the additive method, it is all the more noticeable that there is a major deficiency due to the lack of available publications in the literature and lack of research indicating the possibility of producing energy-efficient biodegradable thermal insulation and its wider application not only in construction but also in other industries and packaging. Therefore, the objective of this work is to experimentally determine the effect of 3D printing on the thermal properties of printed materials using a Voronoi diagram to produce a composite internal structure of innovative cellular composites with natural fillers. The sub-objective is to experimentally determine the correlation between the cellular structure, the type of material used to fabricate the composite and its layering, and the thermal properties, i.e., thermal conductivity, thermal resistance, and thermal transmittance, of the fabricated composites. Glycerin and wastepaper ash were used as natural fillers.

2. Materials and Methods

Due to their very good thermal insulation properties, closed-cell foams are one of the most promising options for their use as energy-efficient insulation materials. Therefore, an in-depth study of their thermal behavior when applied to 3D printing is of scientific and practical importance for the development of technologies for more efficient insulation materials. By studying foams made with additive technology, testing their different thicknesses, layering, and using different materials to make them, such as materials with different coefficients, it is possible to determine the optimal layer thickness and obtain a composite that provides the best thermal performance. The color of the material and natural additives can favorably affect the thermal performance of the cellular composite.
Closed-cell foams were selected for this study. Their cell structure was reproducible based on the Voronoi diagram [55]. The actual structure of cellular materials, such as closed-cell or open-cell foam, is typically characterized by random and complex geometry, including numerous and chaotic pores or cells, irregular cell shapes, and inhomogeneous cell walls. Initially, random Voronoi tessellation was used to geometrically model foam structures at the microstructural level. More recently, however, it has also been proposed for the reconstruction of two-dimensional (2D) and three-dimensional (3D) foam microstructures [60,61]. Therefore, in order to quantitatively analyze the thermal properties of real closed-cell foam, an efficient and simple algorithm has been developed to design a two-dimensional virtual microstructure with randomly distributed polygonal closed and non-overlapping pores. Using an advanced algorithm, the developed model allows a controlled local geometry which makes it possible to create different virtual foams with precisely adjustable parameters such as the number of pores and the thickness of the solid walls.
A Voronoi tessellation, also known as a Voronoi diagram, is created by constructing perpendicular bisectors between pairs of adjacent points so that each cell has several related neighbors [62]. Because of this specific property, Voronoi tessellation with random polygonal cells has been directly used to create meshes of complex shapes with a variety of convex polygons [62,63,64].

2.1. Research Material

A two-dimensional model of closed-cell foam based on a Voronoi diagram (Figure 1) was generated in Rhinoceros 7 software. Rhino 7 is a powerful 3D modeling and design program widely used in the design industry, architecture, product design, and many other fields. The program offers many features and tools for creating complex 3D shapes and designs and is easily expandable through the availability of additional plug-ins and modules. In this case, the plug-in used was Grasshopper, which has built-in modules based on more or less complex algorithms for creating complex figures, for example. Grasshopper has several components for creating Voronoi patterns. In this paper, I have investigated the use of Grasshopper’s 2D Voronoi components (Figure 2d)—based on a complex mech-staff division algorithm—to create, among other things, a two-dimensional Voronoi grid and its parameterization. The point generator count (Figure 2a) and seeding values (Figure 2b) can be set to control the configuration of the number and size of the pores. A two-dimensional Voronoi grid with the same number of pores is generated by randomly placing a set of starting points within a defined area of the 2D foam, and the number of polygonal cells is controlled by the number of these points.
Designed samples containing randomly distributed air voids with a cell count of 500 and solid walls with an internal wall thickness of 0.2 mm (Figure 3) were converted to .slt format and imported into a 3D printer program called Voxeldance Tango 4.0, where they were prepared and optimized for printing. The wall thickness of 0.2 mm was chosen experimentally in relation to the 3D printer used to produce the samples. The author was guided by the possibility of obtaining the thinnest wall possible (that the 3D printer is still capable of printing), in order to minimize, as much as possible, the effect of the thermal conductivity of the composite printing material used on the overall thermal conductivity of the composite. The coefficient of thermal resistance and the coefficient of heat transfer were determined for all printed samples (Figure 4), and the coefficient of heat transfer was determined. The samples were printed on an Elegoo Mars 4 3D printer using DLP technology. For the study, composite samples were made of resins with different emissivity coefficients (ε), i.e., transparent, metalized, black, and gray, as well as gray resin based on soybean oil and gray resin with a blend of natural fiber, i.e., ash and glycerin in a weight ratio of 5% (Figure 5). Single-layer specimens with composite thicknesses of 20, 40, 60, 80, and 100 mm and single-layer and five-layer specimens with composite thicknesses of 100 mm were prepared (Figure 6).
Vegetable oils are renewable raw materials with high efficiency, surface modification ability, low toxicity, and biodegradability. They are very promising and have applications in DLP technology [2]. The example used in this study was a resin based on soybean oil. The choice of printing materials of different colors was justified by the possibility of different emissivity coefficients of the produced composites. Accordingly, the gray samples have a low emissivity coefficient and reflect light well, resulting in lower energy absorption and heat emission. The subsequent black and transparent samples are characterized by a high emissivity coefficient, resulting in the fact that they effectively emit heat. In addition, their low reflectance causes them to absorb more light than gray samples [36]. Metallized samples, on the other hand, are characterized by low emissivity and low thermal reflectivity. The choice of glycerin is justified by its properties. It is a colorless, odorless substance and easily miscible with water. Its coefficient of thermal conductivity λ is 0.28 W/m·K [65]. Recovered paper ash is a by-product of the paper recycling process. It mainly contains fibrous waste from paper production that is rich in cellulose fibers and organic carbon. It has a fine-grained structure and good porosity. Its λ is 0.4–0.6 W/m·K.

2.2. Experimental Research

The tests were performed in accordance with the ISO 9869-1:2014 standard [66] on an available test bench at the Faculty of Mechanical and Energy Engineering, Wroclaw University of Technology, in the Department of Energy Conversion Engineering. The bench consists of an Aisberg LP15 C15 refrigerator/freezer, an FHF04SC heat flux sensor, 4 thermocouples, and a temperature and heat flux recorder. A schematic of the bench is shown in Figure 7.
The values of thermal resistance coefficient (R) and heat transfer coefficient (U) were calculated according to the “average method” proposed by ISO 9869 [66]:
R = j = 1 n T s , i n , j T s , o u t , j j = 1 n q j , m 2 · K / W
U = j = 1 n q j j = 1 n T s , i n , j T s , o u t , j , W / m 2 · K
where j = 1 n T s , i n , j T s , o u t , j is the average temperature difference between the inner and outer surfaces, and j = 1 n q j is the average heat transfer density.
Each sample was tested over a period of up to 24 h with a time step of 10 min. The measurement was performed until thermal equilibrium was reached, i.e., until the temperature variations on both surfaces (bottom and top) of the samples did not exceed 0.5 °C for 0.5 h during the measurement. During the experiment, temperatures and heat flux density were recorded according to the above standard [66]. In order to obtain representative samples for the measurements, samples from three printing cycles were used for each type of material used. In addition, each measurement performed was repeated three times to obtain more accurate results. The measurement uncertainties for the samples tested were 0.03~0.04 (m2·K)/W for the coefficient of thermal resistance (R).
In addition, a UNI-T UTi260B thermal imaging camera was used to measure the temperature distribution on the outer surface of the composite and to check for the presence of thermal bridges. In addition, samples filled with wastepaper ash, glycerin, and soybean-oil-based resin were sub-sampled using a Reflecta DigiMicroscope Professional digital microscope with 500× image magnification to analyze the structure of the composite at the microscopic level. Such a study provides information on the distribution of ash particles in the resin matrix and evaluates their combination with the resin.

3. Results and Discussion

The purpose of the study was to evaluate the thermal properties of the printed composites for potential use of the materials as thermal insulation according to ISO 9869-1:2014. The results were compared with respect to the type of resin and natural filler, the number of layers, and the thickness of the composite. In each case, three series of measurements were obtained and averaged under stabilized temperature conditions. The average temperature difference between the outside and inside of the cooling chamber was 10–11 °C. In addition, some of the specimens were compared in terms of temperature distribution based on measurements with a thermal imaging camera to evaluate the insulation effectiveness.
Statistical analyses were performed using tools provided by STATISTICA 13 (TIBCO Statistica, Palo Alto, CA, USA). A significance threshold of p ≤ 0.05 was used in accordance with common practice in thermal insulation research. For the experimental data values obtained, measures of position and dispersion were first determined, and their summary results are shown in Table 1 and Table 2.
The thermal resistance (R) coefficient values for single-layer samples produced using 3D DLP technology for composite thicknesses from 20 to 100 mm ranged from 0.313 to 5.450 (m2·K)/W, with a mean of 1.898 (m2·K)/W and a variance of 1.479 (m2·K)/W. Again, about half of the samples had a thermal resistance value of 1.287 (m2·K)/W or less. The distribution showed high skewness and kurtosis, indicating that most of the sample results were clustered around the mean and were relatively low. The heat transfer coefficient (U) ranged from 1.913 to 0.171 W/(m2·K), with a mean of 0.778 W/(m2·K) and a standard deviation of 0.593 W/(m2·K). Approximately half of the samples tested had a heat transfer coefficient of 0.554 W/(m2·K) or less. The observed high skewness and kurtosis indicate that the results of most of the samples were relatively low and clustered around the sample mean.
On the other hand, for the single-layer and five-layer samples with a composite thickness of 100 mm (Table 2), the thermal resistance (R) values recorded ranged from 2.962 to 6.273 (m2·K)/W, with a mean of 4.581 (m2·K)/W and a deviation of 0.819 (m2·K)/W. Again, approximately half of the samples had a thermal resistance value of 4.434 (m2·K)/W or less. The distribution showed high skewness and kurtosis, indicating that most of the sample results were clustered around the mean and were relatively low. The heat transfer coefficient (U) ranged from 0.287 to 0.148 (m2·K)/W, with a mean of 0.204 (m2·K)/W and a standard deviation of 0.035 (m2·K)/W. Approximately half of the samples tested had a U-value of 0.203 (m2·K)/W or less.
Next, the significance of the effect of input quantities on output was assessed. ANOVA analysis of variance was used to determine this influence. The results are presented in Table 3 and Table 4. The significance levels (p-values) indicated in the last column of the table, which are less than 0.05, indicate that the material type (m) and composite thickness (δ)—(Table 3) and the material type and layering of composites (δ)—(Table 4) produced by DLP 3D printing technology have a significant effect on the thermal resistance and heat transfer coefficient of the materials tested. The effects of material type (m), composite thickness (δ), and composite layering (n) on the thermal resistance coefficient (R) were determine and an evaluation of potential interaction relationships was carried out. A similar analysis was performed for the heat transfer coefficient (U).
The results of the analysis of variance (Table 3 and Table 4) showed that there was an effect of the type of material, the thickness of the composite, and the number of its layers on the obtained value of the thermal resistance coefficient (R) and the value of the heat transfer (U). The analysis also showed the statistical significance of the interaction of linear factors. However, it was shown that the thickness of the composite and its layers used during the experiment is a highly dominant factor compared to other input factors. This is due to the high strength of influence (F) obtained for it relative to the other factors. Nevertheless, all input factors have a significant effect on the thermal performance of the 3D-printed composites, as shown by the p-value.
Graphical analysis of the results obtained is shown in Figure 8, Figure 9, Figure 10 and Figure 11.
The results emphasize that the thermal performance of the 3D-printed block improves as the insulation thickness and layering increase, and a 100 mm thick, five-layer sample made of soybean-oil-based resin showed the best thermal behavior, with a heat transfer coefficient value of 0.16 W/(m2·K).
The study showed that increasing the number of layers in the cellular composite structure improved its insulating properties. The thermal conductivity and thermal transmittance values of the tested samples decreased by about 30% for the four-layer sample compared to the single-layer sample. On the other hand, the thermal resistance increased by about 35% in the same case. The selection of a particular type of material for 3D printing, as well as the number of layers within the composite and their thickness, proved to be a valuable strategy for achieving very good thermal properties in the samples analyzed. In addition, the color of the composites played a key role in their thermal performance, with transparent and black samples showing lower thermal resistance (R) compared to gray and metallized samples. The addition of natural fillers also had a significant effect on the thermal properties obtained. The best properties were obtained for structures made from soybean oil.
Of all the prototype materials tested, five-layer cellular composites printed with soybean-oil-based resin showed the most favorable thermal properties, with Rc = 6.255 ± 0.02 (K·m2)/W and U = 0.16 ± 0.01 W/m2·K. What is more, all the structures tested met the thermal transmittance requirements of the construction industry, indicating their potential suitability for use in window manufacturing, for example. The development of sustainable insulation materials today requires consideration of environmental impact and raw material sourcing. By controlling the thickness of the thermal insulation material and combinations of filler percentages, 3D printing makes it possible to both optimize thermal conductivity and create lighter components.
The IR thermography technique was performed after stable and constant thermal conditions were achieved between the two surfaces of the 3D-printed block. Figure 12, Figure 13 and Figure 14 show thermal camera measurements of 20 mm thick composite samples made of transparent, black, gray, metallized, soybean-oil-based, natural ash fiber, and glycerin resin immediately after the measurement series. In addition, samples with the addition of ash are a controversial topic due to the combination of solid and liquid. Such composites may behave differently from materials made from liquid alone. For this reason, it was decided to carry out a complete measurement cycle for ash-doped samples, starting from a thickness of the composite made from them of 20 to 100 mm (Figure 12 and Figure 13). For the rest, the tests were carried out only on the basis of a thickness of 20 mm, with the assumption that if there were no visible thermal bridges and the temperature distribution was uniform over the entire surface of the samples, then there will be none for greater thicknesses of composites (Figure 14).
The temperature for the top wall of a 20 mm thick sample is 18.3 °C; for a 40 mm thick sample, it is 19.8 °C; for a 60 mm thick sample, it is 21.6 °C; for an 80 mm thick sample, it is 23.3 °C; and for a 100 mm thick sample, it is 24.1 °C. As the thickness of the insulation increases, the temperature on the outside of the insulation increases; at a thickness of 100 mm, the temperature of the material is practically equal to the ambient temperature. This indicates a decrease in the value of the heat transfer coefficient, an increase in the thermal resistance, and, at the same time, an improvement in the insulation efficiency. The temperature distribution is constant and seems to become more stable as the sample becomes thicker. There are also no visible thermal bridges.
Figure 15, Figure 16 and Figure 17 show photographs of a composite sample of grey resin (95%) and recycled paper ash (5%), grey resin (95%) and glycerin (5%), and grey resin based on soybean oil, obtained with a microscope at 500× magnification.
Microscope images (Figure 15) reveal visible ash particles embedded in the resin matrix and indicate their imprecise bonding, which can adversely affect the thermal properties and strength of the printed composites. The heterogeneity of the structure and the size of the visible particles can also weaken the thermal properties of the composite. Glycerin-based (Figure 16) and oil-based (Figure 17) samples have a more homogeneous structure. Smooth surfaces with fine air bubbles can be seen, and the properties of glycerin can also improve the mechanical properties of the materials obtained.

4. Conclusions

The purpose of the study was to evaluate and compare the thermal properties of samples with different compositions, thicknesses, and layering for their potential use as insulation materials. The rationale for this study is theoretical knowledge indicating that the distribution of air voids in a block significantly affects heat transfer, mainly through convective heat transfer mechanisms. Experimental analysis, carried out using the ISO 9869-1:2014 standard [66] and infrared thermography (IRT) techniques, allowed the effect of the aforementioned assumptions on the thermal permeability of printed composites to be quantified. Analyzing the results obtained, the following conclusions can be drawn
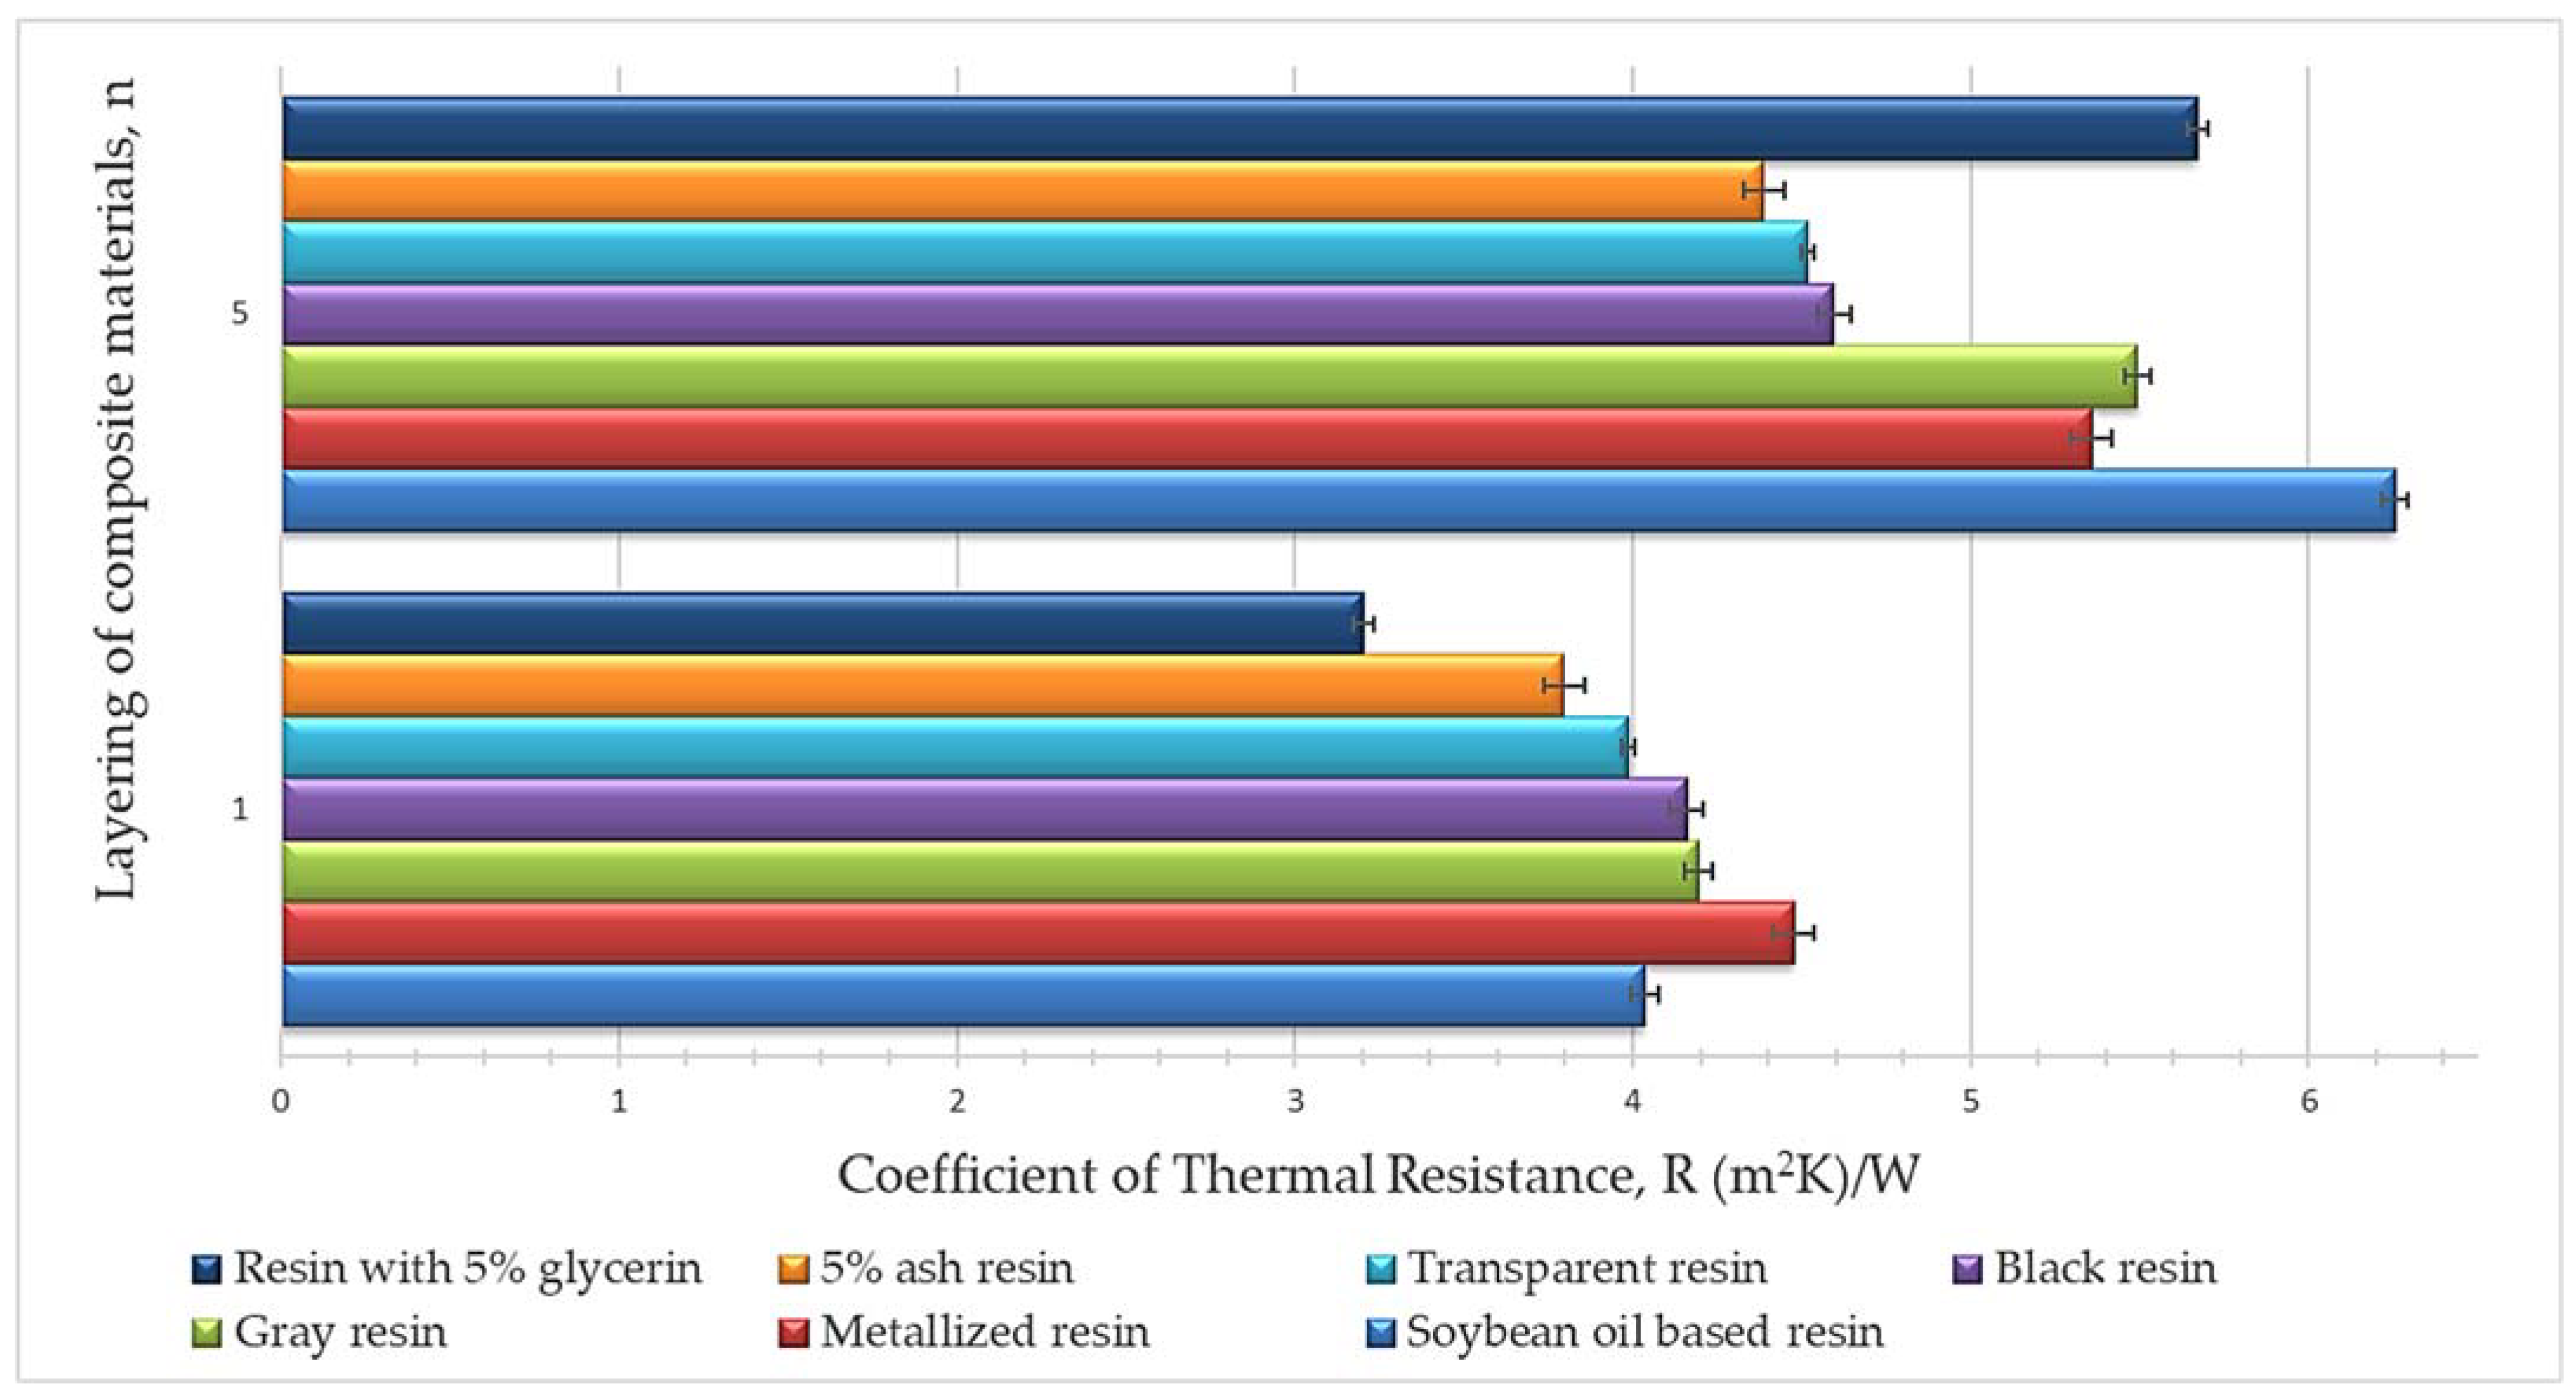
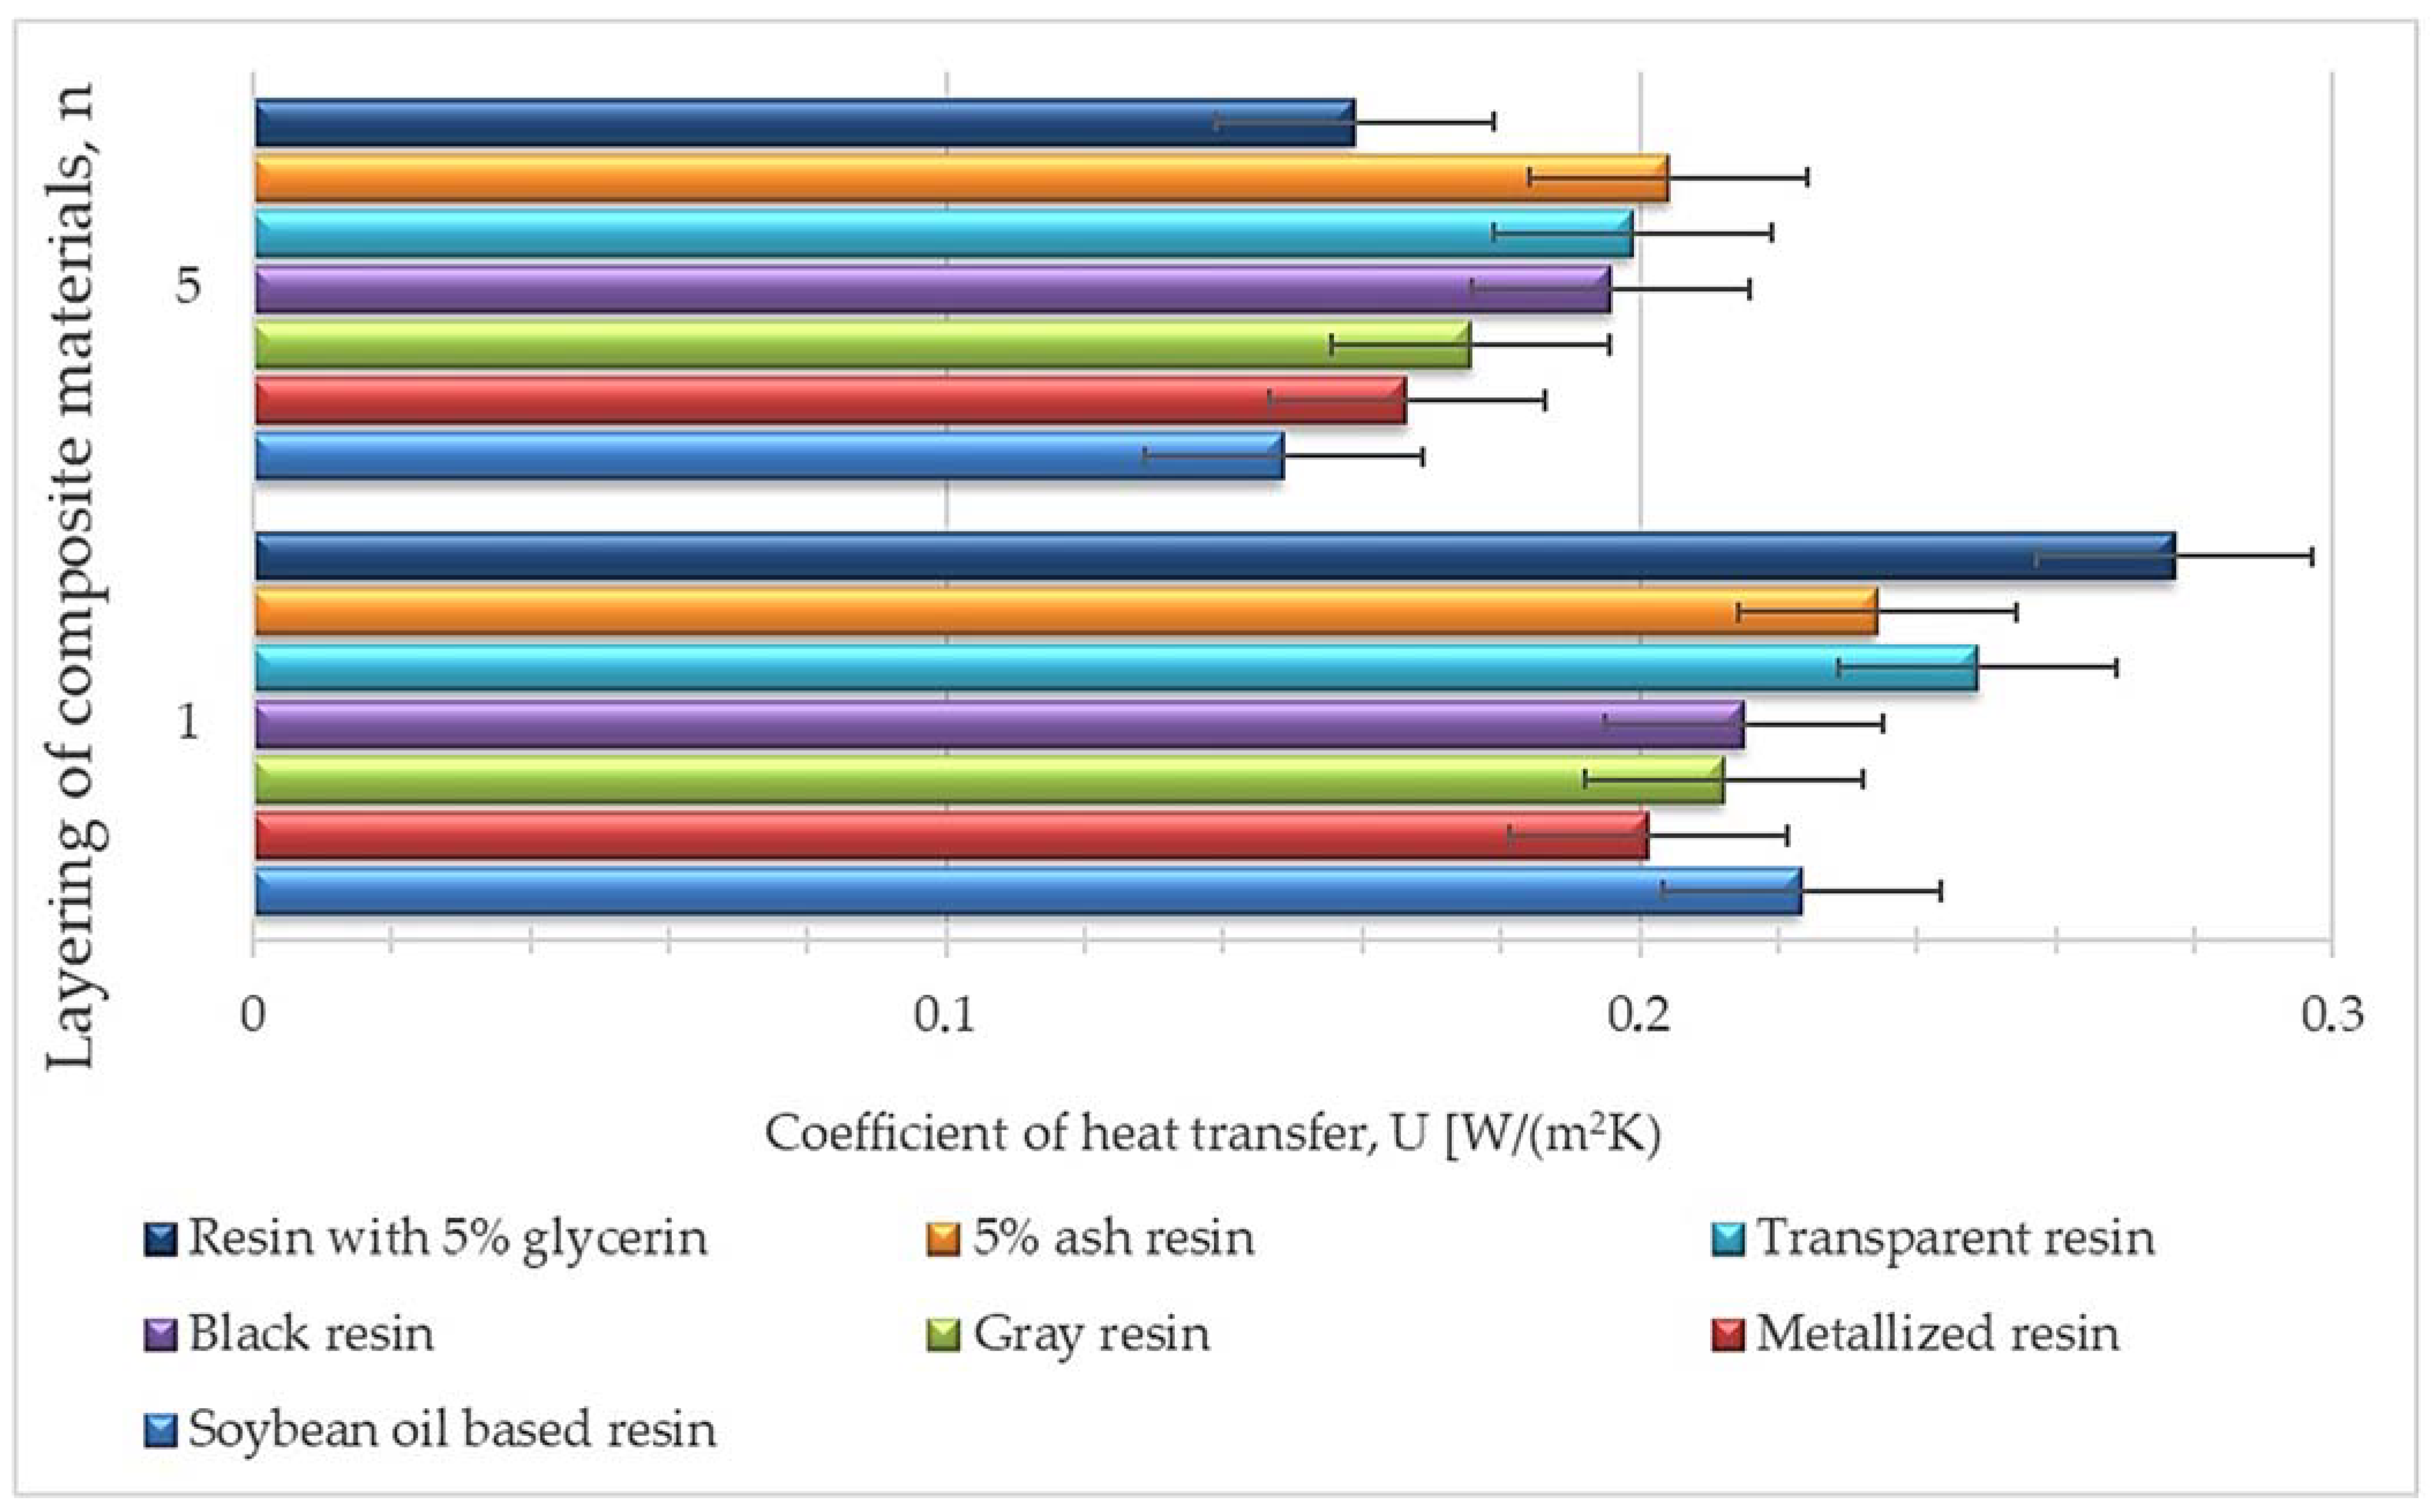
  • Increasing the number of layers has a positive effect on the value of the heat transfer coefficient.
  • For a sample with a thickness of only 40 mm, a decrease in its value of more than 40% was observed.
  • The lowest value with a five-layer material is 0.16 W/m2·K, but all variants of resins of different colors meet the U-value standards for transparent partitions.
  • The best choice in the selection of resin color is gray and metallized; these colors have the most stable and lowest values of heat transfer coefficient.
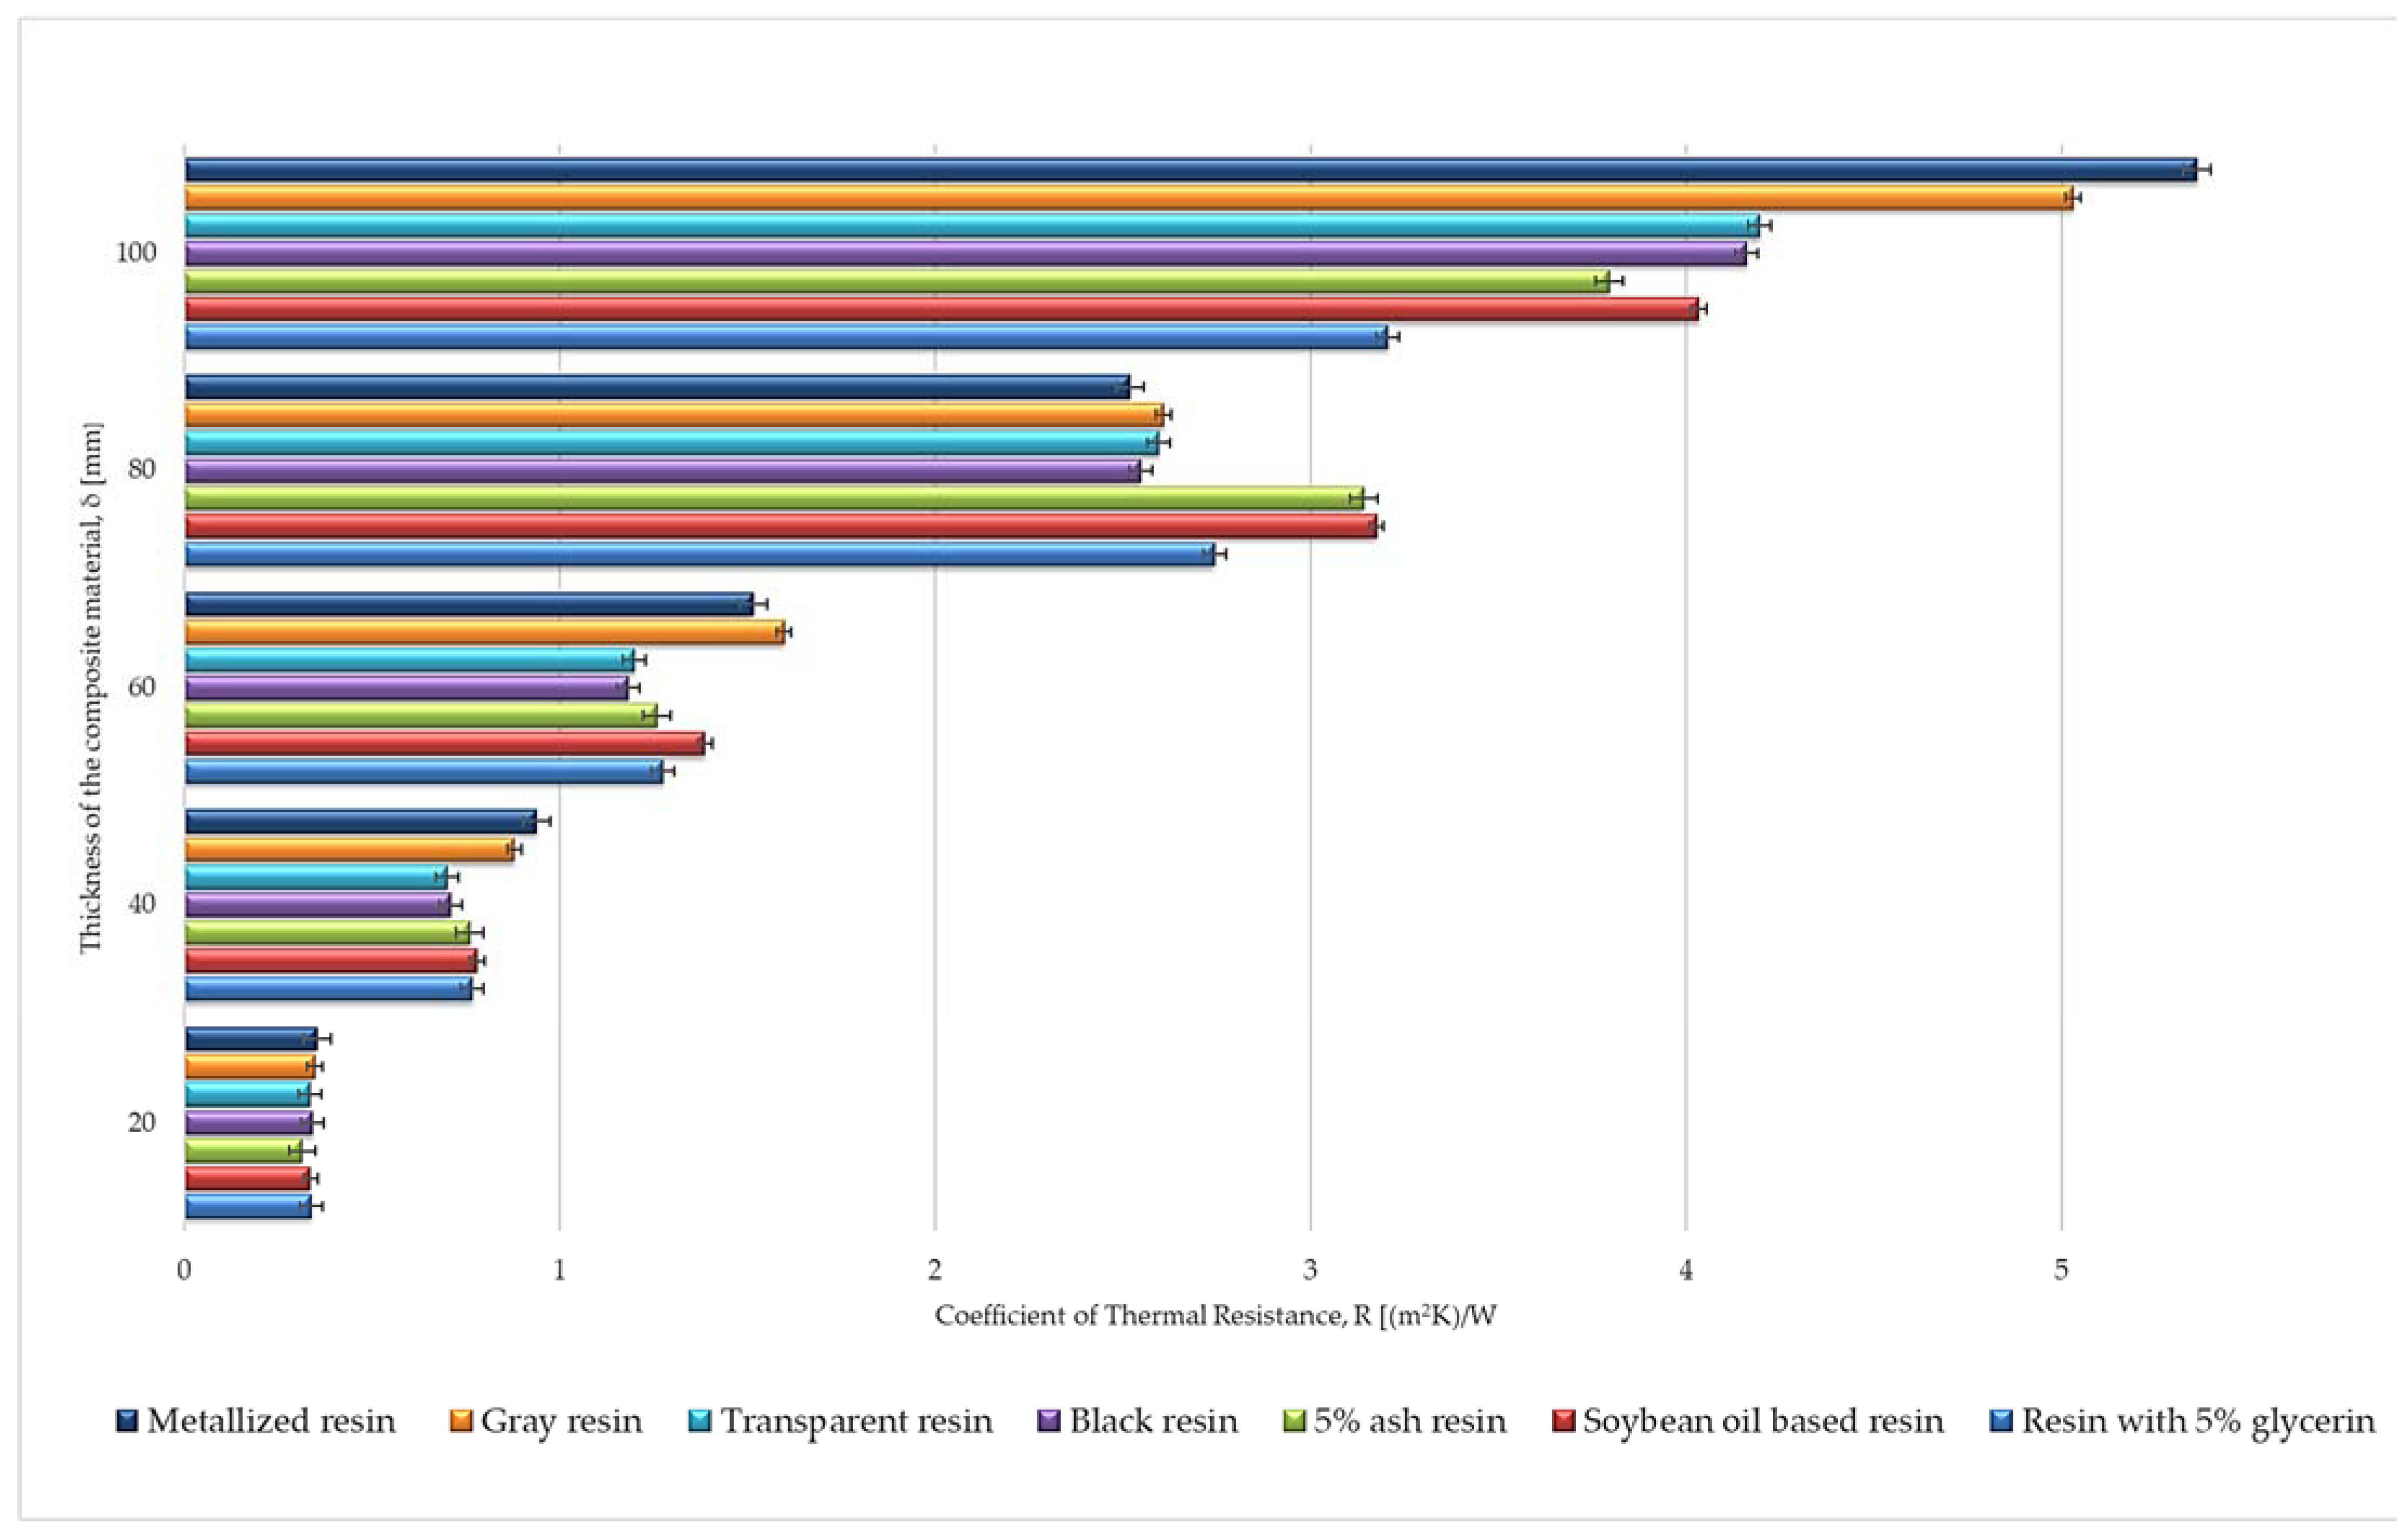
  • The thickness of the sample also significantly improves the thermal properties. The thermal resistance, R, increased in the range of 2.962 to 6.273 (m2·K)/W. The heat transfer coefficient, U, decreased from 1.913 W/m2·K to 0.16 W/m2·K.
  • Insulating materials with natural fibers have great potential. With only 5% ash and glycerin filler, the thermal transmittance values were similar or even lower than those of resin materials of different colors with the same thickness and layering. The 40 mm thick glycerin sample achieved a value of 0.94 W/m2·K, while only the metallized colored resin sample achieved a better result in this comparison, at 0.9 W/m2·K. In addition, each 100 mm thick composite is close to achieving a value of U = 0.2 W/m2·K, which is defined as the maximum value of the heat transfer coefficient for the building envelope according to ISO 9869-1:2014 [66].
  • The soybean-oil-based resin sample has the best thermal properties of all the materials tested. The five-layer composite with a thickness of 100 mm obtained the highest effective thermal transmittance value of 0.16 W/m2·K among all tested samples.
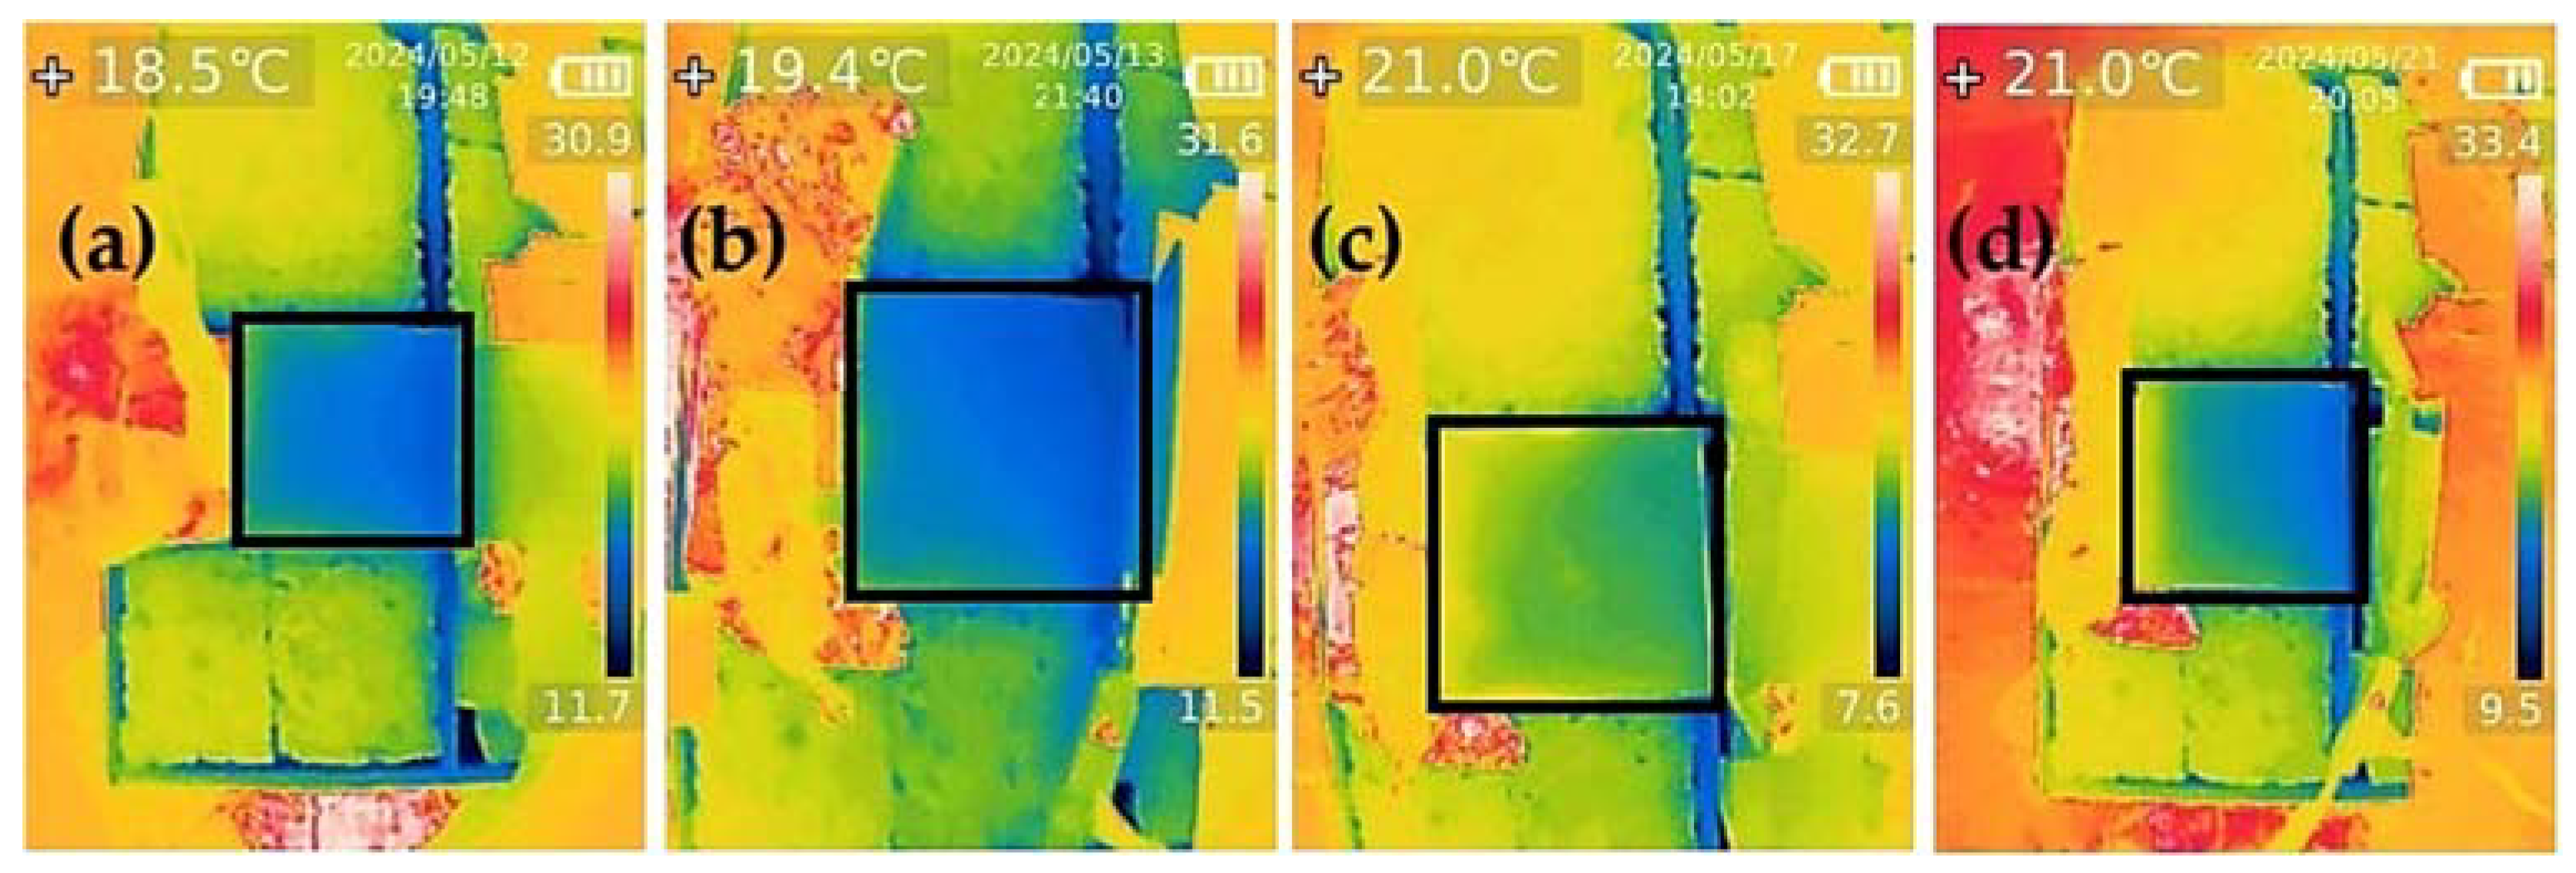
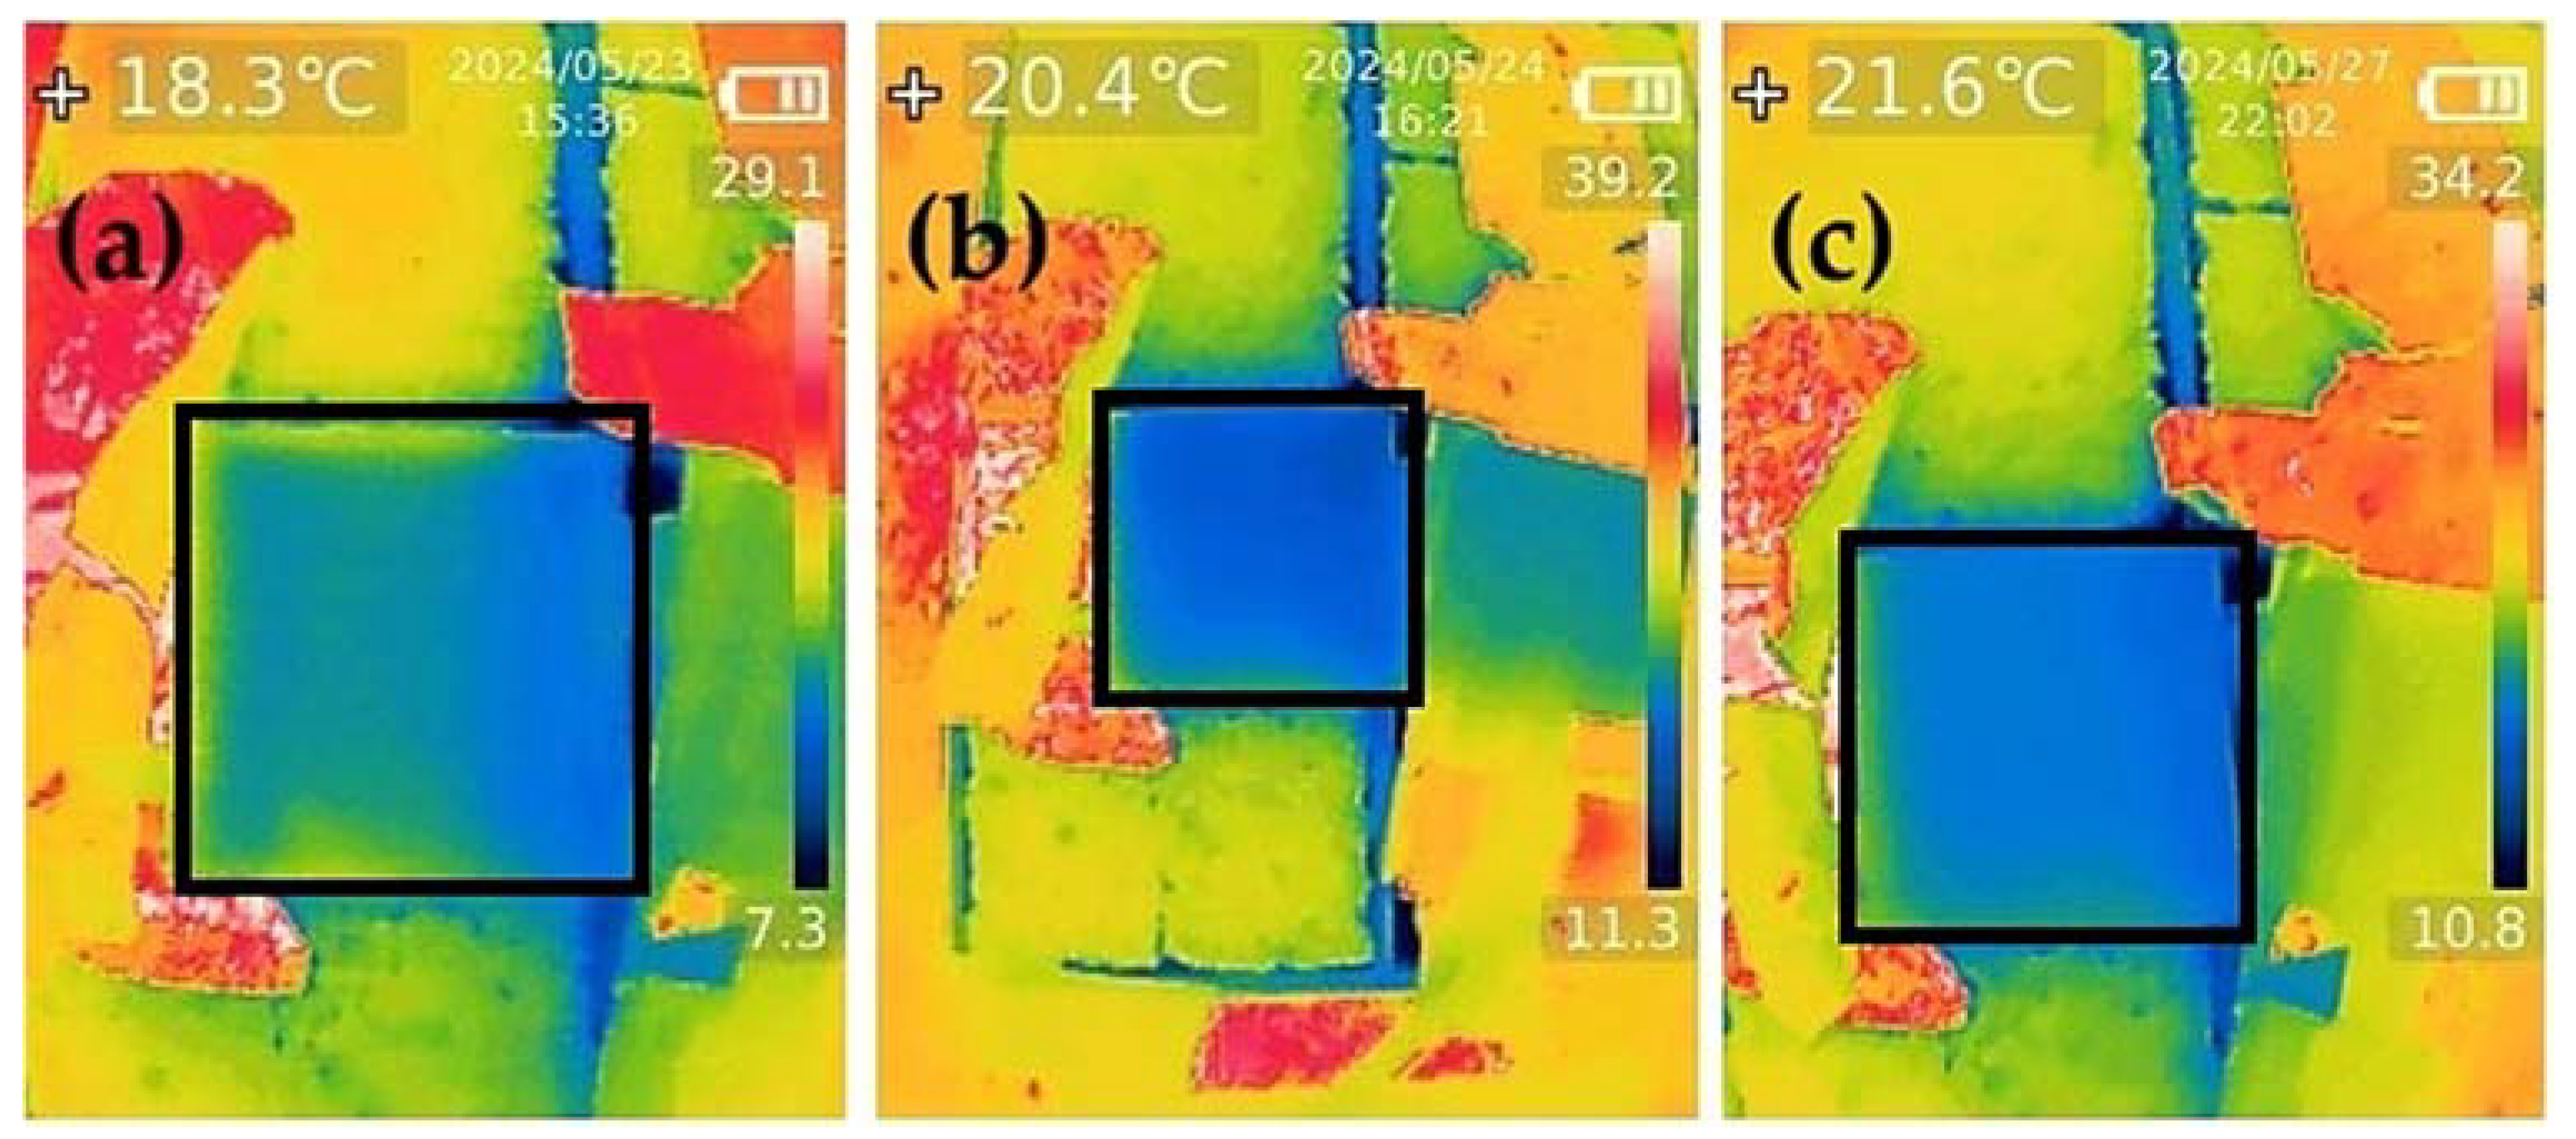
  • From the analysis of images taken with a thermal imaging camera, it can be concluded that there are no thermal heat bridges in any of the tested samples and that increasing the thickness of the material reduces heat loss while increasing energy efficiency.
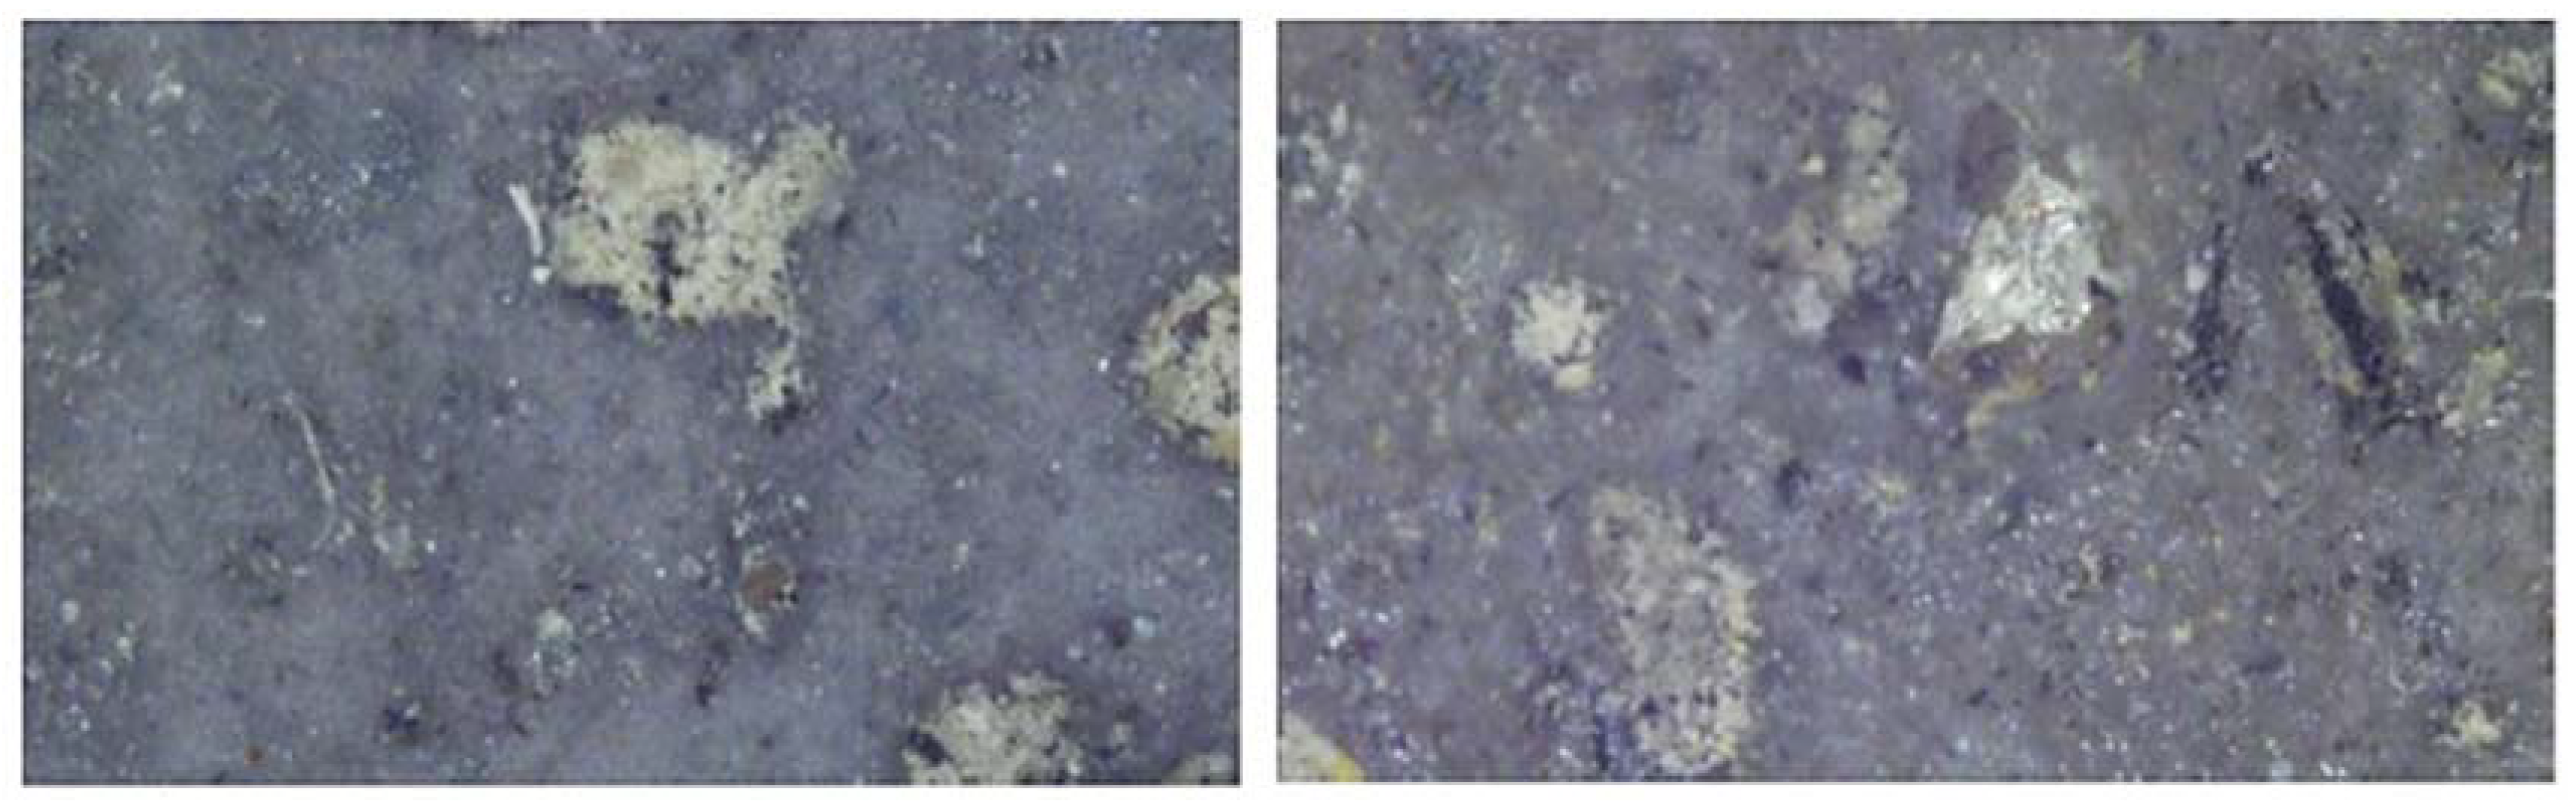
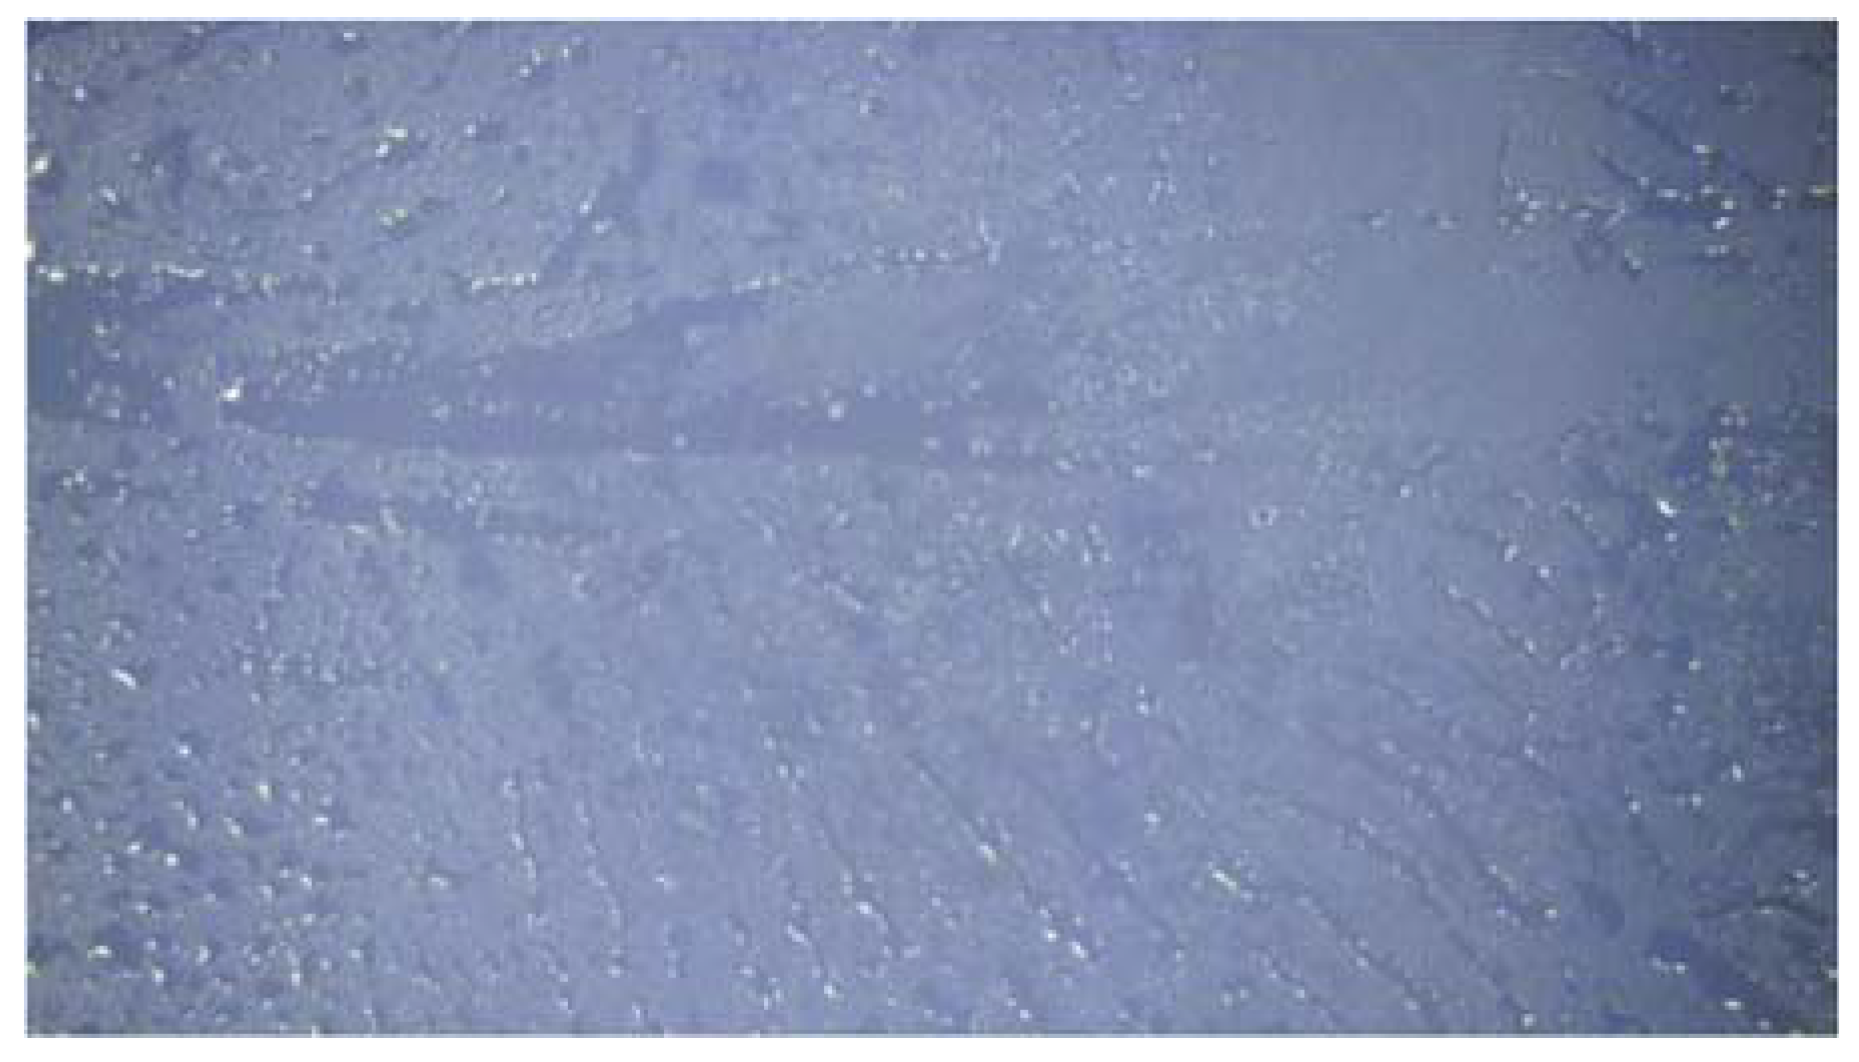
  • Microscope images are a valuable tool for analyzing the structure of composite materials. They provide an opportunity to evaluate the quality of the material combination, particle distribution, and particle size. Such analyses create prospects for improving the technique of conducting experiments.
The results obtained led the author to prepare further tests for the cellular composites analyzed in the article, that is, to determine the mechanical properties (i.e., impact strength, bending strength, deflection temperature, compressive strength). In addition, it seems important to determine the composites’ thermal stability by performing DSC/TG tests.
In conclusion, the results of the study indicate the high potential of using 3D printing to improve the thermal properties of insulating materials. The analyses performed point to the possibility of producing energy-efficient biodegradable thermal insulation and to its wider use not only in construction but also in other industries and packaging.

Funding

This research received no external funding.

Data Availability Statement

Data are contained within the article.

Conflicts of Interest

The author declares no conflict of interest.

References

  1. Barkhad, M.S.; Abu-Jdayil, B.; Iqbal, M.Z.; Mourad, A.-H.I. Thermal Insulation Using Biodegradable Poly(Lactic Acid)/Date Pit Composites. Constr. Build. Mater. 2020, 261, 120533. [Google Scholar] [CrossRef]
  2. Anwajler, B.; Zdybel, E.; Tomaszewska-Ciosk, E. Innovative Polymer Composites with Natural Fillers Produced by Additive Manufacturing (3D Printing)—A Literature Review. Polymers 2023, 15, 3534. [Google Scholar] [CrossRef] [PubMed]
  3. Veeman, D.; Sai, M.S.; Sureshkumar, P.; Jagadeesha, T.; Natrayan, L.; Ravichandran, M.; Mammo, W.D. Additive Manufacturing of Biopolymers for Tissue Engineering and Regenerative Medicine: An Overview, Potential Applications, Advancements, and Trends. Int. J. Polym. Sci. 2021, 2021, 4907027. [Google Scholar] [CrossRef]
  4. Arifin, N.; Sudin, I.; Ngadiman, N.H.A.; Ishak, M.S.A. A Comprehensive Review of Biopolymer Fabrication in Additive Manufacturing Processing for 3D-Tissue-Engineering Scaffolds. Polymers 2022, 14, 2119. [Google Scholar] [CrossRef] [PubMed]
  5. Sen, S.; Singh, A.; Bera, C.; Roy, S.; Kailasam, K. Recent Developments in Biomass Derived Cellulose Aerogel Materials for Thermal Insulation Application: A Review. Cellulose 2022, 29, 4805–4833. [Google Scholar] [CrossRef]
  6. Massoudinejad, M.; Amanidaz, N.; Santos, R.M.; Bakhshoodeh, R. Use of Municipal, Agricultural, Industrial, Construction and Demolition Waste in Thermal and Sound Building Insulation Materials: A Review Article. J. Environ. Health Sci. Eng. 2019, 17, 1227–1242. [Google Scholar] [CrossRef]
  7. Capêto, A.P.; Jesus, M.; Uribe, B.E.B.; Guimarães, A.S.; Oliveira, A.L.S. Building a Greener Future: Advancing Concrete Production Sustainability and the Thermal Properties of 3D-Printed Mortars. Buildings 2024, 14, 1323. [Google Scholar] [CrossRef]
  8. Özçelikci, E.; Oskay, A.; Bayer, İ.R.; Şahmaran, M. Eco-Hybrid Cement-Based Building Insulation Materials as a Circular Economy Solution to Construction and Demolition Waste. Cem. Concr. Compos. 2023, 141, 105149. [Google Scholar] [CrossRef]
  9. Lu, X.; Liu, B.; Zhang, Q.; Wen, Q.; Wang, S.; Xiao, K.; Zhang, S. Recycling of Coal Fly Ash in Building Materials: A Review. Minerals 2022, 13, 25. [Google Scholar] [CrossRef]
  10. Abu-Jdayil, B.; Mourad, A.-H.; Hittini, W.; Hassan, M.; Hameedi, S. Traditional, State-of-the-Art and Renewable Thermal Building Insulation Materials: An Overview. Constr. Build. Mater. 2019, 214, 709–735. [Google Scholar] [CrossRef]
  11. Baino, F.; Ferraris, M. Production and Characterization of Ceramic Foams Derived from Vitrified Bottom Ashes. Mater. Lett. 2019, 236, 281–284. [Google Scholar] [CrossRef]
  12. Lee, S.W.; Lim, C.H.; Salleh, E.I. Bin Reflective Thermal Insulation Systems in Building: A Review on Radiant Barrier and Reflective Insulation. Renew. Sustain. Energy Rev. 2016, 65, 643–661. [Google Scholar] [CrossRef]
  13. Dhangar, M.; Chaturvedi, K.; Mili, M.; Patel, S.S.; Khan, M.A.; Bhargaw, H.N.; Srivastava, A.K.; Verma, S. Emerging 3D Printed Thermal Insulating Materials for Sustainable Approach: A Review and a Way Forward. Polym. Adv. Technol. 2023, 34, 1425–1434. [Google Scholar] [CrossRef]
  14. Al-Homoud, M.S. Performance Characteristics and Practical Applications of Common Building Thermal Insulation Materials. Build. Environ. 2005, 40, 353–366. [Google Scholar] [CrossRef]
  15. Kisilewicz, T.; Fedorczak-Cisak, M.; Barkanyi, T. Active Thermal Insulation as an Element Limiting Heat Loss through External Walls. Energy Build. 2019, 205, 109541. [Google Scholar] [CrossRef]
  16. Fang, Z.; Li, N.; Li, B.; Luo, G.; Huang, Y. The Effect of Building Envelope Insulation on Cooling Energy Consumption in Summer. Energy Build. 2014, 77, 197–205. [Google Scholar] [CrossRef]
  17. Cai, S.; Zhang, B.; Cremaschi, L. Review of Moisture Behavior and Thermal Performance of Polystyrene Insulation in Building Applications. Build. Environ. 2017, 123, 50–65. [Google Scholar] [CrossRef]
  18. Dylewski, R.; Adamczyk, J. Optimum Thickness of Thermal Insulation with Both Economic and Ecological Costs of Heating and Cooling. Energies 2021, 14, 3835. [Google Scholar] [CrossRef]
  19. Khalaf, Y.; El Hage, P.; Dimitrova Mihajlova, J.; Bergeret, A.; Lacroix, P.; El Hage, R. Influence of Agricultural Fibers Size on Mechanical and Insulating Properties of Innovative Chitosan-Based Insulators. Constr. Build. Mater. 2021, 287, 123071. [Google Scholar] [CrossRef]
  20. Mugahed Amran, Y.H.; El-Zeadani, M.; Huei Lee, Y.; Yong Lee, Y.; Murali, G.; Feduik, R. Design Innovation, Efficiency and Applications of Structural Insulated Panels: A Review. Structures 2020, 27, 1358–1379. [Google Scholar] [CrossRef]
  21. Li, C.; Yang, Y.; Xu, G.; Zhou, Y.; Jia, M.; Zhong, S.; Gao, Y.; Park, C.; Liu, Q.; Wang, Y.; et al. Insulating Materials for Realising Carbon Neutrality: Opportunities, Remaining Issues and Challenges. High Voltage 2022, 7, 610–632. [Google Scholar] [CrossRef]
  22. de Rubeis, T.; Ciccozzi, A.; Paoletti, D.; Ambrosini, D. 3D Printing for Energy Optimization of Building Envelope—Experimental Results. Heliyon 2024, 10, e31107. [Google Scholar] [CrossRef] [PubMed]
  23. Manohar, K.; Ramlakhan, D.; Kochhar, G.; Haldar, S. Biodegradable Fibrous Thermal Insulation. J. Braz. Soc. Mech. Sci. Eng. 2006, 28, 45–47. [Google Scholar] [CrossRef]
  24. Voet, V.S.D.; Guit, J.; Loos, K. Sustainable Photopolymers in 3D Printing: A Review on Biobased, Biodegradable, and Recyclable Alternatives. Macromol. Rapid Commun. 2021, 42, e2000475. [Google Scholar] [CrossRef] [PubMed]
  25. Guggenbiller, G.; Brooks, S.; King, O.; Constant, E.; Merckle, D.; Weems, A.C. 3D Printing of Green and Renewable Polymeric Materials: Toward Greener Additive Manufacturing. ACS Appl. Polym. Mater. 2023, 5, 3201–3229. [Google Scholar] [CrossRef]
  26. Macek, D.; Kosina, M. Analysis of the Structure of Heat Losses from Buildings and Benefits of Thermal Insulation Systems. IOP Conf. Ser. Mater. Sci. Eng. 2021, 1165, 012004. [Google Scholar] [CrossRef]
  27. Ranjan, R.; Kumar, D.; Kundu, M.; Chandra Moi, S. A Critical Review on Classification of Materials Used in 3D Printing Process. Mater. Today Proc. 2022, 61, 43–49. [Google Scholar] [CrossRef]
  28. Shahrubudin, N.; Lee, T.C.; Ramlan, R. An Overview on 3D Printing Technology: Technological, Materials, and Applications. Procedia Manuf. 2019, 35, 1286–1296. [Google Scholar] [CrossRef]
  29. Khan, N.; Riccio, A. A Systematic Review of Design for Additive Manufacturing of Aerospace Lattice Structures: Current Trends and Future Directions. Prog. Aerosp. Sci. 2024, 149, 101021. [Google Scholar] [CrossRef]
  30. Suntharalingam, T.; Upasiri, I.; Gatheeshgar, P.; Poologanathan, K.; Nagaratnam, B.; Santos, P.; Rajanayagam, H. Energy Performance of 3D-Printed Concrete Walls: A Numerical Study. Buildings 2021, 11, 432. [Google Scholar] [CrossRef]
  31. Kaszynka, M.; Olczyk, N.; Techman, M.; Skibicki, S.; Zielinski, A.; Filipowicz, K.; Wroblewski, T.; Hoffmann, M. Thermal-Humidity Parameters of 3D Printed Wall. IOP Conf. Ser. Mater. Sci. Eng. 2019, 471, 082018. [Google Scholar] [CrossRef]
  32. Mihalache, A.; Hriţuc, A.; Boca, M.; Oroian, B.; Condrea, I.; Botezatu, C.; Slătineanu, L. Thermal Insulation Capacity of a 3D Printed Material. Macromol. Symp. 2021, 396, 2000286. [Google Scholar] [CrossRef]
  33. Alkhalidi, A.; Hatuqay, D. Energy Efficient 3D Printed Buildings: Material and Techniques Selection Worldwide Study. J. Build. Eng. 2020, 30, 101286. [Google Scholar] [CrossRef]
  34. Bi, X.; Huang, R. 3D Printing of Natural Fiber and Composites: A State-of-the-Art Review. Mater. Des. 2022, 222, 111065. [Google Scholar] [CrossRef]
  35. Feng, C.; Yu, S.-S. 3D Printing of Thermal Insulating Polyimide/Cellulose Nanocrystal Composite Aerogels with Low Dimensional Shrinkage. Polymers 2021, 13, 3614. [Google Scholar] [CrossRef]
  36. Anwajler, B.; Zielińska, S.; Witek-Krowiak, A. Innovative Cellular Insulation Barrier on the Basis of Voronoi Tessellation—Influence of Internal Structure Optimization on Thermal Performance. Materials 2024, 17, 1578. [Google Scholar] [CrossRef]
  37. Dey, D.; Panda, B. An Experimental Study of Thermal Performance of 3D Printed Concrete Slabs. Mater. Lett. 2023, 330, 133273. [Google Scholar] [CrossRef]
  38. Nemova, D.; Kotov, E.; Andreeva, D.; Khorobrov, S.; Olshevskiy, V.; Vasileva, I.; Zaborova, D.; Musorina, T. Experimental Study on the Thermal Performance of 3D-Printed Enclosing Structures. Energies 2022, 15, 4230. [Google Scholar] [CrossRef]
  39. Bedarf, P.; Dutto, A.; Zanini, M.; Dillenburger, B. Foam 3D Printing for Construction: A Review of Applications, Materials, and Processes. Autom. Constr. 2021, 130, 103861. [Google Scholar] [CrossRef]
  40. Lebedevaite, M.; Ostrauskaite, J.; Skliutas, E.; Malinauskas, M. Photoinitiator Free Resins Composed of Plant-Derived Monomers for the Optical µ-3D Printing of Thermosets. Polymers 2019, 11, 116. [Google Scholar] [CrossRef]
  41. Wu, Y.; Advincula, P.A.; Giraldo-Londoño, O.; Yu, Y.; Xie, Y.; Chen, Z.; Huang, G.; Tour, J.M.; Lin, J. Sustainable 3D Printing of Recyclable Biocomposite Empowered by Flash Graphene. ACS Nano 2022, 16, 17326–17335. [Google Scholar] [CrossRef] [PubMed]
  42. Lorente, S.; Petit, M.; Javelas, R. Simplified Analytical Model for Thermal Transfer in Vertical Hollow Brick. Energy Build. 1996, 24, 95–103. [Google Scholar] [CrossRef]
  43. Stefanizzi, P.; Lippolis, A.; Liuzzi, S. Experimental and numerical analysis of heat transfer in the cavities of hollow blocks. Int. J. Heat Technol. 2013, 31, 149–154. [Google Scholar] [CrossRef]
  44. Al-Tamimi, A.S.; Baghabra Al-Amoudi, O.S.; Al-Osta, M.A.; Ali, M.R.; Ahmad, A. Effect of Insulation Materials and Cavity Layout on Heat Transfer of Concrete Masonry Hollow Blocks. Constr. Build. Mater. 2020, 254, 119300. [Google Scholar] [CrossRef]
  45. Zhang, Q.; Yang, X.; Li, P.; Huang, G.; Feng, S.; Shen, C.; Han, B.; Zhang, X.; Jin, F.; Xu, F.; et al. Bioinspired Engineering of Honeycomb Structure—Using Nature to Inspire Human Innovation. Prog. Mater. Sci. 2015, 74, 332–400. [Google Scholar] [CrossRef]
  46. de Rubeis, T.; Ciccozzi, A.; Giusti, L.; Ambrosini, D. The 3D Printing Potential for Heat Flow Optimization: Influence of Block Geometries on Heat Transfer Processes. Sustainability 2022, 14, 15830. [Google Scholar] [CrossRef]
  47. de Rubeis, T. 3D-Printed Blocks: Thermal Performance Analysis and Opportunities for Insulating Materials. Sustainability 2022, 14, 1077. [Google Scholar] [CrossRef]
  48. de Rubeis, T.; Ciccozzi, A.; Pasqualoni, G.; Paoletti, D.; Ambrosini, D. On the Use of Waste Materials for Thermal Improvement of 3D-Printed Block—An Experimental Comparison. Buildings 2023, 13, 1136. [Google Scholar] [CrossRef]
  49. Grabowska, B.; Kasperski, J. The Thermal Conductivity of 3D Printed Plastic Insulation Materials—The Effect of Optimizing the Regular Structure of Closures. Materials 2020, 13, 4400. [Google Scholar] [CrossRef]
  50. Zhu, G.; Jing, H.; Wu, J.; Chen, S.; Gao, Y.; Yin, Q.; Yu, Z.; Qiao, Y.; Ren, J. Study on Heat Transfer Characteristics of Cement-Based Honeycomb Structures Based on Infrared Imaging. J. Build. Eng. 2023, 68, 106134. [Google Scholar] [CrossRef]
  51. Cuevas, K.; Strzałkowski, J.; Kim, J.-S.; Ehm, C.; Glotz, T.; Chougan, M.; Ghaffar, S.H.; Stephan, D.; Sikora, P. Towards Development of Sustainable Lightweight 3D Printed Wall Building Envelopes—Experimental and Numerical Studies. Case Stud. Constr. Mater. 2023, 18, e01945. [Google Scholar] [CrossRef]
  52. Witek-Krowiak, A.; Szopa, D.; Anwajler, B. Advanced Packaging Techniques—A Mini-Review of 3D Printing Potential. Materials 2024, 17, 2997. [Google Scholar] [CrossRef] [PubMed]
  53. Anwajler, B.; Szołomicki, J.; Noszczyk, P.; Baryś, M. The Potential of 3D Printing in Thermal Insulating Composite Materials—Experimental Determination of the Impact of the Geometry on Thermal Resistance. Materials 2024, 17, 1202. [Google Scholar] [CrossRef] [PubMed]
  54. Anwajler, B. The Thermal Properties of a Prototype Insulation with a Gyroid Structure—Optimization of the Structure of a Cellular Composite Made Using SLS Printing Technology. Materials 2022, 15, 1352. [Google Scholar] [CrossRef] [PubMed]
  55. Anwajler, B.; Witek-Krowiak, A. Three-Dimensional Printing of Multifunctional Composites: Fabrication, Applications, and Biodegradability Assessment. Materials 2023, 16, 7531. [Google Scholar] [CrossRef]
  56. Anwajler, B.; Szkudlarek, M. Właściwości Cieplne Materiałów o Strukturze TPMS Wykonanych w Technologii Druku Addytywnego SLS. Rynek Energii 2023, 1, 11–20. [Google Scholar]
  57. Anwajler, B.; Piwowar, A. Bioniczny Kompozyt Komórkowy o Właściwościach Izolacyjnych Wykonany w Technologii Addytywnej SLS. Izolacje 2023, 28, 116–123. [Google Scholar]
  58. Anwajler, B.; Spychaj, R.; Wójcik, P.; Piwowar, A. Doświadczalne Wyznaczenie Właściwości Cieplnych Prototypowych Materiałów Izolacyjnych Wykonanych Technologią Druku 3D. Rynek Energii 2021, 6, 44–51. [Google Scholar]
  59. Piwowar, A.; Anwajler, B.; Szulct, P. Właściwości Cieplne Materiałów Izolacyjnych Wykonanych w Technologii Druku 3D—Wpływ Optymalizacji Struktury Opartej Na Modelu Piany Kelvina. Rynek Energii 2024, 1, 60–68. [Google Scholar]
  60. Tang, L.; Shi, X.; Zhang, L.; Liu, Z.; Jiang, Z.; Liu, Y. Effects of Statistics of Cell’s Size and Shape Irregularity on Mechanical Properties of 2D and 3D Voronoi Foams. Acta Mech. 2014, 225, 1361–1372. [Google Scholar] [CrossRef]
  61. Li, Z.; Zhang, J.; Wang, Z.; Song, Y.; Zhao, L. Study on the Thermal Properties of Closed-Cell Metal Foams Based on Voronoi Random Models. Numeri Heat. Transf. A Appl. 2013, 64, 1038–1049. [Google Scholar] [CrossRef]
  62. Chen, K.; Qin, H.; Ren, Z. Establishment of the Microstructure of Porous Materials and Its Relationship with Effective Mechanical Properties. Sci. Rep. 2023, 13, 18064. [Google Scholar] [CrossRef] [PubMed]
  63. Talischi, C.; Paulino, G.H.; Pereira, A.; Menezes, I.F.M. PolyMesher: A General-Purpose Mesh Generator for Polygonal Elements Written in Matlab. Struct. Multidiscip. Optim. 2012, 45, 309–328. [Google Scholar] [CrossRef]
  64. Wang, H.; Qin, Q.-H.; Xiao, Y. Special n -Sided Voronoi Fiber/Matrix Elements for Clustering Thermal Effect in Natural-Hemp-Fiber-Filled Cement Composites. Int. J. Heat. Mass. Transf. 2016, 92, 228–235. [Google Scholar] [CrossRef]
  65. Heim, D.; Mrowiec, A.; Prałat, K. Analysis and Interpretation of Results of Thermal Conductivity Obtained by the Hot Wire Method. Exp. Tech. 2016, 40, 513–519. [Google Scholar] [CrossRef]
  66. EN ISO 9869-1:2014; Thermal Insulation—Building Elements—In Situ Measurement of Thermal Resistance and Thermal Transmittance. Part 1: Heat Flow Meter Method. International Organization for Standardization: Geneva, Switzerland, 2014.
Figure 1. Rhino 7 software—projections of the created structure.
Fibers 12 00076 g001
Figure 2. Grasshopper software—modules for creating a composite: (a) slider for setting the point generator count in a Voronoi tessellation, (b) slider for setting the seeding values in a Voronoi tessellation, (c) slider for setting the wall thickness in a composite, (d) component in Grasshopper for creating a 2D Voronoi tessellation.
Fibers 12 00076 g002
Figure 3. Model of composite structure based on Voronoi cells; (a) 3D view—50 × 50 × 20 mm sample; (b) front view—500-pore volume.
Fibers 12 00076 g003
Figure 4. Examples of printed samples: (a) transparent; (b) black; (c) gray; (d) metallized.
Fibers 12 00076 g004
Figure 5. Examples of printed samples: (a) based on soybean oil; (b) with 5% ash; (c) with 5% glycerin.
Fibers 12 00076 g005
Figure 6. Layers in printed samples of 100 mm thick composite: (a) one-layer sample, (b) five-layer sample.
Fibers 12 00076 g006
Figure 7. Schematic of the test stand for thermal insulation testing [36,57].
Fibers 12 00076 g007
Figure 8. Effect of thickness of single-layer test material on heat transfer coefficient, U.
Fibers 12 00076 g008
Figure 9. Effect of thickness of single-layer test material on coefficient of thermal resistivity, R.
Fibers 12 00076 g009
Figure 10. Effect of layering 100 mm thick test material on thermal resistivity coefficient, R.
Fibers 12 00076 g010
Figure 11. Effect of layering 100 mm thick test material on heat transfer coefficient, U.
Fibers 12 00076 g011
Figure 12. Temperature distribution for samples having a thickness of 20 mm for (a) transparent resin; (b) black resin; (c) gray resin; (d) metallized resin.
Fibers 12 00076 g012
Figure 13. Temperature distribution for samples having a thickness of 20 mm for (a) 5% ash resin; (b) resin with 5% glycerin; (c) soybean-oil-based resin.
Fibers 12 00076 g013
Figure 14. Temperature distribution for samples having a thickness of 20 to 100 mm for 5% ash resin: (a) 20 mm; (b) 40 mm; (c) 60 mm; (d) 80 mm; and (e) 100 mm.
Fibers 12 00076 g014
Figure 15. Samples with ash.
Fibers 12 00076 g015
Figure 16. Samples with glycerin.
Fibers 12 00076 g016
Figure 17. Soybean-oil-based resin samples.
Fibers 12 00076 g017
Table 1. Descriptive statistics for the thermal resistance (R) and heat transmission coefficient (U) for single-layer composite specimens from 20 to 100 mm thick (M—mean; Me—median, Min—minimum; Max—maximum; SD—standard deviation; Sk—skewness; K—kurtosis).
MMeMinMaxSDSkK
R, W/m2·K1.8981.2870.3135.4501.4790.762−0.575
U, (m2·K)/W0.7780.5540.1711.9130.5930.867−0.726
Table 2. Descriptive statistics for the thermal resistance (R) and heat transmission coefficient (U) for single-layer and five-layer composite specimens with a thickness of 100 mm (M—mean; Me—median, Min—minimum; Max—maximum; SD—standard deviation; Sk—skewness; K—kurtosis).
MMeMinMaxSDSkK
R, W/m2·K4.5814.4342.9626.2730.8190.428−0.257
U, (m2·K)/W0.2040.2030.1480.2870.0350.404−0.074
Table 3. Quantitative assessment of the main effects and the effects of interactions—identification of the impact of dominant and statistically significant input factors on the dependent variable R and U for single-layer composite specimens from 20 to 100 mm thick.
Symbol That Identifies
The Input Factors and Their Interactions
SSdfMSFp
R, W/m2·K
Absolute term378.5631378.56338,558.690.000
M2.59960.43344.130.000
Δ215.4206453.8555485.440.000
m*δ8.994240.37538.17
Absolute term0.6872700.0098
U, (m2·K)/W
Absolute term63.5396163.539677,929.070.000
m0.255660.042652.260.000
δ35.97648.994111,030.880.000
m*δ0.3076240.012815.72
Absolute term0.0571700.0008
m*δ—the interaction between the applied of material type, composite thickness of the structure and the values of the output data obtained in the experiment.
Table 4. Quantitative assessment of the main effects and the effects of interactions—identification of the impact of dominant and statistically significant input factors on the dependent variable R and U for single-layer and five-layer composite specimens with a thickness of 100 mm.
Symbol That Identifies
The Input Factors and Their Interactions
SSdfMSFp
R, W/m2·K
Absolute term881.4311881.43140,386.190.000
m5.46160.91041.710.000
n15.213115.213697.040.000
m*n6.24061.04047.65
Absolute term0.611280.022
U, (m2·K)/W
Absolute term1.754011.754030,854.140.000
m0.009960.001729.140.000
n0.028310.02826497.030.000
m*n0.0104760.0017430.68
Absolute term0.00159280.00006
m*n—the interaction between the applied of material type, composite layering of the structure and the values of the output data obtained in the experiment.
Disclaimer/Publisher’s Note: The statements, opinions and data contained in all publications are solely those of the individual author(s) and contributor(s) and not of MDPI and/or the editor(s). MDPI and/or the editor(s) disclaim responsibility for any injury to people or property resulting from any ideas, methods, instructions or products referred to in the content.

