Abstract
To reduce particulate matter (PM) in diesel exhaust gas, a diesel particulate filter (DPF) has been developed. The thermal durability of existing platinum catalyst-supported DPFs is inadequate. We are focusing on a non-catalytic after-treatment of silicon carbide (SiC) fibers with highly thermal durability. In this study, we simulated the processes of soot deposition and oxidation. Results show that even in exhaust gas without soot, a complex flow pattern is observed. The porosity of the filter is not constant along the flow direction, and the pressure gradient varies. The friction factor is slightly larger than the predicted value by the empirical equation in uniform porous media flow. Since the soot deposition occurs inside the filter, the depth filtration by SiC fibers was confirmed. In addition, the effects of filter temperature and oxygen concentration are clearly revealed. That is, comparing the oxidation at 700 °C, the deposited soot amount at 1200 and 1400 °C is decreased by 60% and 92%, respectively. Raising the oxygen concentration from 10% to 20% increases the oxidation efficiency from 42% to 64%. Although more work is needed over a wide range of operating conditions, a combination of these two parameters is important to achieve the non-catalytic exhaust after-treatment.
1. Introduction
The pollution emitted by diesel cars, such as heavy-duty trucks, causes environmental problems. The fine nanoparticles, including soot, known as particulate matter (PM), can penetrate deep into our lungs and pose serious health risks, including aggravated asthma, lung damage and human carcinogenic effects [1,2,3]. Hence, in many countries, stricter exhaust emission standards, such as Euro V, are being set, and a diesel exhaust after-treatment is needed [4].
As one of the leading technologies to meet current PM emission standards, a diesel particulate filter (DPF) has been developed for the exhaust after-treatment [4,5,6,7]. Most of the commercially available DPFs are ceramic honeycomb filters [4,6,7,8,9,10], where ducts are alternately closed. In a simple explanation of DPF, it traps diesel soot particles when the exhaust gas passes its porous wall. It is the most efficient after-treatment device. The latest research has shown that DPF filtration efficiency can be as high as 99%. However, due to the limitation of the DPF volume, whose porosity is about 0.4, the filter would be plugged with particles, which causes an increase in the filter backpressure [6,8,9]. If the backpressure is too high, the engine may stall or the fuel consumption rate may increase. In order to avoid these problems, an exhaust after-treatment system that burns and removes deposited particles inside the filter is needed [4,8,10,11,12].
In most engine operating conditions, the exhaust gas temperature is insufficient to regenerate the filter. A catalyst is usually used to reduce the PM oxidation temperature [4,5,10,11]. Feng et al. [13] have proposed an attractive concept to use nanowires with catalysts for fuel oxidation. However, since the diesel soot is a solid material and is not diffusive, it is difficult to maintain an effective reactivity, due to the limited contact surface with the catalyst. Additionally, the thermal durability of existing platinum catalyst-supported DPFs is inadequate. Thermal deactivation has been reported, due to high temperature sintering of metal catalysts, called hydrothermal aging [14,15]. Platinum is a rare metal. An establishment of a new PM treatment technology without recourse to the catalyst is urgently required. Thus, it is important to develop a non-catalytic exhaust after-treatment.
There is an alternative, the silicon carbide (SiC) fiber filter. SiC fiber has been widely used in the aerospace industry, due to its high thermal durability. Recently, we have proposed an after-treatment system with silicon carbide (SiC) fibers [16,17]. The schematic is shown in Figure 1, with an image of the inner structure obtained by an X-ray computed tomography (CT) technique. Later, a calculation domain is described in section 2.4, which is shown by a dotted box. The filter is cone-shaped, and it is composed of three layers of SiC fibers. The thickness of the filter (L) is 3.1 mm. The strategy of the PM trap is straightforward, like filter papers. Simply, the diesel soot is trapped inside the fiber structure when the exhaust gas passes through the filter. Trapped particles are burned by an electric heater implemented with a usual 12 V battery. To ensure the complete exhaust after-treatment without any catalysts, air flow is used to promote deposited PM oxidation by an increase of the oxygen concentration. The heat of soot oxidation can be utilized. Continuous electrical heating is not needed. The advantage is that the system is simple, and the filter backpressure is extremely low due to its high porosity. Moreover, concentrations of CO and HC (unburned hydrocarbons) could be reduced, because the exhaust temperature is high enough. In our preliminary experiment, the validity of our proposed system was confirmed by a vehicle test [17]. Since information acquired in experiments is limited [7,9,17], it is difficult to understand how PM is deposited and oxidized inside the filter.
So far, we have succeeded in developing a numerical scheme for the soot trap and oxidation using the lattice Boltzmann method (LBM) [8,16,18,19,20]. In the present paper, the deposition and oxidation processes of soot were simultaneously simulated for a diesel exhaust after-treatment system [4,21]. In order to directly investigate the phenomena occurring inside the actual filter, the inner structure was analyzed by a 3D X-ray computed tomography (CT) technique. The tomography-assisted simulation was conducted using LBM. Based on simulation results, the conditions required for the non-catalytic exhaust after-treatment were quantitatively discussed.
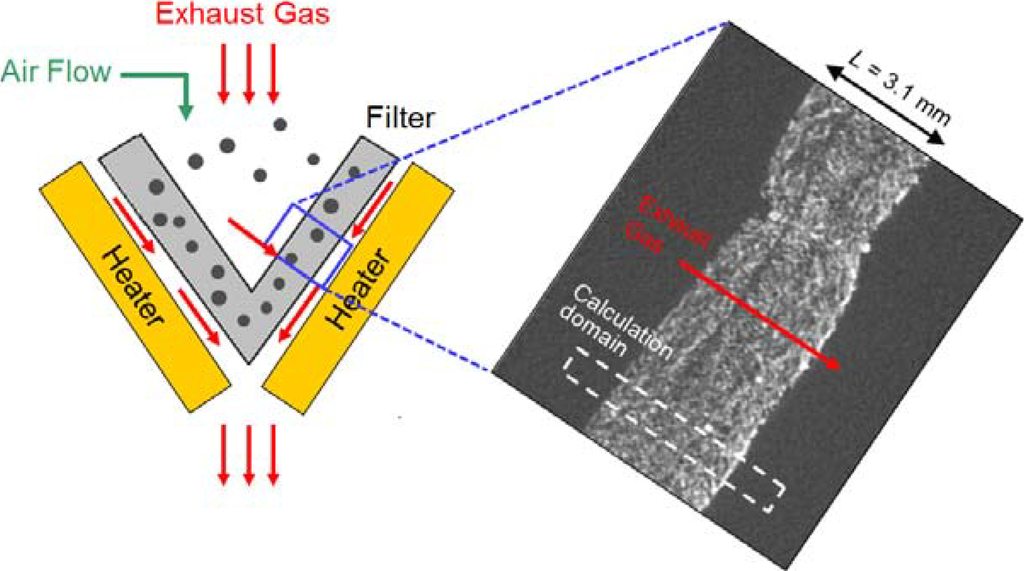
Figure 1.
A schematic of after-treatment system with an SiC fiber filter with an image of inner structure of the filter obtained by an X-ray computed tomography (CT) technique.
Figure 1.
A schematic of after-treatment system with an SiC fiber filter with an image of inner structure of the filter obtained by an X-ray computed tomography (CT) technique.

2. Numerical Method
2.1. X-ray CT Technique
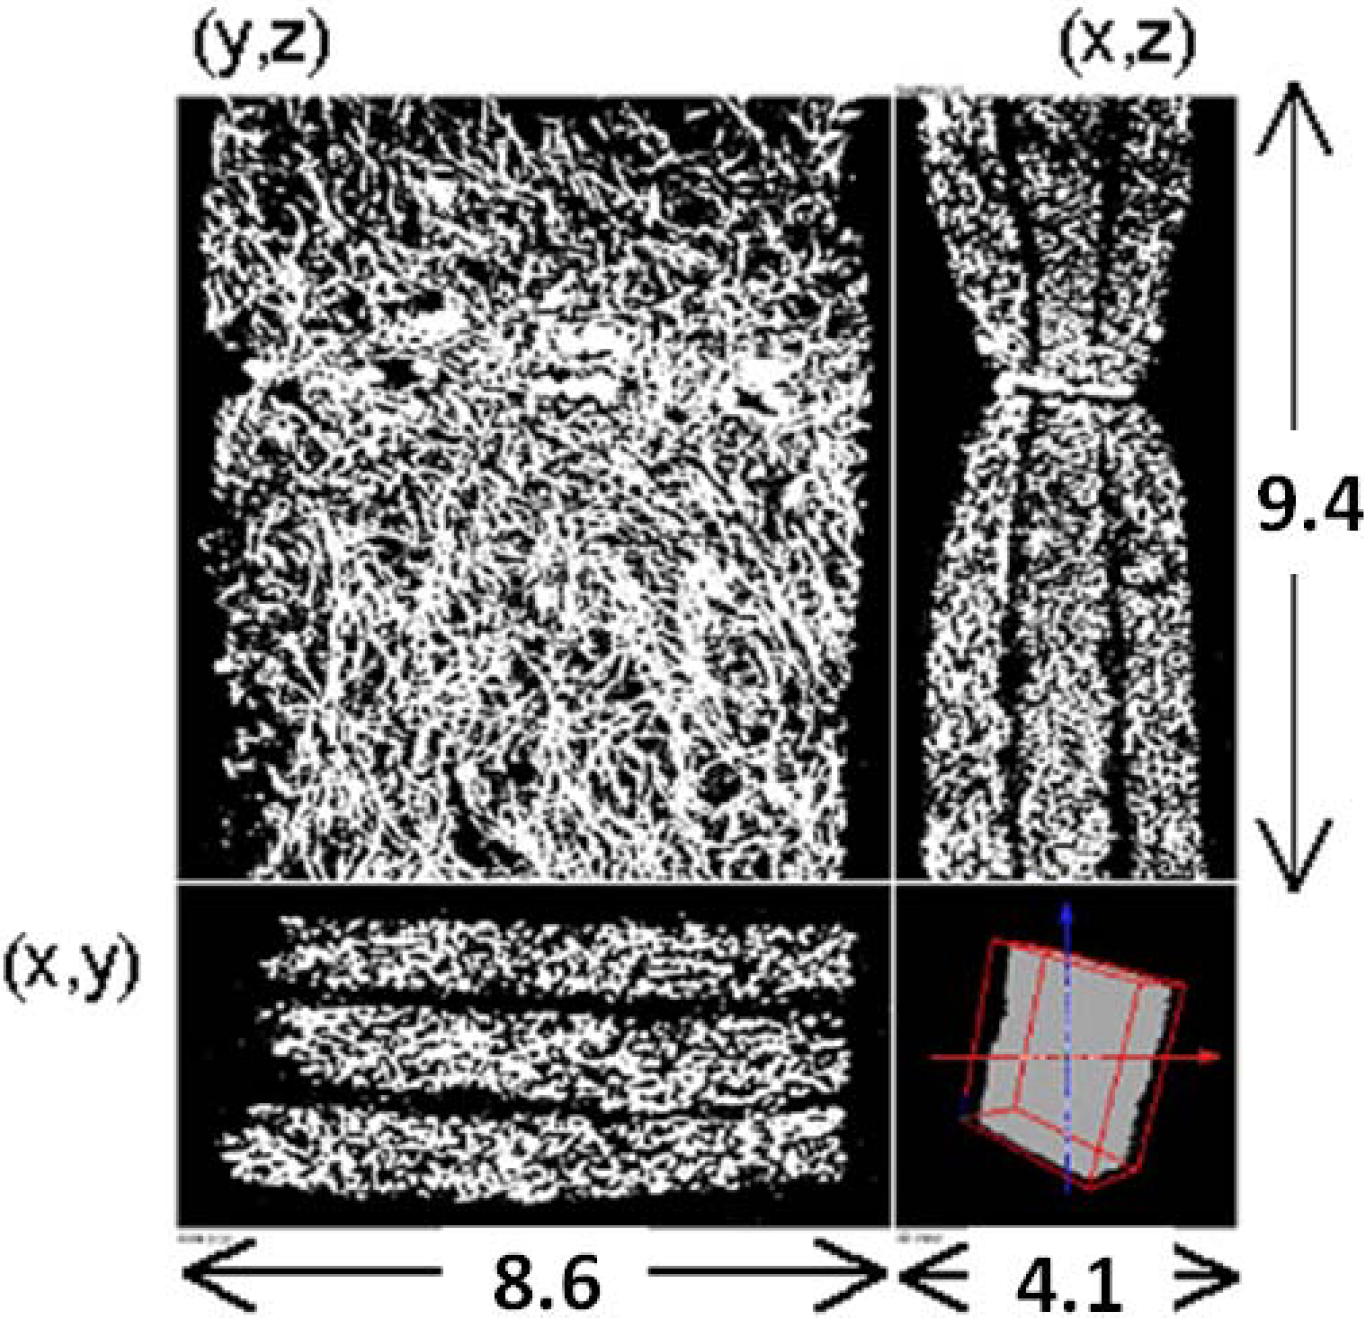
To simulate the flow in a real filter, we need to obtain its inner structure. A micro-focus X-ray tomography system, XVA-160 (Uni-Hite System Corporation, Japan), was used [22]. Figure 2 shows the cross-sectional view of the filter obtained by X-ray CT in the x-y, y-z, and x-z planes. It has three layers in order to trap diesel soot effectively. The estimated porosity of the filter is locally varied from 0.5 to 0.9. The spatial resolution of CT measurement was 13.3 μm/pix, which was the grid size in the simulation. The pixel number is 311 (x) × 651 (y) × 711 (z), and the total image size is 4.1 mm (x) × 8.6 mm (y) × 9.4 mm (z). Compared with our previous work [8], the coarse grid was chosen, simply because the filter thickness was larger. We checked the grid dependency by changing the size and number of the grid system, ensuring that a grid size of 13.3 μm was enough to construct the SiC fiber structure.
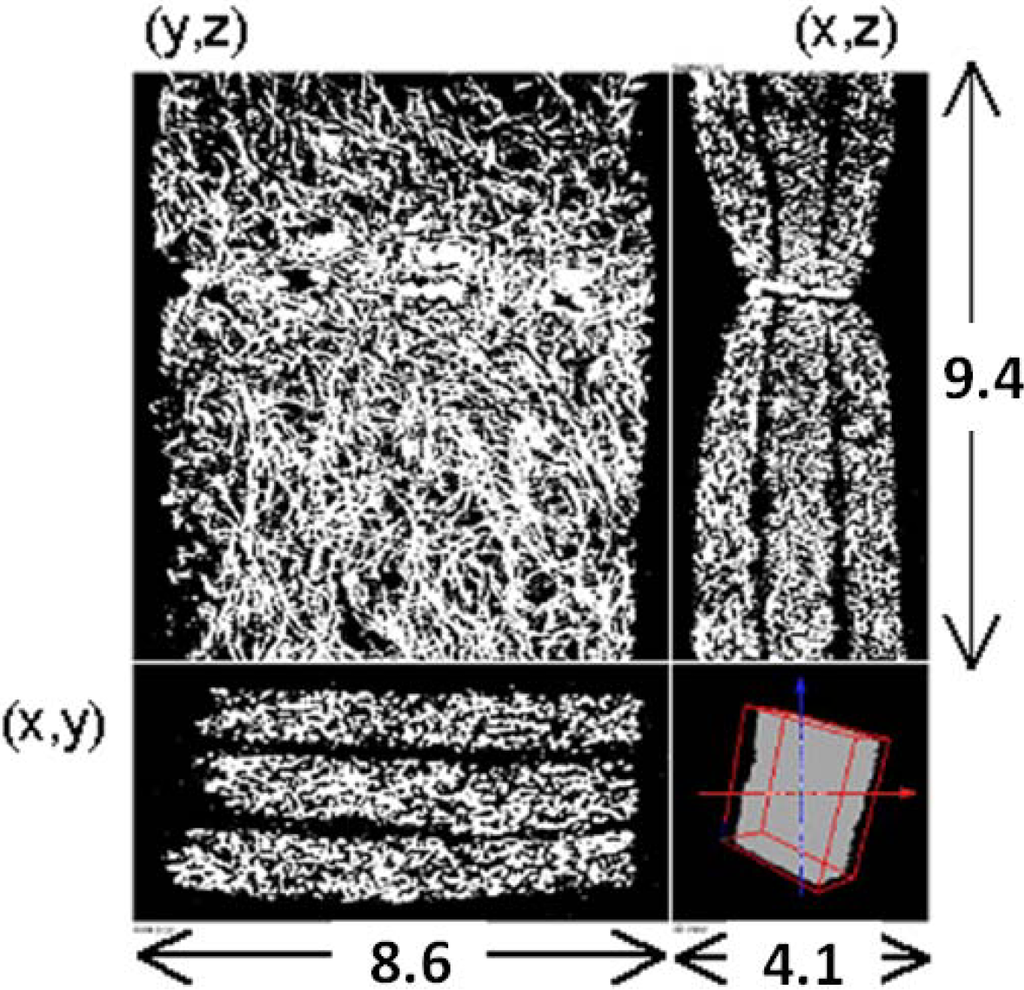
Figure 2.
X-ray CT images of the SiC fiber filter; the x-y, y-z, and x-z planes are shown.
Figure 2.
X-ray CT images of the SiC fiber filter; the x-y, y-z, and x-z planes are shown.
2.2. SiC Fiber Filter
As already shown in Figure 2, the SiC fiber filter has a complex structure. The average fiber diameter is 10 µm. The unique property of the fiber is the high specific surface area ranging from 1 to 100 m2/g, depending on the fiber density and porosity. As for the filtration, several mechanisms are proposed [6,9,23]. Mainly, three mechanisms are considered; surface straining, depth filtration and cake filtration. In surface straining, a large particle cannot pass through the filter, yet smaller particles pass through. In depth filtration, the particle is removed from a fluid even though the particle may be smaller than the pore diameter, which is caused by inertial impaction, direct interception, Brownian deposition, electrostatic attraction and gravity settling. In the cake filtration, once successive layers of soot particles are formed, which is usually called a soot cake, better filtration is achieved [6,7,8,9]. Since the particle size in diesel exhaust gas is much smaller than the fiber spacing of SiC fiber filters, the filtration in the proposed system could be mainly explained by the depth filtration, which will be discussed later.
2.3. Lattice Boltzmann Method
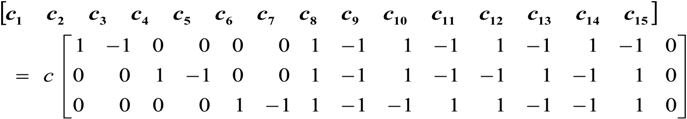
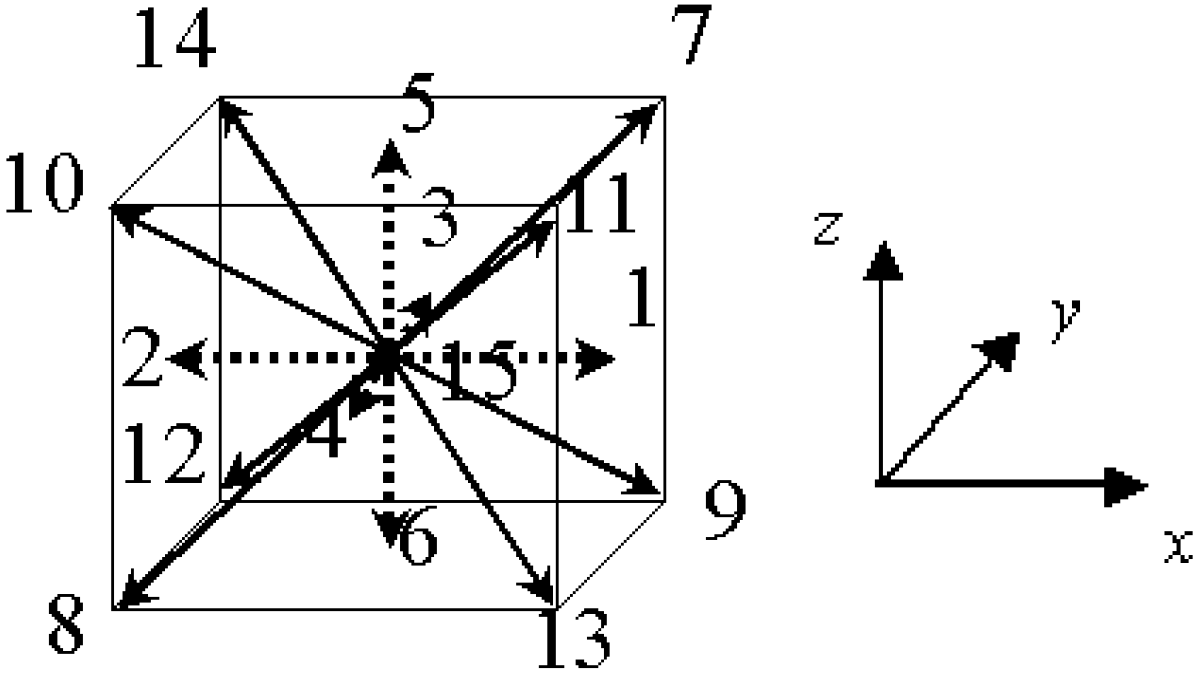
Here, we explain the numerical scheme of the lattice Boltzmann method to simulate the soot trap and oxidation [8,16,17,18,19,20,24]. The flow is described by the lattice Bhatnagar-Gross-Krook (LBGK) equation in terms of the distribution function. The 3D LBGK model (D3Q15 model) [25] evolves on the lattice space with the following 15 discrete velocities in Figure 3.
 where c is the advection speed. The evolution equation using the pressure distribution function is,
 where δt is the time step and τ is the relaxation time that controls the rate of the approach to equilibrium. The equilibrium distribution function, pαeq, is given by:
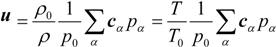
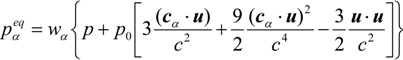 where wα = 1/9 (α = 1:6), wα = 1/72 (α = 7:14) and w15 = 2/9. The sound speed, cs, is c/√3 with p0 = ρ0RT0 = ρ0cs2. Here, p0 and ρ0 are the pressure at the outlet (see Figure 4) and density at room temperature. To consider the variable density, we adopt the low Mach number approximation [24,26]. The pressure and local velocity of u = (ux, uy, uz) are obtained using the ideal gas equation.

 The relaxation time is related to kinetic viscosity using ν = (2τ − 1)/6 c2δt. Then, through the Chapman–Enskog procedure, the Navier-Stokes equations are derived from these equations [27]. On the other hand, the LBM formula for temperature and concentration fields is,

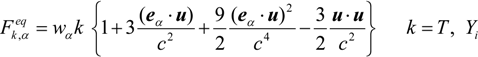 where Qk is the source term, due to chemical reaction [24], and Fk,αeq is the equilibrium distribution function. The temperature, T, and mass fraction of species i in gas phase Yi are determined by these distribution functions.


The soot in the gas phase is deposited on the fiber or the soot layer. The soot deposition is described by the modified particle deposition model [28]. Different from the Lagrangian approach through the equation of motion, individual particles are not considered. Instead, the soot concentration is monitored, so that we do not have to consider the complex geometry of nanoparticles [1,2]. The mass fraction of deposited soot is given by:
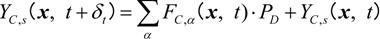 where YC,s is the mass fraction of deposited soot on the SiC fiber or the deposited soot layer and PD is the soot deposition probability, which controls the amount of soot deposition attached to the filter [16,20]. If PD is unity, soot is thoroughly deposited on the SiC fiber without reflection; else, some of the particles are bounced back and transported downstream. As the soot deposition is continued, the soot mass fraction sometime becomes unity. When this limit is reached, the solid site is piled up. In this case, the deposited soot region is treated as a non-slip wall, which implies a change of the boundary condition for a fluid. In our previous study, we determined the value of PD of the fiber filter [20]. When the value of PD was set to 0.001 in the simulation, the mass of soot deposited on the SiC fiber showed a good agreement with the experimental data. Then, we adopted this value. In the simulation, we used a standard PC with CPU with an Intel Xeon Processor X5680 3.33 GHz (Intel Corporation, USA).

Figure 3.
The D3Q15 model used in the lattice Boltzmann method for 3D simulation.
Figure 3.
The D3Q15 model used in the lattice Boltzmann method for 3D simulation.
2.4. Calculation Domain and Boundary Conditions
Figure 4 shows the calculation domain and coordinate system in the simulation. The size is 5.19 mm × 0.53 mm × 0.53 mm, and the total number of grids is 391 (Nx) × 41 (Ny) × 41 (Nz). As already explained, the grid size is 13.3 μm, which is the spatial resolution of the CT measurement. A part of the filter detected by the X-ray CT technique is inserted at the center of the calculation domain. As shown in Figure 1, the filter thickness, L, is 3.1 mm.
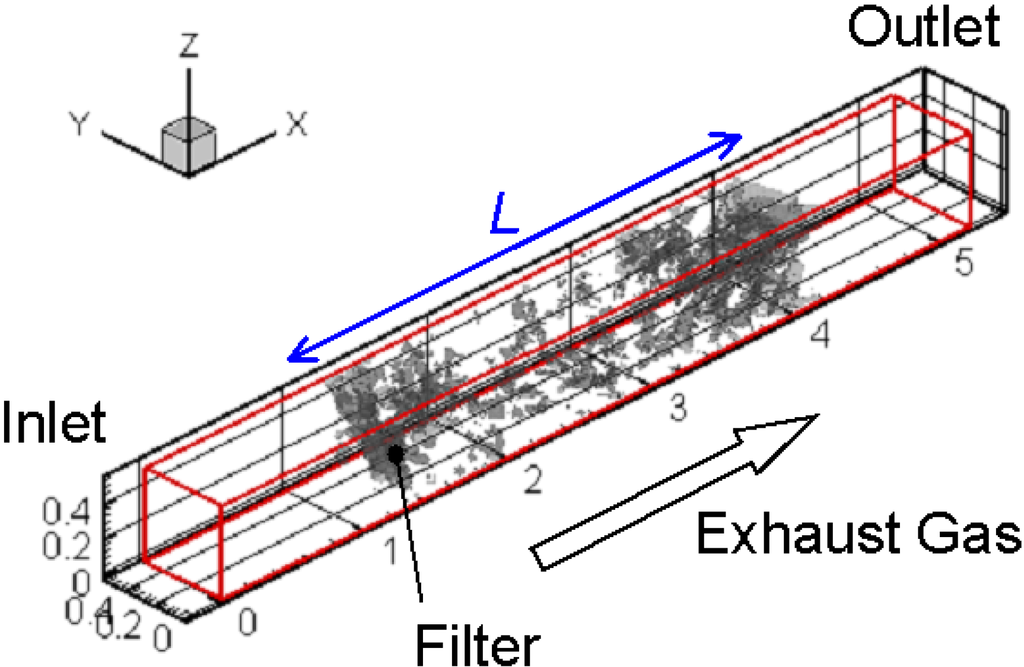
Figure 4.
The calculation domain and coordinate system are shown.
Figure 4.
The calculation domain and coordinate system are shown.
For the boundary condition, the inflow boundary was adopted at the inlet, corresponding to the experimental conditions [17,20]. Numerical conditions are summarized in Table 1. Only the flow field was examined in Case 1, where no soot was included in the flow. Other cases were the simulations of soot oxidation. The inflow velocity of exhaust gas was 1 m/s, and its temperature was 400 °C. The filter temperature controlled by the heater was varied from 700 to 1400 °C. The soot mass fraction was 0.01. The volumetric oxygen concentration (CO2) was changed, which could be an important parameter to promote soot oxidation [18]. The typical value in diesel exhaust gas was 10% in volume (0.113 in mass fraction). At the side wall, the slip boundary condition was adopted, considering the symmetry. At the outlet, the pressure was constant, and the gradient of the scalar, such as temperature and mass fraction, was set to be zero. On the surface of the fiber filter or the deposited soot layer, a non-slip boundary condition was adopted [29]. For the reaction scheme, an overall one-step reaction proposed by Lee et al. [30] was adopted to evaluate the soot oxidation rate.

Table 1.
Numerical conditions.
| Case | Inflow velocity (m/s) | Filter temperature (°C) | CO2 (%) | Soot mass fraction |
|---|---|---|---|---|
| 1 | 0.05–2.0 | 400 | 10 | 0 |
| 2 | 1.0 | 700 | 10 | 0.01 |
| 3 | 1.0 | 1200 | 10 | 0.01 |
| 4 | 1.0 | 1400 | 10 | 0.01 |
| 5 | 1.0 | 700 | 20 | 0.01 |
| 6 | 1.0 | 1200 | 20 | 0.01 |
| 7 | 1.0 | 1400 | 20 | 0.01 |
3. Results and Discussion
3.1. Flow Field inside the Filter
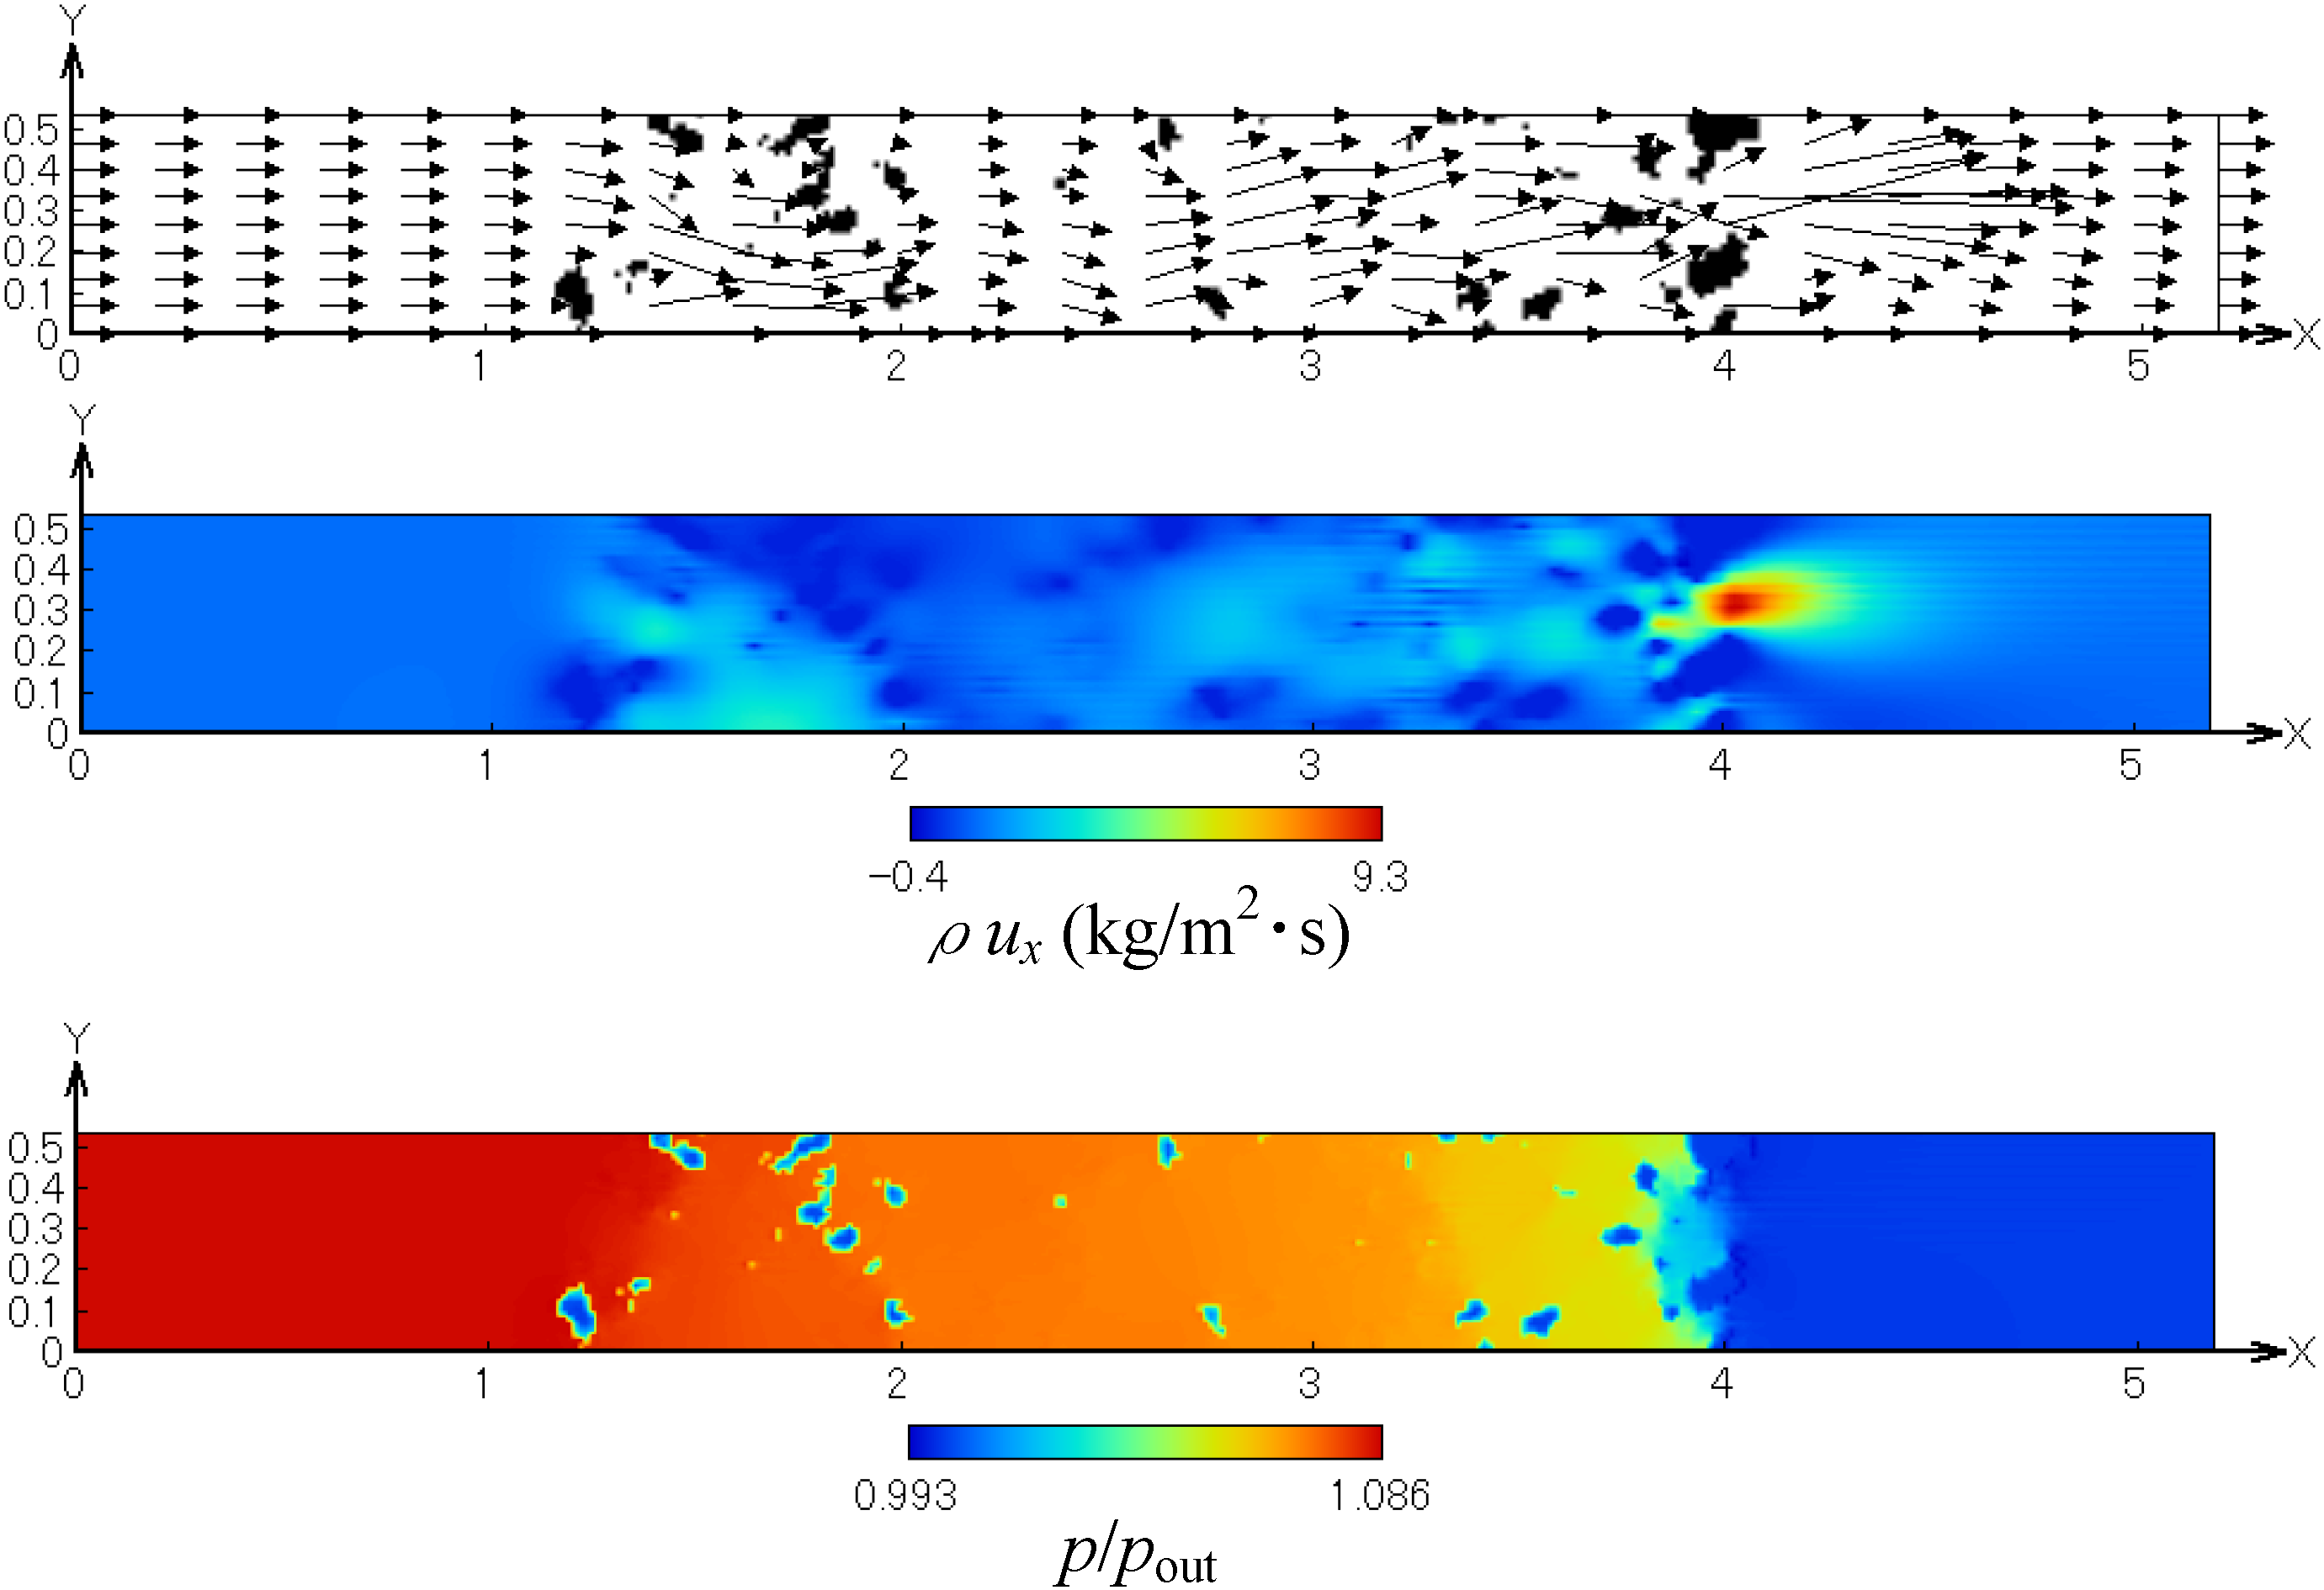
Before simulating the soot trap process, we examined the flow field and pressure inside the filter by using the exhaust gas without soot. Figure 5 shows the profiles of the flow field, non-dimensional mass flux in the x-direction and pressure. These are obtained in the x-y plane at the center of the computational domain (z = 0.265 mm). It is found that, as the flow passes through the SiC fiber filter, the pressure is gradually decreased along the flow direction. The velocity is locally accelerated in the narrow path in the fiber spacing. Flow recirculation also exits. Thus, the flow field inside the filter is well observed, which could not be obtained by velocity measurements.

Figure 5.
Profiles of the flow field, mass flux in the x-direction and pressure.
Figure 5.
Profiles of the flow field, mass flux in the x-direction and pressure.
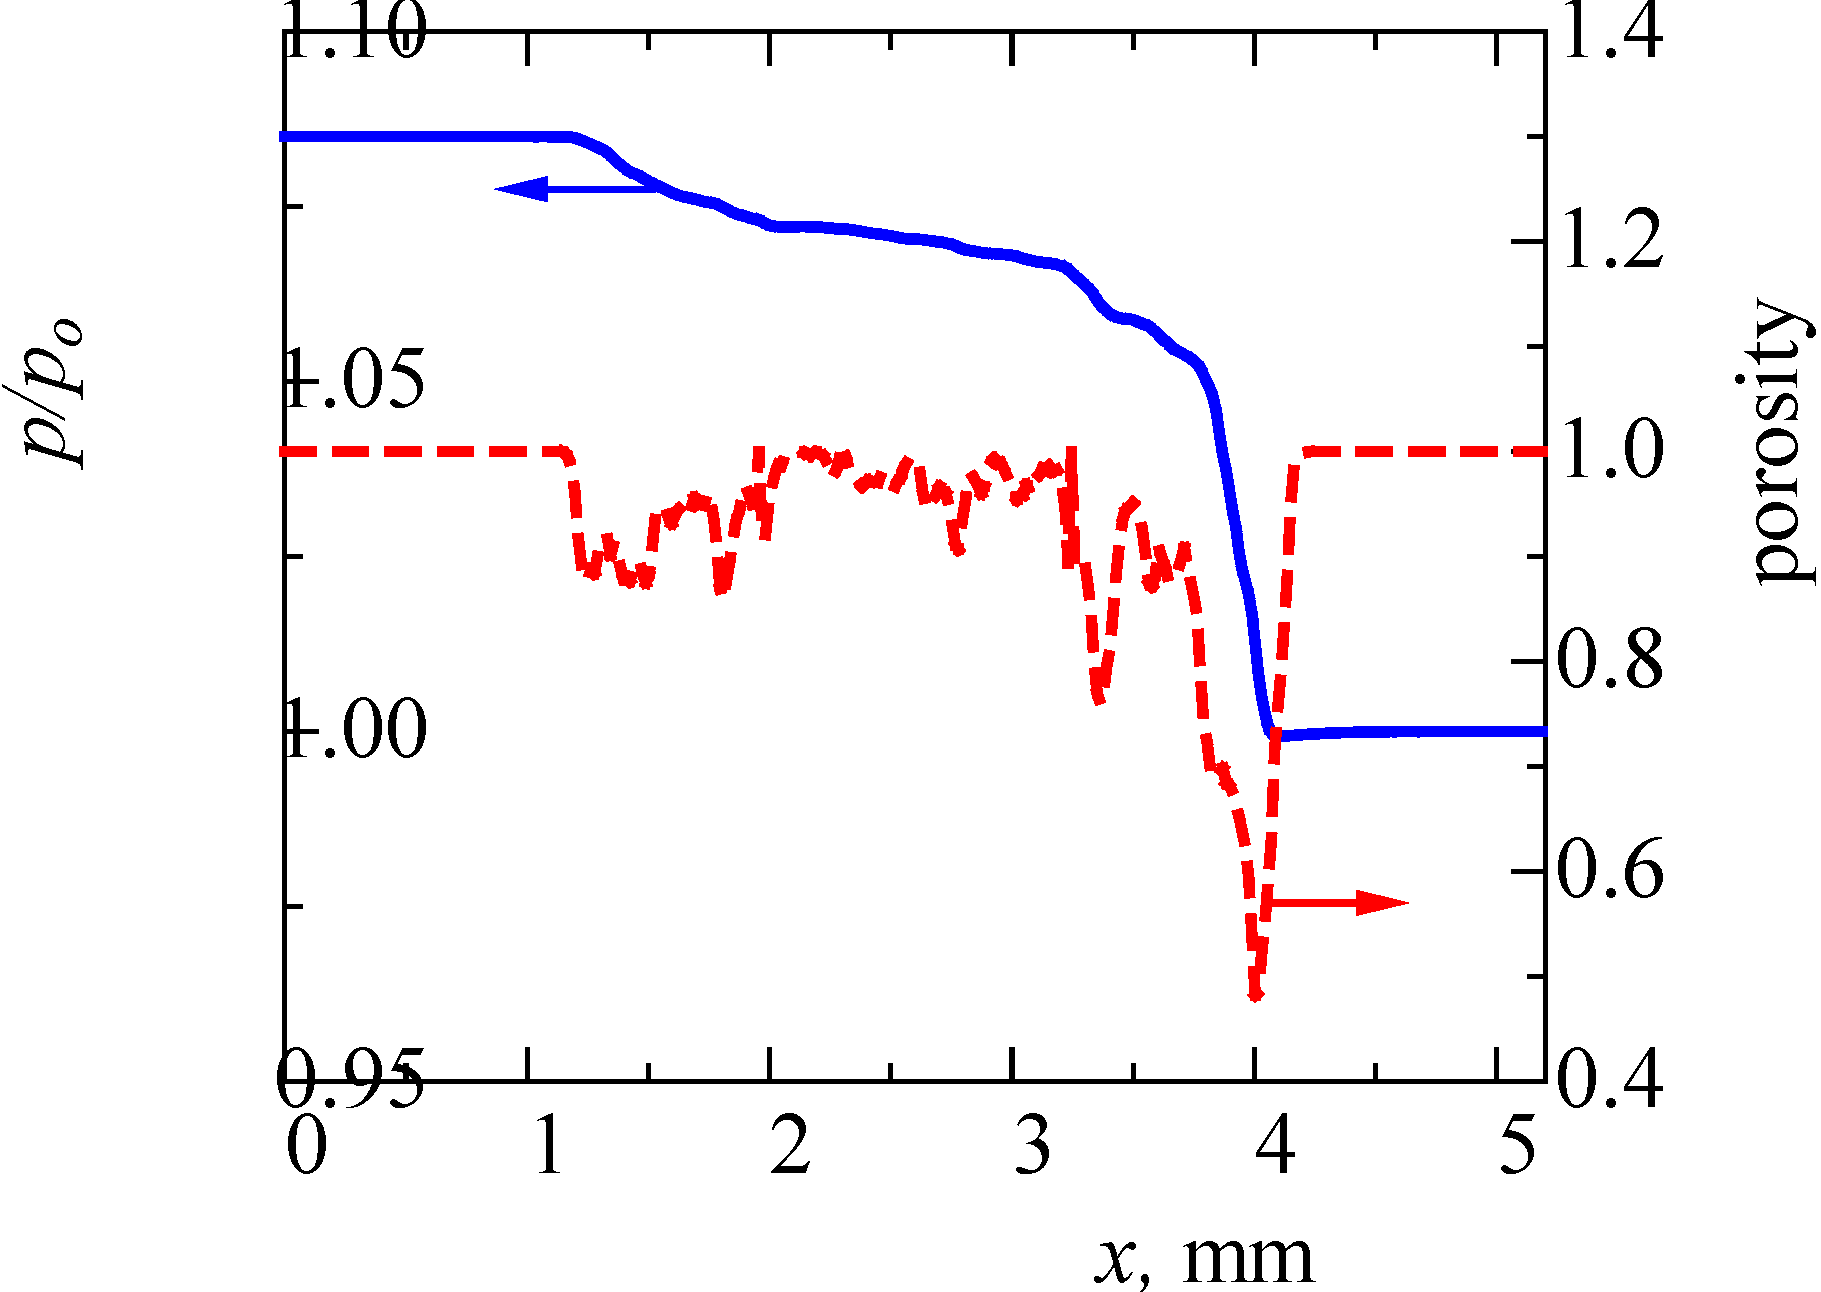
Next, we examined the pressure field quantitatively. The result is shown in Figure 6. This pressure is the averaged value in the y-z plane. For comparison, we checked the porosity, ε, inside the filter. The filter is roughly located in the range of 1.05 mm < x < 4.15 mm. The porosity outside the filter is unity. It is seen that the pressure gradient is varied. It is well known that, in the case of homogenous porous media flow, the pressure linearly decreases along the flow direction, and the pressure gradient is constant [16,18,31]. However, as seen in this figure, the porosity inside the filter is varied from 0.5 to 0.9. It may be noted that the porosity around x = 4 mm is largely reduced, which is due to the manufacturing process of the cone filter. Resultantly, the pressure gradient is not constant. Therefore, depending on the non-uniformity of the pore-structure, both flow and pressure are varied inside the filter.
In our previous study [19], we simulated the flow in a ceramic wall flow filter. It was a cordierite filter whose porosity was 0.4. At the same inflow velocity of 1 m/s, the inlet pressure of p/p0 was 2.1. On the other hand, the value in Figure 6 is 1.085. Then, these filter backpressures of (p-p0)/p0 are 1.1 and 0.085, respectively. The backpressure of the wall flow filter is 13 times higher than that of SiC fiber. This is mainly due to its lower porosity.

Figure 6.
Distributions of pressure and porosity across the filter.
Figure 6.
Distributions of pressure and porosity across the filter.
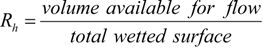
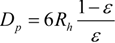
Here, simulation results are compared with the empirical equation [31]. First, the hydraulic radius, Rh, and the equivalent diameter of the filter substrate, Dp, were determined.
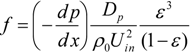
 The friction factor, f, and Reynolds number, Re, are given by:
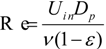 The empirical equation in porous media flow, which is called an Ergun equation, is as follows:
This equation is derived using the assumption of the uniformity of the porous structure. We compared our simulation results with this equation in Figure 7, by changing the inflow velocity in the range of 0.05 to 2.0 m/s. Here, the mean porosity inside the fiber filter was used. The value was 0.908. It is seen that the friction factor evaluated by the simulation is slightly larger than the predicted value by the Ergun equation. In other words, compared with the uniform porous media, it is more difficult to pass the flow through the filter. As a consequence, the particles could be trapped more easily. This may be because the porosity of the filter in Figure 6 is not constant along the flow direction, because of the non-uniformity of the SiC fibers. In the pressure distribution, the pressure gradient inside the filter is changed. Resultantly, the disagreement with the empirical equation is observed.
The empirical equation in porous media flow, which is called an Ergun equation, is as follows:
This equation is derived using the assumption of the uniformity of the porous structure. We compared our simulation results with this equation in Figure 7, by changing the inflow velocity in the range of 0.05 to 2.0 m/s. Here, the mean porosity inside the fiber filter was used. The value was 0.908. It is seen that the friction factor evaluated by the simulation is slightly larger than the predicted value by the Ergun equation. In other words, compared with the uniform porous media, it is more difficult to pass the flow through the filter. As a consequence, the particles could be trapped more easily. This may be because the porosity of the filter in Figure 6 is not constant along the flow direction, because of the non-uniformity of the SiC fibers. In the pressure distribution, the pressure gradient inside the filter is changed. Resultantly, the disagreement with the empirical equation is observed.
f = 150/Re+1.75

Figure 7.
Variations of the friction factor with the Reynolds number (Re) are shown in the simulation, compared with the Ergun equation.
Figure 7.
Variations of the friction factor with the Reynolds number (Re) are shown in the simulation, compared with the Ergun equation.
3.2. Soot Oxidation
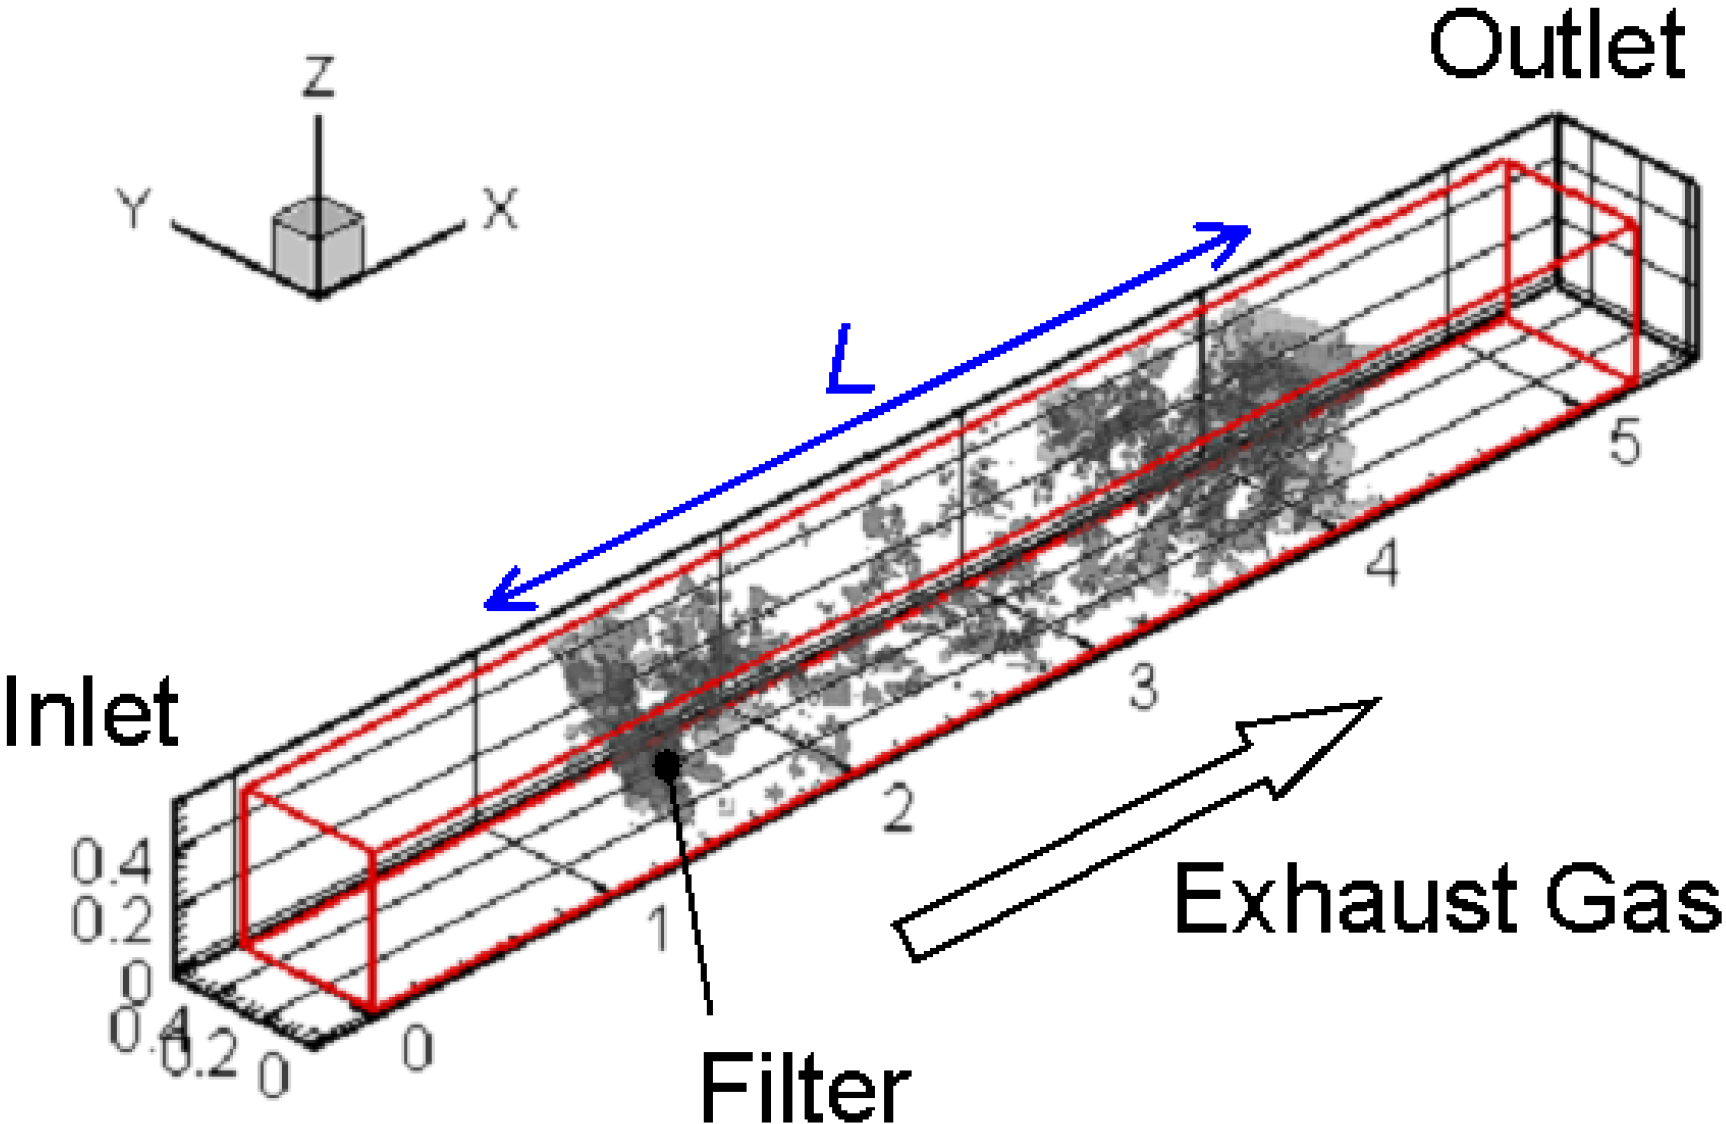
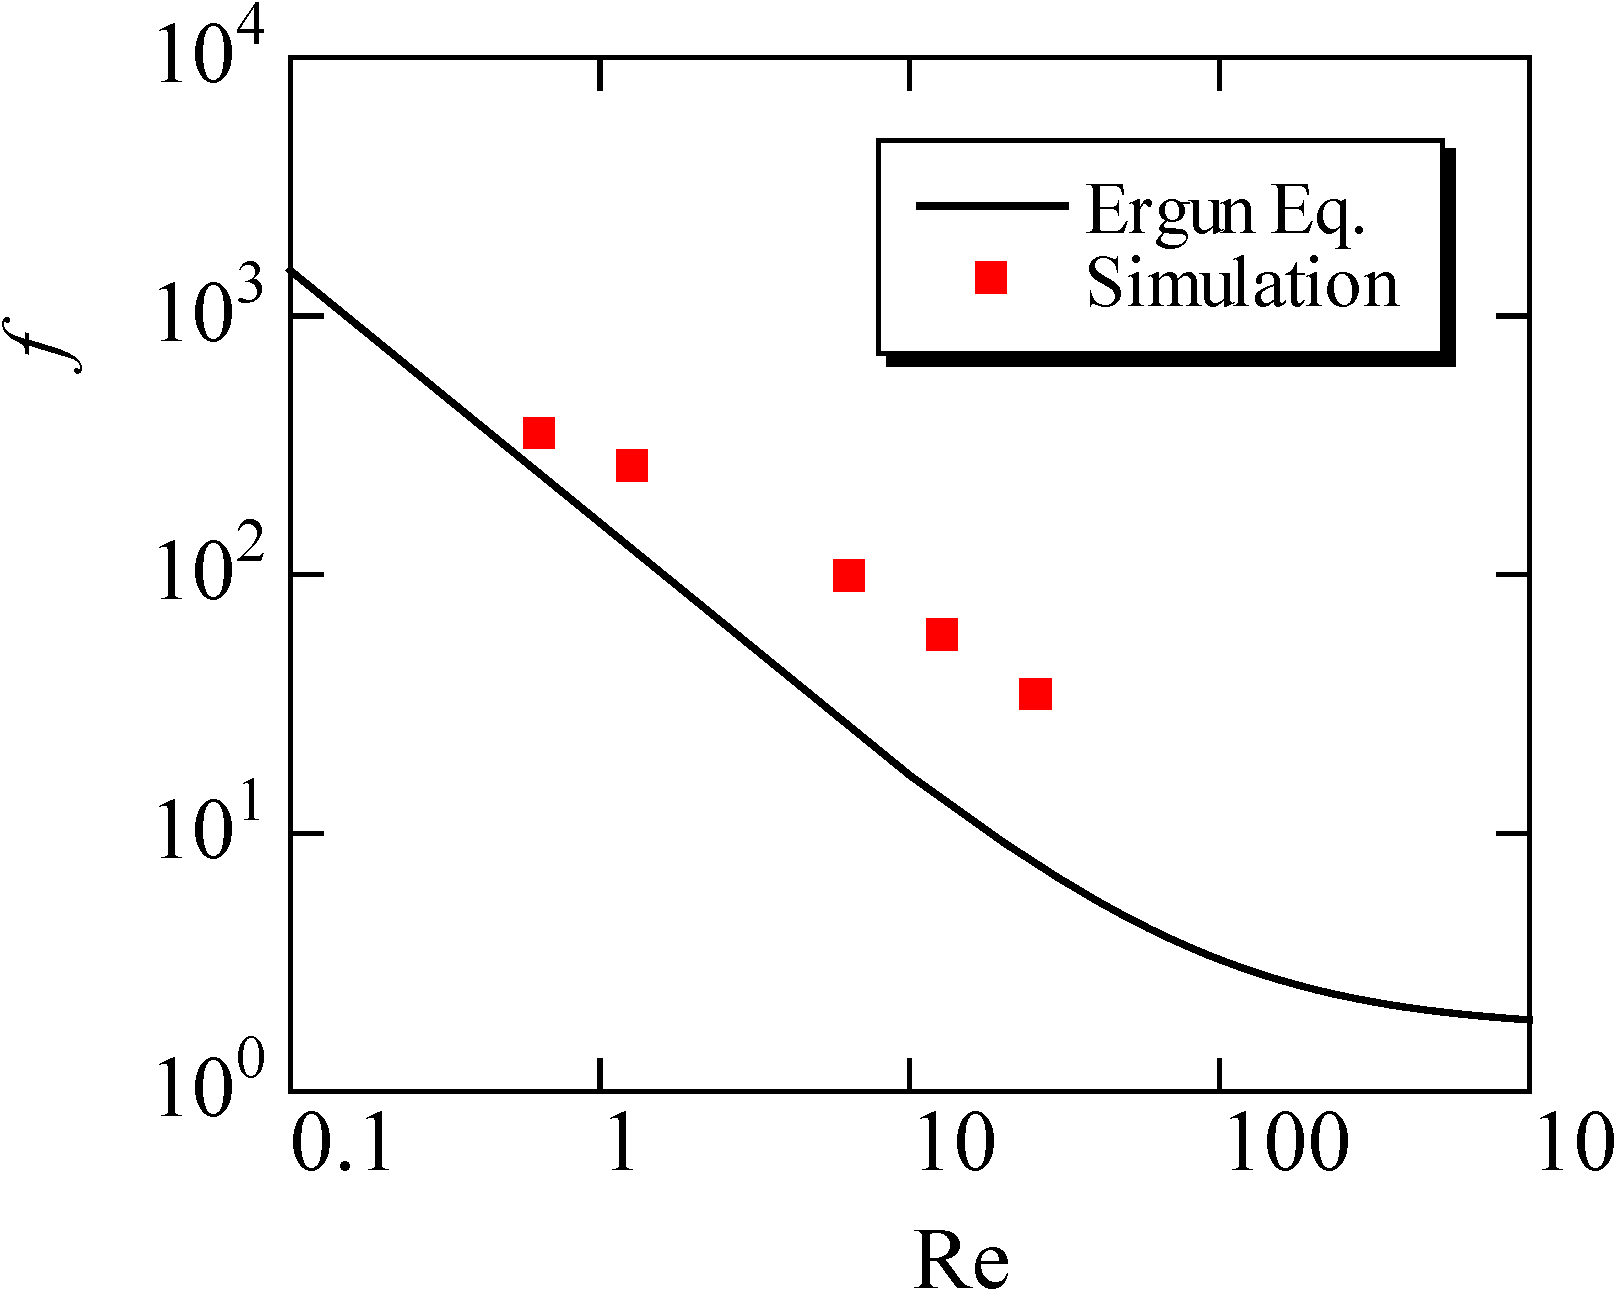
Finally, the soot oxidation process was simulated to investigate the exhaust after-treatment. Figure 8 shows the 3D distribution of the soot mass fraction in the gas phase (Yc, g). The filter temperature (Tw) is 700 °C, and the volumetric oxygen concentration (CO2) is 10%. Three contours corresponding to regions of a soot mass fraction of 0.001, 0.005 and 0.009 are shown, with the gray region of the SiC fibers. The 2D profile in the x-y plane at the center of the computational domain is also shown. It is clearly shown that the soot concentration gradually decreases inside the filter, expectedly caused by the soot deposition and oxidation.
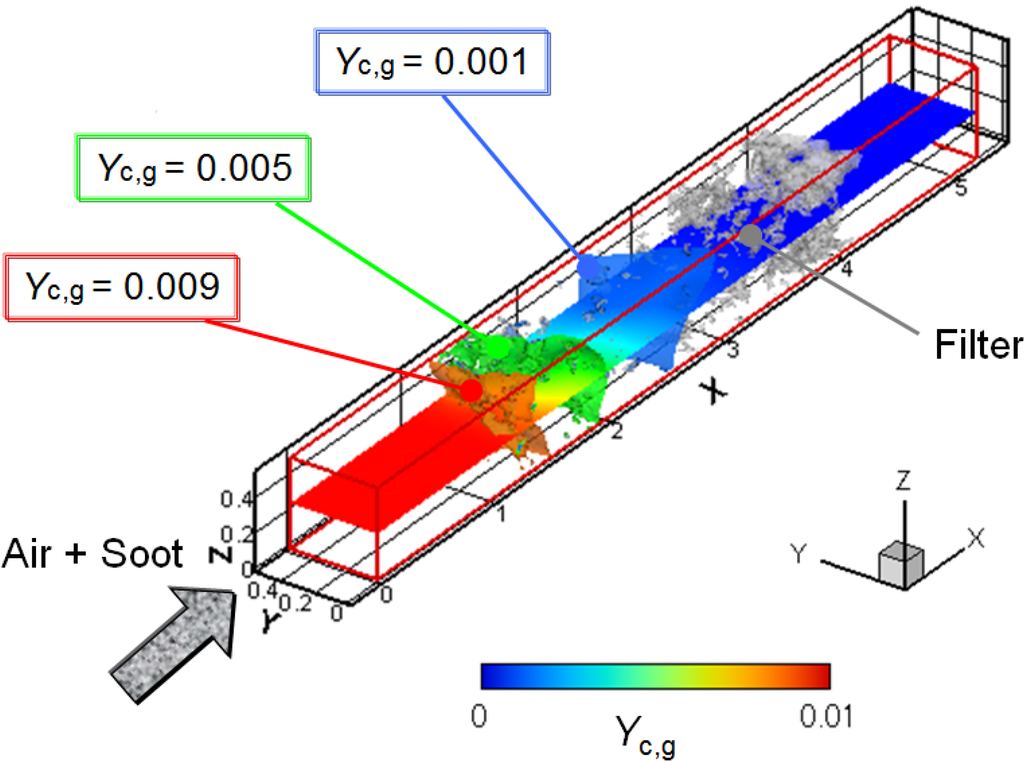
Figure 8.
3D distribution of the soot mass fraction in the gas phase; Tw = 700 °C and CO2 = 10%.
Figure 8.
3D distribution of the soot mass fraction in the gas phase; Tw = 700 °C and CO2 = 10%.

Figure 9 shows the distributions of the soot mass fraction in the gas phase, the temperature and the reaction rate. These are obtained in the x-y plane at Tw = 700 °C and CO2 = 10%. As seen in Figure 9a, the soot concentration is almost zero at the filter outlet. The temperature is increased by approximately 110 °C due to the soot oxidation. In Figure 9c, the reaction rate is large on the SiC fiber, and it is very small in the gas phase. Therefore, it is considered that the soot in the exhaust gas is firstly deposited and then oxidized on the SiC fibers.
Figure 9.
Distributions of (a) the soot mass fraction in the gas phase; (b) temperature; (c) reaction rate; Tw = 700 °C and CO2 = 10%.
Figure 9.
Distributions of (a) the soot mass fraction in the gas phase; (b) temperature; (c) reaction rate; Tw = 700 °C and CO2 = 10%.

Next, we changed the filter temperature, which affects the soot oxidation rate. The filter temperature of Tw was set to be 700, 1200 and 1400 °C at CO2 = 10%. Three-dimensional distributions of deposited soot are shown in Figure 10. The purple contour corresponds to the deposited soot, with the gray region of the SiC fibers. The profile in the x-y plane is the soot mass fraction in the gas phase. Since the soot deposition occurs inside the filter, the depth filtration by SiC fibers is confirmed. Moreover, it clearly shows that, by comparing three cases, the deposited soot region becomes smaller at a higher filter temperature.
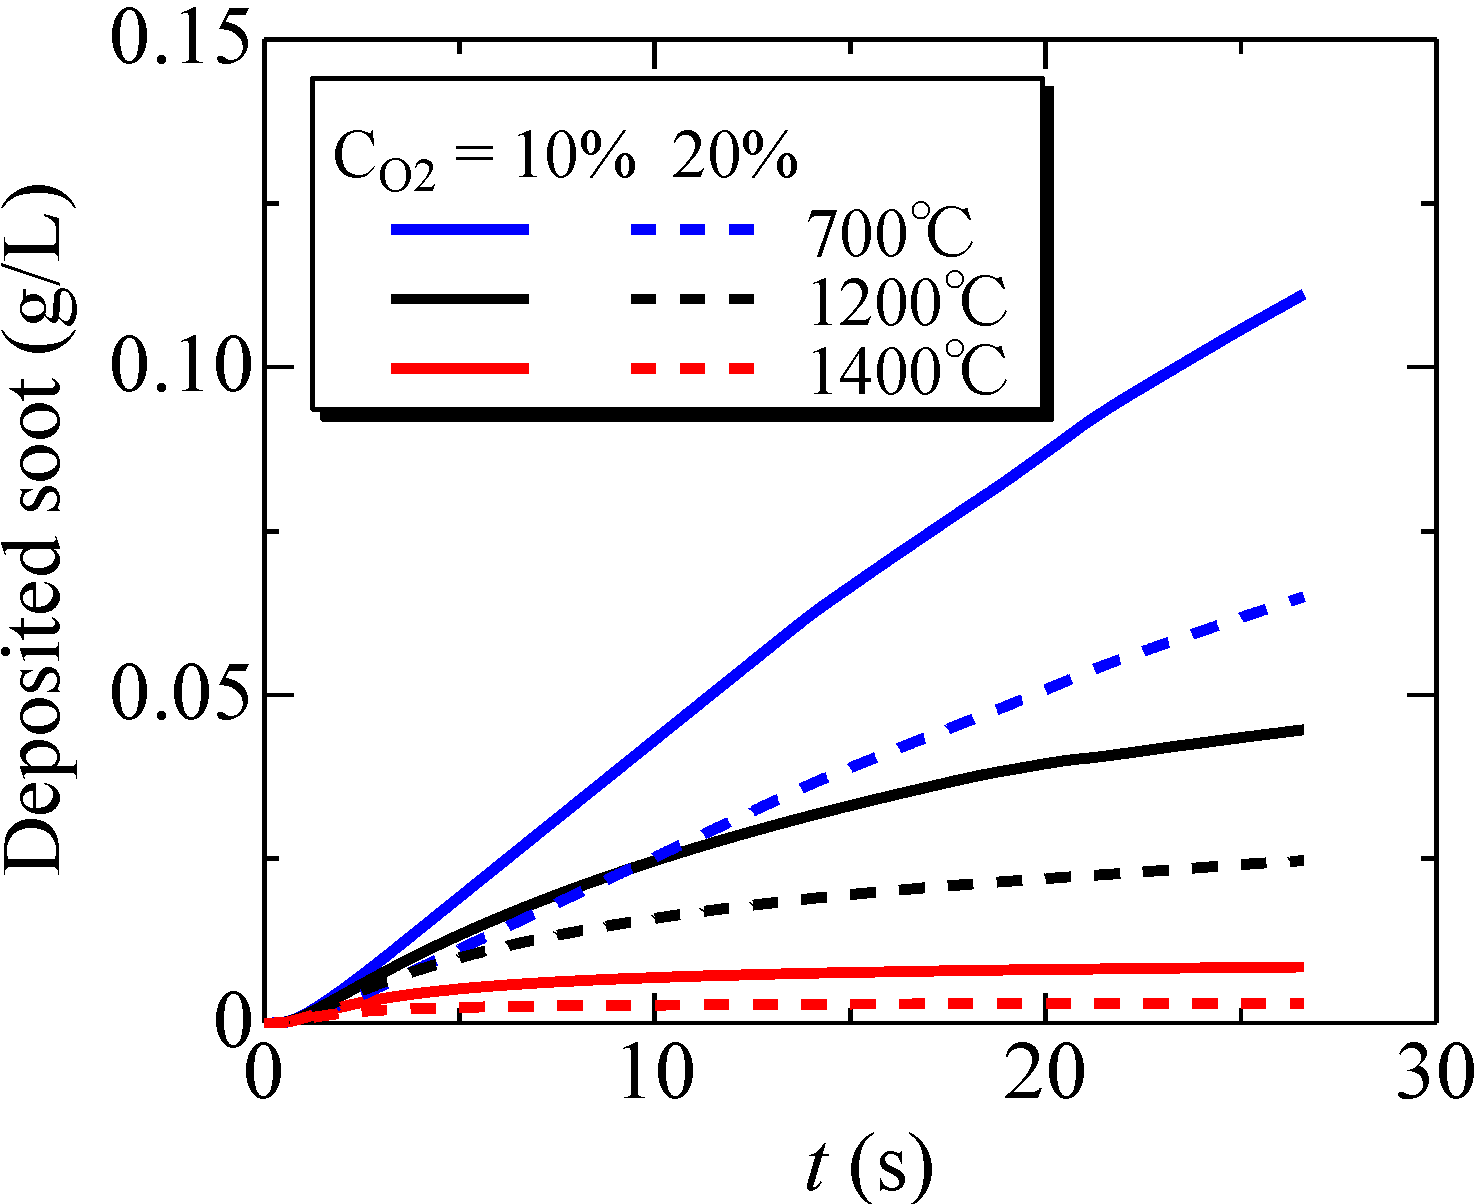
To study this further, time-variations of the deposited soot amount inside the filter were examined at Tw = 700, 1200 and 1400 °C. The results are shown in Figure 11. The volumetric oxygen concentration was 10% or 20%. It is found that, as the filter temperature becomes higher, the deposited soot amount is decreased. Specifically, comparing the oxidation at 700 °C, the deposited soot amount at 1200 and 1400 °C is decreased by 60% and 92%, respectively. That is, more soot is oxidized inside the filter, and filter clogging could be avoided by increasing the filter temperature. In addition, the soot oxidation is promoted with an increase of the oxygen concentration. Quantitatively, raising the oxygen concentration from 10% to 20% increases the oxidation efficiency from 42% to 64%. Although more work is needed over a wide range of operating conditions of the after-treatment system, a combination of these two parameters is important to achieve a non-catalytic system.

Figure 10.
3D distributions of deposited soot at CO2 = 10% are shown; (a) Tw = 700 °C; (b) Tw = 1200 °C; (c) Tw = 1400 °C. The purple contour corresponds to deposited soot. The profile in the x-y plane is the soot mass fraction in the gas phase.
Figure 10.
3D distributions of deposited soot at CO2 = 10% are shown; (a) Tw = 700 °C; (b) Tw = 1200 °C; (c) Tw = 1400 °C. The purple contour corresponds to deposited soot. The profile in the x-y plane is the soot mass fraction in the gas phase.
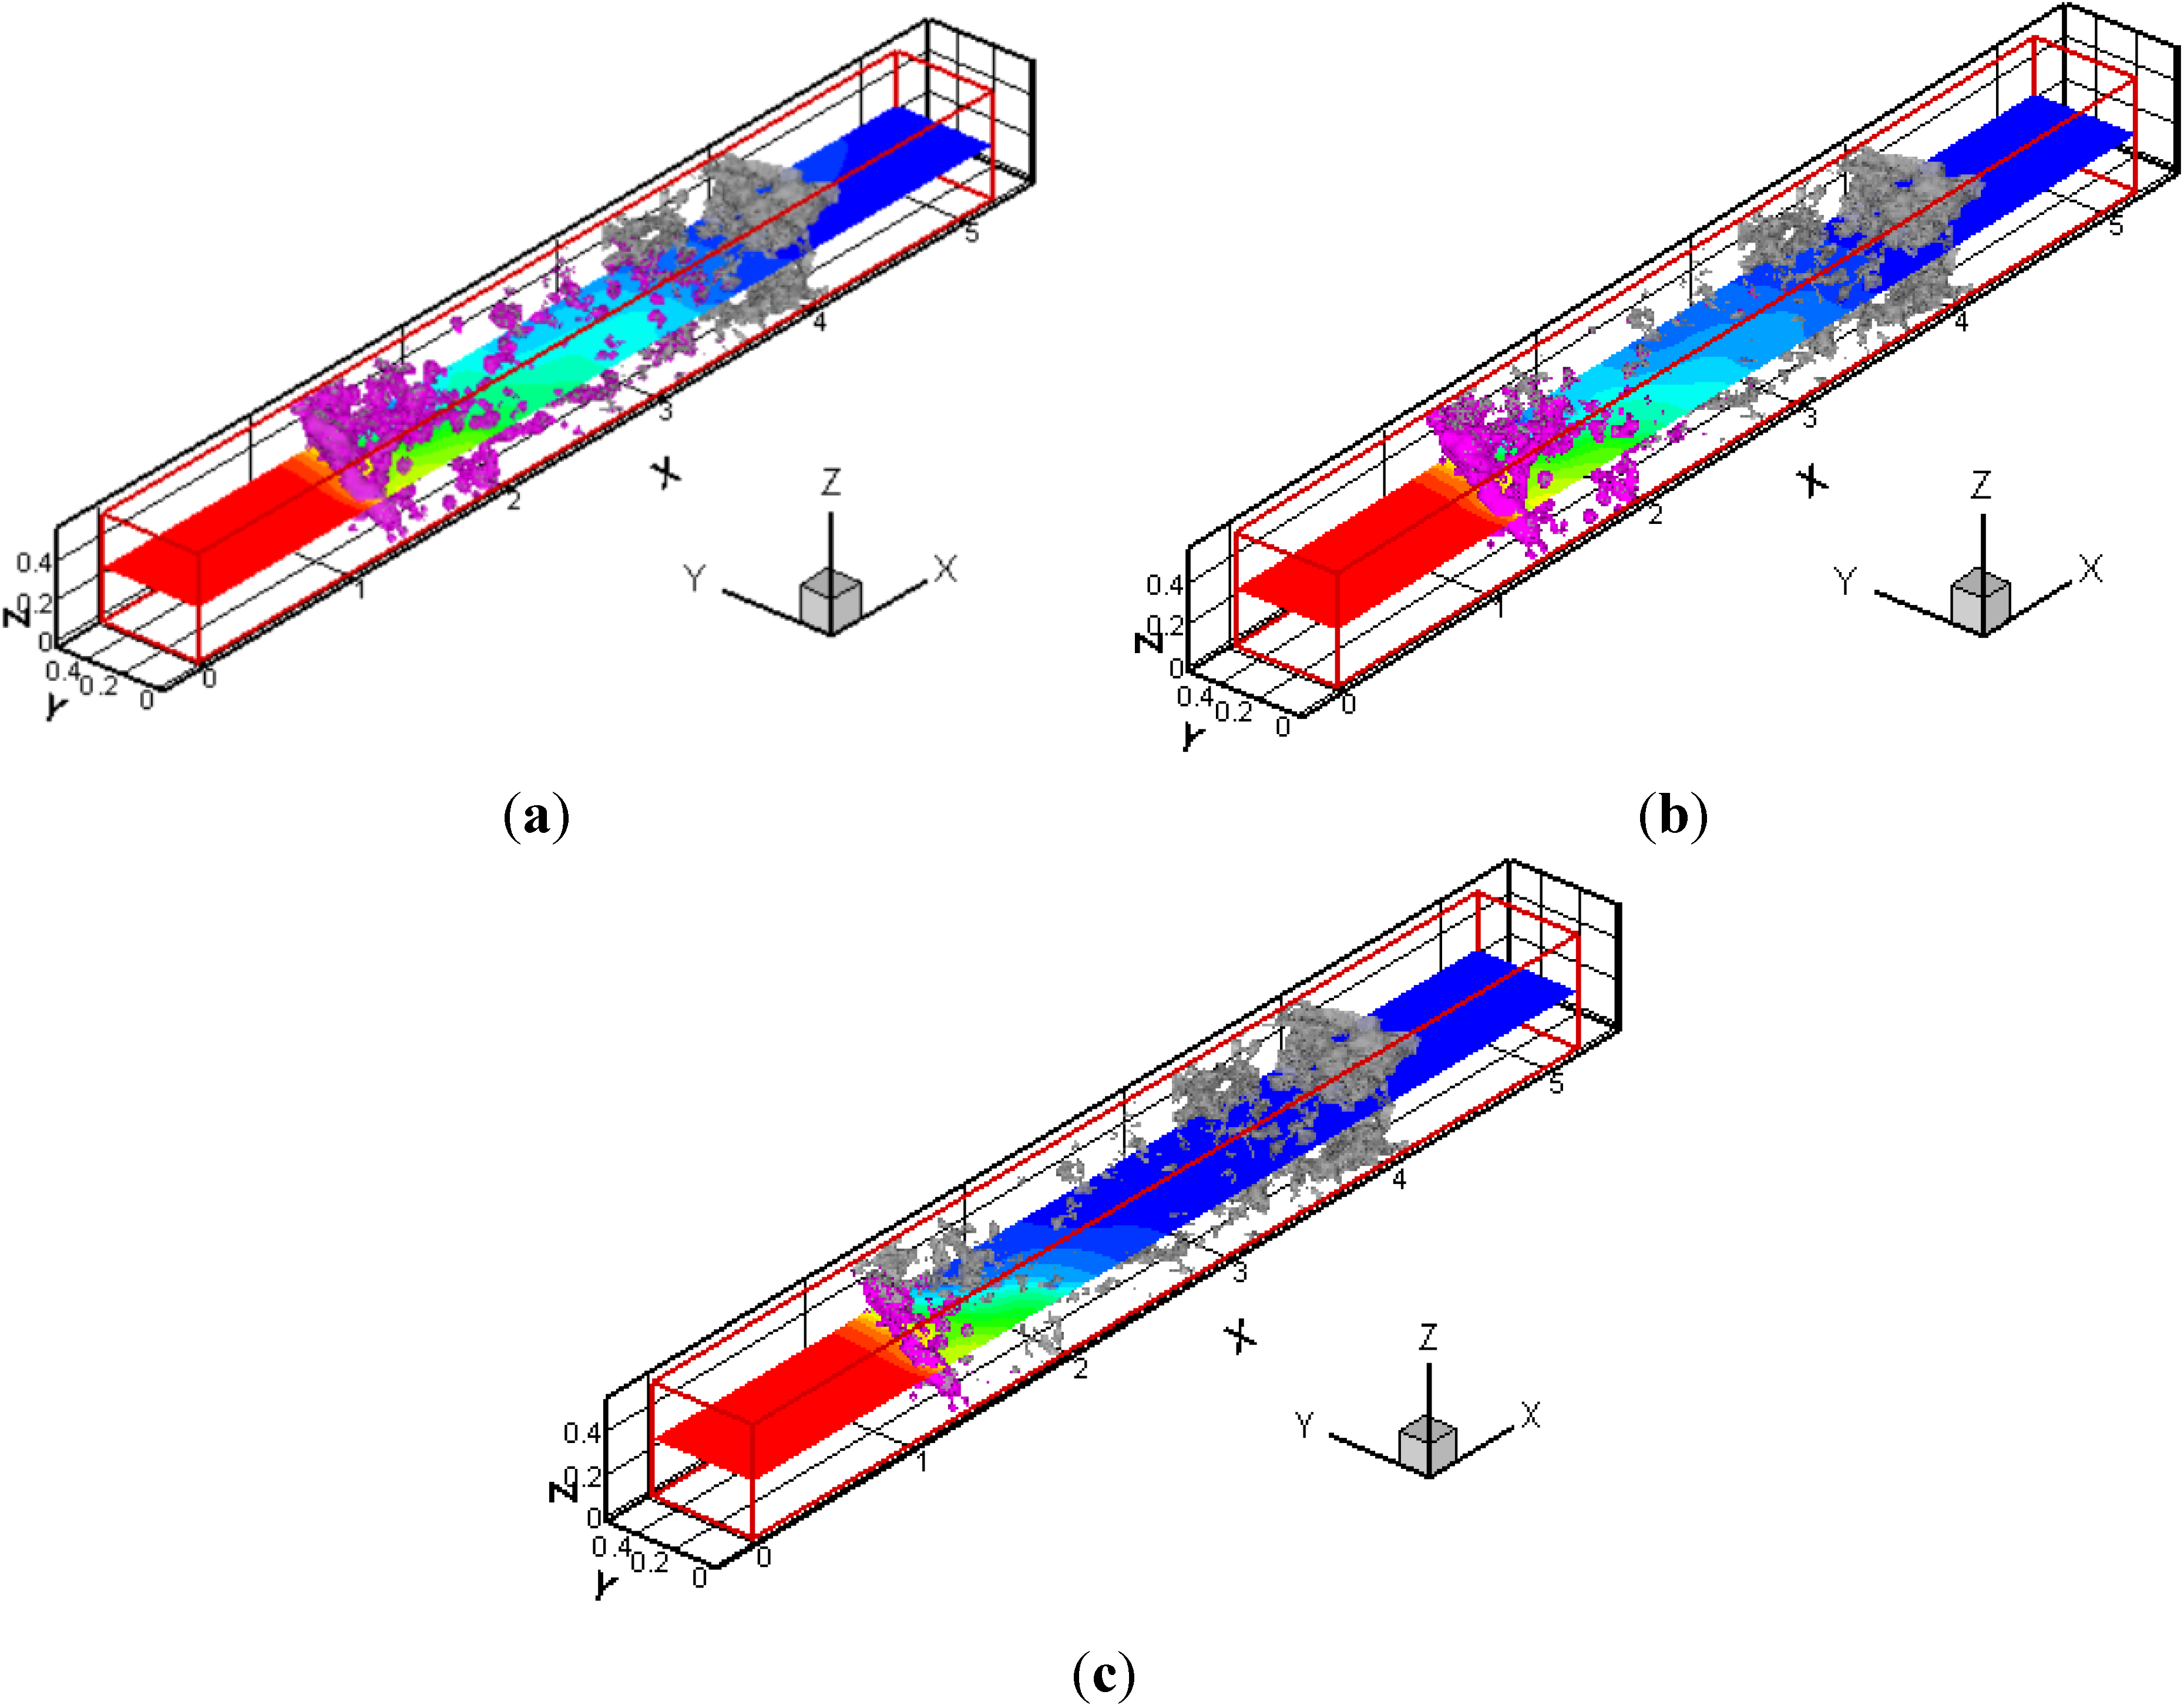

Figure 11.
Time variations of the deposited soot amount inside the filter; Tw = 700, 1200, 1400 °C and CO2 = 10%, 20%.
Figure 11.
Time variations of the deposited soot amount inside the filter; Tw = 700, 1200, 1400 °C and CO2 = 10%, 20%.
4. Conclusions
In this study, we have numerically investigated a non-catalytic exhaust after-treatment using an SiC fiber filter. In order to investigate the phenomenon occurring inside the actual filter, the inner structure was obtained by the X-ray CT technique. It is found that, even in exhaust gas without soot, a complex flow pattern is observed. The friction factor is slightly larger than the predicted value by the empirical equation of uniform porous media flow. This is because the porosity of the filter is not constant along the flow direction and the pressure gradient varies. As a consequence, the particles could be trapped more easily. Since the soot deposition occurs inside the filter, depth filtration by SiC fibers was confirmed. As the filter temperature becomes higher, the deposited soot is decreased. That is, more soot is oxidized, with less chances of the filter clogging. The soot oxidation is promoted when the oxygen concentration is higher. These two parameters are important to achieve a non-catalytic system.
Acknowledgments
This work was partially supported by the Japan Science and Technology Agency. (JST), A-step feasibility study program (Grant Number AS251Z00608K).
Conflicts of Interest
The authors declare no conflict of interest.
References
- Kittelson, D.B. Engines and nanoparticles: A review. J. Aerosol Sci. 1998, 29, 575–588. [Google Scholar] [CrossRef]
- Kennedy, I.M. The health effects of combustion-generated aerosols. Proc. Combust. Inst. 2007, 31, 2757–2770. [Google Scholar] [CrossRef]
- Regulation (EC) No. 595/2009 of the European Parliament and the Council. Off. J. Eur. Union 2009, 1–13.
- Johnson, T. Review of diesel emissions and control. SAE Int. J. Fuels Lubr. 2010, 3, 16–29. [Google Scholar] [CrossRef]
- Clerc, J.C. Catalytic diesel exhaust aftertreatment. Appl. Catal. B 1996, 10, 99–115. [Google Scholar] [CrossRef]
- Wirojsakunchai, E.; Schroeder, E.; Kolodziej, C.; Foster, D.; Schmidt, N.; Root, T.; Kawai, T.; Suga, T.; Nevius, T.; Kusaka, T. Detailed diesel exhaust particulate characterization and real-time DPF filtration efficiency measurements during PM filling process. SAE Tech. Pap. 2007, 1, 320. [Google Scholar] [CrossRef]
- Bensaid, S.; Marchisio, D.L.; Russo, N.; Fino, D. Experimental investigation of soot deposition in diesel particulate filters. Catal. Today 2009, 147S, S295–S300. [Google Scholar]
- Yamamoto, K.; Oohori, S.; Yamashita, H.; Daido, S. Simulation on soot deposition and combustion in diesel particulate filter. Proc. Combust. Inst. 2009, 32, 1965–1972. [Google Scholar] [CrossRef]
- Tsuneyoshi, K.; Takagi, O.; Yamamoto, K. Effects of washcoat on initial PM filtration efficiency and pressure drop in SiC DPF. SAE Tech. Pap. 2011, 1, 817. [Google Scholar] [CrossRef]
- Stein, H.J. Diesel oxidation catalysts for commercial vehicle engines: Strategies on their application for controlling particulate emissions. Appl. Catal. B: Environ. 1996, 10, 69–82. [Google Scholar] [CrossRef]
- Wang, S.; Haynes, B. Catalytic combustion of soot on metal oxides and their supported metal chlorides. Catal. Commun. 2003, 4, 591–596. [Google Scholar] [CrossRef]
- Tzamkiozis, T.; Ntziachristos, L.; Samaras, Z. Diesel passenger car PM emissions: From Euro 1 to Euro 4 with particle filter. Atmos. Environ. 2010, 44, 909–916. [Google Scholar] [CrossRef]
- Feng, Y.; Rao, P.M.; Kim, D.R.; Zheng, X. Methane oxidation over catalytic copper oxides nanowires. Proc. Combust. Inst. 2011, 33, 3169–3175. [Google Scholar] [CrossRef]
- Susu, A.A.; Ogogo, E.O.; Ngomo, H.M. The effect of sintering-redispersion on the selective aromatic yield on supported Platinum catalysts. Trans IChemE Part A 2006, 84, 664–676. [Google Scholar] [CrossRef]
- Kim, M.Y.; Choi, J.S.; Toops, T.J.; Jeong, E.S.; Han, S.W.; Schwartz, V.; Chen, J. Coating SiO2 support with TiO2 or ZrO2, and effects on structure and CO oxidation performance of Pt catalysts. Catalysts 2013, 3, 88–103. [Google Scholar] [CrossRef]
- Yamamoto, K.; Satake, S.; Yamashita, H.; Takada, N.; Misawa, M. Fluid simulation and X-ray CT images for soot deposition in a diesel filter. Eur. Phys. J. 2009, 171, 205–212. [Google Scholar]
- Yamamoto, K.; Fujikake, F.; Matsui, K. Non-catalytic after-treatment for diesel particulates using carbon-fiber filter and experimental validation. Proc. Combust. Inst. 2011, 34, 2865–2875. [Google Scholar] [CrossRef]
- Yamamoto, K.; Takada, N.; Misawa, M. Combustion simulation with lattice Boltzmann method in a three-dimensional porous structure. Proc. Combust. Inst. 2005, 30, 1509–1515. [Google Scholar] [CrossRef]
- Yamamoto, K.; Nakamura, M.; Yane, H.; Yamashita, H. Simulation on catalytic reaction in diesel particulate filter. Catal. Today 2010, 153, 118–124. [Google Scholar] [CrossRef]
- Yamamoto, K.; Yamauchi, K.; Takada, N.; Misawa, M.; Furutani, H.; Shinozaki, O. Lattice Boltzmann simulation on continuously regenerating diesel filter. Philos. Trans. R. Soc. A 2011, 369, 2584–2591. [Google Scholar] [CrossRef]
- Wehner, B.; Uhrner, U.; Lowis, S.; Zallinger, M.; Widensohler, A. Aerosol number size distributions within the exhaust plume of a diesel and a gasoline passenger car under on-road conditions and determination of emission factors. Atmos. Environ. 2009, 43, 1235–1245. [Google Scholar] [CrossRef]
- Misawa, M.; Tiseanu, I.; Hirashima, R.; Koizumi, K.; Ikeda, Y. Oblique view cone beam tomography for inspection of flat-shape objects. Key Eng. Mater. 2004, 270, 1135–1142. [Google Scholar]
- Barhate, R.S.; Sundarrajan, S.; Pliszka, D.; Ramakrishna, S. Fine chemical processing: The potential of nanofibres in filtration. Filtr. Sep. 2008, 45, 32–35. [Google Scholar]
- Yamamoto, K.; He, X.; Doolen, G.D. Simulation of combustion field with lattice Boltzmann method. J. Stat. Phys. 2002, 107, 367–383. [Google Scholar] [CrossRef]
- Qian, Y.H.; D’Humières, D.; Lallemand, P. Lattice BGK models for the Navier-Stokes equation. Europhys. Lett. 1992, 17, 479–484. [Google Scholar] [CrossRef]
- Filippova, O.; Hanel, D. A novel lattice-BGK approach for low Mach number combustion. J. Comput. Phys. 2000, 158, 139–160. [Google Scholar] [CrossRef]
- Chen, S.; Doolen, G.D. Lattice Boltzmann method for fluid flows. Ann. Rev. Fluid Mech. 1998, 30, 329–364. [Google Scholar] [CrossRef]
- Chopard, B.; Masselot, A.; Dupuis, A. A lattice gas model for erosion and particles transport in a fluid. Comput. Phys. Commun. 2000, 129, 167–176. [Google Scholar] [CrossRef]
- He, X.; Luo, L.-S. Lattice Boltzmann model for the incompressible Navier-Stokes equation. J. Stat. Phys. 1997, 88, 927–944. [Google Scholar] [CrossRef]
- Lee, K.B.; Thring, M.W.; Beer, J.M. On the rate of combustion of soot in a laminar soot flame. Combust. Flame 1962, 6, 137–145. [Google Scholar] [CrossRef]
- Bird, R.B.; Stewart, W.E.; Lightfoot, E.N. Transport Phenomena, 2nd ed.John Wiley and Sons: New York, NY, USA, 2002; pp. 177–196. [Google Scholar]
© 2014 by the authors; licensee MDPI, Basel, Switzerland. This article is an open access article distributed under the terms and conditions of the Creative Commons Attribution license (http://creativecommons.org/licenses/by/3.0/).