Abstract
Against the background of the intention to reduce the amount of wood used in the production of particleboard for economic reasons, the associated reduction in panel density and consequently the panel properties, the influence of the alternative use of flat-shaped face layer particles and core layer particles of intentionally greater thickness on the panel properties was investigated. Appropriate particles were made for this purpose, panels with typical (650 kg/m3) and reduced wood usage (500 kg/m3) were produced, and e.g., their bending properties and internal bond strength were determined. Particle size characterization was done with sieve analysis, image analysis (length and width measurement), and manual thickness gauging. It was found that the alternative use of the flat-shaped particle significantly increased the bending properties and thus the level of the reference can be achieved despite the reduced use of wood. The reason for the increased bending properties was assumed to be the higher strength of the particles themselves and the more effective adhesive bond between the particles. The increase in internal bond strength when using alternative particles could be attributed solely the different production history (e.g., use of fresh cutting blades and laboratory scale production).
1. Introduction
One of the current focal points of research in the European wood-based panel industry is the production of particleboards with a reduced use of wood. The short-term goal of wood saving is to simply increase cost efficiency while the long-term goal is to increase material efficiency. The desire for an increase in material efficiency is based on the expected growth of the world population and consumption with limited resources at the same time, and, consequently, a shortage of the raw material (in particular raw virgin particles) for the production of particleboard. In addition to the advantages of increased material efficiency for the particleboard manufacturer, the savings set free material for other uses. The side benefit of the reduction in the use of wood is the reduction in board weight (light-weight particleboard), which may offer economic advantages for furniture manufacturers and retailers of take-away furniture. However, there is currently [1] no sign of a consumer-driven pull effect for lightweight furniture, either now or in the near future. This means that changes in production must lead to a direct cost reduction and a possible additional expense can hardly be passed on.
Boards with a lower density are obtained without changing any process parameters other than the quantity of wood. However, a decrease in board density normally results in a deterioration of the mechanical board properties: Klauditz and Stegmann [2] and Plath [3] showed this relationship for bending strength, Keylwerth [4] for modulus of elasticity, and Liiri [5] for internal bond strength. Recent studies [6,7] confirm these interrelations. Sackey et al. [8] point out the issue of the low edge-screw withdrawal resistance of three-layer boards even without density reduction.
As each type of industrially produced board is already optimized to meet customer-specific requirements at minimal cost, typically, no further reduction of board properties is tolerable. If the quantity of wood used is to be reduced, measures have to be taken to maintain the relevant board properties at the required level. With reference to Benthien et al. [9], such measures can be classified as (a) the adjustment of particle geometry or material used (material adjustments) and (b) the adjustment of density distribution or particle orientation (structural adjustments). The result is function-optimized boards that on the one hand meet the property requirements and on the other hand are reduced in the amount of wood.
An indication of how the properties of density-reduced boards could be obtained by adjusting the particle geometry is given in an article by Wyss [10] on the patent history of particleboard. In it, Wyss describes the different approaches to board setup in the early stages (the years during and after the Second World War) of industrial particleboard production. Hereafter, a porous core layer of low-cost wood waste and face layers of specially manufactured particles characterizes the boards of one of the patent holders, Fred Fahrni. Klauditz [11] characterized these core layer particles as coarse-chunky (tearing chip), and these face layer particles as flat-thin (cutting chip) with a thickness of about 1 mm. Deppe [12] described the face layer particles used by Fahrni (“Type N”) in a scale drawing, and differentiated them from large-sized wafers, strands, and an intermediate form of wafers and strands. The boards resulting from Fahrni’s raw material composition showed a clearly pronounced density profile with face layers of high density (930 kg/m3) and corresponding load-bearing capacity and a core layer of lower density core layer (540 kg/m3) [13]. In contrast, the boards produced by the Behr–Homogenholz-Procedure (second main approach according to Wyss) also consisted of specially produced particles in the core layer, the shape of which resembled that of today’s particleboard particles. The boards produced according to this approach had a compact core layer, which contributed to the strength properties of the board. From the comparison of the two approaches, it is clear that a core layer of low quality can be compensated for with the help of load-bearing face layers of special geometry particles.
Investigations on the influence of the particle geometry (size and shape) on the properties of particle-based board products are often to be found. Many of these studies, however, do not consider particleboards in the narrower sense, but rather, for example, mineral-bonded particleboards, particleboards of agricultural materials, or flakeboards made of strands. In Kollmann (ed.) [14], Teichgräber lists the geometrics of the adhesive-applied wood particles as a factor influencing the properties of particleboard and proves this with works by Turner [15], Kitahara and Kasagi [16], Post [17], and Brumbaugh [18]. Dunky and Niemz [19] compiled the results of various studies on the relationship between particle geometry and board properties in tabular form. Table 1 is a compilation of extracts from this. The results of the works listed by Teichgräber (Turner [15], Kitahara and Kasagi [16]), which are not included in the tables of Dunky and Niemz, can be summarized as follows: Maximum bending strength at a chip thickness of 0.46 mm (0.018 inches), increase in bending strength for boards with 4% adhesive content as particle length increases (Turner), and decrease in bending strength with simultaneous increase in particle length, width, and thickness (Kitahara and Kasagi).

Table 1.
Influence of increasing particle dimension (length or thickness) on the properties of single-layer laboratory particleboard (based on Dunky and Niemz [19]); modulus of rupture (MOR) (bending strength), (bending) modulus of elasticity (MOE), internal bond strength (IB), and thickness swelling (TS).
Studies carried out since then investigated the effect of face and core layer particle size (as a result of applying sieves of different mesh dimensions) on three-layered test boards [24] or the effect of increasing core layer particle thickness in particular, with the focus on lightweight particleboards [9]. The results from Istek et al. [24], indicate an increase of bending strength, modulus of elasticity, and thickness swelling with increasing face layer particle size even though no statistical information is provided. In addition, in the case of the core layer particles not only the mesh width but also the mesh geometry is changed so that no statement can be made about the change in particle size. Benthien et al. [9] found that an increasing core layer particle thickness has a positive effect on internal bond strength (increase) and thickness swelling (decrease). Contrary to what could be assumed on the basis of a previous study of Benthien et al. [25], namely that large wood particles (sieve fraction: > 5 mm) have a higher compression resistance than smaller ones (sieve fraction: 1.25–3.15 mm) and, thus, support the formation of highly compacted load-bearing face layers, no increase in the bending properties was found when using thick particles as a core layer material.
The present study aims to investigate the potential of flat-shaped particles (“Fahrni-Wafer”) in the face layers and, in addition, particles of intentionally greater thickness in the core layer to maintain the bending properties of typical density boards (650 kg/m3) but with reduced wood usage for board manufacture (500 kg/m3). This was done against the background of using a lower amount of wood for particleboard production and applying particles with an adapted geometry. An important part of the present study was the characterization of particle size and board structure (density profile) in order to be able to explain the effects of varied influencing variables on the board properties with the support of numerical parameters.
2. Materials and Methods
2.1. Material
2.1.1. Flat-Shaped Face Layer Particle (Wafer)
By applying a disc-slicer-machine with a vertical knife disc, at the Wood Research Munich laboratory (Technical University of Munich, Munich, Germany), the flat-shaped face layer particle was made by chipping un-dried (green/forest-fresh) pinewood (Pinus sylvestris) board sections, which have been stored in water for several weeks before processing. The cutting of the board sections was done from shuttering boards provided by Ilim Nordic Timber GmbH & Co. KG, Wismar, Germany. The board sections of 200 mm in length, 92 mm in width, and 21 mm in thickness were fed to the flaker’s knife disc that quadratic strand-like wafers (target dimensions of 20 mm in length, 20 mm in width, and 0.5 mm in thickness) were cut from the longitudinal edge. The wafers were manually dried in a wood-drying kiln (fresh air/exhaust air) and sieve screened into “fines” and “good fraction” (mesh size 8 mm). A visual impression of the wafer material can be gained in Figure 1; the results of the chip measurement are given in Section 3.1.2 and Section 3.1.3. Based on wafer, W is used in the following as an abbreviation for the flat-shaped face layer particle.
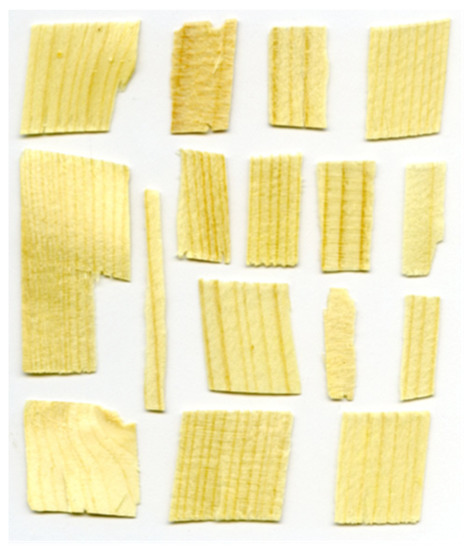
Figure 1.
Exemplary shown wafers.
2.1.2. Lab-Made Core Layer Particle of Intentionally Greater Thickness
The core layer particle of intentionally greater thickness (with T as abbreviation) was prepared from industrial wood chips obtained from Swiss Krono sp z o.o. (Zary, Poland), mainly made of softwood (Pinus sylvestris), by applying an industrial-scale knife ring flaker at the Pallmann Research and Technology Center (PRTC) (Pallmann Maschinenfabrik GmbH & Co. KG, Zweibrücken, Germany). A significantly larger cutting edge projection was set (1.2 mm) for chipping than is usually selected (0.8 mm) for particle production. After manufacture, the core layer particles of intentionally greater thickness were manually dried in a wood-drying kiln (fresh air/exhaust air) with a target moisture content of below 20% and further sieve fractionated into the ‘good fraction’ (1.5–8 mm), and the rejected ‘fines’ (<1.5 mm) and ‘oversize’ (>8 mm) fractions.
2.1.3. Plant-Made Face and Core Layer Particles of Typical Thickness
Already chipped, dried, and sieved, face and core layer particles for reference board manufacture (or reference layer formation) were obtained from the above-mentioned particleboard plant. For the plant-made face layer particle, FL is used as abbreviation; for the plant-made core layer particle of typical thickness, CL is used.
2.1.4. Adhesive, Paraffin, and Hardener
Liquid urea-formaldehyde (UF) adhesive and paraffin emulsion were obtained from the aforementioned industrial partner Swiss Krono. Ammonium nitrate (NH4NO3) solution with 40% solid content was used as hardener. The solid content of the UF-adhesive was 67% while that of the paraffin emulsion was 50%.
2.2. Board Manufacturing
Three-layer boards of reduced (target board density 500 kg/m3) and typical wood usage (target board density 650 kg/m3) were produced on a computer-controlled laboratory hot press without using spacer bars. The target board thickness was 16 mm. The adhesive was applied to the particles in a rotary drum blender of 400 mm in length and 310 mm in diameter (1000 mm in length and 630 mm in diameter in the case of adhesive application to the wafers), equipped with an air-atomizing spray system. Before application, 1% hardener, 1% urea (both based on the adhesive solid content), and 0.5% paraffin emulsion (based on the dry wood mass) were added in the case of the face layer material. In the case of the core layer material only the hardener (3%) was added. The amount of additional water was calculated with regard to particle moisture content and added to the aqueous adhesive solution. A target moisture content of 11% in the face layers and 8% in the core layer were calculated. The adhesive content was 11% (based on dry wood mass) in the face layers and 8% in the core layer. With regard to wood use (target board density), the relation of face-to-core layer was 35/65 (target density 650 kg/m3) or 46/54 (target density 500 kg/m3). This means that each of the face layers consists of 17.5% or 23% of the total particle mass, respectively. The change in face-to-core layer ratio was due to the reduction of the amount of glued particles in the core layer only. Where the face layers were composed of two particle types, their relation to each other was 1:1. According to wood use (target board density) and, thus, relation of face-to-core layer ratio, the particles were weighed and formed into mats on an aluminum caul plate using a 695 mm times 595 mm forming box. After removing the forming box, a second such plate was laid on the top of the mat while both were covered with siliconized paper to prevent adherence between board and caul plates.
At a press plate temperature of 200 °C, the mats were compressed with a pressing time factor of 8 s per mm (effective press time: 128 s). Closing time of the press was 6 s. Within the first 20 s after press closure, a specific pressure of 4 N/mm2 was applied in order to try to achieve a thickness of 15.5 mm. During the following 100 s, the maximum specific pressure was reduced from 1.5 to 1 N/mm2 while the thickness was increased to nominal board thickness (16 mm). Plate positions were kept constant for 8 s while the specific pressure was decreased further stepwise (0.5 N/mm2 per step). After hot-pressing the boards were cooled down at ambient conditions and then stored in a climatic chamber at 20 °C and 65% RH before test specimen cutting.
2.3. Experimental Setup
A total of 21 experimental particleboards with three boards for each of the seven board types (board type (BT)) were made. As influencing parameters on the board properties, face and core layer particle type, and wood use (target board density) were varied. The experimental setup is illustrated in Table 2.
Table 2.
Definition of board types in respect to wood usage and, thus, target density, and particle type in face and core layer. Including; plant-made face layer particle (FL), plant-made core layer particle of typical thickness (CL), wafer (W), and lab-made core layer particle of intentionally greater thickness (T).
The effect of the alternative use of flat-shaped face layer particles instead of the typical particle as face layer material was to be investigated comparing BT 2 (W-CL) with BT 1 (FL-CL), BT 4 (W-T) with BT 3 (FL-T) in the case of low wood usage boards, and BT 7 (W-CL) with BT 6 (FL-CL) in the case of typical wood usage boards. The effect of a partial replacement of the typical face layer particle by wafers was to be investigated comparing BT 5 (FL-W-CL) with BT 1 (FL-CL) and BT 2 (W-CL).
The effect of the alternative use of the core layer particle of intentionally greater thickness instead of the typical particle as core layer material was to be investigated comparing BT 3 (FL-T) with BT 1 (FL-CL), and BT 4 (W-T) with BT 2 (W-CL).
To investigate the potential of flat-shaped particles in the face layer and the particle of intentionally greater thickness in the core layer in order to maintain the properties of low wood usage boards on the level of those of typical wood usage, the board types 2–5 (all low wood usage boards, target density of 500 kg/m3) were compared each with BT 6 (reference board of typical particles (FL and CL) and typical wood usage (target density of 650 kg/m3)).
The differences between low and typical wood usage boards were to be investigated for boards composed of the typical particle materials in face and core layer comparing BT 1 and BT 6, and for boards with flat-shaped particles as face layer material by comparison of BT 2 and BT 7. Table 3 gives an overview of the comparisons made.
Table 3.
Overview of the comparisons made to determine the effect of particle variation.
2.4. Particle Size Characterization
2.4.1. Sieve Analysis
The sieve analysis (DIN 66165-1:2016-8, DIN 66165-2:2016-08) was carried out with a horizontal sieve machine (AS 400 Control) from Retsch GmbH (Haan, Germany). Sieving time was 5 min with a rotation speed of 240 rpm and a mass of each sample (threefold repetition) of 40 g in the case of face layer particle and 46 g in case of core layer particles. The mesh size of the sieves used (200 mm in diameter) were selected as follows: 0.2, 0.315, 0.5, 0.63, 0.8, 1, 2, and 3.15 mm (face layer particle) and 0.8, 1, 1.6, 2, 3.15, 4, 5, 8, 11.2, and 16 mm (core layer particles).
Graphical representation of the data was performed in accordance with DIN ISO 9276-1:2004-09, using a histogram of the mass distribution density q3(x) and mass-based cumulative distribution (Q3[x]). For the histogram plot, each mass of particles remaining on a sieve (sieve residue) was related to the total mass (outcome: Relative share). Then, each relative mass of sieve residue was divided by its size class width. The size class width was the difference between the mesh width of the upper sieve and the mesh width of the sieve containing the residue. The data basis for the cumulative distribution plot was obtained, converting the relative residues into percentages and successively summing these, starting from the smallest particle size.
The mean particle size was calculated as the sum of the product of the relative share and mean particle size of each size class. The quantile values (D10, D50 (median), and D90) were calculated by adding together the class widths (or part of them) from the smallest particle size to obtain 10% (D10), 50% (D50), or 90% (D90) of the total sieve residues. If only a part of the width of a size class was relevant, it was linearly interpolated between the mesh width of the sieve containing the residue and the mesh width of the upper sieve. As each particle type was sieve analyzed three times, the standard deviation can be used to indicate the amount of variation in the measured values. On this basis, any differences in the size (distribution) of the particle types were statistically investigated.
2.4.2. Image Analysis-Based Length and Width Measurement
The image-analytical length and width measurement (ISO 13322-1:2014-05, ISO 13322-2:2006-11) was realized with two different types of particle separation, but with identical techniques of image acquisition and image analysis. While the typical face layer particle was separated by means of compressed air, the core layer particles and the wafers were spread manually onto a glass sheet. For image acquisition, a transmitted light scanner (Epson Perfection V750 Pro, Epson America Inc., Long Beach, CA, USA) was applied. The resolution of the scanned images (16-bit grey scale) were 300 dpi with an image size of 254 mm times 203.2 mm, which results in a pixel edge length of 84.7 µm. The typical face layer particles were measured three times with 0.5 g of air-conditioned (20 °C/65% RH) material for each measuring cycle. The core layer particles were also measured three times each, scattering 2 g of air-conditioned (20 °C/65% RH) material for each scan. The measurement of the wafers was carried out on 15 g adhesive-applied and air-conditioned (20 °C/65% RH) material (number of particles = 437), split on five scans. A total of at least 433 wafers were included in the evaluation.
For image processing, the software FibreBench (Hamburg University, Department of Informatics, Scene analysis and visualization, Hamburg, Germany, Version 1.7, Revision 1901) [26] was used. The algorithm of flowline tracing [27] was switched off, so that the particle dimensions were only determined by the image moment method (rectangular model). In addition to length and width measurement, the number of pixels assigned by the algorithm as particle can be counted and the projection area derived from it.
Graphical representation of the length and width measurement data was conducted in accordance with DIN ISO 9276-1, yielding a histogram of both the length and width distribution density q1(x), as well as the length- and width-based cumulative distribution (Q1[x]). In contrast to the number distribution, where the frequency of the measured characteristic (e.g., length or width) is plotted over the length or width classes, in the case of the dimension distribution the sum of the measured characteristic (e.g., length or width) of each length or width class is plotted over the length or width classes. The procedure for data processing (i.e., setting the proportion of each size class in relation to the sum of the measured characteristic, dividing this value by the size class width, further preparing the plot, and producing the plot itself) is similar to the graphical representation of the sieve analysis results.
The width of the first length class was set to 0.5 mm. With increasing particle length, the width of the length classes was logarithmically increased. Therefore, the upper bin limits were 0.5, 0.7, 0.98, 1.37, 1.92, 2.69, 3.76, 5.27, 7.38, 10.33, 14.46, 20.25, 28.35, 39.69, and 55.56 mm. The upper limits of the width classes were 0.5, 0.7, 0.98, 1.37, 1.92, 2.69, 3.76, 5.27, and 7.38 mm. As only particles longer than 1 mm were evaluated, the first bin of the length distributions containing data was 0.98–1.37 mm. The mean particle length was calculated by dividing the sum of all particle lengths by their count. Then, the 10% quantile (D10 or x10), 50% quantile (D50 or x50), and 90% quantile (D90 or x90) of the length-based cumulative distribution were calculated. D50 represents the median of the length-sorted raw data set. The same specific values were calculated for the width measurement. As further characteristic values, the number of particles found per particle sample (sum of the replicate measurements) and the length (width) of the longest (widest) particle of each particle type (mean of the three replicate measurements) were given.
As each particle type was measured three times, the standard deviation can be used to indicate the amount of variation in the measured values. On this basis, any differences in the length and width of the particle types were statistically investigated.
2.4.3. Manual Thickness Gauging
The core layer particle thickness was measured manually with a caliper on 45 particles from each particle type. The particles were taken from the image analysis samples, with 15 particles for each measurement. The selection of the particles was made on the basis of their manageability, but at the expense of representativeness.
The wafer thickness was measured manually applying dial gauge with a round contact point at the end of the spindle. Due to the limited handling of the wafer at the manual thickness measurement, only 388 of the image analytically analyzed wafers were measured.
2.5. Specimen Preparation and Testing Procedure
Prior to cutting test specimens, boards were trimmed to a size of 500 mm times 400 mm. With respect to the number of replicates for each board type (n = 3), the number of test specimens for each board type was as follows:
- 12 (4 × 3) for measuring bending strength (modulus of rupture (MOR)) and bending modulus (modulus of elasticity (MOE)) according to DIN EN 310:1993-08,
- 24 (8 × 3) for measuring internal bond strength (IB) according to DIN EN 319:1993-08,
- 15 (5 × 3) for measuring the swelling in thickness after immersion in water (thickness swelling = TS) according to DIN EN 317:1993-08, and
- 9 (3 × 3) for measuring the density profile.
The swelling in thickness was determined after 2 h and 24 h of immersion in water (TS 2 h and TS 24 h, respectively). Simultaneous to the swelling in thickness, the increase of mass after immersion in water was determined. The mass of absorbed water is expressed as a percentage of the initial test specimen weight and designated as water absorption (WA). The gravimetric specimen density was determined according to EN 323:1993-08. Prior to testing, test specimens were conditioned at 20 °C and 65% RH until a constant mass was reached.
Density profiles were measured on the basis of the radiometric principle applying the measuring instrument Dax 6000 (Fagus-GreCon Greten GmbH & Co. KG, Alfeld, Germany). The chosen measuring speed was 0.25 mm/s. Beginning from the boards’ bottom side (from pressing), the test specimens were scanned stepwise (step size 0.02 mm) and the density for each scan spot determined. The obtained data sets (scan spot position and density) were transferred to a consistent board thickness of 16 mm and the mean density profile for each board type was calculated and plotted. On the basis of the transferred data set, the maximum density of each upper and lower side face layer, the minimum density (in the core layer), and the mean (radiometric) test specimen density were calculated. After checking statistically for equality of the upper and lower surface layer density, the mean face layer density was calculated. Following the principals of quantitative density profile evaluation of Jensen and Kehr [28], the ratio of the mean face layer density to core layer density (density gradient) was calculated.
To investigate whether the target thickness was achieved on the one hand and the target density on the other hand, the test specimens for the determination of bending properties (n = 12), internal bond strength (n = 24), and swelling in thickness (n = 15) of one board type were used (in sum n = 51). The same database was used to examine for differences in thickness and density between the plate types.
2.6. Statistical Analysis
The majority of statistical analyses were conducted by applying the analysis tool JMP from SAS Institute (Cary, NC, USA). For data preparation, common statistical characteristics calculation (e.g., mean value, standard deviation, coefficient of variance, and quantiles), and many graphics creation, Microsoft Excel (Microsoft Corporation, Redmond, DC, USA) was applied. Furthermore, Microsoft Excel was used to identify extreme outliers. Histogram and density profile plotting was done with Matlab (MathWorks, Inc., Natick, MA, USA).
Each dataset was checked for extreme outliers by applying the interquartile range (IQR) method; with IQR is the difference between the third quartile (Q3 or 75%-quantile) and the first quartile (Q1 or 25%-quantile). As the lower criterion for the definition as an extreme outlier the first quartile minus the triple IQR (Q1 − 3 IQR); as the upper criterion the third quartile plus the triple IQR (Q3 + 3 IQR) was defined. In case of a detected extreme outlier, all data available for this test specimen were excluded from the evaluation.
For the selection of suitable test methods for further statistical data analysis (testing for differences in mean values, comparison of a mean value against a target value), the adjusted data of each set of test specimens (sample) were examined for normal distribution using the Shapiro–Wilk-Test at a significance level of α = 0.01. Data from normally distributed samples to be compared were further examined for homogeneity of variance applying the Levene-Test at a significance level of α = 0.05.
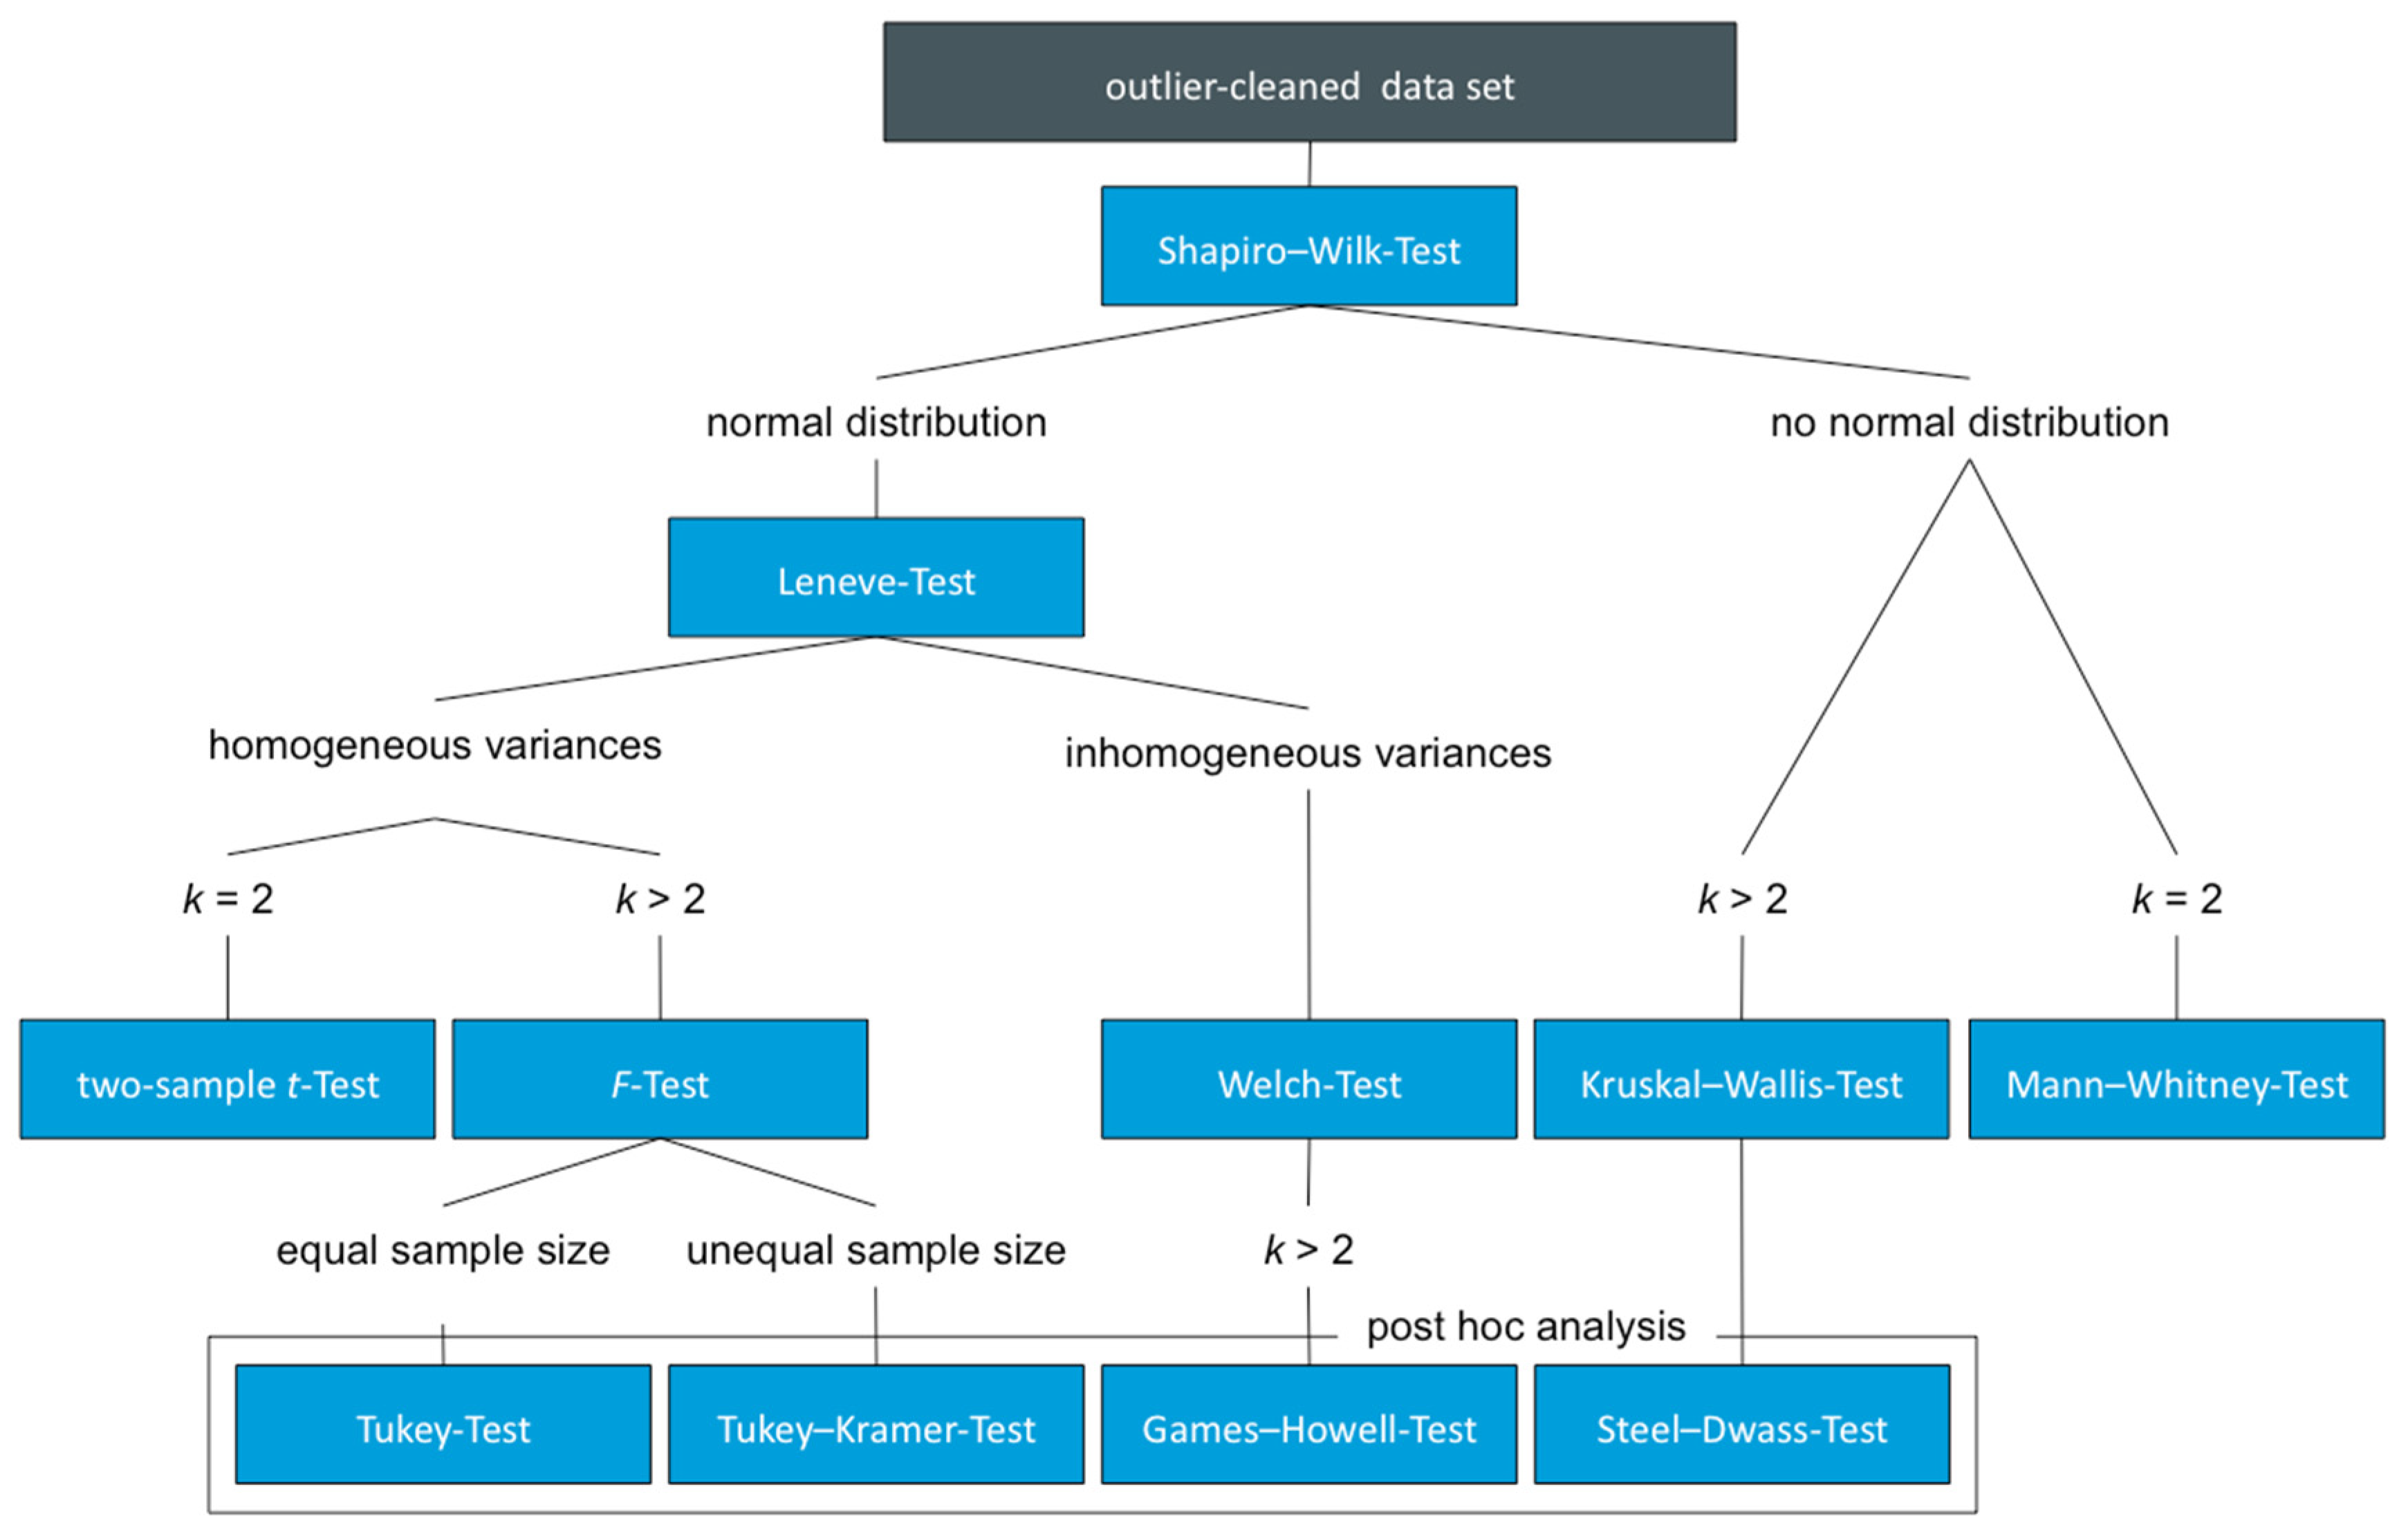
Normally distributed samples for which homogeneity of variance exists were tested for any statistically significant differences using the two-sample t-Test (k = 2) or the F-Test (k > 2) at a significance level of α = 0.05. Normally distributed samples for which there is no homogeneity of variance were investigated using the Welch-Test at the same significance level. If normal distribution was not available for all samples, the Mann–Whitney-Test (k = 2) or the Kuskal–Wallis-Test (k > 2) was applied at the significance level mentioned above. In the case of a sample number greater than two, a post hoc analysis was carried out at a significance level of α = 0.05 to determine which samples differed from each other. The Tukey-Test or Tukey–Kramer-Test was used following the F-Test for balanced and unbalanced samples, respectively. The Games–Howell-Test was applied subsequent to the Welch-Test (normally distributed samples, no homogeneity of variance). In case of non-normally distributed samples, the Steel–Dwass-Test was used following the Kuskal–Wallis-Test. The results of the post hoc analysis were given in the form of homogeneous groups (HG) indicating statistical distinctiveness by different letters. The procedure of test selection is illustrated in Figure 2.

Figure 2.
Illustrating of the process of selecting the appropriate test method for statistical data analysis.
Normal distributed samples were tested for equality with a target value using the one-sample t-Test and non-normal distributed samples were tested using the Wilcoxon-Test, both at a significance level of α = 0.05. The relative difference of a measured quantity to a target was calculated in accordance with Equation (1):
Relative difference to target = ((Measured value − Target value)/Target value) × 100%,
2.7. Shift of Data to Targeted Board Density
With the intention of comparing the properties of the different board types independent of the actually achieved density that naturally deviates to a certain extent from the intended one, the data were shifted, each, to the targeted density of 500 kg/m3 or 650 kg/m3, respectively. The data shift was performed based on the slope of the linear regression line through the data points of the property and density previously calculated, following Equation (2):
Shifted property = ((Target density − Achieved density) × Slope) + Property,
3. Results
3.1. Particle Size Characterization
3.1.1. Sieve Analysis
The data sets were free of extreme outliers (IQR-Method) and normally distributed (Shapiro–Wilk-Test). The Levene-Test showed the presence of variance homogeneity across the (plant-made) core layer particle of typical thickness and the (lab-made) core layer particle of intentionally greater thickness (T) for each of the characteristic values. Consequently, the two-sample t-Test was used to check whether there are significant differences between them.
The results of sieve-analyzing the (plant-made) face and core layer particles and the (lab-made) core layer particle of intentionally greater thickness are graphically prepared in Figure 3. Table 4 shows the characteristic values and their fluctuation range as well as the results of the statistical mean value comparison for the two core layer particles.
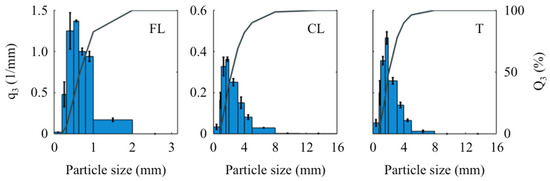
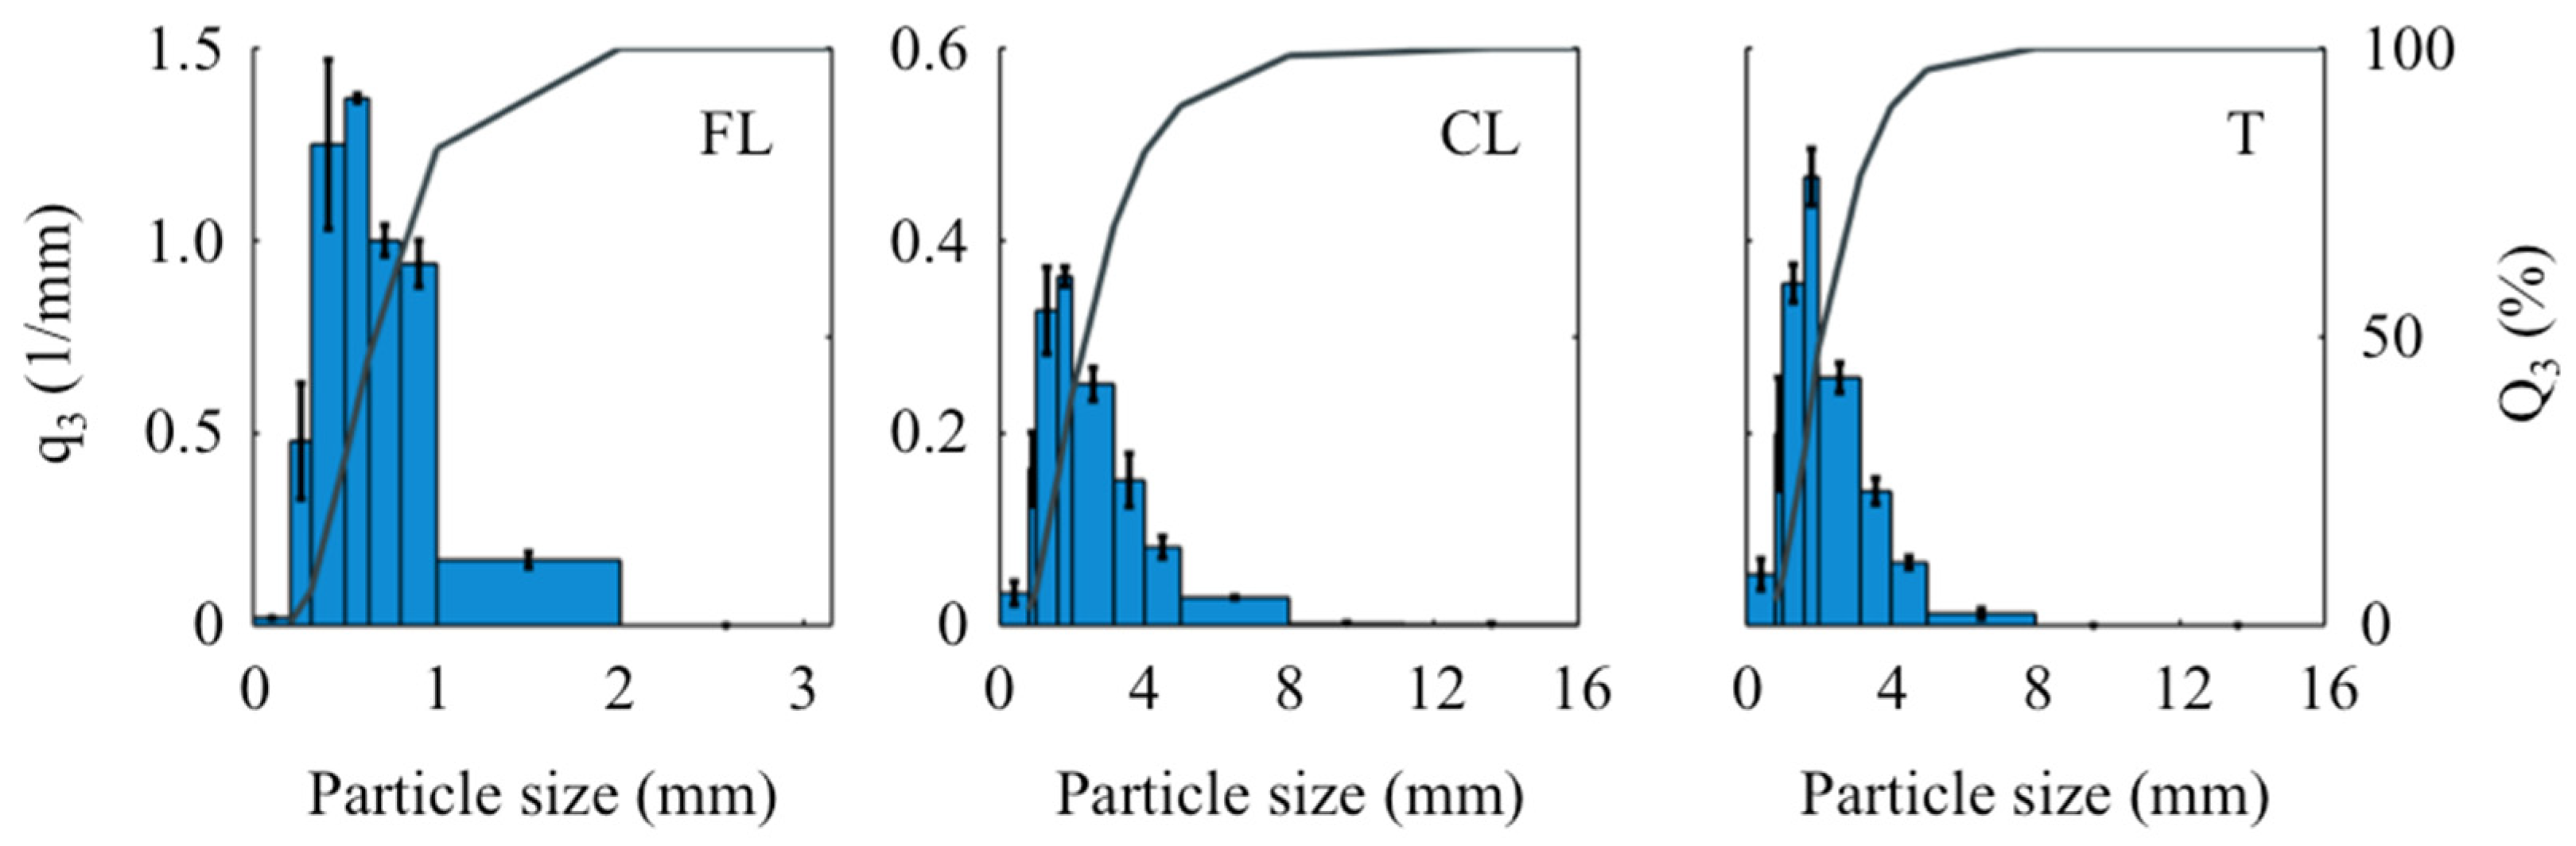
Figure 3.
Histogram (blue columns) of the density distribution (primary x-axis) and line chart of the cumulative distribution (secondary x-axis) of the particle size distribution of the different particle types (FL, CL, and T, where CL and T have the same axis scales) obtained by sieve analysis.
Table 4.
Characteristic values of the particle size distribution after sieve analysis and their coefficient of variance (in brackets) over the repeat measurements with results (homogeneous groups, indicated by letters) of statistical mean value comparison for the core layer particles CL and T. (MV = mean value, D10 = 10% quantile, D50 = 50% quantile, and D90 = 90% quantile).
Based on the statistical comparison of the characteristic values, it can be concluded that the particle size of CL exceeds that of T in the case of two characteristic values (mean value (MV) and D90). In the case of D10 and D50 the particle size of CL exceeds that of T, only nominally, but is not statistically significant. This can be visualized by comparing the height of the histogram bars of certain particle size ranges. The histogram bar of the size class 1.6 to 2 mm of CL is lower than that of T, while the histogram bar of the size class 5 to 8 mm of T is lower than that of CL. In sum, this means that the particle size of the plant-made core layer particle of typical thickness exceeds that of the lab-made core layer particle of intentionally greater thickness.
The different scaling of the abscissa axis shows the differences in particle size between face layer particle (mean particle size 0.8 mm) and core layer particles (mean particle size 2.4 (T) and 2.8 mm (CL)).
3.1.2. Image Analysis-Based Length and Width Measurement
Measuring of FL, CL and T
The data sets were free of extreme outliers (IQR-Method) and normally distributed (Shapiro–Wilk-Test). Apart from the maximum particle width, the Leneve-Test showed the presence of variance homogeneity across board types for each of the other characteristic values. Consequently, both the two-sample t-Test and the Welch-Test were used to check whether there are significant differences in the characteristic values between the board types.
The image analysis results of the (plant-made) face layer particle, the plant-made core layer particle of typical thickness, and the lab-made core layer particle of intentionally greater thickness are graphically prepared in Figure 4. Table 5 shows the characteristic values for particle length and width, as well as the results of the statistical mean value comparison of the two core layer particles.

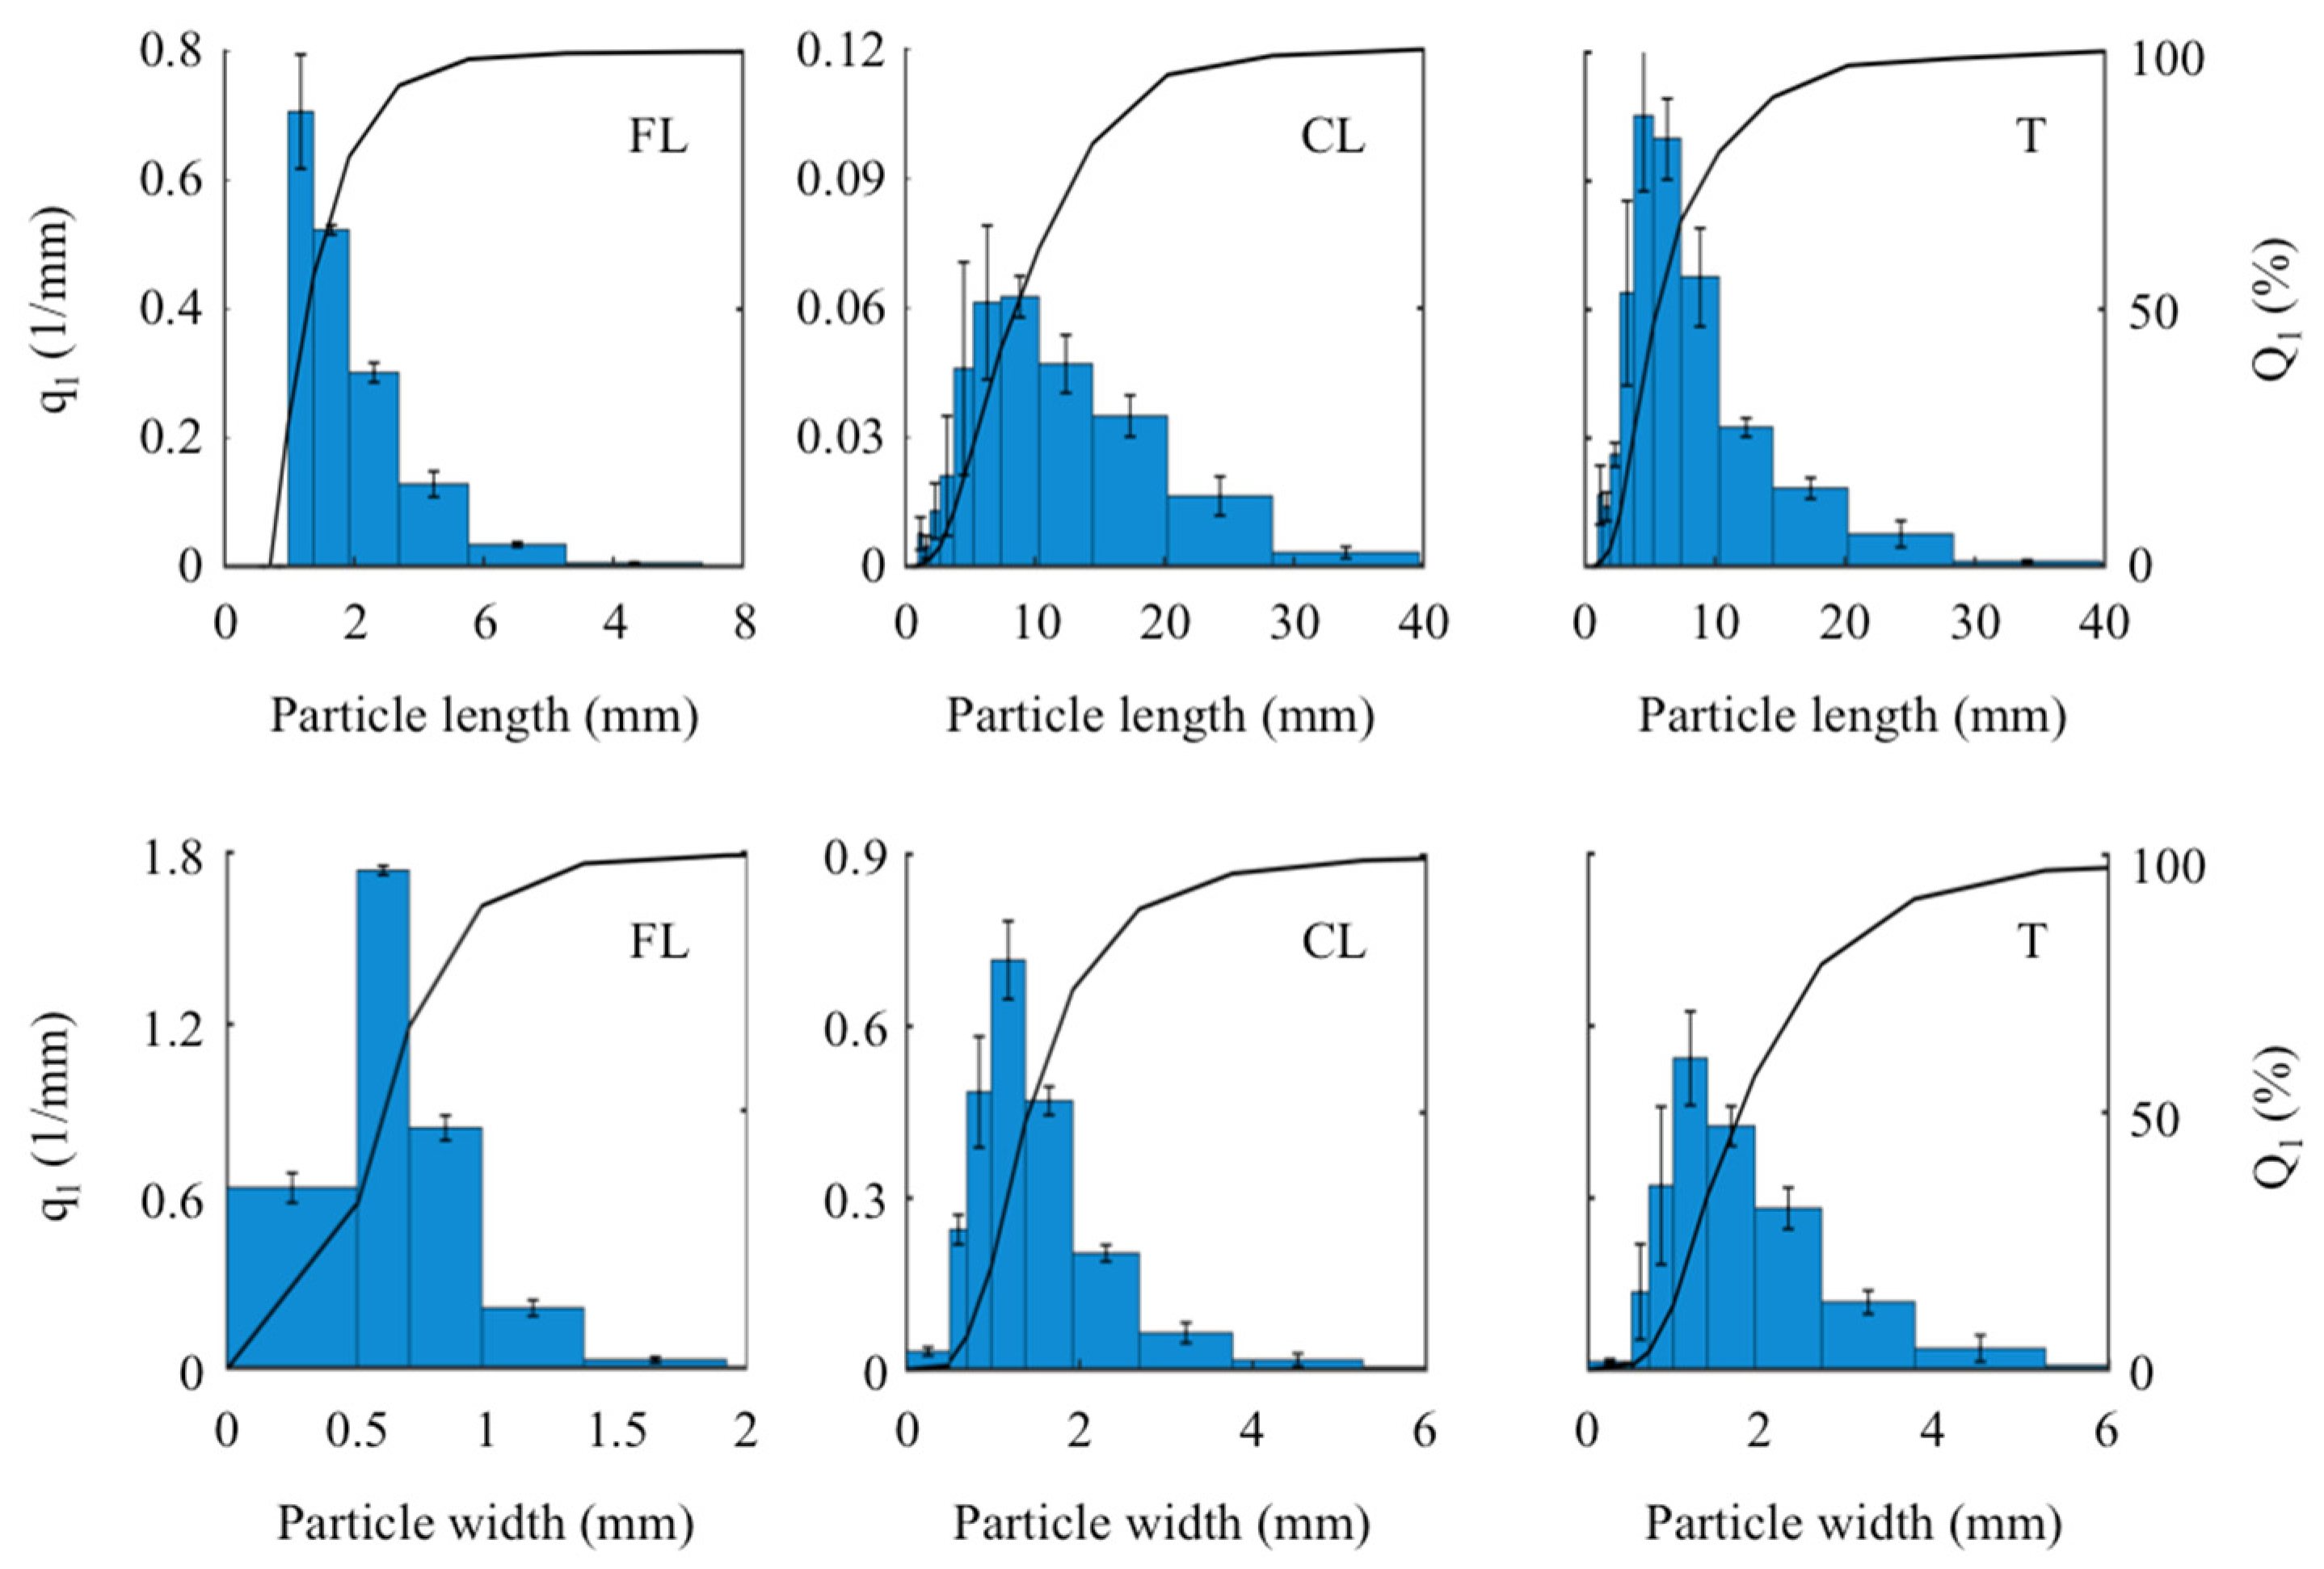
Figure 4.
Histogram (blue columns) of the density distribution (primary x-axis) and line chart of the cumulative distribution (secondary x-axis) of the particle length and width distribution of the different particle types (FL, CL, and T, where CL and T have the same axis scales) obtained by image analysis.
Table 5.
Characteristic values of the particle length and width distribution after image analysis and their coefficient of variance (in brackets) over the repeat measurements with results (homogeneous groups, indicated by letters, upper case for length and lower case for width) of statistical mean value comparison for the core layer particles CL and T. (D10 = 10% quantile, D50 = 50% quantile, D90 = 90% quantile, and Max = maximum).
The characteristic values mainly show that the length of the reference particle (CL) is significantly higher than that of the core layer particle of intentionally greater thickness. In the case of the width measurement, no differences were to be observed between the plant-made (CL) and the lab-made (T) core layer particle. The results from image analysis show that the two core layer particles differ mainly in length where even the reference core layer particle is larger than that of intentionally greater thickness.
This can be visualized by comparing the height of the histogram bars of certain particle size ranges. The histogram bars of the length size classes smaller than 7.38 mm of CL are smaller than that of T, while the histogram bars of the length size classes larger than 10.33 mm of CL are larger than that of T. The histogram bars of the width size classes smaller than 1.37 mm of CL are larger than that of T, while the histogram bars of the width size classes larger than 1.92 mm of CL are smaller than that of T.
The different scaling of the abscissa axis shows the differences in particle length and width between the face layer particle (mean particle length 1.7 mm, and width 0.6 mm) and the core layer particles (mean particle length 6.6 (T) and 9.5 mm (CL), and width 1.7 mm (T) and 2.0 mm (CL)).
Measuring of W
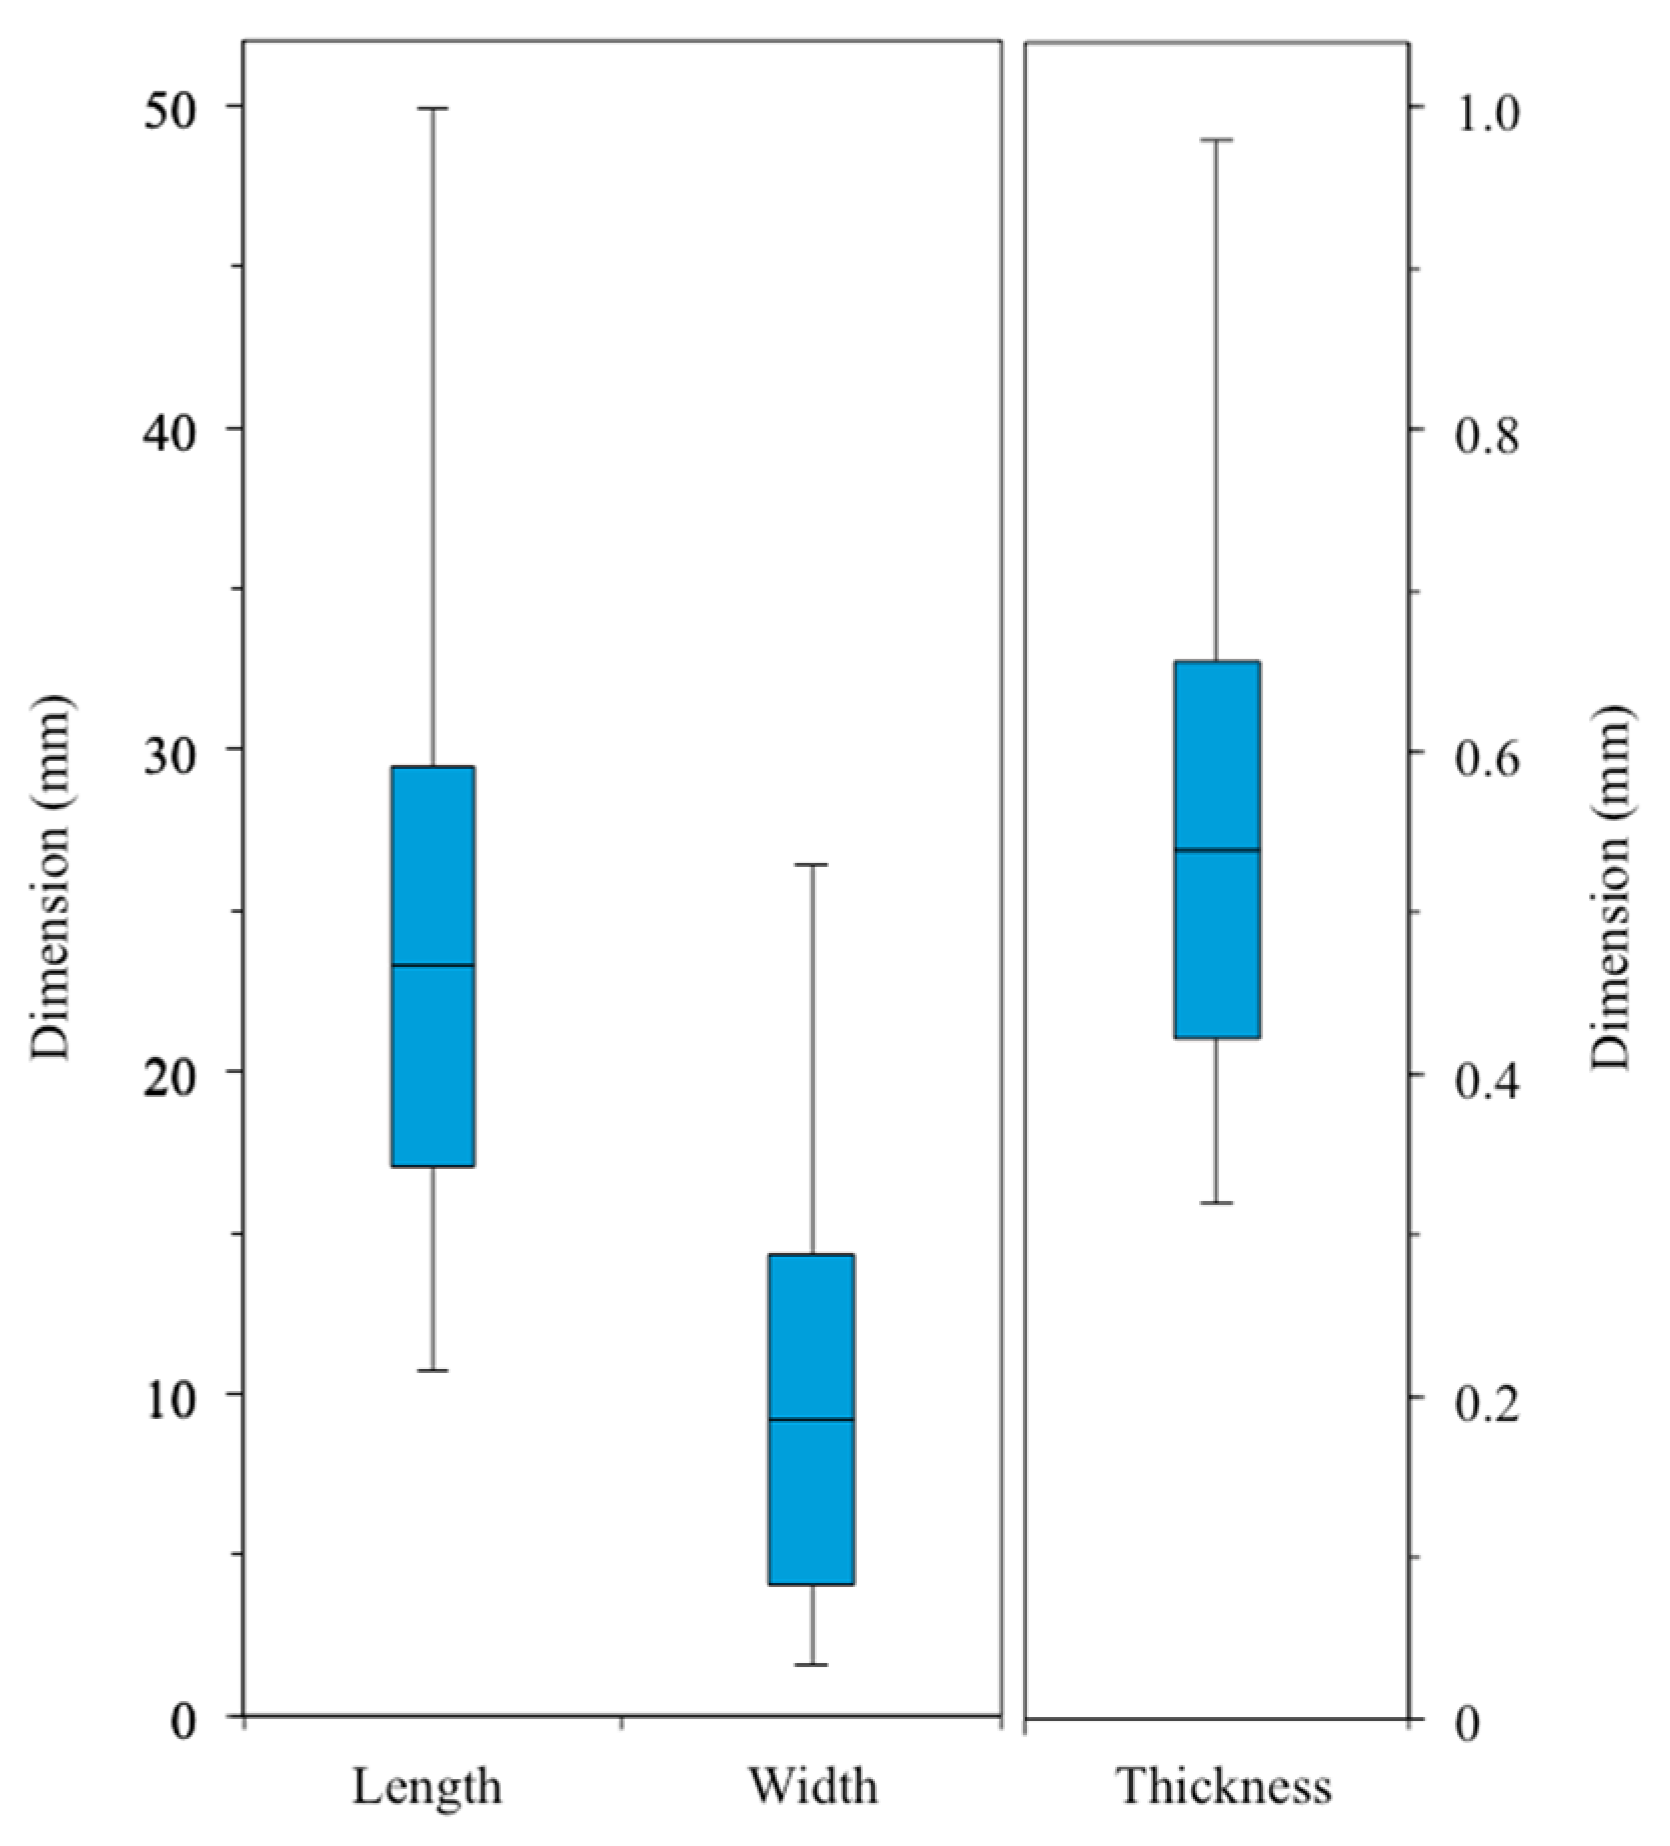
Mean wafer length was determined to a value of 23.3 mm with a coefficient of variance (CV) of 27%; the mean width was 9.2 mm with a CV of 56%. The variance of wafer dimensions is illustrated in Figure 5 by means of box-whisker-plots with standard deviation (±6.2 mm (length), ±5.1 mm (width)) as box and minimal and maximal values (10.7 and 49.9 mm (length), 1.6 and 26.4 mm (width)) as whiskers. The deviation of the mean wafer length from the target of 20 mm and the fluctuation range of the measured values can be explained by the partially improper adjustment of the scoring blades. The width of the wafers fell below the target value of 20 mm due to unintentional but unavoidable resizing in the course of drying and screening. The breaking of the wafers parallel to the fiber is related to the particle width and especially the particle thickness.
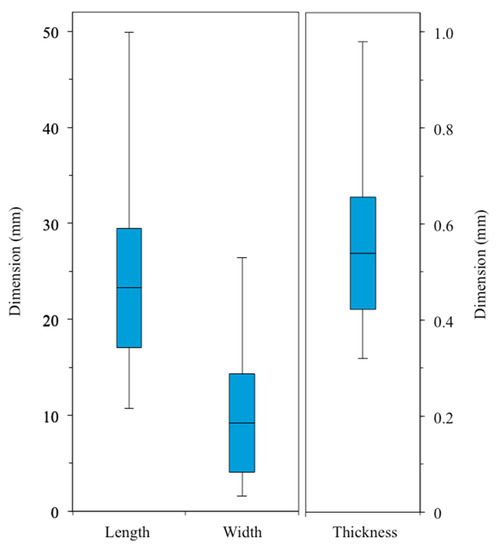
Figure 5.
Size distributions in length, width, and thickness of wafers in form of box-whisker-plots, where the mean as horizontal line, the standard deviation as a box, and minimum and maximum values as whiskers (length and width measurement n = 433; thickness measurement n = 388).
3.1.3. Manual Thickness Gauging
A value of 1.5 mm (SD: ± 0.5 mm, CV: 36%) in the case of the (plant-made) core layer particle of typical thickness and 1.4 mm (SD: ± 0.4 mm, CV: 30%) in the case of the (lab-made) core layer particle of intentionally greater thickness was calculated as the average thickness of 45 particles each. This means that the thickness of CL nominally exceeds that of T, but practically does not differ from it. Consequently, in the later investigation of the influence of core layer particle variation on the board properties, not the effect of thickness is examined, but rather the effect of a varied particle production procedure. In contrast to industrial particle production, it can be assumed that fresh cutting blades, a careful drying, and a more thorough screening were applied.
The thickness of the flat-shaped face layer particles (W) was calculated to a value of 0.5 mm (SD: ± 0.1 mm, CV: 22%) as an average of 388 particles. The variance in wafer thickness is shown in Figure 5 using a box-whisker-plot with the standard deviation as a box and the minimum and maximum value (0.3 and 1.0 mm) as whiskers. The wafer thickness probably varies due to variation of the contact pressure of the board sections against the knife disc.
3.2. Board Properties
3.2.1. Test Specimen Thickness and Density
The data sets were free of extreme outliers (IQR-Method). Missing normal distribution was found for BT 3 (for thickness and density both) and BT 7 (only for thickness) (Shapiro–Wilk-Test). Consequently, both the one-sample t-Test and the Wilcoxon-Test were used to check whether target thickness and density were achieved for each board type; the Kruskal–Wallis-Test was used to check whether there are significant differences in thickness and density between the board types. For the post hoc analysis the Steel–Dwass-Test was to be used.
The results of determining the test specimen thickness and density, checking for achievement of target thickness and density, and testing for significant differences in thickness and density between the board types are summarized in Table 6.
Table 6.
Statistical characteristic values (MV, coefficient of variance (CV)) of the sample thickness, gravimetrically determined sample density (both n = 51), and radiometrically determined sample density (n = 7…9), results (homogeneous group (HG), indicated by letters) of statistical mean value comparison, results of statistical testing for achievement of target thickness and density, and information on the relative difference between target and actual value.
The average test specimen thickness of the board types was between 15.7 and 16.5 mm nominal, which means that the relative difference between the thickness actually achieved and the target thickness (16 mm) was at most 3%. With the exception of BT 6 (FL-CL-FL), the test specimen thickness achieved differed significantly from that intended. Further on, significant differences in mean test specimen thickness were found between the board types. This means that the board thickness achieved at constant pressing conditions is dependent on the particles used. Conversely, this means that the pressing parameters have to be adapted to the particles if a uniform board thickness is to be achieved.
Depending on the targeted density of the boards (500 or 650 kg/m3), the average test specimen density was between 492 and 510 kg/m3 or 631 and 647 kg/m3, respectively. This means that the relative difference between the density actually achieved and the target density was a maximum of 3%. The density of the test specimens differed significantly from the intended density in three of the seven board types, and in the case of four of the seven board types no statistically significant difference was found. Further on, significant differences in test specimen density were found between the board types. This applies across all board types, but also within the respective density levels.
Since the test specimen mass and the test specimen dimensions determine its density, the particles weight as well as the forming box have not been changed for board production, and the test specimen density does not correlate with the test specimen thickness, a lateral yielding of the particle mat during pressing can be assumed in addition to the particle-specific spring back in board thickness after leaving the press.
The comparison of the gravimetrically and radiometrically determined test specimen density shows that, in principle, comparable values were achieved, whereas the radiometrically determined values, however, were basically lower (−4.4% maximum in the case of BT 5) than the gravimetrically determined values.
3.2.2. Density Profile
According to the set rules (IQR method) extreme outliers were found in the case of BT 1 (maximum lower face layer density, one test specimen), BT 4 (maximum lower face layer density and core layer density, one test specimen each), and BT 7 (maximum lower face layer density, two test specimens). All data were normally distributed (Shapiro–Wilk-Test).
The Levene-Test has shown for all board types that the variances of upper face layer density and lower face layer density are homogeneous. The corresponding two-sample t-Test to be applied subsequently showed that the density of the upper face layer and the lower face layer are statistically equal. This shows that the density profiles are symmetrical and therefore the mean value over both face layer densities can be used for further analysis.
No homogeneity of variances was found for both the mean face layer and the core layer density across the board types (Levene-Test). Consequently, the Welch-Test was used to check whether there are significant differences between the board types in terms of mean face layer and the core layer density. The Games–Howell-Test was used for the subsequent post hoc analysis.
The density profiles of the investigated board types are shown in Figure 6a–f, combined in different ways depending on the partial investigation. Table 7 lists the characteristic values of the density profiles: Maximal face layer density, upper and lower side each, as well as the average of upper and lower side maximal density, and the minimal density in the core layer. In addition, the results of the statistical analyses with regard to differences between the board types in terms of face and core layer density, and the density gradient can be found.
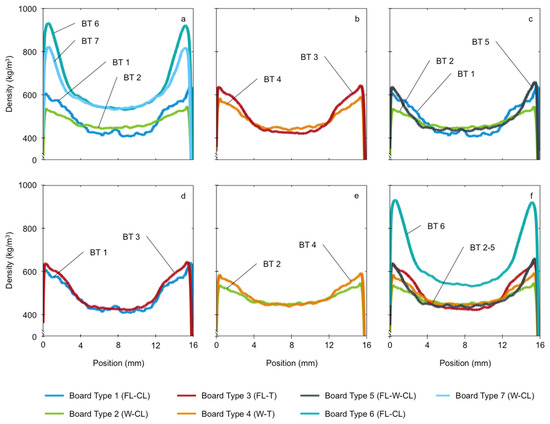
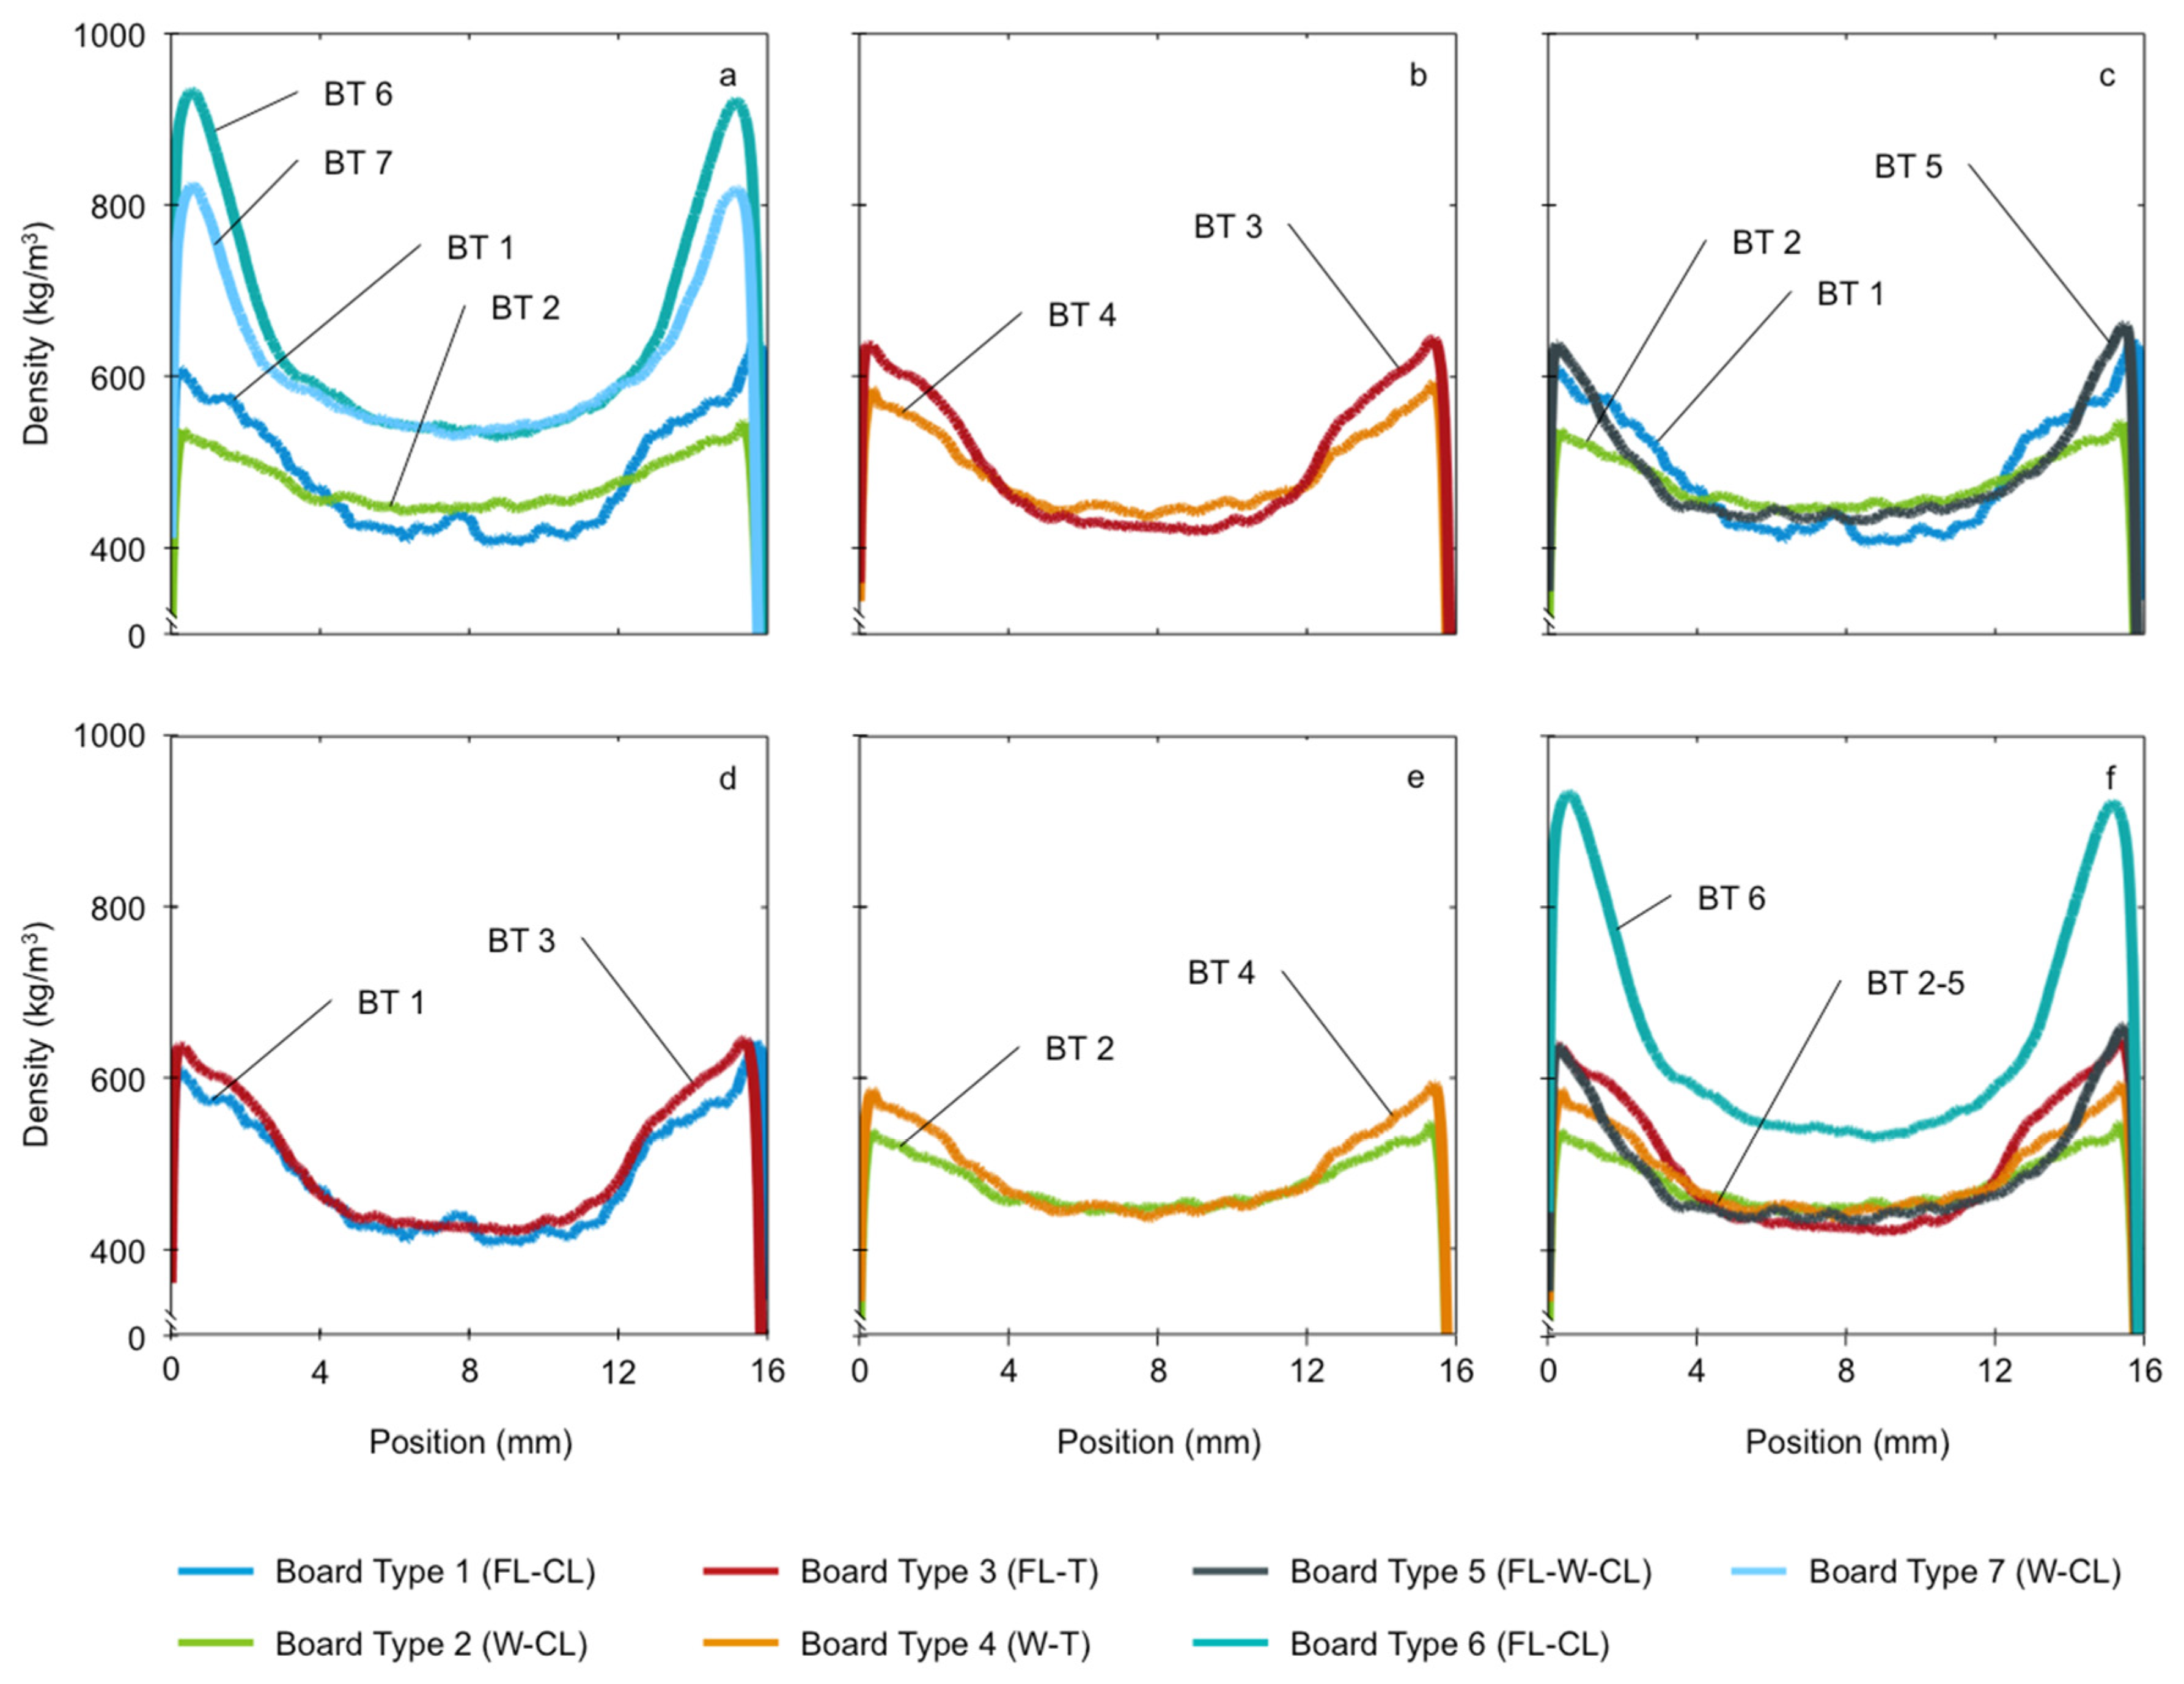
Figure 6.
Average density profiles of the seven board types (BT 1–7) investigated, variously arranged (a–f). The scans were started at the board lower side (from pressing).
Table 7.
Statistical characteristic values (MV, CV) of the radiometrically determined maximal face and minimal core layer sample density, results (HG, indicated by letters) of statistical mean value comparison, and specification of the density gradient.
It is to be seen from Figure 6a that a reduction of wood usage for board manufacture, and, thus, reduction of board density, results in a clear reduction of the pronouncedness of the density profile as well as significant less density face layers and a less density core layer. This applies to both, boards composed of typical particles (BT 6 vs. BT 1) and those with wafers as face layer material (BT 7 vs. BT 2). The decrease in pronouncedness can be traced by the decreasing density gradient each and the results from statistical analysis.
Comparing BT 1 (FL-CL) with BT 2 (W-CL), BT 6 (FL-CL) with BT 7 (W-CL) (both Figure 6a), and BT 4 (W-T) with BT 3 (FL-T) (Figure 6b) it is to be seen that the pronouncedness of the density profile decreases if flat-shaped particles are applied as face layer material. This can be traced by decreasing density gradients each, even though the results of the statistical analysis are not comparably clear. In contrast to a complete replacement of the typical face layer particle by wafers, a partial replacement does not result in a density profile that can be regarded as a mixture of both, but rather in a more pronounced density profile with highly compacted face layers (Figure 6c).
The effect of the alternative use of the particle of intentionally greater thickness instead of a typical one as core layer material of low wood usage boards is to be studied comparing the density profiles of BT 1 (FL-CL) with that of BT 3 (FL-T) in Figure 6d and that of BT 2 (W-CL) with that of BT 4 (W-T) in Figure 6e. This can be traced by decreasing density gradients each, even though the results of the statistical analysis are not comparably clear.
Comparing the density profiles of the low wood usage boards (board types two to five) with that of the reference of typical density and particle composition (BT 6 (FL-CL)) it can be seen that they are all much less pronounced (Figure 6f) than that of the reference. This can be traced by different density gradients and the results of the statistical analysis.
3.2.3. Bending Properties
The data sets under consideration were free of extreme outliers (IQR-Method) and normally distributed (Shapiro–Wilk-Test). No homogeneity of variances was found for both MOR and MOE across the board types (Levene-Test). Consequently, the Welch-Test was used to check whether there are significant differences between the board types in terms of MOR and MOE. The Games–Howell-Test was used for the subsequent post hoc analysis.
After shifting the data no further extreme outliers were found, and the data sets were still normally distributed. As no homogeneity of variances was found, the shifted data sets were checked for significant differences applying the Welch-Test. For the subsequent post hoc analysis the Games–Howell-Test was used.
Table 8 shows mean value and coefficient of variance for the bending properties of the board types (measured data above, shifted data below) and each the results of analysis for significant differences between them. A graphical comparison of the measured values is shown in Figure 7.
Table 8.
Statistical characteristic values (mean value (coefficient of variance)) of the measured and shifted board properties, and results (homogeneous groups, indicated by letters) of the statistical mean value comparison each, measured data (upper case letters), and shifted data (lower case letters).
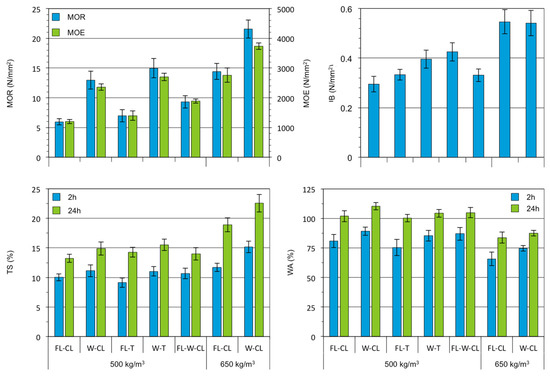
Figure 7.
Properties of wood-reduced (target density 500 kg/m3) and typical wood usage (650 kg/m3) boards composed of different FL, CL, W, T, MOR, MOE, IB, TS, and water absorption (WA); error bars indicate standard deviation.
The bending properties of board of reduced wood usage were found to be significantly below them of typical wood usage, regardless of the applied particle for manufacture (comparing BT 1 with BT 6 and BT 2 with BT 7). An uncompensated reduction in the amount of wood used for board manufacture therefore leads to a reduction in bending properties. As an explanation for the reduced bending properties, the results of the density profile determination and the internal bond strength determination can be used. The density profiles show that the density of the face layers, in particular, are reduced with reduced wood use. This means that there is less substance available to absorb the tensile and compressive forces resulting from bending loads. Furthermore, a lower compression of the wood substance during board manufacture leads to smaller contact surfaces between the particles and, thus, to lower bonding quality. This is at least indicated by the reduction in internal bond strengths with reduced core layer density (see next chapter).
The alternative use of wafers instead of the typical face layer particle leads to a significant increase of bending properties (bending strength and modulus of elasticity). That applies to both, boards of typical wood usage (BT 7 (W-CL) vs. BT 6 (FL-CL)) and those of low wood usage (BT 2 (W-CL) vs. BT 1 (FL-CL) and BT 4 (W-T) vs. BT 3 (FL-T)) for manufacture. The increase of MOR due to the alternative use of W amounts to 120% in the case of boards of low wood usage, and 114% in the case of boards of typical wood usage. In the case of MOE, the increase amounts to 97% and 93% respectively. Including BT 5 with partly substituted face layer particles into the first of the second comparison (BT 2 (W-CL) vs. BT 1 (FL-CL)) a row of significant increasing bending properties (BT 1 < BT 5 < BT 2) with increasing substitution (no, partly, complete) of face layer particle is obtained. The alternative use of wafers as face layer material can therefore serve as a measure to compensate for a reduction in bending properties when the amount of wood used for board production is reduced. The explanation for the improved bending properties is the different nature of the particle, since the previously mentioned positive effect of an increased face layer density on the bending properties is not observed here. Rather, an increase in bending properties can be observed despite a decreasing face layer density. It can therefore be assumed that the different nature of the particle means that the face layers can absorb the tensile and compressive forces resulting from bending loads to a greater extent.
The use of the core layer particle of intentionally greater thickness for board manufacture leads to a small but significant increase in bending properties compared to the respective reference (BT 3 (FL-T) vs. BT 1 (FL-CL) and BT 4 (W-CL) vs. BT 2 (W-T)). When considering the board properties after adjusting for the density influence (Table 7, shifted data), however, it can be seen that the gradation of the board types reverses (MOR, BT 4 vs. BT 2) or the difference between the measured values becomes smaller (MOR, BT 3 vs. BT 1 and MOE both pairings). Comparing each of the low wood usage boards (board types two to five) with the reference of typical wood usage composed of typical wood particles (BT 6) it is to be seen that the combined use of flat-shaped face layer particles and the core layer particle of intentionally greater thickness (BT 4) enables to reach the bending properties of the reference although the use of wood has been reduced by 150 kg/m3 (no significant differences in properties). When considering the bending properties after elimination of the influence of density (Table 7, shifted data), BT 2 reaches or, more precisely, exceeds the bending strength of the reference (BT 6) significantly. Regardless of statistical significance, the bending properties of both BT 2 and BT 4 reach the level of BT 6 after elimination of the influence of density.
The supplementary consideration of the shifted data shows, in contrast to the measured data, that the variation of the core layer particle has no influence on the bending properties.
3.2.4. Internal Bond Strength
According to the set rules (IQR method) extreme outliers were found in the case of BT 1 (sample density, two test specimens). All data were normally distributed (Shapiro–Wilk-Test). The Levene-Test showed the presence of variance homogeneity across the board types. Consequently, the Welch-Test was used to check whether there are significant differences between the board types. The Games–Howell-Test was used for the subsequent post hoc analysis.
After shifting the data no further extreme outliers were found and the data sets were still normally distributed. As no homogeneity of variances was found, the shifted data sets were checked for significant differences applying the Welch-Test. For the subsequent post hoc analysis the Games–Howell-Test was used.
The results of IB determination (mean value, coefficient of variation) and the results of analysis for significant differences between them are listed in Table 7 (measured data above, shifted data below). A graphical comparison of the measured values is shown in Figure 7.
The internal bond strength was found to be significant different for boards of low and typical wood usage, regardless of the applied particles for manufacture (comparing the board types one to five with the board types six and seven). This can be explained by the results of the density profile determination (Figure 6a,f). For boards of low wood usage, a much lower core layer density than for boards of typical wood usage was found. This means a lower compression of the wood substance, smaller contact surfaces between the particles, and, thus, to lower bonding.
The use of wafers instead of the typical particle as face layer material leads to a small but still significant increase of IB comparing BT 2 (W-CL) with BT 1 (FL-CL) and BT 4 (W-T) with BT 3 (FL-T) (all low wood usage boards (500 kg/m3)). One approach to explain this could be the nominally increased core layer density, which in turn could be explained by changed compaction behaviors due to the changed particle type insert. The increase of internal bond strength due to the replacement of the typical face layer particle by flat-shaped ones was found to be equal, regardless of whether the face layer particles were replaced completely or partially (IB of BT 5 equates that of BT 2).
The alternative use of the core layer particle of intentionally greater thickness leads to a significant increase of internal bond strength (BT 3 (FL-T) vs. BT 1 (FL-CL) and BT 4 (W-T) vs. BT 2 (W-CL)) (all low wood usage boards (500 kg/m3)). The increase of internal bond strength amounts 38% in the case of boards with typical particles as face layer material, and 30% in the case of boards with wafers as face layer material. As no differences in core layer particles thickness were found, the increase of internal bond strength can be explained by the difference in particle production. While the core layer particle CL was produced on industrial scale, fresh cutting blades, a careful drying and a more thorough screening were applied in the case core layer particle T, which obviously results in a better bond between the particles.
The comparison of the internal bond strength of the low wood usage board (board types two to five, 500 kg/m3) with that of the typical wood usage reference (BT 6) shows that neither the use of wafers as face layer material nor the use of the core layer particle of intentionally greater thickness was able to maintain the properties of wood-reduced boards on the level of those of typical wood usage ones.
3.2.5. Thickness Swelling
According to the set rules (IQR method) one extreme outlier was found in the case of BT 1 (TS 2 h). Furthermore, the data from one test specimen of BT 3 were excluded from the evaluation, as this was recognized as an outlier when considering the water absorption. Missing normal distribution was found for TS 2 h data of BT 1 (Shapiro–Wilk-Test). The Leneve-Test was therefore applied only for TS 24h data and showed variance homogeneity as a result. According to the findings, either the Kruskal–Wallis-Test (TS 2 h) or the F-Test (TS 24 h) was applied to test for any significant differences in terms of thickness swelling between the board types. The Steel–Dwass-Test (TS 2 h) or the Tukey–Kramer-Test (TS 24 h) was used for subsequent post hoc analysis.
After shifting the data additional extreme outliers to those already sorted out were found and also sorted out (BT 1, TS 2 h, one test specimen). Except for BT 1, TS 2 h, all data were still normally distributed. For the corresponding data set to be examined (TS 24 h), no homogeneity of variances was found. According to the preconditions, the shifted data sets were checked for significant differences applying the Kruskal–Wallis-Test (TS 2 h) or the Welch-Test (TS 24 h). For the subsequent post hoc analysis the Steel–Dwass-Test (TS 2 h) or the Games–Howell-Test (TS 24 h) was used.
The swelling in thickness of board of reduced wood usage were found to be significantly lower than that of typical wood usage, regardless of the applied particles for manufacture (comparing BT 1 with BT 6 and BT 2 with BT 7). This is to be seen in Figure 7 and proven on the basis of the results of statistical analysis given in Table 7 (measured data).
Regardless of the applied face and core layer particle for board manufacture, all boards of low wood usage (board types one to five, 500 kg/m3) reached a quite uniform level of thickness swelling after 2 h and 24 h of immersion in water each (Figure 7). Although mostly significant differences were found at the statistical comparison of the boards of varied composition with the relevant references (Table 7), no obvious regularity can be discerned. Due to that and quite uniform level of property for all low wood usage boards no relevance was attached to the results from statistical analysis. On contrary, for boards of typical wood usage (650 kg/m3) a significant increase of thickness swelling due to the face layer substitution by wafers was observed.
The swelling in thickness after 2 h of immersion in water of the low wood usage boards (board types two to five, 500 kg/m3) did not exceed that of the typical wood usage reference (BT 6 (FL-CL), 650 kg/m3). In the case of 24 h of immersion in water the swelling in thickness was significantly lower than that of the reference.
In total, the results show that thickness swelling is no critical property targeting a reduction of wood usage in particleboard manufacture.
3.2.6. Water Absorption
According to the set rules (IQR method) one extreme outlier was found in the case of BT 3 (WA 24 h). Furthermore, the data from one test specimen of BT 1 were excluded from the evaluation, as this was recognized as an outlier when considering the thickness swelling. The data for WA 2h and WA 24 h were normally distributed (Shapiro–Wilk-Test). For WA 2 h and WA 24 h both, the Levene-Test showed the presence of variance homogeneity across the board types. Consequently, the F-Test was used to check whether there are significant differences between the board types. The Tukey–Kramer-Test was used for subsequent post hoc analysis.
After shifting the data additional extreme outliers to those already sorted out were found and also sorted out (BT 4 (TS 24 h, one test specimen), BT 7 (WA 2 h and WA 24 h, the same one test specimen)). All data sets were still normally distributed. As no homogeneity of variances was found, the shifted data sets were checked for significant differences applying the Welch-Test. For the subsequent post hoc analysis the Games–Howell-Test was used.
Water absorption of each both, 2 h and 24 h of immersion in water and low wood usage (500 kg/m3) and typical wood usage (650 kg/m3) board is on a quite uniform level regardless of the face and core layer particle applied for manufacture (Figure 7). Although water absorption was higher for boards of low wood usage than that of typical wood usage, this property has not to be considered as critical for the manufacture of wood-reduced particleboards.
4. Discussion
In the course of interpreting the influence of the varied parameters on the board properties, it became clear that especially the characteristic values derived from particle size and board structure characterization are helpful for objective assessment. Although the descriptive comparison of graphical representations (particle size distributions or density profiles) helps to evaluate the influence of particle variation, a more concrete statement is possible when comparing characteristic values, such as the mean particle size or the mean value of the maximum face layer density. In addition, characteristic values can be compared for (significant) differences by means of statistical tests. This becomes obvious where there are nominal differences between results, but where these are not significant, taking into account the range of variation. In total, it is therefore possible to make statements of higher quality when comparing characteristic values instead of diagrams.
On the basis of the observation of test specimen thickness and test specimen density, it could be seen that the variation of the particles used leads to a varying degree of lateral yielding of the particle mat during pressing and a spring back of the board thickness after the press is opened. On the one hand, this shows that the particles used are likely to have different compaction behavior. On the other hand, it becomes clear that, if uniform board thicknesses or board densities are desired, overspreading or an adapted pressing program (e.g., over pressing) must be used.
Against the background of the relationship between board density and board properties and the existence of non-uniform density across the board types, the board properties were shifted to the respective target density within the context of the evaluation of the results. Although this procedure only led to minor changes in the data, in the case of the bending properties, it was found that the previously identified influence of the core layer particle used was no longer apparent and was due solely to the differences in density. This side effect argues in favor of always looking at density-adjusted data in the future in order to avoid misinterpretations.
While the data of the density profile determination have already been scaled to a uniform board thickness with regard to the graphical representation, the observations from the comparison of the measured and the shifted board properties suggest that it might also be useful to shift the data of the density profile determination to the intended target density.
In view of the structural setup of early particleboards, the experiments showed that with an appropriately designed board cross-section, i.e., a low-density core layer and face layers of flat-shaped particles, it is possible to produce boards with conventional bending properties while reducing the amount of wood used. As can be seen from the combined consideration of board properties and density profile, the variation of face and core layer particles in boards with low wood usage has not, however, led to comparably pronounced density profiles as can be found in the case of boards with conventional wood usage (highly compressed face layers compared to core layer density). This means that, by replacing the particle, it is not so much the structure of the board that has changed (contrary to what was suspected in a previous study [25]), but rather the strength of the respective layer, regardless of its density. It is therefore the particle itself or the adhesive bond between the particles that enables increased load-bearing capacity. While in the case of face layer particle, the size may be the cause, in the case of core layer particle, the cause must be assumed to be the type of manufacture. In comparison to the plant-made core layer particle, for the manufacture of the lab-made core layer particle fresh cutting blades were applied a careful drying and a more thorough screening. A change in the structural setup due to changed compaction behavior can only be observed when replacing the conventional face layer particle with the wafers in the case of internal bond strength. In addition to the possibly higher strength of the wafers themselves, the much higher surface-specific adhesive amount due to the particle size may also be the reason for the higher strength of the face layers built up from this particle. As the particle size increases, the particle surface area to be coated with adhesive decreases, so that with a constant amount of adhesive and wood used, more adhesive is effectively available to join the particles together. A corresponding sample calculation can be found in an earlier article [9].
Although it has been shown that by adjusting the particle geometry the decrease in board properties due to wood or density reduction could be compensated to a certain extent, it remains unclear whether the surface and edge quality reaches the required level. Together with the consideration of the economic efficiency of the production and processing of particles with different geometries, this is a question that needs to be clarified in subsequent work. In any case, however, it is clear that measures to increase the efficiency of raw materials (wood, adhesives, and energy) require measurement technology that can also automatically determine the thickness of particles in particular, thus enable an objective comparison of the particles actually produced.
5. Conclusions
In this study, the effects of flat-shaped face layer particles and a core layer particle of intentionally greater thickness used as an alternative to typical particles on the properties of wood-reduced particleboards are presented. The properties of the boards made with these materials were compared with those of a typical wood application. The intention was to demonstrate the potential of changing the particle geometry for the production of wood-reduced boards while simultaneously achieving target properties.
The results show that despite a reduction in the use of wood, both the bending strength and the modulus of elasticity can be maintained at the level of boards with typical wood use if the face layer material is replaced by flat shaped particles. A partial substitution of the face layer particles in the form of an intermediate layer between the face and core layer led to an increase in the bending properties, but the level of the typical board was not reached.
An increase in the internal bond strength was observed through the alternative use of a lab-made core layer particle (presumably due to a more sensitive manufacturing process, e.g., fresh cutting blades, a careful drying and a more thorough screening) or wafers as face layer material (due to obviously different compaction behavior). However, the change in particle geometry was not able to maintain this property (IB) at the level of typical wood usage boards.
The present study combines current efforts to increase raw material efficiency with the early approaches of particleboard development. It was attempted to transfer the board structure developed by Fahrni with a low-density core layer and load-bearing face layers of flat-shaped particles to the production of wood-reduced particleboards. Although it has been shown that this approach can produce particleboard with less wood, but achieving bending properties equivalent to those of boards made from typical particles, it remains unclear whether other properties such as surface and edge quality meet current demands.
Author Contributions
Conceptualization, M.O. (formulation of research goals as part of funding acquisition) and J.T.B. (design of experiments); investigation, formal analysis, methodology, writing, J.T.B.; funding acquisition and project administration, M.O., All authors have read and agreed to the published version of the manuscript.
Funding
This research was funded by the Federal Ministry of Food and Agriculture (BMEL), Bonn/Berlin, Germany, based on a resolution of the German Bundestag [Parliament of the Federal Republic of Germany], administrated by the Fachagentur Nachwachsende Rohstoffe e.V. [Agency for Renewable Resources] (FNR), Gülzow-Prüzen, Germany. The contents of the present paper have been achieved within Part 1 of the joint research project “Entwicklung leichter Holzwerkstoffe unter Verwendung definierter Spanorientierung und Partikelmorphologie” [Development of lightweight wood-based boards using defined wood chip orientation and particle morphology], funding code 22005613.
Acknowledgments
The authors would like to thank the following people for their cooperation, which made this work possible: Michael Farnow (Ilim Nordic Timber GmbH & Co. KG) for providing timber material (forest-fresh pinewood boards), Klaus Richter, Fritz Tröger, Markus Knorz and Frank Moosmann (Wood Research Munich) for the possibility to manufacture the flat-shape face layer particles, Joachim Hasch (Swiss Krono Group, Luzern, Switzerland) and Maik Hirschberg (Swiss Krono sp z o.o.) for the supply of wood chips, typical face and core layer particles as well as adhesive and paraffin solution, and Helmut Roll (Pallmann Maschinenfabrik GmbH & Co. KG) for the manufacture of the core layer particle of intentionally greater thickness at the PRTC. Special thanks go to all those persons who were engaged in the experimental realization and data analysis, namely Dörte Bielenberg, Birgit Butenschön, Nick Engehausen, Sabrina Heldner, Hannes Köhm, and Bettina Steffen (all Thünen Institute of Wood Research).
Conflicts of Interest
The authors declare that they have no conflict of interest. Due to the formulation of the call for proposals by the project-executing agency, the funder had minimal indirect role in the design of the study, but definitely no role in the collection, analyses, or interpretation of data; in the writing of the manuscript, or in the decision to publish the results.
Cited Standards
- DIN 66165-1:2016-08, Partikelgrößenanalyse—Siebanalyse—Teil1: Grundlagen [Particle size analysis—Sieving analysis—Part 1: Fundamentals]
- DIN 66165-2:2016-08, Partikelgrößenanalyse—Siebanalyse—Teil 2: Durchführung [Particle size analysis—Sieving analysis—Part 2: Procedure]
- DIN EN 310:1993-08, Holzwerkstoffe; Bestimmung des Biege-Elastizitätsmoduls und der Biegefestigkeit; Deutsche Fassung EN 310:1993 [Wood-based panels; determination of modulus of elasticity in bending and of bending strength; German version EN 310:1993]
- DIN EN 317:1993-08, Spanplatten und Faserplatten; Bestimmung der Dickenquellung nach Wasserlagerung; Deutsche Fassung EN 317:1993 [Particleboards and fibreboards; determination of swelling in thickness after immersion in water; German version EN 317:1993]
- DIN EN 319:1993-08, Spanplatten und Faserplatten; Bestimmung der Zugfestigkeit senkrecht zur Plattenebene; Deutsche Fassung EN 319:1993 [Particleboards and fibreboards; determination of tensile strength perpendicular to the plane of the board; German version EN 319:1993]
- DIN EN 323:1993-08, Holzwerkstoffe; Bestimmung der Rohdichte; Deutsche Fassung EN 323:1993 [Wood-based panels; determination of density; German version EN 323:1993]
- DIN ISO 9276-1:2004-09, Darstellung der Ergebnisse von Partikelgrößenanalysen—Teil 1: Grafische Darstellung (ISO 9276-1:1998) [Representation of results of particle size analysis—Part 1: Graphical representation (ISO 9276-1:1998)
- ISO 13322-1:2014-05, Particle size analysis—Image analysis methods—Part 1: Static image analysis methods
- ISO 13322-2:2006-11, Particle size analysis—Image analysis methods—Part 2: Dynamic image analysis methods
References
- Knauf, M. Understanding the consumer: Multi-modal market research on consumer attitudes in Germany towards lightweight furniture and lightweight materials in furniture design. Eur. J. Wood Wood Prod. 2015, 73, 259–270. [Google Scholar] [CrossRef]
- Klauditz, W.; Stegmann, G. About the suitability of poplar wood for the production of particleboards. Holzforschung 1957, 11, 174–179. (In German) [Google Scholar]
- Plath, E. Influence of gross density on the properties of wood-based boards. Holz Roh Werkst. 1963, 21, 104–108. (In German) [Google Scholar] [CrossRef]
- Keylwerth, R. Achieved and achievable reduction of anisotropy in wood-based boards. Holz Roh Werkst. 1959, 17, 234–238. (In German) [Google Scholar] [CrossRef]
- Liiri, O. Investigations on properties of wood particle boards. Paperi Puu 1961, 43, 3–18. [Google Scholar]
- Istek, A.; Siradag, H. The effect of density on particleboard properties. In Proceedings of the International Caucasian Forestry Symposium (ICFS), Artvin, Turkey, 25–26 October 2013; pp. 932–938. [Google Scholar]
- Benthien, J.T.; Ohlmeyer, M. Influence of face-to-core layer ratio and core layer resin content on the properties of density-decreased particleboards. Eur. J. Wood Wood Prod. 2017, 75, 55–62. [Google Scholar] [CrossRef]
- Sackey, E.K.; Semple, K.E.; Oh, S.W.; Smith, G.D. Improving core bond strength of particleboard through particle size redistribution. Wood Fiber Sci. 2008, 40, 214–224. [Google Scholar]
- Benthien, J.T.; Lüdtke, J.; Ohlmeyer, M. Effect of increasing core layer particle thickness on lightweight particleboard properties. Eur. J. Wood Wood Prod. 2019, 77, 1029–1043. [Google Scholar] [CrossRef]
- Wyss, O. On the patent history of particleboard. Holz Roh Werkst. 1981, 39, 399–404. [Google Scholar] [CrossRef]
- Klauditz, W. Development, status and significance of particleboard production for the wood industry. Holz Roh Werkst. 1955, 13, 405–421. [Google Scholar] [CrossRef]
- Deppe, H.J. Strands. In Wood Encyclopedia, 4th ed.; Lohmann, U., Ed.; DRW-Verlag: Stuttgart, Germany, 2003; Volume 2, pp. 450–451. ISBN 3-87181-355-9. (In German) [Google Scholar]
- Keylwerth, R. On the mechanics of the multilayer particle board. Holz Roh Werkst. 1958, 16, 419–430. (In German) [Google Scholar] [CrossRef]
- Kollmann, F. Wood-based Boards—Particleboards and Wood Particle Castings, Raw Materials, Manufacturing, Planned Costs, Quality Control etc.; Springer: Berlin, Germany, 1966; p. 535. ISBN 978-3-642-50247-7. (In German) [Google Scholar]
- Turner, H.D. Effect of particle size and shape on strength and dimensional stability of resin-bonded wood-particle panels. For. Prod. J. 1954, 4, 210–223. [Google Scholar]
- Kitahara, K.; Kasagi, K. Effects of raw chip dimensions on the physical and mechanical properties of chip-board. Wood Ind. 1955, 10, 406–412. [Google Scholar]
- Post, P.W. Effect of particle geometry and resin content on bending strength of oak flake boards. For. Prod. J. 1958, 8, 317–322. [Google Scholar]
- Brumbaugh, J. Effect of flake dimensions on properties of particle boards. For. Prod. J. 1960, 10, 243–246. [Google Scholar]
- Dunky, M.; Niemz, P. Wood-based Boards and Adhesives—Technology and Influencing Factors; Springer: Berlin, Germany, 2002; pp. 668–670. ISBN 978-3-642-62754-5. (In German) [Google Scholar]
- Liiri, O.; Kivistö, A.; Saarinen, A. The influence of wood species, chip size and binder on the strength and swelling of particleboards with higher elastomechanical properties. Holzforsch. Holzverwert. 1977, 29, 117–122. (In German) [Google Scholar]
- Niemz, P. Investigations on the influence of structure on the properties of particle board—Part 1: Influence of particle size, board density, solid resin content and solid paraffin content. Holztechnologie 1982, 23, 206–213. (In German) [Google Scholar]
- Niemz, P. Influence of selected structural parameters on the tensile and compressive strength of particleboards. Holz Roh Werkst. 1990, 48, 361–364. (In German) [Google Scholar] [CrossRef]
- Niemz, P.; Bauer, S. Relationship between structure and properties of particleboard. Part 2: Shear modulus, shear strength, bending strength. Holzforsch. Holzverwert. 1991, 43, 68–70. (In German) [Google Scholar]
- Istek, A.; Aydin, U.; Özlüsoylu, I. The effect of chip size on the particleboard properties. In Proceedings of the International Congress on Engineering and Life Science (ICELIS), Kastamouno, Turkey, 26–29 April 2018; pp. 439–444. [Google Scholar]
- Benthien, J.T.; Ohlmeyer, M.; Schneider, M.; Stehle, T. Experimental determination of the compression resistance of differently shaped wood particles as influencing parameter on wood-reduced particleboard manufacturing. Eur. J. Wood Wood Prod. 2018, 76, 937–945. [Google Scholar] [CrossRef]
- Benthien, J.T.; Bähnisch, C.; Heldner, S.; Ohlmeyer, M. Effect of fiber size distribution on medium-denstiy fibreboard properties caused by varied streaming time and temperature of defibration process. Wood Fiber Sci. 2014, 46, 175–185. [Google Scholar]
- Seppke, B.; Bähnisch, C.; Benthien, J.T.; Heldner, S.; Ohlmeyer, M. A Concurrent Skeleton-based Approach for the Characterization of Wood Fibers with Sub-pixel Precision for Fiber Board Production. In Proceedings of the 10th International Conference on Mass Data Analysis of Images and Signals (MDA), Hamburg, Germany, 11–14 July 2015. [Google Scholar]
- Jensen, U.; Kehr, E. Quantitative evaluation of density profiles of particleboard and MDF. Holz Roh Werkst. 1995, 53, 16. (In German) [Google Scholar] [CrossRef]


© 2020 by the authors. Licensee MDPI, Basel, Switzerland. This article is an open access article distributed under the terms and conditions of the Creative Commons Attribution (CC BY) license (http://creativecommons.org/licenses/by/4.0/).