
Genome Size Covaries More Positively with Propagule Size than Adult Size: New Insights into an Old Problem


Abstract
:Simple Summary
Abstract
1. Introduction
2. Materials and Methods
2.1. Data Sources
2.2. Scaling Analyses
3. Results
4. Discussion
4.1. Scaling of Crustacean Genome Size with Egg versus Adult Body Sizes
4.2. Scaling of Genome Size with Sizes of Gametes and Propagules in Other Animal and Plant Taxa
4.3. Single-Cell ‘Bottlenecks’ in the Life Cycles of Multicellular Organisms May Affect Their Genome and Cell Sizes
4.4. Relationships between the Sizes and Numbers of Somatic Cells and Those of Propagules or Gametes
4.4.1. Data
4.4.2. Hypothetical Nucleotypic Effects
4.5. Effects of Polyploidy on the Sizes and Numbers of Cells, Gametes and Propagules
4.6. Temperature Effects on Sizes of Cells, Gametes and Propagules
4.7. Linking Genomics with Life-History and Metabolic Theory
4.7.1. Linking Genomics with Life-History Theory
4.7.2. Linking Genomics with Metabolic Theory
4.7.3. Genome Size as an Inter-Linking Component of Multi-Trait Adaptive Syndromes
5. Conclusions
- Genome size often relates more positively to reproductive propagule size than adult size (see Figure 1 and Table 1, Table 2, Table 3 and Table 5). This makes sense because propagules are either single-celled (e.g., eggs, sperm and spores) or consist of a relatively few cells (e.g., pollen and seeds) whose size often relate strongly to propagule size. Therefore, since genome size and cell size are usually strongly positively related, genome size should often relate positively to propagule size, as well. By contrast, multicellular body size relates to either cell size or number or both. This fact leads to the next conclusion.
- Genome size relates more positively to the size of unicellular organisms or small multicellular organisms whose variation in size relates strongly to variation in cell size, than to the size of relatively large multicellular organisms whose variation in size relates chiefly to variation in cell number (illustrated in Figure 3). This conclusion is supported by ubiquitous positive relationships between genome size and body size observed in unicellular organisms, frequently positive relationships between genome size and body size observed in small multicellular organisms (e.g., flatworms, polychaete worms, mollusks, copepods, cladocerans, ostracods, amphipods, mites and ticks, and some rotifers and insects), and no or weakly positive or negative relationships with body size observed in relatively large organisms (e.g., decapods, fishes, tetrapods, ferns and angiosperms; see Figure 3 and Figure 4; and Table 1). This conclusion is also supported by the observation that genome size scales curvilinearly (concave downward) with body length or mass in crustaceans, with a positive relationship at the small end of the body-size range, and an absent or negative relationship at the large end of the body-size range (see Figure 2 and Table 4). However, why some small animal taxa (e.g., nematodes, rotifers, oligochaete worms, spiders and some insects) do not show positive relationships between genome size and body size (see Table 1) remains a mystery.
- Organisms with larger genomes (e.g., polyploids) or that have been exposed to low temperatures during their development tend to show parallel increases in the sizes of their somatic cells and reproductive propagules, and parallel decreases in their number (see Figure 5 and Table A1 and Table A2). Changes in somatic cell size and number are, in turn, often related to changes in various developmental and physiological traits (e.g., rates of growth and metabolism). These patterns suggest that variation in reproductive strategies may be more intimately linked to variation in somatic cell size and function than has been hitherto appreciated. Adaptive or phenotypically plastic changes in reproductive traits may often covary with somatic traits, which should be considered in future theoretical models of life-history evolution and metabolic ecology.
- DNA may influence phenotypes via not only informational (genotypic) effects, but also non-informational, structural or mechanical (nucleotypic) effects. Nucleotypic effects appear to play a central role in the network of cause-and effect relationships among genome size, cell size, propagule size and various other physiological and life-history traits (see Figure 6). Nucleotypic effects and thermally induced phenotypic plasticity may facilitate the evolution of ‘adaptive syndromes’ (integrated suites of traits, including the sizes of genomes, cells and propagules, and the rates of growth, development and metabolism) especially in hot, cold, resource-poor and other kinds of stressful environments.
- I promote and further develop a life-history perspective to understanding the evolution of genome size and its relationship to body size. Genome size may be affected by not only r-, K-and adversity-selection, but also variation in age- and size-specific mortality—in particular, the relative mortality of juveniles (MJ) and adults (MA) (see also Section 4.7.1 and Section 4.7.3). I hypothesize that in organisms where MJ/MA is low, propagule size, cell size and genome size should show strong positive scaling with body size (as observed in copepods), but in organisms where MJ/MA is high, propagule size, cell size and genome size should scale weakly with body size or not at all (as observed in decapods). Furthermore, because of trade-offs between the size and number of propagules and somatic cells, low MJ/MA should be associated with weak or absent scaling of propagule and cell number with body size (as observed in copepods), whereas high MJ/MA should be associated with strongly positive scaling of propagule and cell number with body size (as observed in decapods) (see Figure 7). Genome size may both affect and be affected by the evolution of various life-history traits [103]. I argue that propagule size and number are key (central) traits in this respect, a view that has not received the attention that it deserves. Propagule size relates not only to the genotypic fitness of both offspring and parents, but also to genome size, cell size and many other phenotypic traits, both directly and indirectly by nucleotypic effects (see Figure 6), and thus, to many kinds of internal (biological) and external (ecological) factors. As such, propagule size appears to be a ‘hub trait’ that is highly connected to many other traits [371,372] in adaptive syndromes (correlation networks) representing the multiple interfaces of the genotype, nucleotype, phenotype and ecotype.
6. Recommendations for Further Research
- Further testing of the SCBH is needed, including rigorous multivariate statistical analyses of the relationships among genome size, propagule size, cell size, body size, and various other phenotypic traits in diverse kinds of plants and animals at various taxonomic levels. These analyses would benefit from using phylogenetically informed methods, which have not been employed in the preliminary analyses of crustaceans presented in my article.
- Why genome size and body size are sometimes negatively correlated (Table 1) has not been addressed in my study, and deserves further investigation. Perhaps, negative relationships occur because larger size is sometimes associated with smaller (rather than larger) cells (and thus supporting genomes), a hypothesis that should be tested.
- Experiments involving manipulations of, or artificial selection on the sizes of genomes, cells, propagules and (or) adults are needed to identify and disentangle cause-and-effect relationships (including the mechanisms underlying nucleotypic effects).
- Further syntheses of genomic theory with life-history and metabolic scaling theory are likely to be worthwhile. For example, theory regarding the origin(s) of genome-size diversity would benefit from explicit inclusion of life-history theories regarding the evolution of propagule size and number, and of cell-size-based metabolic scaling theory. Life-history and metabolic scaling theory may also benefit from explicit inclusion of genome-size-related nucleotypic effects (e.g., [205]).
- Scaling analyses of genome size and many other traits have focused mostly on adult size as the independent variable. Analyses based on the sizes of immature ontogenetic stages (as done in the present study) may provide new insights. As Bonner [154] emphasized, it is important to study organisms in the context of their whole life cycles, not just as adults.
Supplementary Materials
Funding
Institutional Review Board Statement
Informed Consent Statement
Data Availability Statement
Acknowledgments
Conflicts of Interest
Appendix A

| Taxon | Propagule/Gamete 1 | Propagule/Gamete 2 | Cell Type 1 | Cell Type 2 | Source |
|---|---|---|---|---|---|
| PLANTS | |||||
| Bryophyta (mosses) | |||||
| Octoblepharurn albidum | Spore | Leaf | [373] | ||
| Polypodiopsida (ferns) | Spore | Stomata | [35] | ||
| Dryopteris filix-mas-Gruppe | Spore | Stomata | [374] | ||
| Angiospermae | Pollen | Seed | Stomata | [166] | |
| Allium oleraceum | Pollen | Stomata | [375] | ||
| Arabidopsis thaliana | Seed | Embryo | Seed coat | [168,169] | |
| Seed | Stomata | Leaf epidermis | |||
| Brassica campestris | Pollen | Stomata | [376] | ||
| B. rapa | Pollen | Seed | Stomata | [377] | |
| Bromus inermis | Pollen | Stomata | [378] | ||
| Catharanthus roseus | Pollen | Seed | Stomata | [379,380] | |
| Chamomilla recutita | Pollen | Seed | Stomata | [381] | |
| Convolvulus pluricaulis | Pollen | Seed | Stomata | Leaf epidermis 1 | [382] |
| Cyamopsis psoraloides | Pollen | Stomata | [383] | ||
| Cyclamen persicum | Pollen | Stomata | [384] | ||
| Dactylis glomerata | Seed | Stomata | [385] | ||
| Echinacea purpurea | Pollen | Seed | Stomata | [386] | |
| Eriotheca species | Pollen | Stomata | [387] | ||
| Fagopyrum tataricum | Pollen | Seed | [388] | ||
| Glycine max | Pollen | Seed | Stomata | [389,390] | |
| Hemerocallis varieties | Pollen | Stomata | [131] | ||
| Hemerocallis flava | Pollen | Stomata | [391] | ||
| Hylocereus species | Pollen | Seed 2 | Stomata | [134] | |
| Hyoscyamus muticus | Seed | Stomata | [392] | ||
| Jatropha curcas | Pollen | Seed | Stomata | [393] | |
| Lactuca sativa | Pollen | Seed | Stomata | [394] | |
| Lagerstroemia indica | Pollen | Seed | Stomata | [395] | |
| Lathyrus sativus | Pollen | Seed | Stomata | [396] | |
| Lavandula angustifolia | Seed | Stomata | [136] | ||
| Lepidium sativum | Seed | Stomata | [397] | ||
| Linum species | Pollen | Seed | Stomata | [398] | |
| Lolium multiflorum | Seed | Stomata | [39] | ||
| Lolium perenne | Seed | Leaf epidermis | [137] | ||
| Malus × domestica | Pollen | Stomata | [138] | ||
| Miscanthus species | Pollen | Stomata | [399] | ||
| Nicotiana species | Seed | Stomata | Leaf epidermis | [40] | |
| Nigella sativa | Seed | Stomata | [400] | ||
| Ocimum basilicum | Pollen | Stomata | [401] | ||
| Oryza sativa | Seed | Spikelet hull epidermis | [402,403] | ||
| Phaseolus vulgaris | Pollen | Seed | Cotyledon | Stomata 3 | [167,216,404] |
| Phlox amabilis | Pollen | Stomata | [405] | ||
| Physalis species | Pollen | Stomata | [406] | ||
| Pisum sativum | Seed | Cotyledon | [139] | ||
| Plantago media | Pollen | Seed | Stomata | [407] | |
| P. ovata | Pollen | Seed | Stomata | [408] | |
| P. psyllium | Pollen | Seed | Stomata | [409] | |
| Pyrus pyrifolia | Pollen | Stomata | [140] | ||
| Raphanus sativus | Pollen | Stomata | [410] | ||
| Rhipsalis baccifera | Seed | Stomata | [411] | ||
| Sesamum indicum | Pollen | Stomata | [412] | ||
| Tanacetum parthenium | Pollen | Seed | Stomata | Root meristem | [413] |
| Trachyspermum ammi | Pollen | Seed | Stomata | [414,415] | |
| Trifolium species | Pollen | Stomata | [416] | ||
| Vicia species | Seed | Cotyledon | [144] | ||
| Vicia villosa | Pollen | Stomata | [417] | ||
| Vigna species | Pollen | Seed | Stomata | [418] | |
| Viola × wittrockiana | Pollen | Seed | [419] | ||
| Ziziphus jujuba | Pollen | Stomata | [420] | ||
| INVERTEBRATE ANIMALS | |||||
| Arthropoda | |||||
| Insecta | |||||
| Bombyx mori | Egg | Serosa | [421] | ||
| VERTEBRATE ANIMALS | |||||
| Actinopterygii (ray-finned fishes) | |||||
| Cobitus | Egg | Erythrocyte | [314] | ||
| Misgurnus anguillicaudatus | Egg | Sperm | [422] | ||
| Anura (frogs) | Egg | Gastrula | [423] | ||
| Rana species | Egg | Epidermis | Lens 4 | [261] | |
| Mammalia | |||||
| Rodentia | Sperm | Liver | [153] |
| Taxon | Cell Size | Cell Number | Propagule Size | Propagule Number | Source |
|---|---|---|---|---|---|
| UNICELLULAR ORGANISMS | |||||
| Prokaryotes | POS | [424,425] | |||
| Fungi | |||||
| Saccharomyces cerevisiae | POS | [426,427,428] | |||
| Bacillariophyceae (diatoms) | |||||
| Thalassiosira species | POS | [29] | |||
| Ciliophora | |||||
| Stentor coeruleus | POS | [34] | |||
| MULTICELLULAR ORGANISMS | |||||
| PLANTS | |||||
| Bryophyta (mosses) | |||||
| Bryum varieties | POS | [429] | |||
| Octoblepharum albidum | POS | POS | [373] | ||
| Polypodiopsida (ferns) | POS | POS | [107,430] | ||
| Asplenium species | POS | [431] | |||
| Asplenium trichomanes x viride-Bastarde | POS | [432] | |||
| Dryopteris margina | POS | [433] | |||
| Dryopteris filix-mas-Gruppe | POS | POS | [374] | ||
| Woodwardia virginica | POS | [433] | |||
| Angiospermae | POS | POS | NEG | [113,166,172,189,434] | |
| Abelmoschus species | POS | NEG | [435] | ||
| Acacia mearnsii | POS | NEG | [436] | ||
| Actinidia deliciosa | POS | [437] | |||
| Andropogon species | POS | [438] | |||
| Aegilops neglecta | POS | NEG | [439] | ||
| Allium oleraceum | POS | NEG | POS | [375] | |
| A. sativum | POS | NEG | [440] | ||
| Anthurium andraeanum | POS | NEG | [441] | ||
| Arabidopsis thaliana | POS | POS | [169,442,443,444,445] | ||
| Arachis species | POS | [446] | |||
| Asparagus officinalis | POS | NEG | [447] | ||
| Atriplex confertifolia | POS | NEG | [201] | ||
| Averrhoa carambola | POS | [448] | |||
| Bletilla striata | POS | [449] | |||
| Brachiaria ruziziensis | POS | [450] | |||
| Brassica campestris | POS | NEG | POS | [376] | |
| B. oleracea | POS | [451] | |||
| B. rapa | POS | POS | [377] | ||
| Bromus inermis | POS | NEG | POS | [378] | |
| Buddleja macrostachya | POS | NEG | [452] | ||
| Calendula officinalis | POS | NEG | [453] | ||
| Camellia sinensis | POS | NEG | [454] | ||
| Cannabis sativa | POS | NEG | [455] | ||
| Carthamus tinctorius | POS | [456] | |||
| Catharanthus roseus | POS | NEG | POS | [379,380] | |
| Cattleya intermedia | POS | NEG | [457] | ||
| Centella asiatica | POS | [458] | |||
| Chaenomeles japonica | POS | [459] | |||
| Chamerion (Epilobium) angustifolium | POS | NEG | POS | [460,461] | |
| Chamomilla recutita | POS | POS | [381] | ||
| Chrysanthemum carinatum | POS | [462] | |||
| Chrysanthemum (Dendranthema × grandiflorum) | NO | NO | [463] | ||
| Citrulus lanatus | POS | NEG | [464] | ||
| Citrus clementine | POS | NEG | [465] | ||
| C. limonia | POS | [466] | |||
| C. reticulata | POS | NEG | [467] | ||
| Clematis heracleifolia | POS | NEG | [468] | ||
| Coffea species | POS | NEG | [469] | ||
| Convolvulus pluricaulis | POS | NEG | POS | NEG | [382] |
| Crataegus species | POS | [470] | |||
| Cyamopsis psoraloides | POS | NEG | POS | NEG | [383] |
| Cyclamen persicum | POS | POS | [384] | ||
| Cynodon dactylon | POS | NEG | [471] | ||
| Dactylis glomerata | POS | POS | NEG | [385,472] | |
| Datura stramonium | POS | NEG | [473] | ||
| Dendrobium cariniferum | POS | NEG | [474] | ||
| Dioscorea zingiberensis | POS | [475] | |||
| Dracocephalum kotschyi | POS | [476] | |||
| Echeveria ‘peerless’ | POS | NEG | [477] | ||
| Echinacea purpurea | POS | NEG | POS | [386] | |
| Eragrostis curvula | POS | [478] | |||
| Eriotheca species | POS | POS | [387] | ||
| Fagopyrum tataricum | POS | [388] | |||
| Festuca arundinacea | POS | NEG | [479] | ||
| Fragaria vesca | POS | NEG | [480] | ||
| Gerbera jamesonii | POS | NEG | [481] | ||
| Glycine max | POS | NEG | POS | NEG | [389,390] |
| Glycyrrhiza glabra | POS | [456] | |||
| Hemerocallis varieties | POS | POS | [131] | ||
| Hemerocallis flava | POS | POS | [391] | ||
| Hibiscus syriacus | POS | NEG | [482] | ||
| Hordeum vulgare | POS | [483] | |||
| Humulus lupulus | POS | [484] | |||
| Hylocereus species | POS/NO 1 | NEG 1 | [133] | ||
| Hylocereus species | POS | NEG | POS/NEG 2 | NEG 2 | [134] |
| Hyoscyamus muticus | POS | POS | [392] | ||
| Impatiens balsamina | POS | NEG | [485] | ||
| Isatis indigotica | POS | POS | [486] | ||
| Jatropha curcas | POS | NEG | POS/NEG 3 | [393] | |
| Lactuca sativa | POS | POS | [394] | ||
| Lagerstroemia indica | POS | NEG | POS | [395,487] | |
| Lathyrus sativus | POS | NEG | POS | NEG | [396] |
| Lavandula angustifolia | POS | POS | [136] | ||
| Lepidium sativum | POS | NEG | POS | [397] | |
| Lilium davidii | POS | NEG | [488] | ||
| Linum species | POS | POS | [398] | ||
| Lobularia maritima | POS | NEG | [489] | ||
| Lolium species | POS | [490] | |||
| Lolium multiflorum | POS | POS | [39,491] | ||
| L. perenne | POS | [491] | |||
| Lycium ruthenicum | POS | NEG | [492] | ||
| Malus × domestica | POS | POS | [138] | ||
| Mentha canadensis | POS | NEG | [493] | ||
| Medicago sativa | POS | NEG | [494] | ||
| Miscanthus species | POS | POS | [399,495] | ||
| Morus alba | POS | NEG | [496] | ||
| Musa species | POS | NEG | [497] | ||
| Musa acuminata | POS | NEG | [498] | ||
| Nicotiana species | POS | NEG | POS | [40] | |
| Nigella sativa | POS | POS | [400] | ||
| Ocimum basilicum | POS | NEG | POS | [401] | |
| O. kilimandscharicum | POS | NEG | [499] | ||
| Onosma species | POS | [500] | |||
| Opuntia mesacantha | POS | [501] | |||
| Oryza sativa | POS | [502] | |||
| Paeonia varieties | POS | [503] | |||
| Papaver bracteatum | POS | NEG | [504] | ||
| Paulownia tomentosa | POS | NEG | [505] | ||
| Pennisetum species | POS | NEG | [506] | ||
| Petroselinum crispum | POS | NEG | [507] | ||
| Phaseolus vulgaris | POS | NEG | POS | [404] | |
| Phleum species | POS | [508] | |||
| Phlox amabilis | POS | POS | [405] | ||
| Physalis species | POS | POS | [406] | ||
| Pinellia ternate | POS | NEG | [509] | ||
| Plantago media | POS | POS | NEG | [407] | |
| P. ovata | POS | POS | POS | [408] | |
| P. psyllium | POS | NEG | POS | [409] | |
| Platanus acerifolia | POS | NEG | [510] | ||
| Plumbago auricalata | POS | NEG | [511] | ||
| Pogostemon cablin | POS | NEG | [512] | ||
| Poncirus trifoliata | POS | [513] | |||
| Populus varieties | POS | [514] | |||
| Populus tremuloides | POS | [305] | |||
| Primula sieboldii | POS | [515] | |||
| Pyrus pyrifolia | POS | POS | NEG | [140] | |
| Ramonda species | POS | [141] | |||
| Raphanus sativus | POS | POS | [410,516] | ||
| Rhododendron fortunei | POS | NEG | [517] | ||
| Ricinus communis | POS | POS | [518] | ||
| Robinia pseudoacacia | POS | NEG | [519] | ||
| Salix species | POS | [520] | |||
| Salix viminalis | POS | [521] | |||
| Salvia officinalis | POS | NEG | [522] | ||
| Secale cereale, Triticum aestivum and hybrids | POS | NEG | [523] | ||
| Sesamum indicum | POS | NEG | POS | [412] | |
| Solanaceae | POS | [524] | |||
| Setaria italica | POS | NEG | [525] | ||
| Solanum phurela | POS | [526] | |||
| Sorghum bicolor | POS | NEG | [527,528] | ||
| Spathiphylum walisii | POS | NEG | [529] | ||
| Tagetes erecta | POS | NEG | [530,531] | ||
| Tanacetum parthenium | POS | NEG | POS | [413] | |
| Taraxacum species | POS | NO | [532] | ||
| Thalictrum alpinum | POS | NEG | [533] | ||
| Themeda triandra | POS | NO/POS 4 | [534] | ||
| Thymus persicus | POS | NEG | [535] | ||
| Tradescantia canaliculata | POS | NEG | [190] | ||
| Trachyspermum ammi | POS | NEG | POS | NEG | [414,415] |
| Trichosanthes dioica | NEG | [536] | |||
| Trifolium species | POS | POS | [416] | ||
| Tripleurospermum species | POS | [537] | |||
| Triticum species | POS | NEG | POS | [538,539] | |
| Vanilla planifolia | POS | [540] | |||
| Viburnum species | POS | NEG | [541] | ||
| Vicia cracca | POS | [542] | |||
| V. faba | POS | NEG | [543] | ||
| V. villosa | POS | NEG | POS | [417] | |
| Vigna species | POS | NEG | POS | [418] | |
| Viola × wittrockiana | POS | NEG | [419] | ||
| Zantedeschia varieties | POS | [544] | |||
| Zea mays | POS | [545] | |||
| Zingiber officinale | POS | [546] | |||
| Ziziphus jujuba | POS | NEG | POS | [420,547] | |
| INVERTEBRATE ANIMALS | |||||
| Mollusca | |||||
| Bivalvia | |||||
| Crassostrea gigas | POS | NEG | [146] | ||
| Mulinia lateralis | POS | NEG | [217] | ||
| Gastropoda | |||||
| Bulinus | POS | [548] | |||
| Potamopyrgus antipodarum | POS | [549] | |||
| Arthropoda | |||||
| Crustacea | |||||
| Anostraca | |||||
| Artemia parthenogenetica | NEG | [550] | |||
| A. salina | POS | NO/NEG5 | [551] | ||
| Cladocera | |||||
| Daphnia pulex complex | POS | NEG | [218,313] | ||
| Decapoda | |||||
| Penaeus chinensis | POS | NEG | [204] | ||
| Insecta | |||||
| Bombyx mori | POS | NEG | POS | [421,552] | |
| VERTEBRATE ANIMALS | |||||
| Actinopterygii (ray-finned fishes) | POS | [553,554] | |||
| Acipenser baeri | POS | [555] | |||
| Carassius auratus | POS | [556,557] | |||
| C. gibelio | POS | NEG | [558] | ||
| Cobitus species | POS | POS | NEG | [222,314] | |
| Cobitis biwae | POS | [559] | |||
| Ctenopharyngodon idella × Hypophthalmichthys nobilis hybrids | POS | [560] | |||
| Cyprinus carpio | POS | NEG | [561] | ||
| Danio rerio | POS | NEG | [562,563] | ||
| Dicentrarchus labrax | POS | [564] | |||
| Gasterosteus aculeatus | POS | NEG | [199] | ||
| Ictalurus punctatus | POS | [565] | |||
| Misgurnus anguillicaudatus | POS | [422] | |||
| M. fossilis | POS | [566] | |||
| M. mizolepis | POS | [567] | |||
| Oncorhynchus kisutch | POS | NEG | POS | [568,569] | |
| O. mykiss | POS | NEG | [570,571] | ||
| Oreochromis varieties | POS | [572] | |||
| Oreochromis aureus | POS | [573] | |||
| Plecoglossus altivelis | POS | NEG | [574] | ||
| Pleuronectes platessa | POS | NEG | [575,576] | ||
| Poeciliopsis species | POS | [577] | |||
| Pomoxis annularis | POS | [578] | |||
| Rhodeus ocellatus | POS | NEG | [579] | ||
| Salmo gairdneri | POS | [580] | |||
| S. salar | POS | NEG | [568,581] | ||
| S. trutta | POS | [582] | |||
| Salvelinus fontinalis | POS | [583] | |||
| Stizostedion varieties | POS | [584] | |||
| Tilapia aurea | POS | [585] | |||
| Tinca tinca | POS | NEG | [586] | ||
| Anura (frogs) | |||||
| Bufo viridis complex | POS | [587] | |||
| Hyla species | POS | [588] | |||
| Hyla versicolor complex | POS | POS | [589,590] | ||
| Neobatrachus species | POS | [200] | |||
| Odontophrynus species | POS | [591] | |||
| Odontophrynus americanus | POS | [592] | |||
| Pleurodema species | POS | [591] | |||
| Pelophylax (Rana) species | POS | [593] | |||
| Pelophylax esculentus | POS | [284] | |||
| Xenopus laevis | POS | [594] | |||
| Caudata (salamanders) | |||||
| Ambystoma species | POS | NEG | [595] | ||
| Ambystoma jeffersonianum complex | POS | [596] | |||
| Ambystoma laterale-texanum hybrid complex | POS | [347] | |||
| Triturus viridescens | POS | NEG | [196,597] | ||
| Mammalia | |||||
| Rodentia | POS | [153] | |||
| Mus musculus | POS | NEG | [197,198,202,258] |
Appendix B
| Species | MJ | MA | Source |
|---|---|---|---|
| COPEPODA | |||
| Acartia clausi | 0.2243 (N) | [598] | |
| A. hudsonii | 0.063 | [599] | |
| A. tonsa | 0.7606 (N) | 0.6 | [598,599,600] |
| Calanus glacialis | 0.11 (C) | [601] | |
| C. finmarchicus | 0.13 (N) | 0.102 | [602,603,604,605,606] |
| 0.097 (C) | |||
| C. helgolandicus | 0.426 (N) | 0.1175 | [598,602,607] |
| C. pacificus | 0.065 | [608] | |
| C. spp. | 0.0975 (N) | [609] | |
| 0.052 (C) | |||
| Centropages typicus | 0.2398 (N) | [598] | |
| Clausocalanus furcatus | 1.0165 (N) | 0.485 | [603] |
| 0.314 (C) | |||
| Diaptomus clavipes | 0.365 (N) | 0.23 | [603] |
| 0.014 (C) | |||
| D. negrensis | 0.53 (N) | 0.80 | [603] |
| 0.878 (C) | |||
| Eurytemora affinus | 1.01 (N) | 0.265 | [598,599,600] |
| Euterpina acutifrons | 0.2322 (N) | [598] | |
| Oithona amazonica | 0.11 (N) | 1.2 | [603] |
| 0.844 (C) | |||
| O. helolandica | 0.1233 (N) | [598] | |
| O. nana | 0.0399 (N) | [598] | |
| O. similis | 0.0194 (N) | 0.0718 | [601,603,609,610] |
| 0.02 (C) | |||
| Paracalanus parvus | 0.0874 (N) | [598] | |
| Pseudocalanus elongatus | 0.04 (N) | [611] | |
| 0.03 (C) | |||
| P. newmani | 0.11 (N) | 0.0965 | [612,613] |
| P. sp. | 0.05 (N) | [600] | |
| 0.05 (C) | |||
| DECAPODA | |||
| (Shrimp) | |||
| Acetes japonicas | 0.00644 | [614] | |
| Crangon crangon | 0.00945 | [615,616] | |
| Litopeneaus schmitti | 0.00662 | [617] | |
| Macrobrachium equidens | 0.00737 | [618] | |
| M. macrobrachion | 0.0092 | [619] | |
| M. völlenhovenii | 0.00764 | [620,621] | |
| Palaemon adspersus | 0.00593 | [622] | |
| Pandalus jordani | 0.04865 (Z) | 0.00436 | [600,623,624] |
| P. borealis | 0.00253 | [625,626] | |
| Penaeus duorarum | 0.22 (Z) | [600] | |
| P. latisulcatus | 0.00386 | [627,628] | |
| P. semisulcatus | 0.00658 | [629] | |
| (Lobsters) | |||
| Panulirus interruptus | 0.018 (Z) | [600] | |
| P. penicillatus | 0.000986 | [630] | |
| (Crayfish) | |||
| Astacus leptodactylus | 0.00158 | [631] | |
| (Crabs) | |||
| Callinectes sapidus | 0.00240 | [632] | |
| Cancer magister | 0.0161 (Z) | 0.00440 | [600,633,634] |
| C. pagurus | 0.00155 | [635] | |
| Chionoecetes bairdi | 0.000562 | [636] | |
| C. opilio | 0.00146 | [636,637,638] | |
| Lithodes aequispinus | 0.00145 | [639] | |
| Pagurus spp. | 0.062 (L) | [640] | |
| Paralithodes camptschaticus | 0.00140 | [639,641] | |
| P. platypus | 0.000515 | [639] |
References
- Greilhuber, J.; Doležel, J.; Lysak, M.A.; Bennett, M.D. The origin, evolution and proposed stabilization of the terms ‘genome size’and ‘C-value’ to describe nuclear DNA contents. Ann. Bot. 2005, 95, 255–260. [Google Scholar] [CrossRef] [PubMed]
- Peters, R.H. The Ecological Implications of Body Size; Cambridge University Press: Cambridge, UK, 1983. [Google Scholar]
- Calder, W.A. Size, Function and Life History; Harvard University Press: Cambridge, MA, USA, 1984. [Google Scholar]
- Schmidt-Nielsen, K. Scaling: Why Is Animal Size So Important? Cambridge University Press: New York, NY, USA, 1984. [Google Scholar]
- Niklas, J.T. Plant. Allometry: The Scaling of Form and Process; University of Chicago Press: Chicago, IL, USA, 1994. [Google Scholar]
- Bonner, J.T. Why Size Matters; Princeton University Press: Princeton, NJ, USA, 2006. [Google Scholar]
- Gregory, T.R. Coincidence, coevolution, or causation? DNA content, cell size, and the C-value enigma. Biol. Rev. 2001, 76, 65–101. [Google Scholar] [CrossRef]
- Gregory, T.R. Genome size evolution in animals. In The Evolution of the Genome; Gregory, T.R., Ed.; Elsevier Academic Press: Burlington, MA, USA, 2005; pp. 3–87. [Google Scholar]
- Bennett, M.D.; Leitch, I.J. Genome size evolution in plants. In The Evolution of the Genome; Gregory, T.R., Ed.; Elsevier Academic Press: Burlington, MA, USA, 2005; pp. 89–162. [Google Scholar]
- Knight, C.A.; Beaulieu, J.M. Genome size scaling through phenotype space. Ann. Bot. 2008, 101, 759–766. [Google Scholar] [CrossRef] [Green Version]
- Patrushev, L.I.; Minkevich, I.G. The problem of the eukaryotic genome size. Biochemistry 2008, 73, 1519–1552. [Google Scholar] [CrossRef] [PubMed]
- Münzbergová, Z. The effect of genome size on detailed species traits within closely related species of the same habitat. Bot. J. Linn. Soc. 2009, 160, 290–298. [Google Scholar] [CrossRef]
- Mirsky, A.E.; Ris, H. The desoxyribonucleic acid content of animal cells and its evolutionary significance. J. Gen. Physiol. 1951, 34, 451–462. [Google Scholar] [CrossRef] [Green Version]
- Elliott, T.A.; Gregory, T.R. What’s in a genome? The C-value enigma and the evolution of eukaryotic genome content. Phil. Trans. R. Soc. B Biol. Sci. 2015, 370, 20140331. [Google Scholar] [CrossRef]
- Cavalier-Smith, T. Nuclear volume control by nucleoskeletal DNA, selection for cell volume and cell growth rate, and the solution of the DNA C-value paradox. J. Cell. Sci. 1978, 34, 247–278. [Google Scholar]
- Cavalier-Smith, T. Skeletal DNA and the evolution of genome size. Annu. Rev. Biophys. Bioeng. 1982, 11, 273–302. [Google Scholar] [CrossRef]
- Lynch, M. The Origins of Genome Architecture; Sinauer Associates: Sunderland, MA, USA, 2007. [Google Scholar]
- Markov, A.V.; Anisimov, V.A.; Korotayev, A.V. Relationship between genome size and organismal complexity in the lineage leading from prokaryotes to mammals. Paleontol. J. 2010, 44, 363–373. [Google Scholar] [CrossRef]
- Shuter, B.J.; Thomas, J.E.; Taylor, W.D.; Zimmerman, A.M. Phenotypic correlates of genomic DNA content in unicellular eukaryotes and other cells. Am. Nat. 1983, 122, 26–44. [Google Scholar] [CrossRef]
- Cavalier-Smith, T. Economy, speed and size matter: Evolutionary forces driving nuclear genome miniaturization and expansion. Ann. Bot. 2005, 95, 147–175. [Google Scholar] [CrossRef] [Green Version]
- Gasol, J.M.; Zweifel, U.L.; Peters, F.; Fuhrman, J.A.; Hagström, Å. Significance of size and nucleic acid content heterogeneity as measured by flow cytometry in natural planktonic bacteria. Appl. Environ. Microbiol. 1999, 65, 4475–4483. [Google Scholar] [CrossRef] [Green Version]
- Akerlund, T.; Nordström, K.; Bernander, R. Analysis of cell size and DNA content in exponentially growing and stationary-phase batch cultures of Escherichia coli. J. Bacteriol. 1995, 177, 6791–6797. [Google Scholar] [CrossRef] [Green Version]
- Holm-Hansen, O. Algae: Amounts of DNA and organic carbon in single cells. Science 1969, 163, 87–88. [Google Scholar] [CrossRef]
- Boucher, N.; Vaulot, D.; Partensky, F. Flow cytometric determination of phytoplankton DNA in cultures and oceanic populations. Mar. Ecol. Prog. Ser. 1991, 71, 75–84. [Google Scholar] [CrossRef]
- Veldhuis, M.J.W.; Cucci, T.L.; Sieracki, M.E. Cellular DNA content of marine phytoplankton using two new fluorochromes: Taxonomic and ecological implications. J. Phycol. 1997, 33, 527–541. [Google Scholar] [CrossRef]
- Malerba, M.E.; Ghedini, G.; Marshall, D.J. Genome size affects fitness in the eukaryotic alga Dunaliella tertiolecta. Curr. Biol. 2020, 30, 3450–3456. [Google Scholar] [CrossRef] [PubMed]
- Connolly, J.A.; Oliver, M.J.; Beaulieu, J.M.; Knight, C.A.; Tomanek, L.; Moline, M.A. Correlated evolution of genome size and cell volume in diatoms (Bacillariophyceae). J. Phycol. 2008, 44, 124–131. [Google Scholar] [CrossRef] [Green Version]
- Sharpe, S.C.; Koester, J.A.; Loebl, M.; Cockshutt, A.M.; Campbell, D.A.; Irwin, A.J.; Finkel, Z.V. Influence of cell size and DNA content on growth rate and photosystem II function in cryptic species of Ditylum brightwellii. PLoS ONE 2012, 7, e52916. [Google Scholar] [CrossRef] [PubMed] [Green Version]
- Von Dassow, P.; Petersen, T.W.; Chepurnov, V.A.; Virginia Armbrust, E. Inter- and intraspecific relationships between nuclear DNA content and cell size in selected members of the centric diatom genus Thalassiosira (Bacillariophyceae). J. Phycol. 2008, 44, 335–349. [Google Scholar] [CrossRef]
- LaJeunesse, T.C.; Lambert, G.; Andersen, R.A.; Coffroth, M.A.; Galbraith, D.W. Symbiodinium (Pyrrhophyta) genome sizes (DNA content) are smallest among dinoflagellates. J. Phycol. 2005, 41, 880–886. [Google Scholar] [CrossRef]
- Cavalier-Smith, T. Cell volume and the evolution of eukaryotic genome size. In The Evolution of Genome Size; Cavalier-Smith, T., Ed.; Wiley: Chichester, UK, 1985; pp. 104–184. [Google Scholar]
- Wickham, S.A.; Lynn, D.H. Relations between growth rate, cell size, and DNA content in colpodean ciliates (Ciliophora: Colpodea). Eur. J. Protistol. 1990, 25, 345–352. [Google Scholar] [CrossRef]
- McGrath, C.L.; Zufall, R.A.; Katz, L.A. Ciliate genome evolution. In Genomics and Evolution of Microbial Eukaryotes; Katz, L.A., Bhattacharya, D., Eds.; Oxford University Press: Oxford, UK, 2006; pp. 64–77. [Google Scholar]
- Slabodnick, M.M.; Ruby, J.G.; Reiff, S.B.; Swart, E.C.; Gosai, S.; Prabakaran, S.; Witkowska, E.; Larue, G.E.; Fisher, S.; Freeman, R.M., Jr.; et al. The macronuclear genome of Stentor coeruleus reveals tiny introns in a giant cell. Curr. Biol. 2017, 27, 569–575. [Google Scholar] [CrossRef] [PubMed] [Green Version]
- Henry, T.A.; Bainard, J.D.; Newmaster, S.G. Genome size evolution in Ontario ferns (Polypodiidae): Evolutionary correlations with cell size, spore size, and habitat type and an absence of genome downsizing. Genome 2014, 57, 555–566. [Google Scholar] [CrossRef] [PubMed]
- Herben, T.; Suda, J.; Klimešová, J.; Mihulka, S.; Říha, P.; Šímová, I. Ecological effects of cell-level processes: Genome size, functional traits and regional abundance of herbaceous plant species. Ann. Bot. 2012, 110, 1357–1367. [Google Scholar] [CrossRef] [Green Version]
- Gallagher, R.V.; Leishman, M.R.; Miller, J.T.; Hui, C.; Richardson, D.M.; Suda, J.; Trávníček, P. Invasiveness in introduced Australian acacias: The role of species traits and genome size. Divers. Distrib. 2011, 17, 884–897. [Google Scholar] [CrossRef]
- Basak, S.; Sun, X.; Wang, G.; Yang, Y. Genome size unaffected by variation in morphological traits, temperature, and precipitation in turnip. Appl. Sci. 2019, 9, 253. [Google Scholar] [CrossRef] [Green Version]
- Rios, E.F.; Kenworthy, K.E.; Munoz, P.R. Association of phenotypic traits with ploidy and genome size in annual ryegrass. Crop. Sci. 2015, 55, 2078–2090. [Google Scholar] [CrossRef]
- Anssour, S.; Krügel, T.; Sharbel, T.F.; Saluz, H.P.; Bonaventure, G.; Baldwin, I.T. Phenotypic, genetic and genomic consequences of natural and synthetic polyploidization of Nicotiana attenuata and Nicotiana obtusifolia. Ann. Bot. 2009, 103, 1207–1217. [Google Scholar] [CrossRef] [Green Version]
- Lawrence, M.E.; Senecio, L. (Asteraceae) in Australia: Nuclear DNA amounts. Aust. J. Bot. 1985, 33, 221–232. [Google Scholar] [CrossRef]
- Minelli, S.; Moscariello, P.; Ceccarelli, M.; Cionini, P.G. Nucleotype and phenotype in Vicia faba. Heredity 1996, 76, 524–530. [Google Scholar] [CrossRef]
- Biradar, D.P.; Bullock, D.G.; Rayburn, A.L. Nuclear DNA amount, growth, and yield parameters in maize. Appl. Genet. 1994, 88, 557–560. [Google Scholar] [CrossRef]
- Gregory, T.R.; Hebert, P.D.; Kolasa, J. Evolutionary implications of the relationship between genome size and body size in flatworms and copepods. Heredity 2000, 84, 201–208. [Google Scholar] [CrossRef] [PubMed]
- Flemming, A.J.; Shen, Z.Z.; Cunha, A.; Emmons, S.W.; Leroi, A.M. Somatic polyploidization and cellular proliferation drive body size evolution in nematodes. Proc. Natl. Acad. Sci. USA 2000, 97, 5285–5290. [Google Scholar] [CrossRef] [PubMed] [Green Version]
- Stelzer, C.P. A first assessment of genome size diversity in Monogonont rotifers. Hydrobiologia 2011, 662, 77–82. [Google Scholar] [CrossRef] [Green Version]
- Stelzer, C.P.; Riss, S.; Stadler, P. Genome size evolution at the speciation level: The cryptic species complex Brachionus plicatilis (Rotifera). BMC Evol. Biol. 2011, 11, 90. [Google Scholar] [CrossRef] [PubMed] [Green Version]
- Beaudreau, N.; Massamba-N’Siala, G.; Belzile, C.; Calosi, P.; Dufresne, F. Life-history traits display strong associations to genome size in annelids. Hydrobiologia 2021, 848, 799–810. [Google Scholar] [CrossRef]
- Gregory, T.R.; Hebert, P.D. Genome size estimates for some oligochaete annelids. Can. J. Zool. 2002, 80, 1485–1489. [Google Scholar] [CrossRef]
- Gambi, M.C.; Ramella, L.; Sella, G.; Protto, P.; Aldieri, E. Variation in genome size in benthic polychaetes: Systematic and ecological relationships. J. Mar. Biol. Assoc. UK 1997, 77, 1045–1058. [Google Scholar] [CrossRef]
- Sella, G.; Redi, C.A.; Ramella, L.; Soldi, R.; Premoli, M.C. Genome size and karyotype length in some interstitial polychaete species of the genus Ophryotrocha (Dorvilleidae). Genome 1993, 36, 652–657. [Google Scholar] [CrossRef]
- Hinegardner, R. Cellular DNA content of the Mollusca. Comp. Biochem. Physiol. 1974, 47A, 447–460. [Google Scholar] [CrossRef]
- Vinogradov, A.E. Variation in ligand-accessible genome size and its ecomorphological correlates in a pond snail. Hereditas 1998, 128, 59–65. [Google Scholar] [CrossRef]
- Yorke, H. Exploring Genome Size Diversity in Arachnid Taxa. Master’s Thesis, University of Guelph, Guelph, ON, Canada, January 2020. [Google Scholar]
- Gregory, T.R.; Young, M.R. Small genomes in most mites (but not ticks). Int. J. Acarol. 2020, 46, 1–8. [Google Scholar] [CrossRef]
- Gregory, T.R.; Shorthouse, D.P. Genome sizes of spiders. J. Hered. 2003, 94, 285–290. [Google Scholar] [CrossRef]
- Hessen, D.O.; Persson, J. Genome size as a determinant of growth and life-history traits in crustaceans. Biol. J. Linn. Soc. 2009, 98, 393–399. [Google Scholar] [CrossRef] [Green Version]
- McLaren, I.A.; Sevigny, J.M.; Corkett, C.J. Body sizes, development rates, and genome sizes among Calanus species. Hydrobiologia 1988, 167/168, 275–284. [Google Scholar] [CrossRef]
- McLaren, I.A.; Sévigny, J.M.; Frost, B.W. Evolutionary and ecological significance of genome sizes in the copepod genus Pseudocalanus. Can. J. Zool. 1989, 67, 565–569. [Google Scholar] [CrossRef]
- Wyngaard, G.A.; Rasch, E.M.; Manning, N.M.; Gasser, K.; Domangue, R. The relationship between genome size, development rate, and body size in copepods. Hydrobiologia 2005, 532, 123–137. [Google Scholar] [CrossRef]
- Leinaas, H.P.; Jalal, M.; Gabrielsen, T.M.; Hessen, D.O. Inter-and intraspecific variation in body-and genome size in calanoid copepods from temperate and arctic waters. Ecol. Evol. 2016, 6, 5585–5595. [Google Scholar] [CrossRef] [Green Version]
- Hultgren, K.M.; Jeffery, N.W.; Moran, A.; Gregory, T.R. Latitudinal variation in genome size in crustaceans. Biol. J. Linn. Soc. 2018, 123, 348–359. [Google Scholar] [CrossRef]
- Jeffery, N.W.; Hultgren, K.; Chak, S.T.C.; Gregory, T.R.; Rubenstein, D.R. Patterns of genome size variation in snapping shrimp. Genome 2016, 59, 393–402. [Google Scholar] [CrossRef] [PubMed] [Green Version]
- Jeffery, N.W.; Ellis, E.A.; Oakley, T.H.; Gregory, T.R. The genome sizes of ostracod crustaceans correlate with body size and evolutionary history, but not environment. J. Hered. 2017, 108, 701–706. [Google Scholar] [CrossRef] [Green Version]
- Jeffery, N.W.; Yampolsky, L.; Gregory, T.R. Nuclear DNA content correlates with depth, body size, and diversification rate in amphipod crustaceans from ancient Lake Baikal, Russia. Genome 2017, 60, 303–309. [Google Scholar] [CrossRef] [PubMed] [Green Version]
- Ritchie, H.; Jamieson, A.J.; Piertney, S.B. Genome size variation in deep-sea amphipods. R Soc. Open Sci. 2017, 4, 170862. [Google Scholar] [CrossRef] [Green Version]
- Kelly, D.J. A Survey of Genome Size Diversity within Scale Insects (Hemiptera: Coccoidea) and Cockroaches and Termites (Blattodea). Master’s Thesis, University of Guelph, Guelph, ON, Canada, May 2018. [Google Scholar]
- Petitpierre, E.; Juan, C. Genome size, chromosomes and egg-chorion ultrastructure in the evolution of Chrysomelinae. Ser. Entomol. 1994, 50, 213–225. [Google Scholar] [CrossRef]
- Gregory, T.R.; Nedved, O.; Adamowicz, S.J. C-value estimates for 31 species of ladybird beetles (Coleoptera: Coccinellidae). Hereditas 2003, 139, 121–127. [Google Scholar] [CrossRef] [PubMed]
- Liu, G.C.; Dong, Z.W.; He, J.W.; Zhao, R.P.; Wang, W.; Li, X.Y. Genome size of 14 species of fireflies (Insecta, Coleoptera, Lampyridae). Zool. Res. 2017, 38, 449–458. [Google Scholar] [CrossRef] [Green Version]
- Lower, S.S.; Johnston, J.S.; Stanger-Hall, K.F.; Hjelmen, C.E.; Hanrahan, S.J.; Korunes, K.; Hall, D. Genome size in North American fireflies: Substantial variation likely driven by neutral processes. Genome Biol. Evol. 2017, 9, 1499–1512. [Google Scholar] [CrossRef]
- Juan, C.; Petitpierre, E. Evolution of genome size in darkling beetles (Tenebrionidae, Coleoptera). Genome 1991, 34, 169–173. [Google Scholar] [CrossRef]
- Palmer, M.; Petitpierre, E. Relationship of genome size to body size in Phylan semicostatus (Coleoptera: Tenebrionidae). Ann. Ent. Soc. Am. 1996, 89, 221–225. [Google Scholar] [CrossRef]
- Palmer, M.; Petitpierre, E.; Pons, J. Test of the correlation between body size and DNA content in Pimelia (Coleoptera: Tenebrionidae) from the Canary Islands. Eur. J. Entomol. 2003, 100, 123–129. [Google Scholar] [CrossRef] [Green Version]
- Alvarez-Fuster, A.; Juan, C.; Petitpierre, E. Genome size in Tribolium flour-beetles: Inter-and intraspecific variation. Genet. Res. 1991, 58, 1–5. [Google Scholar] [CrossRef] [Green Version]
- Cornette, R.; Gusev, O.; Nakahara, Y.; Shimura, S.; Kikawada, T.; Okuda, T. Chironomid midges (Diptera, Chironomidae) show extremely small genome sizes. Zool. Sci. 2015, 32, 248–254. [Google Scholar] [CrossRef]
- Ferrari, J.A.; Rai, K.S. Phenotypic correlates of genome size variation in Aedes albopictus. Evolution 1989, 43, 895–899. [Google Scholar] [CrossRef] [PubMed]
- Craddock, E.M.; Gall, J.G.; Jonas, M. Hawaiian Drosophila genomes: Size variation and evolutionary expansions. Genetica 2016, 144, 107–124. [Google Scholar] [CrossRef]
- Gregory, T.R.; Johnston, J.S. Genome size diversity in the family Drosophilidae. Heredity 2008, 101, 228–238. [Google Scholar] [CrossRef] [Green Version]
- Ellis, L.L.; Huang, W.; Quinn, A.M.; Ahuja, A.; Alfrejd, B.; Gomez, F.E.; Hjelmen, C.E.; Moore, K.L.; Mackay, T.F.; Johnston, J.S.; et al. Intrapopulation genome size variation in D. melanogaster reflects life history variation and plasticity. PLoS Genet. 2014, 10, e1004522. [Google Scholar] [CrossRef] [PubMed] [Green Version]
- Tavares, M.G.; Carvalho, C.R.; Soares, F.A.F. Genome size variation in Melipona species (Hymenoptera: Apidae) and sub-grouping by their DNA content. Apidologie 2010, 41, 636–642. [Google Scholar] [CrossRef]
- Tsutsui, N.D.; Suarez, A.V.; Spagna, J.C.; Johnston, J.S. The evolution of genome size in ants. BMC Evol. Biol. 2008, 8, 64. [Google Scholar] [CrossRef] [PubMed] [Green Version]
- Finston, T.L.; Hebert, P.D.; Foottit, R.B. Genome size variation in aphids. Insect Biochem. Mol. Biol. 1995, 25, 189–196. [Google Scholar] [CrossRef]
- Gregory, T.R.; Hebert, P.D. Genome size variation in lepidopteran insects. Can. J. Zool. 2003, 81, 1399–1405. [Google Scholar] [CrossRef]
- Miller, W.E. Phenotypic correlates of genome size in Lepidoptera. J. Lepid. Soc. 2014, 68, 203–210. [Google Scholar] [CrossRef]
- Ardila-Garcia, A.M.; Gregory, T.R. An exploration of genome size diversity in dragonflies and damselflies (Insecta: Odonata). J. Zool. 2009, 278, 163–173. [Google Scholar] [CrossRef]
- Smith, E.M.; Gregory, T.R. Patterns of genome size diversity in the ray-finned fishes. Hydrobiologia 2009, 625, 1–25. [Google Scholar] [CrossRef]
- Gold, J.R.; Amemiya, C.T. Genome size variation in North American minnows (Cyprinidae). II. Variation among 20 species. Genome 1987, 29, 481–489. [Google Scholar] [CrossRef] [PubMed]
- Organ, C.L.; Shedlock, A.M. Palaeogenomics of pterosaurs and the evolution of small genome size in flying vertebrates. Biol. Lett. 2009, 5, 47–50. [Google Scholar] [CrossRef] [Green Version]
- Liedtke, H.C.; Gower, D.J.; Wilkinson, M.; Gomez-Mestre, I. Macroevolutionary shift in the size of amphibian genomes and the role of life history and climate. Nat. Ecol. Evol. 2018, 2, 1792–1799. [Google Scholar] [CrossRef] [PubMed]
- Miller, K.E.; Brownlee, C.; Heald, R. The power of amphibians to elucidate mechanisms of size control and scaling. Exp. Cell Res. 2020, 392, 112036. [Google Scholar] [CrossRef] [PubMed]
- Sclavi, B.; Herrick, J. Genome size variation and species diversity in salamanders. J. Evol. Biol. 2019, 32, 278–286. [Google Scholar] [CrossRef]
- Decena-Segarra, L.P.; Bizjak-Mali, L.; Kladnik, A.; Sessions, S.K.; Rovito, S.M. Miniaturization, genome size, and biological size in a diverse clade of salamanders. Am. Nat. 2020, 196. [Google Scholar] [CrossRef] [PubMed]
- Organ, C.L.; Brusatte, S.L.; Stein, K. Sauropod dinosaurs evolved moderately sized genomes unrelated to body size. Proc. R. Soc. B Biol. Sci. 2009, 276, 4303–4308. [Google Scholar] [CrossRef] [Green Version]
- Gregory, T.R. Genome size and developmental parameters in the homeothermic vertebrates. Genome 2002, 45, 833–838. [Google Scholar] [CrossRef] [PubMed]
- Ji, Y.; DeWoody, J.A. Relationships among powered flight, metabolic rate, body mass, genome size, and the retrotransposon complement of volant birds. Evol. Biol. 2017, 44, 261–272. [Google Scholar] [CrossRef]
- Yu, J.P.; Liu, W.; Mai, C.L.; Liao, W.B. Genome size variation is associated with life-history traits in birds. J. Zool. 2020, 310, 255–260. [Google Scholar] [CrossRef]
- Tang, Y.; Mai, C.L.; Yu, J.P. Investigating the role of life-history traits in mammalian genomes. Anim. Biol. 2019, 70, 121–130. [Google Scholar] [CrossRef]
- Smith, J.D.; Bickham, J.W.; Gregory, T.R. Patterns of genome size diversity in bats (order Chiroptera). Genome 2013, 56, 457–472. [Google Scholar] [CrossRef] [PubMed]
- Smith, J.D.; Gregory, T.R. The genome sizes of megabats (Chiroptera: Pteropodidae) are remarkably constrained. Biol. Lett. 2009, 5, 347–351. [Google Scholar] [CrossRef] [PubMed]
- Glazier, D.S. Clutch mass, offspring mass, and clutch size: Body mass scaling and taxonomic and environmental variation. In The Natural History of the Crustacea; Wellborn, G.A., Thiel, M., Eds.; Oxford University Press: New York, NY, USA, 2018; Volume 5, pp. 67–95. [Google Scholar]
- Gregory, T.R. Animal Genome Size Database. 2020. Available online: http://www.genomesize.com/ (accessed on 17 September 2020).
- Hessen, D.O.; Daufresne, M.; Leinaas, H.P. Temperature-size relations from the cellular-genomic perspective. Biol. Rev. 2013, 88, 476–489. [Google Scholar] [CrossRef]
- Kerkhoff, A.J.; Enquist, B. Multiplicative by nature: Why logarithmic transformation is necessary in allometry. J. Theor. Biol. 2009, 257, 519–521. [Google Scholar] [CrossRef]
- Glazier, D.S. Log-transformation is useful for examining proportional relationships in allometric scaling. J. Theor. Biol. 2013, 334, 200–203. [Google Scholar] [CrossRef]
- Renzaglia, K.S.; Rasch, E.M.; Pike, L.M. Estimates of nuclear DNA content in bryophyte sperm cells: Phylogenetic considerations. Am. J. Bot. 1995, 82, 18–25. [Google Scholar] [CrossRef]
- Barrington, D.S.; Patel, N.R.; Southgate, M.W. Inferring the impacts of evolutionary history and ecological constraints on spore size and shape in the ferns. Appl. Plant Sci. 2020, 8, e11339. [Google Scholar] [CrossRef] [PubMed] [Green Version]
- Murray, B.G. Nuclear DNA amounts in gymnosperms. Ann. Bot. 1998, 82, 3–15. [Google Scholar] [CrossRef] [Green Version]
- Beaulieu, J.M.; Moles, A.T.; Leitch, I.J.; Bennett, M.D.; Dickie, J.B.; Knight, C.A. Correlated evolution of genome size and seed mass. New Phytol. 2006, 173, 422–437. [Google Scholar] [CrossRef] [Green Version]
- Ohri, D.; Khoshoo, T.N. Genome size in gymnosperms. Plant Syst. Evol. 1986, 153, 119–132. [Google Scholar] [CrossRef]
- Wakamiya, I.; Newton, R.J.; Johnston, J.S.; Price, H.J. Genome size and environmental factors in the genus Pinus. Am. J. Bot. 1993, 80, 1235–1241. [Google Scholar] [CrossRef]
- Grotkopp, E.; Rejmánek, M.; Sanderson, M.J.; Rost, T.L. Evolution of genome size in pines (Pinus) and its life-history correlates: Supertree analyses. Evolution 2004, 58, 1705–1729. [Google Scholar] [CrossRef] [PubMed]
- Bennett, M.D. Nuclear DNA content and minimum generation time in herbaceous plants. Proc. R. Soc. B Biol. Sci. 1972, 181, 109–135. [Google Scholar] [CrossRef]
- Kirk, W.D.J. Interspecific size and number variation in pollen grains and seeds. Biol. J. Linn. Soc. 1993, 49, 239–248. [Google Scholar] [CrossRef]
- Knight, C.A.; Clancy, R.B.; Götzenberger, L.; Dann, L.; Beaulieu, J.M. On the relationship between pollen size and genome size. J. Bot. 2010, 612017. [Google Scholar] [CrossRef] [Green Version]
- Šímová, I.; Herben, T. Geometrical constraints in the scaling relationships between genome size, cell size and cell cycle length in herbaceous plants. Proc. R. Soc. B Biol. Sci. 2012, 279, 867–875. [Google Scholar] [CrossRef] [PubMed] [Green Version]
- Thompson, K. Genome size, seed size and germination temperature in herbaceous angiosperms. Evol. Trends Plants 1990, 4, 113–116. [Google Scholar]
- Knight, C.A.; Molinari, N.A.; Petrov, D.A. The large genome constraint hypothesis: Evolution, ecology and phenotype. Ann. Bot. 2005, 95, 177–190. [Google Scholar] [CrossRef] [PubMed] [Green Version]
- Veselý, P.; Bureš, P.; Šmarda, P.; Pavlíček, T. Genome size and DNA base composition of geophytes: The mirror of phenology and ecology? Ann. Bot. 2012, 109, 65–75. [Google Scholar] [CrossRef] [PubMed] [Green Version]
- Dabrowska, J. Chromosome number and DNA content in taxa of Achillea L. in relation to the distribution of the genus. Acta Univ. Wratislav. Prace Bot. 1992, 49, 1–83. [Google Scholar]
- Krahulcová, A.; Trávníček, P.; Krahulec, F.; Rejmánek, M. Small genomes and large seeds: Chromosome numbers, genome size and seed mass in diploid Aesculus species (Sapindaceae). Ann. Bot. 2017, 119, 957–964. [Google Scholar] [CrossRef] [Green Version]
- Aliyu, O.M. Analysis of absolute nuclear DNA content reveals a small genome and intra-specific variation in Cashew (Anacardium occidentale L.), Anacardiaceae. Silvae Genet. 2014, 63, 285–292. [Google Scholar] [CrossRef] [Green Version]
- Vekemans, X.; Lefebvre, C.; Coulaud, J.; Blaise, S.; Gruber, W.; Siljak-Yakovlev, S.; Brown, S.C. Variation in nuclear DNA content at the species level in Armeria maritima. Hereditas 1996, 124, 237–242. [Google Scholar] [CrossRef]
- Siqueiros-Delgado, M.E.; Fisher, A.E.; Columbus, J.T. Polyploidy as a factor in the evolution of the Bouteloua curtipendula complex (Poaceae: Chloridoideae). Syst. Bot. 2017, 42, 432–448. [Google Scholar] [CrossRef]
- Kim, S.; Han, M.; Rayburn, A.L. Genome size and seed mass analyses in Cicer arietinum (Chickpea) and wild Cicer species. HortScience 2015, 50, 1751–1756. [Google Scholar] [CrossRef] [Green Version]
- Benor, S.; Fuchs, J.; Blattner, F.R. Genome size variation in Corchorus olitorius (Malvaceae s.l.) and its correlation with elevation and phenotypic traits. Genome 2011, 54, 575–585. [Google Scholar] [CrossRef]
- Jones, R.N.; Brown, L.M. Chromosome evolution and DNA variation in Crepis. Heredity 1976, 36, 91–104. [Google Scholar] [CrossRef] [Green Version]
- Caceres, M.E.; De Pace, C.; Mugnozza, G.T.S.; Kotsonis, P.; Ceccarelli, M.; Cionini, P.G. Genome size variations within Dasypyrum villosum: Correlations with chromosomal traits, environmental factors and plant phenotypic characteristics and behaviour in reproduction. Theor. Appl. Genet. 1998, 96, 559–567. [Google Scholar] [CrossRef]
- Chung, J.; Lee, J.H.; Arumuganathan, K.; Graef, G.L.; Specht, J.E. Relationships between nuclear DNA content and seed and leaf size in soybean. Appl. Genet. 1998, 96, 1064–1068. [Google Scholar] [CrossRef]
- Snodgrass, S.J.; Jareczek, J.; Wendel, J.F. An examination of nucleotypic effects in diploid and polyploid cotton. Aob Plants 2017, 9, plw082. [Google Scholar] [CrossRef] [Green Version]
- Podwyszyńska, M.; Gabryszewska, E.; Dyki, B.; Stępowska, A.A.; Kowalski, A.; Jasiński, A. Phenotypic and genome size changes (variation) in synthetic tetraploids of daylily (Hemerocallis) in relation to their diploid counterparts. Euphytica 2015, 203, 1–16. [Google Scholar] [CrossRef] [Green Version]
- Karp, A.; Rees, H.; Jewell, A.W. The effects of nucleotype and genotype upon pollen grain development in Hyacinth and Scilla. Heredity 1982, 48, 251–261. [Google Scholar] [CrossRef] [Green Version]
- Cohen, H.; Tel-Zur, N. Morphological changes and self-incompatibility breakdown associated with autopolyploidization in Hylocereus species (Cactaceae). Euphytica 2012, 184, 345–354. [Google Scholar] [CrossRef]
- Cohen, H.; Fait, A.; Tel-Zur, N. Morphological, cytological and metabolic consequences of autopolyploidization in Hylocereus (Cactaceae) species. BMC Plant Biol. 2013, 13, 173. [Google Scholar] [CrossRef] [Green Version]
- Khorami, S.S.; Arzani, K.; Karimzadeh, G.; Shojaeiyan, A.; Ligterink, W. Genome size: A novel predictor of nut weight and nut size of walnut trees. HortScience 2018, 53, 275–282. [Google Scholar] [CrossRef] [Green Version]
- Urwin, N.A.; Horsnell, J.; Moon, T. Generation and characterisation of colchicine-induced autotetraploid Lavandula angustifolia. Euphytica 2007, 156, 257–266. [Google Scholar] [CrossRef]
- Sugiyama, S.; Yamaguchi, K.; Yamada, T. Intraspecific phenotypic variation associated with nuclear DNA content in Lolium perenne L. Euphytica 2002, 128, 145–151. [Google Scholar] [CrossRef]
- Podwyszyńska, M.; Kruczynska, D.; Machlanska, A.; Dyki, B.; Sowik, I. Nuclear DNA content and ploidy level of apple cultivars including Polish ones in relation to some morphological traits. Acta Biol. Crac. Ser. Bot. 2016, 58, 81–93. [Google Scholar] [CrossRef]
- Lemontey, C.; Mousset-Déclas, C.; Munier-Jolain, N.; Boutin, J.P. Maternal genotype influences pea seed size by controlling both mitotic activity during early embryogenesis and final endoreduplication level/cotyledon cell size in mature seed. J. Exp. Bot. 2000, 51, 167–175. [Google Scholar] [CrossRef] [PubMed] [Green Version]
- Wang, X.; Wang, H.; Shi, C.; Zhang, X.; Duan, K.; Luo, J. Morphological, cytological and fertility consequences of a spontaneous tetraploid of the diploid pear (Pyrus pyrifolia Nakai) cultivar ‘Cuiguan’. Sci. Hortic. 2015, 189, 59–65. [Google Scholar] [CrossRef]
- Lazarevic, M.; Siljak-Yakovlev, S.; Lazarevic, P.; Stevanovic, B.; Stevanovic, V. Pollen and seed morphology of resurrection plants from the genus Ramonda (Gesneriaceae): Relationship with ploidy level and relevance to their ecology and identification. Turk. J. Bot. 2013, 37, 872–885. [Google Scholar] [CrossRef]
- Kenton, A.Y.; Rudall, P.J.; Johnson, A.R. Genome size variation in Sisyrinchium L. (Iridaceae) and its relationship to phenotype and habitat. Bot. Gaz. 1986, 147, 342–354. [Google Scholar] [CrossRef]
- Möller, M. Nuclear DNA C-values are correlated with pollen size at tetraploid but not diploid level and linked to phylogenetSic descent in Streptocarpus (Gesneriaceae). S. Afr. J. Bot. 2018, 114, 323–344. [Google Scholar] [CrossRef]
- Davies, D.R. DNA contents and cell number in relation to seed size in the genus Vicia. Heredity 1977, 39, 153–163. [Google Scholar] [CrossRef] [Green Version]
- Çelïkler, S.; Bïlaloğlu, R. Nucleotypic effects in different genotypes of Vicia sativa L. Turk. J. Biol. 2001, 25, 205–219. [Google Scholar]
- Guo, X.; Allen, S.K. Reproductive potential and genetics of triploid Pacific oysters, Crassostrea gigas (Thunberg). Biol. Bull. 1994, 187, 309–318. [Google Scholar] [CrossRef] [PubMed]
- Arnqvist, G.; Sayadi, A.; Immonen, E.; Hotzy, C.; Rankin, D.; Tuda, M.; Hjelmen, C.E.; Johnston, J.S. Genome size correlates with reproductive fitness in seed beetles. Proc. R. Soc. B Biol. Sci. 2015, 282, 20151421. [Google Scholar] [CrossRef] [Green Version]
- Schmidt-Ott, U.; Rafiqi, A.M.; Sander, K.; Johnston, J.S. Extremely small genomes in two unrelated dipteran insects with shared early developmental traits. Dev. Genes Evol. 2009, 219, 207–210. [Google Scholar] [CrossRef] [PubMed] [Green Version]
- Markow, T.A.; Beall, S.; Matzkin, L.M. Egg size, embryonic development time and ovoviviparity in Drosophila species. J. Evol. Biol. 2009, 22, 430–434. [Google Scholar] [CrossRef] [PubMed]
- Hardie, D.C.; Hebert, P.D. Genome-size evolution in fishes. Can. J. Fish. Aquat. Sci. 2004, 61, 1636–1646. [Google Scholar] [CrossRef]
- Jockusch, E.L. An evolutionary correlate of genome size change in plethodontid salamanders. Proc. R. Soc. B Biol. Sci. 1997, 264, 597–604. [Google Scholar] [CrossRef] [Green Version]
- Gage, M.J. Mammalian sperm morphometry. Proc. R. Soc. B Biol. Sci. 1998, 265, 97–103. [Google Scholar] [CrossRef] [Green Version]
- Gallardo, M.H.; Bickham, J.W.; Honeycutt, R.L.; Ojeda, R.A.; Köhler, N. Discovery of tetraploidy in a mammal. Nature 1999, 401, 341. [Google Scholar] [CrossRef]
- Bonner, J.T. Size and Cycle: An Essay on the Structure of Biology; Princeton University Press: Princeton, NJ, USA, 1965. [Google Scholar]
- Buss, L.W. The Evolution of Individuality; Princeton University Press: Princeton, NJ, USA, 1987. [Google Scholar]
- Maynard Smith, J.; Szathmáry, E. The Major Transitions in Evolution; W.H. Freeman and Company: Oxford, UK, 1995. [Google Scholar]
- Grosberg, R.K.; Strathmann, R.R. One cell, two cell, red cell, blue cell: The persistence of a unicellular stage in multicellular life histories. Trends Ecol. Evol. 1998, 13, 112–116. [Google Scholar] [CrossRef]
- Grosberg, R.K.; Strathmann, R.R. The evolution of multicellularity: A minor major transition? Annu. Rev. Ecol. Evol. Syst. 2007, 38, 621–654. [Google Scholar] [CrossRef] [Green Version]
- Michod, R.E. Darwinian Dynamics: Evolutionary Transitions in Fitness and Individuality; Princeton University Press: Princeton, NJ, USA, 1999. [Google Scholar]
- Wolpert, L.; Szathmáry, E. Multicellularity: Evolution and the egg. Nature 2002, 420, 745. [Google Scholar] [CrossRef] [PubMed]
- Rainey, P.B.; Kerr, B. Cheats as first propagules: A new hypothesis for the evolution of individuality during the transition from single cells to multicellularity. Bioessays 2010, 32, 872–880. [Google Scholar] [CrossRef]
- Hammerschmidt, K.; Rose, C.J.; Kerr, B.; Rainey, P.B. Life cycles, fitness decoupling and the evolution of multicellularity. Nature 2014, 515, 75–79. [Google Scholar] [CrossRef] [PubMed]
- Michod, R.E. On the transfer of fitness from the cell to the multicellular organism. Biol. Philos. 2005, 20, 967–987. [Google Scholar] [CrossRef]
- Rose, C.J.; Hammerschmidt, K.; Pichugin, Y.; Rainey, P.B. Meta-population structure and the evolutionary transition to multicellularity. Ecol. Lett. 2020, 23, 1380–1390. [Google Scholar] [CrossRef]
- Rose, C.J. Germ lines and extended selection during the evolutionary transition to multicellularity. J. Exp. Zool. B Mol. Dev. Evol. 2020. [Google Scholar] [CrossRef] [PubMed]
- Blakeslee, A.F. Effect of induced polyploidy in plants. Am. Nat. 1941, 75, 117–135. [Google Scholar] [CrossRef]
- Sexton, P.J.; Boote, K.J.; White, J.W.; Peterson, C.M. Seed size and seed growth rate in relation to cotyledon cell volume and number in common bean. Field Crop. Res. 1997, 54, 163–172. [Google Scholar] [CrossRef]
- Alonso-Blanco, C.; Blankestijn-de Vries, H.; Hanhart, C.J.; Koornneef, M. Natural allelic variation at seed size loci in relation to other life history traits of Arabidopsis thaliana. Proc. Natl. Acad. Sci. USA 1999, 96, 4710–4717. [Google Scholar] [CrossRef] [PubMed] [Green Version]
- Del Pozo, J.C.; Ramirez-Parra, E. Whole genome duplications in plants: An overview from Arabidopsis. J. Exp. Bot. 2015, 66, 6991–7003. [Google Scholar] [CrossRef] [PubMed] [Green Version]
- Li, N.; Li, Y. Signaling pathways of seed size control in plants. Curr. Opin. Plant Biol. 2016, 33, 23–32. [Google Scholar] [CrossRef] [PubMed]
- Li, N.; Xu, R.; Li, Y. Molecular networks of seed size control in plants. Annu. Rev. Plant Biol. 2019, 70, 435–463. [Google Scholar] [CrossRef]
- Stebbins, G.L. Chromosomal Evolution in Higher Plants; Addison-Wesley: Reading, MA, USA, 1971. [Google Scholar]
- Szarski, H. Cell size and nuclear DNA content in vertebrates. Int. Rev. Cytol. 1976, 44, 93–111. [Google Scholar] [CrossRef]
- Olmo, E. Nucleotype and cell size in vertebrates: A review. Basic Appl. Histochem. 1983, 27, 227–256. [Google Scholar]
- Nurse, P. The genetic control of cell volume. In The Evolution of Genome Size; Cavalier-Smith, T., Ed.; John Wiley and Sons: Chichester, UK, 1985; pp. 185–196. [Google Scholar]
- Price, H.J. DNA content variation among higher plants. Ann. Missouri Bot. Gard. 1988, 75, 1248–1257. [Google Scholar] [CrossRef]
- Gregory, T.R. The C-value enigma in plants and animals: A review of parallels and an appeal for partnership. Ann. Bot. 2005, 95, 133–146. [Google Scholar] [CrossRef] [PubMed] [Green Version]
- Hardie, D.C.; Hebert, P.D. The nucleotypic effects of cellular DNA content in cartilaginous and ray-finned fishes. Genome 2003, 46, 683–706. [Google Scholar] [CrossRef] [Green Version]
- Otto, S.P. The evolutionary consequences of polyploidy. Cell 2007, 131, 452–462. [Google Scholar] [CrossRef] [PubMed] [Green Version]
- Beaulieu, J.M.; Leitch, I.J.; Patel, S.; Pendharkar, A.; Knight, C.A. Genome size is a strong predictor of cell size and stomatal density in angiosperms. New Phytol. 2008, 179, 975–986. [Google Scholar] [CrossRef] [PubMed] [Green Version]
- Hodgson, J.G.; Sharafi, M.; Jalili, A.; Díaz, S.; Montserrat-Martí, G.; Palmer, C.; Cerabolini, B.; Pierce, S.; Hamzehee, B.; Asri, Y.; et al. Stomatal vs. genome size in angiosperms: The somatic tail wagging the genomic dog? Ann. Bot. 2010, 105, 573–584. [Google Scholar] [CrossRef]
- Dufresne, F.; Jeffery, N. A guided tour of large genome size in animals: What we know and where we are heading. Chromosome Res. 2011, 19, 925–938. [Google Scholar] [CrossRef]
- Greilhuber, J.; Leitch, I.J. Genome size and the phenotype. In Plant Genome Diversity; Leitch, I.J., Greilhuber, J., Dolezel, J., Wendel, J.F., Eds.; Springer: Vienna, Austria, 2013; Volume 2, pp. 323–344. [Google Scholar]
- Frawley, L.E.; Orr-Weaver, T.L. Polyploidy. Curr. Biol. 2015, 25, R353–R358. [Google Scholar] [CrossRef] [PubMed] [Green Version]
- Gillooly, J.F.; Hein, A.; Damiani, R. Nuclear DNA content varies with cell size across human cell types. Cold Spring Harb. Perspect. Biol. 2015, 7, a019091. [Google Scholar] [CrossRef] [PubMed] [Green Version]
- Hessen, D.O. Noncoding DNA as a phenotypic driver. Evol. Biol. 2015, 42, 427–431. [Google Scholar] [CrossRef]
- Mueller, R.L. Genome biology and the evolution of cell-size diversity. Cold Spring Harb. Perspect. Biol. 2015, 7, a019125. [Google Scholar] [CrossRef] [PubMed] [Green Version]
- Simonin, K.A.; Roddy, A.B. Genome downsizing, physiological novelty, and the global dominance of flowering plants. PLoS Biol. 2018, 16, e2003706. [Google Scholar] [CrossRef] [Green Version]
- Müntzing, A. The evolutionary significance of autopolyploidy. Hereditas 1936, 21, 363–378. [Google Scholar] [CrossRef]
- Sax, K.; Sax, H.J. Stomata size and distribution in diploid and polyploid plants. J. Arnold Arbor. 1937, 18, 164–172. [Google Scholar]
- Gregory, T.R.; Mable, B.K. Polyploidy in animals. In The Evolution of the Genome; Gregory, T.R., Ed.; Elsevier Academic Press: Burlington, MA, USA, 2005; pp. 428–517. [Google Scholar]
- Tate, J.A.; Soltis, D.E.; Soltis, P.S. Polyploidy in plants. In The Evolution of the Genome; Gregory, T.R., Ed.; Elsevier Academic Press: Burlington, MA, USA, 2005; pp. 372–426. [Google Scholar]
- Mable, B.K.; Alexandrou, M.A.; Taylor, M.I. Genome duplication in amphibians and fish: An extended synthesis. J. Zool. 2011, 284, 151–182. [Google Scholar] [CrossRef]
- Doyle, J.J.; Coate, J.E. Polyploidy, the nucleotype, and novelty: The impact of genome doubling on the biology of the cell. Int. J. Plant Sci. 2019, 180, 1–52. [Google Scholar] [CrossRef]
- Bomblies, K. When everything changes at once: Finding a new normal after genome duplication. Proc. R. Soc. B Biol. Sci. 2020, 287, 20202154. [Google Scholar] [CrossRef] [PubMed]
- Fankhauser, G. The effects of changes in chromosome number on amphibian development. Q. Rev. Biol. 1945, 20, 20–78. [Google Scholar] [CrossRef]
- Beatty, R.A.; Fischberg, M. Cell number in haploid, diploid and polyploid mouse embryos. J. Exp. Biol. 1951, 28, 541–552. [Google Scholar]
- Edwards, R.G. The number of cells and cleavages in haploid, diploid, polyploid, and other heteroploid mouse embryos at 3½ days gestation. J. Exp. Zool. 1958, 138, 189–207. [Google Scholar] [CrossRef]
- Swarup, H. Effect of triploidy on the body size, general organization and cellular structure in Gasterosteus aculeatus (L). J. Genet. 1959, 56, 143–155. [Google Scholar] [CrossRef]
- Mahony, M.J.; Robinson, E.S. Polyploidy in the Australian leptodactylid frog genus Neobatrachus. Chromosoma 1980, 81, 199–212. [Google Scholar] [CrossRef]
- Warner, D.A.; Edwards, G.E. Effects of polyploidy on photosynthetic rates, photosynthetic enzymes, contents of DNA, chlorophyll, and sizes and numbers of photosynthetic cells in the C(4) Dicot Atriplex confertifolia. Plant Physiol. 1989, 91, 1143–1151. [Google Scholar] [CrossRef] [Green Version]
- Henery, C.C.; Kaufman, M.H. Relationship between cell size and nuclear volume in nucleated red blood cells of developmentally matched diploid and tetraploid mouse embryos. J. Exp. Zool. 1992, 261, 472–478. [Google Scholar] [CrossRef] [PubMed]
- Conlon, I.; Raff, M. Size control in animal development. Cell 1999, 96, 235–244. [Google Scholar] [CrossRef] [Green Version]
- Xiang, J.; Li, F.; Zhang, C.; Zhang, X.; Yu, K.; Zhou, L.; Wu, C. Evaluation of induced triploid shrimp Penaeus (Fenneropenaeus) chinensis cultured under laboratory conditions. Aquaculture 2006, 259, 108–115. [Google Scholar] [CrossRef]
- Kozłowski, J.; Konarzewski, M.; Gawelczyk, A.T. Cell size as a link between noncoding DNA and metabolic rate scaling. Proc. Natl. Acad. Sci. USA 2003, 100, 14080–14085. [Google Scholar] [CrossRef] [PubMed] [Green Version]
- Bonner, J.T. Size Morphogenesis: An Essay on Development; Princeton University Press: Princeton, NJ, USA, 1952. [Google Scholar]
- Calow, P. Life Cycles: An. Evolutionary Approach to the Physiology of Reproduction, Development and Aging; Chapman and Hall: London, UK, 1978. [Google Scholar]
- Conklin, E.G. Body size and cell size. J. Morphol. 1912, 23, 159–188. [Google Scholar] [CrossRef]
- Bailey, I.W.; Tupper, W.W. Size variation in tracheary cells: I. A comparison between the secondary xylems of vascular cryptogams, gymnosperms and angiosperms. Proc. Am. Acad. Arts Sci. 1918, 54, 149–204. [Google Scholar] [CrossRef]
- Teissier, G. Biométrie de la cellule. Table Biol. 1939, 19, 1–64. [Google Scholar]
- Rensch, B. Evolution above the Species Level; Columbia University Press: New York, NY, USA, 1959. [Google Scholar]
- Thompson, D.W. On Growth and Form; Cambridge University Press: Cambridge, UK, 1963. [Google Scholar]
- Morgado, E.; Ocqueteau, C.; Cury, M.; Becker, L.; González, U.; Muxica, L.; Gunther, B. Three-dimensional morphometry of mammalian cells. II. Areas, volumes, and area-volume ratios. Arch. Biol. Med. Exp. 1990, 23, 21–27. [Google Scholar]
- Savage, V.M.; Allen, A.P.; Brown, J.H.; Gillooly, J.F.; Herman, A.B.; Woodruff, W.H.; West, G.B. Scaling of number, size, and metabolic rate of cells with body size in mammals. Proc. Natl. Acad. Sci. USA 2007, 104, 4718–4723. [Google Scholar] [CrossRef] [PubMed] [Green Version]
- Elgar, M.A. Evolutionary compromise between a few large and many small eggs: Comparative evidence in teleost fish. Oikos 1990, 59, 283–287. [Google Scholar] [CrossRef]
- White, J.W.; Gonzalez, A. Characterization of the negative association between seed yield and seed size among genotypes of common bean. Field Crop. Res. 1990, 23, 159–175. [Google Scholar] [CrossRef]
- Guo, X.; Allen, S.K. Sex determination and polyploid gigantism in the dwarf surfclam (Mulinia lateralis Say). Genetics 1994, 138, 1199–1206. [Google Scholar] [CrossRef]
- Dufresne, F.; Hebert, P.D. Temperature-related differences in life-history characteristics between diploid and polyploid clones of the Daphnia pulex complex. Ecoscience 1998, 5, 433–437. [Google Scholar] [CrossRef]
- Ernsting, G.; Isaaks, A. Ectotherms, temperature, and trade-offs: Size and number of eggs in a carabid beetle. Am. Nat. 2000, 155, 804–813. [Google Scholar] [CrossRef]
- Glazier, D.S. Smaller amphipod mothers show stronger trade-offs between offspring size and number. Ecol. Lett. 2000, 3, 142–149. [Google Scholar] [CrossRef]
- Hendriks, A.J.; Mulder, C. Scaling of offspring number and mass to plant and animal size: Model and meta-analysis. Oecologia 2008, 155, 705–716. [Google Scholar] [CrossRef] [PubMed] [Green Version]
- Juchno, D.; Boroń, A.; Kujawa, R.; Szlachciak, J.; Szacherski, S.; Spóz, A.; Grabowska, A. Comparison of egg and offspring size of karyologically identified spined loach, Cobitis taenia L., and hybrid triploid Cobitis females (Pisces, Cobitidae). Fish. Aquat. Life 2013, 21, 293–299. [Google Scholar] [CrossRef]
- Edwards, K.F.; Steward, G.F.; Schvarcz, C.R. Making sense of virus size and the tradeoffs shaping viral fitness. Ecol. Lett. 2020. [Google Scholar] [CrossRef]
- McLaren, I.A.; Marcogliese, D.J. Similar nucleus numbers among copepods. Can. J. Zool. 1983, 61, 721–724. [Google Scholar] [CrossRef]
- Escribano, R.; McLaren, I.A.; Breteler, W.K. Innate and acquired variation of nuclear DNA contents of marine copepods. Genome 1992, 35, 602–610. [Google Scholar] [CrossRef]
- Martin, G.G.; Graves, B.L. Fine structure and classification of shrimp hemocytes. J. Morphol. 1985, 185, 339–348. [Google Scholar] [CrossRef] [PubMed]
- Hose, J.E.; Martin, G.G.; Gerard, A.S. A decapod hemocyte classification scheme integrating morphology, cytochemistry, and function. Biol. Bull. 1990, 178, 33–45. [Google Scholar] [CrossRef]
- Gargioni, R.; Barracco, M.A. Hemocytes of the palaemonids Macrobrachium rosenbergii and M. acanthurus, and of the Penaeid Penaeus paulensis. J. Morphol. 1998, 236, 209–221. [Google Scholar] [CrossRef]
- Giulianini, P.G.; Bierti, M.; Lorenzon, S.; Battistella, S.; Ferrero, E.A. Ultrastructural and functional characterization of circulating hemocytes from the freshwater crayfish Astacus leptodactylus: Cell types and their role after in vivo artificial non-self challenge. Micron 2007, 38, 49–57. [Google Scholar] [CrossRef] [PubMed]
- Zhou, Y.L.; Gu, W.B.; Tu, D.D.; Zhu, Q.H.; Zhou, Z.K.; Chen, Y.Y.; Shu, M.A. Hemocytes of the mud crab Scylla paramamosain: Cytometric, morphological characterization and involvement in immune responses. Fish. Shellfish Immunol. 2018, 72, 459–469. [Google Scholar] [CrossRef]
- Jeyachandran, S.; Park, K.; Kwak, I.S.; Baskaralingam, V. Morphological and functional characterization of circulating hemocytes using microscopy techniques. Microsc. Res. Tech. 2020, 83, 736–743. [Google Scholar] [CrossRef] [PubMed]
- Crab Cliparts Black #2812105. Available online: http://clipart-library.com/clipart/947704.htm (accessed on 4 December 2020).
- Drawing Fish #1416367. Available online: http://clipart-library.com/clipart/piode7j6T.htm (accessed on 4 December 2020).
- Bushes Clipart Black and White #975041. Available online: http://clipart-library.com/clip-art/10-109830_ferns-vascular-plants-leaves-png-image-fern-clip.htm (accessed on 4 December 2020).
- Tree Clipart #2994176. Available online: http://clipart-library.com/clipart/tree-clipart-21.htm (accessed on 4 December 2020).
- Maszczyk, P.; Brzeziński, T. Body size, maturation size and growth, rate of crustaceans. In The Natural History of the Crustacea; Wellborn, G.A., Thiel, M., Eds.; Oxford University Press: New York, NY, USA, 2018; Volume 5, pp. 35–65. [Google Scholar]
- Stearns, S.C. The Evolution of Life Histories; Oxford University Press: Oxford, UK, 1992. [Google Scholar]
- Commoner, B. DNA and the chemistry of inheritance. Am. Sci. 1964, 52, 365–388. [Google Scholar]
- Cavalier-Smith, T.; Beaton, M.J. The skeletal function of nongenic nuclear DNA: New evidence from ancient cell chimaeras. Genetica 1999, 106, 3–13. [Google Scholar] [CrossRef]
- Bennett, M.D. The duration of meiosis. Proc. R. Soc. B Biol. Sci. 1971, 178, 277–299. [Google Scholar] [CrossRef]
- Bennett, M.D. The nucleotype, the natural karyotype and the ancestral genome. Symp. Soc. Exp. Biol. 1996, 50, 45–52. [Google Scholar] [PubMed]
- Blommaert, J. Genome size evolution: Towards new model systems for old questions. Proc. R. Soc. B Biol. Sci. 2020, 287, 20201441. [Google Scholar] [CrossRef] [PubMed]
- Herrick, J.; Sclavi, B. Genome evolution in amphibians. In eLS; John Wiley & Sons: Chichester, UK, 2020; pp. 1–10. [Google Scholar] [CrossRef]
- Wright, N.A.; Gregory, T.R.; Witt, C.C. Metabolic ‘engines’ of flight drive genome size reduction in birds. Proc. R. Soc. B Biol. Sci. 2014, 28, 20132780. [Google Scholar] [CrossRef] [Green Version]
- Roff, D.A. The Evolution of Life Histories: Theory and Analysis; Chapman and Hall: New York, NY, USA, 1992. [Google Scholar]
- Bernardo, J. The particular maternal effect of propagule size, especially egg size: Patterns, models, quality of evidence and interpretations. Am. Zool. 1996, 36, 216–236. [Google Scholar] [CrossRef]
- Westoby, M.; Leishman, M.; Lord, J. Comparative ecology of seed size and dispersal. Philos. Trans. R. Soc. Lond. B Biol. Sci. 1996, 351, 1309–1318. [Google Scholar] [CrossRef]
- Yampolsky, L.Y.; Scheiner, S.M. Why larger offspring at lower temperatures? A demographic approach. Am. Nat. 1996, 147, 86–100. [Google Scholar] [CrossRef]
- Fox, C.W.; Czesak, M.E. Evolutionary ecology of progeny size in arthropods. Annu. Rev. Entomol. 2000, 45, 341–369. [Google Scholar] [CrossRef] [Green Version]
- Marshall, D.J.; Pettersen, A.K.; Cameron, H.A. global synthesis of offspring size variation, its eco-evolutionary causes and consequences. Funct. Ecol. 2018, 32, 1436–1446. [Google Scholar] [CrossRef]
- Anderson, D.M.; Gillooly, J.F. Predicting egg size across temperatures in marine teleost fishes. Fish. Fish. 2020, 21, 1027–1033. [Google Scholar] [CrossRef]
- Olmo, E.; Morescalchi, A. Evolution of the genome and cell sizes in salamanders. Experientia 1975, 31, 804–806. [Google Scholar] [CrossRef] [PubMed]
- Szarski, H. Cell size and the concept of wasteful and frugal evolutionary strategies. J. Theor. Biol. 1983, 105, 201–209. [Google Scholar] [CrossRef]
- Hughes, A.L.; Hughes, M.K. Small genomes for better flyers. Nature 1995, 377, 391. [Google Scholar] [CrossRef]
- Gregory, T.R. Genome size and developmental complexity. Genetica 2002, 115, 131–146. [Google Scholar] [CrossRef]
- Waltari, E.; Edwards, S.V. Evolutionary dynamics of intron size, genome size, and physiological correlates in archosaurs. Am. Nat. 2002, 160, 539–552. [Google Scholar] [CrossRef] [PubMed]
- Roddy, A.B.; Théroux-Rancourt, G.; Abbo, T.; Benedetti, J.W.; Brodersen, C.R.; Castro, M.; Castro, S.; Gilbride, A.B.; Jensen, B.; Jiang, G.F.; et al. The scaling of genome size and cell size limits maximum rates of photosynthesis with implications for ecological strategies. Int. J. Plant Sci. 2020, 181, 75–87. [Google Scholar] [CrossRef]
- Epstein, C.J. Cell size, nuclear content, and the development of polyploidy in the mammalian liver. Proc. Natl. Acad. Sci. USA 1967, 57, 327–334. [Google Scholar] [CrossRef] [PubMed] [Green Version]
- Neiman, M.; Beaton, M.J.; Hessen, D.O.; Jeyasingh, P.D.; Weider, L.J. Endopolyploidy as a potential driver of animal ecology and evolution. Biol. Rev. 2017, 92, 234–247. [Google Scholar] [CrossRef] [PubMed] [Green Version]
- Atkinson, D. Temperature and organism size: A biological law for ectotherms? Adv. Ecol. Res. 1994, 25, 1–58. [Google Scholar] [CrossRef]
- Chambers, R. Einfluss der Eigrösse und der Temperatur auf das Wachstum und die Grösse des Frosches und dessen Zellen. Arch. Mikrosk. Anat. 1908, 72, 607–661. [Google Scholar] [CrossRef]
- Marshall, N.B. Egg size in Arctic, Antarctic and deep-sea fishes. Evolution 1953, 7, 328–341. [Google Scholar] [CrossRef] [Green Version]
- Campbell, E.; Grainger, J.N.R. The effect of temperature on size and structure: II. The body musculature of Cyclops agilis (Koch, Sars). Proc. R. Ir. Acad. B Biol. Geol. Chem. Sci. 1975, 75, 391–399. [Google Scholar]
- Perrin, N. Why are offspring born larger when it is colder? Phenotypic plasticity for offspring size in the cladoceran Simocephalus vetulus (Muller). Funct. Ecol. 1988, 2, 283–288. [Google Scholar] [CrossRef]
- Partridge, L.; Barrie, B.; Fowler, K.; French, V. Evolution and development of body size and cell size in Drosophila melanogaster in response to temperature. Evolution 1994, 48, 1269–1276. [Google Scholar] [CrossRef] [PubMed]
- Van Voorhies, W.A. Bergmann size clines: A simple explanation for their occurrence in ectotherms. Evolution 1996, 50, 1259–1264. [Google Scholar] [CrossRef]
- Woods, H.A. Egg-mass size and cell size: Effects of temperature on oxygen distribution. Am. Zool. 1999, 39, 244–252. [Google Scholar] [CrossRef]
- Blanckenhorn, W.U. Temperature effects on egg size and their fitness consequences in the yellow dung fly Scathophaga stercoraria. Evol. Ecol. 2000, 14, 627–643. [Google Scholar] [CrossRef]
- Blanckenhorn, W.U.; Llaurens, V. Effects of temperature on cell size and number in the yellow dung fly Scathophaga stercoraria. J. Biol. 2005, 30, 213–219. [Google Scholar] [CrossRef]
- Atkinson, D.; Morley, S.A.; Weetman, D.; Hughes, R.N. Offspring size responses to maternal temperature in ectotherms. In Environment and Animal Development: Genes, Life Histories and Plasticity; Atkinson, D., Thorndyke, M., Eds.; BIOS Scientific Publishers: Oxford, UK, 2001; pp. 269–285. [Google Scholar]
- Atkinson, D.; Morley, S.A.; Hughes, R.N. From cells to colonies: At what levels of body organization does the ‘temperature-size rule’ apply? Evol. Dev. 2006, 8, 202–214. [Google Scholar] [CrossRef] [PubMed]
- Fischer, K.; Brakefield, P.M.; Zwaan, B.J. Plasticity in butterfly egg size: Why larger offspring at lower temperatures? Ecology 2003, 84, 3138–3147. [Google Scholar] [CrossRef]
- Arendt, J. Ecological correlates of body size in relation to cell size and cell number: Patterns in flies, fish, fruits and foliage. Biol. Rev. 2007, 82, 241–256. [Google Scholar] [CrossRef]
- Bownds, C.; Wilson, R.; Marshall, D.J. Why do colder mothers produce larger eggs? An optimality approach. J. Exp. Biol. 2010, 213, 3796–3801. [Google Scholar] [CrossRef] [Green Version]
- Collin, R.; Salazar, M.Z. Temperature-mediated plasticity and genetic differentiation in egg size and hatching size among populations of Crepidula (Gastropoda: Calyptraeidae). Biol. J. Linn. Soc. 2010, 99, 489–499. [Google Scholar] [CrossRef]
- Goodman, R.M.; Heah, T.P. Temperature-induced plasticity at cellular and organismal levels in the lizard Anolis carolinensis. Integr. Zool. 2010, 5, 208–217. [Google Scholar] [CrossRef]
- Marshall, D.J.; Krug, P.J.; Kupriyanova, E.K.; Byrne, M.; Emlet, R.B. The biogeography of marine invertebrate life histories. Annu. Rev. Ecol. Evol. Syst. 2012, 43, 97–114. [Google Scholar] [CrossRef] [Green Version]
- Czarnoleski, M.; Cooper, B.S.; Kierat, J.; Angilletta, M.J. Flies developed small bodies and small cells in warm and in thermally fluctuating environments. J. Exp. Biol. 2013, 216, 2896–2901. [Google Scholar] [CrossRef] [Green Version]
- Czarnoleski, M.; Labecka, A.M.; Kozłowski, J. Thermal plasticity of body size and cell size in snails from two subspecies of Cornu aspersum. J. Molluscan Stud. 2016, 82, 235–243. [Google Scholar] [CrossRef] [Green Version]
- Czarnoleski, M.; Labecka, A.M.; Starostová, Z.; Sikorska, A.; Bonda-Ostaszewska, E.; Woch, K.; Kubička, L.; Kratochvíl, L.; Kozlowski, J. Not all cells are equal: Effects of temperature and sex on the size of different cell types in the Madagascar ground gecko Paroedura picta. Biol. Open 2017, 6, 1149–1154. [Google Scholar] [CrossRef] [Green Version]
- Sabath, N.; Ferrada, E.; Barve, A.; Wagner, A. Growth temperature and genome size in bacteria are negatively correlated, suggesting genomic streamlining during thermal adaptation. Genome Biol. Evol. 2013, 5, 966–977. [Google Scholar] [CrossRef] [PubMed]
- Walczyńska, A.; Labecka, A.M.; Sobczyk, M.; Czarnoleski, M.; Kozłowski, J. The temperature–size rule in Lecane inermis (Rotifera) is adaptive and driven by nuclei size adjustment to temperature and oxygen combinations. J. Biol. 2015, 54, 78–85. [Google Scholar] [CrossRef] [PubMed]
- Walczyńska, A.; Sobczyk, M.; Czarnoleski, M.; Kozłowski, J. The temperature–size rule in a rotifer is determined by the mother and at the egg stage. Evol. Ecol. 2015, 29, 525–536. [Google Scholar] [CrossRef]
- Hermaniuk, A.; Rybacki, M.; Taylor, J.R. Low temperature and polyploidy result in larger cell and body size in an ectothermic vertebrate. Physiol. Biochem. Zool. 2016, 89, 118–129. [Google Scholar] [CrossRef] [PubMed] [Green Version]
- Huete-Stauffer, T.M.; Arandia-Gorostidi, N.; Alonso-Sáez, L.; Morán, X.A.G. Experimental warming decreases the average size and nucleic acid content of marine bacterial communities. Front. Microbiol. 2016, 7, 730. [Google Scholar] [CrossRef] [Green Version]
- Kierat, J.; Szentgyörgyi, H.; Czarnoleski, M.; Woyciechowski, M. The thermal environment of the nest affects body and cell size in the solitary red mason bee (Osmia bicornis L.). J. Therm. Biol. 2017, 68, 39–44. [Google Scholar] [CrossRef] [PubMed]
- Barneche, D.R.; Burgess, S.C.; Marshall, D.J. Global environmental drivers of marine fish egg size. Glob. Ecol. Biogeogr. 2018, 27, 890–898. [Google Scholar] [CrossRef] [Green Version]
- Pettersen, A.K.; White, C.R.; Bryson-Richardson, R.J.; Marshall, D.J. Linking life-history theory and metabolic theory explains the offspring size-temperature relationship. Ecol. Lett. 2019, 22, 518–526. [Google Scholar] [CrossRef] [PubMed]
- Antoł, A.; Labecka, A.M.; Horváthová, T.; Sikorska, A.; Szabla, N.; Bauchinger, U.; Kozłowski, J.; Czarnoleski, M. Effects of thermal and oxygen conditions during development on cell size in the common rough woodlice Porcellio scaber. Ecol. Evol. 2020, 17, 9552–9566. [Google Scholar] [CrossRef] [PubMed]
- Jalal, M.; Andersen, T.; Hessen, D.O. Temperature and developmental responses of body and cell size in Drosophila; effects of polyploidy and genome configuration. J. Biol. 2015, 51, 1–14. [Google Scholar] [CrossRef]
- Starostová, Z.; Kratochvíl, L.; Flajšhans, M. Cell size does not always correspond to genome size: Phylogenetic analysis in geckos questions optimal DNA theories of genome size evolution. Zoology 2008, 111, 377–384. [Google Scholar] [CrossRef] [PubMed]
- Löve, A.; Löve, D. The geobotanical significance of polyploidy. I. Polyploidy and latitude. Port. Acta Biol. A 1949, Spec. Vol., 273–352. [Google Scholar]
- Levin, D.A. Polyploidy and novelty in flowering plants. Am. Nat. 1983, 122, 1–25. [Google Scholar] [CrossRef]
- Bennet, M.D. Variation in genome form in plants and its ecological implications. New Phytol. 1987, 196, 177–200. [Google Scholar] [CrossRef]
- Beaton, M.J.; Hebert, P.D. Geographical parthenogenesis and polyploidy in Daphnia pulex. Am. Nat. 1988, 132, 837–845. [Google Scholar] [CrossRef]
- Ward, R.D.; Bickerton, M.A.; Finston, T.; Hebert, P.D. Geographical cline in breeding systems and ploidy levels in European populations of Daphnia pulex. Heredity 1994, 73, 532–543. [Google Scholar] [CrossRef] [Green Version]
- James, A.C.; Azevedo, R.B.; Partridge, L. Cellular basis and developmental timing in a size cline of Drosophila melanogaster. Genetics 1995, 140, 659–666. [Google Scholar] [CrossRef]
- Atkinson, D.; Ciotti, B.J.; Montagnes, D.J. Protists decrease in size linearly with temperature: Ca. 2.5% °C−1. Proc. R. Soc. B Biol. Sci. 2003, 270, 2605–2611. [Google Scholar] [CrossRef] [PubMed] [Green Version]
- Otto, C.R.; Snodgrass, J.W.; Forester, D.C.; Mitchell, J.C.; Miller, R.W. Climatic variation and the distribution of an amphibian polyploid complex. J. Anim. Ecol. 2007, 76, 1053–1061. [Google Scholar] [CrossRef] [PubMed]
- Rees, D.J.; Dufresne, F.; Glemet, H.; Belzile, C. Amphipod genome sizes: First estimates for Arctic species reveal genomic giants. Genome 2007, 50, 151–158. [Google Scholar] [CrossRef]
- Morán, X.A.G.; López-Urrutia, Á.; Calvo-Díaz, A.; Li, W.K.W. Increasing importance of small phytoplankton in a warmer ocean. Glob. Chang. Biol. 2010, 16, 1137–1144. [Google Scholar] [CrossRef]
- Alfsnes, K.; Leinaas, H.P.; Hessen, D.O. Genome size in arthropods; different roles of phylogeny, habitat and life history in insects and crustaceans. Ecol. Evol. 2017, 7, 5939–5947. [Google Scholar] [CrossRef]
- Gjoni, V.; Glazier, D.S. A perspective on body size and abundance relationships across ecological communities. Biology 2020, 9, 42. [Google Scholar] [CrossRef] [Green Version]
- Zohary, T.; Flaim, G.; Sommer, U. Temperature and the size of freshwater phytoplankton. Hydrobiologia 2020, 848, 143–155. [Google Scholar] [CrossRef]
- Greer, B.T.; Still, C.; Cullinan, G.L.; Brooks, J.R.; Meinzer, F.C. Polyploidy influences plant-environment interactions in quaking aspen (Populus tremuloides Michx.). Tree Physiol. 2018, 38, 630–640. [Google Scholar] [CrossRef] [PubMed]
- MacArthur, R.H.; Wilson, E.O. The Theory of Island Biogeography; Princeton University Press: Princeton, NJ, USA, 1967. [Google Scholar]
- Kapraun, D.F.; Dunwoody, J.T. Relationship of nuclear genome size to some reproductive cell parameters in the Florideophycidae (Rhodophyta). Phycologia 2002, 41, 507–516. [Google Scholar] [CrossRef]
- Stebbins, G.L. Variation and Evolution in Plants; Columbia University Press: New York, NY, USA, 1950. [Google Scholar]
- Cavalier-Smith, T. r-and K-tactics in the evolution of protist developmental systems: Cell and genome size, phenotype diversifying selection, and cell cycle patterns. Biosystems 1980, 12, 43–59. [Google Scholar] [CrossRef]
- White, M.M.; McLaren, I.A. Copepod development rates in relation to genome size and 18S rDNA copy number. Genome 2000, 43, 750–755. [Google Scholar] [CrossRef]
- Gruner, A.; Hoverter, N.; Smith, T.; Knight, C.A. Genome size is a strong predictor of root meristem growth rate. J. Bot. 2010, 2010, 390414. [Google Scholar] [CrossRef] [Green Version]
- Lertzman-Lepofsky, G.; Mooers, A.; Greenberg, D.A. Ecological constraints associated with genome size across salamander lineages. Proc. R. Soc. B Biol. Sci. 2019, 286, 20191780. [Google Scholar] [CrossRef] [PubMed]
- Weider, L.J. Life history variation among low-arctic clones of obligately parthenogenetic Daphnia pulex: A diploid-polyploid complex. Oecologia 1987, 73, 251–256. [Google Scholar] [CrossRef] [PubMed]
- Mezhzherin, S.V.; Salyy, T.V.; Tsyba, A.A. Reproductive potentials of diploid and polyploidy representatives of the genus Cobitis (Cypriniformes, Cobitidae). Vest. Zool. 2017, 51, 37–44. [Google Scholar] [CrossRef] [Green Version]
- Charnov, E.L.; Schaffer, W.M. Life history consequences of natural selection: Cole’s result revisited. Am. Nat. 1973, 107, 791–793. [Google Scholar] [CrossRef] [Green Version]
- Law, R. Optimal life histories under age-specific predation. Am. Nat. 1979, 114, 399–417. [Google Scholar] [CrossRef]
- Womack, M.C.; Metz, M.J.; Hoke, K.L. Larger genomes linked to slower development and loss of late-developing traits. Am. Nat. 2019, 194, 854–864. [Google Scholar] [CrossRef] [PubMed]
- Brown, J.H.; Gillooly, J.F.; Allen, A.P.; Savage, V.M.; West, G.B. Toward a metabolic theory of ecology. Ecology 2004, 85, 1771–1789. [Google Scholar] [CrossRef]
- Glazier, D.S. Is metabolic rate a universal ‘pacemaker’ for biological processes? Biol. Rev. 2015, 90, 377–407. [Google Scholar] [CrossRef]
- Smith, H.M. Cell size and metabolic activity in Amphibia. Biol. Bull. 1925, 48, 347–378. [Google Scholar] [CrossRef]
- Davison, J. Body weight, cell surface, and metabolic rate in anuran Amphibia. Biol. Bull. 1955, 109, 407–419. [Google Scholar] [CrossRef]
- Davison, J. An analysis of cell growth and metabolism in the crayfish (Procambarus alleni). Biol. Bull. 1956, 110, 264–273. [Google Scholar] [CrossRef]
- Chown, S.L.; Marais, E.; Terblanche, J.S.; Klok, C.J.; Lighton, J.R.B.; Blackburn, T.M. Scaling of insect metabolic rate is inconsistent with the nutrient supply network model. Funct. Ecol. 2007, 21, 282–290. [Google Scholar] [CrossRef]
- Glazier, D.S.; Powell, M.G.; Deptola, T.J. Body-size scaling of metabolic rate in the trilobite Eldredgeops rana. Paleobiology 2013, 39, 109–122. [Google Scholar] [CrossRef]
- Vinogradov, A.E. Nucleotypic effect in homeotherms: Body-mass-corrected basal metabolic rate of mammals is related to genome size. Evolution 1995, 49, 1249–1259. [Google Scholar] [CrossRef]
- Vinogradov, A.E. Nucleotypic effect in homeotherms: Body-mass independent resting metabolic rate of passerine birds is related to genome size. Evolution 1997, 51, 220–225. [Google Scholar] [CrossRef] [PubMed]
- Gregory, T.R. A bird’s-eye view of the C-value enigma: Genome size, cell size, and metabolic rate in the class Aves. Evolution 2002, 56, 121–130. [Google Scholar] [CrossRef] [PubMed]
- Gregory, T.R. Variation across amphibian species in the size of the nuclear genome supports a pluralistic, hierarchical approach to the C-value enigma. Biol. J. Linn. Soc. 2003, 79, 329–339. [Google Scholar] [CrossRef]
- Olmo, E. Reptiles: A group of transition in the evolution of genome size and of the nucleotypic effect. Cytogenet. Genome Res. 2003, 101, 166–171. [Google Scholar] [CrossRef] [PubMed]
- Gardner, J.D.; Laurin, M.; Organ, C.L. The relationship between genome size and metabolic rate in extant vertebrates. Philos. Trans. R. Soc. Lond. B Bio. Sci. 2020, 375, 20190146. [Google Scholar] [CrossRef] [PubMed] [Green Version]
- Hermaniuk, A.; Rybacki, M.; Taylor, J.R. Metabolic rate of diploid and triploid edible frog Pelophylax esculentus correlates inversely with cell size in tadpoles but not in frogs. Physiol. Biochem. Zool. 2017, 90, 230–239. [Google Scholar] [CrossRef]
- Lahnsteiner, F.; Lahnsteiner, E.; Kletzl, M. Differences in metabolism of triploid and diploid Salmo trutta f. lacustris under acclimation conditions and after exposure to stress situations. Aquac. Res. 2019, 50, 2444–2459. [Google Scholar] [CrossRef]
- Warner, D.A.; Edwards, G.E. Effects of polyploidy on photosynthesis. Photosynth. Res. 1993, 35, 135–147. [Google Scholar] [CrossRef]
- Licht, L.E.; Lowcock, L.A. Genome size and metabolic rate in salamanders. Comp. Biochem. Physiol. B Comp. Biochem. 1991, 100, 83–92. [Google Scholar] [CrossRef]
- Atkins, M.E.; Benfey, T.J. Effect of acclimation temperature on routine metabolic rate in triploid salmonids. Comp. Biochem. Physiol. A Mol. Integr. Physiol. 2008, 149, 157–161. [Google Scholar] [CrossRef] [PubMed]
- Hermaniuk, A.; van de Pol, I.L.; Verberk, W.C. Are acute and acclimated thermal effects on metabolic rate modulated by cell size? a comparison between diploid and triploid zebrafish larvae. J. Exp. Biol. 2021, jeb.227124. [Google Scholar] [CrossRef]
- Starostová, Z.; Kubička, L.; Konarzewski, M.; Kozłowski, J.; Kratochvíl, L. Cell size but not genome size affects scaling of metabolic rate in eyelid geckos. Am. Nat. 2009, 174, E100–E105. [Google Scholar] [CrossRef]
- Glazier, D.S. Scaling of metabolic scaling within physical limits. Systems 2014, 2, 425–450. [Google Scholar] [CrossRef] [Green Version]
- Starostová, Z.; Konarzewski, M.; Kozłowski, J.; Kratochvíl, L. Ontogeny of metabolic rate and red blood cell size in eyelid geckos: Species follow different paths. PLoS ONE 2013, 8, e64715. [Google Scholar] [CrossRef] [PubMed] [Green Version]
- Zhang, Y.; Huang, Q.; Liu, S.; He, D.; Wei, G.; Luo, Y. Intraspecific mass scaling of metabolic rates in grass carp (Ctenopharyngodon idellus). J. Comp. Physiol. B 2014, 184, 347–354. [Google Scholar] [CrossRef] [PubMed]
- Luo, Y.; He, D.; Li, G.; Xie, H.; Zhang, Y.; Huang, Q. Intraspecific metabolic scaling exponent depends on red blood cell size in fishes. J. Exp. Biol. 2015, 218, 1496–1503. [Google Scholar] [CrossRef] [PubMed] [Green Version]
- Glazier, D.S.; Butler, E.M.; Lombardi, S.A.; Deptola, T.J.; Reese, A.J.; Satterthwaite, E.V. Ecological effects on metabolic scaling: Amphipod responses to fish predators in freshwater springs. Ecol. Monogr. 2011, 81, 599–618. [Google Scholar] [CrossRef]
- Huang, Q.; Zhang, Y.; Liu, S.; Wang, W.; Luo, Y. Intraspecific scaling of the resting and maximum metabolic rates of the crucian carp (Carassius auratus). PLoS ONE 2013, 8, e82837. [Google Scholar] [CrossRef]
- Lv, X.; Xie, H.; Xia, D.; Shen, C.; Li, J.; Luo, Y. Mass scaling of the resting and maximum metabolic rates of the black carp. J. Comp. Physiol. B 2018, 188, 591–598. [Google Scholar] [CrossRef] [PubMed]
- Hjelmen, C.E.; Parrott, J.J.; Srivastav, S.P.; McGuane, A.S.; Ellis, L.L.; Stewart, A.D.; Johnston, J.S.; Tarone, A.M. Effect of phenotype selection on genome size variation in two species of Diptera. Genes 2020, 11, 218. [Google Scholar] [CrossRef] [Green Version]
- Jaeckle, W.B. Variation in the size, energy content, and biochemical composition of invertebrate eggs: Correlates to the mode of larval development. In Ecology of Marine Invertebrate Larvae; McEdward, L.R., Ed.; CRC Press: Boca Raton, FL, USA, 1995; pp. 49–77. [Google Scholar]
- Licht, L.E.; Bogart, J.P. Embryonic development and temperature tolerance in diploid and polyploid salamanders (genus Ambystoma). Am. Midl. Nat. 1989, 122, 401–407. [Google Scholar] [CrossRef]
- Moran, A.L.; McAlister, J.S. Egg size as a life history character of marine invertebrates: Is it all it’s cracked up to be? Biol. Bull. 2009, 216, 226–242. [Google Scholar] [CrossRef] [Green Version]
- Popoff, M. Experimentelle Zellstudien. Arch. Zellforsch. 1908, 1, 245–379. [Google Scholar]
- Root, R.B.; Chaplin, S.J. The life-styles of tropical milkweed bugs, Oncopeltus (Hemiptera: Lygaeidae) utilizing the same hosts. Ecology 1976, 57, 132–140. [Google Scholar] [CrossRef]
- Eckhardt, R.C. The adaptive syndromes of two guilds of insectivorous birds in the Colorado Rocky Mountains. Ecol. Monogr. 1979, 49, 129–149. [Google Scholar] [CrossRef]
- Price, P.W. Macroevolutionary Theory on Macroecological Patterns; Cambridge University Press: Cambridge, UK, 2003. [Google Scholar]
- Wright, J.; Bolstad, G.H.; Araya-Ajoy, Y.G.; Dingemanse, N.J. Life-history evolution under fluctuating density-dependent selection and the adaptive alignment of pace-of-life syndromes. Biol. Rev. 2019, 94, 230–247. [Google Scholar] [CrossRef] [PubMed] [Green Version]
- Martin, L.B.; Ghalambor, C.K.; Woods, H.A. (Eds.) Integrative Organismal Biology; Wiley Blackwell: Hoboken, NJ, USA, 2015. [Google Scholar]
- Mayr, E. What Evolution Is; Basic Books: New York, NY, USA, 2001. [Google Scholar]
- Dawkins, R. The Extended Phenotype: The Long Reach of the Gene; Oxford University Press: Oxford, UK, 2016. [Google Scholar]
- Southwood, T.R.E. Tactics, strategies and templets. Oikos 1988, 52, 3–18. [Google Scholar] [CrossRef]
- Fox, D.T.; Soltis, D.E.; Soltis, P.S.; Ashman, T.L.; Van de Peer, Y. Polyploidy: A biological force from cells to ecosystems. Trends Cell Biol. 2020, 30, 688–694. [Google Scholar] [CrossRef]
- Van de Peer, Y.; Ashman, T.L.; Soltis, P.S.; Soltis, D.E. Polyploidy: An evolutionary and ecological force in stressful times. Plant Cell 2020, koaa015. [Google Scholar] [CrossRef] [PubMed]
- Crozier, W.J. On curves of growth, especially in relation to temperature. J. Gen. Physiol. 1926, 10, 53–73. [Google Scholar] [CrossRef] [PubMed]
- Cossins, A. Temperature Biology of Animals; Chapman and Hall: London, UK, 1987. [Google Scholar]
- Dell, A.I.; Pawar, S.; Savage, V.M. Systematic variation in the temperature dependence of physiological and ecological traits. Proc. Natl. Acad. Sci. USA 2011, 108, 10591–10596. [Google Scholar] [CrossRef] [PubMed] [Green Version]
- Clarke, A. Principles of Thermal Ecology: Temperature, Energy and Life; Oxford University Press: Oxford, UK, 2017. [Google Scholar]
- Li, Q.; Zhu, X.; Xiong, W.; Zhu, Y.; Zhang, J.; Djiba, P.K.; Lv, X.; Luo, Y. Effects of temperature on metabolic scaling in black carp. PeerJ 2020, 8, e9242. [Google Scholar] [CrossRef]
- Angilletta, M.J.; Steury, T.D.; Sears, M.W. Temperature, growth rate, and body size in ectotherms: Fitting pieces of a life-history puzzle. Integr. Comp. Biol. 2004, 44, 498–509. [Google Scholar] [CrossRef] [PubMed]
- Verberk, W.C.; Atkinson, D.; Hoefnagel, K.N.; Hirst, A.G.; Horne, C.R.; Siepel, H. Shrinking body sizes in response to warming: Explanations for the temperature–size rule with special emphasis on the role of oxygen. Biol. Rev. 2020. [Google Scholar] [CrossRef] [PubMed]
- Schlichting, C.D. Phenotypic integration and environmental change. BioScience 1989, 39, 460–464. [Google Scholar] [CrossRef]
- Pigliucci, M. Phenotypic integration: Studying the ecology and evolution of complex phenotypes. Ecol. Lett. 2003, 6, 265–272. [Google Scholar] [CrossRef] [Green Version]
- West-Eberhard, M.J. Developmental Plasticity and Evolution; Oxford University Press: Oxford, UK, 2003. [Google Scholar]
- Piersma, T.; van Gils, J.A. The Flexible Phenotype: A Body-Centred Integration of Ecology, Physiology, and Behavior; Oxford University Press: Oxford, UK, 2011. [Google Scholar]
- Kleyer, M.; Trinogga, J.; Cebrián-Piqueras, M.A.; Trenkamp, A.; Fløjgaard, C.; Ejrnæs, R.; Bouma, T.J.; Minden, V.; Maier, M.; Mantilla-Contreras, J.; et al. Trait correlation network analysis identifies biomass allocation traits and stem specific length as hub traits in herbaceous perennial plants. J. Ecol. 2019, 107, 829–842. [Google Scholar] [CrossRef]
- He, N.; Li, Y.; Liu, C.; Xu, L.; Li, M.; Zhang, J.; He, J.; Tang, Z.; Han, X.; Ye, Q.; et al. Plant trait networks: Improved resolution of the dimensionality of adaptation. Trends Ecol. Evol. 2020, 35, 908–918. [Google Scholar] [CrossRef] [PubMed]
- Khanna, K.R. The haploid and the spontaneous diploid race in Octoblepharum albidum Hedw. Cytologia 1960, 25, 334–341. [Google Scholar] [CrossRef] [Green Version]
- Schneller, J.J. Untersuchungen an einheimischen Farnen, insbesondere der Dryopteris filix-mas-Gruppe. 1. Ber. Schweis. Bot. Gesellsch. 1974, 84, 195–217. [Google Scholar]
- Ježilová, E.; Nožková-Hlaváčková, V.; Duchoslav, M. Photosynthetic characteristics of three ploidy levels of Allium oleraceum L. (A maryllidaceae) differing in ecological amplitude. Plant Species Biol. 2015, 30, 212–224. [Google Scholar] [CrossRef]
- Kumar, G.; Dwivedi, K. Induced polyploidization in Brassica campestris L. (Brassicaceae). Cytol. Genet. 2014, 48, 103–110. [Google Scholar] [CrossRef] [Green Version]
- Zhang, C.; Wang, H.; Xu, Y.; Zhang, S.; Wang, J.; Hu, B.; Hou, X.; Li, Y.; Liu, T. Enhanced relative electron transport rate contributes to increased photosynthetic capacity in autotetraploid Pak Choi. Plant Cell Physiol. 2020, 61, 761–774. [Google Scholar] [CrossRef]
- Tan, G.Y.; Dunn, G.M. Relationship of stomatal length and frequency and pollen-grain diameter to ploidy level in Bromus inermis Leyss. Crop. Sci. 1973, 13, 332–334. [Google Scholar] [CrossRef]
- Hosseini, H.; Chehrazi, M.; Ahmadi, D.N.; Sorestani, M.M. Colchicine-induced autotetraploidy and altered plant cytogenetic and morpho-physiological traits in Catharanthus roseus (L.) G. Don. Adv. Hortic. Sci. 2018, 32, 229–238. [Google Scholar] [CrossRef]
- Shala, A.; Deng, Z. Investigation of morphological and anatomical changes in Catharanthus roseus (L.) G. Don due to colchicine induced polyploidy. Sci. J. Flower. Ornam. Plant. 2018, 5, 233–243. [Google Scholar] [CrossRef]
- Seidler-Łożykowska, K. Determination of the ploidy level in chamomile (Chamomilla recutita (L.) Rausch.) strains rich in a-bisabolol. J. Appl. Genet. 2003, 44, 151–155. [Google Scholar]
- Malik, C.P.; Tandon, S.L. Morphological and cytological studies of a natural polyploid complex in Convolvulus pluricaulis Chois. Cytologia 1959, 24, 523–531. [Google Scholar] [CrossRef] [Green Version]
- Biswas, A.K.; Bhattacharyya, N.K. Induced polyploidy in legumes. I. Cyamopsis psoraloides DC. Cytologia 1971, 36, 469–479. [Google Scholar] [CrossRef] [Green Version]
- Takamura, T.; Miyajima, I. Colchicine induced tetraploids in yellow-flowered cyclamens and their characteristics. Sci. Hort. 1996, 65, 305–312. [Google Scholar] [CrossRef]
- Bretagnolle, F.; Lumaret, R. Bilateral polyploidization in Dactylis glomerata L. subsp. lusitanica: Occurrence, morphological and genetic characteristics of first polyploids. Euphytica 1995, 84, 197–207. [Google Scholar] [CrossRef]
- Abdoli, M.; Moieni, A.; Badi, H.N. Morphological, physiological, cytological and phytochemical studies in diploid and colchicine-induced tetraploid plants of Echinacea purpurea (L.). Acta Physiol. Plant. 2013, 35, 2075–2083. [Google Scholar] [CrossRef]
- Marinho, R.C.; Mendes-Rodrigues, C.; Bonetti, A.M.; Oliveira, P.E. Pollen and stomata morphometrics and polyploidy in Eriotheca (Malvaceae-Bombacoideae). Plant Biol. 2014, 16, 508–511. [Google Scholar] [CrossRef] [PubMed]
- Wang, L.J.; Sheng, M.Y.; Wen, P.C.; Du, J.Y. Morphological, physiological, cytological and phytochemical studies in diploid and colchicine-induced tetraploid plants of Fagopyrum tataricum (L.) Gaertn. Bot. Stud. 2017, 58, 2. [Google Scholar] [CrossRef] [Green Version]
- Porter, K.B.; Weiss, M.G. The effect of polyploidy on soybeans. Agron. J. 1948, 40, 710–724. [Google Scholar] [CrossRef]
- Biswas, A.K.; Bhattacharyya, N.K. Induced polyploidy in legumes. II. Glycine max (L.). Cytologia 1972, 37, 605–617. [Google Scholar] [CrossRef] [Green Version]
- Chen, C.H.; Goeden-Kallemeyn, Y.C. In vitro induction of tetraploid plants from colchicine-treated diploid daylily callus. Euphytica 1979, 28, 705–709. [Google Scholar] [CrossRef]
- Shahriari-Ahmadi, F.; Dehghan, E.; Farsi, M.; Azizi, M. Tetraploid induction of Hyoscyamus muticus L. using colchicine treatment. Pak. J. Biol. Sci. 2008, 11, 2653–2659. [Google Scholar] [CrossRef] [Green Version]
- Niu, L.; Tao, Y.B.; Chen, M.S.; Fu, Q.; Dong, Y.; He, H.; Xu, Z.F. Identification and characterization of tetraploid and octoploid Jatropha curcas induced by colchicine. Caryologia 2016, 69, 58–66. [Google Scholar] [CrossRef] [Green Version]
- Eenink, A.H. Plant characteristics for distinction of diploid, triploid and tetraoloid lettuce. Sci. Hort. 1980, 12, 109–115. [Google Scholar] [CrossRef]
- Ye, Y.M.; Tong, J.; Shi, X.P.; Yuan, W.; Li, G.R. Morphological and cytological studies of diploid and colchicine-induced tetraploid lines of crape myrtle (Lagerstroemia indica L.). Sci. Hort. 2010, 124, 95–101. [Google Scholar] [CrossRef]
- Dibyendu, T. Cytogenetic characterization of induced autotetraploids in grass pea (Lathyrus sativus L.). Caryologia 2010, 63, 62–72. [Google Scholar] [CrossRef]
- Aqafarini, A.; Lotfi, M.; Norouzi, M.; Karimzadeh, G. Induction of tetraploidy in garden cress: Morphological and cytological changes. Plant Cell Tissue Organ Cult. 2019, 137, 627–635. [Google Scholar] [CrossRef]
- Masima, I. Studies on the tetraploid flax induced by colchicine. Cytologia 1942, 12, 460–468. [Google Scholar] [CrossRef]
- Głowacka, K.; Jeżowski, S.; Kaczmarek, Z. In vitro induction of polyploidy by colchicine treatment of shoots and preliminary characterisation of induced polyploids in two Miscanthus species. Ind. Crop. Prod. 2010, 32, 88–96. [Google Scholar] [CrossRef]
- Dixit, V.; Verma, S.; Chaudhary, B.R. Changes in ploidy and its effect on thymoquinone concentrations in Nigella sativa L. seeds. J. Hort. Sci. Biotech. 2016, 90, 537–542. [Google Scholar] [CrossRef]
- Omidbaigi, R.; Mirzaee, M.; Hasani, M.E.; Sedghi Moghadam, M. Induction and identification of polyploidy in basil (Ocimum basilicum L.) medicinal plant by colchicine treatment. Int. J. Plant Prod. 2010, 4, 87–98. [Google Scholar]
- Fang, N.; Xu, R.; Huang, L.; Zhang, B.; Duan, P.; Li, N.; Luo, Y.; Li, Y. SMALL GRAIN 11 controls grain size, grain number and grain yield in rice. Rice 2016, 9, 64. [Google Scholar] [CrossRef] [Green Version]
- Li, N.; Xu, R.; Duan, P.; Li, Y. Control of grain size in rice. Plant Reprod. 2018, 31, 237–251. [Google Scholar] [CrossRef]
- Biswas, A.K.; Bhattacharyya, N.K. Induced polyploidy in legumes. III. Phaseolus vulgaris L. Cytologia 1976, 41, 105–110. [Google Scholar] [CrossRef] [Green Version]
- Chansler, M.T.; Ferguson, C.J.; Fehlberg, S.D.; Prather, L.A. The role of polyploidy in shaping morphological diversity in natural populations of Phlox amabilis. Am. J. Bot. 2016, 103, 1546–1558. [Google Scholar] [CrossRef] [PubMed] [Green Version]
- Azeez, S.O.; Faluyi, J.O.; Oziegbe, M. Cytological, foliar epidermal and pollen grain studies in relation to ploidy levels in four species of Physalis L. (Solanaceae) from Nigeria. Int. J. Biol. Chem. Sci. 2019, 13, 1960–1968. [Google Scholar] [CrossRef] [Green Version]
- Van Dijkt, P.; Van Delden, W. Evidence for autotetraploidy in Plantago media and comparisons between natural and artificial cytotypes concerning cell size and fertility. Heredity 1990, 65, 349–357. [Google Scholar] [CrossRef] [Green Version]
- Sabzehzari, M.; Hoveidamanesh, S.; Modarresi, M.; Mohammadi, V. Morphological, anatomical, physiological, and cytological studies in diploid and tetraploid plants of Ispaghul (Plantago ovata Forsk.). Genet. Resour. Crop. Evol. 2020, 67, 129–137. [Google Scholar] [CrossRef]
- Sabzehzari, M.; Hoveidamanesh, S.; Modarresi, M.; Mohammadi, V. Morphological, anatomical, physiological, and cytological studies in diploid and tetraploid plants of Plantago psyllium. Plant Cell Tissue Organ Cult. 2019, 139, 131–137. [Google Scholar] [CrossRef]
- Cheng, W.; Tang, M.; Xie, Y.; Xu, L.; Wang, Y.; Luo, X.; Fan, L.; Liu, L. Transcriptome-based gene expression profiling of diploid radish (Raphanus sativus L.) and the corresponding autotetraploid. Mol. Biol. Rep. 2019, 46, 933–945. [Google Scholar] [CrossRef] [PubMed]
- Cota-Sánchez, J.H.; Bomfim-Patrício, M.C. Seed morphology, polyploidy and the evolutionary history of the epiphytic cactus Rhipsalis baccifera (Cactaceae). Polibotánica 2010, 29, 107–129. [Google Scholar]
- Kumar, G.; Yadav, R.S. Impact of genome doubling on cytomorphological characters of Sesamum indicum L. (Pedaliaceae). Chromosome Bot. 2010, 5, 43–47. [Google Scholar] [CrossRef] [Green Version]
- Majdi, M.; Karimzadeh, G.; Malboobi, M.A.; Omidbaigi, R.; Mirzaghaderi, G. Induction of tetraploidy to feverfew (Tanacetum parthenium Schulz-Bip.): Morphological, physiological, cytological, and phytochemical changes. HortScience 2010, 45, 16–21. [Google Scholar] [CrossRef] [Green Version]
- Kumar, G.; Dwivedi, H. Induced autotetraploidy in Trachyspermum ammi (L.) Sprague (Apiaceae). Cytol. Genet. 2017, 51, 391–400. [Google Scholar] [CrossRef]
- Noori, S.A.S.; Norouzi, M.; Karimzadeh, G.; Shirkool, K.; Niazian, M. Effect of colchicine-induced polyploidy on morphological characteristics and essential oil composition of ajowan (Trachyspermum ammi L.). Plant Cell Tissue Organ Cult. 2017, 130, 543–551. [Google Scholar] [CrossRef]
- Evans, A.M. The production and identification of polyploids in red clover, white clover and lucerne. New Phytol. 1955, 54, 149–162. [Google Scholar] [CrossRef]
- Tulay, E.; Unal, M. Production of colchicine induced tetraploids in Vicia villosa Roth. Caryologia 2010, 63, 292–303. [Google Scholar] [CrossRef] [Green Version]
- Rao, S.R.; Raina, S.N. Cytological evaluation of colchitetraploidy in moth bean (Vigna aconitifolia) and its allied species. J. Arid Legume 2006, 2, 389–396. [Google Scholar]
- Dalbato, A.L.; Kobza, F.; Karlsson, L.M. Effect of polyploidy and pollination methods on capsule and seed set of pansies (Viola x wittrockiana Gams). Hortic. Sci. 2013, 40, 22–30. [Google Scholar] [CrossRef] [Green Version]
- Wang, L.; Luo, Z.; Wang, L.; Deng, W.; Wei, H.; Liu, P.; Liu, M. Morphological, cytological and nutritional changes of autotetraploid compared to its diploid counterpart in Chinese jujube (Ziziphus jujuba Mill.). Sci. Hort. 2019, 249, 263–270. [Google Scholar] [CrossRef]
- Kawamura, N.; Nakada, T. Studies on the increase in egg size in tetraploid silkworms induced from a normal and a giant-egg strains. Jpn. J. Genet. 1981, 56, 249–256. [Google Scholar] [CrossRef] [Green Version]
- Oshima, K.; Morishima, K.; Yamaha, E.; Arai, K. Reproductive capacity of triploid loaches obtained from Hokkaido Island, Japan. Ichthyol. Res. 2005, 52, 1–8. [Google Scholar] [CrossRef]
- Vargas, A.; Del Pino, E.M. Analysis of cell size in the gastrula of ten frog species reveals a correlation of egg with cell sizes, and a conserved pattern of small cells in the marginal zone. J. Exp. Zool. B Mol. Devel. Evol. 2017, 328, 88–96. [Google Scholar] [CrossRef] [PubMed]
- Angert, E.R. DNA replication and genomic architecture of very large bacteria. Annu. Rev. Microbiol. 2012, 66, 197–212. [Google Scholar] [CrossRef] [PubMed]
- Soppa, J. Polyploidy in archaea and bacteria: About desiccation resistance, giant cell size, long-term survival, enforcement by a eukaryotic host and additional aspects. J. Mol. Microbiol. Biotech. 2014, 24, 409–419. [Google Scholar] [CrossRef]
- Müller, I. Die Variabilität der Zellgenerationsdauer von Saccharomyces cerevisiae in Abhängigkeit von Ploidie, Heterozygotie und Umwelt. Z. Vererb. 1965, 97, 111–137. [Google Scholar] [CrossRef]
- Mable, B.K. Ploidy evolution in the yeast Saccharomyces cerevisiae: A test of the nutrient limitation hypothesis. J. Evol. Biol. 2001, 14, 157–170. [Google Scholar] [CrossRef] [Green Version]
- Storchová, Z.; Breneman, A.; Cande, J.; Dunn, J.; Burbank, K.; O’Toole, E.; Pellman, D. Genome-wide genetic analysis of polyploidy in yeast. Nature 2006, 443, 541–547. [Google Scholar] [CrossRef] [PubMed]
- Wettstein, F. Experimentelle Untersuchungen zum Artbildungsproblem. 1. Zellgrössenregulation und Fertilwerden einer polyploiden Bryum-Sippe. Z. Indukt. Abstamm. Ver. 1937, 74, 34–53. [Google Scholar]
- Barrington, D.S.; Paris, C.A.; Ranker, T.A. Systematic inferences from spore and stomate size in the ferns. Am. Fern J. 1986, 76, 149–159. [Google Scholar] [CrossRef]
- Wagner, W.H. Reticulate evolution in the Appalachian aspleniums. Evolution 1954, 8, 103–118. [Google Scholar] [CrossRef]
- Lovis, J.D.; Reichstein, T. Die zwei diploiden Asplenium trichomanes x viride-Bastarde und ihre Fahigkeit zur spontanen Chromosomenverdoppelung. Bauhinia 1968, 4, 53–63. [Google Scholar]
- Lawton, E. Regeneration and induced polyploidy in ferns. Am. J. Bot. 1932, 19, 303–334. [Google Scholar] [CrossRef]
- Muller, J. Form and function in angiosperm pollen. Ann. Missouri Bot. Gard. 1979, 66, 593–632. [Google Scholar] [CrossRef]
- Jambhale, N.D.; Nerkar, Y.S. Indirect selection criteria for isolation of induced polyploids in the Abelmoschus species hybrids. Cytologia 1982, 47, 603–607. [Google Scholar] [CrossRef] [Green Version]
- Beck, S.L.; Dunlop, R.W.; Fossey, A. Stomatal length and frequency as a measure of ploidy level in black wattle, Acacia mearnsii (de Wild). Bot. J. Linn. Soc. 2003, 141, 177–181. [Google Scholar] [CrossRef] [Green Version]
- Przywara, L.; Pandey, K.K.; Sanders, P.M. Length of stomata as an indicator of ploidy level in Actinidia deliciosa. N. Z. J. Bot. 1988, 26, 179–182. [Google Scholar] [CrossRef]
- Gould, F.W. Pollen size as related to polyploidy and speciation in the Andropogon saccharoides—A. barbinodis complex. Brittonia 1957, 9, 71–75. [Google Scholar] [CrossRef]
- Aryavand, A.; Ehdaie, B.; Tran, B.; Waines, J.G. Stomatal frequency and size differentiate ploidy levels in Aegilops neglecta. Genet. Resour. Crop. Evol. 2003, 50, 175–182. [Google Scholar] [CrossRef]
- Yousef, E.A.A.; Elsadek, M.A. A Comparative study of morphological and volatile oil composition characteristics in diploid and tetraploid garlic plants. Egypt. J. Hortic. 2020, 47, 1–14. [Google Scholar] [CrossRef]
- Chen, C.; Hou, X.; Zhang, H.; Wang, G.; Tian, L. Induction of Anthurium andraeanum “Arizona” tetraploid by colchicine in vitro. Euphytica 2011, 181, 137–145. [Google Scholar] [CrossRef]
- Altmann, T.; Damm, B.; Frommer, W.B.; Martin, T.; Morris, P.C.; Schweizer, D.; Willmitzer, L.; Schmidt, R. Easy determination of ploidy level in Arabidopsis thaliana plants by means of pollen size measurement. Plant Cell Rep. 1994, 13, 652–656. [Google Scholar] [CrossRef]
- Li, X.; Yu, E.; Fan, C.; Zhang, C.; Fu, T.; Zhou, Y. Developmental, cytological and transcriptional analysis of autotetraploid Arabidopsis. Planta 2012, 236, 579–596. [Google Scholar] [CrossRef] [PubMed]
- Tsukaya, H. Does ploidy level directly control cell size? Counterevidence from Arabidopsis genetics. PLoS ONE 2013, 8, e83729. [Google Scholar] [CrossRef]
- Robinson, D.O.; Coate, J.E.; Singh, A.; Hong, L.; Bush, M.; Doyle, J.J.; Roeder, A.H. Ploidy and size at multiple scales in the Arabidopsis sepal. Plant Cell 2018, 30, 2308–2329. [Google Scholar] [CrossRef] [PubMed] [Green Version]
- Singsit, C.; Ozias-Akins, P. Rapid estimation of ploidy levels in in vitro-regenerated interspecific Arachis hybrids and fertile triploids. Euphytica 1992, 64, 183–188. [Google Scholar] [CrossRef]
- Chen, H.; Lu, Z.; Wang, J.; Chen, T.; Gao, J.; Zheng, J.; Zhang, S.; Xi, J.; Huang, X.; Guo, A.; et al. Induction of new tetraploid genotypes and heat tolerance assessment in Asparagus officinalis L. Sci. Hort. 2020, 264, 109168. [Google Scholar] [CrossRef]
- Hu, Y.; Sun, D.; Hu, H.; Zuo, X.; Xia, T.; Xie, J. A comparative study on morphological and fruit quality traits of diploid and polyploid carambola (Averrhoa carambola L.) genotypes. Sci. Hort. 2021, 277, 109843. [Google Scholar] [CrossRef]
- Pan-pan, H.; Wei-xu, L.; Hui-hui, L. In vitro induction and identification of autotetraploid of Bletilla striata (Thunb.) Reichb. f. by colchicine treatment. Plant Cell Tissue Organ Cult. 2018, 132, 425–432. [Google Scholar] [CrossRef]
- Ishigaki, G.; Gondo, T.; Suenaga, K.; Akashi, R. Induction of tetraploid ruzigrass (Brachiaria ruziziensis) plants by colchicine treatment of in vitro multiple-shoot clumps and seedlings. Grassl. Sci. 2009, 55, 164–170. [Google Scholar] [CrossRef]
- Howard, H.W. The size of seeds in diploid and autotetraploid Brassica oleracea L. J. Genet. 1939, 38, 325–340. [Google Scholar] [CrossRef]
- Chen, G.; Sun, W.B.; Sun, H. Morphological characteristics of leaf epidermis and size variation of leaf, flower and fruit in different ploidy levels in Buddleja macrostachya (Buddlejaceae). J. Syst. Evol. 2009, 47, 231–236. [Google Scholar] [CrossRef]
- Esmaeili, G.; Van Laere, K.; Muylle, H.; Leus, L. Artificial chromosome doubling in allotetraploid Calendula officinalis. Front. Plant Sci. 2020, 11, 622. [Google Scholar] [CrossRef]
- Ng’etich, W.; Wachira, F.N. Variations in leaf anatomy and gas exchange in tea clones with different ploidy. J. Hort. Sci. Biotech. 2003, 78, 173–176. [Google Scholar] [CrossRef]
- Mansouri, H.; Bagheri, M. Induction of polyploidy and its effect on Cannabis sativa L. In Cannabis sativa L.—Botany and Biotechnology; Chandra, S., Lata, H., ElSohly, M., Eds.; Springer: Cham, Switzerland, 2017; pp. 365–383. [Google Scholar] [CrossRef]
- Moghbel, N.; Borujeni, M.K.; Bernard, F. Colchicine effect on the DNA content and stomata size of Glycyrrhiza glabra var. glandulifera and Carthamus tinctorius L. cultured in vitro. J. Genet. Eng. Biotechnol. 2015, 13, 1–6. [Google Scholar] [CrossRef] [PubMed] [Green Version]
- Callegari-Jacques, S.; Bodanese-Zanettini, M.H. Induction and identification of polyploids in Cattleya intermedia Lindl. (Orchidaceae) by in vitro techniques. Ciênc. Rural 2000, 30, 105–111. [Google Scholar] [CrossRef] [Green Version]
- Kaensaksiri, T.; Soontornchainaksaeng, P.; Soonthornchareonnon, N.; Prathanturarug, S. In vitro induction of polyploidy in Centella asiatica (L.) Urban. Plant Cell Tissue Organ Cult. 2011, 107, 187. [Google Scholar] [CrossRef]
- Stanys, V.; Weckman, A.; Staniene, G.; Duchovskis, P. In vitro induction of polyploidy in Japanese quince (Chaenomeles japonica). Plant Cell Tissue Organ Cult. 2006, 84, 263–268. [Google Scholar] [CrossRef]
- Mosquin, T. Evidence for autopolyploidy in Epilobium angustifolium (Onagraceae). Evolution 1967, 21, 713–719. [Google Scholar] [CrossRef] [PubMed] [Green Version]
- Maherali, H.; Walden, A.E.; Husband, B.C. Genome duplication and the evolution of physiological responses to water stress. New Phytol. 2009, 184, 721–731. [Google Scholar] [CrossRef] [PubMed]
- Kushwah, K.S.; Verma, R.C.; Patel, S.; Jain, N.K. Colchicine induced polyploidy in Chrysanthemum carinatum L. J. Phylogenetics Evol. Biol. 2018, 6, 1000193. [Google Scholar] [CrossRef]
- Endo, M.; Kim, J.S.; Inada, I. Production and characteristics of chromosome-doubled plants of small-flowered garden Chrysanthemum, Dendranthema × grandiflorum (Ramat.) Kitam. cv. YS by colchicine treatment of cultured shoot tips. J. Jpn. Soc. Hortic. Sci. 1997, 65, 825–833. [Google Scholar] [CrossRef] [Green Version]
- Jaskani, M.J.; Kwon, S.W.; Kim, D.H. Comparative study on vegetative, reproductive and qualitative traits of seven diploid and tetraploid watermelon lines. Euphytica 2005, 145, 259–268. [Google Scholar] [CrossRef]
- Padoan, D.; Mossad, A.; Chiancone, B.; Germana, M.A.; Khan, P.S.S.V. Ploidy levels in Citrus clementine affects leaf morphology, stomatal density and water content. Exp. Plant Physiol. 2013, 25, 283–290. [Google Scholar] [CrossRef] [Green Version]
- Allario, T.; Brumos, J.; Colmenero-Flores, J.M.; Tadeo, F.; Froelicher, Y.; Talon, M.; Navarro, L.; Ollitrault, P.; Morillon, R. Large changes in anatomy and physiology between diploid Rangpur lime (Citrus limonia) and its autotetraploid are not associated with large changes in leaf gene expression. J. Exp. Bot. 2011, 62, 2507–2519. [Google Scholar] [CrossRef] [Green Version]
- Tan, F.-Q.; Tu, H.; Wang, R.; Wu, X.-M.; Xie, K.-D.; Chen, J.J.; Zhang, H.Y.; Xu, J.; Guo, W.W. Metabolic adaptation following genome doubling in citrus doubled diploids revealed by non-targeted metabolomics. Metabolomics 2017, 13, 143. [Google Scholar] [CrossRef]
- Wu, Y.; Li, W.; Dong, J.; Yang, N.; Zhao, X.; Yang, W. Tetraploid induction and cytogenetic characterization for Clematis heracleifolia. Caryologia 2013, 66, 215–220. [Google Scholar] [CrossRef] [Green Version]
- Mishra, M.K. Stomatal characteristics at different ploidy levels in Coffea L. Ann. Bot. 1997, 80, 689–692. [Google Scholar] [CrossRef] [Green Version]
- McGoey, B.V.; Chau, K.; Dickinson, T.A. Stomata size in relation to ploidy level in North American hawthorns (Crataegus, Rosaceae). Madroño 2014, 61, 177–193. [Google Scholar] [CrossRef]
- Chaves, A.L.A.; Chiavegatto, R.B.; Gavilanes, M.L.; Benites, F.R.G.; Techio, V.H. Effect of polyploidy on the leaf epidermis structure of Cynodon dactylon (L.) Pers. (Poaceae). Biologia 2018, 73, 1007–1013. [Google Scholar] [CrossRef]
- Bretagnolle, F.; Thompson, J.D.; Lumaret, R. The influence of seed size variation on seed germination and seedling vigour in diploid and tetraploid Dactylis glomerata L. Ann. Bot. 1995, 76, 607–615. [Google Scholar] [CrossRef]
- Cukrova, V.; Avratovscukova, N. Photosynthetic activity, chlorophyll content, and stomatal characteristics in diploid and tetraploid types of Datura stramonium L. Photosynthetica 1968, 2, 227–228. [Google Scholar]
- Zhang, X.; Gao, J. Colchicine-induced tetraploidy in Dendrobium cariniferum and its effect on plantlet morphology, anatomy and genome size. Plant Cell Tissue Organ Cult. 2020. [Google Scholar] [CrossRef]
- Heping, H.; Shanlin, G.; Lanlan, C.; Xiaoke, J. In vitro induction and identification of autotetraploids of Dioscorea zingiberensis. Vitr. Cell. Dev. Biol. Plant 2008, 44, 448–455. [Google Scholar] [CrossRef]
- Zahedi, A.A.; Hosseini, B.; Fattahi, M. Effect of different concentration of colchicine on some morphological and phytochemical characteristics of Dracocephalum kotschyi Boiss. J. Plant Prod. 2018, 40, 31–40. [Google Scholar] [CrossRef]
- Cabahug, R.A.M.; Khanh, H.T.T.M.; Lim, K.B.; Hwang, Y.J. Phenotype and ploidy evaluation of colchicine-induced Echeveria ‘Peerless’. Toxicol. Environ. Health Sci. 2020. [Google Scholar] [CrossRef]
- Spies, J.J. Stomatal area as an anatomical criterion for the determination of chromosome number in the Eragrostis curvula complex. Bothalia 1982, 14, 119–122. [Google Scholar] [CrossRef] [Green Version]
- Byrne, M.C.; Nelson, C.J.; Randall, D.D. Ploidy effects on anatomy and gas exchange of tall fescue leaves. Plant Physiol. 1981, 68, 891–893. [Google Scholar] [CrossRef] [PubMed] [Green Version]
- Wei, N.; Du, Z.; Liston, A.; Ashman, T.L. Genome duplication effects on functional traits and fitness are genetic context and species dependent: Studies of synthetic polyploid Fragaria. Am. J. Bot. 2020, 107, 262–272. [Google Scholar] [CrossRef]
- Gantait, S.; Mandal, N.; Bhattacharyya, S.; Das, P.K. Induction and identification of tetraploids using in vitro colchicine treatment of Gerbera jamesonii Bolus cv. Sciella. Plant Cell Tissue Organ Cult. 2011, 106, 485. [Google Scholar] [CrossRef]
- Lattier, J.D.; Chen, H.; Contreras, R.N. Variation in genome size, ploidy, stomata, and rDNA signals in Althea. J. Am. Soc. Hortic. Sci. 2019, 144, 130–140. [Google Scholar] [CrossRef] [Green Version]
- Borrino, E.M.; Powell, W. Stomatal guard cell length as an indictor of ploidy in microspore-derived plants of barley. Genome 1988, 30, 158–160. [Google Scholar] [CrossRef]
- Roy, A.; Leggett, G.; Koutoulis, A. In vitro tetraploid induction and generation of tetraploids from mixoploids in hop (Humulus lupulus L.). Plant Cell Rep. 2001, 20, 489–495. [Google Scholar] [CrossRef]
- Dikshit, A.; Girjesh, K. Morphogenetic analysis of colchitetraploids in Impatiens balsamina L. Caryologia 2007, 60, 199–202. [Google Scholar] [CrossRef]
- Zhou, Y.; Kang, L.; Liao, S.; Pan, Q.; Ge, X.; Li, Z. Transcriptomic analysis reveals differential gene expressions for cell growth and functional secondary metabolites in induced autotetraploid of Chinese woad (Isatis indigotica Fort.). PLoS ONE 2015, 10, e0116392. [Google Scholar] [CrossRef] [PubMed] [Green Version]
- Zhang, Q.; Luo, F.; Liu, L.; Guo, F. In vitro induction of tetraploids in crape myrtle (Lagerstroemia indica L.). Plant Cell Tissue Organ Cult. 2010, 101, 41–47. [Google Scholar] [CrossRef]
- Li, S.; Lin, Y.; Pei, H.; Zhang, J.; Zhang, J.; Luo, J. Variations in colchicine-induced autotetraploid plants of Lilium davidii var. unicolor. Plant Cell Tissue Organ Cult. 2020. [Google Scholar] [CrossRef]
- Huang, R.; Liu, D.; Zhao, M.; Li, Z.; Li, M.; Sui, S. Artificially induced polyploidization in Lobularia maritima (L.) Desv. and its effect on morphological traits. HortScience 2015, 50, 636–639. [Google Scholar] [CrossRef] [Green Version]
- Speckmann, G.J.; Post, J.; Dijkstra, H. The length of stomata as an indicator for polyploidy in rye-grasses. Euphytica 1965, 14, 225–230. [Google Scholar] [CrossRef]
- Sugiyama, S. Polyploidy and cellular mechanisms changing leaf size: Comparison of diploid and autotetraploid populations in two species of Lolium. Ann. Bot. 2005, 96, 931–938. [Google Scholar] [CrossRef] [PubMed] [Green Version]
- Rao, S.; Kang, X.; Li, J.; Chen, J. Induction, identification and characterization of tetraploidy in Lycium ruthenicum. Breed. Sci. 2019, 69, 160–168. [Google Scholar] [CrossRef] [PubMed] [Green Version]
- Yu, X.; Wang, H.T.; Liu, Y.; Liang, C.Y.; Li, W.L. In vitro induction of chromosome-doubling in cultured shoots of three cultivars of mint (Mentha canadensis L.) treated with colchicine. J. Hortic. Sci. Biotechnol. 2013, 88, 306–312. [Google Scholar] [CrossRef]
- Setter, T.L.; Schrader, L.E.; Bingham, E.T. Carbon dioxide exchange rates, transpiration, and leaf characters in genetically equivalent ploidy levels of Alfalfa. Crop. Sci. 1978, 18, 327–332. [Google Scholar] [CrossRef]
- Chae, W.B.; Hong, S.J.; Gifford, J.M.; Lane Rayburn, A.; Widholm, J.M.; Juvik, J.A. Synthetic polyploid production of Miscanthus sacchariflorus, Miscanthus sinensis, and Miscanthus x giganteus. Gcb Bioenergy 2013, 5, 338–350. [Google Scholar] [CrossRef]
- Chakraborti, S.P.; Vijayan, K.; Roy, B.N.; Qadri, S.M.H. In vitro induction of tetraploidy in mulberry (Morus alba L.). Plant Cell Rep. 1998, 17, 799–803. [Google Scholar] [CrossRef] [PubMed]
- Vandenhout, H.; Ortiz, R.; Vuylsteke, D.; Swennen, R.; Bai, K.V. Effect of ploidy on stomatal and other quantitative traits in plantain and banana hybrids. Euphytica 1995, 83, 117–122. [Google Scholar] [CrossRef]
- Hamill, S.D.; Smith, M.K.; Dodd, W.A. In vitro induction of banana autotetraploids by colchicine treatment of micropropagated diploids. Aust. J. Bot. 1992, 40, 887–896. [Google Scholar] [CrossRef] [Green Version]
- Bose, R.B.; Choudhury, J.K. A comparative study of the cytotaxonomy, pallynology, physiology of ‘diploid’ and ‘polyploid’ plants of Ocimum kilimandscharicum Guerke and their yield of raw material and volatile contents. Caryologia 1962, 15, 435–454. [Google Scholar] [CrossRef] [Green Version]
- Kolarčik, V.; Vašková, D.; Mirková, M.; Mártonfi, P. Pollen morphology in natural diploid–polyploid hybridogeneous complex of the genus Onosma (Boraginaceae–Lithospermeae). Plant Syst. Evol. 2019, 305, 151–168. [Google Scholar] [CrossRef]
- Adanick, P.; Drezner, T.D.; Stock, A.D. Stomata length is a reliable characteristic for distinguishing infraspecies and ploidy levels of Opuntia mesacantha (Cactaceae). J. Bot. Res. Inst. Tex. 2018, 12, 141–147. [Google Scholar]
- Yang, P.M.; Zhou, X.R.; Huang, Q.C. The mechanism of starch content increase in grain of autotetraploid rice (Oryza sativa L.). Photosynthetica 2019, 57, 680–687. [Google Scholar] [CrossRef] [Green Version]
- Hao, L.; Ma, H.; da Silva, J.A.T.; Yu, X. Pollen morphology of herbaceous peonies with different ploidy levels. J. Am. Soc. Hortic. Sci. 2016, 141, 275–284. [Google Scholar] [CrossRef] [Green Version]
- Esfahani, S.T.; Karimzadeh, G.; Naghavi, M.R. In vitro polyploidy induction in Persian Poppy (Papaver bracteatum Lindl.). Caryologia 2020, 73, 133–144. [Google Scholar] [CrossRef]
- Tang, Z.Q.; Chen, D.L.; Song, Z.J.; He, Y.C.; Cai, D.T. In vitro induction and identification of tetraploid plants of Paulownia tomentosa. Plant Cell Tissue Organ Cult. 2010, 102, 213–220. [Google Scholar] [CrossRef]
- Campos, J.M.S.; Davide, L.C.; Salgado, C.C.; Santos, F.C.; Costa, P.N.; Silva, P.S.; Alves, C.C.S.; Viccini, L.F.; Pereira, A.V. In vitro induction of hexaploid plants from triploid hybrids of Pennisetum purpureum and Pennisetum glaucum. Plant Breed. 2009, 128, 101–104. [Google Scholar] [CrossRef]
- Nasirvand, S.; Zakaria, R.A.; Zare, N.; Esmaeilpoor, B. Polyploidy induction in parsley (Petroselinum crispum L.) by colchicine treatment. Cytologia 2018, 83, 393–396. [Google Scholar] [CrossRef] [Green Version]
- Joachimiak, A.; Grabowska-Joachimiak, A. Stomatal cell length and ploidy level in four taxa belonging to the Phleum sect. Phleum. Acta Biol. Crac. Ser. Bot. 2000, 42, 103–107. [Google Scholar]
- He, L.; Ding, Z.; Jiang, F.; Jin, B.; Li, W.; Ding, X.; Sun, J.; Lv, G. Induction and identification of hexadecaploid of Pinellia ternate. Euphytica 2012, 186, 479–488. [Google Scholar] [CrossRef]
- Liu, G.; Li, Z.; Bao, M. Colchicine-induced chromosome doubling in Platanus acerifolia and its effect on plant morphology. Euphytica 2007, 157, 145–154. [Google Scholar] [CrossRef]
- Jiang, Y.; Liu, S.; Hu, J.; He, G.; Liu, Y.Y.; Chen, X.; Lei, T.; Li, Q.; Yang, L.; Li, W.; et al. Polyploidization of Plumbago auriculata Lam. in vitro and its characterization including cold tolerance. Plant Cell Tissue Organ Cult. 2020, 140, 315–325. [Google Scholar] [CrossRef]
- Widoretno, W. In vitro induction and characterization of tetraploid Patchouli (Pogostemon cablin Benth.) plant. Plant Cell Tissue Organ Cult. 2016, 125, 261–267. [Google Scholar] [CrossRef]
- Wei, T.; Wang, Y.; Xie, Z.; Guo, D.; Chen, C.; Fan, Q.; Deng, X.; Liu, J.H. Enhanced ROS scavenging and sugar accumulation contribute to drought tolerance of naturally occurring autotetraploids in Poncirus trifoliata. Plant Biotechnol. J. 2019, 17, 1394–1407. [Google Scholar] [CrossRef] [PubMed] [Green Version]
- Liu, W.; Zheng, Y.; Song, S.; Huo, B.; Li, D.; Wang, J. In vitro induction of allohexaploid and resulting phenotypic variation in Populus. Plant Cell Tissue Organ Cult. 2018, 134, 183–192. [Google Scholar] [CrossRef]
- Yamaguchi, S. Identification of ploid level by pollen characters in Primula sieboldii E. Morren. Jpn. J. Breed. 1980, 30, 293–300. [Google Scholar] [CrossRef] [Green Version]
- Manawadu, I.P.; Dahanayake, N.; Senanayake, S.G.J.N. Colchicine induced tetraploids of radish (Raphanus sativus L.). Trop. Agric. Res. Ext. 2016, 19, 176–179. [Google Scholar]
- Mo, L.; Chen, J.; Chen, F.; Lou, X.; Xu, Q.; Tong, Z.; Huang, H.; Dong, R.; Lou, X.; Lin, E. Induction and characterization of polyploids from seeds of Rhododendron fortunei Lindl. J. Integr. Agric. 2020, 19, 2016–2026. [Google Scholar] [CrossRef]
- Baghyalakshmi, K.; Shaik, M.; Mohanrao, M.D.; Shaw, R.K.; Lavanya, C.; Manjunatha, T.; Senthilvel, S. Development and characterization of tetraploid castor plants. Plant Genet. Resour. 2020, 18, 98–104. [Google Scholar] [CrossRef]
- Suliman, H.H.; Asander, H.S. Polyploidy induced by colchicine in Robinia pseudoacacia L. and its effects on morphological, physiological and anatomical seedling traits. Iraqi J. Agric. Sci. 2020, 51, 829–847. [Google Scholar] [CrossRef]
- Buechler, W.K. Estimating polyploidy levels in fossil Salix: A critical review of cell size proxy methods. PaleoBios 2010, 29, 60–75. [Google Scholar]
- Dudits, D.; Torok, K.; Cseri, A.; Paul, K.; Nagy, A.V.; Nagy, B.; Sass, L.; Ferenc, G.; Vankora, R.; Dobrev, P.; et al. Response of organ structure and physiology to autotetraploidization in early development of Energy Willow Salix viminalis. Plant Physiol. 2016, 170, 1504–1523. [Google Scholar] [CrossRef] [PubMed] [Green Version]
- Hassanzadeh, F.; Zakaria, R.A.; Azad, N.H. Polyploidy induction in Salvia officinalis L. and its effects on some morphological and physiological characteristics. Cytologia 2020, 85, 157–162. [Google Scholar] [CrossRef]
- Sapra, V.T.; Hughes, J.L.; Sharma, G.C. Frequency, size, and distribution of stomata in triticale leaves. Crop. Sci. 1975, 15, 356–358. [Google Scholar] [CrossRef]
- Berkov, S. Size and alkaloid content of seeds in induced autotetraploids of Datura innoxia, Datura stramonium and Hyoscyamus niger. Pharm. Biol. 2001, 39, 329–331. [Google Scholar] [CrossRef]
- Rodiansah, A.; Puspita, M.I. In vitro polyploidy induction of foxtail millet (Setaria italica (L) beauv) cv. buru hotong using colchicine treatment. IOP Conf. Ser. Earth Environ. Sci. 2020, 484, 012031. [Google Scholar] [CrossRef]
- Stupar, R.M.; Bhaskar, P.B.; Yandell, B.S.; Rensink, W.A.; Hart, A.L.; Ouyang, S.; Veilleux, R.E.; Busse, J.S.; Erhardt, R.J.; Buell, C.R.; et al. Phenotypic and transcriptomic changes associated with potato autopolyploidization. Genetics 2007, 176, 2055–2067. [Google Scholar] [CrossRef] [Green Version]
- Murali, K.M.; Vanitha, J.; Jiang, S.; Ramachandran, S. Impact of colchicine treatment on Sorghum bicolor BTÃ x 623. Mol. Plant Breed. 2013, 4, 128–135. [Google Scholar] [CrossRef]
- Ardabili, G.S.; Zakaria, R.A.; Zare, N. In vitro induction of polyploidy in Sorghum bicolor L. Cytologia 2015, 80, 495–503. [Google Scholar] [CrossRef] [Green Version]
- Van Laere, K.; Franca, S.C.; Vansteenkiste, H.; Van Huylenbroeck, J.; Steppe, K.; Van Labeke, M.-C. Influence of ploidy level on morphology, growth and drought susceptibility in Spathiphyllum wallisii. Acta Physiol. Plant. 2011, 33, 1149–1156. [Google Scholar] [CrossRef]
- Sajjad, Y.; Jaskani, M.J.; Mehmood, A.; Ahmad, I.; Abbas, H. Effect of colchicine on in vitro polyploidy induction in African marigold (Tagetes erecta). Pak. J. Bot. 2013, 45, 1255–1258. [Google Scholar]
- He, Y.; Sun, Y.; Zheng, R.; Ai, Y.; Cao, Z.; Bao, M. Induction of tetraploid male sterile Tagetes erecta by colchicine treatment and its application for interspecific hybridization. Hortic. Plant J. 2016, 2, 284–292. [Google Scholar] [CrossRef]
- Marciniuk, J.; Rerak, J.; Grabowska-Joachimiak, A.; Jastrząb, I.; Musiał, K.; Joachimiak, A. Chromosome numbers and stomatal cell length in Taraxacum sect. Palustria from Poland. Acta Biol. Crac. Ser. Bot. 2010, 52, 117–121. [Google Scholar] [CrossRef]
- Mooney, H.A.; Johnson, A.W. Comparative physiological ecology of an arctic and alpine population of Thalictrum alpinum L. Ecology 1965, 46, 721–727. [Google Scholar] [CrossRef]
- Godfree, R.C.; Marshall, D.J.; Young, A.G.; Miller, C.H.; Mathews, S. Empirical evidence of fixed and homeostatic patterns of polyploid advantage in a keystone grass exposed to drought and heat stress. R. Soc. Open Sci. 2017, 4, 170934. [Google Scholar] [CrossRef] [Green Version]
- Tavan, M.; Mirjalili, M.H.; Karimzadeh, G. In vitro polyploidy induction: Changes in morphological, anatomical and phytochemical characteristics of Thymus persicus (Lamiaceae). Plant Cell Tissue Organ Cult. 2015, 122, 573–583. [Google Scholar] [CrossRef]
- Hassan, J.; Miyajima, I.; Ozaki, Y.; Mizunoe, Y.; Sakai, K.; Zaland, W. Tetraploid induction by colchicine treatment and crossing with a diploid reveals less-seeded fruit production in Pointed Gourd (Trichosanthes dioica Roxb.). Plants 2020, 9, 370. [Google Scholar] [CrossRef] [PubMed] [Green Version]
- Inceer, H.; Hayirlioglu-Ayaz, S. Chromosome numbers in Tripleurospermum Sch. Bip. (Asteraceae) and closely related genera: Relationships between ploidy level and stomatal length. Plant Syst. Evol. 2010, 285, 149–157. [Google Scholar] [CrossRef] [PubMed] [Green Version]
- Halloran, G.M.; Pennell, A.L. Grain size and seedling growth of wheat at different ploidy levels. Ann. Bot. 1982, 49, 103–113. [Google Scholar] [CrossRef]
- Khazaei, H.; Monneveux, P.; Hongbo, S.; Mohammady, S. Variation for stomatal characteristics and water use efficiency among diploid, tetraploid and hexaploid Iranian wheat landraces. Genet. Resour. Crop. Evol. 2010, 57, 307–314. [Google Scholar] [CrossRef]
- Bory, S.; Catrice, O.; Brown, S.; Leitch, I.J.; Gigant, R.; Chiroleu, F.; Grisoni, M.; Duval, M.F.; Besse, P. Natural polyploidy in Vanilla planifolia (Orchidaceae). Genome 2008, 51, 816–826. [Google Scholar] [CrossRef] [PubMed]
- Moeglein, M.K.; Chatelet, D.S.; Donoghue, M.J.; Edwards, E.J. Evolutionary dynamics of genome size in a radiation of woody plants. Am. J. Bot. 2020, 107, 1527–1541. [Google Scholar] [CrossRef] [PubMed]
- Eliášová, A.; Münzbergová, Z. Higher seed size and germination rate may favour autotetraploids of Vicia cracca L. (Fabaceae). Biol. J. Linn. Soc. 2014, 113, 57–73. [Google Scholar] [CrossRef] [Green Version]
- Nagat, E.; Kamla, B.; Hoda, K. Phenotypic and molecular characterization of polyploidy Vicia faba induced by colchicine. Gsc Biol. Pharm. Sci. 2020, 11, 235–243. [Google Scholar] [CrossRef]
- Cohen, D.; Yao, J.L. In vitro chromosome doubling of nine Zantedeschia cultivars. Plant Cell Tissue Organ Cult. 1996, 47, 43–49. [Google Scholar] [CrossRef]
- Ho, I.; Wan, Y.; Widholm, J.M.; Rayburn, A.L. The use of stomatal chloroplast number for rapid determination of ploidy level in maize. Plant Breed. 1990, 105, 203–210. [Google Scholar] [CrossRef]
- Zhou, J.; Guo, F.; Fu, J.; Xiao, Y.; Wu, J. In vitro polyploid induction using colchicine for Zingiber officinale Roscoe cv. ‘Fengtou’ ginger. Plant Cell Tissue Organ Cult. 2020, 142, 87–94. [Google Scholar] [CrossRef]
- Cui, Y.; Hou, L.; Li, X.; Huang, F.; Pang, X.; Li, Y. In vitro induction of tetraploid Ziziphus jujuba Mill. var. spinosa plants from leaf explants. Plant Cell Tissue Organ Cult. 2017, 131, 175–182. [Google Scholar] [CrossRef]
- Brown, D.S.; Wright, C.A. On a polyploid complex of freshwater snails (Planorbidae: Bulinus) in Ethiopia. J. Zool. 1972, 167, 97–132. [Google Scholar] [CrossRef]
- Soper, D.M.; Neiman, M.; Savytskyy, O.P.; Zolan, M.E.; Lively, C.M. Spermatozoa production by triploid males in the New Zealand freshwater snail Potamopyrgus antipodarum. Biol. J. Linn. Soc. 2013, 110, 227–234. [Google Scholar] [CrossRef]
- Zhang, L.; King, C.E. Life history divergence of sympatric diploid and polyploid populations of brine shrimp Artemia parthenogenetica. Oecologia 1993, 93, 177–183. [Google Scholar] [CrossRef] [PubMed]
- Artom, C. La polyploidie dans ses correlations morphologiques et biologiques. C. R. Soc. Biol. Paris 1928, 99, 29–49. [Google Scholar]
- Kawamura, N. Polyploidy and size of serosa nuclei and cells in eggs of the silkworm, Bombyx mori. J. Sericult. Sci. Jpn. 1979, 48, 77–85. [Google Scholar] [CrossRef]
- Purdom, C.E. Genetics and Fish. Breeding; Chapman and Hall: London, UK, 1993. [Google Scholar]
- Flajšhans, M.; Pšenička, M.; Rodina, M.; Těšitel, J. Image cytometric measurements of diploid, triploid and tetraploid fish erythrocytes in blood smears reflect the true dimensions of live cells. Cell Biol. Int. 2011, 35, 67–71. [Google Scholar] [CrossRef]
- Fopp-Bayat, D.; Jankun, M.; Woznicki, P. Chromosome number and erythrocyte nuclei length in triploid Siberian sturgeon Acipenser baeri Brandt. Caryologia 2006, 59, 319–321. [Google Scholar] [CrossRef] [Green Version]
- Sezaki, K.; Kobayashi, H.; Nakamura, M. Size of erythrocytes in the diploid and triploid specimens of Carassius auratus langsdorfi. Jpn. J. Ichthyol. 1977, 24, 135–140. [Google Scholar] [CrossRef]
- Liu, S.M.; Hashimoto, K.; Sezaki, K.; Kobayashi, H.; Nakamura, M. Simplified techniques for determination of polyploidy in Ginbuna Carassius auratus langsdorfi carp. Bull. Jpn. Soc. Sci. Fish. 1978, 44, 601–606. [Google Scholar] [CrossRef]
- Przybyl, A.; Juchno, D.; Szabelska, A.; Boron, A. Fecundity of diploid and triploid Carassius gibelio (Bloch, 1782) females. Front. Mar. Sci. Conf. Abstr. Xvi Eur. Congr. Ichthyol. 2019. [Google Scholar] [CrossRef]
- Sezaki, K.; Kobayashi, H. Comparison of erythrocytic size between diploid and tetraploid in spinous loach, Cobitis biwae. Bull. Jpn. Soc. Sci. Fish. 1978, 44, 851–854. [Google Scholar] [CrossRef] [Green Version]
- Beck, M.L.; Biggers, C.J. Erythrocyte measurements of diploid and triploid Ctenopharyngodon idella × Hypophthalmichthys nobilis hybrids. J. Fish. Biol. 1983, 22, 497–502. [Google Scholar] [CrossRef]
- Ueno, K. Induction of triploid carp and their haematological characteristics. Jpn. J. Genet. 1984, 59, 585–591. [Google Scholar] [CrossRef] [Green Version]
- Kavumpurath, S.; Pandian, T.J. Induction of triploidy in the zebrafish, Brachydanio rerio (Hamilton). Aquacult. Res. 1990, 21, 299–306. [Google Scholar] [CrossRef]
- van de Pol, I.L.; Flik, G.; Verberk, W.C. Triploidy in zebrafish larvae: Effects on gene expression, cell size and cell number, growth, development and swimming performance. PLoS ONE 2020, 15, e0229468. [Google Scholar] [CrossRef] [PubMed]
- Felip, A.; Piferrer, F.; Carrillo, M.; Zanuy, S. Comparison of the gonadal development and plasma levels of sex steroid hormones in diploid and triploid sea bass, Dicentrarchus labrax L. J. Exp. Zool. 2001, 290, 384–395. [Google Scholar] [CrossRef]
- Wolters, W.R.; Chrisman, C.L.; Libey, G.S. Erythrocyte nuclear measurements of diploid and triploid channel catfish, Ictalurus punctatus (Rafinesque). J. Fish. Biol. 1982, 20, 253–258. [Google Scholar] [CrossRef]
- Alavi, S.M.H.; Drozd, B.; Hatef, A.; Flajšhans, M. Sperm morphology, motility, and velocity in naturally occurring polyploid European weatherfish (Misgurnus fossilis L.). Theriogenology 2013, 80, 153–160. [Google Scholar] [CrossRef]
- Kim, D.S.; Jo, J.Y.; Lee, T.Y. Induction of triploidy in mud loach (Misgurnus mizolepis) and its effect on gonad development and growth. Aquaculture 1994, 120, 263–270. [Google Scholar] [CrossRef]
- Small, S.A.; Benfey, T.J. Cell size in triploid salmon. J. Exp. Zool. 1987, 241, 339–342. [Google Scholar] [CrossRef]
- Piferrer, F.; Benfey, T.J.; Donaldson, E.M. Gonadal morphology of normal and sex-reversed triploid and gynogenetic diploid coho salmon (Oncorhynchus kisutch). J. Fish. Biol. 1994, 45, 541–553. [Google Scholar] [CrossRef]
- Yamamoto, A.; Iida, T. Hematological characteristics of triploid rainbow trout. Fish. Pathol. 1994, 29, 239–243. [Google Scholar] [CrossRef]
- Kenanoğlu, O.N.; Yılmaz, S.; Soytaş, N.; Ergün, S.; Akı, C.; Tapan, F. Determination of triploidy in rainbow trout, Oncorhynchus mykiss using erythrocyte measurements. Mar. Sci. Technol. Bull. 2012, 1, 17–19. [Google Scholar]
- Jayaprasad, P.P.; Srijaya, T.C.; Jose, D.; Papini, A.; Hassan, A.; Chatterji, A.K. Identification of diploid and triploid red tilapia by using erythrocyte indices. Caryologia 2011, 64, 485–492. [Google Scholar] [CrossRef]
- Don, J.; Avtalion, R.R. The induction of triploidy in Oreochromis aureus by heat shock. Appl. Genet. 1986, 72, 186–192. [Google Scholar] [CrossRef]
- Aliah, R.S.; Inada, Y.; Yamaoka, K.; Taniguchi, N. Effects of triploidy on hematological characteristics and oxygen consumption in Ayu. Nippon Suisan Gakk. 1991, 57, 833–836. [Google Scholar] [CrossRef] [Green Version]
- Lincoln, R.F. Sexual maturation in triploid male plaice (Pleuronectes platessa) and plaice x flounder (Platichthys flesus) hybrids. J. Fish. Biol. 1981, 19, 415–426. [Google Scholar] [CrossRef]
- Lincoln, R.F. Sexual maturation in female triploid plaice, Pleuronectes platessa, and plaice× flounder, Platichthys flesus, hybrids. J. Fish. Biol. 1981, 19, 499–508. [Google Scholar] [CrossRef]
- Cimino, M.C. Karyotypes and erythrocyte sizes of some diploid and triploid fishes of the genus Poeciliopsis. J. Fish. Bd. Can. 1973, 30, 1736–1737. [Google Scholar] [CrossRef]
- Baldwin, N.W.; Busack, C.A.; Meals, K.O. Induction of triploidy in white crappie by temperature shock. Trans. Am. Fish. Soc. 1990, 119, 438–444. [Google Scholar] [CrossRef]
- Kawamura, K.; Ueda, T.; Aoki, K.; Hosoya, K. Spermatozoa in triploids of the rosy bitterling Rhodeus ocellatus ocellatus. J. Fish. Biol. 1999, 55, 420–432. [Google Scholar] [CrossRef]
- Lincoln, R.F.; Scott, A.P. Sexual maturation in triploid rainbow trout, Salmo gairdneri Richardson. J. Fish. Biol. 1984, 25, 385–392. [Google Scholar] [CrossRef]
- Benfey, T.J.; Sutterlin, A.M.; Thompson, R.J. Use of erythrocyte measurements to identify triploid salmonids. Can. J. Fish. Aquat. Sci. 1984, 41, 980–984. [Google Scholar] [CrossRef]
- Dorafshan, S.; Kalbassi, M.R.; Pourkazemi, M.; Amiri, B.M.; Karimi, S.S. Effects of triploidy on the Caspian salmon Salmo trutta caspius haematology. Fish. Physiol. Biochem. 2008, 34, 195–200. [Google Scholar] [CrossRef] [PubMed]
- Woznicki, P.; Kuzminski, H. Chromosome number and erythrocyte nuclei length in triploid brook trout (Salvelinus fontinalis). Caryologia 2002, 55, 295–298. [Google Scholar] [CrossRef]
- Garcia-Abiado, M.A.R.; Dabrowski, K.; Christensen, J.E.; Czesny, S.; Bajer, P. Use of erythrocyte measurements to identify triploid saugeyes. N. Am. J. Aquac. 1999, 61, 319–325. [Google Scholar] [CrossRef] [Green Version]
- Valenti, R.J. Induced polyploidy in Tilapia aurea (Steindachner) by means of temperature shock treatment. J. Fish. Biol. 1975, 7, 519–528. [Google Scholar] [CrossRef]
- Linhart, O.; Rodina, M.; Flajšhans, M.; Mavrodiev, N.; Nebesarova, J.; Gela, D.; Kocour, M. Studies on sperm of diploid and triploid tench, Tinca tinca (L.). Aquac. Int. 2006, 14, 9–25. [Google Scholar] [CrossRef]
- Stöck, M.; Schmid, M.; Steinlein, C.; Grosse, W.R. Mosaicism in somatic triploid specimens of the Bufo viridis complex in the Karakoram with examination of calls, morphology and taxonomic conclusions. Ital. J. Zool. 1999, 66, 215–232. [Google Scholar] [CrossRef] [Green Version]
- Matson, T.O. Erythrocyte size as a taxonomic character in the identification of Ohio Hyla chrysoscelis and H. versicolor. Herpetologica 1990, 46, 457–462. [Google Scholar]
- Bogart, J.P.; Wasserman, A.O. Diploid-polyploid cryptic species pairs: A possible clue to evolution by polyploidization in anuran amphibians. Cytogenetics 1972, 11, 7–24. [Google Scholar] [CrossRef] [PubMed]
- Green, D.M. Size differences in adhesive toe-pad cells of treefrogs of the diploid-polyploid Hyla versicolor complex. J. Herpetol. 1980, 14, 15–19. [Google Scholar] [CrossRef]
- Otero, M.A.; Grenat, P.R.; Valetti, J.A.; Salas, N.E.; Martino, A.L. Erythrocyte nuclear size as a better diagnostic character than cell size in the identification of live cryptic polyploid species. Zootaxa 2013, 3694, 262–270. [Google Scholar] [CrossRef] [PubMed] [Green Version]
- Martino, A.L.; Sinsch, U. Speciation by polyploidy in Odontophrynus americanus. J. Zool. 2002, 257, 67–81. [Google Scholar] [CrossRef]
- Gunther, V.R. Die erythrozytengrosse als kriterium zur unterscheidung diploider und triploider teichfrosche Rana “esculenta” L. (Anura). Biol. Zbl. 1977, 96, 457–466. [Google Scholar]
- George, S.A.; Lennartz, M.R. Methods for determining ploidy in amphibians: Nucleolar number and erythrocyte size. Experientia 1980, 36, 687–688. [Google Scholar] [CrossRef] [Green Version]
- Uzzell, T.M. Relations of the diploid and triploid species of the Ambystoma jeffersonianum complex (Amphibia, Caudata). Copeia 1964, 1964, 257–300. [Google Scholar] [CrossRef]
- Austin, N.E.; Bogart, J.P. Erythrocyte area and ploidy determination in the salamanders of the Ambystoma jeffersonianum complex. Copeia 1982, 1982, 485–488. [Google Scholar] [CrossRef]
- Fankhauser, G.; Griffiths, R.B. Induction of triploidy and haploidy in the newt, Triturus viridescens, by cold treatment of unsegmented eggs. Proc. Natl. Acad. Sci. USA 1939, 25, 233–238. [Google Scholar] [CrossRef] [Green Version]
- Morgan, S.G. Life and death in the plankton: Larval mortality and adaptation. In Ecology of Marine Invertebrate Larvae; McEdward, L., Ed.; CRC Press: Boca Raton, FL, USA, 1995; pp. 279–321. [Google Scholar]
- McGurk, M.D. Natural mortality of marine pelagic fish eggs and larvae: Role of spatial patchiness. Mar. Ecol. Prog. Ser. 1986, 34, 227–242. [Google Scholar] [CrossRef]
- Rumrill, S.S. Natural mortality of marine invertebrate larvae. Ophelia 1990, 32, 163–198. [Google Scholar] [CrossRef]
- Thor, P.; Nielsen, T.G.; Tiselius, P. Mortality rates of epipelagic copepods in the post-spring bloom period in Disko Bay, western Greenland. Mar. Ecol. Progr. Ser. 2008, 359, 151–160. [Google Scholar] [CrossRef]
- Ohman, M.D.; Eiane, K.; Durbin, E.G.; Runge, J.A.; Hirche, H.-J. A comparative study of Calanus finmarchicus mortality patterns at five localities in the North Atlantic. Ices J. Mar. Sci. 2004, 61, 687–697. [Google Scholar] [CrossRef] [Green Version]
- Bi, H.; Rose, K.A.; Benfield, M.C. Estimating copepod stage-specific mortality rates in open ocean waters: A case study from the northern Gulf of Mexico, USA. Mar. Ecol. Progr. Ser. 2011, 427, 145–159. [Google Scholar] [CrossRef] [Green Version]
- Gislason, A.; Eiane, K.; Reynisson, P. Vertical distribution and mortality of Calanus finmarchicus during overwintering in oceanic waters southwest of Iceland. Mar. Biol. 2007, 150, 1253–1263. [Google Scholar] [CrossRef]
- Neuheimer, A.B.; Gentleman, W.C.; Galloway, C.L.; Johnson, C.L. Modeling larval Calanus finmarchicus on Georges Bank: Time-varying mortality rates and a cannibalism hypothesis. Fish. Oceanogr. 2009, 18, 147–160. [Google Scholar] [CrossRef]
- Head, E.J.; Gentleman, W.C.; Ringuette, M. Variability of mortality rates for Calanus finmarchicus early life stages in the Labrador Sea and the significance of egg viability. J. Plankton Res. 2015, 37, 1149–1165. [Google Scholar] [CrossRef] [Green Version]
- Maud, J.L.; Hirst, A.G.; Atkinson, A.; Lindeque, P.K.; McEvoy, A.J. Mortality of Calanus helgolandicus: Sources, differences between the sexes and consumptive and nonconsumptive processes. Limnol. Oceanogr. 2018, 63, 1741–1761. [Google Scholar] [CrossRef] [Green Version]
- Ohman, M.D.; Hsieh, C.H. Spatial differences in mortality of Calanus pacificus within the California Current System. J. Plankton Res. 2008, 30, 359–366. [Google Scholar] [CrossRef]
- Hirst, A.G.; Ward, P. Spring mortality of the cyclopoid copepod Oithona similis in polar waters. Mar. Ecol. Progr. Ser. 2008, 372, 169–180. [Google Scholar] [CrossRef] [Green Version]
- Dvoretsky, V.G. Seasonal mortality rates of Oithona similis (Cyclopoida) in a large Arctic fjord. Polar Sci. 2012, 6, 263–269. [Google Scholar] [CrossRef] [Green Version]
- Eiane, K.; Ohman, M.D. Stage-specific mortality of Calanus finmarchicus, Pseudocalanus elongatus and Oithona similis on Fladen Ground, North Sea, during a spring bloom. Mar. Ecol. Progr. Ser. 2004, 268, 183–193. [Google Scholar] [CrossRef]
- Aksnes, D.L.; Ohman, M.D. A vertical life table approach to zooplankton mortality estimation. Limnol. Oceanogr. 1996, 41, 1461–1469. [Google Scholar] [CrossRef]
- Ohman, M.D.; Wood, S.N. Mortality estimation for planktonic copepods: Pseudocalanus newmani in a temperate fjord. Limnol. Oceanogr. 1996, 41, 126–135. [Google Scholar] [CrossRef]
- Nurul Amin, S.M.; Arshad, A.; Siraj, S.S.; Sidik, B.J. Population structure, growth, mortality and yield per recruit of segestid shrimp, Acetes japonicus (Decapoda: Sergestidae) from the coastal waters of Malacca, Peninsular Malaysia. Indian J. Mar. Sci. 2009, 38, 57–68. [Google Scholar]
- Oh, C.-W.; Hartnoll, R.G.; Nash, R.D.M. Population dynamics of the common shrimp, Crangon crangon (L.), in port Erin Bay, Isle of Man, Irish Sea. Ices J. Mar. Sci. 1999, 56, 718–733. [Google Scholar] [CrossRef]
- Temming, A.; Günther, C.; Rückert, C.; Hufnagl, M. Understanding the life cycle of North Sea brown shrimp Crangon crangon: A simulation model approach. Mar. Ecol. Progr. Ser. 2017, 584, 119–143. [Google Scholar] [CrossRef] [Green Version]
- Díaz, A.; Ferrer, O.; Álvarez, R.; González, L.; Méndez, J.; Corona, M. Mortality, recruitment pattern and growth of the white shrimp Litopenaeus schmitti (Crustacea: Penaeidae) from the Gulf of Venezuela. Ciencia 2014, 22, 187–196. [Google Scholar]
- Nwosu, F.M. Growth and mortality of the rough river prawn Macrobrachium equidens Dana, 1852 (Crustacea, Palaemonidae) in Cross River Estuary, Southeast Nigeria. J. Food Agric. Environ. 2008, 6, 186–189. [Google Scholar]
- Enin, U.I. First estimates of growth, mortality and recruitment parameters of Macrobrachium macrobrachion Herklots, 1851 in the Cross River estuary, Nigeria. Dana 1995, 11, 29–38. [Google Scholar]
- Gabche, C.E.; Hockey, H.U.P. Growth and mortality of the Giant African River Prawn Macrobrachium völlenhovenii (Herklots, Crustacea, Palaemonidae) in the Lobe River, Cameroon—A preliminary evaluation. J. Shellfish Res. 1995, 14, 185–190. [Google Scholar]
- Etim, L.; Sankare, Y. Growth and mortality, recruitment and yield of the fresh-water shrimp, Macrobrachium völlenhovenii, Herklots 1851 (Crustacea, Palaemonidae) in the Fahe reservoir, Côte d’Ivoire, West Africa. Fish. Res. 1998, 38, 211–223. [Google Scholar] [CrossRef]
- Glamuzina, L.; Conides, A.; Prusina, I.; Ćukteraš, M.; Klaoudatos, D.; Zacharaki, P.; Glamuzina, B. Population structure, growth, mortality and fecundity of Palaemon adspersus (Rathke 1837; Decapoda: Palaemonidae) in the Parila Lagoon (Croatia, SE Adriatic Sea) with notes on the population management. Turk. J. Fish. Aquat. Sci. 2014, 14, 677–687. [Google Scholar] [CrossRef]
- Gotshall, D.W. Population size, mortality rates, and growth rates of Northern California ocean shrimp: Pandalus jordani, 1965 through 1968. Calif. Fish. Bull. 1972, 155, 1–47. [Google Scholar]
- Hannah, R.W. Variation in geographic stock area, catchability, and natural mortality of ocean shrimp (Pandalus jordani): Some new evidence for a trophic interaction with Pacific hake (Merluccius productus). Can. J. Fish. Aquat. Sci. 1995, 52, 1018–1029. [Google Scholar] [CrossRef]
- Anderson, P.J. Age, growth, and mortality of the northern shrimp Pandalus borealis Kroyer in Pavlof Bay, Alaska. Fish. Bull. 1991, 89, 541–553. [Google Scholar]
- Fu, C.; Quinn II, T.J. Estimability of natural mortality and other population parameters in a length-based model: Pandalus borealis in Kachemak Bay, Alaska. Can. J. Fish. Aquat. Sci. 2000, 57, 2420–2432. [Google Scholar] [CrossRef]
- McLeay, L.J.; Beckmann, C.L.; Hooper, G.E. Gulf St. Vincent Prawn Penaeus (Melicertus) latisulcatus Fishery 2016/17; Fishery Assessment Report to PIRSA Fisheries and Aquaculture; South Australian Research and Development Institute (Aquatic Sciences): Adelaide, Australia, 2017; SARDI Publication No. F2007/000782-7. SARDI Research Report Series No. 972. [Google Scholar]
- Xiao, Y.; McShane, P. Estimation of instantaneous rates of fishing and natural mortalities from mark–recapture data on the western king prawn Penaeus latisulcatus in the Gulf St. Vincent, Australia, by conditional likelihood. Trans. Am. Fish. Soc. 2000, 129, 1005–1017. [Google Scholar] [CrossRef]
- Siddeek, M.S.M. Estimation of natural mortality of Kuwait’s grooved tiger prawn Penaeus semisulcatus (de Haan) using tag-recapture and commercial fisheries data. Fish. Res. 1991, 11, 109–125. [Google Scholar] [CrossRef]
- Hearn, A.; Murillo, J.C. Life history of the red spiny lobster, Panulirus penicillatus (Decapoda: Palinuridae), in the Galápagos Marine Reserve, Ecuador. Pac. Sci. 2008, 62, 191–204. [Google Scholar] [CrossRef] [Green Version]
- Deval, M.C.; Bök, T.; Ateş, C.; Tosunoğlu, Z. Length-based estimates of growth parameters, mortality rates, and recruitment of Astacus leptodactylus (Eschscholtz, 1823) (Decapoda, Astacidae) in unexploited inland waters of the northern Marmara region, European Turkey. Crustaceana 2007, 80, 655–665. [Google Scholar] [CrossRef] [Green Version]
- Hewitt, D.A.; Lambert, D.M.; Hoenig, J.M.; Lipcius, R.N.; Bunnell, D.B.; Miller, T.J. Direct and indirect estimates of natural mortality for Chesapeake Bay blue crab. Trans. Am. Fish. Soc. 2007, 136, 1030–1040. [Google Scholar] [CrossRef] [Green Version]
- Zhang, Z.; Hajas, W.; Phillips, A.; Boutillier, J.A. Use of length-based models to estimate biological parameters and conduct yield analyses for male Dungeness crab (Cancer magister). Can. J. Fish. Aquat. Sci. 2004, 61, 2126–2134. [Google Scholar] [CrossRef]
- Hankin, D.G.; Diamond, N.; Mohr, M.S.; Ianelli, J. Growth and reproductive dynamics of adult female Dungeness crabs (Cancer magister) in northern California. Ices J. Mar. Sci. 1989, 46, 94–108. [Google Scholar] [CrossRef]
- Klaoudatos, D.S.; Conides, A.J.; Anastasopoulou, A.; Dulčić, J. Age, growth, mortality and sex ratio of the inshore population of the edible crab, Cancer pagurus (Linnaeus 1758) in South Wales (UK). J. Appl. Ichthyol. 2013, 29, 579–586. [Google Scholar] [CrossRef]
- Zheng, J. Uncertainties of natural mortality estimates for eastern Bering Sea snow crab, Chionoecetes opilio. Fish. Res. 2003, 65, 411–425. [Google Scholar] [CrossRef]
- Drouineau, H.; Sainte-Marie, B.; Duplisea, D. Estimating natural mortality and egg production of snow crab Chionoecetes opilio adult females. Aquat. Biol. 2013, 18, 261–270. [Google Scholar] [CrossRef] [Green Version]
- Murphy, J.T.; Rugolo, L.J.; Turnock, B.J. Estimation of annual, time-varying natural mortality and survival for Eastern Bering Sea snow crab (Chionoecetes opilio) with state-space population models. Fish. Res. 2018, 205, 122–131. [Google Scholar] [CrossRef]
- Siddeek, M.S.M.; Watson, L.J.; Blau, S.F.; Moore, H. Estimating natural mortality of king crabs from tag recapture data. In Crabs in Cold Water Regions: Biology, Management, and Economics; Paul, A.J., Ed.; University of Alaska Sea Grant College Program, AK-SG-02–01: Fairbanks, AK, USA, 2002; pp. 51–75. [Google Scholar]
- White, J.W.; Morgan, S.G.; Fisher, J.L. Planktonic larval mortality rates are lower than widely expected. Ecology 2014, 95, 3344–3353. [Google Scholar] [CrossRef] [Green Version]
- Windsland, K. Total and natural mortality of red king crab (Paralithodes camtschaticus) in Norwegian waters: Catch–curve analysis and indirect estimation methods. Ices J. Mar. Sci. 2015, 72, 642–650. [Google Scholar] [CrossRef] [Green Version]

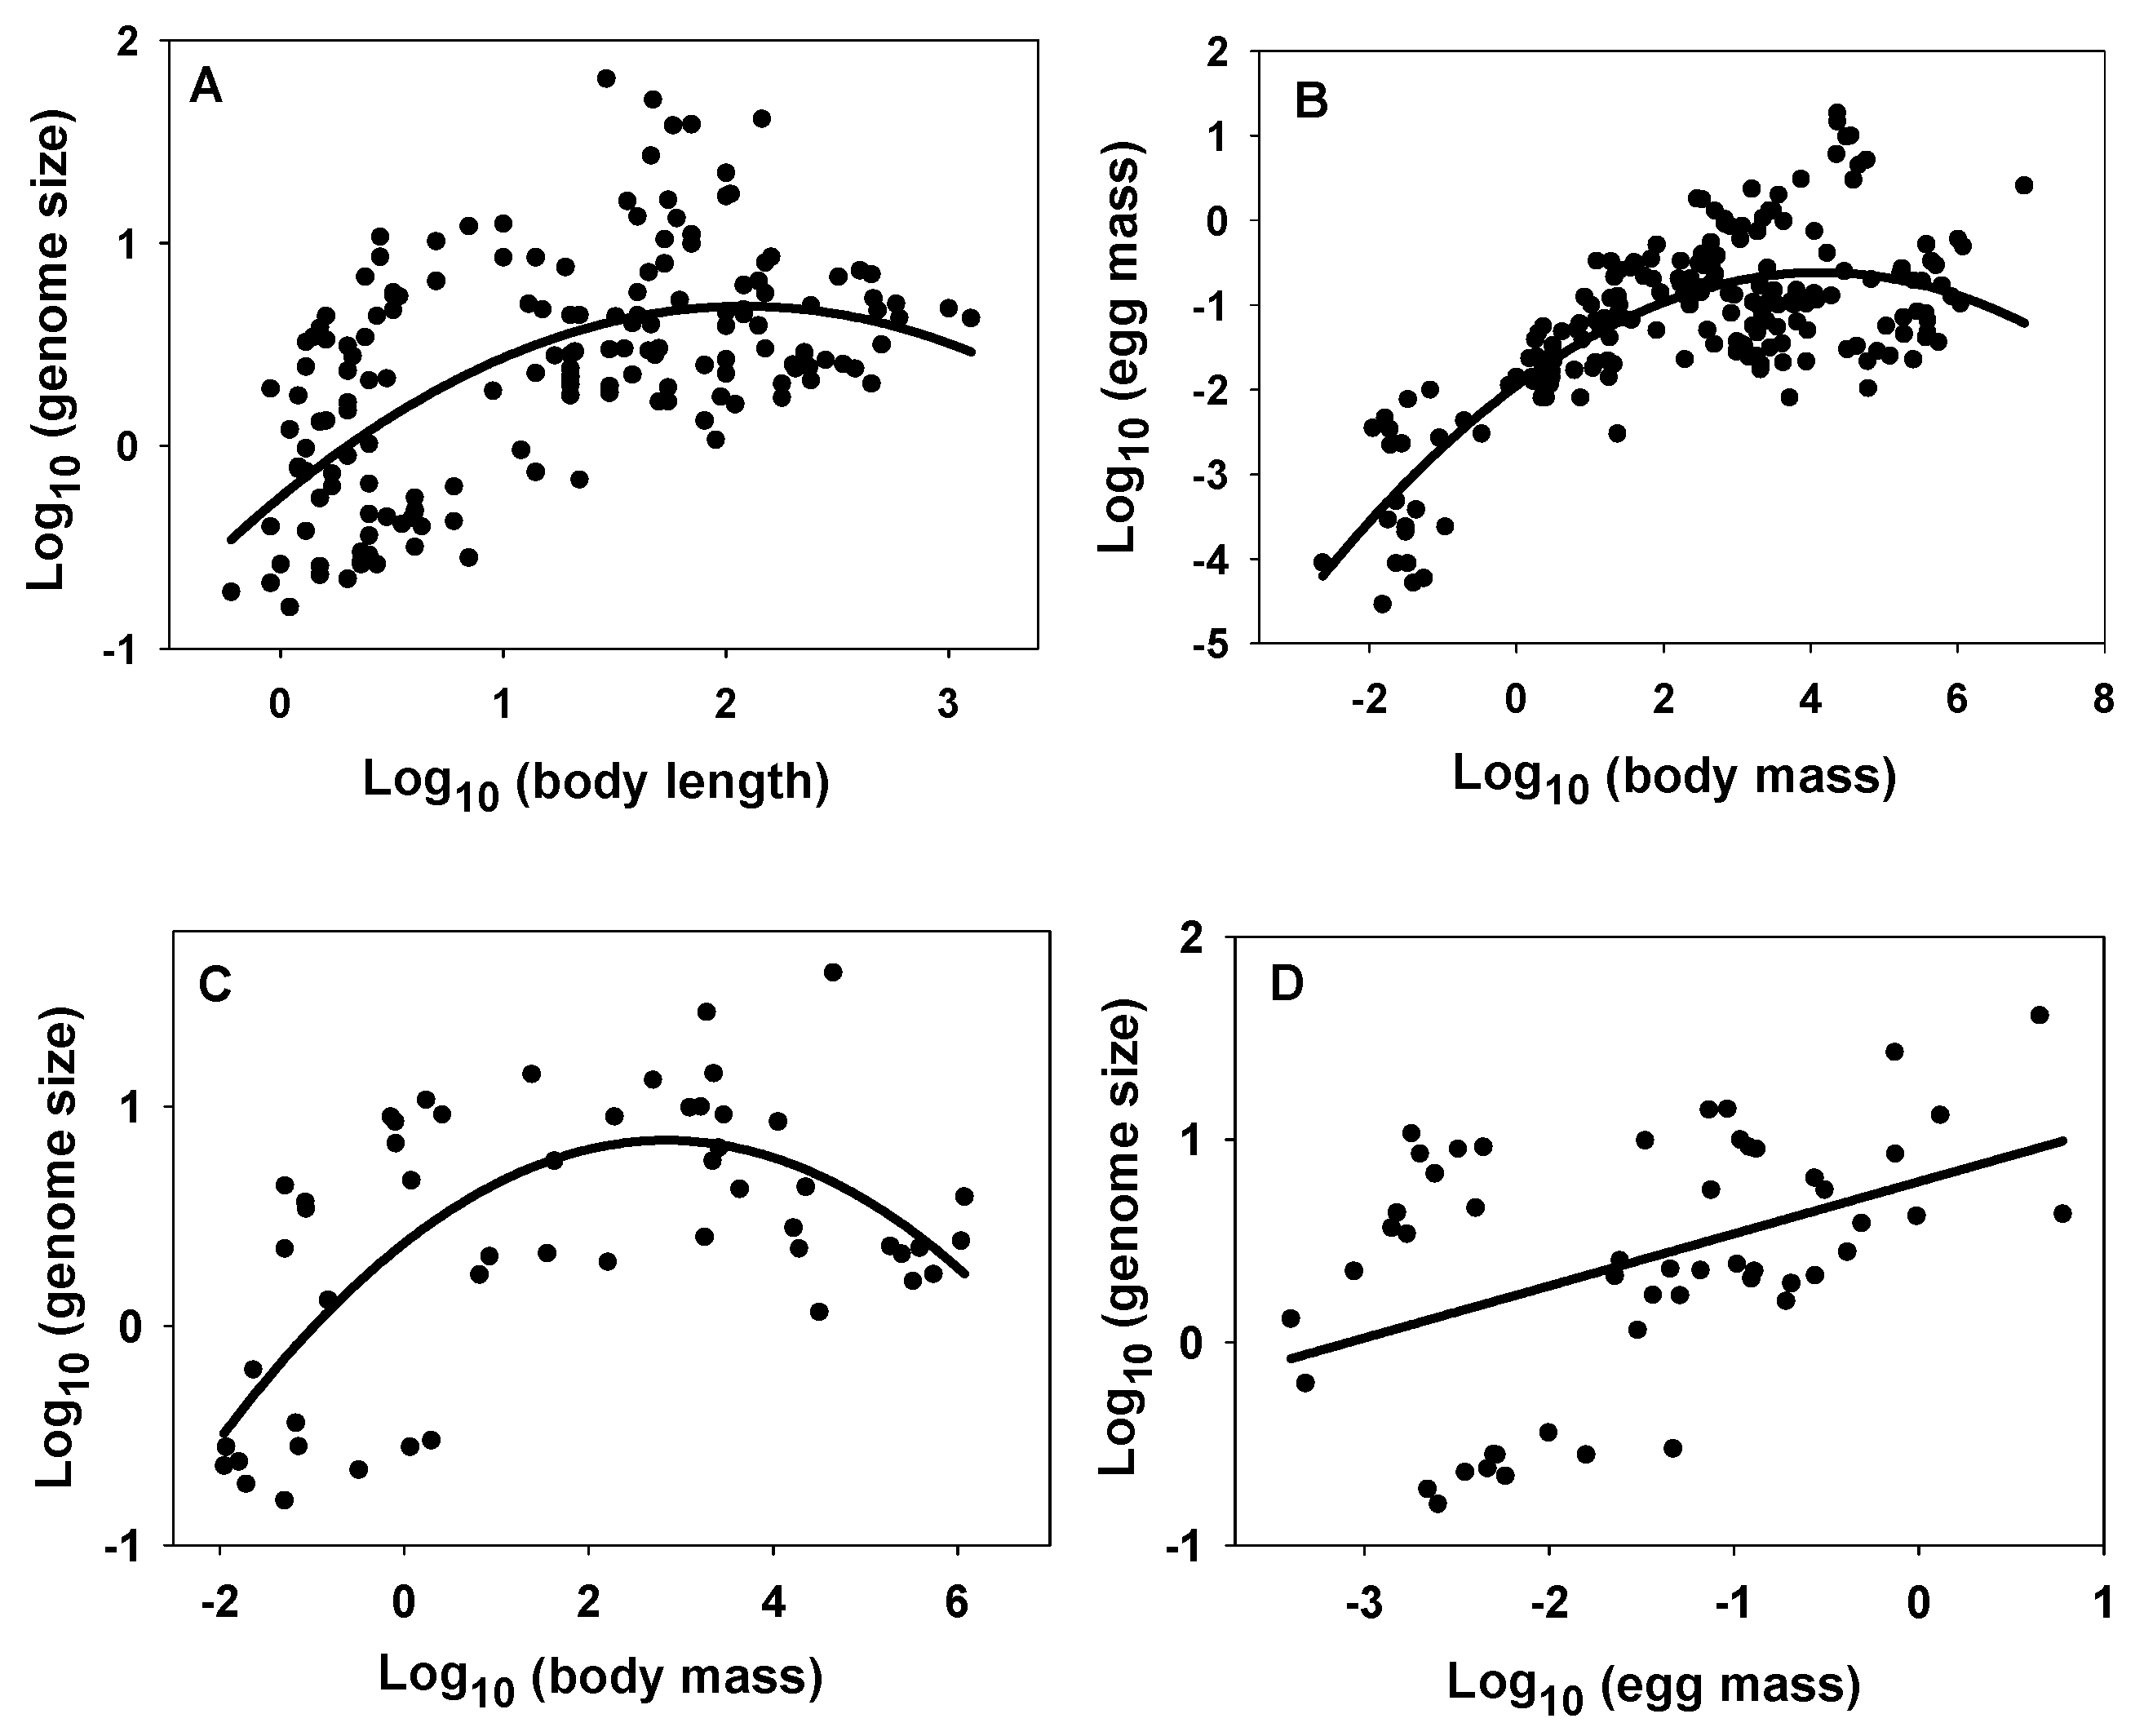
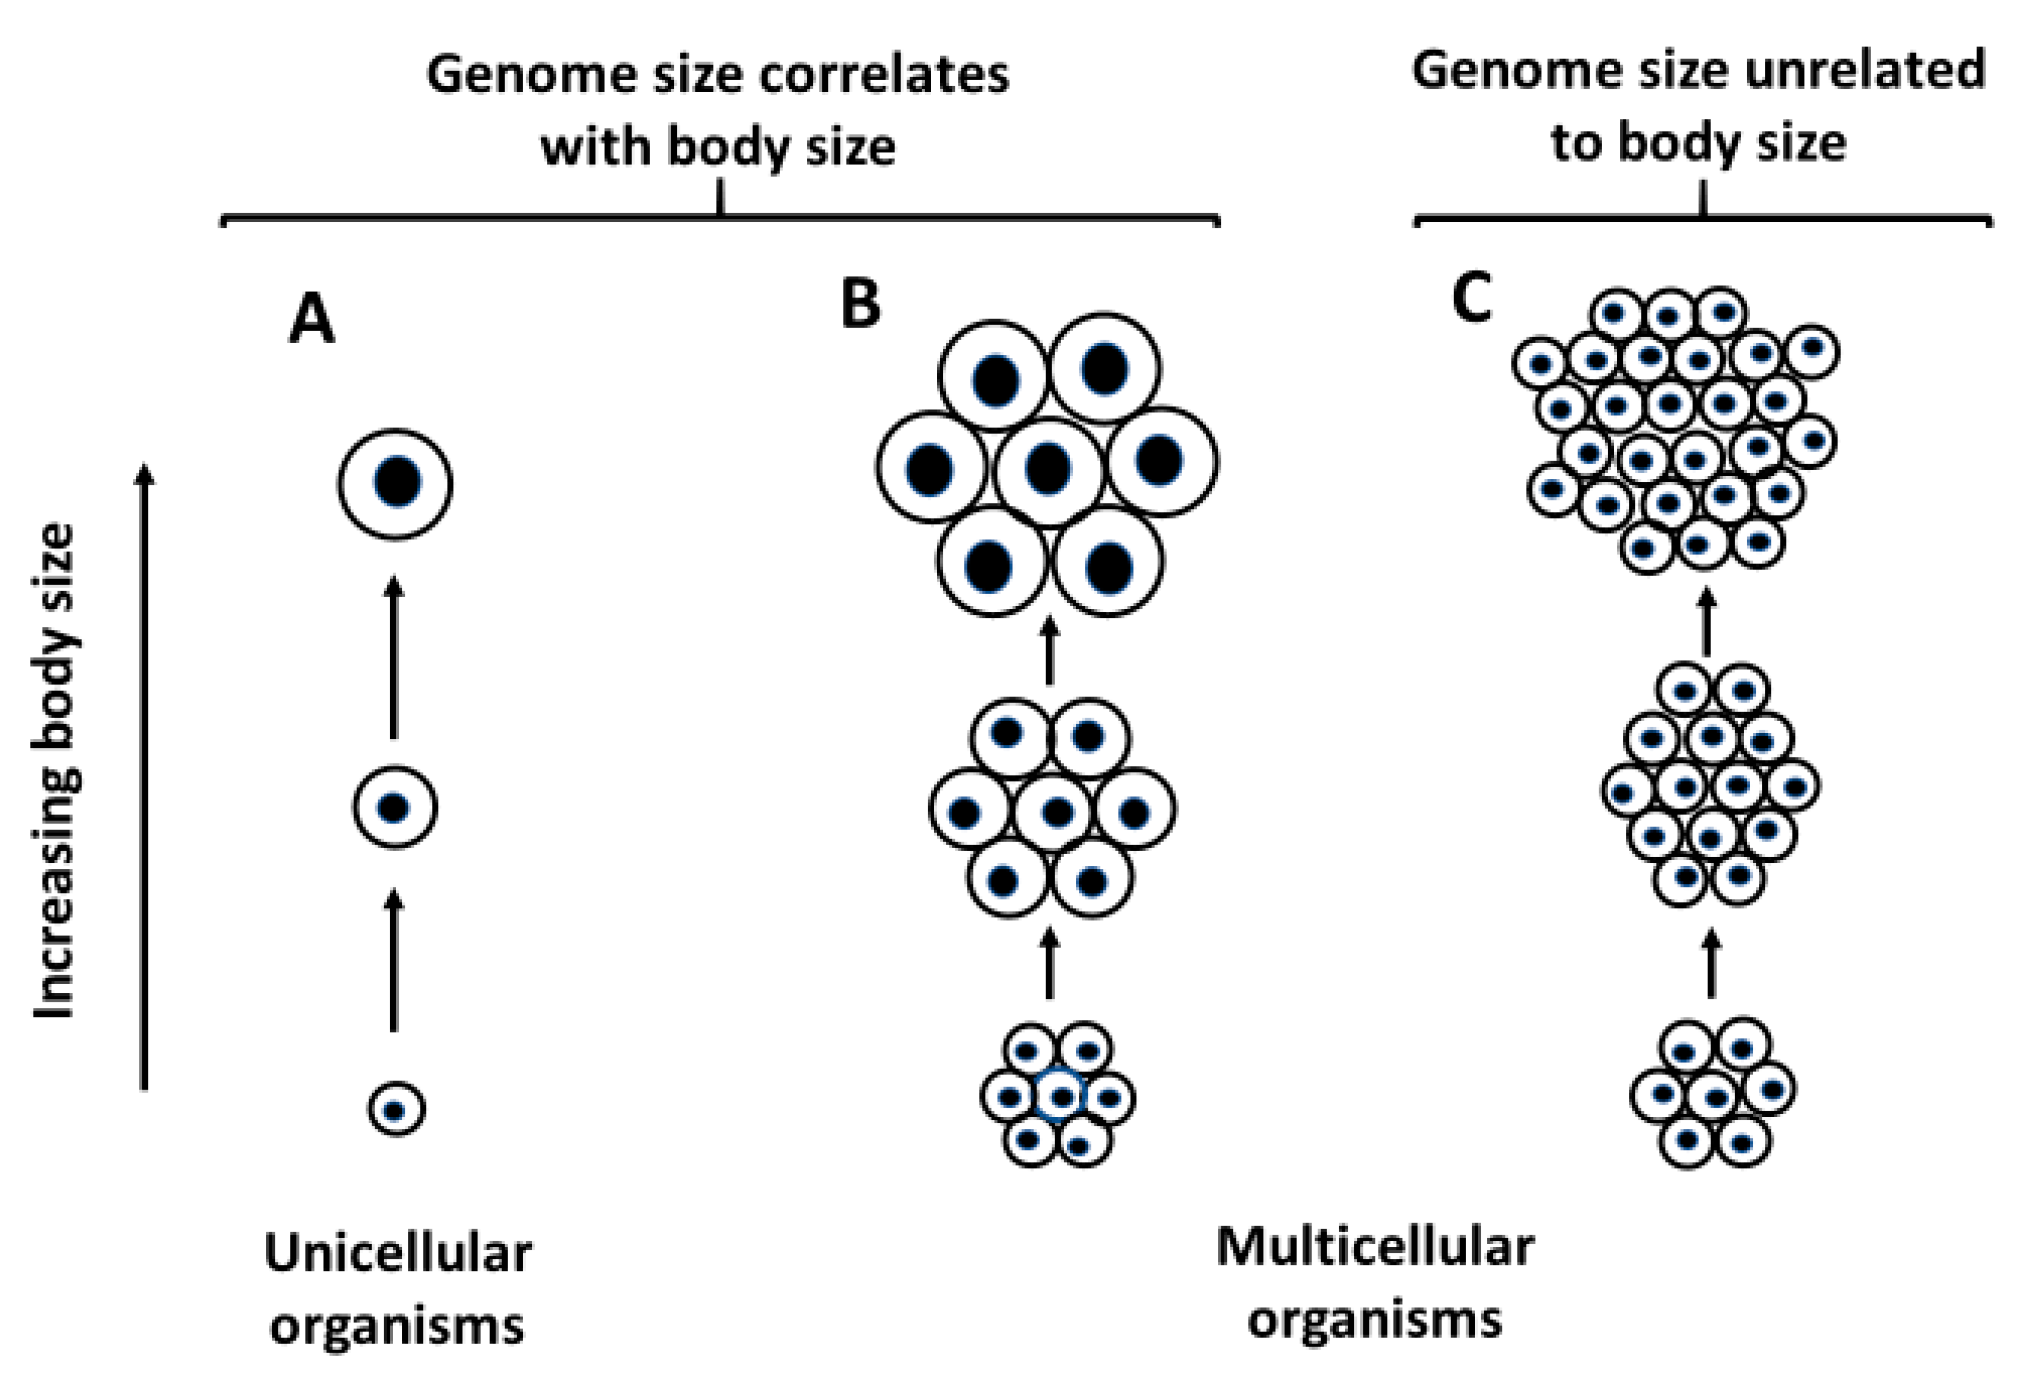
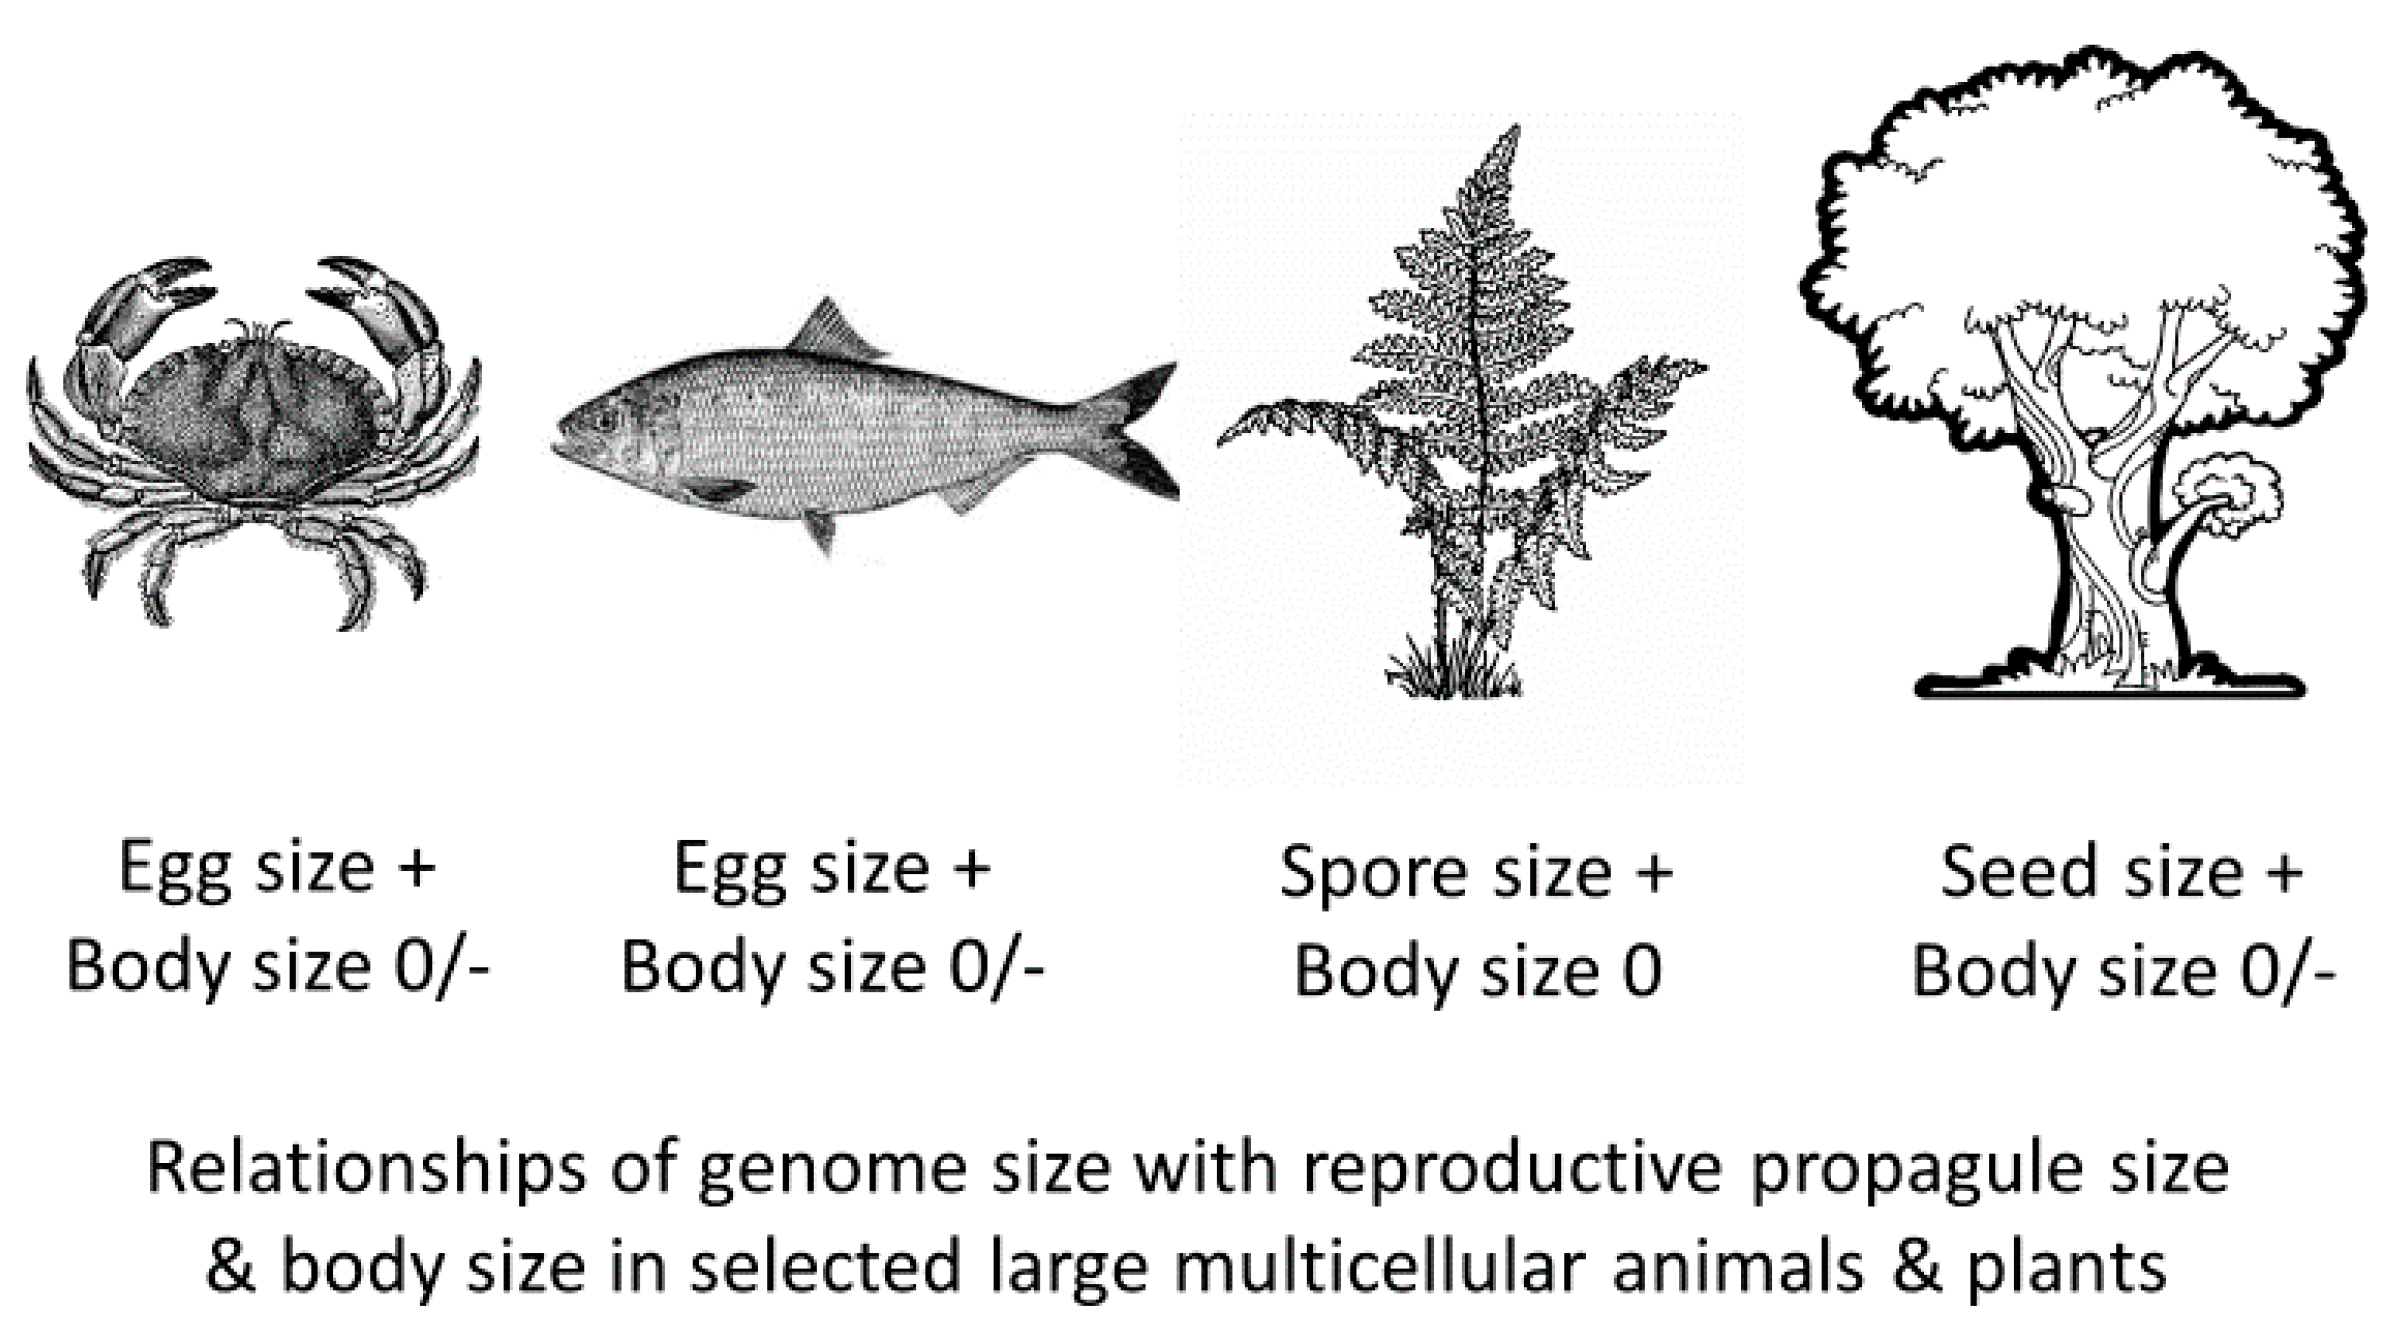
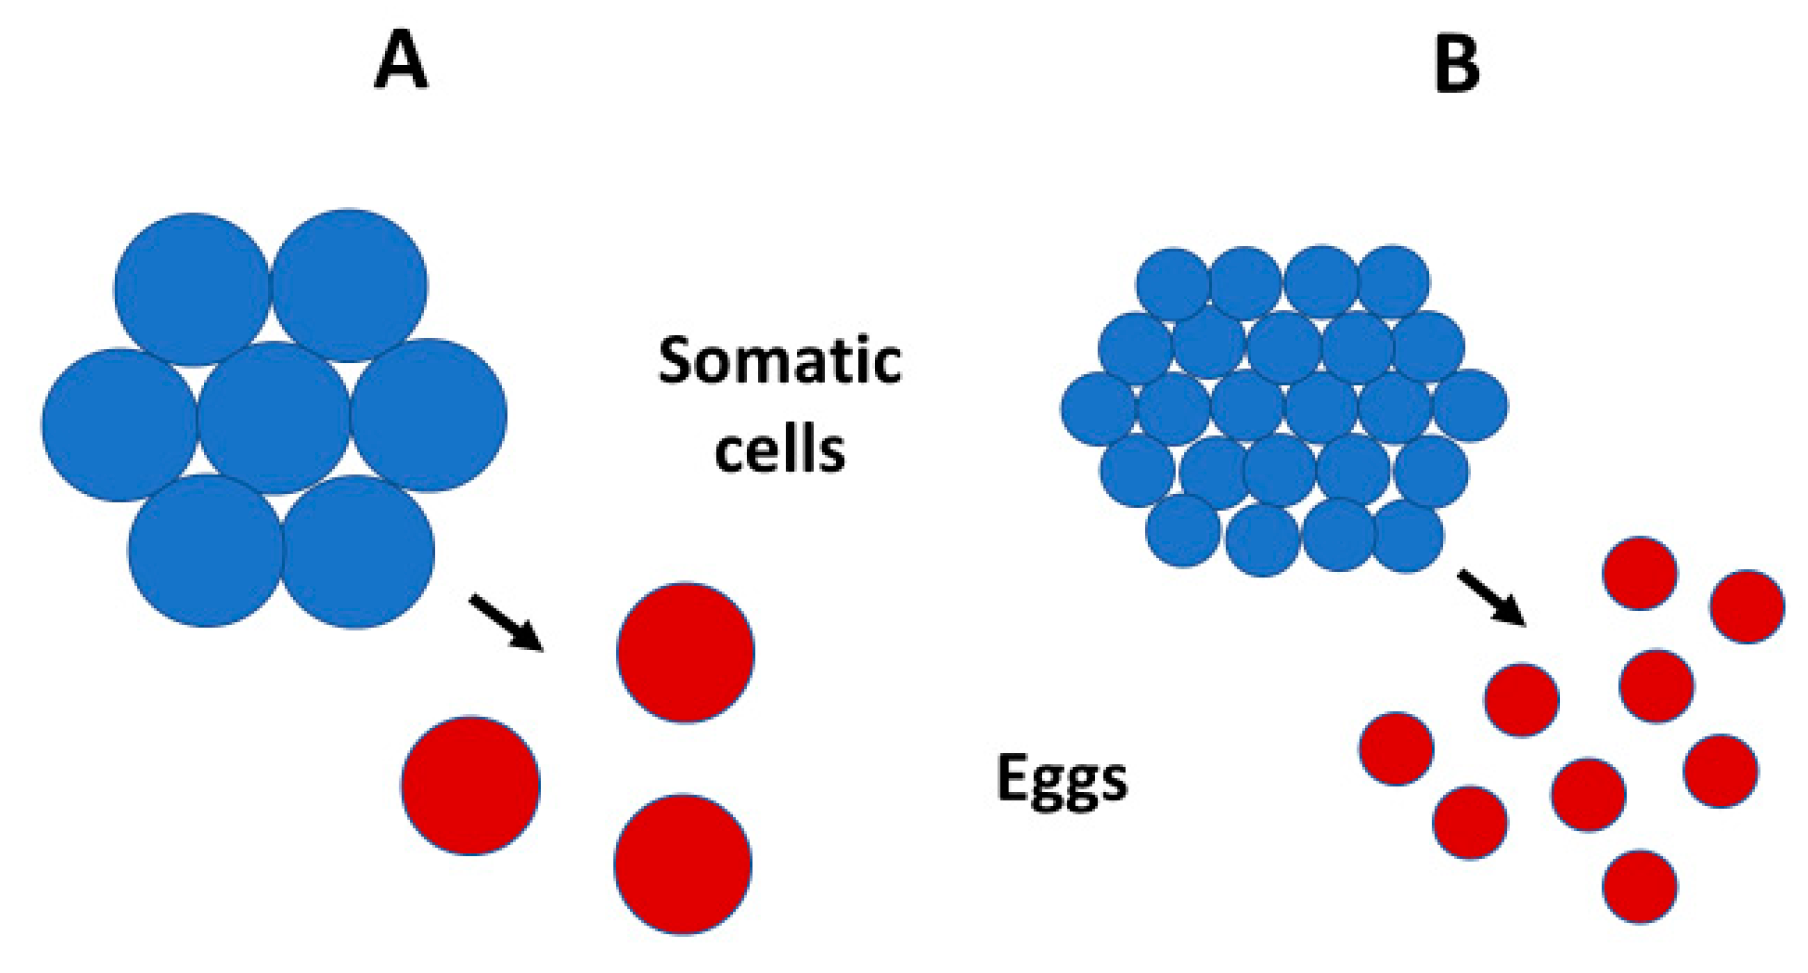

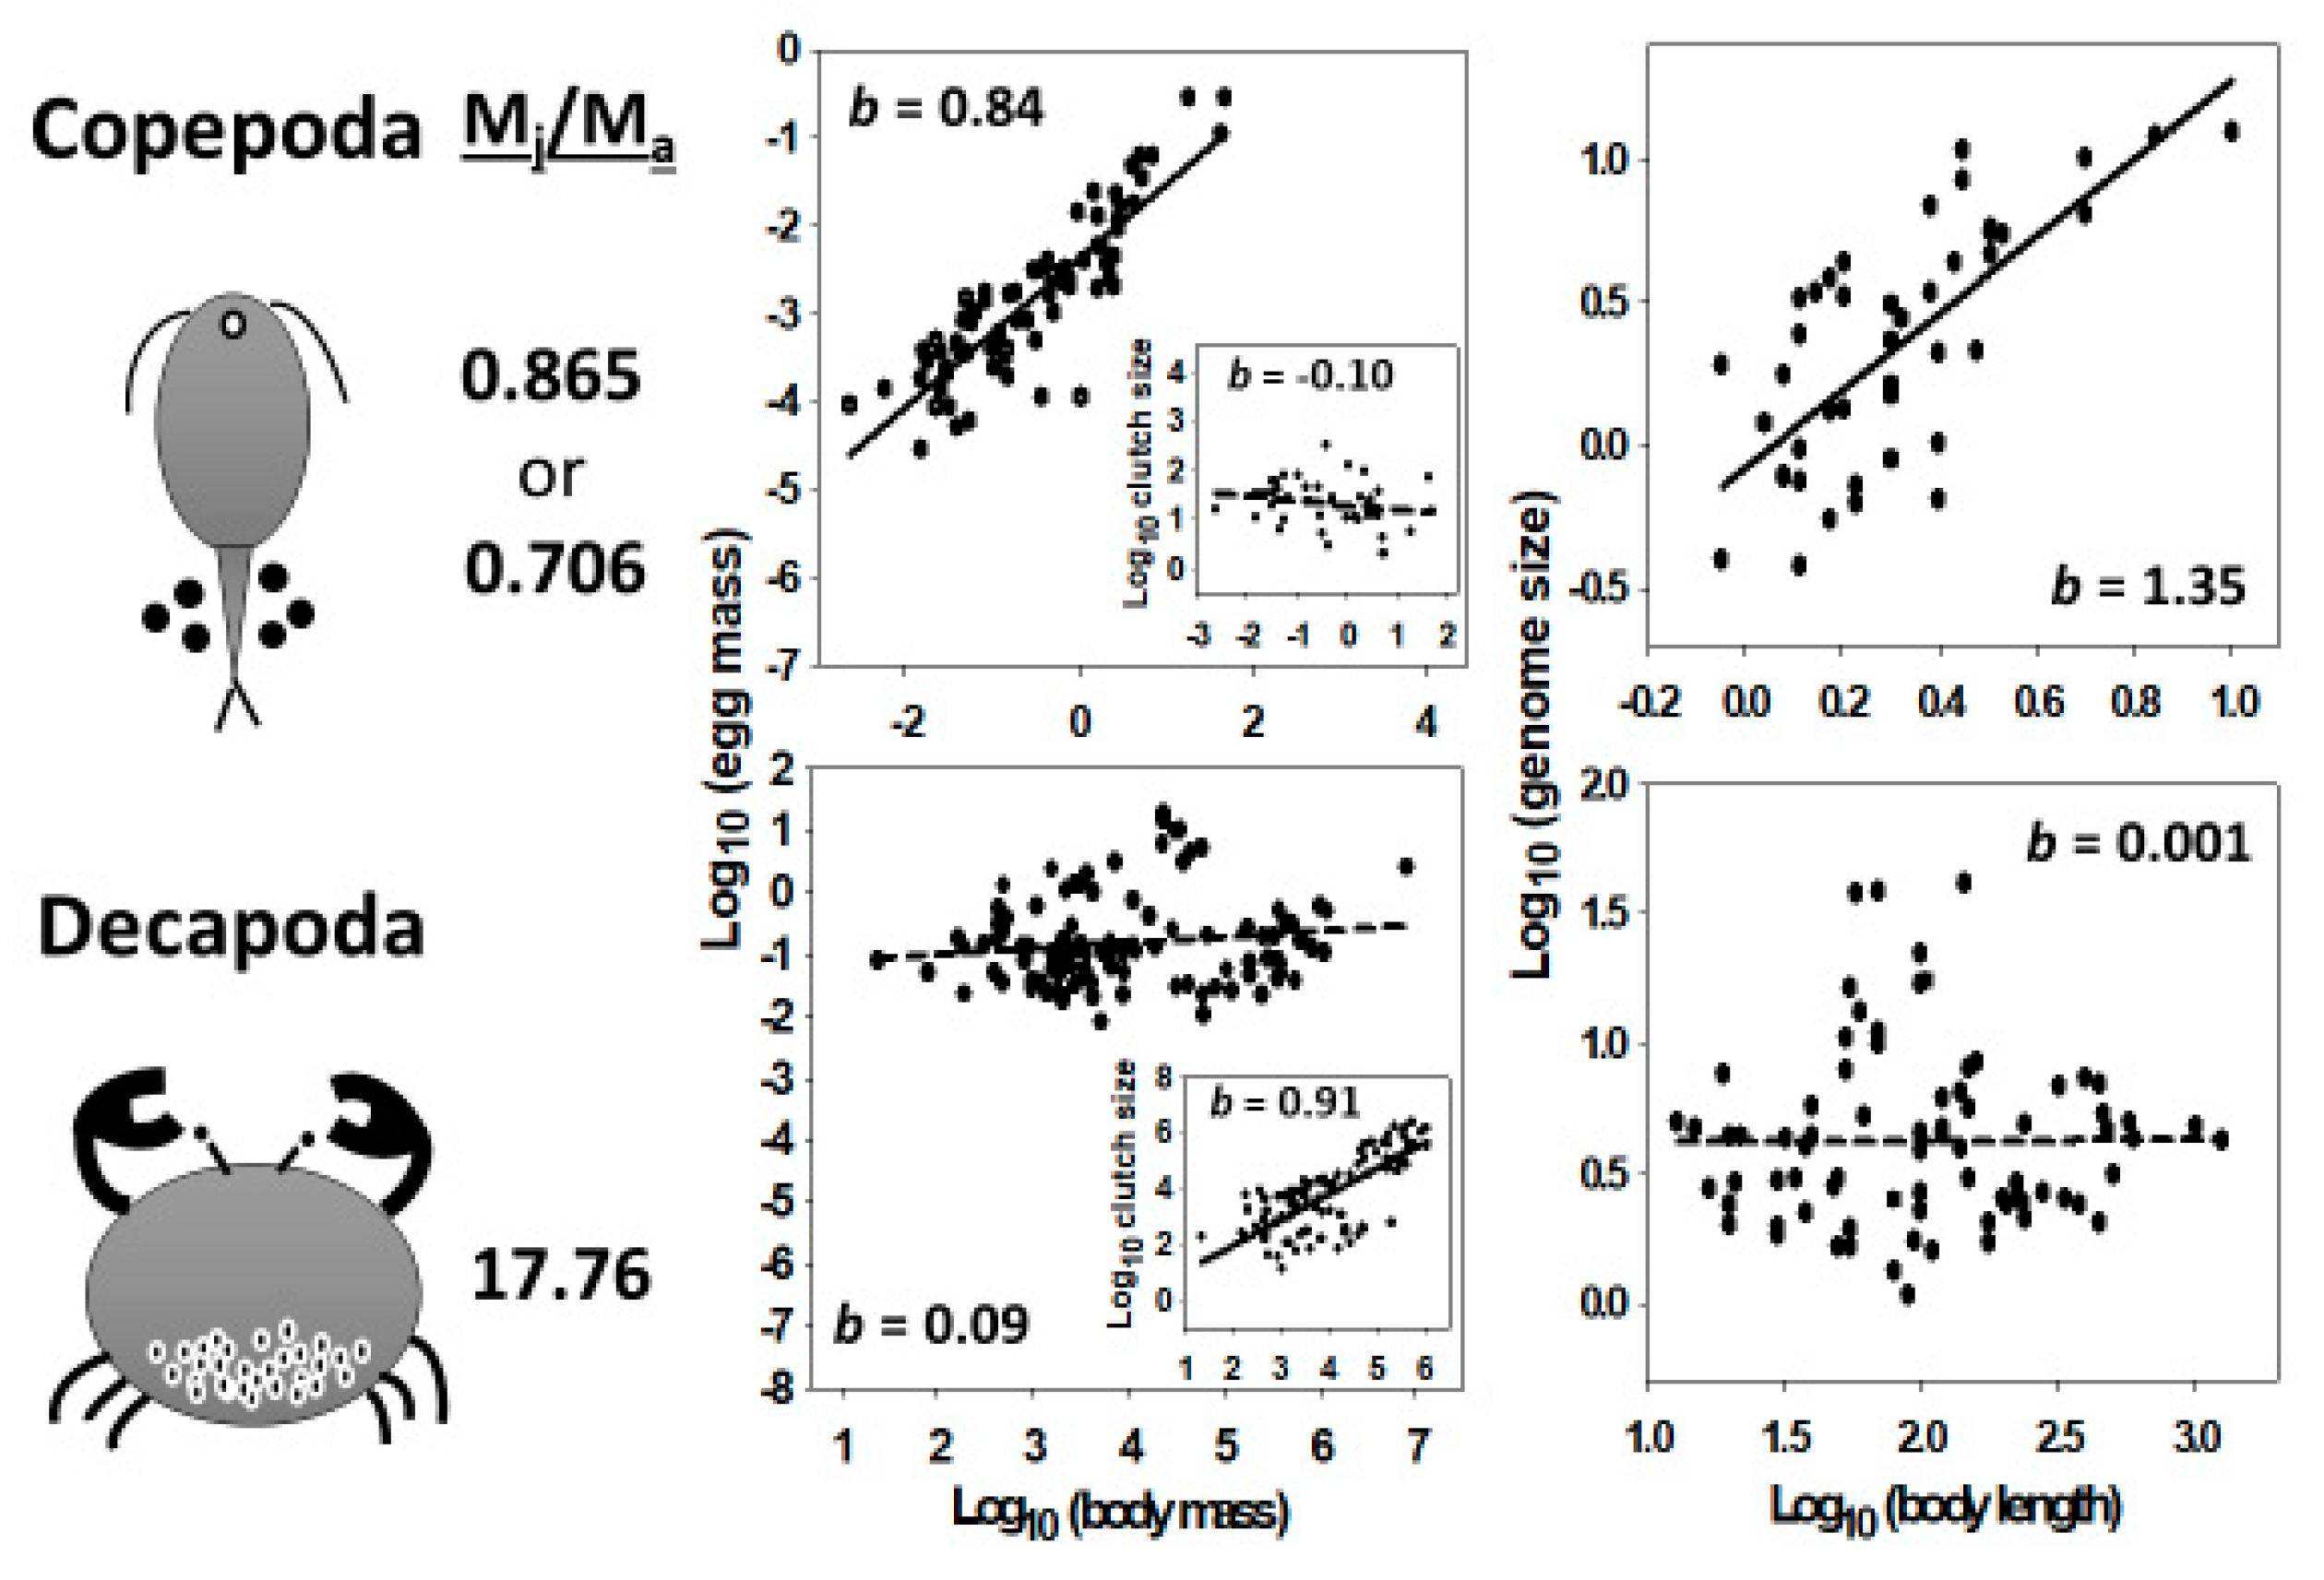
| Taxon | Relationship | Source |
|---|---|---|
| UNICELLULAR ORGANISMS | ||
| Prokaryotes and eukaryotes | POS | [19,20] |
| Planktonic bacteria | POS | [21] |
| Escherichia coli | POS | [22] |
| Algae (phytoplankton) | POS | [23,24,25] |
| Dunaliella tertiolecta | POS | [26] |
| Bacillariophyceae (diatoms) | POS | [27] |
| Ditylum brightwellii | POS | [28] |
| Thalassiosira species | POS | [29] |
| Dinoflagellata | POS | [30] |
| Protists | POS | [31] |
| Ciliophora | POS | [32,33] |
| Stentor coeruleus | POS 1 | [34] |
| MULTICELLULAR PLANTS | ||
| Polypodiopsida (ferns) | NO | [35] |
| Angiospermae | NEG | [10] |
| Herbaceous species | POS | [36] |
| Perennial species | NEG | [12] |
| Acacia species | NO | [37] |
| Brassica rapa | NO | [38] |
| Lolium multiflorum | POS | [39] |
| Nicotiana species | POS/NO 2 | [40] |
| Senecio species | POS | [41] |
| Vicia faba | NEG | [42] |
| Zea mays | NEG | [43] |
| MULTICELLULAR INVERTEBRATE ANIMALS | ||
| Platyhelminthes (flatworms) | POS | [44] |
| Nematoda (round worms) | NO | [45] |
| Rotifera (Monogononta) | NO | [46] |
| Brachionus plicatilis | POS/NO 3 | [47] |
| Annelida (segmented worms) | POS | [48] |
| Oligochaeta | NO | [49] |
| Polychaeta | POS | [50] |
| Dorvilleidae | ||
| Ophryotrocha species | POS/NO 4 | [48,51] |
| Mollusca | POS | [52] |
| Gastropoda (snails) | ||
| Viviparus contectus | POS | [53] |
| Arthropoda | ||
| Arachnida | POS | [54] |
| Acari (mites and ticks) | POS | [55] |
| Araneae (spiders) | NO | [56] |
| Crustacea | ||
| Cladocera | NO | [present study] |
| POS | [57] | |
| Copepoda | POS | [44,57,58,59,60,61,62] [present study] |
| Decapoda | NO | [57] |
| NEG | [present study] | |
| Synalpheus species | NO | [63] |
| Ostracoda | POS | [64] |
| Peracarida | ? 5 | [present study] |
| Amphipoda | POS | [57,65,66] |
| Hexapoda (insects) | ||
| Blattodea (cockroaches and termites) | NO | [67] |
| Coleoptera (beetles) | ||
| Chrysomelidae | NO | [68] |
| Coccinellidae | NO | [69] |
| Lampryidae | NO | [70,71] |
| Tenebrionidae | NO | [72] |
| Phylan semicostatus | NEG | [73] |
| Pimelia species | NO | [74] |
| Tribolium species | NO | [75] |
| Diptera | ||
| Chironomidae (midges) | NO/POS | [76] |
| Culicidae (mosquitoes) | ||
| Aedes albopictus | NO | [77] |
| Drosophilidae (fruit flies) | NO | [78] |
| POS | [79] | |
| Drosophila melanogaster | POS 6 | [80] |
| Hymenoptera | ||
| Apidae (bees) | ||
| Melipona species | NO | [81] |
| Formicidae (ants) | NO | [82] |
| Hemiptera | ||
| Aphidoidea (aphids) | NO | [83] |
| Coccoidea (scale insects) | POS | [67] |
| Lepidoptera (moths and butterflies) | NO | [84,85] |
| Arctiidae | NEG | [85] |
| Geometridae | POS | [85] |
| Noctuidae | NO | [85] |
| Odonata | ||
| Anisoptera (dragonflies) | POS | [86] |
| Zygoptera (damselflies) | NEG | [86] |
| MULTICELLULAR VERTEBRATE ANIMALS | ||
| Actinopterygii (ray-finned fishes) | NO | [87] |
| Cyprinidae | NO | [88] |
| Tetrapoda (4-legged vertebrates) | NO | [89] |
| Anura (frogs and toads) | NO | [90] |
| Pipidae | NO | [91] |
| Caudata (salamanders) | NO | [90,92] |
| POS | [93] | |
| Dinosauria | ||
| Sauropoda | NO 7 | [94] |
| Aves (birds) | POS | [95,96,97] |
| Mammalia | POS | [95,98] |
| Artiodactyla | NO | [95] |
| Carnivora | NO | [95] |
| Chiroptera (bats) | NO | [95] |
| POS | [99] | |
| Pteropodidae (megabats) | NO | [100] |
| NO/POS 3 | [99] | |
| Primates | NO | [95] |
| Rodentia | POS | [95] |
| Relationship | Taxon | Slope 2 | Intercept 2 | r3 | n4 | p5 |
|---|---|---|---|---|---|---|
| GS vs. BL | Cladocera | 0.444 (±0.155) | −0.680 (±0.073) | 0.756 | 28 | <0.00001 |
| GS vs. BL | Copepoda | 1.354 (±0.419) | −0.078 (±0.159) | 0.709 | 44 | <0.00001 |
| GS vs. BL | Peracarida | 1.291 (±1.029) | −1.091 (±1.423) | 0.504 | 19 | 0.017 |
| GS vs. BL | Decapoda | 0.001 (±0.168) | 0.623 (±0.345) | 0.002 | 79 | 0.986 |
| EM vs. BM | Cladocera | 0.390 (±0.168) | −1.828 (±0.213) | 0.777 | 18 | 0.00015 |
| EM vs. BM | Copepoda | 0.842 (±0.111) | −2.377 (±0.117) | 0.871 | 75 | <0.00001 |
| EM vs. BM | Peracarida | 0.639 (±0.123) | −1.972 (±0.204) | 0.798 | 64 | <0.00001 |
| EM vs. BM | Decapoda | 0.094 (±0.031) | −1.190 (±0.520) | 0.145 | 105 | 0.141 |
| GS vs. BM | Cladocera | 0.039 (±0.098) | −0.562 (±0.133) | 0.309 | 10 | 0.384 |
| GS vs. BM | Copepoda | 0.432 (±0.222) | 0.861 (±0.196) | 0.807 | 12 | 0.0015 |
| GS vs. BM | Peracarida | 0.367 (±0.502) | 0.025 (±0.931) | 0.643 | 7 | 0.119 |
| GS vs. BM | Decapoda | −0.194 (±0.126) | 1.487 (±0.552) | 0.573 | 23 | 0.0043 |
| GS vs. EM | Cladocera | 0.179 (±0.152) | −0.211 (±0.339) | 0.694 | 10 | 0.026 |
| GS vs. EM | Copepoda | 0.972 (±0.420) | 3.330 (±1.182) | 0.852 | 12 | 0.00043 |
| GS vs. EM | Peracarida | 0.541 (±1.242) | 1.047 (±1.034) | 0.448 | 7 | 0.314 |
| GS vs. EM | Decapoda | 0.273 (±0.219) | 0.873 (±0.223) | 0.493 | 23 | 0.017 |
| Taxon | N | BM Effect Coefficient | p | EM Effect Coefficient | p |
|---|---|---|---|---|---|
| Cladocera | 10 | −0.098 | 0.074 | 0.343 | 0.0089 |
| Copepoda | 12 | 0.203 | 0.140 | 0.643 | 0.040 |
| Peracarida | 7 | 0.515 | 0.258 | −0.373 | 0.676 |
| Decapoda | 23 | −0.181 | 0.0025 | 0.247 | 0.0090 |
| Relationship | Y Intercept | X Term | X2 Term | r 2 | n3 | p4 |
|---|---|---|---|---|---|---|
| GS vs. BL (linear) | −0.052 | 0.344 | 0.534 | 170 | <0.00001 | |
| GS vs. BL (curvilinear) | −1.252 | 0.903 | −0.217 | 0.588 | 170 | <0.00001 0.00013 |
| EM vs. BM (linear) | −2.217 | 0.391 | 0.758 | 262 | <0.00001 | |
| EM vs. BM (curvilinear) | −2.101 | 0.688 | −0.079 | 0.831 | 262 | <0.00001 <0.00001 |
| GS vs. BM (linear) | 0.213 | 0.110 | 0.461 | 52 | 0.00058 | |
| GS vs. BM (curvilinear) | 0.377 | 0.331 | −0.058 | 0.674 | 52 | <0.00001 0.00002 |
| GS vs. EM (linear) | 0.793 | 0.257 | 0.439 | 52 | 0.00112 | |
| GS vs. EM (curvilinear) | 0.889 | 0.528 | 0.094 | 0.474 | 52 | 0.0132 0.163 2 |
| Taxon | Propagule or Gamete | Relationship | Source |
|---|---|---|---|
| PLANTS | |||
| Bryophyta (mosses) | Sperm | POS | [106] |
| Polypodiopsida (ferns) | Spore | POS | [35,107] |
| Gymnospermae | Pollen | NO | [108] |
| Seed | POS | [109] | |
| Pinus species | Seed | POS | [110,111,112] |
| Angiospermae | Pollen | NO/POS | [9,113,114,115,116] |
| Seed | POS | [9,10,36,109,114,117,118] | |
| Perennial herbs | Seed | POS | [12] |
| Geophytes | Seed | NO | [119] |
| Acacia species | Seed | NO | [37] |
| Achillea species | Seed | POS | [120] |
| Aesculus species | Seed | NO/POS 1 | [121] |
| Allium species | Seed | POS | [9,113] |
| Anacardium occidentale | Seed | POS | [122] |
| Armeria maritima | Pollen | POS | [123] |
| Bouteloua curtipendula | Pollen | POS 2 | [124] |
| Brassica rapa | Seed | NO | [38] |
| Cicer species | Seed | POS | [125] |
| Corchorus olitorius | Seed | NO/POS 3 | [126] |
| Crepis species | Pollen | POS | [127] |
| Seed | POS | [127] | |
| Dasypyrum villosum | Seed | POS | [128] |
| Glycine max | Seed | POS | [129] |
| Gossypium species | Pollen | POS | [130] |
| Hemerocallis varieties | Pollen | POS | [131] |
| Hyacinthus orientalis | Pollen | POS | [132] |
| Hylocereus species | Pollen | POS | [133,134] |
| Seed | NO/POS/NEG 4 | [133] | |
| Juglans rea | Seed | POS | [135] |
| Lavandula angustifolia | Seed | POS | [136] |
| Lolium multiflorum | Seed | POS | [39] |
| Lolium perenne | Seed | POS | [137] |
| Malus × domestica | Pollen | POS | [138] |
| Nicotiana species | Seed | POS | [40] |
| Pisum sativum | Seed | POS | [139] |
| Pyrus pyrifolia | Pollen | POS | [140] |
| Ramonda species | Pollen | POS | [141] |
| Ramonda species | Seed | NO/POS 5 | [141] |
| Scilla sibirica | Pollen | POS | [132] |
| Senecio species | Seed | NO | [41] |
| Sisyrhinchium species | Seed | POS | [142] |
| Streptocarpus species | Pollen | NO/POS 6 | [143] |
| Vicia species | Seed | POS | [113,144] |
| Vicia sativa | Seed | POS | [145] |
| Zea mays | Seed | NEG | [43] |
| INVERTEBRATE ANIMALS | |||
| Rotifera (Monogononta) | Egg | NO | [46] |
| Brachionus plicatilis | Egg | POS | [47] |
| Annelida (segmented worms) | |||
| Oligochaeta | |||
| Dorvilleidae | |||
| Ophryotrocha species | Egg | NO | [48,51] |
| Mollusca | |||
| Crassostrea gigas | Egg | POS | [146] |
| Arthropoda | |||
| Crustacea | |||
| Cladocera | Egg | POS | [present study] |
| Copepoda | Egg | POS | [present study] |
| Decapoda | Egg | POS | [present study] |
| Peracarida | Egg | ? 7 | [present study] |
| Insecta | |||
| Coleoptera (beetles) | |||
| Bruchinae | Egg | NO | [147] |
| Tenebrionidae | |||
| Tribolium species | Sperm | POS | [75] |
| Diptera | Egg | ? 8 | [148] |
| Drosophilidae (fruit flies) | Sperm | POS | [79] |
| Drosophilidae (fruit flies) | Egg | NO | [79,149] my analysis |
| VERTEBRATE ANIMALS | |||
| Actinopterygii (ray-finned fishes) | Egg | POS | [87,150] |
| Anura (frogs and toads) | Egg | NO | [90] |
| Pipidae | Egg | NO | [91] |
| Caudata (salamanders) | Egg | NO | [90] |
| Plethodontidae | Egg | POS | [151] my analysis |
| Mammalia | Sperm | NO/POS 9 | [7,152,153] |
| Chiroptera | Neonate | NO | [99] |
| Assumption/Prediction | Statement |
|---|---|
| Assumption #1 | The life cycles of most multicellular organisms include a single-celled developmental stage connecting one generation to the next. |
| Assumption #2 | Reproductive propagules or gametes are unicellular (e.g., eggs/oocytes, sperm and spores) or consist of relatively few cells (pollen and seeds) compared to that of adults. |
| Assumption #3 | Variation in the sizes of multicellular reproductive propagules is usually related to variation in cell size, at least in part. |
| Assumption #4 | Genome size is almost always positively correlated with cell size. |
| Assumption #5 | Genome size is usually unrelated or even negatively related to cell number in multicellular organisms. |
| Assumption #6 | Multicellular bodies grow by cell enlargement or multiplication, or both. |
| Assumption #7 | Large organisms typically require more cell multiplication to reach adult size than do small organisms, especially if the size differences are large. |
| Assumption #8 | Trade-offs between somatic cell size and number and between propagule size and number often occur because of spatial (body-volume) constraints. |
| Prediction #1 | Genome size should be more positively correlated with propagule size than adult body size. This prediction should apply to both unicellular and multicellular propagules. |
| Prediction #2 | Genome size should be more strongly related to the size of a living system if it is unicellular than if it is multicellular. |
| Prediction #3 | Genome size should be more strongly related to adult body size in multicellular organisms that differ mainly in cell size rather than cell number. |
| Prediction #4 | Genome size should be more related to the size of a multicellular living system if it is small and chiefly affected by cell size (e.g., reproductive propagules and small adults) than if it is large and chiefly affected by cell number (e.g., large adults). |
| Prediction #5 | Spatial (body-volume) constraints and similar effects of genome size on the sizes of somatic cells and reproductive propagules should cause interpopulation or interspecific variation in propagule size and number to parallel variation in somatic cell size and number. |
Publisher’s Note: MDPI stays neutral with regard to jurisdictional claims in published maps and institutional affiliations. |
© 2021 by the author. Licensee MDPI, Basel, Switzerland. This article is an open access article distributed under the terms and conditions of the Creative Commons Attribution (CC BY) license (http://creativecommons.org/licenses/by/4.0/).
Share and Cite
Glazier, D.S. Genome Size Covaries More Positively with Propagule Size than Adult Size: New Insights into an Old Problem. Biology 2021, 10, 270. https://doi.org/10.3390/biology10040270
Glazier DS. Genome Size Covaries More Positively with Propagule Size than Adult Size: New Insights into an Old Problem. Biology. 2021; 10(4):270. https://doi.org/10.3390/biology10040270
Chicago/Turabian StyleGlazier, Douglas S. 2021. "Genome Size Covaries More Positively with Propagule Size than Adult Size: New Insights into an Old Problem" Biology 10, no. 4: 270. https://doi.org/10.3390/biology10040270
APA StyleGlazier, D. S. (2021). Genome Size Covaries More Positively with Propagule Size than Adult Size: New Insights into an Old Problem. Biology, 10(4), 270. https://doi.org/10.3390/biology10040270