
Messenger RNA Gene Expression Screening of VIP and PACAP Neuropeptides and Their Endogenous Receptors in Ruminants

 ,
,
Abstract
:Simple Summary
Abstract
1. Introduction
2. Materials and Methods
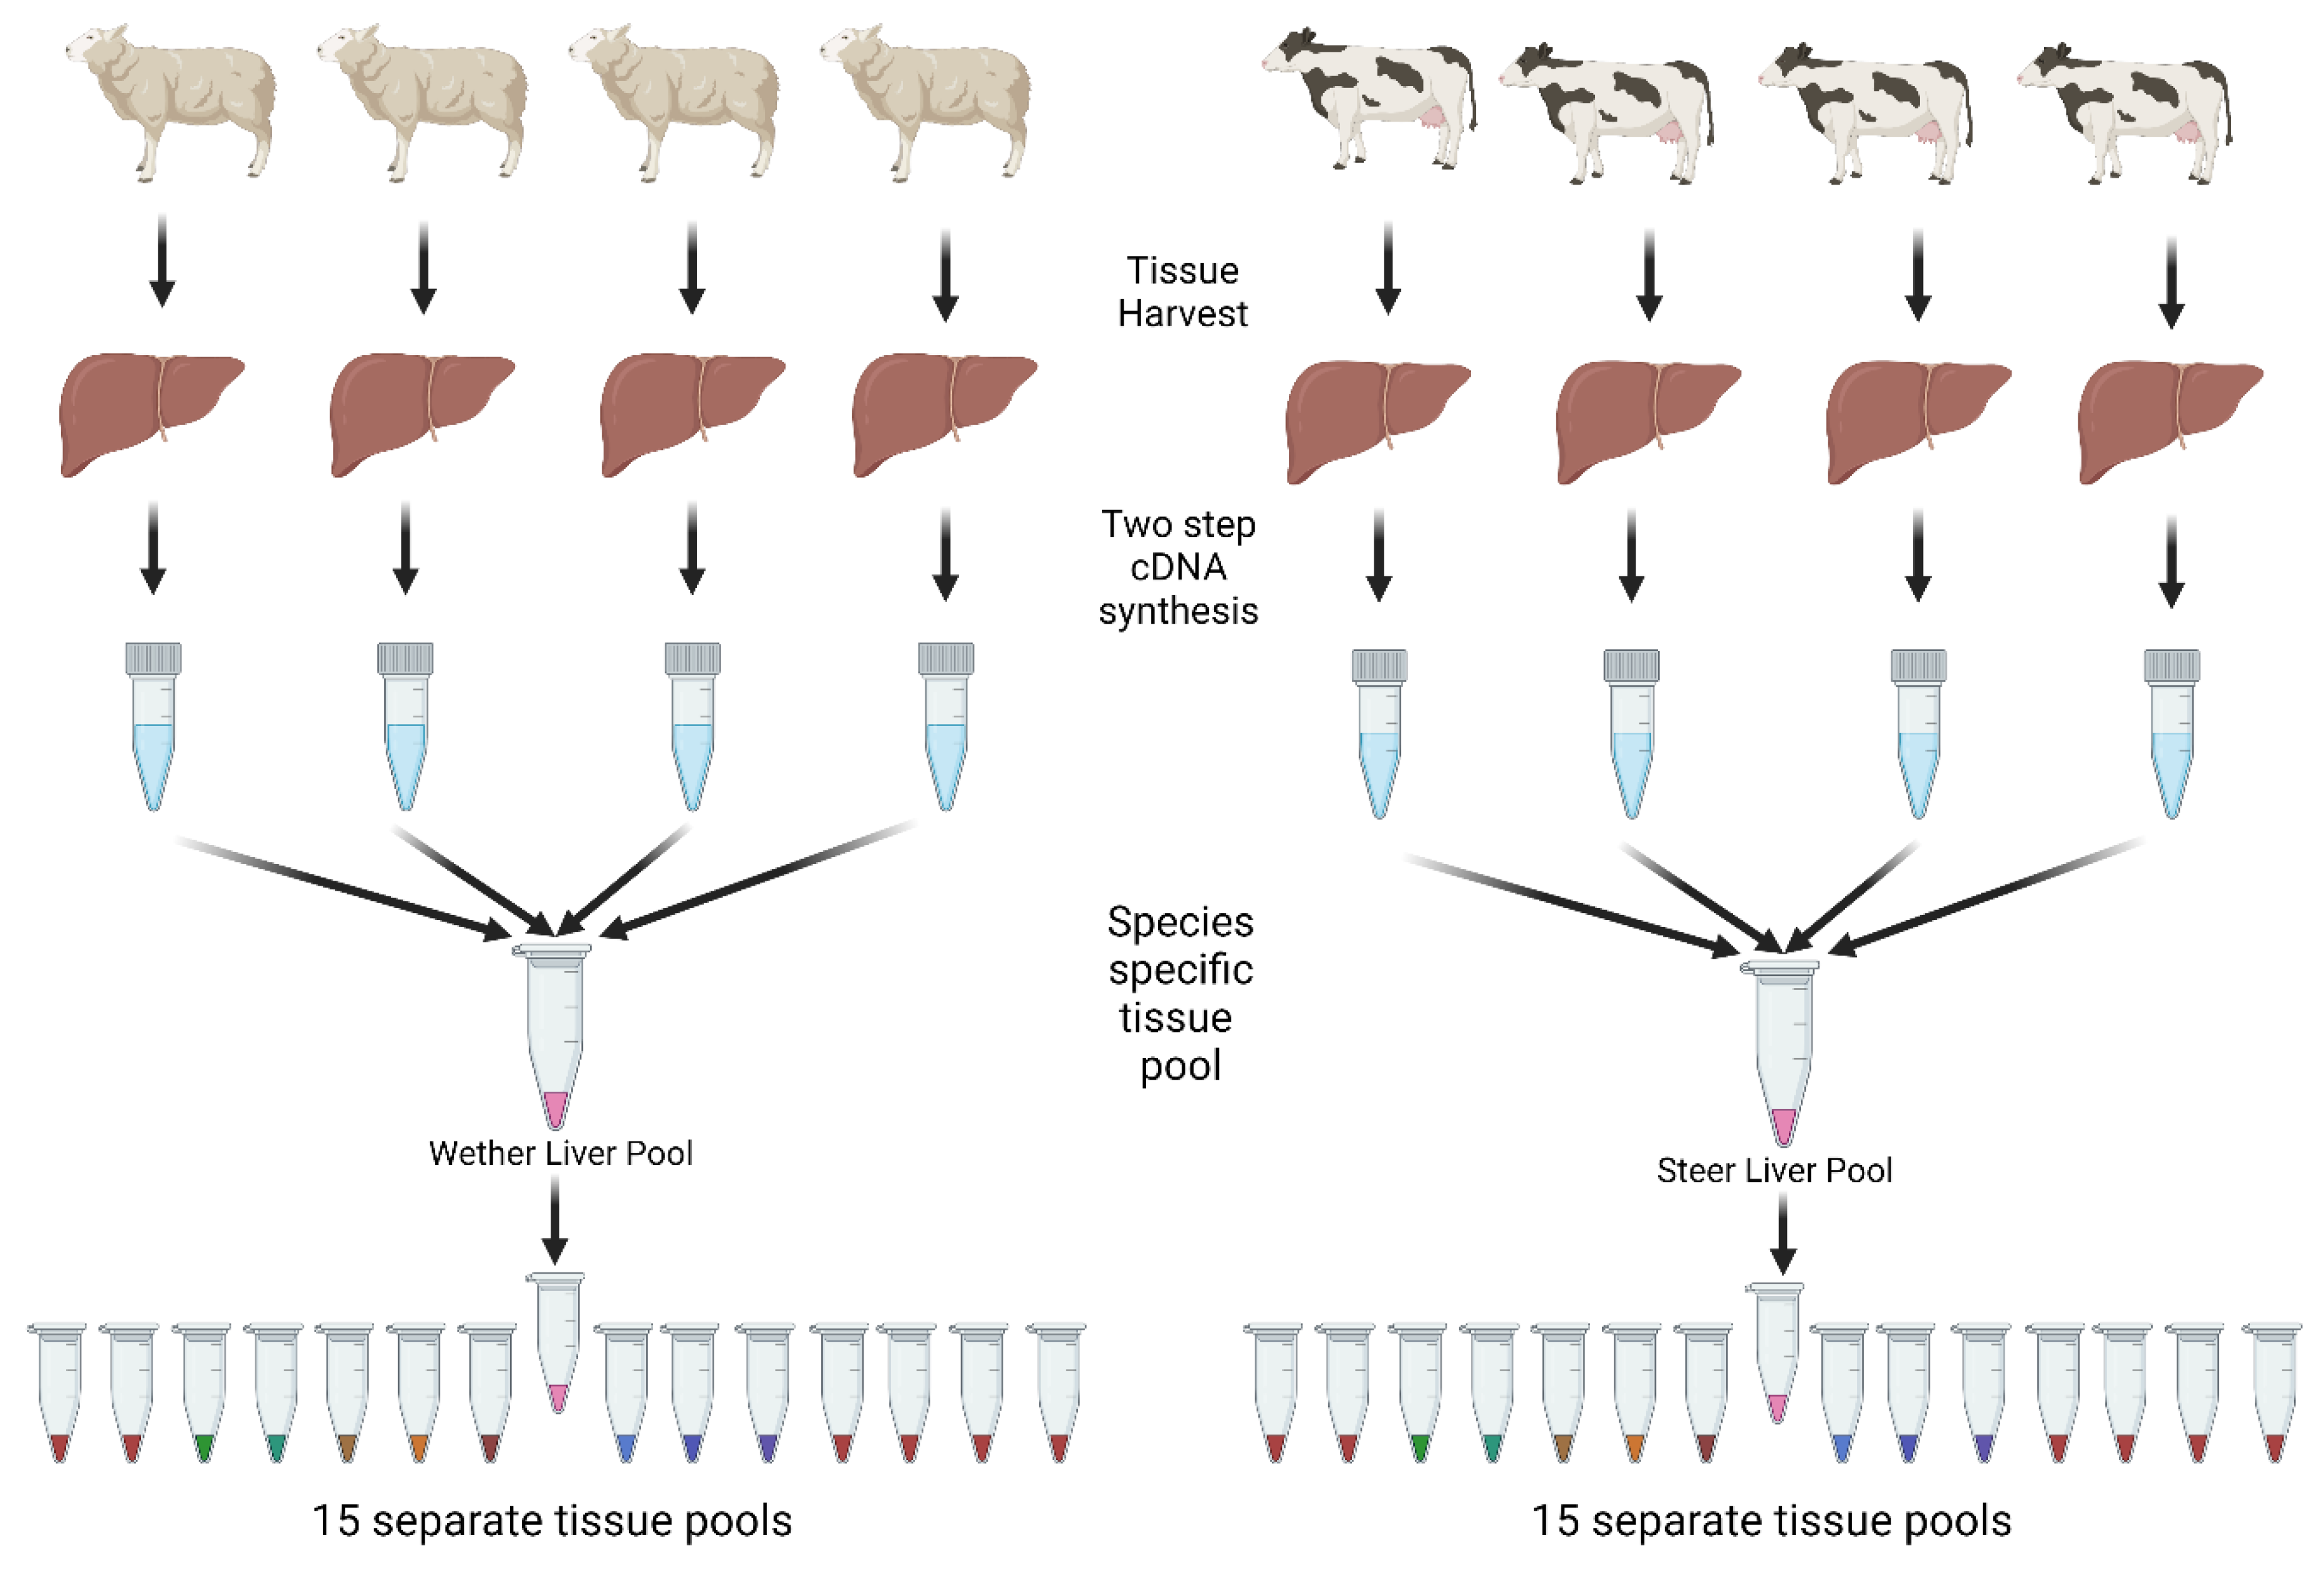
2.1. Tissue Harvest
2.2. RNA Extraction and cDNA Synthesis
2.3. qPCR
2.4. Data Analysis
3. Results
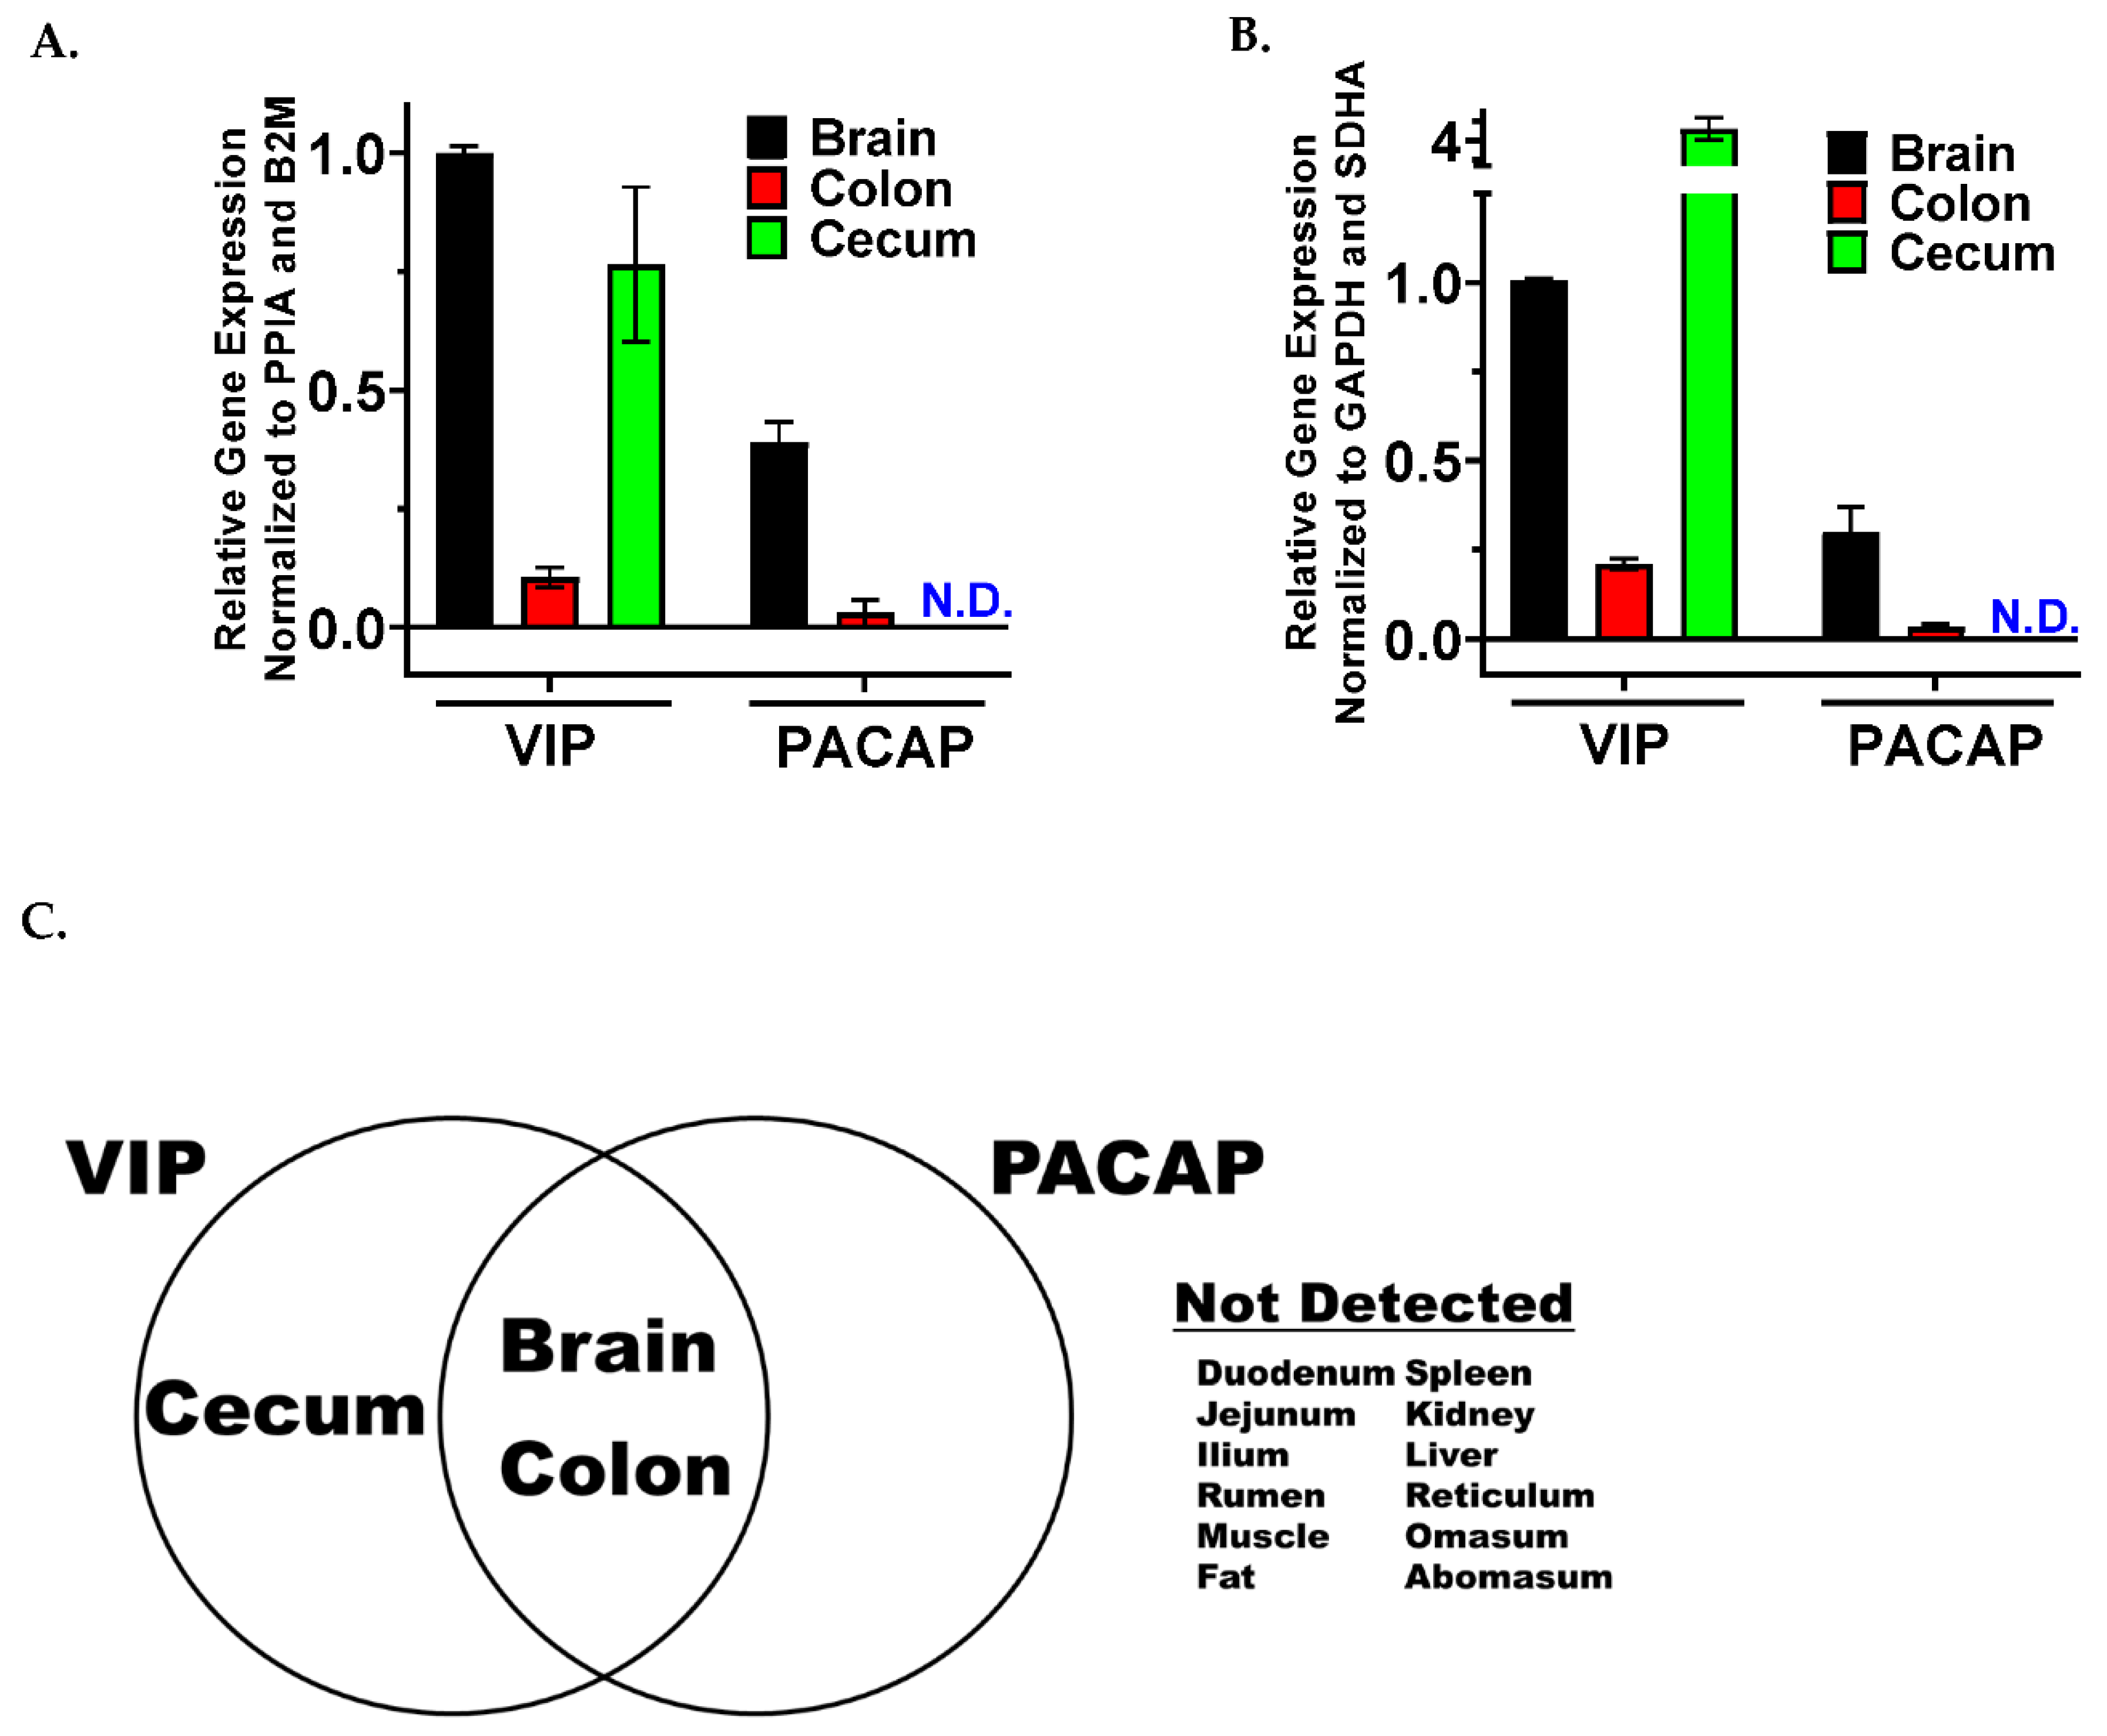
3.1. VIP and PACAP Ligands Share a Similar mRNA Tissue Expression Profile between the Gut and Brain
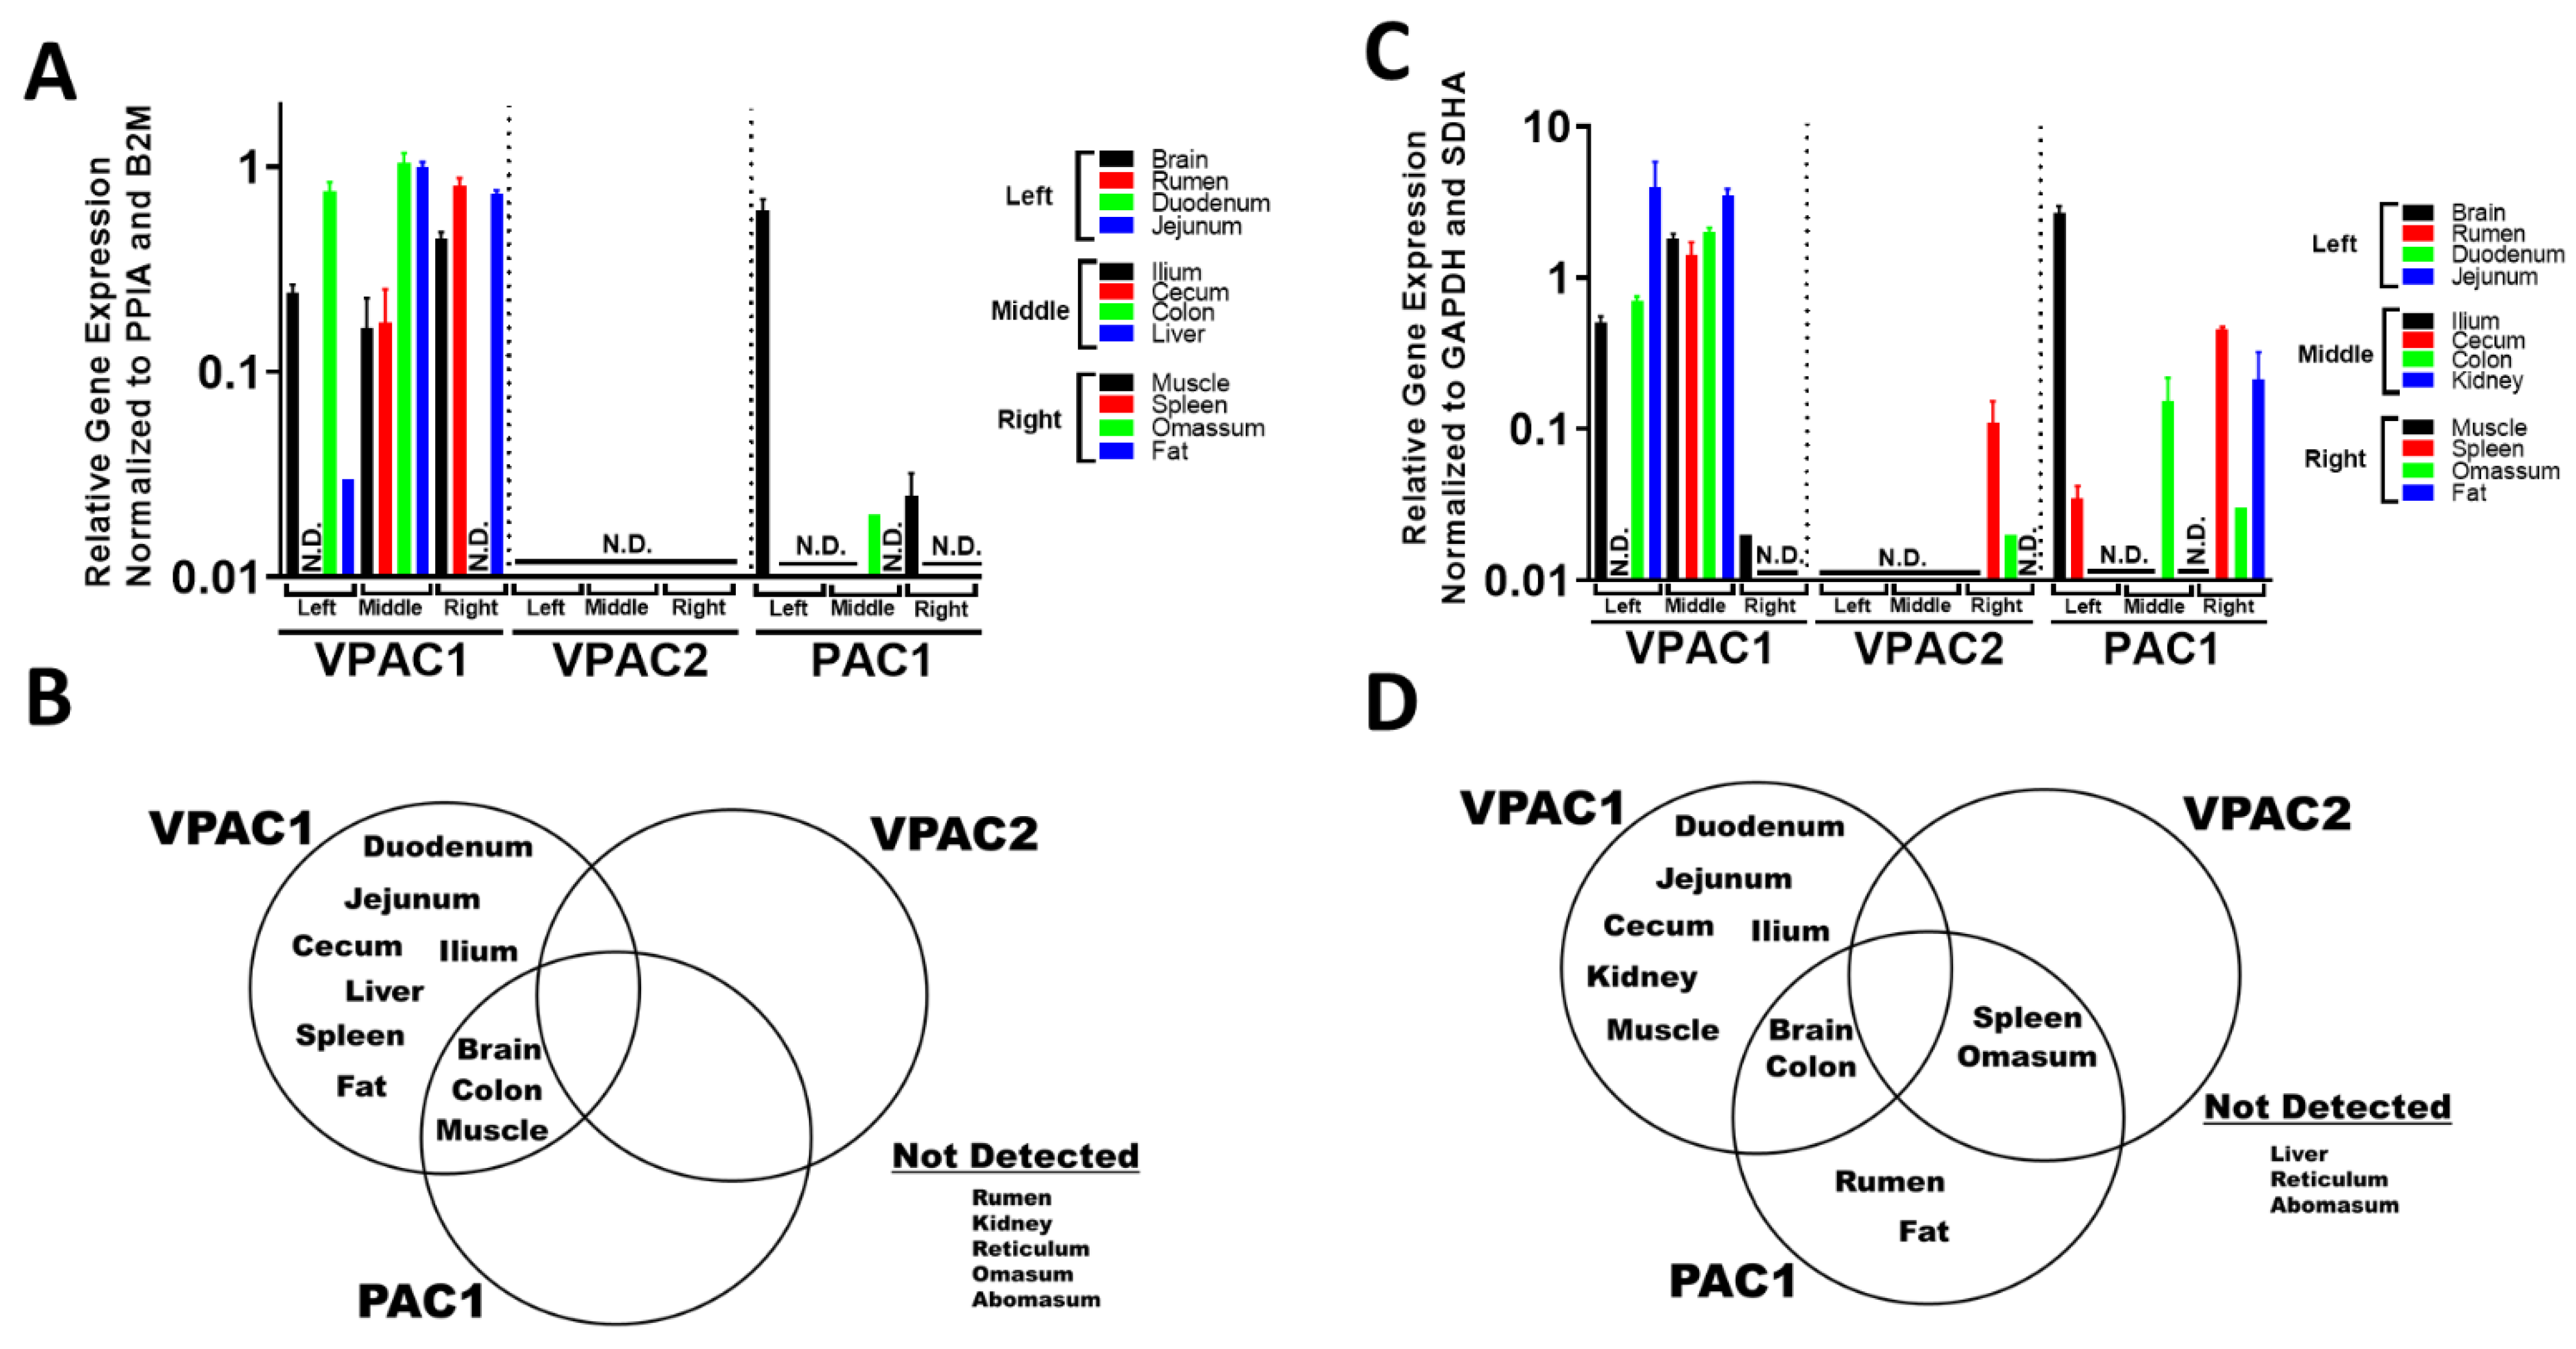
3.2. VIP and PACAP GPCRs Have a More Varied and Widespread mRNA Tissue Expression Profile Compared to Their Ligands
4. Discussion
Author Contributions
Funding
Institutional Review Board Statement
Informed Consent Statement
Data Availability Statement
Conflicts of Interest
Appendix A


| Item to Check | Importance | Checklist | Details |
|---|---|---|---|
| Experimental Design | |||
| Definition of experimental and control groups | E | ✓ | 4 stears 455–621 days old and 4 wethers 252–276 days old. |
| Number within each group | E | ✓ | A total of 4 biological replicates were pooled in each tissue cDNA group, except for fat and brain, which only contained 3 replicates. |
| Assay carried out by core lab or investigator’s lab? | D | ✓ | Investigator’s lab |
| Acknowledgement of authors’ contributions | D | ✓ | K.M, M.Y., and K.C.S performed the sheep and cow husbandry and tissue collection. E.H. and K.M. extracted RNA from tissues and EH performed qPCR experiments. E.H. and G.P.D. wrote the sections of the manuscript. G.P.D calculated fold-changes for the dataset and produced the graphs. K.C.S, C.D., and K.M. provided advice for the experimental design. K.C.S., K.M., C.D., and M.Y. critically edited the manuscript. G.P.D. devised the experimental design, established collaborations with K.C.S., K.M., and M.Y., interpreted all the data, graphed the data, organized the tables, and edited the manuscript. |
| Sample | |||
| Description | E | ✓ | From both steers & wethers: (1) Brain (2) Duodenum (3) Jejunum (4) Ileum (5) Cecum (6) Colon (7) Rumen (8) Reticulum (9) Omasum (10) Abomasum (11) Muscle (12) Fat (13) Liver (14) Spleen and (15) Kidney. |
| Volume/mass of sample processed | D | ||
| Microdissection or macrodissection | E | ✓ | Macrodissection |
| Processing procedure | E | ✓ | None |
| If frozen—how and how quickly? | E | ✓ | Liquid nitrogen. |
| If fixed—with what, how quickly? | E | ✓ | No fixation |
| Sample storage conditions and duration | E | ✓ | 30 min duration between slaughter to freezing. Samples stored at −80 °C |
| NUCLEIC ACID EXTRACTION | |||
| Procedure and/or instrumentation | E | ✓ | Column and Phenol/chloroform extraction |
| Name of kit and details of any modifications | E | ✓ | Trizol, Qiagen Mini or Universal Mini Kits. |
| Source of additional reagents used | D | ✓ | Millipore-Sigma |
| Details of DNase or RNAse treatment | E | ✓ | Qiagen Mini (qiashredder column), Qiagen Universal Mini (gDNAse included in kit). DNAse also used prior to cDNA (see below) |
| Contamination assessment (DNA or RNA) | E | ✓ | All NRT and NTC reactions for this study were ≤ 8% based on the following formula: RT+ fluorescence = 100% − [2(−(Cq NRT or NTC)/( −2^(−Cq RT+)) × 100] [37]. |
| Nucleic acid quantification | E | ✓ | Spectrophotometer |
| Instrument and method | E | ✓ | Nanodrop ND-1000 spectrophotometer |
| Purity (A260/A280) | D | ✓ | 1.9–2.3 |
| Yield | D | ✓ | 7–92 ug |
| RNA integrity method/instrument | E | ✓ | Qubit 4 fluorometer |
| RIN/RQI or Cq of 3′ and 5′ transcripts | E | ✓ | IQ 6.4–10 |
| Electrophoresis traces | D | ||
| Inhibition testing (Cq dilutions, spike or other) | E | ✓ | cDNA was diluted 1/10 with water or 1x TE prior to qPCR. |
| Reverse Transcription | |||
| Complete reaction conditions | E | ✓ | cDNA reactions containing final concentrations of FIREScript RT (10 U/µL), RiboGripTM RNase Inhibitor (1 U/µL), dNTP MIX (500 µM of each), Oligo dT (2.5 µM) Random primers (2.5 µM) and 1x RT Reaction Buffer with DTT with final concentrations of 50 mM Tris-HCl pH 8.3, 50 mM KCl, 3 mM MgCl2, 10 mM DTT |
| Amount of RNA and reaction volume | E | ✓ | 620–800 ng in 20 µL volume |
| Priming oligonucleotide (if using GSP) and concentration | E | ✓ | 100 µM Oligo (dT) and 100 µM Random primers |
| Reverse transcriptase and concentration | E | ✓ | FIREScript RT (200 U/µl) |
| Temperature and time | E | ✓ | Reverse transcriptase reactions were incubated at 25 °C for 5–10 min, 37–60 °C for 15–30 min and 85 °C for 5 min to deactivate the enzyme. |
| Manufacturer of reagents and catalogue numbers | D | ✓ | Solis BioDyne FIREScript RT cDNA synthesis kit (#06-15-00050). |
| Cqs with and without RT | D | ✓ | Water added to reverse transcriptase (RT) negative control |
| Storage conditions of cDNA | D | ✓ | −80 °C for up to 1 year |
| qPCR Target Information | |||
| If multiplex, efficiency and LOD of each assay. | E | ✓ | Not Multiplex |
| Sequence accession number | E | ✓ | See Table 1. |
| Location of amplicon | D | ✓ | See Table 1. |
| Amplicon length | E | ✓ | See Table 1. |
| In silico specificity screen (BLAST, etc.) | E | ✓ | NCBI BLAST and IDT Primer Quest |
| Pseudogenes, retropseudogenes or other homologs? | D | ||
| Sequence alignment | D | ||
| Secondary structure analysis of amplicon | D | ||
| Location of each primer by exon or intron (if applicable) | E | ✓ | See Table 1. |
| What splice variants are targeted? | E | ✓ | See Table 1. |
| qPCR Oligonucleotides | |||
| Primer sequences | E | ✓ | See Table 1. |
| RTPrimerDB Identification Number | D | ||
| Probe sequences | D | ||
| Location and identity of any modifications | E | ✓ | See Table 1. |
| Manufacturer of oligonucleotides | D | ✓ | Solis BioDyne FIREScript RT cDNA synthesis kit (#06-15-00050). |
| Purification method | D | ||
| qPCR Protocol | |||
| Complete reaction conditions | E | ✓ | Amplification parameters were: 95 °C (12 min) hot start + [ 95 °C (15 s) denaturation + 60 °C (30 s) annealing] × 40 cycles. Melt curves with 5-second intervals between 65–95 °C followed all PCR experiments, and only those primer pairs that showed a single amplicon PCR product were used for this study. |
| Reaction volume and amount of cDNA/DNA | E | ✓ | 20 µL. At least 93% cDNA |
| Primer, (probe), Mg++ and dNTP concentrations | E | ✓ | Solis BioDyne FIREScript RT cDNA synthesis kit (#06-15-00050). |
| Polymerase identity and concentration | E | ✓ | Solis BioDyne FIREScript RT cDNA synthesis kit (#06-15-00050). |
| Buffer/kit identity and manufacturer | E | ✓ | Solis BioDyne FIREScript RT cDNA synthesis kit (#06-15-00050). |
| Exact chemical constitution of the buffer | D | ✓ | Solis BioDyne FIREScript RT cDNA synthesis kit (#06-15-00050). |
| Additives (SYBR Green I, DMSO, etc.) | E | ✓ | Solis BioDyne FIREScript RT cDNA synthesis kit (#06-15-00050). |
| Manufacturer of plates/tubes and catalog number | D | ✓ | Applied Biosystems Catalogue # 4346907 |
| Complete thermocycling parameters | E | ✓ | Amplification parameters were: 95 °C (12 min) hot start + [ 95 °C (15 s) denaturation + 60 °C (30 s) annealing] × 40 cycles. Melt curves with 5-second intervals between 65–95 °C followed all PCR experiments, and only those primer pairs that showed a single amplicon PCR product were used for this study. |
| Reaction setup (manual/robotic) | D | ✓ | Manual |
| Manufacturer of qPCR instrument | E | ✓ | Bio-Rad CFX96 |
| qPCR Validation | |||
| Evidence of optimisation (from gradients) | D | ||
| Specificity (gel, sequence, melt, or digest) | E | ✓ | Single Melting Peak |
| For SYBR Green I, Cq of the NTC | E | ✓ | All NRT and NTC reactions for this study were ≤ 8% based on the following formula: RT+ fluorescence = 100% − [2(−(Cq NRT or NTC)/(−2^(−Cq RT+)) × 100] [37]. |
| Standard curves with slope and y-intercept | E | ✓ | See Table 1 and Figure A1. |
| PCR efficiency calculated from slope | E | ✓ | See Table 1. |
| Confidence interval for PCR efficiency or standard error | D | ||
| r2 of standard curve | E | ✓ | See Table 1. |
| Linear dynamic range | E | ✓ | See Table 1. |
| Cq variation at lower limit | E | ✓ | See Table 1. |
| Confidence intervals throughout range | D | ||
| Evidence for limit of detection | E | ✓ | See Table 1. |
| If multiplex, efficiency and LOD of each assay. | E | ✓ | Not Multiplex |
| Data Analysis | |||
| qPCR analysis program (source, version) | E | ✓ | BioRad Manager 3.1 software (updated 06/06/2021) |
| Cq method determination | E | ✓ | The values of Cqs were measured using the regression determination method of BioRad Manager 3.1 software (updated 06/06/2021). |
| Outlier identification and disposition | E | ✓ | Outliars included |
| Results of NTCs | E | ✓ | All NRT and NTC reactions for this study were ≤ 8% based on the following formula: RT+ fluorescence = 100% − [2(−(Cq NRT or NTC)/(−2^(−Cq RT+)) × 100] [37]. |
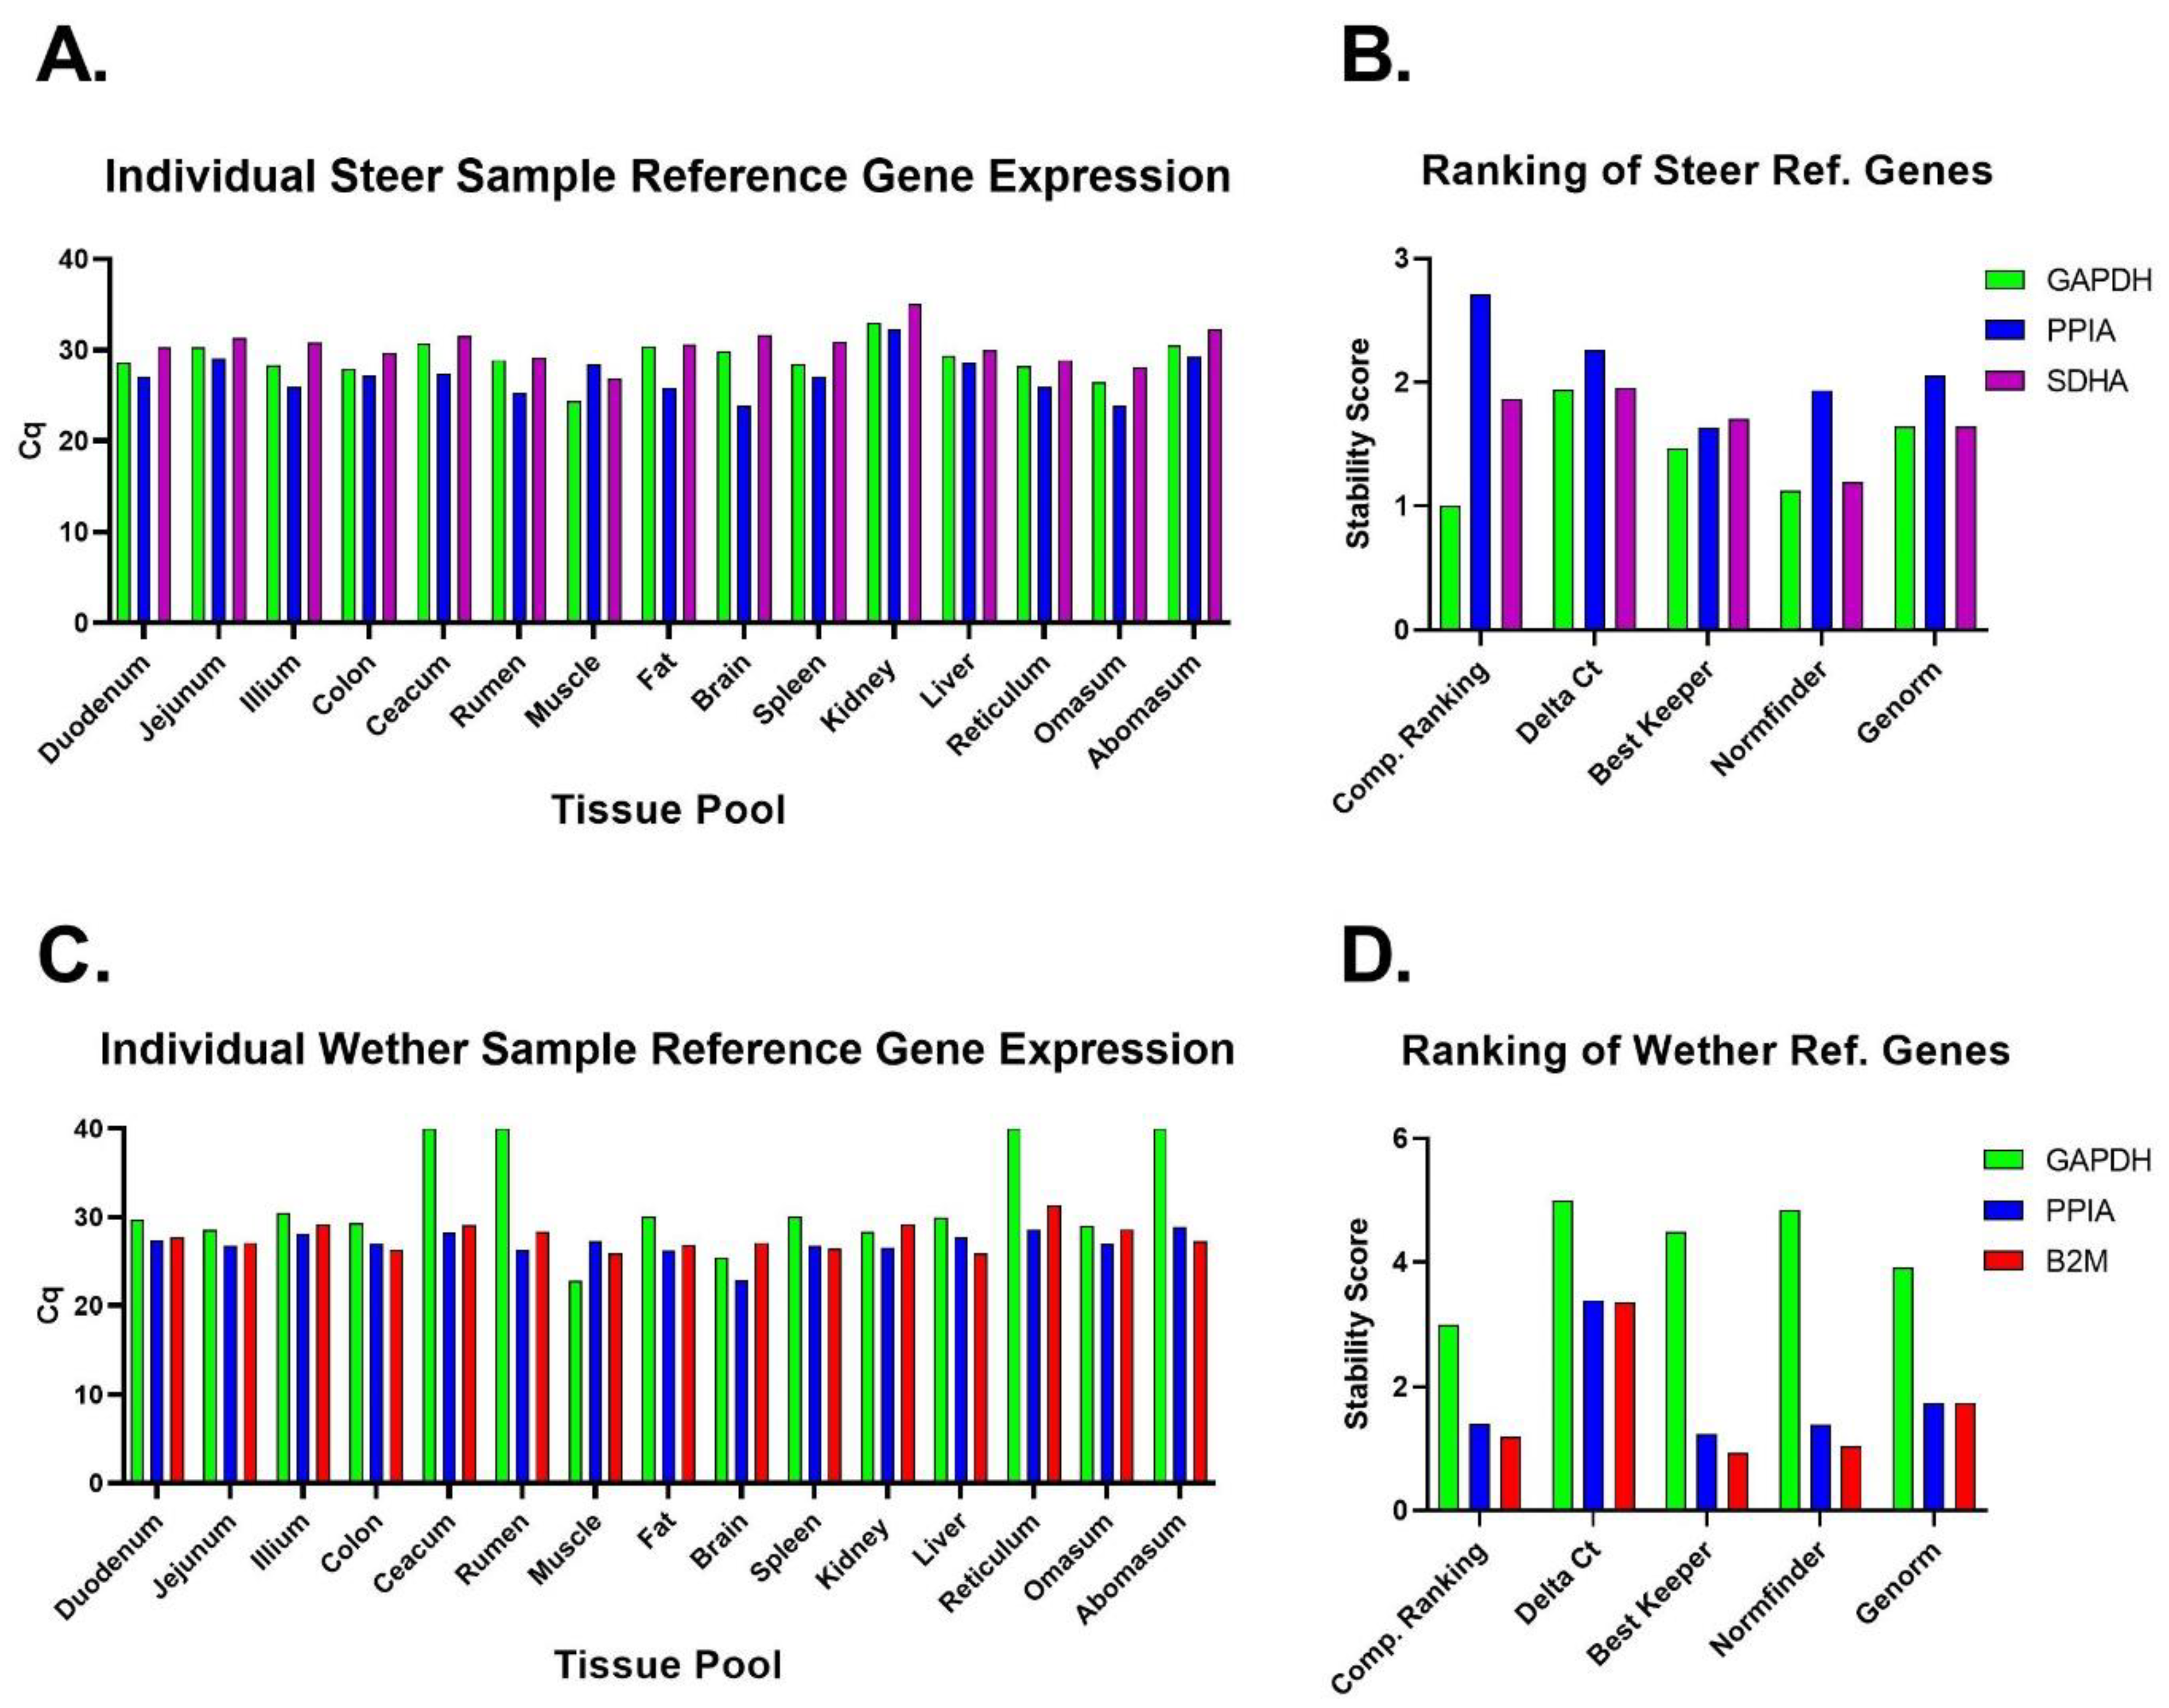
| Justification of number and choice of reference genes | E | ✓ | Three reference genes were assessed due to a recommended number [38], but only the two most stable reference genes were used to calculate relative expression (Figure 2 and Figure 3). |
| Description of normalization method | E | ✓ | Relative quantification for mRNA expression levels [37] |
| Number and concordance of biological replicates | D | ✓ | Pooled cDNA (biological replicates 3–4). Figure 1. |
| Number and stage (RT or qPCR) of technical replicates | E | ✓ | Two technical replicates of tissue samples were performed from pooled cDNA |
| Repeatability (intra-assay variation) | E | ✓ | All but 3 technical replicates out of 210 conducted were within 0.5 Cqs. |
| Reproducibility (inter-assay variation, %CV) | D | ✓ | The percent coefficient of variation [(standard deviation/mean) × 100] of intraassay controls was below 1.3% (Figure A3). |
| Power analysis | D | ||
| Statistical methods for result significance | E | ✓ | Data were analyzed by a Two-Way ANOVA with either a Sidak or Tukey multiple comparison test. Adjusted p-values ≤ 0.05 were considered statistically significant. |
| Software (source, version) | E | ✓ | All analyses were conducted using GraphPad Prism version 9.3.1 for Mac OS (GraphPad Software, San Diego, CA, USA). |
| Cq or raw data submission using RDML | D |
| Tissue | Species | IQ | 260/280 | Total RNA Extracted (μg) | |||
|---|---|---|---|---|---|---|---|
| Mean | SD | Mean | SD | Mean | SD | ||
| Brain | Steers | 8.3 | 0.4 | 2.16 | 0.01 | 36 | 12 |
| Wethers | 7.1 | 0.7 | 2.14 | 0.02 | 45 | 8 | |
| Duodenum | Steers | 8.8 | 1.4 | 2.04 | 0.02 | 30 | 9 |
| Wethers | 9.2 | 0.1 | 2.07 | 0.01 | 32 | 6 | |
| Jejunum | Steers | 9.2 | 0.3 | 2.04 | 0.02 | 37 | 6 |
| Wethers | 8.9 | 0.6 | 2.06 | 0.01 | 57 | 20 | |
| Ilium | Steers | 9.2 | 0.5 | 2.11 | 0.10 | 83 | 9 |
| Wethers | 9.3 | 0.6 | 2.07 | 0.07 | 80 | 4 | |
| Cecum | Steers | 7.2 | 0.3 | 2.01 | 0.03 | 68 | 8 |
| Wethers | 6.9 | 0.3 | 2.01 | 0.01 | 57 | 21 | |
| Colon | Steers | 9.1 | 0.9 | 2.09 | 0.02 | 42 | 31 |
| Wethers | 9.6 | 0.8 | 2.07 | 0.02 | 32 | 19 | |
| Rumen | Steers | 8.6 | 1.0 | 2.10 | 0.02 | 35 | 16 |
| Wethers | 8.5 | 1.2 | 2.10 | 0.04 | 40 | 13 | |
| Reticulum | Steers | 9.4 | 0.5 | 2.17 | 0.03 | 23 | 6 |
| Wethers | 9.4 | 0.1 | 2.20 | 0.06 | 23 | 9 | |
| Omasum | Steers | 9.5 | 0.9 | 2.07 | 0.01 | 39 | 4 |
| Wethers | 9.9 | 0.2 | 2.08 | 0.01 | 30 | 5 | |
| Abomasum | Steers | 9.6 | 0.3 | 2.14 | 0.01 | 68 | 7 |
| Wethers | 9.3 | 0.3 | 2.16 | 0.08 | 78 | 14 | |
| Muscle | Steers | 8.7 | 0.9 | 2.10 | 0.01 | 11 | 1 |
| Wethers | 8.5 | 1.1 | 2.10 | 0.01 | 7 | 2 | |
| Fat | Steers | 7.5 | 0.6 | 1.95 | 0.08 | 5 | 4 |
| Wethers | 8.1 | 0.5 | 1.96 | 0.08 | 7 | 3 | |
| Liver | Steers | 9.1 | 0.5 | 2.10 | 0.01 | 33 | 22 |
| Wethers | 8.0 | 0.4 | 2.15 | 0.01 | 25 | 9 | |
| Spleen | Steers | 8.6 | 1.1 | 2.06 | 0.00 | 19 | 5 |
| Wethers | 9.2 | 0.6 | 2.05 | 0.01 | 16 | 5 | |
| Kidney | Steers | 9.8 | 0.4 | 2.08 | 0.02 | 49 | 12 |
| Wethers | 8.9 | 0.1 | 2.08 | 0.03 | 45 | 2 | |
References
- Drouillard, J.S. Current situation and future trends for beef production in the United States of America—A review. Asian-Australas. J. Anim. Sci. 2018, 31, 1007–1016. [Google Scholar] [CrossRef] [PubMed] [Green Version]
- Milani, F.X.; Wendorff, L.W. Goat and sheep milk products in the United States (USA). Small Rumin. Res. 2011, 101, 134–139. [Google Scholar] [CrossRef]
- Wu, Z.; Weersink, A.; Maynard, A. Fuel-feed-livestock price linkages under structural changes. Appl. Econ. 2021, 54, 206–223. [Google Scholar] [CrossRef]
- Moss, A.R.; Jouany, J.-P.; Newbold, J. Methane production by ruminants: Its contribution to global warming. Ann. Zootech. 2000, 49, 231–253. [Google Scholar] [CrossRef] [Green Version]
- Hejazi, S.; Fluharty, F.L.; Perley, J.E.; Loerch, S.C.; Lowe, G.D. Effects of corn processing and dietary fiber source on feedlot performance, visceral organ weight, diet digestibility, and nitrogen metabolism in lambs. J. Anim. Sci. 1999, 77, 507–515. [Google Scholar] [CrossRef] [PubMed]
- Matthews, C.C.; Crispie, F.; Lewis, E.; Reid, M.; O’Toole, P.W.; Cotter, P.D. The rumen microbiome: A crucial consideration when optimising milk and meat production and nitrogen utilisation efficiency. Gut Microbes 2019, 10, 115–132. [Google Scholar] [CrossRef]
- Zhang, R.; Zhu, W.; Mao, S. High-concentrate feeding upregulates the expression of inflammation-related genes in the ruminal epithelium of dairy cattle. J. Anim. Sci. Biotechnol. 2016, 7, 42. [Google Scholar] [CrossRef] [PubMed] [Green Version]
- Colwell, C.S.; Michel, S.; Itri, J.; Rodriguez, W.; Tam, J.; Lelievre, V.; Hu, Z.; Liu, X.; Wascheck, J.A. Disrupted circadian rhythms in VIP- and PHI-deficient mice. Am. J. Physiol. Regul. Integr. Comp. Physiol. 2003, 285, R939–R949. [Google Scholar] [CrossRef]
- Filatov, E.; Short, L.I.; Forster, M.A.M.; Harris, S.S.; Schien, E.N.; Hughes, M.C.; Cline, D.L.; Appleby, C.J.; Gray, S.L. Contribution of thermogenic mechanisms by male and female mice lacking pituitary adenylate cyclase-activating polypeptide in response to cold acclimation. Am. J. Physiol. Endocrinol. Metab. 2021, 320, E475–E487. [Google Scholar] [CrossRef]
- Langer, I.; Latek, D. Drug Repositioning For Allosteric Modulation of VIP and PACAP Receptors. Front. Endocrinol. 2021, 12, 711906. [Google Scholar] [CrossRef]
- Martin, B.; Shin, Y.K.; White, C.M.; Ji, S.; Kim, W.; Carlson, O.D.; Napora, J.K.; Chadwick, W.; Chapter, M.; Waschek, J.A.; et al. Vasoactive intestinal peptide-null mice demonstrate enhanced sweet taste preference, dysglycemia, and reduced taste bud leptin receptor expression. Diabetes 2010, 59, 1143–1152. [Google Scholar] [CrossRef] [Green Version]
- Yi, C.X.; Sun, N.; Ackermans, M.T.; Alkemade, A.; Foppen, E.; Shi, J.; Serlie, M.J.; Buijs, R.M.; Fliers, E.; Kalsbeek, A. Pituitary adenylate cyclase-activating polypeptide stimulates glucose production via the hepatic sympathetic innervation in rats. Diabetes 2010, 59, 1591–1600. [Google Scholar] [CrossRef] [PubMed] [Green Version]
- Vaudry, D.; Falluel-Morel, A.; Bourgault, S.; Basille, M.; Burel, D.; Wurtz, O.; Fournier, A.; Chow, B.K.C.; Hashimoto, H.; Galas, L.; et al. Pituitary adenylate cyclase-activating polypeptide and its receptors: 20 years after the discovery. Pharm. Rev. 2009, 61, 283–357. [Google Scholar] [CrossRef] [PubMed]
- Harmar, A.J.; Fahrenkrug, J.; Gozes, I.; Laburthe, M.; May, V.; Pisegna, J.R.; Vaudry, D.; Vaudry, H.; A Waschek, J.; Said, S. Pharmacology and functions of receptors for vasoactive intestinal peptide and pituitary adenylate cyclase-activating polypeptide: IUPHAR review 1. Br. J. Pharmacol. 2012, 166, 4–17. [Google Scholar] [CrossRef] [PubMed] [Green Version]
- Sherwood, N.M.; Krueckl, S.L.; McRory, J.E. The origin and function of the pituitary adenylate cyclase-activating polypeptide (PACAP)/glucagon superfamily. Endocr. Rev. 2000, 21, 619–670. [Google Scholar]
- Dorsam, G.P.; Benton, K.; Failing, J.; Batra, S. Vasoactive intestinal peptide signaling axis in human leukemia. World J. Biol. Chem. 2011, 2, 146–160. [Google Scholar] [CrossRef]
- Hakanson, R.; Chen, D.; Lindstrom, E.; Bernsand, M.; Norlen, P. Control of secretion from rat stomach ECL cells in situ and in primary culture. Scand. J. Clin. Lab. Investig. Suppl. 2001, 234, 53–60. [Google Scholar] [CrossRef]
- Lelievre, V.; Favrais, G.; Abad, C.; Adle-Biassette, H.; Lu, Y.; Germano, P.M.; Cheung-Lau, G.; Pisegna, J.; Gressens, P.; Lawson, G.; et al. Gastrointestinal dysfunction in mice with a targeted mutation in the gene encoding vasoactive intestinal polypeptide: A model for the study of intestinal ileus and Hirschsprung’s disease. Peptides 2007, 28, 1688–1699. [Google Scholar] [CrossRef] [PubMed] [Green Version]
- Lazar, Z.; Shahbazian, A.; Benko, R.; Toth, G.; Penke, B.; Bartho, L.; Holzer, P. PACAP-(6-38) inhibits the effects of vasoactive intestinal polypeptide, but not PACAP, on the small intestinal circular muscle. Eur. J. Pharmacol. 2001, 431, 259–264. [Google Scholar] [CrossRef]
- Carlsson, P.O.; Ostenson, C.G.; Efendic, S.; Langel, U.; Jansson, L. Pituitary adenylate cyclase activating polypeptide (PACAP) redistributes the blood within the pancreas of anesthetized rats. Regul. Pept. 1996, 63, 123–128. [Google Scholar] [CrossRef]
- Lauff, J.M.; Modlin, I.M.; Tang, L.H. Biological relevance of pituitary adenylate cyclase-activating polypeptide (PACAP) in the gastrointestinal tract. Regul. Pept. 1999, 84, 1–12. [Google Scholar] [CrossRef]
- Iwasaki, M.; Akiba, Y.; Kaunitz, J.D. Recent advances in vasoactive intestinal peptide physiology and pathophysiology: Focus on the gastrointestinal system. F1000Research 2019, 8, 1629. [Google Scholar] [CrossRef] [PubMed] [Green Version]
- Karpiesiuk, A.; Palus, K. Pituitary Adenylate Cyclase-Activating Polypeptide (PACAP) in Physiological and Pathological Processes within the Gastrointestinal Tract: A Review. Int. J. Mol. Sci. 2021, 22, 8682. [Google Scholar] [CrossRef] [PubMed]
- Azuma, Y.T.; Hagi, K.; Shintani, N.; Kuwamura, M.; Nakajima, H.; Hashimoto, H.; Baba, A.; Takeuchi, T. PACAP provides colonic protection against dextran sodium sulfate induced colitis. J. Cell. Physiol. 2008, 216, 111–119. [Google Scholar] [CrossRef] [PubMed]
- Padua, D.; Vu, J.P.; Germano, P.M.; Pisegna, J.R. The Role of Neuropeptides in Mouse Models of Colitis. J. Mol. Neurosci. 2016, 59, 203–210. [Google Scholar] [CrossRef] [Green Version]
- Heimesaat, M.M.; Dunay, I.R.; Schulze, S.; Fischer, A.; Grundmann, U.; Alutis, M.; Kühl, A.A.; Tamas, A.; Toth, G.; Dunay, M.P.; et al. Pituitary adenylate cyclase-activating polypeptide ameliorates experimental acute ileitis and extra-intestinal sequelae. PLoS ONE 2014, 9, e108389. [Google Scholar] [CrossRef] [Green Version]
- Wu, X.; Conlin, V.S.; Morampudi, V.; Ryz, N.R.; Nasser, Y.; Bhinder, G.; Bergstrom, K.S.; Yu, H.B.; Waterhouse, C.C.M.; Buchan, A.M.J.; et al. Vasoactive intestinal polypeptide promotes intestinal barrier homeostasis and protection against colitis in mice. PLoS ONE 2015, 10, e0125225. [Google Scholar] [CrossRef]
- Tanaka, K.; Shibuya, I.; Kanno, T. Potentiation of cholecystokinin-induced amylase release by peptide VIP in guinea pig pancreatic acini. Jpn. J. Physiol. 1995, 45, 241–256. [Google Scholar] [CrossRef] [Green Version]
- Swanson, K.C.; Richards, C.J.; Harmon, D.L. Influence of abomasal infusion of glucose or partially hydrolyzed starch on pancreatic exocrine secretion in beef steers. J. Anim. Sci. 2002, 80, 1112–1116. [Google Scholar] [CrossRef]
- Swanson, K.C. Small Intestinal Anatomy, Physiology, and Digestion in Ruminants. In Reference Module in Food Science; Elsevier: Amsterdam, The Netherlands, 2019. [Google Scholar]
- Talbot, J.; Hahn, P.; Kroehling, L.; Nguyen, H.; Li, D.; Littman, D.R. Feeding-dependent VIP neuron-ILC3 circuit regulates the intestinal barrier. Nature 2020, 579, 575–580. [Google Scholar] [CrossRef]
- Nemetz, N.; Abad, C.; Lawson, G.; Nobuta, H.; Chhith, S.; Duong, L.; Tse, G.; Braun, J.; Waschek, J.A. Induction of colitis and rapid development of colorectal tumors in mice deficient in the neuropeptide PACAP. Int. J. Cancer 2008, 122, 1803–1809. [Google Scholar] [CrossRef] [PubMed]
- Heimesaat, M.M.; Reifenberger, G.; Vicena, V.; Illes, A.; Horvath, G.; Tamas, A.; Fulop, B.D.; Bereswill, S.; Reglodi, D. Intestinal Microbiota Changes in Mice Lacking Pituitary Adenylate Cyclase Activating Polypeptide (PACAP)—Bifidobacteria Make the Difference. Eur. J. Microbiol. Immunol. 2017, 7, 187–199. [Google Scholar] [CrossRef] [Green Version]
- Bains, M.; Laney, C.; Wolfe, A.E.; Orr, M.; Waschek, J.A.; Ericsson, A.C.; Dorsam, G.P. Vasoactive Intestinal Peptide Deficiency Is Associated With Altered Gut Microbiota Communities in Male and Female C57BL/6 Mice. Front. Microbiol. 2019, 10, 2689. [Google Scholar] [CrossRef] [Green Version]
- Ericsson, A.C.; Bains, M.; McAdams, Z.; Daniels, J.; Busi, S.B.; Waschek, J.A.; Dorsam, G.P. The G Protein-Coupled Receptor, VPAC1, Mediates Vasoactive Intestinal Peptide-Dependent Functional Homeostasis of the Gut Microbiota. Gastro. Hep. Adv. 2022, 1, 253–264. [Google Scholar] [CrossRef]
- Bustin, S.A.; Benes, V.; Garson, J.A.; Hellemans, J.; Huggett, J.; Kubista, M.; Mueller, R.; Nolan, T.; Pfaffl, M.W.; Shipley, G.L.; et al. The MIQE guidelines: Minimum information for publication of quantitative real-time PCR experiments. Clin. Chem. 2009, 55, 611–622. [Google Scholar] [CrossRef] [Green Version]
- Ye, J.; Coulouris, G.; Zaretskaya, I.; Cutcutache, I.; Rozen, S.; Madden, T.L. Primer-BLAST: A tool to design target-specific primers for polymerase chain reaction. BMC Bioinform. 2012, 13, 134. [Google Scholar] [CrossRef] [Green Version]
- Livak, K.J.; Schmittgen, T.D. Analysis of relative gene expression data using real-time quantitative PCR and the 2(-Delta Delta C(T)) Method. Methods 2001, 25, 402–408. [Google Scholar] [CrossRef] [PubMed]
- Andersen, C.L.; Jensen, J.L.; Orntoft, T.F. Normalization of real-time quantitative reverse transcription-PCR data: A model-based variance estimation approach to identify genes suited for normalization, applied to bladder and colon cancer data sets. Cancer Res. 2004, 64, 5245–5250. [Google Scholar] [CrossRef] [Green Version]
- Denes, V.; Geck, P.; Mester, A.; Gabriel, R. Pituitary Adenylate Cyclase-Activating Polypeptide: 30 Years in Research Spotlight and 600 Million Years in Service. J. Clin. Med. 2019, 8, 1488. [Google Scholar] [CrossRef] [PubMed] [Green Version]
- Wei, P.; Keller, C.; Li, L. Neuropeptides in gut-brain axis and their influence on host immunity and stress. Comput. Struct. Biotechnol. J. 2020, 18, 843–851. [Google Scholar] [CrossRef] [PubMed]
- Abad, C.; Tan, Y.V. Immunomodulatory Roles of PACAP and VIP: Lessons from Knockout Mice. J. Mol. Neurosci. 2018, 66, 102–113. [Google Scholar] [CrossRef] [PubMed]
- Yue, F.; Cheng, Y.; Breschi, A.; Vierstra, J.; Wu, W.; Ryba, T.; Sandstrom, R.; Samantha, K.; Davis, C.; Pope, B.D.; et al. A comparative encyclopedia of DNA elements in the mouse genome. Nature 2014, 515, 355–364. [Google Scholar] [CrossRef] [PubMed] [Green Version]
- Vomhof-DeKrey, E.E.; Hermann, R.J.; Palmer, M.F.; Benton, K.D.; Sandy, A.R.; Dorsam, S.T.; Dorsam, G.P. TCR signaling and environment affect vasoactive intestinal peptide receptor-1 (VPAC-1) expression in primary mouse CD4 T cells. Brain Behav. Immun. 2008, 22, 1032–1040. [Google Scholar] [CrossRef] [PubMed] [Green Version]
- Fagerberg, L.; Hallstrom, B.M.; Oksvold, P.; Kampf, C.; Djureinovic, D.; Odeberg, J.; Habuka, M.; Tahmasebpoor, S.; Danielsson, A.; Edlund, K.; et al. Analysis of the human tissue-specific expression by genome-wide integration of transcriptomics and antibody-based proteomics. Mol. Cell. Proteom. 2014, 13, 397–406. [Google Scholar] [CrossRef] [Green Version]
- Girard-Madoux, M.J.H.; Gomez de Aguero, M.; Ganal-Vonarburg, S.C.; Mooser, C.; Belz, G.T.; Macpherson, A.J.; Vivier, E. The immunological functions of the Appendix: An example of redundancy? Semin. Immunol. 2018, 36, 31–44. [Google Scholar] [CrossRef]
- Ganea, D.; Hooper, K.M.; Kong, W. The neuropeptide vasoactive intestinal peptide: Direct effects on immune cells and involvement in inflammatory and autoimmune diseases. Acta Physiol. 2015, 213, 442–452. [Google Scholar] [CrossRef] [Green Version]
- Karacay, B.; O’Dorisio, M.S.; Kasow, K.; Hollenback, C.; Krahe, R. Expression and fine mapping of murine vasoactive intestinal peptide receptor 1. J. Mol. Neurosci. 2001, 17, 311–324. [Google Scholar] [CrossRef]
- Lijnen, H.R.; Freson, K.; Hoylaerts, M.F. Effect of VPAC1 Blockade on Adipose Tissue Formation and Composition in Mouse Models of Nutritionally Induced Obesity. J. Obes. 2010, 2010, 359527. [Google Scholar] [CrossRef] [Green Version]
- Jayawardena, D.; Guzman, G.; Gill, R.K.; Alrefai, W.A.; Onyuksel, H.; Dudeja, P.K. Expression and localization of VPAC1, the major receptor of vasoactive intestinal peptide along the length of the intestine. Am. J. Physiol. Gastrointest. Liver Physiol. 2017, 313, G16–G25. [Google Scholar] [CrossRef] [Green Version]
- Fung, C.; Unterweger, P.; Parry, L.J.; Bornstein, J.C.; Foong, J.P. VPAC1 receptors regulate intestinal secretion and muscle contractility by activating cholinergic neurons in guinea pig jejunum. Am. J. Physiol. Gastrointest. Liver Physiol. 2014, 306, G748–G758. [Google Scholar] [CrossRef]
- Jiang, Y.; Xie, M.; Chen, W.; Talbot, R.; Maddox, J.F.; Faraut, T.; Wu, C.; Muzny, D.M.; Li, Y.; Zhang, W.; et al. The sheep genome illuminates biology of the rumen and lipid metabolism. Science 2014, 344, 1168–1173. [Google Scholar] [CrossRef]
- Delgado, M.; Pozo, D.; Ganea, D. The significance of vasoactive intestinal peptide in immunomodulation. Pharmacol. Rev. 2004, 56, 249–290. [Google Scholar] [CrossRef] [PubMed]
- Voice, J.K.; Dorsam, G.; Lee, H.; Kong, Y.; Goetzl, E.J. Allergic diathesis in transgenic mice with constitutive T cell expression of inducible vasoactive intestinal peptide receptor. FASEB J. 2001, 15, 2489–2496. [Google Scholar] [CrossRef] [PubMed] [Green Version]
- Pisegna, J.R.; Wank, S.A. Cloning and characterization of the signal transduction of four splice variants of the human pituitary adenylate cyclase activating polypeptide receptor. Evidence for dual coupling to adenylate cyclase and phospholipase C. J. Biol. Chem. 1996, 271, 17267–17274. [Google Scholar] [CrossRef] [Green Version]
- Ushiyama, M.; Ikeda, R.; Yoshida, M.; Mori, K.; Kangawa, K.; Sugawara, H.; Inoue, K.; Yamada, K.; Miyata, A. Alternative splicing of the pituitary adenylate cyclase-activating polypetide (PACAP) receptor contributes to function of PACAP-27. J. Mol. Neurosci. 2010, 42, 341–348. [Google Scholar] [CrossRef] [PubMed]
| Gene | Species | Primer Pair Sequence (5′ > 3′) | Target Sequence Accession # | Product Length (bps) | Efficiency | Slope | R2 | Product MT °C | Exon–Exon Boundary (nt) |
|---|---|---|---|---|---|---|---|---|---|
| VIP | B | F: CCACTCAGATGCTGTCTTCACT R: TTCACTGCTTCGCTTTCCATTTAG | NM_173970.3 | 103 | 94.1% | −3.47 | 0.99 | 80.0 | 5–6 (642/643) |
| VIP | O | F: CACTGACAACTACACACGCC R: GACTCTCCTTCGCTGCTTCTC | NM_001126368.1 | 93 | 105.6% | −3.1 | 0.99 | 79.0 | 4–5 (467/468) |
| PACAP | B | F: TGTACGACGAGGACGGAAAC R: GTGGGCGACATCTCTTTCCT | NM_001046555.1 | 131 | 107.4% | −3.12 | 0.99 | 90.5 | 2–3 (242/243) |
| O | NM_001009776.1 | 131 | 108.6% | −3.13 | 0.99 | 90.5 | N/A | ||
| VPAC1 | B | F: ATCCTTGCCTCCATCTTGGTG R: GCTGTCACTCTTCCCGACAT | NM_001081607.1 | 99 | 103.1% | −3.25 | 0.99 | 81.5 | 9–10 (1029/1030) |
| O | XM_042235879.1 | 99 | 107.5% | −3.15 | 0.96 | 81.5 | N/A | ||
| VPAC2 | B | F: CATCCGCATCTCCTCCAAGTA R: TCTGCACCTCGCTGTTGA | NM_001206781.1 | 107 | 90.9% | −3.56 | 0.99 | 84.5 | 12–13 (1287/1288) |
| PAC1 | B | F: ATCATCATTGGCTGGGGGAC R: ATGATGCCGATGAAGAGCACA | NM_175715.2 | 176 | 101.4% | −3.29 | 0.99 | 85.5 | 10–11 (1371/1372) |
| O | XM_027968637.2 | 176 | 104.3% | −3.22 | 0.99 | 85.5 | N/A | ||
| GAPDH | B | F: TCGGAGTGAACGGATTCGGC R: TGATGACGAGCTTCCCGTTC | NM_001034034.2 | 192 | 98.5% | −3.36 | 0.99 | 80.5 | 2–3 (94/95) |
| O | NM_001190390.1 | 192 | 106.4% | −3.18 | 0.99 | 80.5 | 2–3 (62/63) | ||
| PPIA | B | F: GCCAAGACTGAGTGGTTGGAT R: TTGCTGGTCTTGCCATTCCT | NM_178320.2 | 113 | 100.6% | −3.31 | 1.00 | 84.5 | 4–5 (373/374) |
| O | NM_001308578.1 | 113 | 100.3% | −3.31 | 0.99 | 84.5 | 4–5 (363/364) | ||
| SDHA | B | F: TCCTGCAGACCCGGAGATAA R: TCTGCATGTTGAGTCGCAGT | NM_174178.2 | 130 | 91.2% | −3.55 | 0.99 | 81.0 | 10–11 (1446/1447) |
| B2M | O | F: CTGCTGCAAGGATGGCTGTCT R: GGACCTCTGGAATACGCTGGAT | NM_001009284.2 | 93 | 96.9% | −3.39 | 0.99 | 87.5 | 1–2 (79/80) |
| Wether | Steer | Wether | Steer | Wether | Steer | Wether | Steer | Wether | Steer | |
|---|---|---|---|---|---|---|---|---|---|---|
| Brain | ++ | + | + | −/+ | ++ | + | ND | ND | ++ | ++ |
| Rumen | ND | ND | ND | ND | ND | ND | ND | ND | ND | −/+ |
| Duodenum | ND | ND | ND | ND | + | + | ND | ND | ND | ND |
| Jejunum | ND | ND | ND | ND | −/+ | ++ | ND | ND | ND | ND |
| Ilium | ND | ND | ND | ND | + | ++ | ND | ND | ND | ND |
| Cecum | ++ | ++ | ND | ND | + | ++ | ND | ND | ND | ND |
| Colon | −/+ | −/+ | −/+ | −/+ | ++ | ++ | ND | ND | −/+ | + |
| Liver | ND | ND | ND | ND | ++ | ++ | ND | ND | ND | ND |
| Muscle | ND | ND | ND | ND | + | −/+ | ND | ND | −/+ | ND |
| Spleen | ND | ND | ND | ND | + | ND | ND | + | ND | + |
| Omasum | ND | ND | ND | ND | ND | ND | ND | −/+ | ND | −/+ |
| Fat | ND | ND | ND | ND | + | ND | ND | ND | ND | + |
| Kidney | ND | ND | ND | ND | ND | ND | ND | ND | ND | ND |
| Reticulum | ND | ND | ND | ND | ND | ND | ND | ND | ND | ND |
| Abomasum | ND | ND | ND | ND | ND | ND | ND | ND | ND | ND |
| Peptide | AA Sequence or REF # | % Identity to Homo sapiens |
|---|---|---|
| VIP | ||
| Homo sapiens | HSDAVFTDNYTRLRKQMAVKKYLNSILN | 100% |
| Mus musculus | HSDAVFTDNYTRLRKQMAVKKYLNSILN | 100% |
| Bos taurus | HSDAVFTDNYTRLRKQMAVKKYLNSILN | 100% |
| Ovis aries | HSDAVFTDNYTRLRKQMAVKKYLNSILN | 100% |
| PACAP-38 | ||
| Homo sapiens | HSDGIFTDSYSRYRKQMAVKKYLAAVLGKRYKQRVKNK | 100% |
| Mus musculus | HSDGIFTDSYSRYRKQMAVKKYLAAVLGKRYKQRVKNK | 100% |
| Bos taurus | HSDGIFTDSYSRYRKQMAVKKYLAAVLGKRYKQRVKNK | 100% |
| Ovis aries | HSDGIFTDSYSRYRKQMAVKKYLAAVLGKRYKQRVKNK | 100% |
| VPAC1 | ||
| Homo sapiens | sp|P32241|31-457 | 100% |
| Mus musculus | sp|P97751|31-459 | 84.3% |
| Bos taurus | tr|F1MF07|31-457 | 89.9% |
| Ovis aries | tr|W5NZL6|31-492 | 78.9% |
| VPAC2 | ||
| Homo sapiens | sp|P41587|24-438 | 100% |
| Mus musculus | sp|P41588|23-437 | 87.7% |
| Bos taurus | tr|F1MIT6|25-442 | 86.3% |
| Ovis aries | * tr|W5PKZ4|20-96, 109-363, 369-424 | 79.8% |
| PAC1 | ||
| Homo sapiens | sp|P41586|21-468 | 100% |
| Mus musculus | sp|P70205|21-496 | 88.4% |
| Bos taurus | sp|Q29627|38-513 | 90.7% |
| Ovis aries | tr|W5PCC2|21-520 | 81.8% |
Publisher’s Note: MDPI stays neutral with regard to jurisdictional claims in published maps and institutional affiliations. |
© 2022 by the authors. Licensee MDPI, Basel, Switzerland. This article is an open access article distributed under the terms and conditions of the Creative Commons Attribution (CC BY) license (https://creativecommons.org/licenses/by/4.0/).
Share and Cite
Hawley, E.; Mia, K.; Yusuf, M.; Swanson, K.C.; Doetkott, C.; Dorsam, G.P. Messenger RNA Gene Expression Screening of VIP and PACAP Neuropeptides and Their Endogenous Receptors in Ruminants. Biology 2022, 11, 1512. https://doi.org/10.3390/biology11101512
Hawley E, Mia K, Yusuf M, Swanson KC, Doetkott C, Dorsam GP. Messenger RNA Gene Expression Screening of VIP and PACAP Neuropeptides and Their Endogenous Receptors in Ruminants. Biology. 2022; 11(10):1512. https://doi.org/10.3390/biology11101512
Chicago/Turabian StyleHawley, Emma, Kafi Mia, Mustapha Yusuf, Kendall C. Swanson, Curt Doetkott, and Glenn P. Dorsam. 2022. "Messenger RNA Gene Expression Screening of VIP and PACAP Neuropeptides and Their Endogenous Receptors in Ruminants" Biology 11, no. 10: 1512. https://doi.org/10.3390/biology11101512