
An Effective Ensemble Machine Learning Approach to Classify Breast Cancer Based on Feature Selection and Lesion Segmentation Using Preprocessed Mammograms
 ,
,  , ,
, ,  and
and
Abstract
:Simple Summary
Abstract
1. Introduction
2. Research Aim and Scope
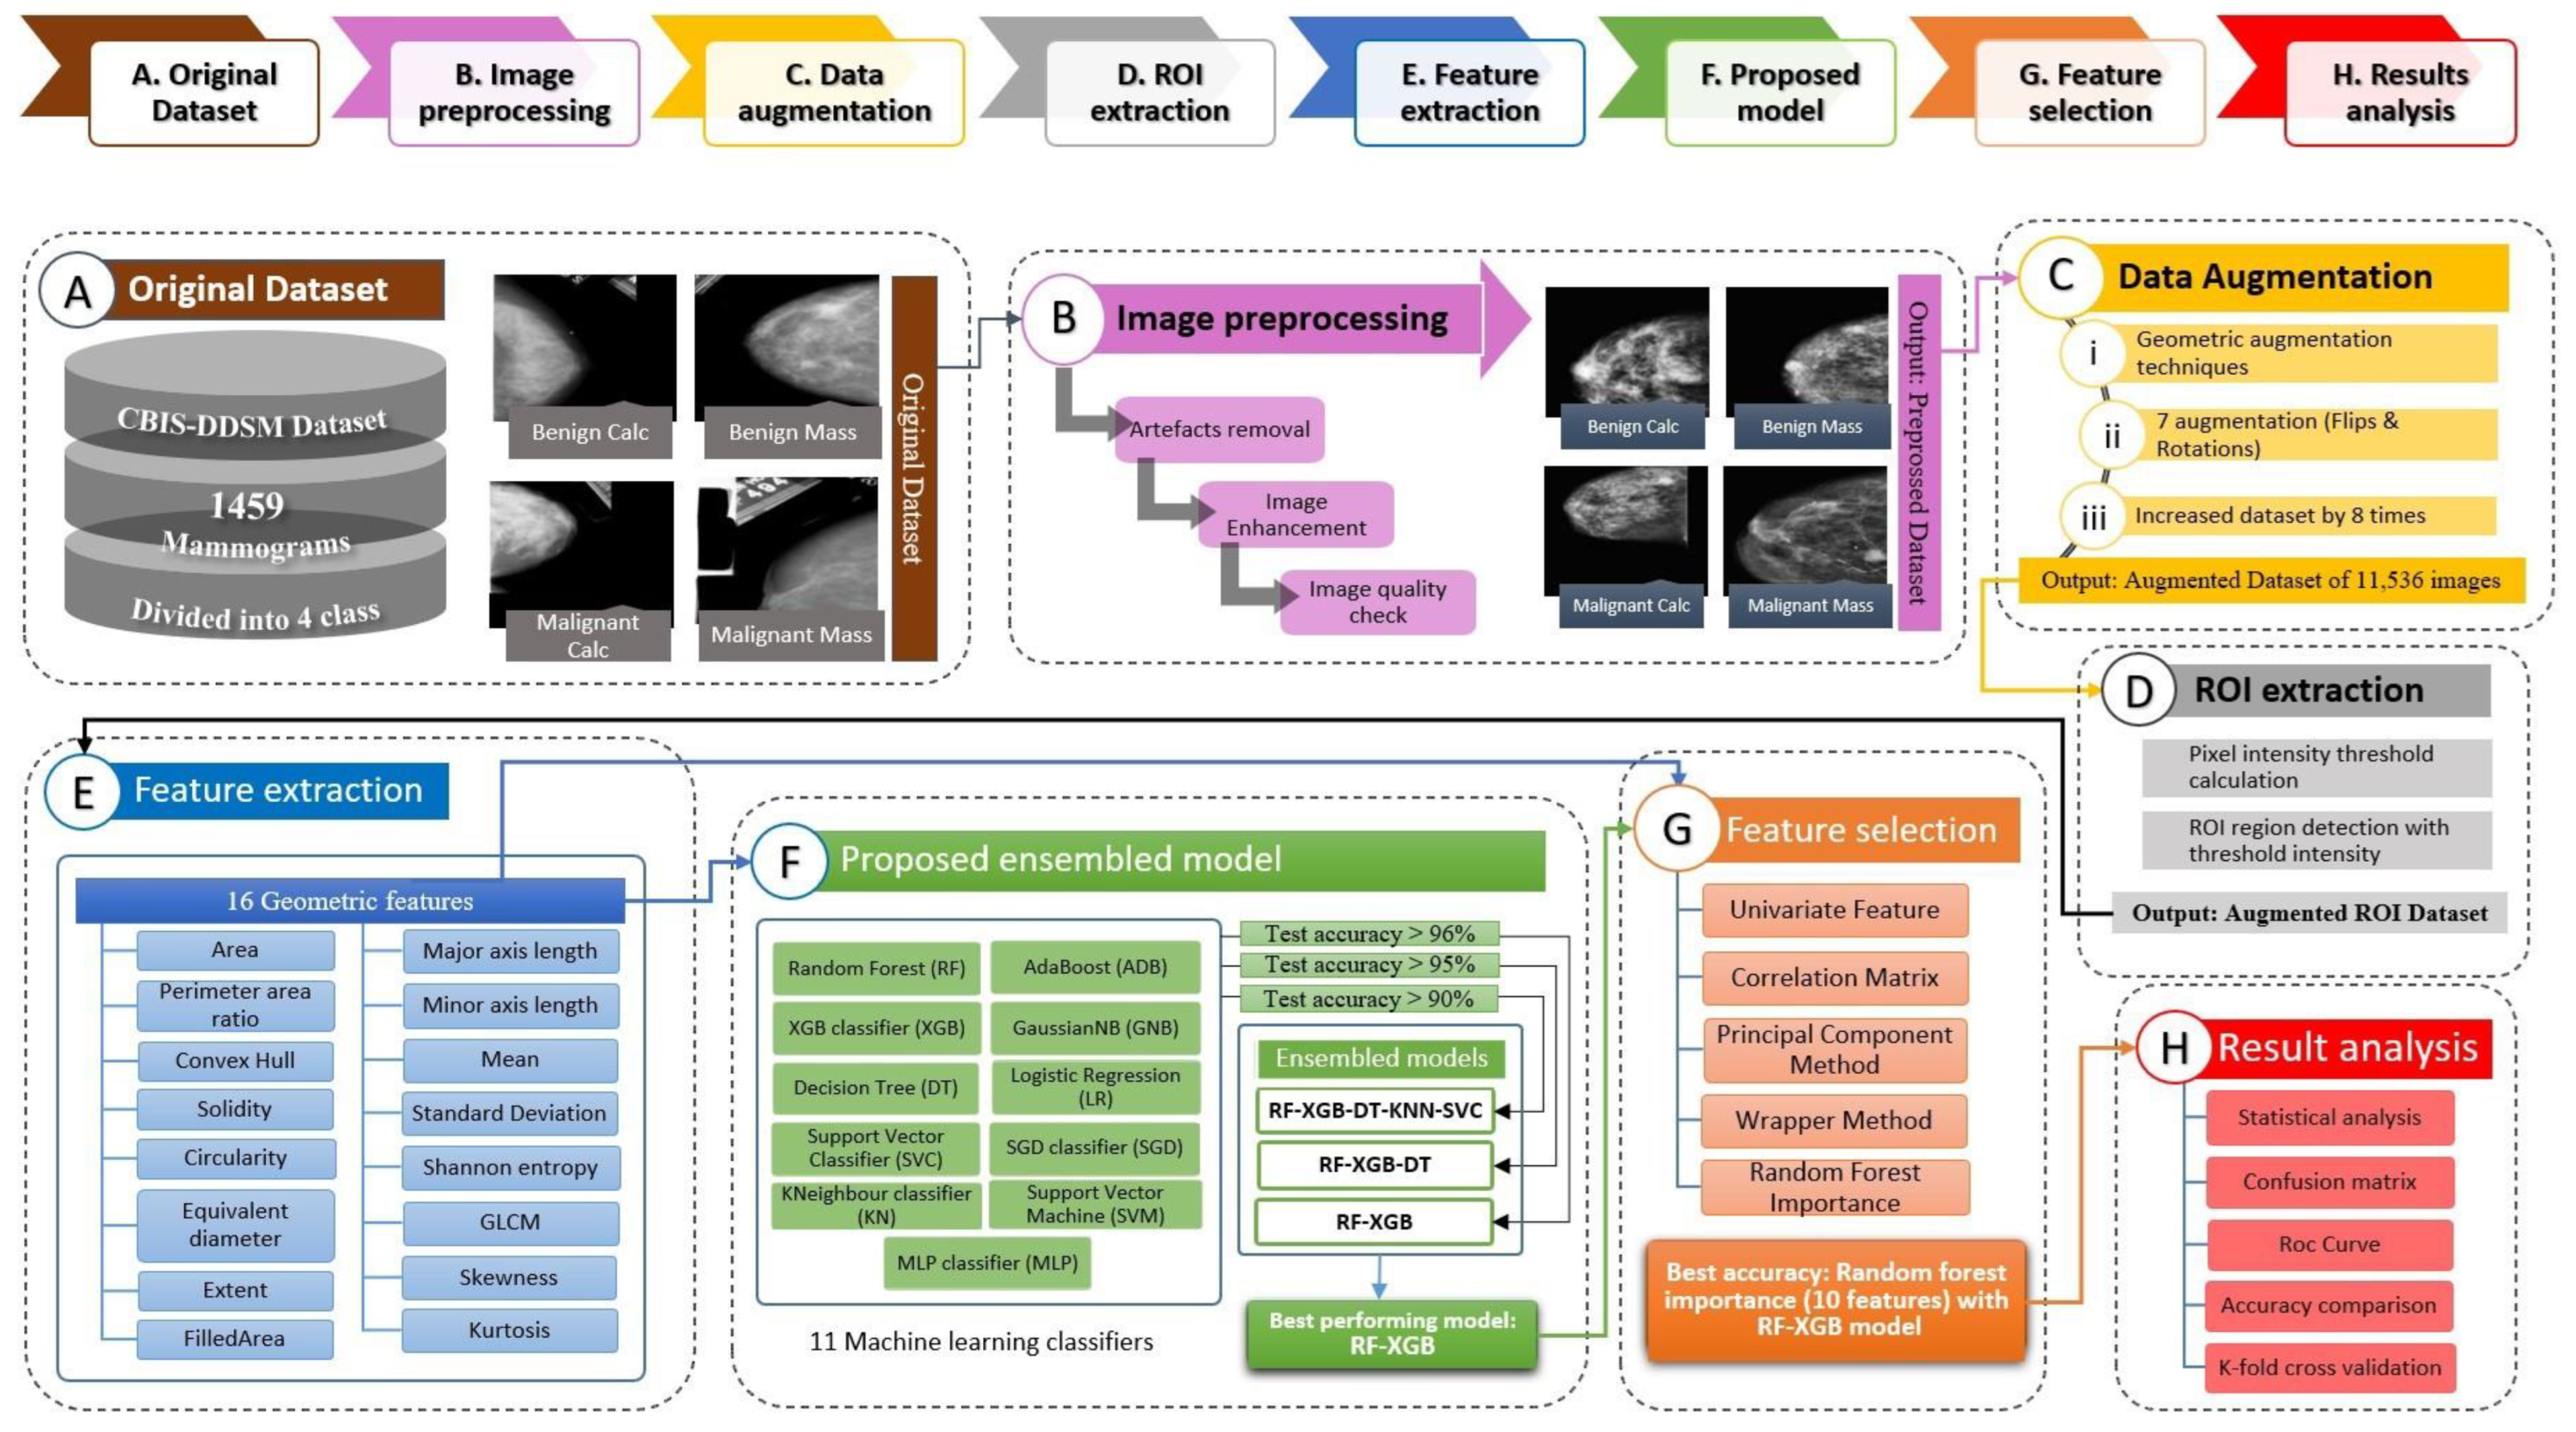
- To begin with, several widely-used image-processing techniques, named Binary Masking, Largest Contour Detection, Canny Edge detection and Hough Lines Transformation, are employed successfully to remove the artefacts and afterwards, Gamma Correction and Contrast Limited Adaptive Histogram Equalization (CLAHE) are employed to enhance the brightness and contrast level of the mammograms.
- The volume of the dataset is increased from 1459 to 11,536 images by performing various augmentations methods.
- The region of interest (ROI) is retrieved from the preprocessed augmented mammograms by the help of a region-growing method where a dynamic intensity thresholding process is introduced.
- A total of 16 geometrical features are uprooted from these ROI images.
- A total of eleven ML algorithms named Decision Tree, Random Forest, Logistic Regression, AdaBoost, Support Vector classification, K Nearest Neighbors, Multilayer Perceptron, Gaussian Naive Bayes, Stochastic Gradient Descent, XG Boost and Support Vector Machine are applied to the geometrical features and three ensemble models are developed from the eleven models, depending on three thresholds derived from test accuracy.
- These ensemble methods are again trained with the extracted geometrical features and the ideal model is determined based on the highest accuracy.
- For enhancing the performance of the best model, five feature selection approaches named Random Forest feature importance (RF), Univariate features, Correlation Matrix, Principal Component Analysis method (PCA) and Wrapper Method are carried out with fourteen different configurations.
- The robustness of the best model is evaluated further by training the model and applying K-fold cross-validations with 12 K values beginning from 3 to 30.
3. Literature Review
4. Materials and Methods
4.1. Dataset
4.2. Challenges of the Mammography Dataset in Classification
- Various artefacts (large texts and marks) are present within the mammograms resembling the pixel intensity of the ROI region that can interfere with the ROI extraction process.
- Malignant tumors are mostly found with an irregular shape as well as ambiguous and blurred edges that make it tricky to determine the boundaries of ROI.
- Along with the masses, the surrounding area of the lesion is important to preserve to ensure no loss of the cancerous region in the segmented images.
- Poor brightness and contrast level can be seen in some mammograms.
- Structural complexity of the breast portion of the mammogram having a white line attached to it.
- Patients with dense breasts are found with dense breast tissues showing pixel intensity near similar to the cancerous tissues.
- Limited number of mammogram images can be found in the chosen dataset.
- Visually intra-class dissimilarity and inter-class similarity between BC, BM, MC and MM.
4.3. Image Processing
4.3.1. Artefact Removal
Binary Masking
Largest Contour Detection
Line Removal
4.3.2. Image Enhancement
4.3.3. Assurance of Image Quality
4.4. Data Augmentation
4.5. ROI Extraction
5. Proposed Approach
5.1. Machine Learning Algorithms
5.2. Feature Extraction
5.3. Training ML Algorithms
5.4. Proposed Ensemble Model: RF-XGB-10
6. Results and Discussion
6.1. Evaluation Matrices
6.2. Comparison of Different ML Models Based on Accuracy Measures
6.3. Developing Optimal Ensembled Model
6.4. Feature Selection
6.5. Performance Evaluation
6.6. Comparison with Some Existing Literature
6.7. Discussion
7. Conclusions
Author Contributions
Funding
Institutional Review Board Statement
Informed Consent Statement
Data Availability Statement
Conflicts of Interest
References
- Dubey, A.K.; Gupta, U.; Jain, S. Breast Cancer Statistics and Prediction Methodology: A Systematic Review and Analysis. Asian Pac. J. Cancer Prev. 2015, 16, 4237–4245. [Google Scholar] [CrossRef] [PubMed] [Green Version]
- Bray, F.; Ren, J.S.; Masuyer, E.; Ferlay, J. Global Estimates of Cancer Prevalence for 27 Sites in the Adult Population in 2008. Int. J. Cancer 2013, 132, 1133–1145. [Google Scholar] [CrossRef] [PubMed]
- Ali, A.R.; Li, J.; Kanwal, S.; Yang, G.; Hussain, A.; Jane O’Shea, S. A Novel Fuzzy Multilayer Perceptron (F-MLP) for the Detection of Irregularity in Skin Lesion Border Using Dermoscopic Images. Front. Med. 2020, 7, 297. [Google Scholar] [CrossRef] [PubMed]
- Li, H.; Zhuang, S.; Li, D.-A.; Zhao, J.; Ma, Y. Benign and Malignant Classification of Mammogram Images Based on Deep Learning. Biomed. Signal Process. Control 2019, 51, 347–354. [Google Scholar] [CrossRef]
- Timmers, J.M.H.; Van Doorne-Nagtegaal, H.J.; Zonderland, H.M.; Van Tinteren, H.; Visser, O.; Verbeek, A.L.M.; Den Heeten, G.J.; Broeders, M.J.M. The Breast Imaging Reporting and Data System (Bi-Rads) in the Dutch Breast Cancer Screening Programme: Its Role as an Assessment and Stratification Tool. Eur. Radiol. 2012, 22, 1717–1723. [Google Scholar] [CrossRef] [Green Version]
- Tang, X.; Zhang, L.; Zhang, W.; Huang, X.; Iosifidis, V.; Liu, Z.; Zhang, M.; Messina, E.; Zhang, J. Using Machine Learning to Automate Mammogram Images Analysis. In Proceedings of the 2020 IEEE International Conference on Bioinformatics and Biomedicine (BIBM), Seoul, Korea, 16–19 December 2020; pp. 757–764. [Google Scholar] [CrossRef]
- Vijayarajeswari, R.; Parthasarathy, P.; Vivekanandan, S.; Basha, A.A. Classification of Mammogram for Early Detection of Breast Cancer Using SVM Classifier and Hough Transform. Meas. J. Int. Meas. Confed. 2019, 146, 800–805. [Google Scholar] [CrossRef]
- Meselhy Eltoukhy, M.; Faye, I.; Belhaouari Samir, B. A Statistical Based Feature Extraction Method for Breast Cancer Diagnosis in Digital Mammogram Using Multiresolution Representation. Comput. Biol. Med. 2012, 42, 123–128. [Google Scholar] [CrossRef]
- Singh, V.P.; Srivastava, A.; Kulshreshtha, D.; Chaudhary, A.; Srivastava, R. Mammogram Classification Using Selected GLCM Features and Random Forest Classifier. Int. J. Comput. Sci. Inf. Secur. 2016, 14, 82–87. [Google Scholar]
- Al-Hadidi, M.R.; Alarabeyyat, A.; Alhanahnah, M. Breast Cancer Detection Using K-Nearest Neighbor Machine Learning Algorithm. In Proceedings of the 2016 9th International Conference on Developments in eSystems Engineering (DeSE), Liverpool, UK, 31 August–2 September 2016; pp. 35–39. [Google Scholar] [CrossRef]
- Sivasangari, A.; Ajitha, P.; Bevishjenila; Vimali, J.S.; Jose, J.; Gowri, S. Breast Cancer Detection Using Machine Learning. Lect. Notes Data Eng. Commun. Technol. 2022, 68, 693–702. [Google Scholar] [CrossRef]
- The Cancer Imaging Archive (TCIA) Public Access. Available online: https://wiki.cancerimagingarchive.net/display/Public/CBIS-DDSM (accessed on 3 October 2022).
- Montaha, S.; Azam, S.; Rafid, A.K.M.R.H.; Hasan, M.Z.; Karim, A.; Hasib, K.M.; Patel, S.K.; Jonkman, M.; Mannan, Z.I. MNet-10: A Robust Shallow Convolutional Neural Network Model Performing Ablation Study on Medical Images Assessing the Effectiveness of Applying Optimal Data Augmentation Technique. Front. Med. 2022, 9, 2346. [Google Scholar] [CrossRef]
- Montaha, S.; Azam, S.; Kalam, A.; Rakibul, M.; Rafid, H.; Ghosh, P.; Hasan, Z.; Jonkman, M.; Boer, F. De BreastNet18: A High Accuracy Fine-Tuned VGG16 Model Evaluated Using Ablation Study for Diagnosing Breast Cancer from Enhanced Mammography Images. Biology 2021, 10, 1347. [Google Scholar] [CrossRef] [PubMed]
- Gong, X.Y.; Su, H.; Xu, D.; Zhang, Z.T.; Shen, F.; Yang, H. Bin An Overview of Contour Detection Approaches. Int. J. Autom. Comput. 2018, 15, 656–672. [Google Scholar] [CrossRef]
- Ding, L.; Goshtasby, A. On the canny edge detector. Pattern Recognition 2001, 34, 721–725. [Google Scholar] [CrossRef]
- Duda, R.O.; Hart, P.E. Use of the Hough Transformation to Detect Lines and Curves in Pictures. Commun. ACM 1972, 15, 11–15. [Google Scholar] [CrossRef]
- Dhar, P. A Method to Detect Breast Cancer Based on Morphological Operation. Int. J. Educ. Manag. Eng. 2021, 11, 25–31. [Google Scholar] [CrossRef]
- Montaha, S.; Azam, S.; Rakibul, A.K.M.R.H.; Islam, S.; Ghosh, P.; Jonkman, M. A Shallow Deep Learning Approach to Classify Skin Cancer Using Down-Scaling Method to Minimize Time and Space Complexity. PLoS ONE 2022, 17, e0269826. [Google Scholar] [CrossRef]
- Hassan, N.; Ullah, S.; Bhatti, N.; Mahmood, H.; Zia, M. The Retinex Based Improved Underwater Image Enhancement. Multimed. Tools Appl. 2021, 80, 1839–1857. [Google Scholar] [CrossRef]
- Beeravolu, A.R.; Azam, S.; Jonkman, M.; Shanmugam, B.; Kannoorpatti, K.; Anwar, A. Preprocessing of Breast Cancer Images to Create Datasets for Deep-CNN. IEEE Access 2021, 9, 33438–33463. [Google Scholar] [CrossRef]
- Dar, A.S.; Padha, D. Medical Image Segmentation A Review of Recent Techniques, Advancements and a Comprehensive Comparison. Int. J. Comput. Sci. Eng. 2019, 7, 114–124. [Google Scholar] [CrossRef]
- Singh, A.K.; Gupta, B. A Novel Approach for Breast Cancer Detection and Segmentation in a Mammogram. Procedia Comput. Sci. 2015, 54, 676–682. [Google Scholar] [CrossRef] [Green Version]
- Nguyen, T.L.; Choi, Y.H.; Aung, Y.K.; Evans, C.F.; Trinh, N.H.; Li, S.; Dite, G.S.; Kim, M.S.; Brennan, P.C.; Jenkins, M.A.; et al. Breast Cancer Risk Associations with Digital Mammographic Density by Pixel Brightness Threshold and Mammographic System. Radiology 2018, 286, 433–442. [Google Scholar] [CrossRef] [Green Version]
- Sheba, K.U.; Raj, S.G. Objective Quality Assessment of Image Enhancement Methods in Digital Mammography—A Comparative Study. Signal Image Process. Int. J. 2016, 7, 1–13. [Google Scholar] [CrossRef]
- Ghosh, P.; Azam, S.; Hasib, K.M.; Karim, A.; Jonkman, M.; Anwar, A. A performance based study on deep learning algorithms in the effective prediction of breast cancer. In Proceedings of the 2021 International Joint Conference on Neural Networks (IJCNN), Shenzhen, China, 18–22 July 2021. [Google Scholar]
- Abuzaghleh, O.; Barkana, B.D.; Faezipour, M. Automated Skin Lesion Analysis Based on Color and Shape Geometry Feature Set for Melanoma Early Detection and Prevention. In Proceedings of the IEEE Long Island Systems, Applications and Technology (LISAT) Conference 2014, Farmingdale, NY, USA, 2 May 2014. [Google Scholar] [CrossRef]
- AlFayez, F.; Abo El-Soud, M.W.; Gaber, T. Thermogram Breast Cancer Detection: A Comparative Study of Two Machine Learning Techniques. Appl. Sci. 2020, 10, 551. [Google Scholar] [CrossRef] [Green Version]
- Mathew, S.P.; Balas, V.E.; Zachariah, K.P. A Content-Based Image Retrieval System Based on Convex Hull Geometry. Acta Polytech. Hung. 2015, 12, 103–116. [Google Scholar] [CrossRef]
- Riti, Y.F.; Nugroho, H.A.; Wibirama, S.; Windarta, B.; Choridah, L. Feature Extraction for Lesion Margin Characteristic Classification from CT Scan Lungs Image. In Proceedings of the 2016 1st International Conference on Information Technology, Information Systems and Electrical Engineering (ICITISEE), Yogyakarta, Indonesia, 23–24 August 2016; pp. 54–58. [Google Scholar] [CrossRef]
- Wirth, M.A. Shape Analysis & Measurement. Image Processing Group. 2004, 1–49. [Google Scholar]
- Wilson, J.D.; Bechtel, D.B.; Todd, T.C.; Seib, P.A. Measurement of Wheat Starch Granule Size Distribution Using Image Analysis and Laser Diffraction Technology. Cereal Chem. 2006, 83, 259–268. [Google Scholar] [CrossRef] [Green Version]
- Soranamageswari, M.; Meena, C. Statistical Feature Extraction for Classification of Image Spam Using Artificial Neural Networks. In Proceedings of the 2010 Second International Conference on Machine Learning and Computing, Bangalore, India, 9–11 February 2010; pp. 101–105. [Google Scholar] [CrossRef]
- Cui, G.; Tang, L.; Liu, M.; Zhou, X. Quantitative Response of Subjective Visual Recognition to Fog Concentration Attenuation Based on Image Standard Deviation. Optik 2021, 232, 166446. [Google Scholar] [CrossRef]
- Wu, Y.; Zhou, Y.; Saveriades, G.; Agaian, S.; Noonan, J.P.; Natarajan, P. Local Shannon Entropy Measure with Statistical Tests for Image Randomness. Inf. Sci. 2013, 222, 323–342. [Google Scholar] [CrossRef] [Green Version]
- Htay, T.T.; Maung, S.S. Early Stage Breast Cancer Detection System Using GLCM Feature Extraction and K-Nearest Neighbor (k-NN) on Mammography Image. In Proceedings of the 2018 18th International Symposium on Communications and Information Technologies (ISCIT), Bangkok, Thailan, 26–29 September 2018; pp. 345–348. [Google Scholar] [CrossRef]
- Attallah, B.; Serir, A.; Chahir, Y. Feature Extraction in Palmprint Recognition Using Spiral of Moment Skewness and Kurtosis Algorithm. Pattern Anal. Appl. 2019, 22, 1197–1205. [Google Scholar] [CrossRef] [Green Version]
- Brown, C.A.; Robinson, D.M. Skewness and Kurtosis Implied by Option Prices: A Correction. J. Financ. Res. 2002, 25, 279–282. [Google Scholar] [CrossRef]
- Fushiki, T. Estimation of Prediction Error by Using K-Fold Cross-Validation. Stat. Comput. 2011, 21, 137–146. [Google Scholar] [CrossRef]
- Reza, M.; Miri, S.; Javidan, R. A Hybrid Data Mining Approach for Intrusion Detection on Imbalanced NSL-KDD Dataset. Int. J. Adv. Comput. Sci. Appl. 2016, 7, 1–33. [Google Scholar] [CrossRef] [Green Version]
- Kuz’min, V.E.; Polishchuk, P.G.; Artemenko, A.G.; Andronati, S.A. Interpretation of QSAR Models Based on Random Forest Methods. Mol. Inform. 2011, 30, 593–603. [Google Scholar] [CrossRef]
- Kabiraj, S.; Raihan, M.; Alvi, N.; Afrin, M.; Akter, L.; Sohagi, S.A.; Podder, E. Breast Cancer Risk Prediction Using XGBoost and Random Forest Algorithm. In Proceedings of the 2020 11th International Conference on Computing, Communication and Networking Technologies (ICCCNT), Kharagpur, India, 1–3 July 2020. [Google Scholar]
- Montaha, S.; Azam, S.; Rafid, A.K.M.R.H.; Hasan, M.Z.; Karim, A.; Islam, A. TimeDistributed-CNN-LSTM: A Hybrid Approach Combining CNN and LSTM to Classify Brain Tumor on 3D MRI Scans Performing Ablation Study. IEEE Access 2022, 10, 60039–60059. [Google Scholar] [CrossRef]
- Chicco, D.; Jurman, G. The Advantages of the Matthews Correlation Coefficient (MCC) over F1 Score and Accuracy in Binary Classification Evaluation. BMC Genom. 2020, 21, 6. [Google Scholar] [CrossRef] [Green Version]
- Zhao, Y.; Zhu, W.; Wei, P.; Fang, P.; Zhang, X.; Yan, N.; Liu, W.; Zhao, H.; Wu, Q. Classification of Zambian Grasslands Using Random Forest Feature Importance Selection during the Optimal Phenological Period. Ecol. Indic. 2022, 135, 108529. [Google Scholar] [CrossRef]
- Gomez-Chova, L.; Calpe, J.; Camps-Valls, G.; Martín, J.D.; Soria, E.; Vila, J.; Alonso-Chorda, L.; Moreno, J. Feature Selection of Hyperspectral Data through Local Correlation and SFFS for Crop Classification. Int. Geosci. Remote Sens. Symp. 2003, 1, 555–557. [Google Scholar] [CrossRef]
- Parveen, A.N.; Inbarani, H.H.; Kumar, E.N.S. Performance Analysis of Unsupervised Feature Selection Methods. In Proceedings of the 2012 International Conference on Computing, Communication and Applications, Dindigul, India, 22–24 February 2012. [Google Scholar] [CrossRef] [Green Version]
- Molinari, R.; Bakalli, G.; Guerrier, S.; Miglioli, C.; Orso, S.; Scaillet, O. Swag: A Wrapper Method for Sparse Learning. SSRN Electron. J. 2020. [Google Scholar] [CrossRef]


| Authors | Task | Models | Limitations |
|---|---|---|---|
| Tang et al. [6] | Classification | Backpropagation Network, Naïve Bayes Classifier and Linear Discriminant Analysis | i. Lack of image enhancement techniques. ii. Artefact removal is not conducted iii. Absence of data-augmentation technique |
| Vijayarajeswari et al. [7] | Classification | SMV | i. Absence of data-augmentation technique ii. Experimentation with various models is missing |
| Meselhy Eltoukhy et al. [8] | Classification | SMV | i. Lack of image-enhancement techniques. ii. Artefact removal is not conducted iii. Absence of data-augmentation technique iv. Experimentation with various ML models is absent |
| Singh et al. [9] | Classification | Random forest | i. Lack of automatic ROI segmentation process ii. Absence of data-augmentation techniques |
| Al-Hadidi et al. [10] | Segmentation Classification | Logistic Regression and Backpropagation Neural Network | i. Lack of automatic ROI segmentation process ii. Absence of data-augmentation techniques iii. Experimentation with various ML models is absent |
| Samples in dataset (total) | 1459 mammograms |
| Dimension | 224 × 224 pixels |
| Color Grading | Red Green Blue (RGB) |
| Benign Calcification (BC) | 398 mammograms |
| Benign Mass (BM) | 417 mammograms |
| Malignant Calcification (MC) | 300 mammograms |
| Malignant Mass (MM) | 344 mammograms |
| Algorithms | Functions | Values of Parameter |
|---|---|---|
| Binary masking | OpenCV rectangle() | Width = 5 |
| Largest contour detection | OpenCV findContours() | Mode for contour approximation = CHAIN_APPROX_SIMPLE Retrieval mode of contour = RETR_EXTERNAL |
| max() | Meassure key = contourArea | |
| OpenCV drawContours() | Index = largest contour, color of contour boarder = (255, 255, 255), width = 1 | |
| Vertical line removal | OpenCV Canny() | Minimum Value = 50, maximum Value = 150 and Size of aparture = 3 |
| OpenCV HoughLines() | edges = Canny(), rho = 1, theta = numpy. pi/50, threshold = 50 | |
| Line | Color value = (0,0,0), Width = 5 | |
| Gamma correction | Numpy array() | Value of gamma = 2.0 |
| CLAHE | OspenCV createCLAHE() | Clip Limit = 1.0, tile Grid Size = (8, 8) |
| Image | PSNR | MSE | RMSE | SSIM |
|---|---|---|---|---|
| Img_1 | 36.67 | 16.38 | 4.04 | 0.958 |
| Img_2 | 36.29 | 14.73 | 4.21 | 0.959 |
| Img_3 | 37.28 | 15.35 | 3.91 | 0.965 |
| Img_4 | 38.31 | 14.41 | 3.79 | 0.961 |
| Img_5 | 39.67 | 12.63 | 3.55 | 0.974 |
| Img_6 | 40.29 | 12.35 | 3.51 | 0.974 |
| Img_7 | 38.28 | 14.69 | 3.83 | 0.966 |
| Img_8 | 40.16 | 13.39 | 3.65 | 0.968 |
| Img_9 | 36.84 | 14.32 | 3.78 | 0.964 |
| Img_10 | 39.17 | 15.42 | 3.92 | 0.969 |
| No | Feature Name | Feature Definition |
|---|---|---|
| 1 | Area [28] | The total area of all extracted regions |
| 2 | Perimeter area ratio [28] | The ratio between the measure of the length of a shape around the ROI and Area |
| 3 | Convex Hull [29] | The set of pixels that are included in convex polygon that is smallest surrounding white pixels |
| 4 | Solidity [30] | Contrasting object areas compared to its Convex Hull by utilizing the pixels that make up the Convex Hull. |
| 5 | Circularity [31] | The measurement of the roundness of the ROI |
| 6 | Equivalent diameter [32] | This is the diameter of a circle that has the same perimeter as the ROI region. |
| 7 | Extent | The area of the ROI divided by the Area of Convex hull |
| 8 | FilledArea | The total area measurement of only the ROI regions |
| 9 | Major axis length [27] | The longest length of the ROI object |
| 10 | Minor axis length [27] | The smallest width of the ROI object |
| 11 | Mean [33] | The sum of all pixels divided by the total pixel number |
| 12 | Standard Deviation [34] | The measurement of dispersion in the grey intensity level of the image |
| 13 | Shannon entropy [35] | The quantity of information present in the ROI images |
| 14 | Gray level co-occurrence matrix [36] | The textural information of the ROI regions |
| 15 | Skewness [37] | The measure of symmetry in the pixel’s distribution in the image |
| 16 | Kurtosis [38] | The density of the pixel’s distribution |
| Model | T_ACC(%) | T_MCC (%) | T_F1 score (%) | Te_ACC (%) | Te_MCC (%) | Te_F1(%) | AUC (%) |
|---|---|---|---|---|---|---|---|
| KNN | 100 | 100 | 100 | 92.82 | 89.27 | 92.82 | 95.88 |
| SVC | 100 | 100 | 100 | 92.82 | 75.22 | 81.99 | 86.52 |
| DT | 100 | 100 | 100 | 94.62 | 92.46 | 94.62 | 96.36 |
| RF | 100 | 100 | 100 | 95.91 | 95.39 | 95.90 | 96.74 |
| MLP | 70.24 | 58.43 | 67.97 | 70.61 | 58.80 | 68.49 | 82.03 |
| AB | 53.05 | 37.32 | 53.74 | 54.39 | 39.15 | 55.19 | 57.12 |
| XBG | 99.58 | 99.44 | 99.58 | 95.40 | 94.97 | 95.22 | 96.65 |
| GNB | 42.70 | 23.39 | 41.04 | 43.97 | 25.27 | 42.34 | 68.10 |
| SVM | 38.01 | 17.01 | 34.02 | 36.96 | 15.36 | 32.62 | 65.72 |
| SGD | 40.97 | 13.73 | 28.48 | 40.54 | 12.42 | 27.59 | 57.13 |
| LR | 43.06 | 13.36 | 42.08 | 42.90 | 12.99 | 41.79 | 59.91 |
| Model | T_ACC (%) | T_MCC (%) | T_F1 Score (%) | Te_ACC (%) | Te_MCC (%) | Te_F1 Score (%) | AUC (%) |
|---|---|---|---|---|---|---|---|
| RF-DT-XGB | 100 | 100 | 100 | 95.64 | 95.47 | 95.64 | 96.14 |
| RF-XGB | 100 | 100 | 100 | 96.57 | 97.06 | 96.57 | 97.30 |
| RF-DT-XGB-SVM-KNN | 100 | 100 | 100 | 91.53 | 88.07 | 91.39 | 93.47 |
| Feature Selection | Configuration | Feature Number | Test ACC (%) | MCC (%) | F1 (%) | AUC (%) |
|---|---|---|---|---|---|---|
| All features | 16 features | 16 | 96.03 | 97.06 | 96.03 | 96.50 |
| Univariate Feature | 14 features | 14 | 96.58 | 96.39 | 96.58 | 97.54 |
| Univariate Feature | 12 features | 12 | 97.35 | 95.55 | 97.31 | 98.21 |
| Correlation Matrix | 0.01 threshold | 15 | 96.70 | 96.56 | 96.69 | 97.58 |
| Correlation Matrix | 0.015 threshold | 14 | 97.25 | 96.64 | 97.25 | 97.62 |
| Correlation Matrix | 0.025 threshold | 12 | 97.35 | 95.55 | 97.31 | 98.21 |
| PAC | - | 15 | 96.70 | 96.56 | 96.69 | 97.58 |
| PAC | - | 14 | 97.25 | 96.64 | 97.25 | 97.62 |
| PAC | - | 10 | 96.74 | 95.13 | 96.74 | 98.03 |
| Wrapper Method | 0.05 thresh | 14 | 97.92 | 96.89 | 97.92 | 98.73 |
| Wrapper Method | 0.01 thresh | 13 | 97.13 | 95.72 | 97.13 | 98.23 |
| Wrapper Method | 0.045 thresh | 9 | 96.74 | 95.15 | 96.73 | 97.97 |
| RF | Threshold 0.25 | 14 | 96.90 | 96.76 | 96.90 | 97.48 |
| RF | Threshold 0.045 | 12 | 97.81 | 96.73 | 97.81 | 98.67 |
| RF | Threshold 0.05 | 10 | 98.05 | 97.27 | 98.05 | 98.91 |
| Author | Class | No of Images | Method/Model | Accuracy (%) |
|---|---|---|---|---|
| Meselhy Eltoukhy et al. [8] | 2 class: Benign and malignant | 322 mammograms | Wavelet coefficient SVM classifier | 95.84 |
| Vijayarajeswari et al. [7] | 3 class: benign, malignant and normal | 95 mammograms | SVM | 94.0 |
| Tang et al. [6] | 2 class: normal and cancerous | 1487 mammograms | voting classification | 96.06 |
| This paper | 4 classes: benign calc, benign mass, malignant calc and malignant mass | 1459 mammograms After augmentation: 11,536 images | Geometric feature extraction, Random Forest Feature selection RF-XGB-10 classifier | 98.05 |
Publisher’s Note: MDPI stays neutral with regard to jurisdictional claims in published maps and institutional affiliations. |
© 2022 by the authors. Licensee MDPI, Basel, Switzerland. This article is an open access article distributed under the terms and conditions of the Creative Commons Attribution (CC BY) license (https://creativecommons.org/licenses/by/4.0/).
Share and Cite
Rafid, A.K.M.R.H.; Azam, S.; Montaha, S.; Karim, A.; Fahim, K.U.; Hasan, M.Z. An Effective Ensemble Machine Learning Approach to Classify Breast Cancer Based on Feature Selection and Lesion Segmentation Using Preprocessed Mammograms. Biology 2022, 11, 1654. https://doi.org/10.3390/biology11111654
Rafid AKMRH, Azam S, Montaha S, Karim A, Fahim KU, Hasan MZ. An Effective Ensemble Machine Learning Approach to Classify Breast Cancer Based on Feature Selection and Lesion Segmentation Using Preprocessed Mammograms. Biology. 2022; 11(11):1654. https://doi.org/10.3390/biology11111654
Chicago/Turabian StyleRafid, A. K. M. Rakibul Haque, Sami Azam, Sidratul Montaha, Asif Karim, Kayes Uddin Fahim, and Md. Zahid Hasan. 2022. "An Effective Ensemble Machine Learning Approach to Classify Breast Cancer Based on Feature Selection and Lesion Segmentation Using Preprocessed Mammograms" Biology 11, no. 11: 1654. https://doi.org/10.3390/biology11111654