
Influence of Ecological Factors on the Metabolomic Composition of Fish Lenses

 , , and
Abstract
:Simple Summary
Abstract

1. Introduction
2. Materials and Methods
2.1. Locations
2.2. Measurements of LDO
2.3. Biochemical Analysis of Water Samples
2.4. Lens Sample Collection
2.5. Sample Preparation
2.6. NMR Measurements
2.7. NMR Signal Identification and Metabolite Quantification
2.8. Data Analysis
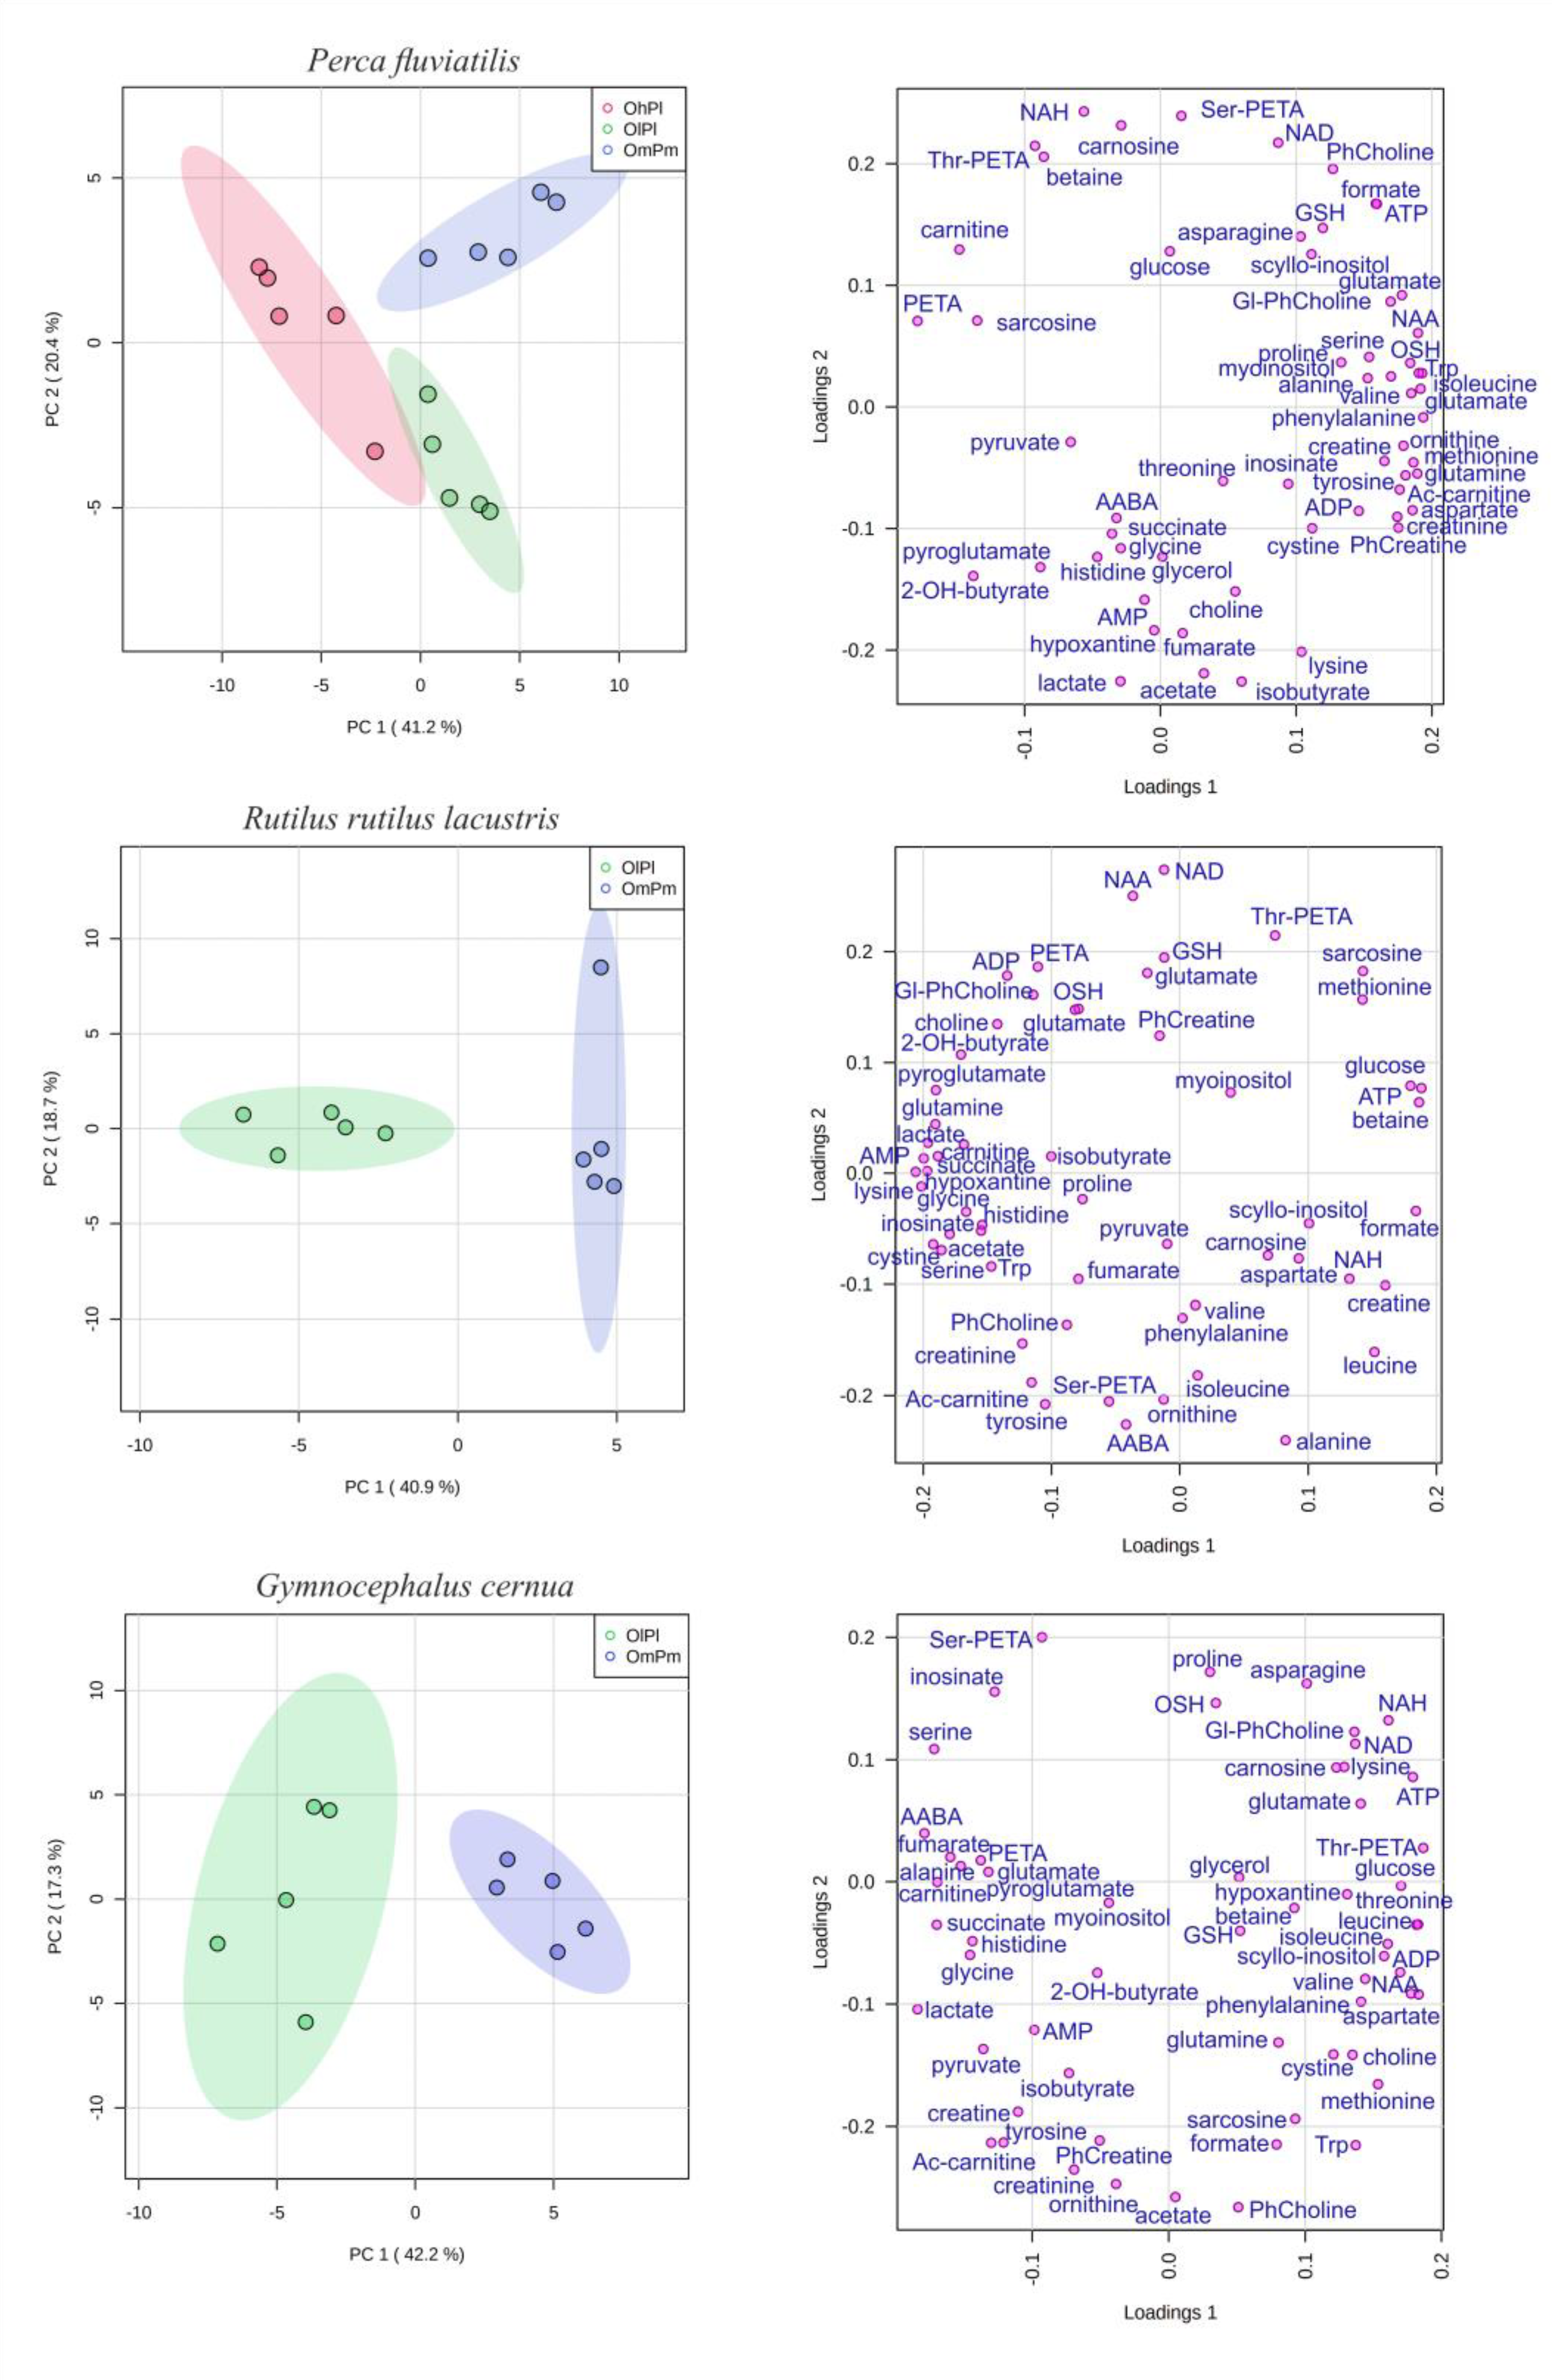
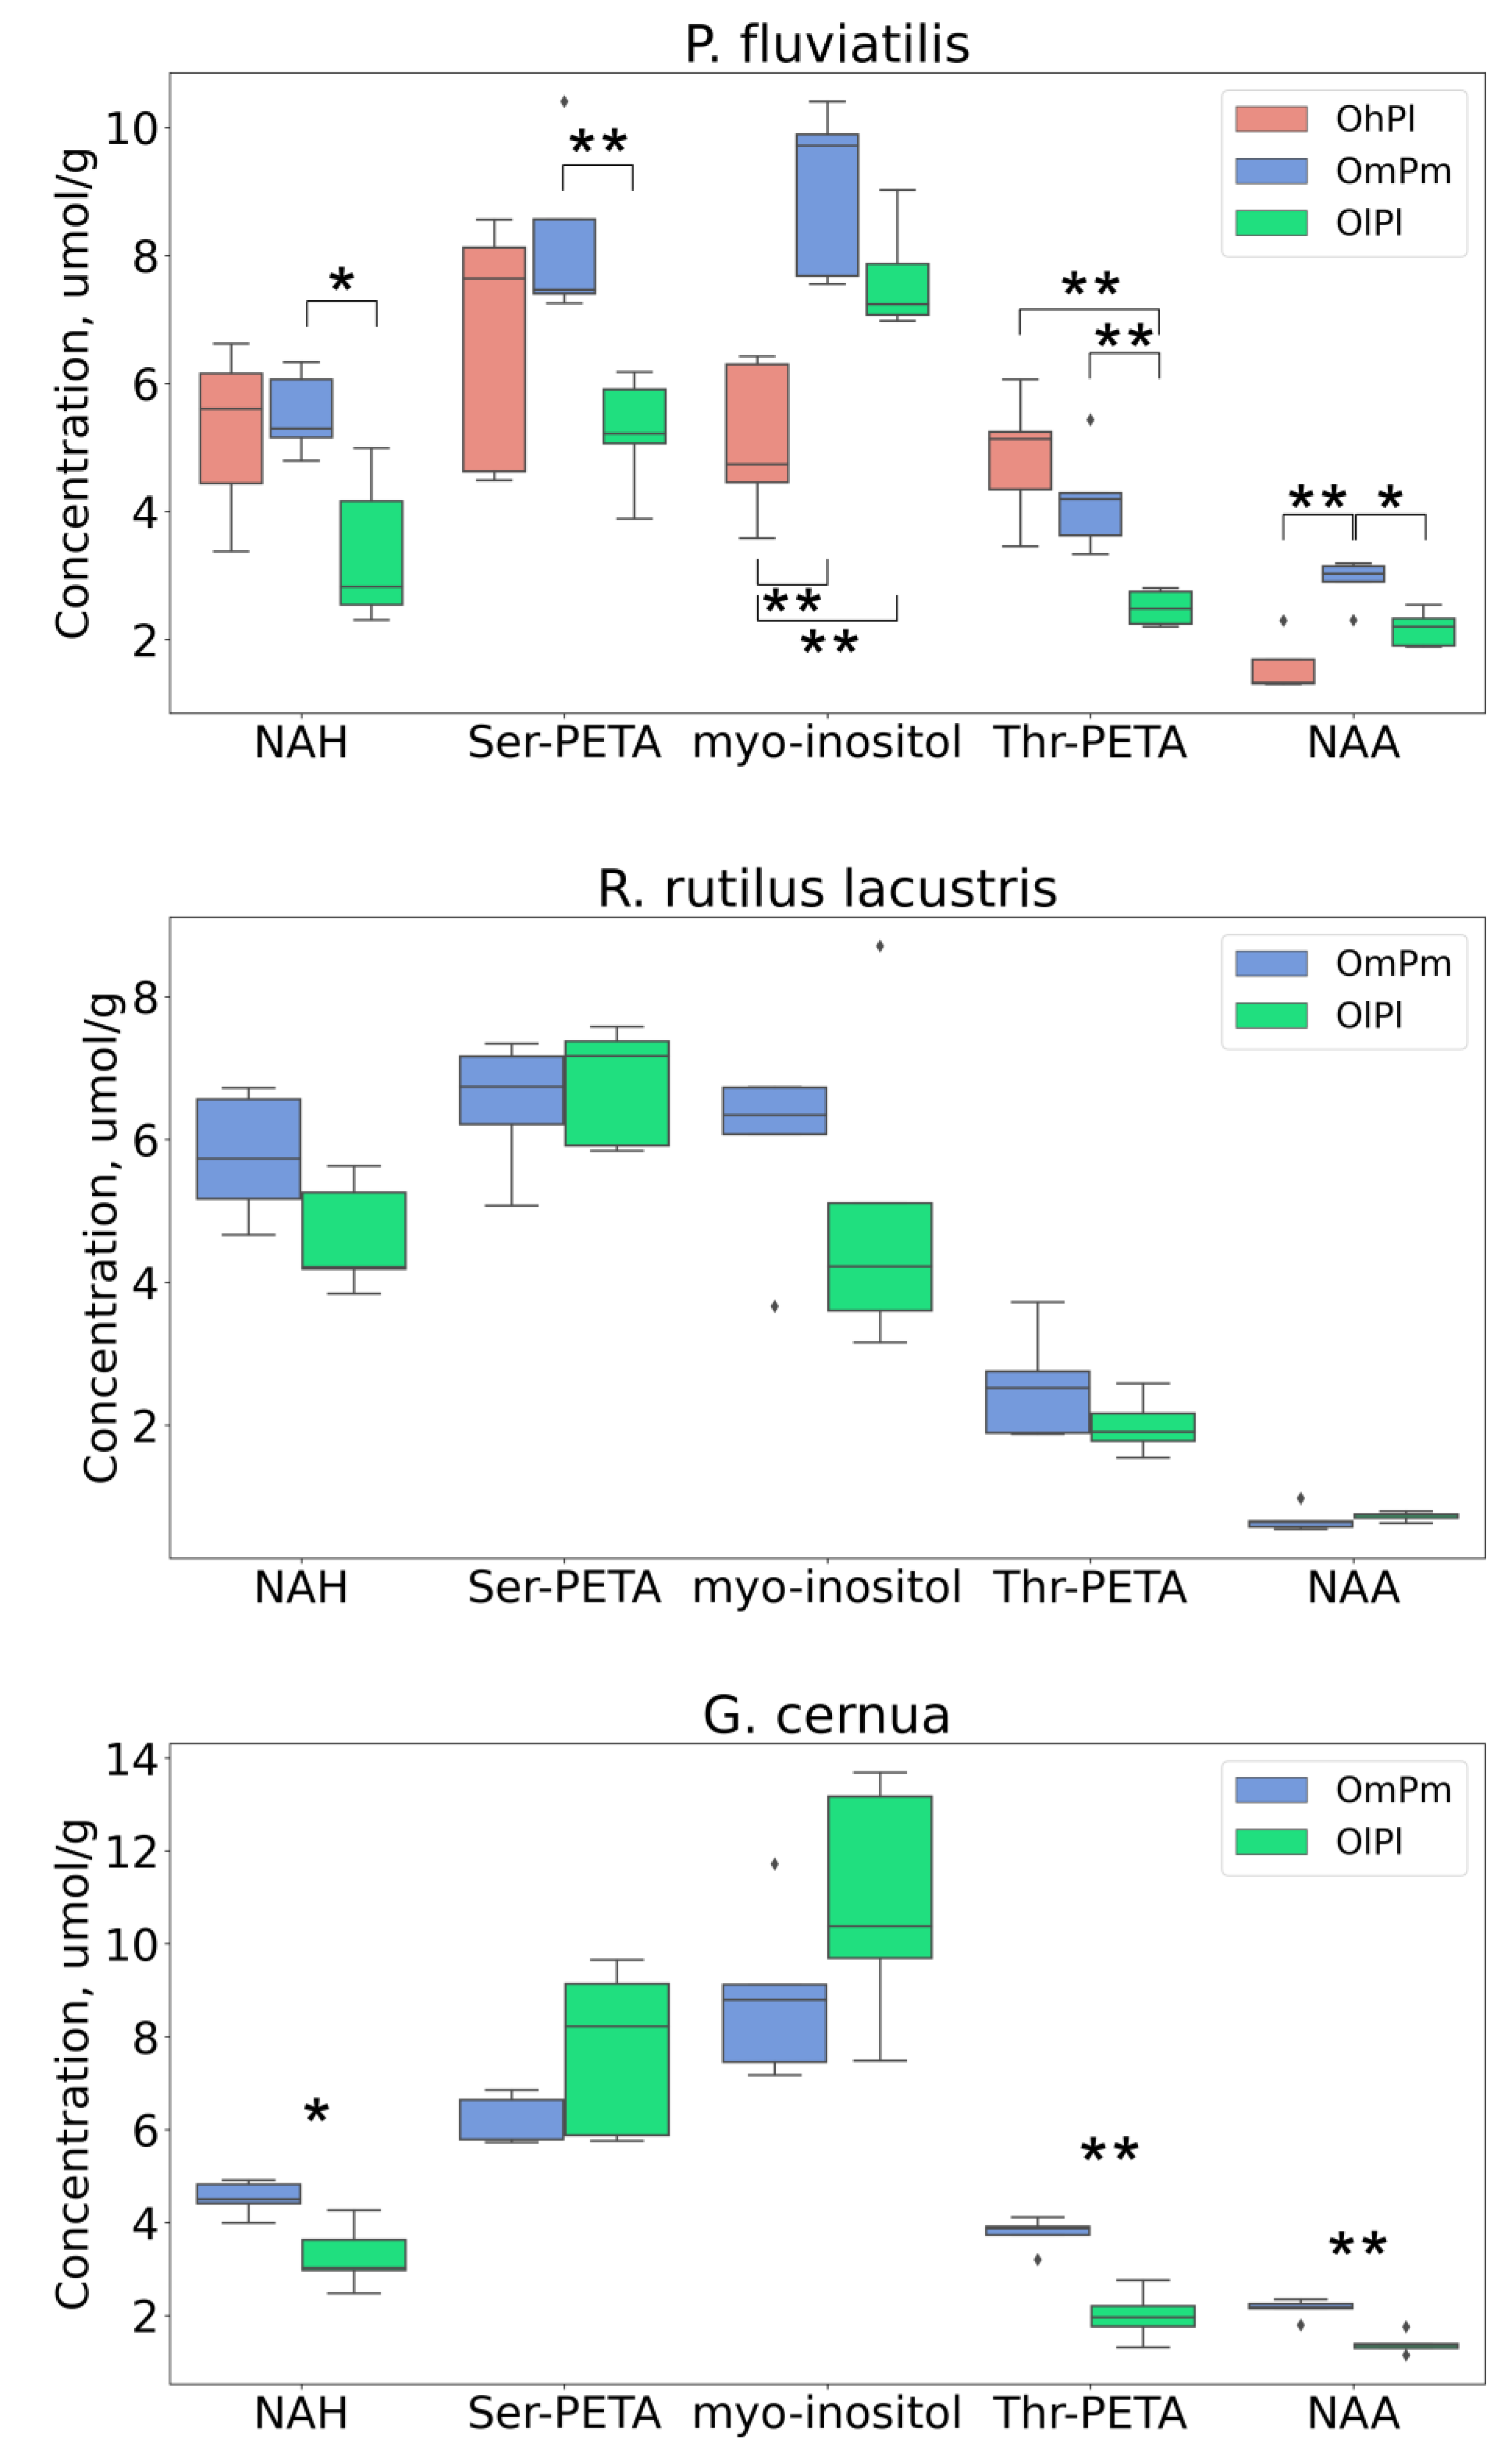
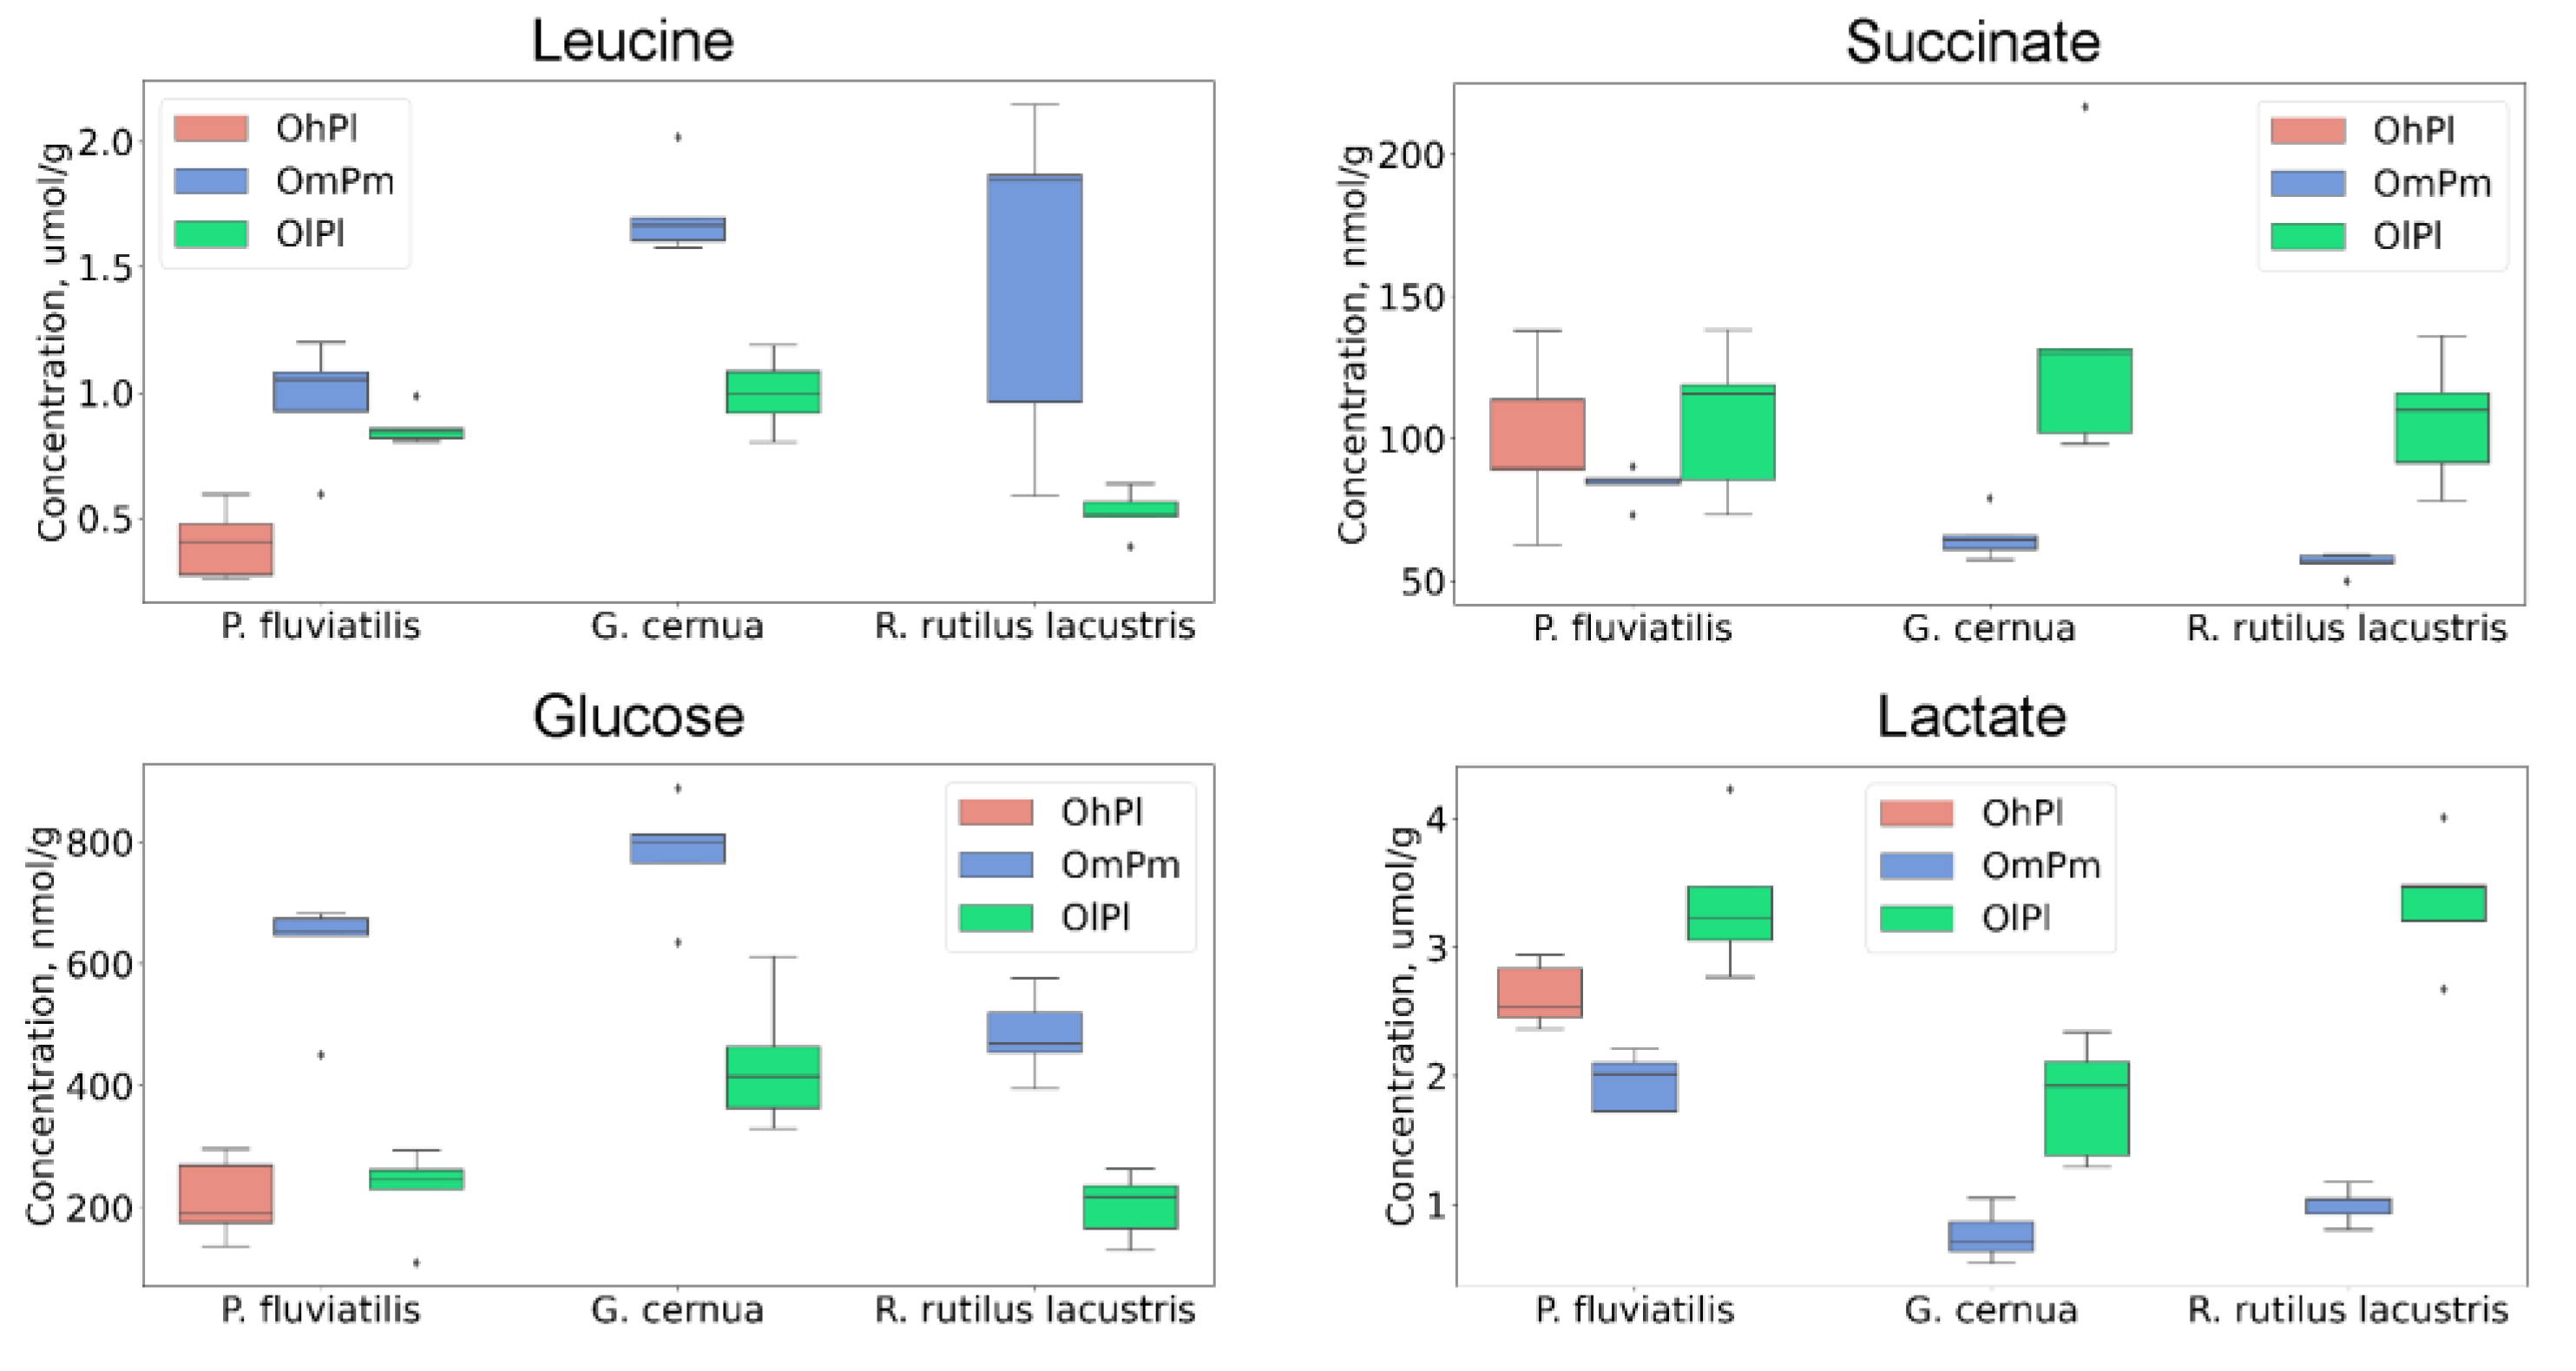
3. Results
4. Discussion
5. Conclusions
Supplementary Materials
Author Contributions
Funding
Institutional Review Board Statement
Informed Consent Statement
Data Availability Statement
Acknowledgments
Conflicts of Interest
References
- Lankadurai, B.P.; Nagato, E.G.; Simpson, M.J. Environmental metabolomics: An emerging approach to study organism responses to environmental stressors. Environ. Rev. 2013, 21, 180–205. [Google Scholar] [CrossRef]
- Jiang, W.; Tian, X.; Fang, Z.; Li, L.; Dong, S.; Li, H.; Zhao, K. Metabolic responses in the gills of tongue sole (Cynoglossus semilaevis) exposed to salinity stress using NMR-based metabolomics. Sci. Total Environ. 2018, 653, 465–474. [Google Scholar] [CrossRef] [PubMed]
- May, M.A.; Bishop, K.D.; Rawson, P.D. NMR Profiling of Metabolites in Larval and Juvenile Blue Mussels (Mytilus edulis) under Ambient and Low Salinity Conditions. Metabolites 2017, 7, 33. [Google Scholar] [CrossRef] [PubMed] [Green Version]
- Remø, S.C.; Hevrøy, E.M.; Breck, O.; Olsvik, P.A.; Waagbø, R. Lens metabolomic profiling as a tool to understand cataractogenesis in Atlantic salmon and rainbow trout reared at optimum and high temperature. PLoS ONE 2017, 12, e0175491. [Google Scholar] [CrossRef] [PubMed] [Green Version]
- Sambraus, F.; Fjelldal, P.G.; Remø, S.C.; Hevrøy, E.M.; O Nilsen, T.; Thorsen, A.; Hansen, T.J.; Waagbø, R. Water temperature and dietary histidine affect cataract formation in Atlantic salmon (Salmo salar L.) diploid and triploid yearling smolt. J. Fish Dis. 2017, 40, 1195–1212. [Google Scholar] [CrossRef] [PubMed] [Green Version]
- Wu, H.; Liu, X.; Zhang, X.; Ji, C.; Zhao, J.; Yu, J. Proteomic and metabolomic responses of clam Ruditapes philippinarum to arsenic exposure under different salinities. Aquat. Toxicol. 2013, 136-137, 91–100. [Google Scholar] [CrossRef]
- Wu, H.; Zhang, X.; Wang, Q.; Li, L.; Ji, C.; Liu, X.; Zhao, J.; Yin, X. A metabolomic investigation on arsenic-induced toxicological effects in the clam Ruditapes philippinarum under different salinities. Ecotoxicol. Environ. Saf. 2013, 90, 1–6. [Google Scholar] [CrossRef]
- Allen, P.J.; Wise, D.; Greenway, T.; Khoo, L.; Griffin, M.; Jablonsky, M. Using 1-D 1H and 2-D 1H J-resolved NMR metabolomics to understand the effects of anemia in channel catfish (Ictalurus punctatus). Metabolomics 2014, 11, 1131–1143. [Google Scholar] [CrossRef]
- Izral, N.M.; Brua, R.B.; Culp, J.M.; Yates, A.G. Developing metabolomics-based bioassessment: Crayfish metabolome sensitivity to food and dissolved oxygen stress. Environ. Sci. Pollut. Res. 2018, 25, 36184–36193. [Google Scholar] [CrossRef]
- Lardon, I.; Eyckmans, M.; Vu, T.N.; Laukens, K.; De Boeck, G.; Dommisse, R. 1H-NMR study of the metabolome of a moderately hypoxia-tolerant fish, the common carp (Cyprinus carpio). Metabolomics 2013, 9, 1216–1227. [Google Scholar] [CrossRef]
- Lardon, I.; Nilsson, G.E.; Stecyk, J.A.W.; Vu, T.N.; Laukens, K.; Dommisse, R.; De Boeck, G. 1H-NMR study of the metabolome of an exceptionally anoxia tolerant vertebrate, the crucian carp (Carassius carassius). Metabolomics 2012, 9, 311–323. [Google Scholar] [CrossRef]
- Zhang, Y.; Wu, H.; Wei, L.; Xie, Z.; Guan, B. Effects of hypoxia in the gills of the Manila clam Ruditapes philippinarum using NMR-based metabolomics. Mar. Pollut. Bull. 2017, 114, 84–89. [Google Scholar] [CrossRef] [PubMed]
- Cappello, T.; Maisano, M.; Mauceri, A.; Fasulo, S. 1H NMR-based metabolomics investigation on the effects of petrochemical contamination in posterior adductor muscles of caged mussel Mytilus galloprovincialis. Ecotoxicol. Environ. Saf. 2017, 142, 417–422. [Google Scholar] [CrossRef] [PubMed]
- Cappello, T.; Pereira, P.; Maisano, M.; Mauceri, A.; Pacheco, M.; Fasulo, S. Advances in understanding the mechanisms of mercury toxicity in wild golden grey mullet (Liza aurata) by 1H NMR-based metabolomics. Environ. Pollut. 2016, 219, 139–148. [Google Scholar] [CrossRef] [PubMed]
- Vignet, C.; Cappello, T.; Fu, Q.; Lajoie, K.; De Marco, G.; Clérandeau, C.; Mottaz, H.; Maisano, M.; Hollender, J.; Schirmer, K.; et al. Imidacloprid induces adverse effects on fish early life stages that are more severe in Japanese medaka (Oryzias latipes) than in zebrafish (Danio rerio). Chemosphere 2019, 225, 470–478. [Google Scholar] [CrossRef]
- Hani, Y.M.I.; Prud’Homme, S.M.; Nuzillard, J.-M.; Bonnard, I.; Robert, C.; Nott, K.; Ronkart, S.; Dedourge-Geffard, O.; Geffard, A. 1H-NMR metabolomics profiling of zebra mussel (Dreissena polymorpha): A field-scale monitoring tool in ecotoxicological studies. Environ. Pollut. 2020, 270, 116048. [Google Scholar] [CrossRef]
- Izral, N.M.; Brua, R.B.; Culp, J.M.; Yates, A.G. Crayfish tissue metabolomes effectively distinguish impacts of wastewater and agriculture in aquatic ecosystems. Sci. Total Environ. 2020, 760, 143322. [Google Scholar] [CrossRef]
- Li, M.-H.; Ruan, L.-Y.; Zhou, J.-W.; Fu, Y.-H.; Jiang, L.; Zhao, H.; Wang, J.-S. Metabolic profiling of goldfish (Carassius auratis) after long-term glyphosate-based herbicide exposure. Aquat. Toxicol. 2017, 188, 159–169. [Google Scholar] [CrossRef]
- Viant, M.R.; Pincetich, C.A.; Tjeerdema, R.S. Metabolic effects of dinoseb, diazinon and esfenvalerate in eyed eggs and alevins of Chinook salmon (Oncorhynchus tshawytscha) determined by 1H NMR metabolomics. Aquat. Toxicol. 2006, 77, 359–371. [Google Scholar] [CrossRef]
- De Marco, G.; Brandão, F.; Pereira, P.; Pacheco, M.; Cappello, T. Organ-Specific Metabolome Deciphering Cell Pathways to Cope with Mercury in Wild Fish (Golden Grey Mullet Chelon auratus). Animals 2021, 12, 79. [Google Scholar] [CrossRef] [PubMed]
- Vidal, N.P.; Picone, G.; Goicoechea, E.; Laghi, L.; Manzanos, M.J.; Danesi, F.; Bordoni, A.; Capozzi, F.; Guillén, M.D. Metabolite release and protein hydrolysis during the in vitro digestion of cooked sea bass fillets. A study by 1H NMR. Food Res. Int. 2016, 88, 293–301. [Google Scholar] [CrossRef]
- Tappi, S.; Pinheiro, A.C.D.A.S.; Mercatante, D.; Picone, G.; Soglia, F.; Rodriguez-Estrada, M.T.; Petracci, M.; Capozzi, F.; Rocculi, P. Quality Changes during Frozen Storage of Mechanical-Separated Flesh Obtained from an Underutilized Crustacean. Foods 2020, 9, 1485. [Google Scholar] [CrossRef] [PubMed]
- Tsentalovich, Y.P.; Zelentsova, E.A.; Yanshole, L.V.; Yanshole, V.V.; Odud, I.M. Most abundant metabolites in tissues of freshwater fish pike-perch (Sander lucioperca). Sci. Rep. 2020, 10, 17128. [Google Scholar] [CrossRef] [PubMed]
- Simakov, I.; Nikiforov-Nikishin, A.; Nikiforov-Nikishin, D.; Beketov, S. Amphibian and fish eye lens used as biomarker of remote and chronic environmental contamination. Ecol. Montenegrina 2021, 45, 72–82. [Google Scholar] [CrossRef]
- Snytnikova, O.A.; Khlichkina, A.A.; Yanshole, L.V.; Yanshole, V.V.; Iskakov, I.A.; Egorova, E.V.; Stepakov, D.A.; Novoselov, V.P.; Tsentalovich, Y.P. Metabolomics of the human aqueous humor. Metabolomics 2017, 13, 5. [Google Scholar] [CrossRef]
- Tsentalovich, Y.P.; Yanshole, V.V.; Zelentsova, E.A.; Melnikov, A.D.; Sagdeev, R.Z. Seasonal Variations and Interspecific Differences in Metabolomes of Freshwater Fish Tissues: Quantitative Metabolomic Profiles of Lenses and Gills. Metabolites 2019, 9, 264. [Google Scholar] [CrossRef] [PubMed] [Green Version]
- Terzhevik, A.; Golosov, S. Dissolved Oxygen in Ice-Covered Lakes. In Encyclopedia of Lakes and Reservoirs; Bengtsson, L., Herschy, R.W., Fairbridge, R.W., Eds.; Springer: Dordrecht, The Netherlands, 2012; pp. 220–222. ISBN 978-1-4020-4410-6. [Google Scholar]
- Bundgaard, A.; James, A.M.; Gruszczyk, A.V.; Martin, J.; Murphy, M.P.; Fago, A. Metabolic adaptations during extreme anoxia in the turtle heart and their implications for ischemia-reperfusion injury. Sci. Rep. 2019, 9, 2850. [Google Scholar] [CrossRef] [PubMed] [Green Version]
- Shekhovtsov, S.V.; Bulakhova, N.A.; Tsentalovich, Y.P.; Zelentsova, E.A.; Yanshole, L.V.; Meshcheryakova, E.N.; Berman, D.I. Metabolic response of the Siberian wood frog Rana amurensis to extreme hypoxia. Sci. Rep. 2020, 10, 14604. [Google Scholar] [CrossRef] [PubMed]
- Xu, H.-D.; Wang, J.-S.; Li, M.-H.; Liu, Y.; Chen, T.; Jia, A.-Q. 1H NMR based metabolomics approach to study the toxic effects of herbicide butachlor on goldfish (Carassius auratus). Aquat. Toxicol. 2015, 159, 69–80. [Google Scholar] [CrossRef] [PubMed]
- Cappello, T. NMR-Based Metabolomics of Aquatic Organisms. In eMagRes; Wiley: Hoboken, NJ, USA, 2020; pp. 81–100. [Google Scholar]
- Wishart, D.S.; Feunang, Y.D.; Marcu, A.; Guo, A.C.; Liang, K.; Vázquez-Fresno, R.; Sajed, T.; Johnson, D.; Li, C.; Karu, N.; et al. HMDB 4.0: The human metabolome database for 2018. Nucleic Acids Res. 2018, 46, D608–D617. [Google Scholar] [CrossRef] [PubMed]
- Tsentalovich, Y.P.; Verkhovod, T.D.; Yanshole, V.V.; Kiryutin, A.S.; Yanshole, L.V.; Fursova, A.Z.; Stepakov, D.A.; Novoselov, V.P.; Sagdeev, R.Z. Metabolomic composition of normal aged and cataractous human lenses. Exp. Eye Res. 2015, 134, 15–23. [Google Scholar] [CrossRef] [PubMed]
- Yanshole, V.V.; Yanshole, L.V.; Snytnikova, O.A.; Tsentalovich, Y.P. Quantitative metabolomic analysis of changes in the lens and aqueous humor under development of age-related nuclear cataract. Metabolomics 2019, 15, 29. [Google Scholar] [CrossRef] [PubMed]
- Pang, Z.; Chong, J.; Zhou, G.; de Lima Morais, D.A.; Chang, L.; Barrette, M.; Gauthier, C.; Jacques, P.-É.; Li, S.; Xia, J. MetaboAnalyst 5.0: Narrowing the gap between raw spectra and functional insights. Nucleic Acids Res. 2021, 49, W388–W396. [Google Scholar] [CrossRef]
- Tuffnail, W.; Mills, G.A.; Cary, P.D.; Greenwood, R. An environmental 1H NMR metabolomic study of the exposure of the marine mussel Mytilus edulis to atrazine, lindane, hypoxia and starvation. Metabolomics 2008, 5, 33–43. [Google Scholar] [CrossRef]
- Venter, L.; Loots, D.T.; Mienie, L.J.; van Rensburg, P.J.J.; Mason, S.; Vosloo, A.; Lindeque, J.Z. Uncovering the metabolic response of abalone (Haliotis midae) to environmental hypoxia through metabolomics. Metabolomics 2018, 14, 49. [Google Scholar] [CrossRef]
- Lu, J.; Shi, Y.; Wang, S.; Chen, H.; Cai, S.; Feng, J. NMR-based metabolomic analysis of Haliotis diversicolor exposed to thermal and hypoxic stresses. Sci. Total Environ. 2016, 545–546, 280–288. [Google Scholar] [CrossRef]


| Property | River Nigiya | Lake Borovoye | Ob Reservoir | Reference Range 3 | |
|---|---|---|---|---|---|
| 1. | pH | 6.8 | 7.5 | 5.3 | 6.0–9.0 |
| 2. | Total mineralization | 125 | 118 | <50 | 1500 |
| 3. | Total hardness | 1.8 | 2.4 | <0.1 | 10.0 |
| 4. | Ammonium ion | 3.10 | <0.05 | 0.230 | 2.0 |
| 5. | Iron total | 0.6 | <0.05 | <0.05 | 0.3 |
| 6. | Cadmium | <0.0001 | <0.0001 | <0.0001 | 0.001 |
| 7. | Magnesium | 5.40 | 6.40 | 0.080 | 50 |
| 8. | Manganese | <0.001 | <0.001 | 0.0180 | 0.1 |
| 9. | Copper | <0.001 | <0.001 | <0.001 | 1.0 |
| 10. | Molybdenum | <0.001 | <0.001 | <0.001 | 0.07 |
| 11. | Arsenic | 0.0050 | <0.005 | <0.005 | 0.01 |
| 12. | Nickel | 0.0130 | 0.0130 | 0.0150 | 0.02 |
| 13. | Nitrate | 0.13 | 0.32 | 2.23 | 45.0 |
| 14. | Nitrite | 0.12 | 0.13 | 0.11 | 3.0 |
| 15. | Lead | <0.001 | <0.001 | <0.001 | 0.01 |
| 16. | Sulfate | <10.0 | 12.2 | <10.0 | 500.0 |
| 17. | Chloride | <10.0 | <10.0 | <10.0 | 350.0 |
| 18. | Chrom total | <0.001 | <0.001 | <0.001 | 0.05 |
| 19. | COD 1 | 43.0 | 20.0 | 16.0 | 30.0 |
| 20. | BOD 2 | 18.90 | 8.80 | 7.2 | 4.0 |
| 21. | Suspended substances | 58.4 | <3.0 | <3.0 | - |
| 22. | Petroleum product | 0.031 | 0.025 | 0.027 | 0.1 |
| 23. | Bicarbonate | 135.1 | 135.1 | 143.9 | - |
| 24. | Phenol | 0.012 | 0.009 | 0.014 | 0.001 |
| 25. | Permanganate oxidizability | 13.8 | 2.1 | 2.5 | 7.0 |
| 26. | Mercury | <0.0001 | <0.0001 | <0.0001 | 0.0005 |
| 27. | Phosphate | <0.05 | <0.05 | <0.05 | 3.5 |
| 28. | Cobalt | <0.001 | <0.001 | <0.001 | 0.1 |
| 29. | Zinc | <0.005 | <0.005 | <0.005 | 5.0 |
| 30. | LDO | 6.8 | 13.1 | 9.7 | - |
| Metabolite | P. fluviatilis | R. rutilus lacustris | G. cernua | ||
|---|---|---|---|---|---|
| Nigiya vs. Borovoye | Ob Reservoir vs. Borovoye | Nigiya vs. Ob Reservoir | Nigiya vs. Ob Reservoir | Nigiya vs. Ob Reservoir | |
| Proteinogenic amino acids | |||||
| Alanine | ↑↑ | ↑↑ | ↑↑ | ||
| Asparagine | ↑ | ↓↓ | |||
| Aspartate | ↑↑ | ↑↑ | ↓↓ | ||
| Glutamate | ↑ | ↑↑ | ↑↑ | ||
| Glutamine | ↑↑ | ↑↑ | |||
| Glycine | ↑↑ | ↑ | |||
| Histidine | |||||
| Isoleucine | ↑↑ | ↑ | ↓ | ↓ | |
| Leucine | ↑↑ | ↑ | ↑ | ↑↑ | ↓↓ |
| Lysine | ↑ | ↓ | |||
| Methionine | ↑↑ | ↑↑ | ↓ | ||
| Phenylalanine | ↑ | ↑ | ↑↑ | ↓↓ | |
| Serine | ↑↑ | ↑ | ↑↑ | ||
| Threonine | ↓↓ | ||||
| Valine | ↑ | ↑ | |||
| Other amino acids | |||||
| Betaine | ↓↓ | ↓↓ | ↓↓ | ||
| Carnitine | ↓↓ | ↓↓ | ↓ | ↑↑ | ↑ |
| Carnosine | ↓ | ||||
| Creatine | ↑↑ | ↑↑ | ↓↓ | ||
| Sarcosine | ↓ | ↓ | ↓↓ | ||
| Organic acids | |||||
| 2-OH-butyrate | ↓↓ | ↑↑ | ↑ | ||
| Acetate | ↑↑ | ||||
| α-Aminobutyrate | ↑↑ | ||||
| Formate | ↑↑ | ↓↓ | ↓↓ | ||
| Fumarate | ↑ | ↑↑ | |||
| Isobutyrate | ↑↑ | ↑↑ | |||
| Lactate | ↑ | ↓↓ | ↑↑ | ↑↑ | ↑↑ |
| Pyroglutamate | ↓↓ | ↑↑ | ↑↑ | ↑↑ | |
| Succinate | ↑↑ | ↑↑ | |||
| Osmolytes | |||||
| myo-Inositol | ↑↑ | ↑↑ | |||
| NAA | ↑↑ | ↓ | ↓↓ | ||
| NAH | ↓ | ↓ | |||
| Ser-PETA | ↓↓ | ||||
| Thr-PETA | ↓↓ | ↓↓ | ↓↓ | ||
| Antioxidants | |||||
| Cystine | |||||
| ↑↑ | |||||
| Alcohols, amines, and sugars | |||||
| Choline | ↑ | ||||
| Glucose | ↑ | ↓↓ | ↓↓ | ↓↓ | |
| Gl-PhCholine | ↑↑ | ↓↓ | |||
| PhCholine | ↓↓ | ↓↓ | |||
| Phosphoethanolamine | ↓↓ | ↑ | ↑ | ||
| scyllo-Inositol | ↓↓ | ↓ | |||
| Glycerol | ↑↑ | ||||
| Nitrogenous bases, nucleotides, and nucleosides | |||||
| ADP | ↓ | ||||
| AMP | ↑↑ | ||||
| ATP | ↑↑ | ↓ | ↓↓ | ↓ | |
| Creatinine | ↑↑ | ↑↑ | |||
| Hypoxanthine | ↑↑ | ↑↑ | |||
| Inosinate | ↑ | ↑ | |||
| NAD | ↑ | ↓↓ | |||
| Metabolite | Stressor | |
|---|---|---|
| Reduced LDO | Water Pollution | |
| Proteinogenic amino acids | ||
| Alanine | ↑ | ↑ |
| Asparagine | ↑ | |
| Aspartate | ↑ | ↑ |
| Glutamate | ↑ | ↑ |
| Glutamine | ↑ | ↑ |
| Leucine | ↑ | ↑ |
| Phenylalanine | ↑ | ↑ |
| Serine | ↑ | ↑ |
| Valine | ↑ | ↑ |
| Other amino acids | ||
| Betaine | ↓ | |
| Carnitine | ↓ | |
| Creatine | ↑ | ↑ |
| Sarcosine | ↓ | ↓ |
| Organic acids | ||
| Formate | ↑ | |
| Lactate | ↑ | ↓ |
| Osmolytes | ||
| myo-Inositol | ↑ | |
| NAA | ↑ | |
| NAH | ↓ | |
| Thr-PETA | ↓ | |
| Alcohols, amines, and sugars | ||
| Glucose | ↑ | |
| Phosphoethanolamine | ↓ | ↓ |
| Nitrogenous bases, nucleotides, and nucleosides | ||
| AMP | ↓ | |
| NAD | ↑ | |
Publisher’s Note: MDPI stays neutral with regard to jurisdictional claims in published maps and institutional affiliations. |
© 2022 by the authors. Licensee MDPI, Basel, Switzerland. This article is an open access article distributed under the terms and conditions of the Creative Commons Attribution (CC BY) license (https://creativecommons.org/licenses/by/4.0/).
Share and Cite
Tsentalovich, Y.P.; Zelentsova, E.A.; Savina, E.D.; Yanshole, V.V.; Sagdeev, R.Z. Influence of Ecological Factors on the Metabolomic Composition of Fish Lenses. Biology 2022, 11, 1709. https://doi.org/10.3390/biology11121709
Tsentalovich YP, Zelentsova EA, Savina ED, Yanshole VV, Sagdeev RZ. Influence of Ecological Factors on the Metabolomic Composition of Fish Lenses. Biology. 2022; 11(12):1709. https://doi.org/10.3390/biology11121709
Chicago/Turabian StyleTsentalovich, Yuri P., Ekaterina A. Zelentsova, Ekaterina D. Savina, Vadim V. Yanshole, and Renad Z. Sagdeev. 2022. "Influence of Ecological Factors on the Metabolomic Composition of Fish Lenses" Biology 11, no. 12: 1709. https://doi.org/10.3390/biology11121709